Embed Size (px)
Citation preview
Acetonitrile from bio-ethanol ammoxidation: process design from
the grass-roots and life cycle analysis
A. Tripodi,a E. Bahadori,a D. Cespi,b,c F. Passarini,c,d F. Cavani, c,d Tommaso Tabanelli c, I.
Rossetti,a,*
a. Chemical Plants and Industrial Chemistry Group, Dip. Chimica, Università degli Studi di
Milano, CNR-ISTM and INSTM Unit Milano-Università, via C. Golgi 19, 20133 Milano,
Italy. * Corresponding author: [email protected]
b. Environmental Management and Consulting (EMC) Innovation Lab S.r.l., Viale Italia 29,
47921 Rimini, Italy.
c. Department of Industrial Chemistry “Toso Montanari”, University of Bologna, viale del
Risorgimento 4, 40136 Bologna, Italy.
d. Centro Interdipartimentale di Ricerca Industriale “Energia e Ambiente”, University of
Bologna, via Angherà 22, Rimini, Italy.
ABSTRACT
The growing interest for new routes to obtain acetonitrile led to the development of catalysts active
towards the ammoxidation of various substrates. Among these, a C2 molecule such as ethanol
represents a good choice in terms of atom economy and, being renewable, sets the basis for a
* Corresponding author: fax +39-02-50314300; email [email protected]
brought to you by COREView metadata, citation and similar papers at core.ac.uk
provided by AIR Universita degli studi di Milano
long-term sustainable process. This paper describes a fully integrated, newly designed process
for the production of acetonitrile from bioethanol, currently not present in the literature. The target
is the production and purification of 10 kg/h of acetonitrile, unit of production used for calculations,
obtained from ethanol, ammonia and air as raw materials. All the by-products, mainly ammonium
bicarbonate and sodium cyanide, are considered marketable chemicals and represent an added
value, instead of a disposal issue. Their optimized recovery is included in this flowsheet as a basis
for the future economic assessment of the system. The process consumes CO2 without its direct
emission. In principle, all the carbon atoms and 90% of the nitrogen atoms are turned into reaction
products and the main loss is gaseous N2. The process design has been performed by means of
the Aspen PLUS® process simulator, on the basis of literature data and other experimental results.
In addition, to evaluate the potential benefits of the innovatiove bio-based route, a life cycle
analysis was carried out including all the stages involved in the bio-acetonitrile production (from
raw materials extraction up to the gate plant). The results were then compared with those
achieved for the traditional fossil route (SOHIO process), showing a sensible decrease of the
environmental burdens in terms of non-renewable resources and damages on ecosystems (e.g.
toxicity, climate change, etc.). Finally, a simplified sensitivity analysis was carried out by
substituting the starting raw material for the production of bio-ethanol (corn) with other
conventionally used worldwide, such as sugarcane and wood. The latter option seems to make
the system more competitive in terms of carbon neutrality, thanks to the usage of the residual
lignocellulosic fraction available on market.
3
Keywords: Acetonitrile; Ethanol; Ammonia; Ammoxidation; CO2 use; Process simulation;
Life cycle assessment (LCA).
Introduction
The 1st principle of Green Chemistry1 suggests to avoid waste by optimization of reaction
or, when it is not possible to improve the whole process, by recovering and transforming the
side streams into valuable added products. An interesting industrial example is represented
by acetonitrile, which is mainly produced as byproduct from the acrylonitrile synthesis (≈6
Mtons in 2010 2).
The chemical importance of acetonitrile comes from its very particular polarity, affinity with
both organic liquids and water and relatively high boiling point. Its main use is as a solvent
for pharmaceutical and laboratory applications (nearly 70%) 3, but it is also adopted as
extraction agent to separate butadiene from C4 alkanes 4, propylene and propane 5 and for
cellular metabolome extraction6.
However, acetonitrile’s yield depends on how the main acrylonitrile process is operated. This
intrinsic dependence represents the reason for the recognized mismatch between its
demand and availability worldwide 7.
More recently, routes to acetonitrile as the main reaction product have been sought (tough
important details such as the feedstock nature and consumption are anyway patented and
undisclosed3) and an efficient atom-economy could be achieved by using C2 substrates.
Among these, ethanol (EtOH) ammoxidation is a promising alternative, since EtOH is a
renewable resource, readily available from established fermentation processes 8 and usable
for this process without particular purification requirements. Another crucial aspect is EtOH
abundance and market estimated to be over 158 × 109 L 9 and 53,105.3 million US$ by
202510. This led to different exemples of valorisation of ethanol for chemicals
production, such as its conversion to ethylene by dehydration over acidic
catalysts11,12 or its conversion to 1-butanol13.
Besides interesting attempts to develop suitable catalysts, to date, no full description of a
plant for acetonitrile production by ethanol ammoxidation is disclosed in the literature. Novel
production processes can take advantage, nowadays, of computational calculation tools that
can sensibly reduce the times of a preliminary feasibility study, leaving the further stages of
development to cope with design details, after having sorted out less favourable options. In
addition, computational studies can easily integrate a benign-by-design approach14 by
supporting synthetic chemists to focus the efforts on the most suitable solution. Thus,
process simulation and life cycle analysis should accompany tightly the design of new and
sustainable processes as tools to address decisions towards feasibility.
The conversion of ethanol (azeotropic purity) into acetonitrile is studied in this paper
according to the experimental data summarized in the following section. A new fully
integrated acetonitrile production plant has been designed from the grass roots. The system
is suitable to produce acetonitrile (10 kg/h is taken as reference basis) from ethanol,
ammonia and air. Besides the reaction section, the full separation train for pure acetonitrile
recovery (> 99%) has been optimized as described elsewhere 15,16, and integrated with the
recovery of all the by-products (CO2, HCN) and unreacted ammonia. The recovery and
valorisation of the marketable by-products (cyanide salts and NH4HCO3) is also discussed
as one of the possible co-product recovery examples. The process consumes more CO2
than what constitutes the reactor by-product, allowing a further sequestration of this
greenhouse gas (GHG). Then, in order to support the design stage, a life cycle approach
was also applied to verify the environmental performances of the whole system in terms of
renewability and ecosystem burdens.
5
Background
As written above, acetonitrile is the major by-product of propylene ammoxidation to
acrylonitrile17. The global acetonitrile market has grown at Compound Annual Growth Rate
(CAGR) ca. 5% during 2009-2016, and is now close to 6.5 Mtons/year. Acetonitrile is
isolated by distillation, and depending on the distillation capability, different acetonitrile
qualities are obtained3. In 2008-2009, the chemical industry experienced a severe
acetonitrile shortage7,18, because several acrylonitrile plants were shut down, due to
stagnation of fibers market. This made the industry aware of the fact that a dedicated
process for the synthesis of acetonitrile is needed.
Possible routes for the synthesis of acetonitrile include:
(a) Reaction between CO, NH3 and H219,20;
(b) Hydrocyanation of methane with HCN, at 900 °C21,22;
(c) Ethane or ethylene ammoxidation; catalysts for ethane ammoxidation include mixed
Nb/Sb oxides, Nb-promoted Ni oxides and Co-exchanged zeolites. Because of the better
yields obtained, ethane ammoxidation is the preferred route18,23–28.
Recently Alzchem claimed to have started a gas-phase ammoxidation process for the
production of acetonitrile.
Computational methods
The overall process design has been carried out using the software Aspen PLUS® V.
8.8, with the APV88 and NISTV88 components databanks for components properties.
The thermodynamic system used is the ENRTL (Electrolyte Non Random Two
Liquids) to compute the non-ideality in the liquid phase. It was chosen since salts are
present overall the process and it allows to model their thermodynamic properties in
a more reliable way than NRTL. The Redlich-Kwong equation of state was used to
model non ideality for the gaseous phase 29. Some species were also treated as
Henry components (properties from the same databases) to account for their
solubility.
The life cycle analysis was carried out using the SimaPro software (PhD version
8.4.0.0)30 and its libraries. Among these, Ecoinvent (v.3.3)31 represents one of the
most consolidated and used databases worldwide. It is adopted by researchers to
cover all the background data concerning raw materials extraction and refinery,
energy and transportation, infrastructure, an all the auxiliary substances required to
simulate the system under study.
In addition, several impact analysis methods were adopted. More details are reported
in the last paragraph.
Process description
Conversion Data and Stoichiometry
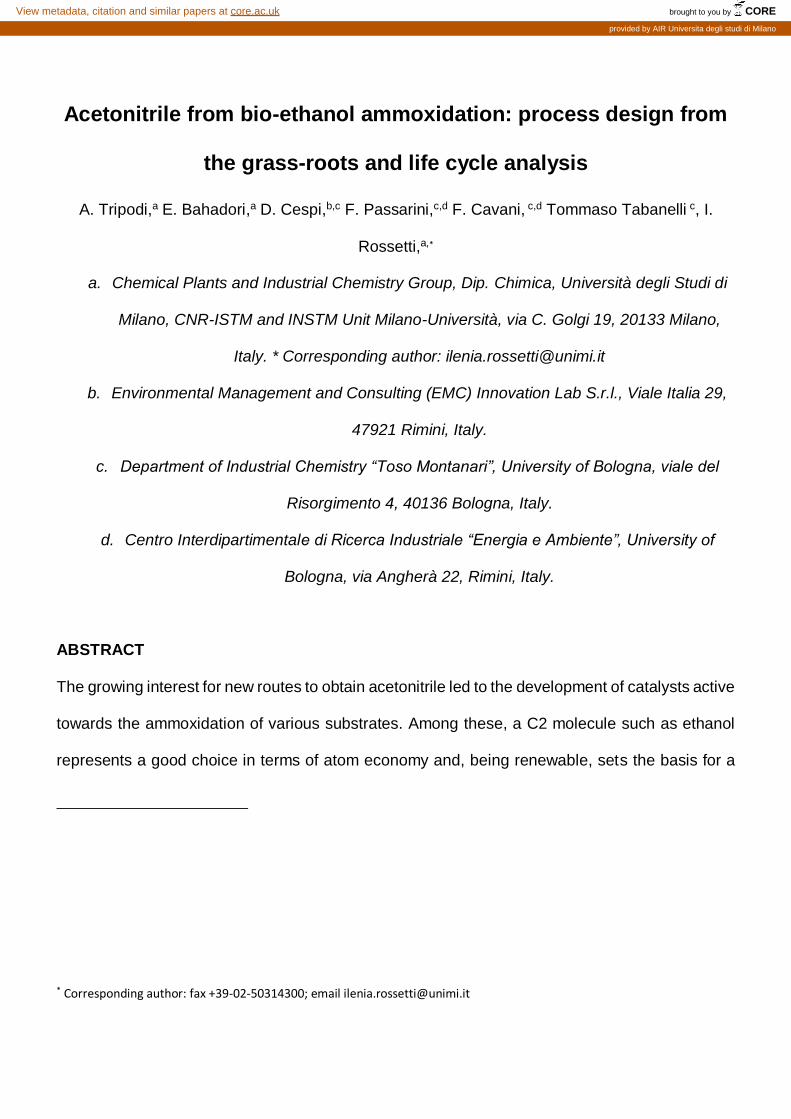
The conceptual process layout is reported in Fig. 1, whereas the PFD is sketched in
Fig. 2.
The alkylation of Ammonia with Ethanol (whose C-O bond is activated by the initial
dehydrogenation or oxidation into acetaldehyde) and the further oxidation of the C-N
into the nitrile group, has been studied by diverse groups on different catalysts32–35.
The reaction is demonstrated at laboratory level. Nevertheless, process scale up to
the pilot-plant or commercial scale has not been attempted yet. Furthermore, process
design issues are still open and integrated processes are actually missing for this.
7
Plant design is here based on the data obtained by Folco et al. 36 on a Cs doped
V2O5/TiO2 catalyst. 3 moles of ammonia per mole of ethanol are used as feed and a
byproduct distribution dominated by light gases (carbon mono- and di-oxide, thanks
to the pronounced oxidative conditions adopted) rather than by high-boiling
condensates is obtained.
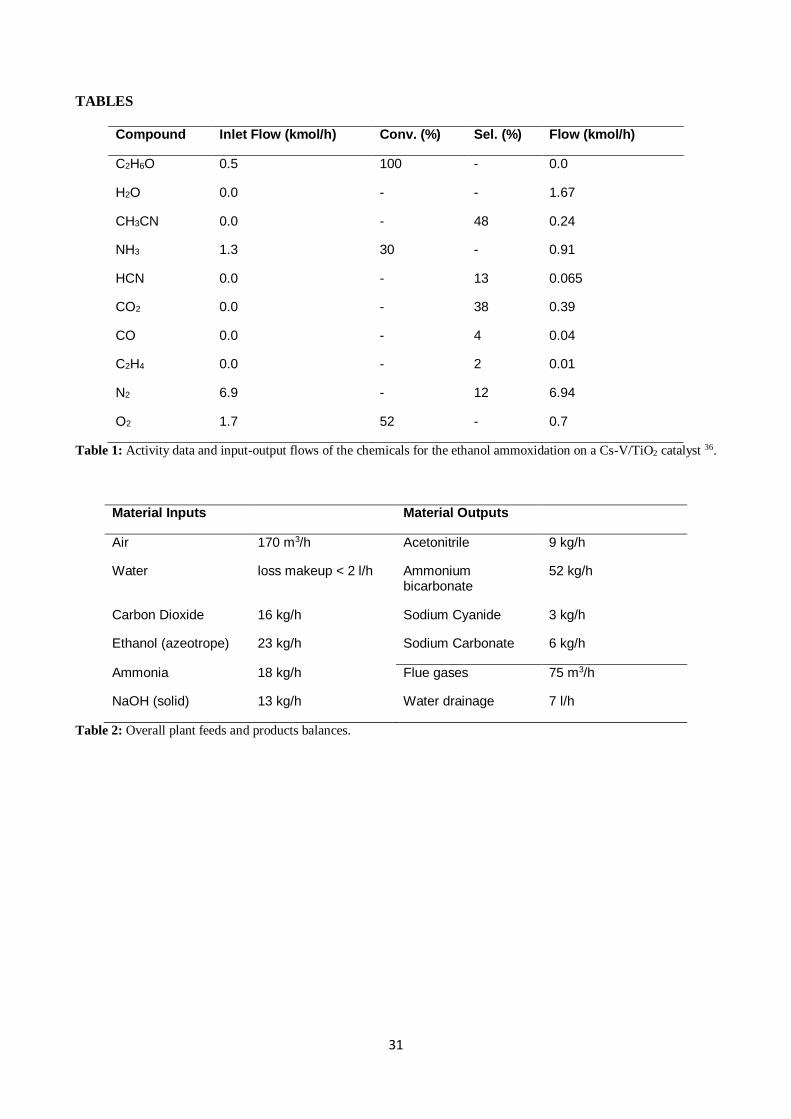
The dataset is reported in Table 1. Though higher selectivities to acetonitrile were
achieved by the same authors, the selected reaction conditions (320°C, atmospheric
pressure, catalyst load of 0.8 g per cm3/s of gas flow) were characterized by a
relatively low temperature, very low ethylene and polycondensate yields, a small
undesired combustion of ammonia, almost complete oxidation of CO to CO2 and the
complete consumption of the intermediately formed acetaldehyde. Furthermore, in
order to simplify the already complex separation train, catalyst and conditions
corresponding to full ethanol conversion were selected. Indeed, different operating
conditions led to higher selectivity to acetonitrile, but with unreacted ethanol in the
products stream. This would make the whole separation much more demanding and,
overall, the purity of acetonitrile required by the market was not met.
The product distribution has then been rationalized with the following stoichiometry:
𝐶2𝐻6𝑂 + 𝑂2 + 𝑁𝐻3 → 𝐶2𝐻3𝑁 + 3𝐻2𝑂 (ethanol ammoxidation) (R1)
𝐶2𝐻6𝑂 → 𝐶2𝐻4 + 𝐻2𝑂 (ethanol dehydration) (R2)
𝐶2𝐻6𝑂 + 5
2𝑂2 → 𝐶𝑂 + 𝐶𝑂2 + 3𝐻2𝑂 (ethanol oxidation) (R3)
𝐶2𝐻3𝑁 + 5
4𝑂2 →
1
2𝐶𝑂 +
1
2𝐶𝑂2 + 𝐻2𝑂 + 𝐻𝐶𝑁 (acetonitrile oxidation) (R4)
3
4𝑂2 + 𝑁𝐻3 →
1
2𝑁2 +
3
2𝐻2𝑂 (ammonia oxidation) (R5)
𝐶𝑂 + 1
2𝑂2 → 𝐶𝑂2 (CO oxidation) (R6)
where it is assumed that the heavy compounds generated (and for whom a brute
formula is not available) are re-oxidized to CO2. The molar flows were selected to
meet a model scale production target of 10 kg/h of acetonitrile, just as a basis for
calculation.
The excess of oxygen needed in the adopted conditions has two drawbacks: i) the
necessity to feed it as air, and then to design a reactor where the inert N2 volumetric
flow is as large as the flow of the reactants; ii) the undesired oxidation of acetonitrile
into HCN. Nevertheless, once the HCN is neutralized and recovered as cyanide salts,
it becomes a marketable byproduct itself 37.
On the other hand, the non-negligible N2 flow has also at least three positive
consequences: i) it increases the thermal inertia in the reactor, convenient when
coping with an exothermal reaction network; ii) it reduces the relative volumetric flow
increase, at constant temperature and pressure (any reaction above, except the last,
produces more moles than it consumes), then keeping the pressure drops nearly
constant; iii) it reduces the relative decrease of the excess reactants (oxygen and
ammonia) concentration, keeping the kinetic conditions nearer to the laboratory ones
(where the inert carrier is actually in large excess and ammonia and oxygen are in
excess with respect to ethanol), meeting nearly the conditions in which kinetic testing
was performed, for a more reliable prevision.
At this stage, the dataset available allows to select an appropriate operating window
based on wide experimental design, but is not suitable to derive a robust kinetic
model. Thus, the reactor only takes a picture of the inlet-outlet compositions, but it is
not possible to carry out the optimisation of the process variables and reactor sizing.
Ammonia – Carbon Dioxide Process integration
The reaction, as outlined in the cited works, prescribe an excess of ammonia in the
reactor feed. The substantial flow of this reactant still present at the reactor outlet
9
poses a serious recovery issue, due to its affinity both with nitrogen and acetonitrile
(in the hot gas phase) and with water and acetonitrile (in the condensed liquid phase).
The contemporary presence of CO2, on the other hand, suggests different options for
ammonia recovery. The first trivial route would be its separation and recycle.
However, this relies on expensive cryogenic separation. Alternatively, CO2 and NH3
may react to form urea or can be used to produce ammonium bicarbonate
(NH4HCO3). Both the latter can be viable alternatives, since the value of both
chemicals is higher than that of ammonia. Ammonium bicarbonate and urea find
application in the same fertilisers market, with cost ca. 0.18-0.22 USD/kg (with a more
unstable quotation for urea). However, urea needs an additional plant that may be
unfitted to the relatively small plant size typically expected for renewable-based
processes, thus additional costs. By contrast, ammonium bicarbonate can be easily
reacted and separated while cooling down the product mixture, envisaging lower
capital costs.
From a sustainability point of view, the production of ammonium bicarbonate
consumes one mole CO2 per mole of NH3, whereas halved amount of CO2 is
consumed to produce urea. On this basis, as will be discussed further in the following,
the selection of ammonium bicarbonate as ammonia recovery co-product (maybe
even the predominant one, from mass balances), allows to convert additional carbon
dioxide with respect to the amount produced during the reaction. A rigorous
comparison between the two routes needs the economic assessment and a further
comparative life cycle assessment, which is out of the scope of this work. Thus in the
following we consider only the ammonia recovery in form of ammonium bicarbonate.
In this way, four process improvements are achieved at once: i) all the ammonia is
converted into marketable products, rising its conversion from 30% (acetonitrile plus
cyanides) to 96% (acetonitrile, cyanides and ammonium bicarbonate, what is left out
is the nitrogen generated from ammonia oxidation); ii) the further purification of
acetonitrile is made easier; iii) the CO2 emission from the reactor is fully brought to
zero and, since additional CO2 is consumed, the process is even more sustainable
from this point of view; iv) the cryogenic separation of ammonia from N2 (deriving
from feeding air and produced during the reaction), preliminary to its possible recycle
to the reactor, as alternative option, is avoided.
This two-process integration has been designed interposing, between the reaction
and purification stages, a salt formation and precipitation section (as in the ‘wet’
ammonium bicarbonate process or in several later options for CO2-NH3 absorption
38–43) with a main washing tower discharging the oversaturated solution into a
decanter. A first centrifuge separates the suspension, then the ammonia still present
is further precipitated blowing into the liquid an additional amount of carbon dioxide
and separating through a second centrifuge.
Bicarbonate recovery
The ammonium bicarbonate salt exits from the centrifuges as a hydrated solid. It has
to be dried in order to prevent its decomposition, mediated by water, into gaseous
ammonia and CO2 that, even at low temperatures, results into an appreciable material
loss 44. Moreover, the moisture discharged from the centrifuges along with the salt
contains a small quantity of acetonitrile, which has to be recovered to improve
process yield. Taking advantage of the salt being insoluble in alcohols 45, the slurry
is first washed with ethanol, causing a ‘chemical separation’ of the moist salt from the
water and so quenching the decomposition 44, allowing a safer warm-air drying.
The air current passed over the salt in the dryer recovers then the acetonitrile still
absorbed in the solid plus the ethanol and the oxygen needed for the reaction, so the
11
dryer exhaust flow can be directly recycled to the reactor as part of the feed mixture,
into which ammonia is then vaporized. In this way, the dryer heat input is also fully
recovered to the process without any additional ethanol consumption.
In the present as for the washer and dryer, the saturation threshold of ammonium
bicarbonate has been calculated on water as basis solvent, being this the default
method of the software electrolyte-NRTL framework. This is a conservative approach.
As a matter of fact, the salt solubility in a mixed solvent involving also ethanol and
acetonitrile was lower, as confirmed experimentally in the bench-scale tests we
carried out to find data to set these units.
The liquid mixture discharged by the centrifuges along with the ammonium salt has
been fixed according to a series of experiments. After dissolving the salt in pure water
or in a water-ethanol-acetonitrile mixture, the vials have been centrifuged and the
solid filtered and left to dry at ambient temperature. Weighting the sample just after
the filtration and after the drying we could quantify the humidity content of the
centrifuged salt.
According to these tests, we could also specify the drier block as a “virtual evaporator”
that actually eliminates all the species present as liquid in the stream, except for a
residual mass fraction that can be set appropriately based on experiments. The
acetonitrile recovery from the dried vapor is tuned accordingly.
Acetonitrile purification
Acetonitrile forms an azeotrope with water 46, thus, a dedicated purification strategy
must be developed. The method chosen to purify the acetonitrile is the pressure
swing distillation technique 47 and its application to this case is fully described
elsewhere 16. With respect to other purification strategies 15,48,49 this has appreciable
heat duties, but it does not require the addition of any other chemical (with their
relative feed circuits, makeup costs and dedicated procedures).
The entire acetonitrile purification train consists of four blocks, i.e. two main columns,
each of them preceded by two auxiliary turrets:
a) the first column is without condenser and discharges water excess in the bottom;
b) the second column performs the main task: it collects the acetonitrile-water binary
azeotrope (at the 10 bar equilibrium composition) recycled from the other main tower,
and produces a distillate where acetonitrile and water are at the atmospheric
azeotrope ratio dumping all the remaining excess water in the bottoms;
c) the third turret separates hydrogen cyanide (plus residual ammonia and CO2) from
the acetonitrile-water binary liquid;
d) the fourth main column operates at 10 bar: at this pressure, the feed composition
results poorer in water (33 mol%) than the equilibrium azeotrope is (48 mol%), so that
pure acetonitrile can flow in the residues.
The operating pressure of the columns in the pressure swing loop was optimised in
a previous work and resulted in a better separation with respect to lower pressure
cases. On the other hand it avoid excessively high pressure, that would not add value
for separation in spite of increasing capital and operating costs.
An intermediate “stabilising” column has been added just before the pump to the high
pressure column in order to accomplish full gas recovery. In principle, this could be
achieved with a partial condenser, but the liquid phase composition sent to the pump
still contained dissolved gas when dealing with a simple once-through flash
separation.
Hydrogen Cyanide separation
13
Being much more soluble than ammonium bicarbonate, ammonium cyanide cannot
be precipitated at this stage, where a relatively large volume of water is still present.
This gas is quenched into a sodium hydroxide bath (pH ≥13), where it turns into
solvated sodium cyanide. The vapours released from this alkaline solution contain
the residual ammonia, which can be recycled into the bicarbonate precipitation
section, while the carbonate residues remain in the liquid phase as sodium carbonate.
A further development of this work will account for the stepwise separation of the
sodium salts, relying on the sensibly different solubility of NaCN with respect to
Na2CO3. Also in this case, this difference is greatly enhanced by adding ethanol 45.
The reactions set used in this section is detailed in the Supplementary Information.
Results and discussion
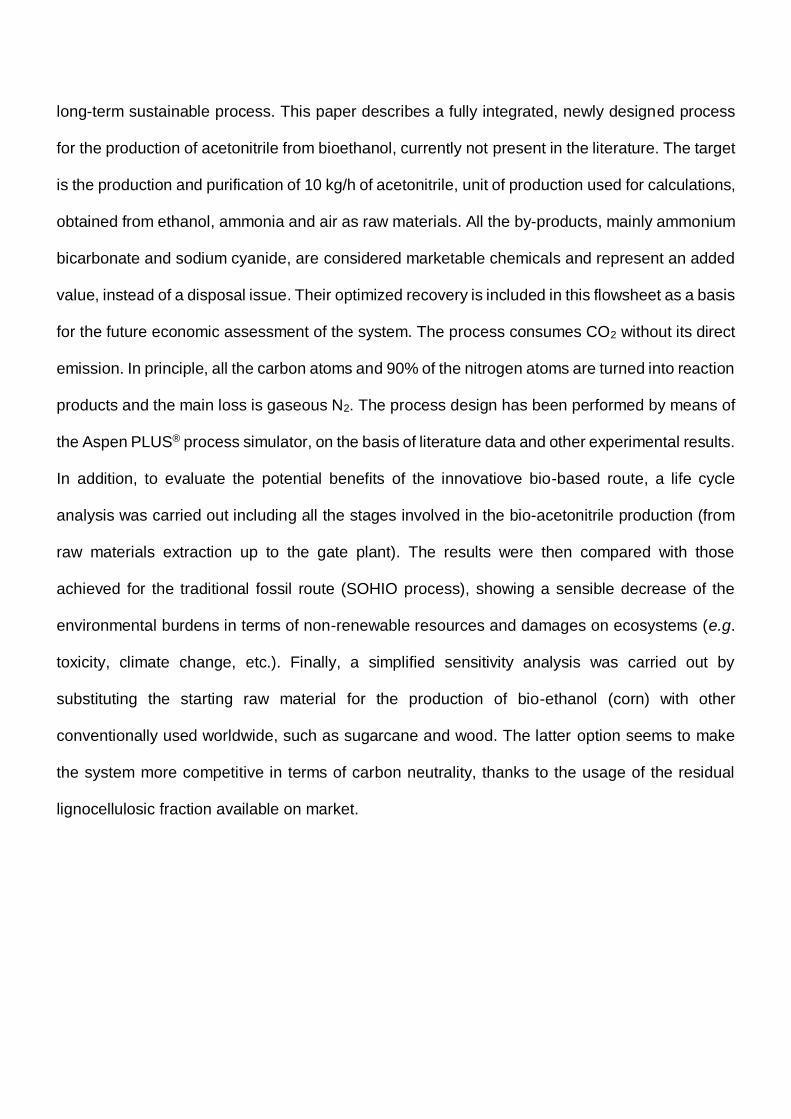
The overall process balances are reported in Table 2 and Fig. 3.
Of 0.24 kmol/h of acetonitrile formed in the reactor according to reaction 1, 0.22
kmol/h are recovered with 99.5% purity. The higher loss takes place in the main
precipitation column, which is indeed the more complex block calculated. The
process takes place at low pressure to save compression costs, anyway the gaseous
flow through the reactor is at 1 bar-gauge, in order to obtain some volume flow
reduction. The pressure is reduced gradually within the salt-precipitation stage to the
atmospheric level, because the pressure-swing technique takes advantage of the
highest differential pressure available.
Mixture washing
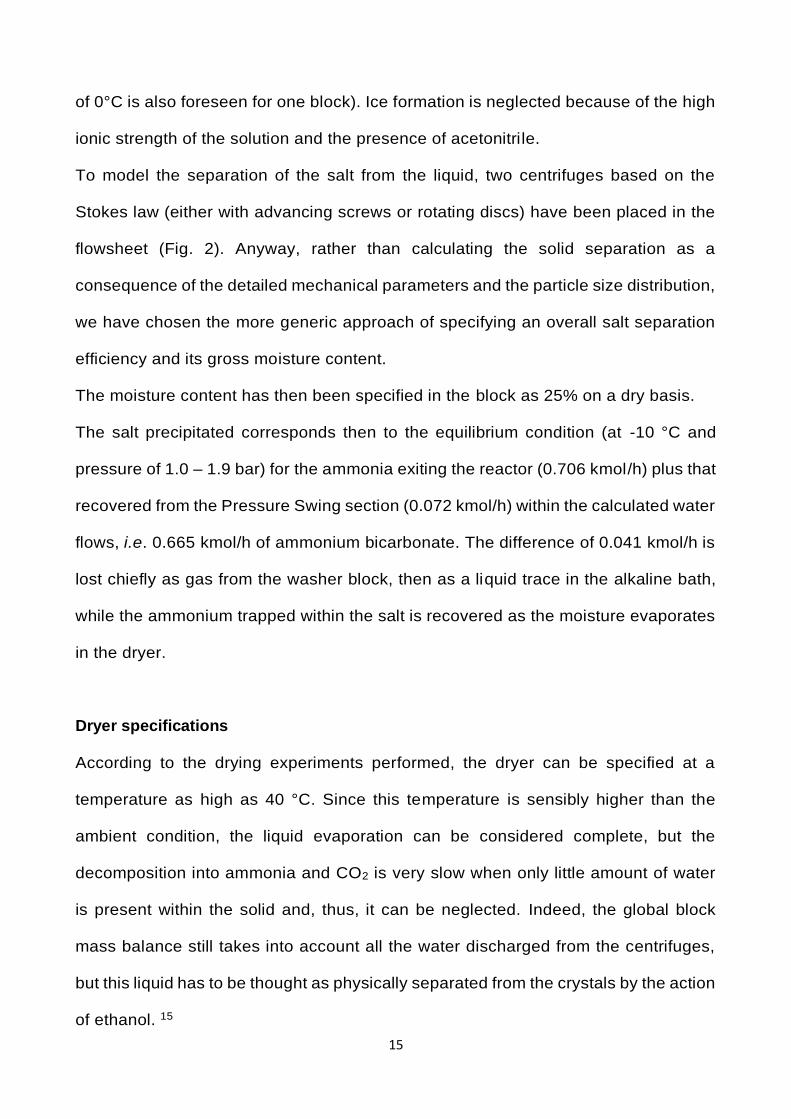
Several preliminary calculations of the thermodynamic conditions for this stage have
been done, to test the possibility to start the separation of the ammonia at this point:
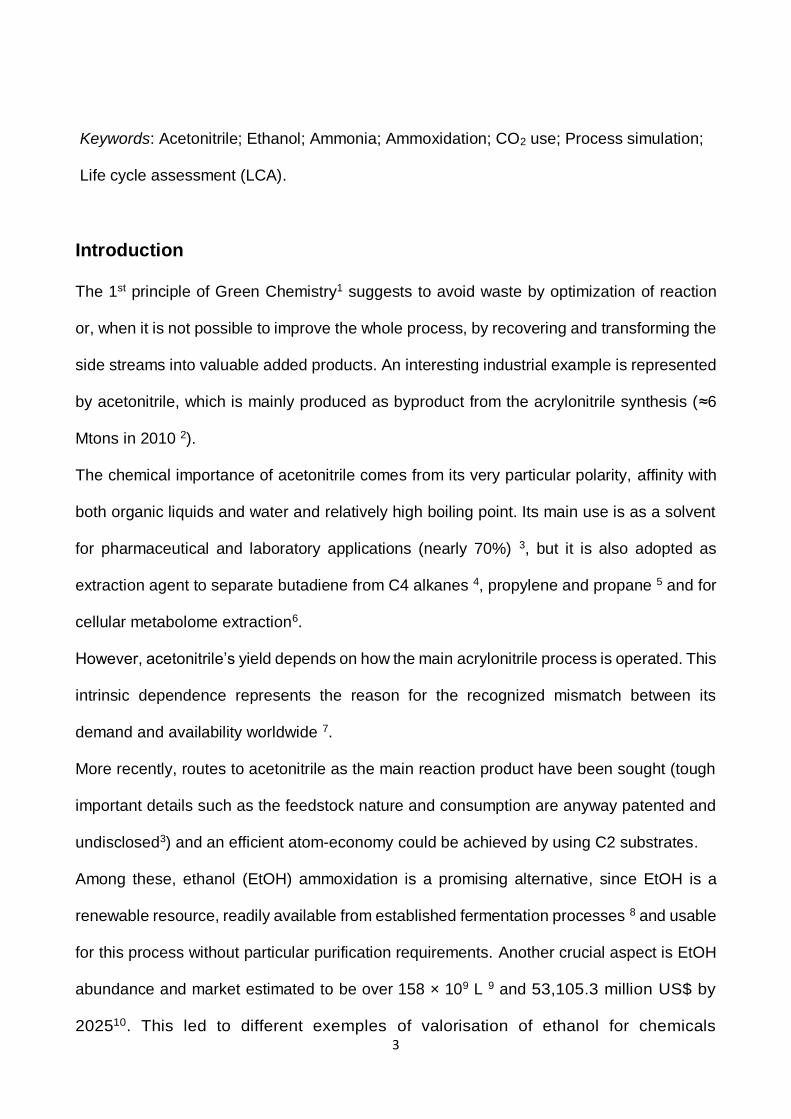
the results achieved with a vapor-liquid separator indicated a low Kvl for ammonia due
to its precipitation as NH4HCO3, but a higher Kvl for acetonitrile (Fig. 4), so the gas-
liquid contact has been extended with a multiple-stages layout substituting the single-
stage separator with a small plate column.
Along the four-trays of the washer, several functions are carried out at once: i) outflow
of the non-condensable gases; ii) final cooling of the reaction products; iii) first
precipitation of ammonium bicarbonate in the recirculated bottoms.
Most of the acetonitrile (4-5% on a molar basis) is lost at this stage, together with 1.2
mol% of the ammonia.
To lower the losses within a single block configuration we should have decreased the
temperature even below this already low value. Additional stages purposely
dedicated to the recycle of these species (e.g. intercooled compressors plus
separators, or basic washings) may be further added on purpose, following economic
evaluation.
We did not increase the water amount (that would lower the ammonia loss overhead)
to precipitate more bicarbonate. A swell, we did not lower the temperature because
the three cryogenic cycles currently under development are at present, designed at -
15 or -20 °C.
Solid precipitation and handling
The solubility of ammonium bicarbonate depends from several equilibria besides the
solid-liquid electrolytes distribution, plus the equilibria of repartition of ammonia and
CO2 between the liquid and the vapor phases. Given a mixture of water, ammonia
and CO2, the solid precipitate is coupled to the pH and depends essentially on the
temperature: this is kept to -10 °C for the whole section (a less demanding condition
15
of 0°C is also foreseen for one block). Ice formation is neglected because of the high
ionic strength of the solution and the presence of acetonitrile.
To model the separation of the salt from the liquid, two centrifuges based on the
Stokes law (either with advancing screws or rotating discs) have been placed in the
flowsheet (Fig. 2). Anyway, rather than calculating the solid separation as a
consequence of the detailed mechanical parameters and the particle size distribution,
we have chosen the more generic approach of specifying an overall salt separation
efficiency and its gross moisture content.
The moisture content has then been specified in the block as 25% on a dry basis.
The salt precipitated corresponds then to the equilibrium condition (at -10 °C and
pressure of 1.0 – 1.9 bar) for the ammonia exiting the reactor (0.706 kmol/h) plus that
recovered from the Pressure Swing section (0.072 kmol/h) within the calculated water
flows, i.e. 0.665 kmol/h of ammonium bicarbonate. The difference of 0.041 kmol/h is
lost chiefly as gas from the washer block, then as a liquid trace in the alkaline bath,
while the ammonium trapped within the salt is recovered as the moisture evaporates
in the dryer.
Dryer specifications
According to the drying experiments performed, the dryer can be specified at a
temperature as high as 40 °C. Since this temperature is sensibly higher than the
ambient condition, the liquid evaporation can be considered complete, but the
decomposition into ammonia and CO2 is very slow when only little amount of water
is present within the solid and, thus, it can be neglected. Indeed, the global block
mass balance still takes into account all the water discharged from the centrifuges,
but this liquid has to be thought as physically separated from the crystals by the action
of ethanol. 15
Pressure Swing distillation
The final acetonitrile purification via this technique is fully described elsewhere15,16.
The role of the intermediate column PS3 and its specification are also explained in
the dedicated work on separation by pressure swing16.
The blocks specifications are reported in Table 3. The last column is sized so to work
very close to the theoretical material solution of the azeotrope breaking:
{𝐹 × 𝑥𝑎𝑡𝑚 = 𝐷 × 𝑥10 + 𝐵 × 0.995
𝐵 ≥ 0.22 (E1)
where B, F and D are the flows of acetonitrile in the column bottoms, feed and
distillate, respectively, and its recovery and purity are set as process targets. xatm and
x10 are the molar azeotropic fractions at different pressures. The first three-columns
joint operation is rather more complex, as it involves the treatment of a 5-species non-
ideal mixture, so we refer the reader to the above cited papers for additional details.
This plant section is the most demanding in energetic terms: it is then possible further
and more detailed optimization and economic analysis.
Alkaline salts trap
Ammonia and CO2 in equilibrium with the precipitated salt are expelled from the
Pressure-Swing section, but their recovery and separation from HCN via distillation
is scarcely feasible due to the very low bubble point of ammonia. It is more convenient
to separate ammonia from HCN exploiting their opposite acid-base behaviour, even
if this implies to treat the carbonates alongside the cyanides. This strategy has been
adopted because: i) ammonia is a more valuable feedstock than CO2, then its
recovery has the priority, ii) carbonates and cyanides have quite different solubilities,
17
so their further solid-liquid separation should not be problematic, iii) the conversion of
CO2 into carbonates improves the carbon-recycle character of the process.
The alkaline bath pH (raised with sodium hydroxide) and temperature have been
chosen so to maximize the recovery of ammonia while keeping all the cyanide within
the solution.
Thermal duties and integration
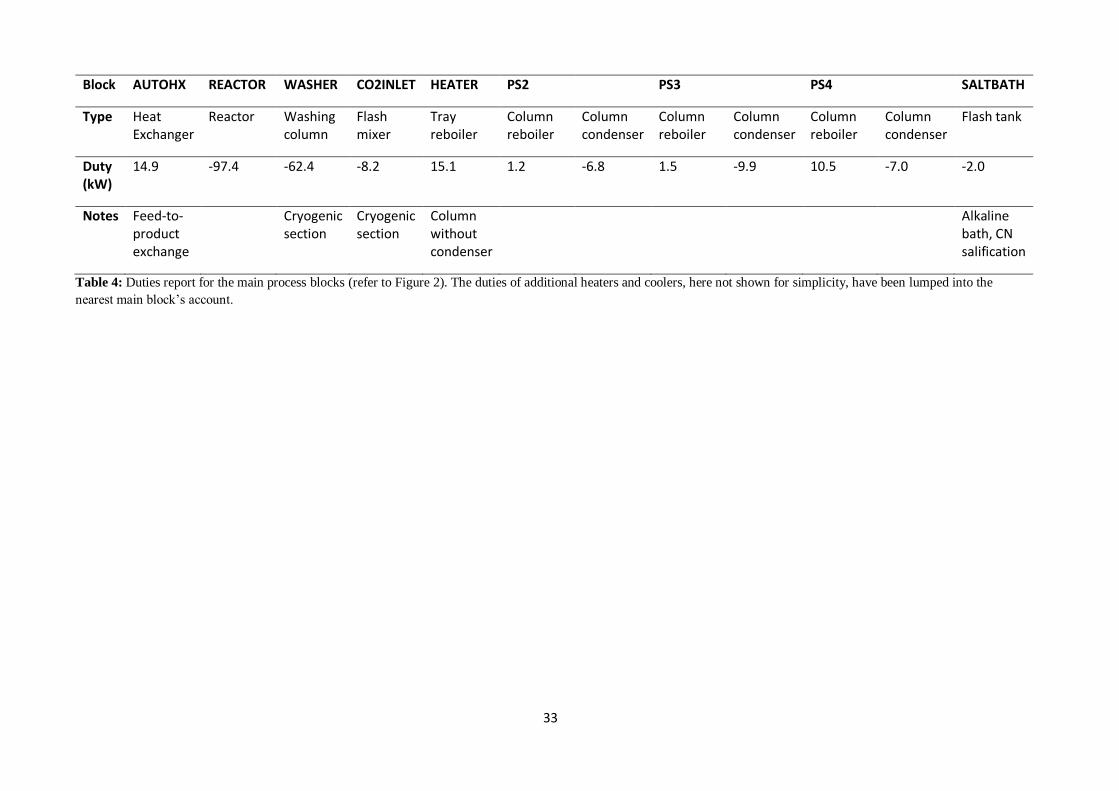
The thermal needs and deliveries of the process are summarized in Table 4. The
main issue of this design is the cryogenic temperature needed for an efficient
ammonium bicarbonate precipitation. Several strategies are possible to meet this
demand, as they will be developed and compared in a further work. At the moment,
the most promising seems a simple compression-expansion cycle of a refrigerant
mixture (it requires less heat than an adsorption cycle based upon rectification and is
likely better suited for a possible scale up with respect to a heterogeneous-absorber
machine).
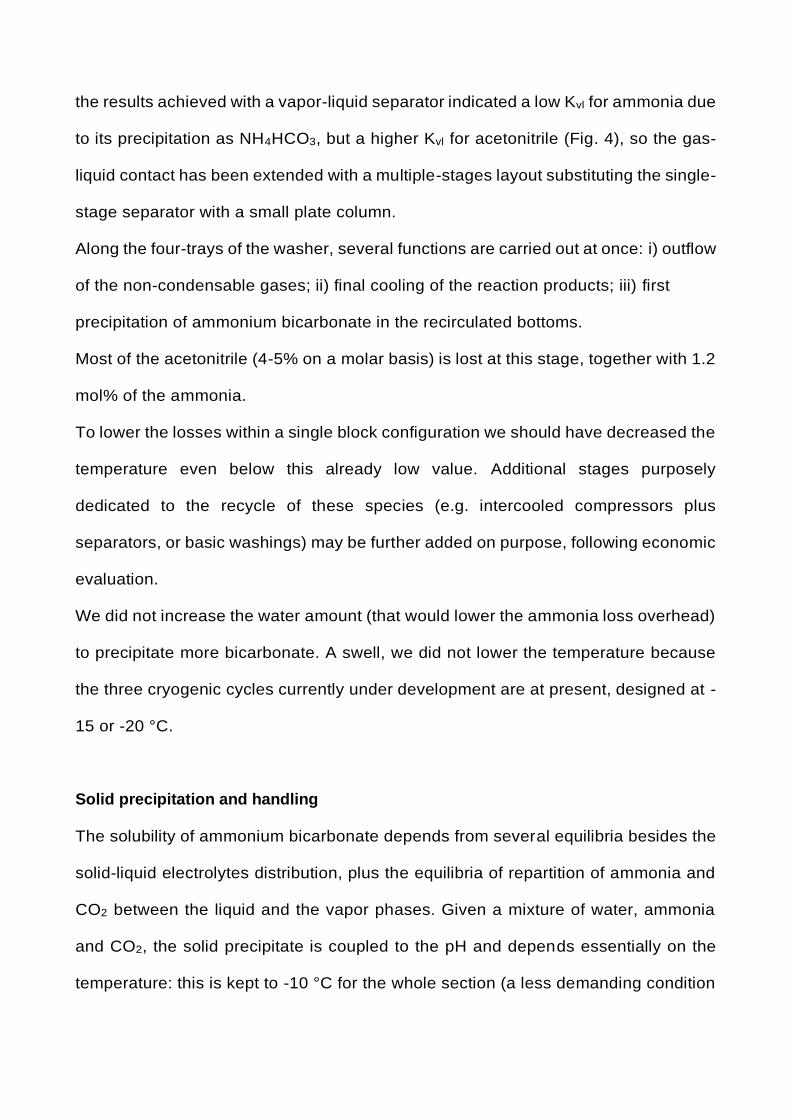
Atom and CO2 balances
As outlined in Fig. 3, the process relies on a tight atom economy, since the losses
are within the 10% and are due mostly to the unavoidable ammonia undesired
oxidation in the reactor. Considering that only a part of the carbon is fed as ethanol,
the acetonitrile and bicarbonate yields with respect to this reactant becomes more
balanced, i.e. the 48% (instead of 33%) and the 46% (instead of the 50%)
respectively, while the cyanide represents ca. 6%.
The ammonium bicarbonate process is then not only effective to recover the
ammonia, but also to turn the competitive combustion of ethanol into a still useful
reaction with a marketable outcome. Of the total fed carbon atoms, 28% comes from
external CO2, and this leaves the possibility to couple this process with other
installations characterized by net positive CO2 emissions.
Life cycle analysis
Life Cycle Assessment (LCA) methodology is a standardized approach based on ISO
14040 series50,51, used by researchers and companies to support design of innovative
products and systems. LCA is not new in the chemical sector. In previous studies,
LCA has been applied to evaluate the production of acrylonitrile from propylene and
propane to ammoxidation52. However, it is quite a versatile methodology, easily
applied at both industrial53 and laboratory scale54,55. In general, in the case of bio-
chemicals is used to support decision making and marketing procedures. In fact,
through a life cycle analysis and its holistic approach researchers are able to identify
environmental criticalities of the innovative pathways and to propose valuable
alternatives to the traditional routes. Its usage within the bio-based industry is strongly
suggested by international literature56 to estimate and compare environmental scores
of chemicals from renewables with those achieved by fossil routes. In this case a
cradle to gate perspective is usually recommended, since able to include in the model
from raw materials extraction up to the synthesis of the target molecule. In the study,
the LCA approach was used to compare the innovative bio-based acetonitrile route
with the traditional pathway from oil (SOHIO process). Results from flowsheet
simulation were used to fill in the inventory data for the bio-based acetonitrile. Table
5 collects the full inventory for the production of 1 kg of bio-acetonitrile (functional
unit). On the other hand, the default process in Ecoinvent31 library was used as a
base to simulate the production of fossil acetonitrile from an average European plant
based on SOHIO process (process name Acetonitrile {RER}| Sohio process | Alloc
19
Def, U). The SimaPro license30 includes several standardized analysis methods,
among which the Cumulative Energy Demand (CED) one (v 1.09)57. CED is in general
defined as “the entire demand, valued as primary energy, which arises in connection
with the production, use and disposal of an economic good”58. In this case, CED was
used to identify the whole amount of resources utilized in the entire chain (raw
materials and energy) and their origin (fossil or renewables). Table S1 in ESI shows
the results from CED evaluation, in which resources consumption is expressed in
terms of MJ eq. As depicted, bio-acetonitrile route is able to reduce the total amount
of resources up to -33% if compared to the fossil one. In addition, given that CED is
considered a valuable screening indicator of the overall impact of products59,60, it was
used to estimate a new and easy parameter called renewability grade of both routes
to acetonitrile. The renewability grade represents the ratio between the renewables
and the whole amount of resources used in the entire supply chain (from raw
materials extraction up to the industrial gate). The scores, expressed in percentage
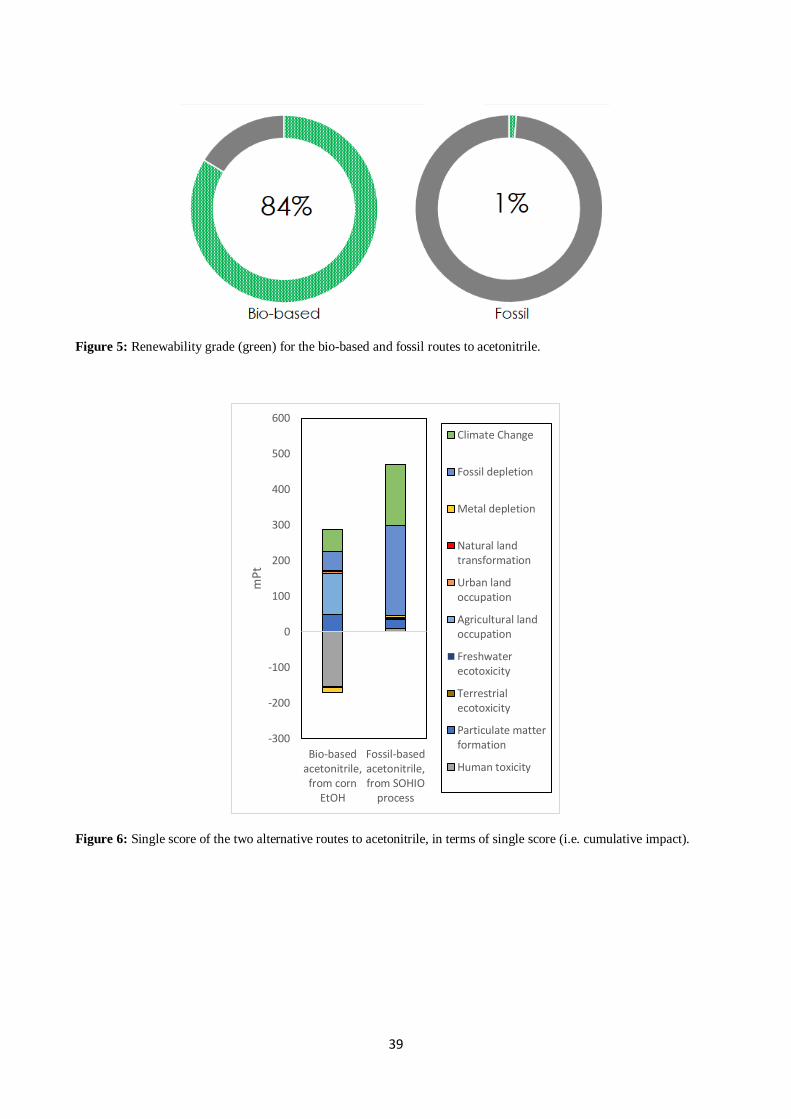
of overall quantity, are reported in Fig. 5. As depicted, the renewability grade of the
bio-based acetonitrile reaches 84%: more than four-fifths of the resources has
renewable origin. These results seem impressive if compared with those of the fossil
pathway for which the score is around 1% as a consequence of the lower grade of
renewables used which are mainly concentrated in the production of energy (e.g.
hydro-, solar- and wind-power, Table S1). This represents a further confirmation of
the fact that the reduction in the use of fossil resources between two routes was
evaluated around -89% (Table S1 in ESI).
The renewability grade was introduced since it is simple to estimate and quite useful
when the bio-based sector is under study, to identify if the innovation is able to reduce
the fossil dependence or not.
CED is usually considered a single-issue analysis method, since able to show the
consumption of resources only. No information concerning negative implication on
ecosystems are easily understandable. Therefore, in order to show these potential
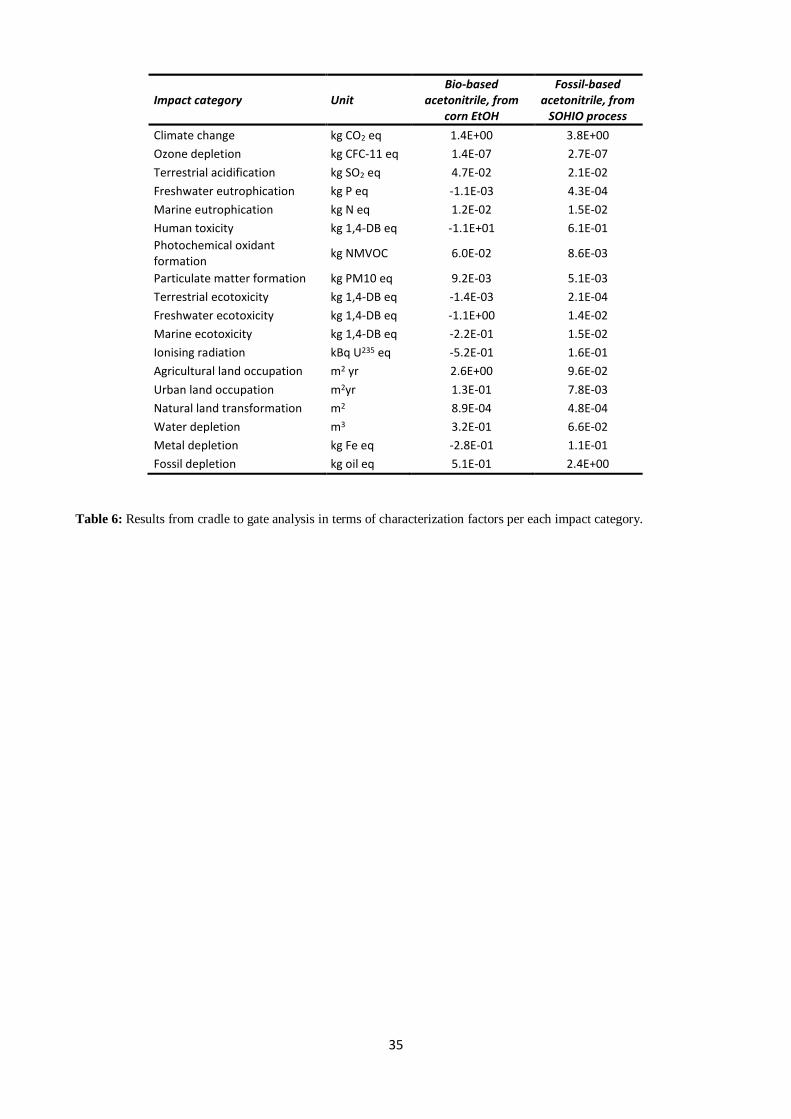
impacts the ReCiPe 2016 method was adopted61. The method expressed results in
terms of 18 impact categories at midpoint level. Table 2 shows the trends of both
routes using the characterization factors (e.g. kg of CO2 eq. for the climate change).
Among these, only 10 (the more relevant after a weighting analysis) were selected to
be translated into a single score by using a common unit (millipoints, mPt). Results
in the form of single score (Fig. 6) represent the cumulative impacts reached by both
pathways to estimate the worst in terms of sustainability. A greater cumulative score
means larger environmental burdens. On the contrary, lower mPt values indicate
potential reduction of the impacts. As disclosed, the bio-based synthesis presents an
inferior cumulative score than the fossil pathway mainly thanks to its renewability
grade. The usage of bio-EtOH, in fact, leads the whole system to achieve lower
burdens in terms of fossil dependence (fossil depletion category, -78%) and climate
change (-64%). In addition, the avoided production of ammonium bicarbonate,
sodium cyanide and sodium carbonate (all recovered as by-products in bio-refinery
system) produces significant improvements in terms of human toxicity and metal
depletion. In fact, both categories achieve negative results which means avoided
impacts and, therefore, potential benefits on ecosystems. On the contrary, the
categories directly linked to cultivation of biomass (such as land occupation and
transformation) present worst results for the bio-based route if compared with those
achieved by fossil pathway. These results are in line with our expectations. In fact, as
already discussed in a recent publication9, today the main source of EtOH is a
dedicated crop such as corn. This scenario represents the actual situation on market
21
(default bio-based scenario) in which EtOH is 100% corn-based, derived from US
production (worldwide leader). In order to investigate other primary sources for bio-
acetonitrile, two further EtOH raw materials were evaluated: sugarcane and
lignocellulosic biomass.
Results of this sensitivity analysis are collected in Fig. 7. The usage of dedicated
sugarcane presents a dramatic increase of the environmental impacts for all the
impact categories considered, if compared with the default bio-based scenario (Bio-
based acetonitrile, from corn EtOH). In particular, the Bio-based acetonitrile, from
sugarcane EtOH simulates the Brazilian situation (second major producer of EtOH),
in which the main source is sugarcane. This alternative has negative effects on
environment (=higher scores in mPt) for the categories of natural land transformation,
terrestrial ecotoxicty, climate change, fossil fuel usage and land occupation. The main
reason is the depletion of the natural forest as a consequence of the intensive
cultivation of sugarcane and usage of fertilizers. Cumulative impact of the sugarcane-
based scenario is far to be considered carbon neutral and/or comparable with the
fossil route: +96% (see ESI, Table S2). On the other hand, second generation EtOH,
which means ethanol from lignocellulosic fraction, seems to be more competitive. The
Bio-based acetonitrile, from lignocellulosic EtOH, in fact, could reduce the overall
impact of -73% if compared with the traditional process; and it seems only + 7% if
compared with the default bio-based scenario (the main reason is the lower efficiency
of transformation for lignocellulosic biomass EtOH vs. corn EtOH). However,
the most interesting aspect is that the usage of residual lignocellulosic materials (e.g.
bio-waste, such as residual wood fraction deriving from timber and prunes activities)
leads the whole system to the carbon neutrality: climate change effects are negative
(avoided impacts, see ESI Table S2).
Conclusions
A process for acetonitrile production through ethanol ammoxidation has been
designed from the grass roots. This represents a fully new process, with complete
materials recovery, that allows the independent production of acetonitrile exploiting
renewable sources.
The process feasibility is proven even dealing with relatively low selectivity to
acetonitrile (e.g. as low as 50%). The large excess of ammonia, needed to enhance
the ammoxidation kinetics against the oxidation reactions, is fully recovered as
marketable ammonium bicarbonate. Alternatives are possible, such as ammonia
recovery as urea, but they should be carefully evaluated from the economic point of
view. The resolution of the acetonitrile-water azeotrope has been designed so to
accomplish the purification of a more complex mixture. Overall, a 92% recovery of
the produced acetonitrile (99.5% purity) is the final yield. The flue gases recovery and
valorisation is also possible with the addition of NaOH.
The simplified life cycle evaluation here was applied to support process development.
LCA results confirm the reduction in the environmental burdens of the innovative bio-
based route, compared to the traditional pathway from petroleum. However, the usage
of non-dedicated crops is strongly recommended. In fact, despite the lower yield
conversion, the lignocellulosic fractions deriving from residual woods seems the better
way to fight climate change and to promote a lower carbon society starting from greener
commodities.
Supplementary Information
23
The Supplementary Information file includes the reactions set for solids recovery; the
phase diagram to describe equilibria in the washer and drier sections; Resources
consumption and the sensitivity analysis of different routes to acetonitrile.
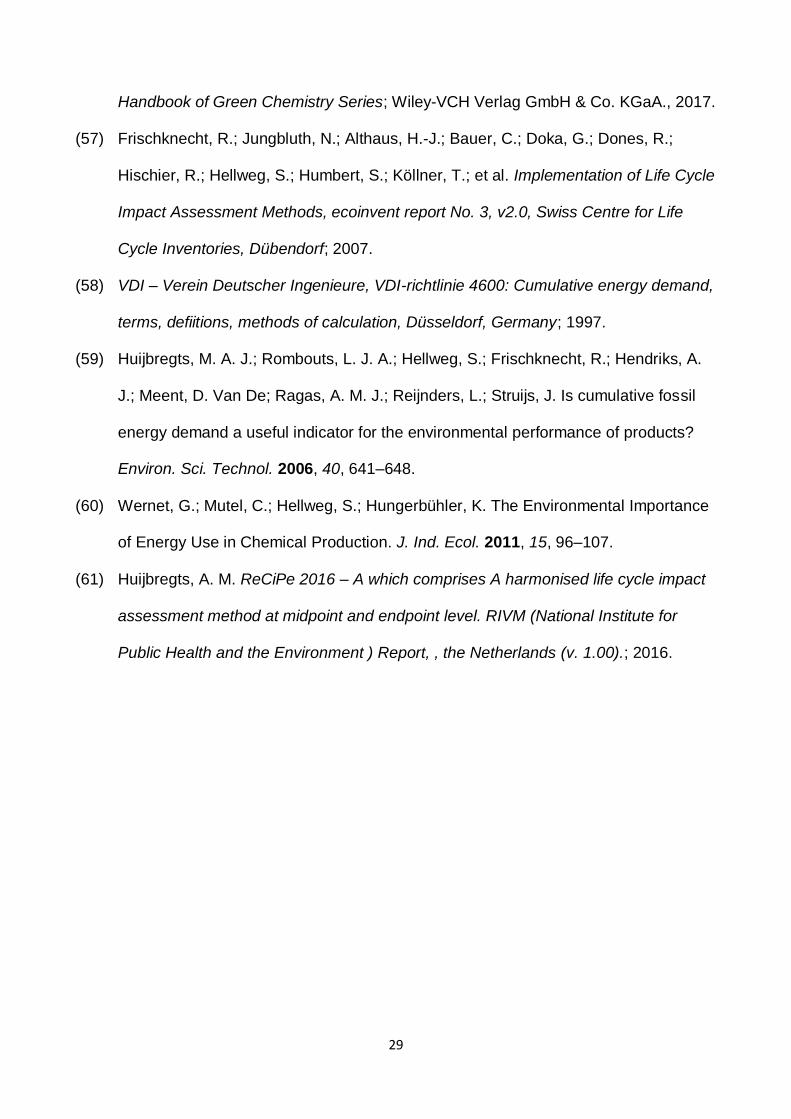
REFERENCES
(1) Anastas, P. T.; Warner, J. C. Green Chemistry: Theory and Practice; Oxford
University Press, Oxford, 1998.
(2) Cespi, D.; Passarini, F.; Neri, E.; Vassura, I.; Ciacci, L.; Cavani, F. Life Cycle
Assessment comparison of two ways for acrylonitrile production: The SOHIO
process and an alternative route using propane. J. Clean. Prod. 2014, 69, 17–25.
(3) Mcconvey, I. F.; Woods, D.; Lewis, M.; Gan, Q.; Nancarrow, P. The Importance of
Acetonitrile in the Pharmaceutical Industry and Opportunities for its Recovery from
Waste. Org. Process Res. Dev 2012, 16 (4), 612–624.
(4) Evans, B.; Hawkins, S.; Schulz ed., G. Ullmann’s Encyclopedy of Industrial
Chemistry; Evans, B., Hawkins, S., Schulz, G., Eds.; VCH, Weinheim, 1991.
(5) Liao, B.; Lei, Z.; Xu, Z.; Zhou, R.; Duan, Z. New process for separating propylene
and propane by extractive distillation with aqueous acetonitrile. Chem. Eng. J. 2001,
84, 581–586.
(6) Rabinowitz, J. D.; Kimball, E. Acidic Acetonitrile for Cellular Metabolome Extraction
from Escherichia coli. Anal. Chem. 2007, 79 (16), 6167–6173.
(7) Tullo, A. A SOLVENT DRIES UP. Chem Eng News 2008, 86 (47), 2008.
(8) Huang, H. J.; Ramaswamy, S.; Tschirner, U. W.; Ramarao, B. V. A review of
separation technologies in current and future biorefineries. Sep. Purif. Technol.
2008, 62 (1), 1–21.
(9) Cespi, D.; Passarini, F.; Vassura, I.; Cavani, F. Butadiene from biomass, a life cycle
perspective to address sustainability in the chemical industry. Green Chem. 2016,
18, 1625 –1638.
(10) Global Ethanol Market, By Process (Wet Milling, Dry Milling), Source (Natural
Source, Synthetic Source), End-Use Industry (Automotive, Alcoholic Beverages,
Pharmaceutical, Cosmetic), and Geography - Insights, Size, Share, Opportunity
Analysis, & Industry https://www.coherentmarketinsights.com/market-insight/ethanol-
market-276.
(11) Rossetti, I.; Compagnoni, M.; Finocchio, E.; Ramis, G.; Di Michele, A.; Millot, Y.;
Dzwigaj, S. Ethylene production via catalytic dehydration of diluted bioethanol: a
step towards an integrated biorefinery. Appl. Catal. B Environ. 2017, 210, 407–420.
(12) Rossetti, I.; Compagnoni, M.; De Guido, G.; Pellegrini, L.; Ramis, G.; Dzwigaj, S.
Ethylene production from diluted bioethanol solutions. Canad. J. Chem. Eng. 2017,
95, 1752.
(13) Michaels, W.; Zhang, H.; Luyben, W. L.; Baltrusaitis, J. Design of a separation
section in an ethanol-to-butanol process. Biomass and Bioenergy 2018, 109
(December 2017), 231–238.
(14) Anastas, P. T.; Ferris, C. A. Benign by design. Alternative synthetic design for
pollution prevention; American Chemical Society, 1994; Vol. 577.
(15) Tripodi, A.; Manzini, D.; Compagnoni, M.; Ramis, G.; Rossetti, I. Alternative
Integrated Distillation Strategies for the Purification of Acetonitrile from Ethanol
Ammoxidation. J. Ind. Eng. Chem. 2018, 59, 35–49.
(16) Tripodi, A.; Compagnoni, M.; Ramis, G.; Rossetti, I. Pressure-swing or extractive
distillation for the recovery of pure acetonitrile from ethanol ammoxidation process: A
comparison of efficiency and cost. Chem. Eng. Res. Des. 2017, 127C, 92–102.
(17) Cavani, F.; Centi, G.; Marion, P. Catalytic ammoxidation of hydrocarbons on mixed
oxides. In Metal Oxide Catalysts; Jackson, S. D., Hargreaves, J. S. J., Eds.; Wiley-
25
VCH Verlag GmbH & Co. KGaA, Weinheim, Germany, 2009; pp 771–818.
(18) Rojas, E.; Guerrero-pérez, M. O.; Bañares, M. A. Direct ammoxidation of ethane : An
approach to tackle the worldwide shortage of acetonitrile. Catal. Commun. 2009, 10
(11), 1555–1557.
(19) Kim, K. N.; Lane, A. M. sorted by relevance | date The selective synthesis of
acetonitrile from carbon monoxide, hydrogen, and ammonia over MO/SiO2. J. Catal
1992, 137, 127–138.
(20) Tatsumi, T.; Kunitomi, S.; Yoshiwara, J.; Muramatsu, A.; Tominaga, H. Synthesis of
acetonitrile and related compounds from CO-H2-NH3 over Mo/SiO2. Catal. Lett.
1989, 3, 223–226.
(21) Krebaum, L. J. Preparation of acetonitrile. US 3129241, 1964.
(22) Sandner, W. J.; Fierce, W. L. Preparation of acetonitrile. CA 615929, 1961.
(23) Li, Y.; Armor, J. N. A Reaction Pathway for the Ammoxidation of Ethane and
Ethylene over Co-ZSM-5 Catalyst. J. Catal. 1998, 176, 495–502.
(24) Li, Y.; Armor, J. N. Ammoxidation of ethane to acetonitrile. IV: substantial differences
between Y and dealuminated Y zeolite. Appl. Catal. A Gen. A 1999, 183, 107–120.
(25) Sobalik, Z.; Belhekar, A. A.; Tvaru, Z.; Wichterlová, B. Metal ligand complexes in
CoH–BEA relevant to ethane ammoxidation to acetonitrile: an FTIR study. Appl.
Catal. A Gen. A 1999, 188, 175–186.
(26) Rojas, E.; Calatayud, M.; Banares, M.; Guerrero-Perez, O. Theoretical and
Experimental Study of Light Hydrocarbon Ammoxidation and Oxidative
Dehydrogenation on (110)-VSbO 4 Surfaces. J. Phys. Chem. C 2012, No. 110.
(27) Bulánek, R.; Novoveská, K.; Wichterlová, B. Oxidative dehydrogenation and
ammoxidation of ethane and propane over pentasil ring Co-zeolites. Appl. Catal. A
Gen. 2002, 235, 181–191.
(28) Ayari, F.; Mhamdi, M.; Debecker, D. P.; Gaigneaux, E. M.; Alvarez-Rodriguez, J.;
Guerrero-Ruiz, A. Effect of the chromium precursor nature on the physicochemical
and catalytic properties of Cr–ZSM-5 catalysts: Application to the ammoxidation of
ethylene. J. Mol. Catal. A Chem. 2011, 339, 8–16.
(29) Chen, C.; Mathias, P. M. Applied Thermodynamics for Process Modeling. AIChE J.
2002, 48 (2), 194–200.
(30) PRé Consultants, SimaPro, PhD version 8.4.0.0, Amersfoort, The Netherlands;
2018.
(31) Ecoinvent Centre (formerly Swiss Centre for Life Cycle Inventories) Ecoinvent 3.3
Database; 2016.
(32) Belov, V. V.; Markov, V. I.; Sova, S. B.; Golosman, E. Z.; Nechugovskii, A. I. New
composite catalysts for the synthesis of acetonitrile from ethanol and ammonia,
prepared using calcium aluminates (Talyum). Russ. J. Appl. Chem. 2016, 89 (3),
414–420.
(33) Feng, C.; Zhang, Y.; Zhang, Y.; Wen, Y.; Zhao, J. Study on alumina-supported
cobalt-nickel oxide catalyst for synthesis of acetonitrile from ethanol. Catal. Letters
2011, 141 (1), 168–177.
(34) Hamill, C.; Driss, H.; Goguet, A.; Burch, R.; Petrov, L.; Daous, M.; Rooney, D. Mild
temperature palladium-catalyzed ammoxidation of ethanol to acetonitrile. Appl.
Catal. A Gen. 2015, 506, 261–267.
(35) Hu, Y.; Cao, J.; Deng, J.; Cui, B.; Tan, M.; Li, J.; Zhang, H. Synthesis of acetonitrile
from ethanol via reductive amination over Cu/γ-Al2O3. React. Kinet. Mech. Catal.
2012, 106 (1), 127–139.
(36) Folco, F.; Ochoa, J. V.; Cavani, F.; Ott, L.; Janssen, M. Ethanol gas-phase
ammoxidation to acetonitrile. Catal. Sci. Technol. 2017, 7, 200–212.
(37) AAVV. Cyanides of Hydrogen, Sodium and Potassium, and Acetone Cyanohydrin - I;
27
ECETOC, 2007; Vol. JACC 53.
(38) Zhuang, Q.; Clements, B.; Li, Y. From ammonium bicarbonate fertilizer production
process to power plant CO 2 capture. Int. J. Greenh. Gas Control 2012, 10, 56–63.
(39) Sutter, D.; Gazzani, M.; Mazzotti, M. A low-energy chilled ammonia process
exploiting controlled solid formation for post-combustion CO 2 capture. Faraday
Discuss. 2016, 192, 59–83.
(40) Gaspar, J.; Waseem, M.; Blaker, E.; Langseth, B.; Hansen, T.; Thomsen, K.; von
Solms, N.; Fosbol, P. L. A Low Energy Aqueous Ammonia CO2 Capture Process.
Energy Procedia 2014, 63, 614–623.
(41) Gazzani, M.; Sutter, D.; Mazzotti, M. Improving the efficiency of a chilled ammonia
CO 2 capture plant through solid formation : a thermodynamic analysis. Energy
Procedia 2014, 63, 1084–1090.
(42) Bak, C.; Asif, M.; Kim, W. Experimental study on CO2 capture by chilled ammonia
process. Chem. Eng. J. 2015, 265, 1–8.
(43) Yildirim, Ö.; Kiss, A. A.; Hüser, N.; Leßmann, K.; Kenig, E. Y. Reactive absorption in
chemical process industry: A review on current activities. Chem. Eng. J. 2012, 213,
371–391.
(44) Kuu, W.; Chilamkurti, R.; Chen, C. Effect of relative humidity and temperature on
moisture sorption and stability of sodium bicarbonate powder. Int. J. Pharm. 1998,
166, 167–175.
(45) Lide ed., D. R. “Physical Constants of Inorganic Compunds” in CRC Handbook of
Chemistry and Physics, 15th ed.; Lide, D. R., Ed.; CRC Press, 2005.
(46) Horsley, H. Azeotropic Data; American Chemical Society, 1973.
(47) Repke, J. U.; Forner, F.; Klein, A. Separation of homogeneous azeotropic mixtures
by pressure swing distillation - Analysis of the operation performance. Chem. Eng.
Technol. 2005, 28 (10), 1151–1157.
(48) Rodríguez-Donis, I.; Gerbaud, V.; Joulia, X. Entrainer Selection Rules for the
Separation of Azeotropic and Close-Boiling-Temperature Mixtures by Homogeneous
Batch. Ind. Eng. Chem. Res. 2001, 40, 2729–2741.
(49) Li, J.; Yang, X.; Chen, K.; Zheng, Y.; Peng, C.; Liu, H. Sifting Ionic Liquids as
Additives for Separation of Acetonitrile and Water Azeotropic Mixture Using the
COSMO-RS Method. Ind Eng Chem Res 2012.
(50) EN ISO 14040 Environmental Management, Life Cycle Assessment, Principles and
Framework, International Organization for Standardization, Geneva, Switzerland.;
2006.
(51) EN ISO 14044 Environmental Management, Life Cycle Assessment, Requirements
and Guidelines, International Organization for Standardization, Geneva,
Switzerland.; 2006.
(52) Cespi, D.; Passarini, F.; Neri, E.; Vassura, I.; Ciacci, L.; Cavani, F. Life Cycle
Assessment comparison of two ways for acrylonitrile production: the SOHIO process
and an alternative route using propane. J. Clean. Prod. 2014, 69, 17 – 25.
(53) Cespi, D.; Cucciniello, R.; Ricciardi, M.; Capacchione, C.; Vassura, I.; Passarini, F.;
Proto, A. Butadiene from biomass, a life cycle perspective to address sustainability
in the chemical industry. Green Chem. 2016, 18, 4559–4570.
(54) Ricciardi, M.; Passarini, F.; Vassura, I.; Proto, A.; Capacchione, C.; Cucciniello, R.;
Cespi, D. Glycidol, a Valuable Substrate for the Synthesis of Monoalkyl Glyceryl
Ethers: A Simplified Life Cycle Approach. ChemSusChem 2017, 10, 2291–2300.
(55) Samorì, C.; Cespi, D.; Blair, P.; Galletti, P.; Malferrari, D.; Passarini, F.; Vassura, I.;
Tagliavini, E. Application of switchable hydrophilicity solvents for recycling multilayer
packaging materials. Green Chem. 2017, 19, 1714–1720.
(56) Anastas, P. T.; Beach, E. S.; Kundu, S. Tools for Green Chemistry, Volume 10. In
29
Handbook of Green Chemistry Series; Wiley-VCH Verlag GmbH & Co. KGaA., 2017.
(57) Frischknecht, R.; Jungbluth, N.; Althaus, H.-J.; Bauer, C.; Doka, G.; Dones, R.;
Hischier, R.; Hellweg, S.; Humbert, S.; Köllner, T.; et al. Implementation of Life Cycle
Impact Assessment Methods, ecoinvent report No. 3, v2.0, Swiss Centre for Life
Cycle Inventories, Dübendorf; 2007.
(58) VDI – Verein Deutscher Ingenieure, VDI-richtlinie 4600: Cumulative energy demand,
terms, defiitions, methods of calculation, Düsseldorf, Germany; 1997.
(59) Huijbregts, M. A. J.; Rombouts, L. J. A.; Hellweg, S.; Frischknecht, R.; Hendriks, A.
J.; Meent, D. Van De; Ragas, A. M. J.; Reijnders, L.; Struijs, J. Is cumulative fossil
energy demand a useful indicator for the environmental performance of products?
Environ. Sci. Technol. 2006, 40, 641–648.
(60) Wernet, G.; Mutel, C.; Hellweg, S.; Hungerbühler, K. The Environmental Importance
of Energy Use in Chemical Production. J. Ind. Ecol. 2011, 15, 96–107.
(61) Huijbregts, A. M. ReCiPe 2016 – A which comprises A harmonised life cycle impact
assessment method at midpoint and endpoint level. RIVM (National Institute for
Public Health and the Environment ) Report, , the Netherlands (v. 1.00).; 2016.

Acronyms, abbreviations and symbols
ENRTL Electrolytes Non-Random Two
Liquids
MeCN Acetonitrile, CH3CN
NRTL Non-Random Two Liquids
RADFRAC Rigorous ADsorption-
FRACtioning
T Temperature
Flowsheets coding
Functional coding – section number – block coding – block number
Functional codes Block type code
AA Compressor
FR Feed of Reagents AP Pump for Pressure rising
SB Separation of By-products CA Column with Azeotropes
SP Separation of Products CM Column with a Mixture of more than 2 specie
SV Separation of Wastes CV Control Valve
TP Transformation of Products HB Heat exchanger,Boiler
HF Heat exchanger,Furnace
HX Heat eXchanger, generic
MJ Mixing Junction
PA Tube at Atmospheric pressure
PP Tube under Pressure
RK Reactor in Kinetic conditions
SA Separation of Azeotropes
SC Separation Column
SF Separation via Flash
SG Separation by Gravity
SJ Splitting Junction
SS Separation of Solids
31
TABLES
Compound Inlet Flow (kmol/h) Conv. (%) Sel. (%) Flow (kmol/h)
C2H6O 0.5 100 - 0.0
H2O 0.0 - - 1.67
CH3CN 0.0 - 48 0.24
NH3 1.3 30 - 0.91
HCN 0.0 - 13 0.065
CO2 0.0 - 38 0.39
CO 0.0 - 4 0.04
C2H4 0.0 - 2 0.01
N2 6.9 - 12 6.94
O2 1.7 52 - 0.7
Table 1: Activity data and input-output flows of the chemicals for the ethanol ammoxidation on a Cs-V/TiO2 catalyst 36.
Material Inputs Material Outputs
Air 170 m3/h Acetonitrile 9 kg/h
Water loss makeup < 2 l/h Ammonium bicarbonate
52 kg/h
Carbon Dioxide 16 kg/h Sodium Cyanide 3 kg/h
Ethanol (azeotrope) 23 kg/h Sodium Carbonate 6 kg/h
Ammonia 18 kg/h Flue gases 75 m3/h
NaOH (solid) 13 kg/h Water drainage 7 l/h
Table 2: Overall plant feeds and products balances.
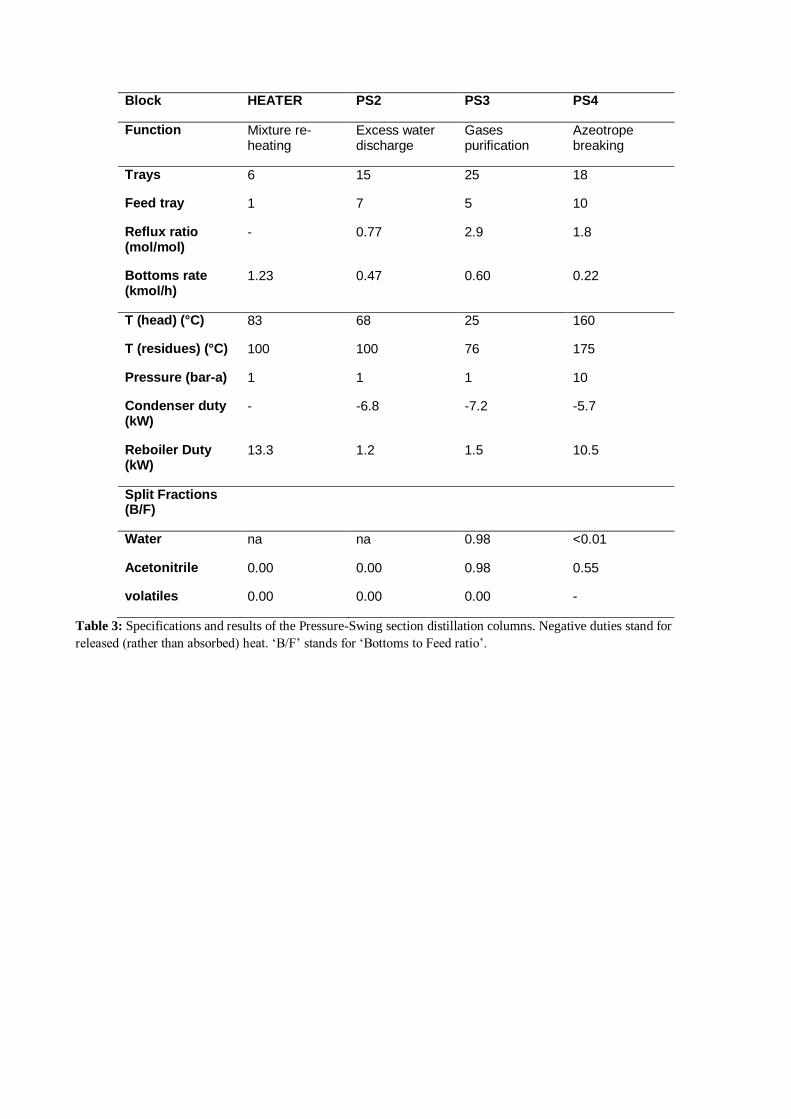
Block HEATER PS2 PS3 PS4
Function Mixture re-heating
Excess water discharge
Gases purification
Azeotrope breaking
Trays 6 15 25 18
Feed tray 1 7 5 10
Reflux ratio (mol/mol)
- 0.77 2.9 1.8
Bottoms rate (kmol/h)
1.23 0.47 0.60 0.22
T (head) (°C) 83 68 25 160
T (residues) (°C) 100 100 76 175
Pressure (bar-a) 1 1 1 10
Condenser duty (kW)
- -6.8 -7.2 -5.7
Reboiler Duty (kW)
13.3 1.2 1.5 10.5
Split Fractions (B/F)
Water na na 0.98 <0.01
Acetonitrile 0.00 0.00 0.98 0.55
volatiles 0.00 0.00 0.00 -
Table 3: Specifications and results of the Pressure-Swing section distillation columns. Negative duties stand for
released (rather than absorbed) heat. ‘B/F’ stands for ‘Bottoms to Feed ratio’.
33
Block AUTOHX REACTOR WASHER CO2INLET HEATER PS2 PS3 PS4 SALTBATH
Type Heat Exchanger
Reactor Washing column
Flash mixer
Tray reboiler
Column reboiler
Column condenser
Column reboiler
Column condenser
Column reboiler
Column condenser
Flash tank
Duty (kW)
14.9 -97.4 -62.4 -8.2 15.1 1.2 -6.8 1.5 -9.9 10.5 -7.0 -2.0
Notes Feed-to-product exchange
Cryogenic section
Cryogenic section
Column without condenser
Alkaline bath, CN salification
Table 4: Duties report for the main process blocks (refer to Figure 2). The duties of additional heaters and coolers, here not shown for simplicity, have been lumped into the
nearest main block’s account.
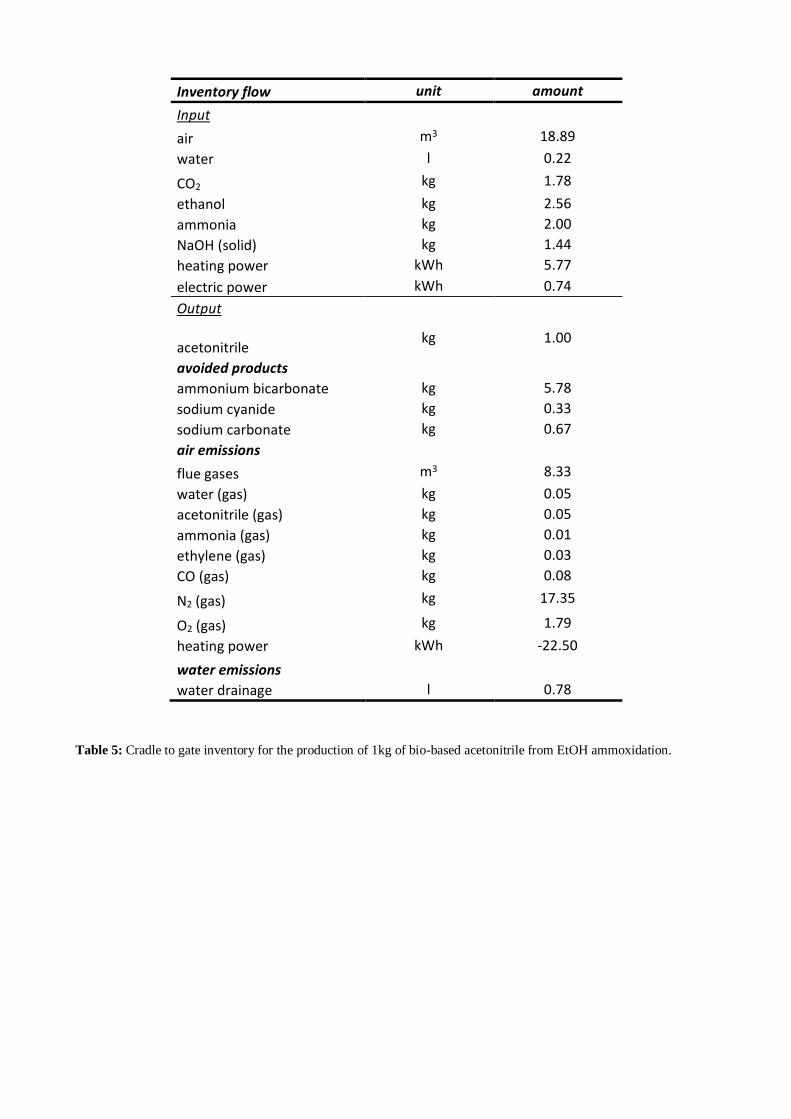
Table 5: Cradle to gate inventory for the production of 1kg of bio-based acetonitrile from EtOH ammoxidation.
Inventory flow unit amount
Input
air m3 18.89
water l 0.22
CO2 kg 1.78
ethanol kg 2.56
ammonia kg 2.00
NaOH (solid) kg 1.44
heating power kWh 5.77
electric power kWh 0.74
Output
acetonitrile kg 1.00
avoided products ammonium bicarbonate kg 5.78
sodium cyanide kg 0.33
sodium carbonate kg 0.67
air emissions
flue gases m3 8.33
water (gas) kg 0.05
acetonitrile (gas) kg 0.05
ammonia (gas) kg 0.01
ethylene (gas) kg 0.03
CO (gas) kg 0.08
N2 (gas) kg 17.35
O2 (gas) kg 1.79
heating power kWh -22.50
water emissions water drainage l 0.78
35
Table 6: Results from cradle to gate analysis in terms of characterization factors per each impact category.
Impact category Unit Bio-based
acetonitrile, from corn EtOH
Fossil-based acetonitrile, from
SOHIO process
Climate change kg CO2 eq 1.4E+00 3.8E+00
Ozone depletion kg CFC-11 eq 1.4E-07 2.7E-07
Terrestrial acidification kg SO2 eq 4.7E-02 2.1E-02
Freshwater eutrophication kg P eq -1.1E-03 4.3E-04
Marine eutrophication kg N eq 1.2E-02 1.5E-02
Human toxicity kg 1,4-DB eq -1.1E+01 6.1E-01
Photochemical oxidant formation
kg NMVOC 6.0E-02 8.6E-03
Particulate matter formation kg PM10 eq 9.2E-03 5.1E-03
Terrestrial ecotoxicity kg 1,4-DB eq -1.4E-03 2.1E-04
Freshwater ecotoxicity kg 1,4-DB eq -1.1E+00 1.4E-02
Marine ecotoxicity kg 1,4-DB eq -2.2E-01 1.5E-02
Ionising radiation kBq U235 eq -5.2E-01 1.6E-01
Agricultural land occupation m2 yr 2.6E+00 9.6E-02
Urban land occupation m2yr 1.3E-01 7.8E-03
Natural land transformation m2 8.9E-04 4.8E-04
Water depletion m3 3.2E-01 6.6E-02
Metal depletion kg Fe eq -2.8E-01 1.1E-01
Fossil depletion kg oil eq 5.1E-01 2.4E+00
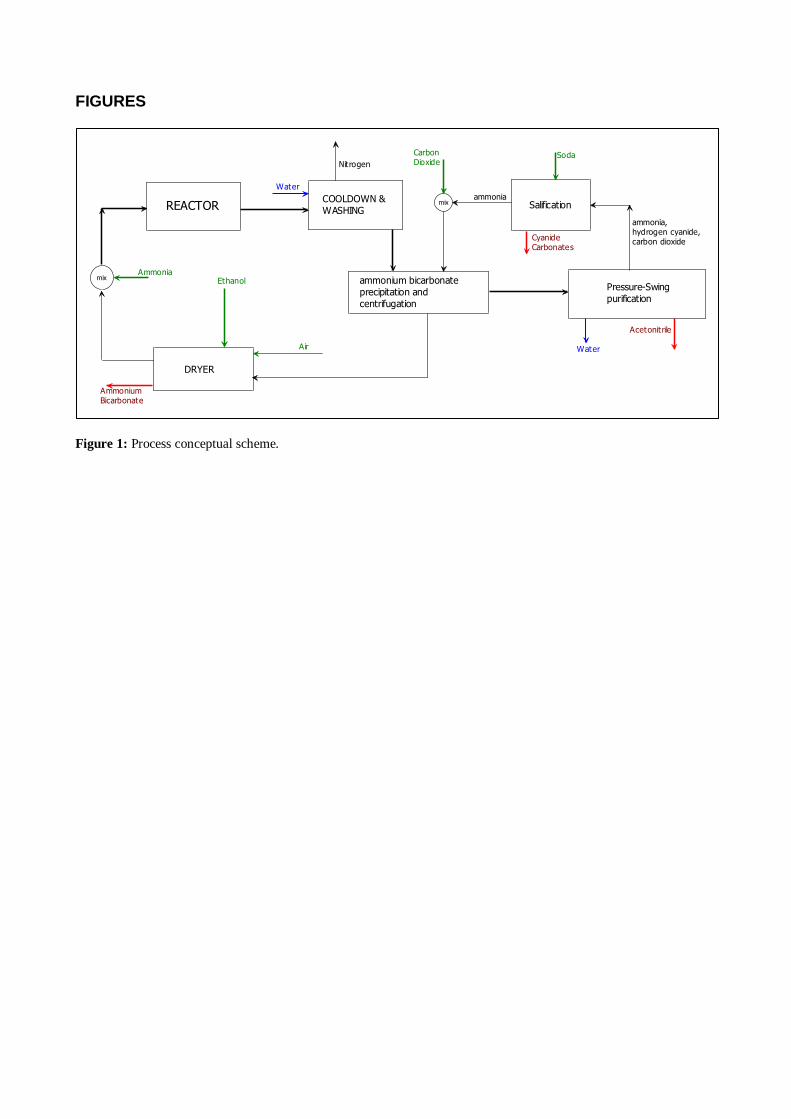
FIGURES
Figure 1: Process conceptual scheme.
REACTOR
DRYER
mix
mix
CarbonDioxide
AmmoniaEthanol
AmmoniumBicarbonate
CyanideCarbonates
Acetonitrile
Soda
COOLDOWN &WASHING
ammonium bicarbonateprecipitation andcentrifugation
Air
Nitrogen
ammonia,hydrogen cyanide,carbon dioxide
Pressure-Swingpurification
Salificationammonia
Water
Water
37
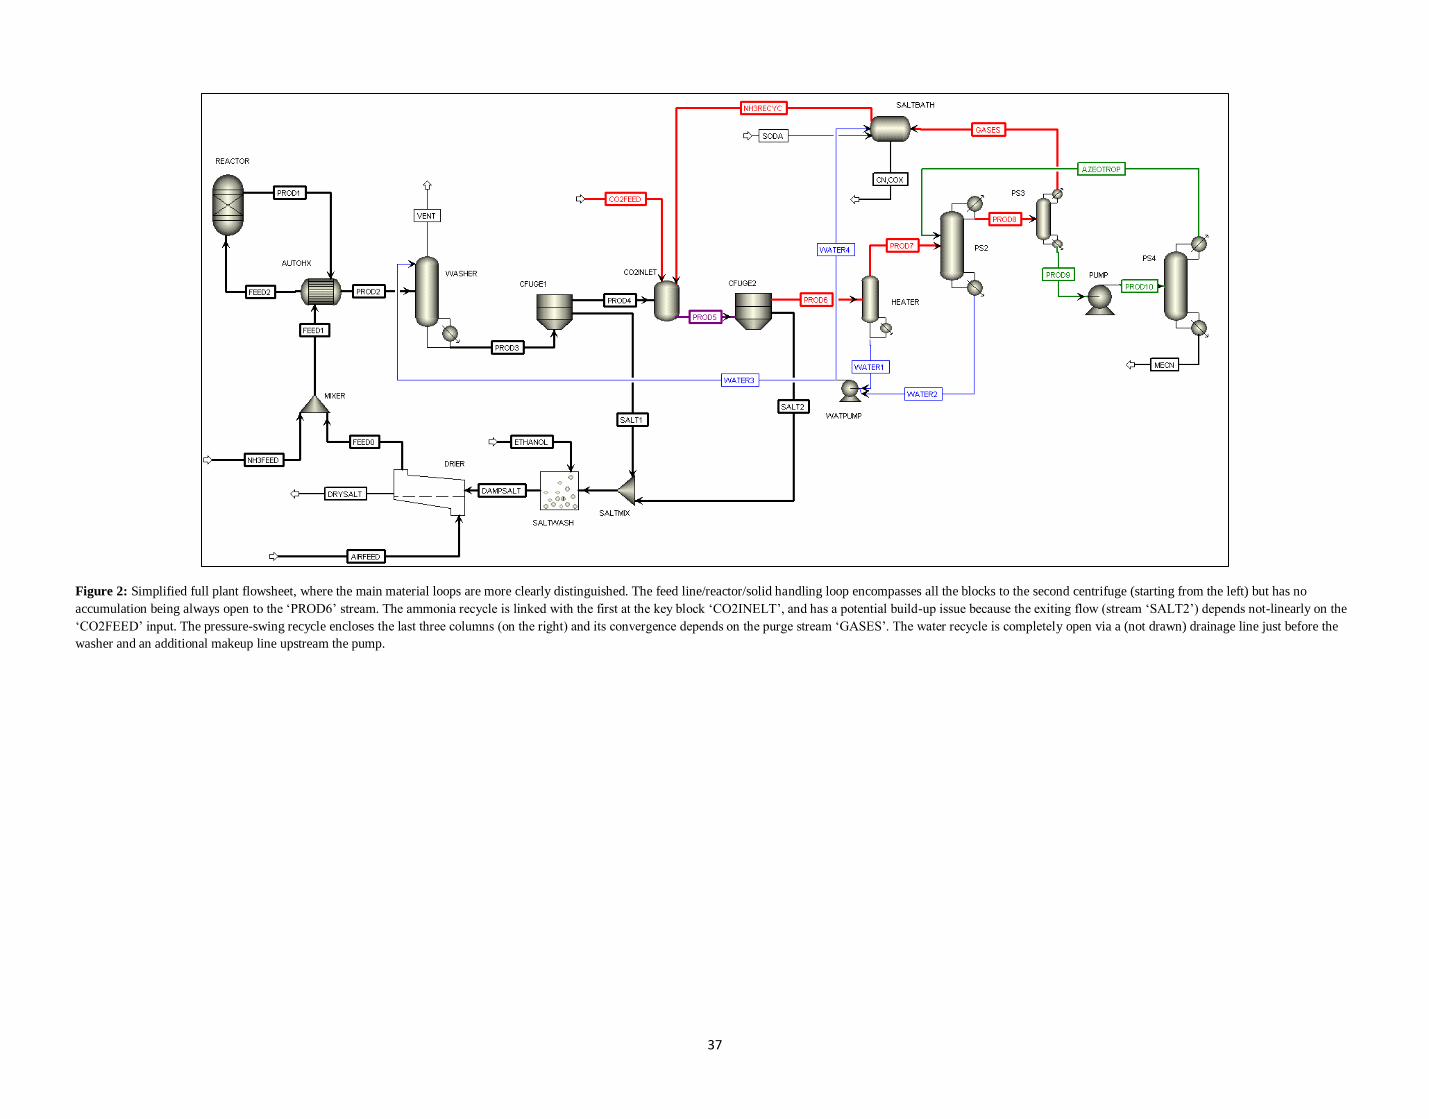
Figure 2: Simplified full plant flowsheet, where the main material loops are more clearly distinguished. The feed line/reactor/solid handling loop encompasses all the blocks to the second centrifuge (starting from the left) but has no
accumulation being always open to the ‘PROD6’ stream. The ammonia recycle is linked with the first at the key block ‘CO2INELT’, and has a potential build-up issue because the exiting flow (stream ‘SALT2’) depends not-linearly on the
‘CO2FEED’ input. The pressure-swing recycle encloses the last three columns (on the right) and its convergence depends on the purge stream ‘GASES’. The water recycle is completely open via a (not drawn) drainage line just before the
washer and an additional makeup line upstream the pump.
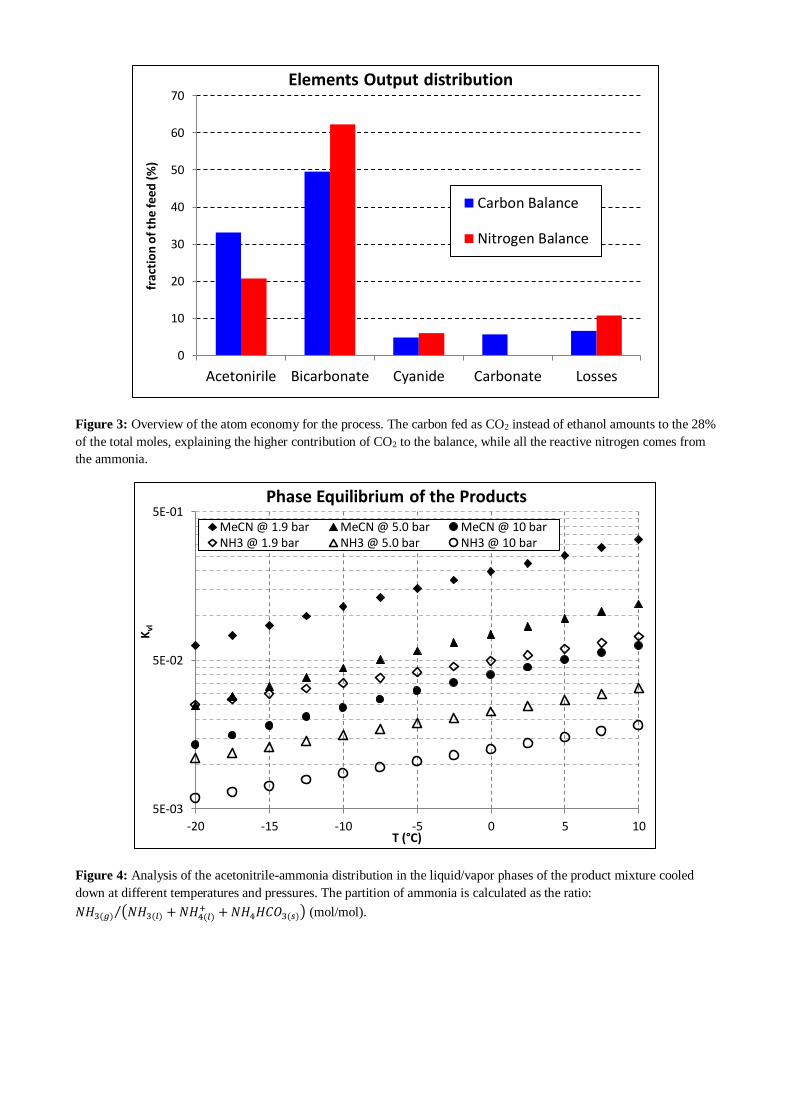
Figure 3: Overview of the atom economy for the process. The carbon fed as CO2 instead of ethanol amounts to the 28%
of the total moles, explaining the higher contribution of CO2 to the balance, while all the reactive nitrogen comes from
the ammonia.
Figure 4: Analysis of the acetonitrile-ammonia distribution in the liquid/vapor phases of the product mixture cooled
down at different temperatures and pressures. The partition of ammonia is calculated as the ratio:
𝑁𝐻3(𝑔) (𝑁𝐻3(𝑙) + 𝑁𝐻4(𝑙)+ + 𝑁𝐻4𝐻𝐶𝑂3(𝑠))⁄ (mol/mol).
0
10
20
30
40
50
60
70
Acetonirile Bicarbonate Cyanide Carbonate Losses
fra
ctio
n o
f th
e f
ee
d (
%)
Elements Output distribution
Carbon Balance
Nitrogen Balance
5E-03
5E-02
5E-01
-20 -15 -10 -5 0 5 10
Kvl
T (°C)
Phase Equilibrium of the Products
MeCN @ 1.9 bar MeCN @ 5.0 bar MeCN @ 10 barNH3 @ 1.9 bar NH3 @ 5.0 bar NH3 @ 10 bar
39
Figure 5: Renewability grade (green) for the bio-based and fossil routes to acetonitrile.
Figure 6: Single score of the two alternative routes to acetonitrile, in terms of single score (i.e. cumulative impact).
-300
-200
-100
0
100
200
300
400
500
600
Bio-basedacetonitrile,from corn
EtOH
Fossil-basedacetonitrile,from SOHIO
process
mP
t
Climate Change
Fossil depletion
Metal depletion
Natural landtransformation
Urban landoccupation
Agricultural landoccupation
Freshwaterecotoxicity
Terrestrialecotoxicity
Particulate matterformation
Human toxicity

Figure 7: Sensitivity analysis of different routes to acetonitrile, cumulative scores (Pt).
-400
-200
0
200
400
600
800
1,000
1,200
Bio-basedacetonitrile,
from corn EtOH
Bio-basedacetonitrile, fromsugarcane EtOH
Bio-basedacetonitrile, from
lignocellulosicEtOH
Fossil-basedacetonitrile, from
SOHIO process
mP
tClimate Change
Fossil depletion
Metal depletion
Natural land transformation
Urban land occupation
Agricultural land occupation
Freshwater ecotoxicity
Terrestrial ecotoxicity
Particulate matter formation
41
For Table of Contents Use Only
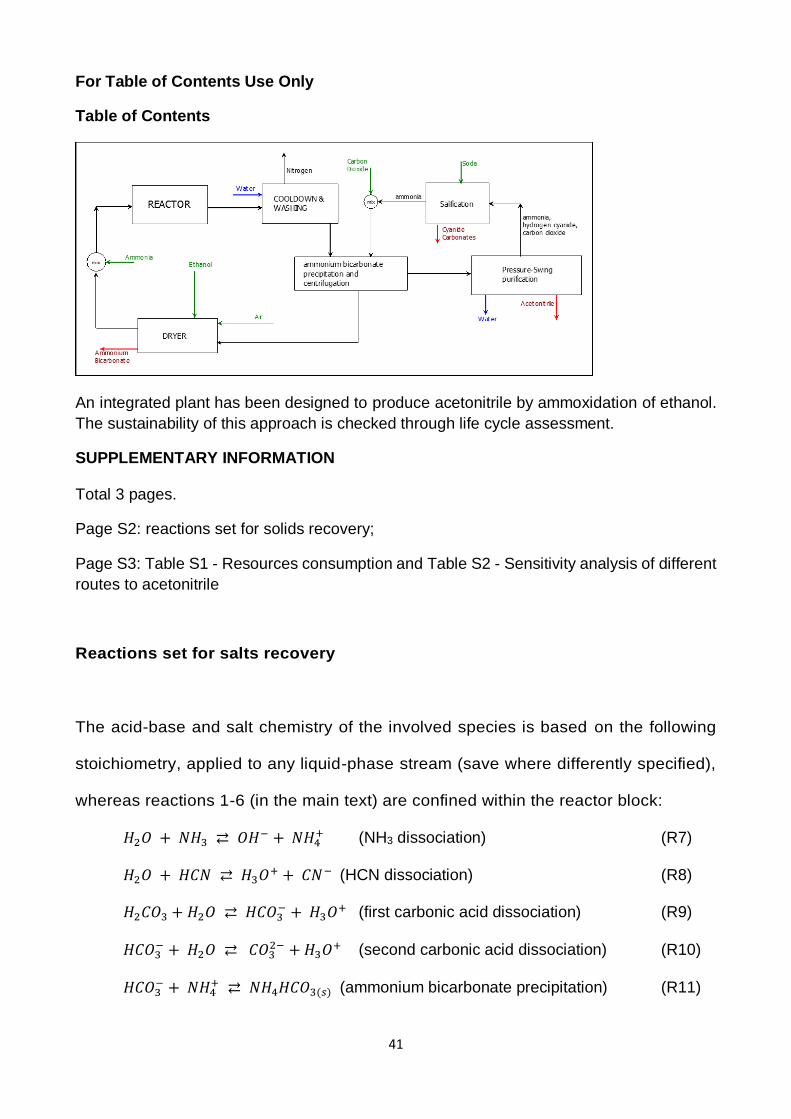
Table of Contents
An integrated plant has been designed to produce acetonitrile by ammoxidation of ethanol.
The sustainability of this approach is checked through life cycle assessment.
SUPPLEMENTARY INFORMATION
Total 3 pages.
Page S2: reactions set for solids recovery;
Page S3: Table S1 - Resources consumption and Table S2 - Sensitivity analysis of different
routes to acetonitrile
Reactions set for salts recovery
The acid-base and salt chemistry of the involved species is based on the following
stoichiometry, applied to any liquid-phase stream (save where differently specified),
whereas reactions 1-6 (in the main text) are confined within the reactor block:
𝐻2𝑂 + 𝑁𝐻3 ⇄ 𝑂𝐻− + 𝑁𝐻4+ (NH3 dissociation) (R7)
𝐻2𝑂 + 𝐻𝐶𝑁 ⇄ 𝐻3𝑂+ + 𝐶𝑁− (HCN dissociation) (R8)
𝐻2𝐶𝑂3 + 𝐻2𝑂 ⇄ 𝐻𝐶𝑂3− + 𝐻3𝑂+ (first carbonic acid dissociation) (R9)
𝐻𝐶𝑂3− + 𝐻2𝑂 ⇄ 𝐶𝑂3
2− + 𝐻3𝑂+ (second carbonic acid dissociation) (R10)
𝐻𝐶𝑂3− + 𝑁𝐻4
+ ⇄ 𝑁𝐻4𝐻𝐶𝑂3(𝑠) (ammonium bicarbonate precipitation) (R11)

𝑁𝑎𝑂𝐻(𝑠) → 𝑁𝑎+ + 𝑂𝐻− (NaOH dissociation) (R12)
2𝐻2𝑂 ⇄ 𝐻3𝑂+ + 𝑂𝐻− (water auto-protolysis) (R13)
where the formation of carbamates has been neglected, at this stage of process
development, being at least one order of magnitude less concentrated with respect
to the ammonium and bicarbonate ions [Mathias, P. M.; Reddy, S.; Connell, J. P. O.
Quantitative Evaluation of the Aqueous-Ammonia Process for CO 2 Capture Using
Fundamental Data and Thermodynamic Analysis. Energy Procedia 2009, 1 (1),
1227–1234].
43
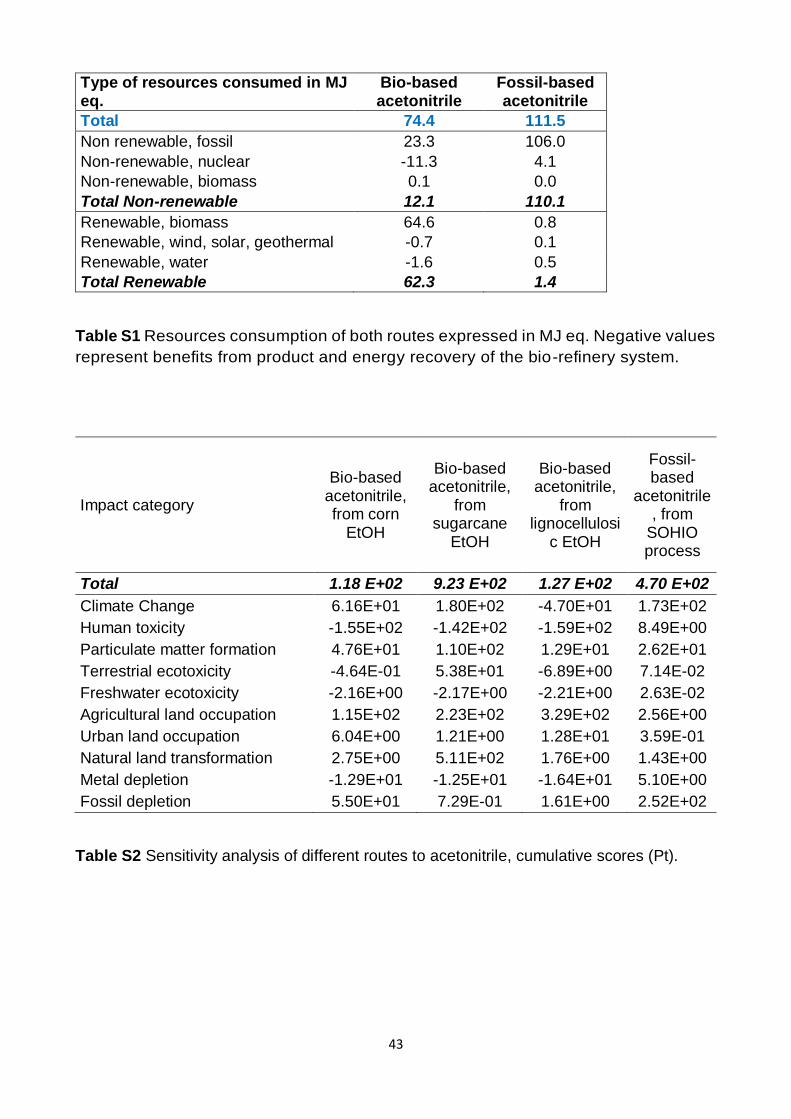
Type of resources consumed in MJ eq.
Bio-based acetonitrile
Fossil-based acetonitrile
Total 74.4 111.5
Non renewable, fossil 23.3 106.0
Non-renewable, nuclear -11.3 4.1
Non-renewable, biomass 0.1 0.0
Total Non-renewable 12.1 110.1
Renewable, biomass 64.6 0.8
Renewable, wind, solar, geothermal -0.7 0.1
Renewable, water -1.6 0.5
Total Renewable 62.3 1.4
Table S1 Resources consumption of both routes expressed in MJ eq. Negative values
represent benefits from product and energy recovery of the bio-refinery system.
Impact category
Bio-based acetonitrile, from corn
EtOH
Bio-based acetonitrile,
from sugarcane
EtOH
Bio-based acetonitrile,
from lignocellulosi
c EtOH
Fossil-based
acetonitrile, from
SOHIO process
Total 1.18 E+02 9.23 E+02 1.27 E+02 4.70 E+02
Climate Change 6.16E+01 1.80E+02 -4.70E+01 1.73E+02
Human toxicity -1.55E+02 -1.42E+02 -1.59E+02 8.49E+00
Particulate matter formation 4.76E+01 1.10E+02 1.29E+01 2.62E+01
Terrestrial ecotoxicity -4.64E-01 5.38E+01 -6.89E+00 7.14E-02
Freshwater ecotoxicity -2.16E+00 -2.17E+00 -2.21E+00 2.63E-02
Agricultural land occupation 1.15E+02 2.23E+02 3.29E+02 2.56E+00
Urban land occupation 6.04E+00 1.21E+00 1.28E+01 3.59E-01
Natural land transformation 2.75E+00 5.11E+02 1.76E+00 1.43E+00
Metal depletion -1.29E+01 -1.25E+01 -1.64E+01 5.10E+00
Fossil depletion 5.50E+01 7.29E-01 1.61E+00 2.52E+02
Table S2 Sensitivity analysis of different routes to acetonitrile, cumulative scores (Pt).


![Electrochemical reduction of 7,7,8,8 ... · solvent systems (methanol, ethanol and acetonitrile in presence of HCl) [20–22]. In spite of ... performed after deoxygenation with argon](https://img.pdfslide.us/doc/110x75/5e29499a03cee952570867a4/electrochemical-reduction-of-7788-solvent-systems-methanol-ethanol-and.jpg)