Embed Size (px)
Citation preview
Water Structure at Air/Acetonitrile Aqueous Solution Interfaces
Yi Rao, Nicholas J. Turro, and Kenneth B. Eisenthal*Department of Chemistry, 3000 Broadway, Columbia UniVersity, New York, New York 10027
ReceiVed: March 31, 2009; ReVised Manuscript ReceiVed: May 1, 2009
How is interfacial water organized beneath an acetonitrile monolayer at the air/acetonitrile aqueous solutioninterface? The method of vibrational sum frequency generation was used to address these issues. It wasfound that the different water structures expressed at different vibrational spectral regions, i.e. the “ice-like”,the “liquid-like”, and the non-hydrogen bonded “free” OD, responded differently as the acetonitrile bulkconcentration was increased. At the bulk acetonitrile concentration that was sufficient to form an acetonitrilemonolayer and at higher bulk concentrations, it was observed that there are no longer vibrational resonancesthat correspond to the oriented collective water vibrations, i.e. the “ice-like” and “liquid-like” structures ofwater as observed at the air/water interface. The story was different in the free OD vibrational region wherea red-shifted resonance was found at acetonitrile concentrations sufficient to form an acetonitrile monolayer.Speculations on the origin of this resonance are presented.
Introduction
The structure of interfacial water is of importance in science,medicine, and technology.1,2 The geometrical arrangements andpacking of the molecules that comprise a water interface are adelicate balance of the intermolecular interactions of the watermolecules with each other and with those of the other bulkphases. The unique chemical and physical properties associatedwith water surfaces, whether they are composed of one chemicalspecies (neat water interface) or are multicomponent aqueoussurfaces, are directly related to the orientational structure,molecular density, and the chemical composition of the interface.The vibrational spectrum of the water surface is of particularinterest because the OH stretch modes are highly sensitive tothe local molecular environment.3-12 The water vibrationalspectrum therefore provides a sensitive probe of the structureand energetics of the hydrogen-bond network at interfaces.
The interfacial structures as well as the bulk structures ofbinary nonelectrolyte aqueous solutions are of special interest.2
Of these, the bulk properties of acetonitrile-water binarysolutions have been studied extensively by many techniquesbecause of its importance in many areas of chemistry rangingfrom synthesis to chromatography and electrochemistry.13-16
Thermodynamics and diffusion studies indicate that the bulkbehavior is far from that of an ideal solution.15,16 At the air/CH3CN-water solution interface, there is a preferential adsorp-tion of acetonitrile because interfacial acetonitrile significantlylowers the interface energy relative to the air/water interface.17,18
Related to the studies discussed here is earlier work on theinterfacial orientational structure and vibrational spectrum ofCH3CN at the air/CH3CN-H2O solution interface.17,18 Evidenceof an unexpected sharp change in the sum frequency generation(SFG) signals occurred when the bulk CH3CN concentrationincreased from a mole fraction below 0.07 to 0.1.17,19 Thischange was manifested by an abrupt shift in both the -CNvibrational frequency (14 cm-1) and in the orientation ofacetonitrile molecules (40°-70° tilt) at the interface. A sharpchange in orientation at the same bulk acetonitrile concentrationhas been observed and reported to us in a private communica-
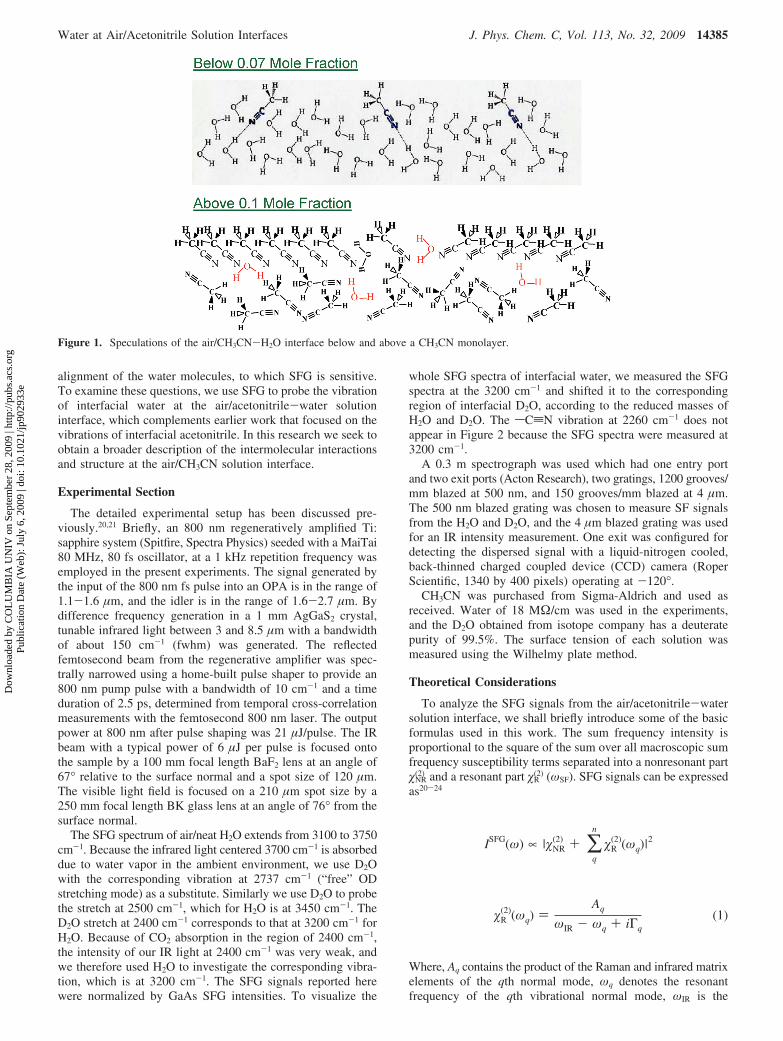
tion.19 The vibrational frequency of the -CN chromophore atbulk concentrations below XCH3CN ) 0.07 was found to becharacteristic of nitriles hydrogen bonded to proton donors suchas water in bulk solution. At bulk concentrations greater than0.1 mol fraction, the vibrational frequency of the interfacial-CN chromophore was observed to shift to a value that is nearthat in neat bulk acetonitrile, i.e. the non-hydrogen bonded form.This dependence of vibrational frequency on compositionindicates that the acetonitrile molecules at the surface experiencetwo different environments: one below 0.07 and one at andabove 0.1 mol fraction. A model was proposed to account forthe structural changes. It was suggested that at the higher bulkconcentrations the acetonitrile molecules at the interface are nolonger hydrogen bonded to water and have changed theirorientation. The driving force for the structural change wasattributed to the dipole-dipole interactions among the interfacialacetonitrile molecules. As the interfacial density of the CH3CNmolecules increase, their dipole-dipole interactions becomemore important. These interactions can be attractive or repulsive.The orientational rearrangement, which results from the CH3CNdipole axis being at larger angles to the surface normal, reducesthe repulsive dipole-dipole interactions and increases theattractive interactions, which thereby lowers the surface freeenergy (Figure 1).
In the present study, we address the question of the changein water structure as CH3CN displaces the H2O molecules atthe interface. Are the water molecules beneath acetonitrilemonolayer oriented or not? It has been well established thatthe presence of an insoluble monolayer significantly alters thestructure of interfacial water. Unlike previous studies, whichexamined the water structure beneath an insoluble surfactantmonolayer, the work reported here involves the presence of themolecules comprising the monolayer, in this case acetonitrile,that are in the bulk solution as well as at the interface. Theacetonitrile molecules are free to enter and leave the interfacialregion, whereas the surfactant cannot. Because the acetonitrilemolecules are in the bulk solution, they compete with the watermolecules for locations beneath the acetonitrile monolayers. Akey issue is how the acetonitrile molecules below the monolayeraffect the water hydrogen bonding network and the orientational* E-mail: [email protected].
J. Phys. Chem. C 2009, 113, 14384–1438914384
10.1021/jp902933e CCC: $40.75 2009 American Chemical SocietyPublished on Web 07/06/2009
Dow
nloa
ded
by C
OL
UM
BIA
UN
IV o
n Se
ptem
ber
28, 2
009
| http
://pu
bs.a
cs.o
rg
Pub
licat
ion
Dat
e (W
eb):
Jul
y 6,
200
9 | d
oi: 1
0.10
21/jp
9029
33e
alignment of the water molecules, to which SFG is sensitive.To examine these questions, we use SFG to probe the vibrationof interfacial water at the air/acetonitrile-water solutioninterface, which complements earlier work that focused on thevibrations of interfacial acetonitrile. In this research we seek toobtain a broader description of the intermolecular interactionsand structure at the air/CH3CN solution interface.
Experimental Section
The detailed experimental setup has been discussed pre-viously.20,21 Briefly, an 800 nm regeneratively amplified Ti:sapphire system (Spitfire, Spectra Physics) seeded with a MaiTai80 MHz, 80 fs oscillator, at a 1 kHz repetition frequency wasemployed in the present experiments. The signal generated bythe input of the 800 nm fs pulse into an OPA is in the range of1.1-1.6 µm, and the idler is in the range of 1.6-2.7 µm. Bydifference frequency generation in a 1 mm AgGaS2 crystal,tunable infrared light between 3 and 8.5 µm with a bandwidthof about 150 cm-1 (fwhm) was generated. The reflectedfemtosecond beam from the regenerative amplifier was spec-trally narrowed using a home-built pulse shaper to provide an800 nm pump pulse with a bandwidth of 10 cm-1 and a timeduration of 2.5 ps, determined from temporal cross-correlationmeasurements with the femtosecond 800 nm laser. The outputpower at 800 nm after pulse shaping was 21 µJ/pulse. The IRbeam with a typical power of 6 µJ per pulse is focused ontothe sample by a 100 mm focal length BaF2 lens at an angle of67° relative to the surface normal and a spot size of 120 µm.The visible light field is focused on a 210 µm spot size by a250 mm focal length BK glass lens at an angle of 76° from thesurface normal.
The SFG spectrum of air/neat H2O extends from 3100 to 3750cm-1. Because the infrared light centered 3700 cm-1 is absorbeddue to water vapor in the ambient environment, we use D2Owith the corresponding vibration at 2737 cm-1 (“free” ODstretching mode) as a substitute. Similarly we use D2O to probethe stretch at 2500 cm-1, which for H2O is at 3450 cm-1. TheD2O stretch at 2400 cm-1 corresponds to that at 3200 cm-1 forH2O. Because of CO2 absorption in the region of 2400 cm-1,the intensity of our IR light at 2400 cm-1 was very weak, andwe therefore used H2O to investigate the corresponding vibra-tion, which is at 3200 cm-1. The SFG signals reported herewere normalized by GaAs SFG intensities. To visualize the
whole SFG spectra of interfacial water, we measured the SFGspectra at the 3200 cm-1 and shifted it to the correspondingregion of interfacial D2O, according to the reduced masses ofH2O and D2O. The sCtN vibration at 2260 cm-1 does notappear in Figure 2 because the SFG spectra were measured at3200 cm-1.
A 0.3 m spectrograph was used which had one entry portand two exit ports (Acton Research), two gratings, 1200 grooves/mm blazed at 500 nm, and 150 grooves/mm blazed at 4 µm.The 500 nm blazed grating was chosen to measure SF signalsfrom the H2O and D2O, and the 4 µm blazed grating was usedfor an IR intensity measurement. One exit was configured fordetecting the dispersed signal with a liquid-nitrogen cooled,back-thinned charged coupled device (CCD) camera (RoperScientific, 1340 by 400 pixels) operating at -120°.
CH3CN was purchased from Sigma-Aldrich and used asreceived. Water of 18 MΩ/cm was used in the experiments,and the D2O obtained from isotope company has a deuteratepurity of 99.5%. The surface tension of each solution wasmeasured using the Wilhelmy plate method.
Theoretical Considerations
To analyze the SFG signals from the air/acetonitrile-watersolution interface, we shall briefly introduce some of the basicformulas used in this work. The sum frequency intensity isproportional to the square of the sum over all macroscopic sumfrequency susceptibility terms separated into a nonresonant partNR
(2) and a resonant part R(2) (ωSF). SFG signals can be expressed
as20-24
Where, Aq contains the product of the Raman and infrared matrixelements of the qth normal mode, ωq denotes the resonantfrequency of the qth vibrational normal mode, ωIR is the
Figure 1. Speculations of the air/CH3CN-H2O interface below and above a CH3CN monolayer.
ISFG(ω) ∝ |NR(2) + ∑
q
n
R(2)(ωq)|
2
R(2)(ωq) )
Aq
ωIR - ωq + iΓq(1)
Water at Air/Acetonitrile Solution Interfaces J. Phys. Chem. C, Vol. 113, No. 32, 2009 14385
Dow
nloa
ded
by C
OL
UM
BIA
UN
IV o
n Se
ptem
ber
28, 2
009
| http
://pu
bs.a
cs.o
rg
Pub
licat
ion
Dat
e (W
eb):
Jul
y 6,
200
9 | d
oi: 1
0.10
21/jp
9029
33e
frequency of the IR light, and Γq is the spectral width of thevibrational state.
Of the total 27 macroscopic susceptibility tensors IJK(2) (I, J,
K being the three laboratory coordinates), 7 nonzero terms arenonvanishing for a rotationally isotropic interface (C∞V sym-metry), namely, XXZ
(2) ) YYZ(2) ; XZX
(2) ) YZY(2) ; ZXX
(2) ) ZYY(2) and
ZZZ(2) .18-24,27-30 In our experiments, the YZ plane was the plane
of incidence for both the visible and IR beams. The twopolarization combinations measured in each experiment wereSSP and PPP, where the first letter denotes the polarization ofthe sum frequency, the second one denotes the polarizationof the visible light, and the last one denotes the polarization ofthe IR light. These polarizations are connected with thelaboratory coordinates by nonlinear Fresnel coefficients andappropriate projections. The seven nonzero macroscopic sus-ceptibilities in the laboratory coordinates are obtained from thefour polarization combinations.
Results and Discussion
To examine the effects of acetonitrile on the interfacialstructure of water, we will start with the unperturbed water
structure at a neat air/water interface. Although there arecontroversies, it is generally accepted that there are three typesof OH stretching modes.3-12 One has a fairly narrow spectrumat ∼3700 cm-1, which is attributed to a free OH extending intothe vapor phase, i.e. the OH is not hydrogen bonded to otherwater molecules. In addition there are two broad and overlappingbands centered at ∼3400 and 3200 cm-1 that are attributed tooriented hydrogen bonded collective water vibrations. The 3400cm-1 vibration is often referred to as “liquid-like” because ofits proximity to bonded OH stretching modes in bulk water. Ina similar way, the 3200 cm-1 resonance is referred to as being“ice-like” because of its proximity to bonded OH in bulk ice.As noted earlier, D2O is used rather than H2O for experimentalreasons. The peaks for the OD stretching modes at 2737 and2500 cm-1 correspond respectively to the 3700 and 3400 cm-1
modes for the OH stretching modes. Measurements of the 3200cm-1 OH stretching mode corresponds to the 2350 cm-1
resonance for the OD stretching mode (Figure 2). It is to benoted that the SFG spectra of D2O is slightly dependent on theangle of incidence of the visible and IR beams. Thus in ourexperiments, which were performed at geometries that were
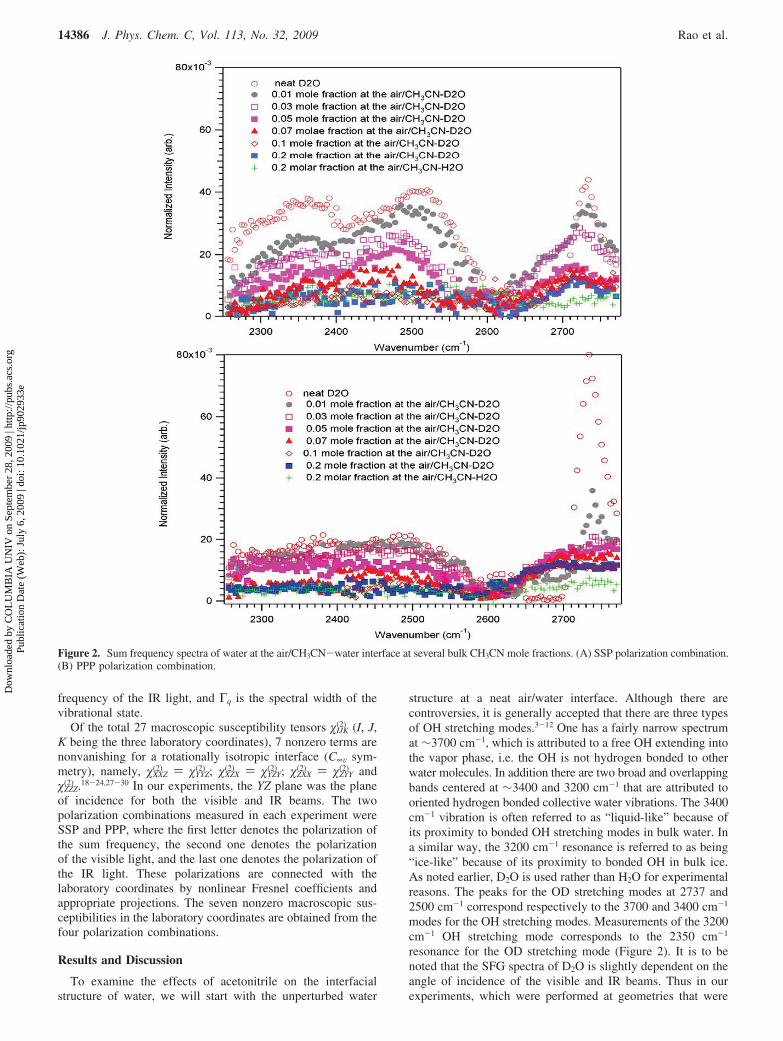
Figure 2. Sum frequency spectra of water at the air/CH3CN-water interface at several bulk CH3CN mole fractions. (A) SSP polarization combination.(B) PPP polarization combination.
14386 J. Phys. Chem. C, Vol. 113, No. 32, 2009 Rao et al.
Dow
nloa
ded
by C
OL
UM
BIA
UN
IV o
n Se
ptem
ber
28, 2
009
| http
://pu
bs.a
cs.o
rg
Pub
licat
ion
Dat
e (W
eb):
Jul
y 6,
200
9 | d
oi: 1
0.10
21/jp
9029
33e
different from those in other laboratories,25,26 we obtainedslightly different SFG spectra.
In order to determine orientational structure, we used theintensity ratio method in our data analysis. Because thesymmetry of the free OD is C∞V, there are three nonzerohyperpolarizability elements, which are zzz
(2), xxz(2) ) yyz
(2) ) rzzz(2),
where z is parallel to the OD bond and x and y are perpendicularto the OD bond and r ) xxz
(2)/zzz(2). The allowed susceptibility
tensors for the OD chromophore are20-24,27-34
The orientation of the free OD axis is independent of the in-plane angle φ because the interface of a liquid is isotropic withrespect to φ.
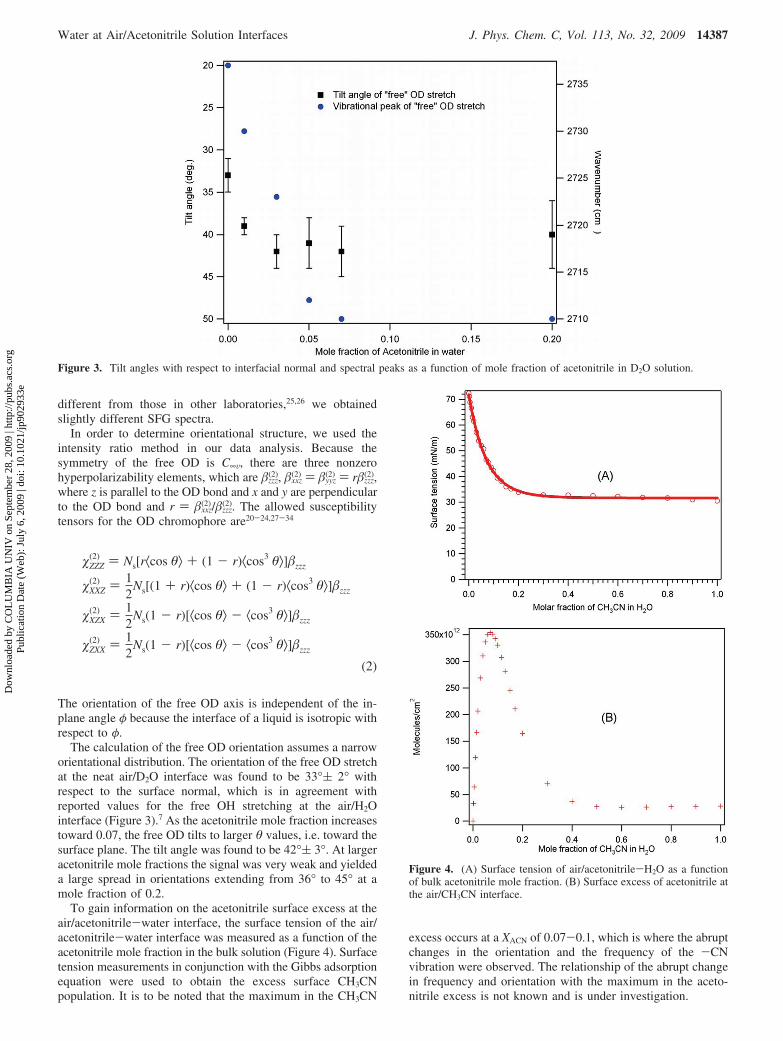
The calculation of the free OD orientation assumes a narroworientational distribution. The orientation of the free OD stretchat the neat air/D2O interface was found to be 33°( 2° withrespect to the surface normal, which is in agreement withreported values for the free OH stretching at the air/H2Ointerface (Figure 3).7 As the acetonitrile mole fraction increasestoward 0.07, the free OD tilts to larger θ values, i.e. toward thesurface plane. The tilt angle was found to be 42°( 3°. At largeracetonitrile mole fractions the signal was very weak and yieldeda large spread in orientations extending from 36° to 45° at amole fraction of 0.2.
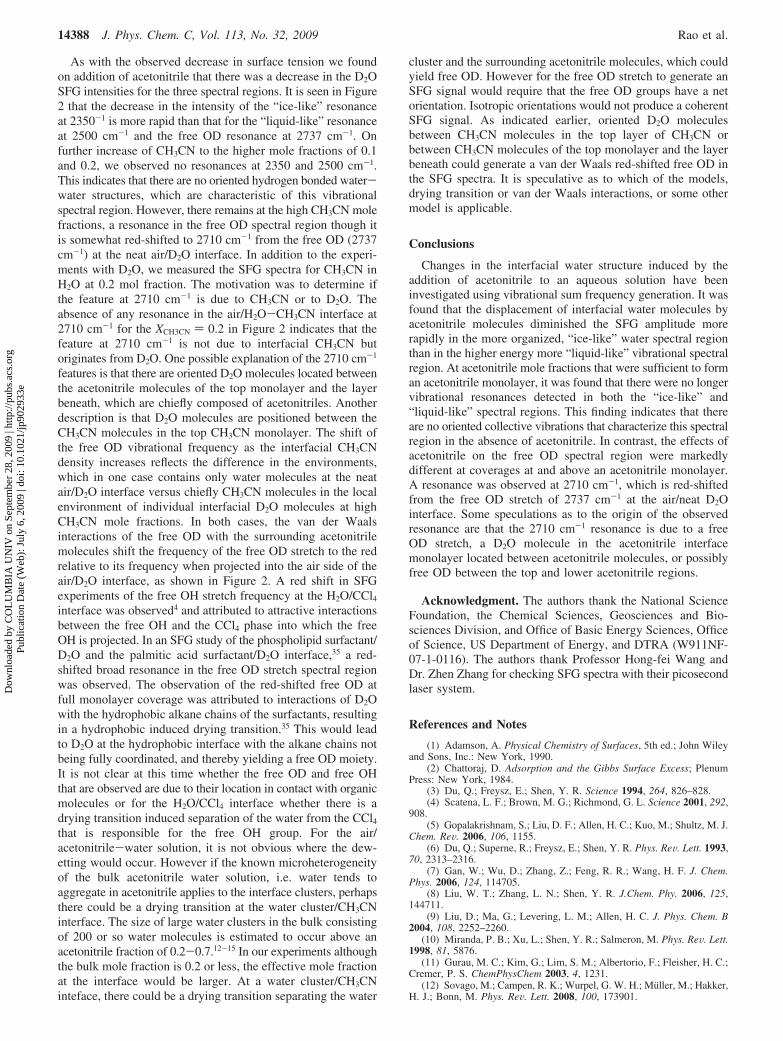
To gain information on the acetonitrile surface excess at theair/acetonitrile-water interface, the surface tension of the air/acetonitrile-water interface was measured as a function of theacetonitrile mole fraction in the bulk solution (Figure 4). Surfacetension measurements in conjunction with the Gibbs adsorptionequation were used to obtain the excess surface CH3CNpopulation. It is to be noted that the maximum in the CH3CN
excess occurs at a XACN of 0.07-0.1, which is where the abruptchanges in the orientation and the frequency of the -CNvibration were observed. The relationship of the abrupt changein frequency and orientation with the maximum in the aceto-nitrile excess is not known and is under investigation.
Figure 3. Tilt angles with respect to interfacial normal and spectral peaks as a function of mole fraction of acetonitrile in D2O solution.
ZZZ(2) ) Ns[r⟨cos θ⟩ + (1 - r)⟨cos3 θ⟩]zzz
XXZ(2) ) 1
2Ns[(1 + r)⟨cos θ⟩ + (1 - r)⟨cos3 θ⟩]zzz
XZX(2) ) 1
2Ns(1 - r)[⟨cos θ⟩ - ⟨cos3 θ⟩]zzz
ZXX(2) ) 1
2Ns(1 - r)[⟨cos θ⟩ - ⟨cos3 θ⟩]zzz
(2)
Figure 4. (A) Surface tension of air/acetonitrile-H2O as a functionof bulk acetonitrile mole fraction. (B) Surface excess of acetonitrile atthe air/CH3CN interface.
Water at Air/Acetonitrile Solution Interfaces J. Phys. Chem. C, Vol. 113, No. 32, 2009 14387
Dow
nloa
ded
by C
OL
UM
BIA
UN
IV o
n Se
ptem
ber
28, 2
009
| http
://pu
bs.a
cs.o
rg
Pub
licat
ion
Dat
e (W
eb):
Jul
y 6,
200
9 | d
oi: 1
0.10
21/jp
9029
33e
As with the observed decrease in surface tension we foundon addition of acetonitrile that there was a decrease in the D2OSFG intensities for the three spectral regions. It is seen in Figure2 that the decrease in the intensity of the “ice-like” resonanceat 2350-1 is more rapid than that for the “liquid-like” resonanceat 2500 cm-1 and the free OD resonance at 2737 cm-1. Onfurther increase of CH3CN to the higher mole fractions of 0.1and 0.2, we observed no resonances at 2350 and 2500 cm-1.This indicates that there are no oriented hydrogen bonded water-water structures, which are characteristic of this vibrationalspectral region. However, there remains at the high CH3CN molefractions, a resonance in the free OD spectral region though itis somewhat red-shifted to 2710 cm-1 from the free OD (2737cm-1) at the neat air/D2O interface. In addition to the experi-ments with D2O, we measured the SFG spectra for CH3CN inH2O at 0.2 mol fraction. The motivation was to determine ifthe feature at 2710 cm-1 is due to CH3CN or to D2O. Theabsence of any resonance in the air/H2O-CH3CN interface at2710 cm-1 for the XCH3CN ) 0.2 in Figure 2 indicates that thefeature at 2710 cm-1 is not due to interfacial CH3CN butoriginates from D2O. One possible explanation of the 2710 cm-1
features is that there are oriented D2O molecules located betweenthe acetonitrile molecules of the top monolayer and the layerbeneath, which are chiefly composed of acetonitriles. Anotherdescription is that D2O molecules are positioned between theCH3CN molecules in the top CH3CN monolayer. The shift ofthe free OD vibrational frequency as the interfacial CH3CNdensity increases reflects the difference in the environments,which in one case contains only water molecules at the neatair/D2O interface versus chiefly CH3CN molecules in the localenvironment of individual interfacial D2O molecules at highCH3CN mole fractions. In both cases, the van der Waalsinteractions of the free OD with the surrounding acetonitrilemolecules shift the frequency of the free OD stretch to the redrelative to its frequency when projected into the air side of theair/D2O interface, as shown in Figure 2. A red shift in SFGexperiments of the free OH stretch frequency at the H2O/CCl4
interface was observed4 and attributed to attractive interactionsbetween the free OH and the CCl4 phase into which the freeOH is projected. In an SFG study of the phospholipid surfactant/D2O and the palmitic acid surfactant/D2O interface,35 a red-shifted broad resonance in the free OD stretch spectral regionwas observed. The observation of the red-shifted free OD atfull monolayer coverage was attributed to interactions of D2Owith the hydrophobic alkane chains of the surfactants, resultingin a hydrophobic induced drying transition.35 This would leadto D2O at the hydrophobic interface with the alkane chains notbeing fully coordinated, and thereby yielding a free OD moiety.It is not clear at this time whether the free OD and free OHthat are observed are due to their location in contact with organicmolecules or for the H2O/CCl4 interface whether there is adrying transition induced separation of the water from the CCl4
that is responsible for the free OH group. For the air/acetonitrile-water solution, it is not obvious where the dew-etting would occur. However if the known microheterogeneityof the bulk acetonitrile water solution, i.e. water tends toaggregate in acetonitrile applies to the interface clusters, perhapsthere could be a drying transition at the water cluster/CH3CNinterface. The size of large water clusters in the bulk consistingof 200 or so water molecules is estimated to occur above anacetonitrile fraction of 0.2-0.7.12-15 In our experiments althoughthe bulk mole fraction is 0.2 or less, the effective mole fractionat the interface would be larger. At a water cluster/CH3CNinteface, there could be a drying transition separating the water
cluster and the surrounding acetonitrile molecules, which couldyield free OD. However for the free OD stretch to generate anSFG signal would require that the free OD groups have a netorientation. Isotropic orientations would not produce a coherentSFG signal. As indicated earlier, oriented D2O moleculesbetween CH3CN molecules in the top layer of CH3CN orbetween CH3CN molecules of the top monolayer and the layerbeneath could generate a van der Waals red-shifted free OD inthe SFG spectra. It is speculative as to which of the models,drying transition or van der Waals interactions, or some othermodel is applicable.
Conclusions
Changes in the interfacial water structure induced by theaddition of acetonitrile to an aqueous solution have beeninvestigated using vibrational sum frequency generation. It wasfound that the displacement of interfacial water molecules byacetonitrile molecules diminished the SFG amplitude morerapidly in the more organized, “ice-like” water spectral regionthan in the higher energy more “liquid-like” vibrational spectralregion. At acetonitrile mole fractions that were sufficient to forman acetonitrile monolayer, it was found that there were no longervibrational resonances detected in both the “ice-like” and“liquid-like” spectral regions. This finding indicates that thereare no oriented collective vibrations that characterize this spectralregion in the absence of acetonitrile. In contrast, the effects ofacetonitrile on the free OD spectral region were markedlydifferent at coverages at and above an acetonitrile monolayer.A resonance was observed at 2710 cm-1, which is red-shiftedfrom the free OD stretch of 2737 cm-1 at the air/neat D2Ointerface. Some speculations as to the origin of the observedresonance are that the 2710 cm-1 resonance is due to a freeOD stretch, a D2O molecule in the acetonitrile interfacemonolayer located between acetonitrile molecules, or possiblyfree OD between the top and lower acetonitrile regions.
Acknowledgment. The authors thank the National ScienceFoundation, the Chemical Sciences, Geosciences and Bio-sciences Division, and Office of Basic Energy Sciences, Officeof Science, US Department of Energy, and DTRA (W911NF-07-1-0116). The authors thank Professor Hong-fei Wang andDr. Zhen Zhang for checking SFG spectra with their picosecondlaser system.
References and Notes
(1) Adamson, A. Physical Chemistry of Surfaces, 5th ed.; John Wileyand Sons, Inc.: New York, 1990.
(2) Chattoraj, D. Adsorption and the Gibbs Surface Excess; PlenumPress: New York, 1984.
(3) Du, Q.; Freysz, E.; Shen, Y. R. Science 1994, 264, 826–828.(4) Scatena, L. F.; Brown, M. G.; Richmond, G. L. Science 2001, 292,
908.(5) Gopalakrishnam, S.; Liu, D. F.; Allen, H. C.; Kuo, M.; Shultz, M. J.
Chem. ReV. 2006, 106, 1155.(6) Du, Q.; Superne, R.; Freysz, E.; Shen, Y. R. Phys. ReV. Lett. 1993,
70, 2313–2316.(7) Gan, W.; Wu, D.; Zhang, Z.; Feng, R. R.; Wang, H. F. J. Chem.
Phys. 2006, 124, 114705.(8) Liu, W. T.; Zhang, L. N.; Shen, Y. R. J.Chem. Phy. 2006, 125,
144711.(9) Liu, D.; Ma, G.; Levering, L. M.; Allen, H. C. J. Phys. Chem. B
2004, 108, 2252–2260.(10) Miranda, P. B.; Xu, L.; Shen, Y. R.; Salmeron, M. Phys. ReV. Lett.
1998, 81, 5876.(11) Gurau, M. C.; Kim, G.; Lim, S. M.; Albertorio, F.; Fleisher, H. C.;
Cremer, P. S. ChemPhysChem 2003, 4, 1231.(12) Sovago, M.; Campen, R. K.; Wurpel, G. W. H.; Muller, M.; Hakker,
H. J.; Bonn, M. Phys. ReV. Lett. 2008, 100, 173901.
14388 J. Phys. Chem. C, Vol. 113, No. 32, 2009 Rao et al.
Dow
nloa
ded
by C
OL
UM
BIA
UN
IV o
n Se
ptem
ber
28, 2
009
| http
://pu
bs.a
cs.o
rg
Pub
licat
ion
Dat
e (W
eb):
Jul
y 6,
200
9 | d
oi: 1
0.10
21/jp
9029
33e
(13) Harris, K. R.; Newitt, P. J. J. Phys. Chem. B 1999, 103, 7015–7018.
(14) Venables, D. S.; Schmuttenmaer, C. A. J. Chem. Phys. 1998, 108,4935.
(15) Takamuku, T.; Tabata, M.; Yamaguchi, A.; Nishimoto, J.; Kuma-moto, M.; Wakita, H.; Yamaguchi, T. J. Phys. Chem. B 1998, 102, 8880–8888.
(16) Paul, S.; Chandra, A. J. Chem. Phys. 2005, 123, 184706.(17) Zhang, D.; Gutow, J. H.; Eisenthal, K. B.; Heinz, T. F. J. Chem.
Phys. 1993, 98, 5099.(18) Kim, J.; Chou, K. C.; Somorjai, G. A. J. Phys. Chem. B 2003,
107, 1592.(19) Zhang, Z.; Wang, H. F., private communication.(20) Rao, Y.; Comstock, M.; Eisenthal, K. B. J. Phys. Chem. B 2006,
110, 1727.(21) Rao, Y.; Song, D. H.; Turro, N. J.; Eisenthal, K. B. J. Phys. Chem.
B 2008, 112, 13572.(22) Rao, Y.; Tao, Y. S.; Wang, H. F. J. Chem. Phys. 2003, 119, 5226.(23) Zhuang, X.; Miranda, P. B.; Kim, D.; Shen, Y. R. Phys. ReV. B
1999, 59, 12632.
(24) Wang, H. F.; Gan, W.; Lu, R.; Rao, Y.; Wu, B. Int. ReV. Phys.Chem. 2005, 24, 191–256.
(25) Tian, C. S.; Shen, Y. R. Chem. Phys. Lett. 2003, 470, 1–6.(26) Sovago, M.; Campen, R. K.; Bakker, H. J.; Bonn, M. Chem. Phys.
Lett. 2009, 470, 7–12.(27) Wang, J.; Paszti, Z.; Even, M. A.; Chen, Z. J. Am. Chem. Soc.
2002, 124, 7016–7023.(28) Voges, A. B.; Al-abadleh, H. A.; Musorrariti, M. J.; Bertin, P. A.;
Nguyen, S. T.; Geiger, F. M. J. Phys. Chem. B 2004, 108, 18675.(29) Esenturk, O.; Walker, R. J. Chem. Phys. 2006, 125, 174701.(30) Fourkas, J. T.; Walker, R. A.; Can, S. Z.; Gershgoren, E. J. Phys.
Chem. C 2007, 111, 8902.(31) Bordenyuk, A.; Benderskii, A. J. Chem. Phys. 2005, 122, 134713.(32) Liu, J.; Conboy, J. J. Phys. Chem. C 2007, 111, 8988.(33) Kataoka, S.; Cremer, P. J. Am. Chem. Soc. 2006, 128, 5516.(34) Shultz, M. J.; Schnitzer, C.; Baldelli, S. Int. ReV. Phys. Chem. 2000,
19, 123.(35) Ma, G.; Chen, X. K.; Allen, H. C. J. Am. Chem. Soc. 2007, 129,
14053.
JP902933E
Water at Air/Acetonitrile Solution Interfaces J. Phys. Chem. C, Vol. 113, No. 32, 2009 14389
Dow
nloa
ded
by C
OL
UM
BIA
UN
IV o
n Se
ptem
ber
28, 2
009
| http
://pu
bs.a
cs.o
rg
Pub
licat
ion
Dat
e (W
eb):
Jul
y 6,
200
9 | d
oi: 1
0.10
21/jp
9029
33e