Embed Size (px)
Citation preview

Investigating the psychometric properties of the Child and
Adolescent PsychProfiler (CAPP) using the Rasch model
PsychProfiler
PsychProfiler Supplement.indd 1 19/11/09 12:35:38 PM

2 PsychProfiler Research Supplement
COPYRIGHT © 2009 AUSTRALIAN COUNCIL FOR EDUCATIONAL RESEARCH
Rassoul Sadeghi (PhD)
Australian Council for Educational ResearchAbstract
The Child and Adolescent PsychProfiler (CAPP) is an easily administered, psychometrically approved screening instrument to identify children and adolescents with psychological disorders. It is a criterion-referenced screener oriented to the DSM-IV-TR. (Diagnostic and Statistical Manual of Disorders, fourth edition, text revision, 2000) The psychometric properties of the CAPP (e.g., inter-rater reliabilities, Cronbach alphas) have been supported using classical test theory (Langsford, Houghton & Douglas, 2007). To date, however, this test has not been subjected to Rasch analysis. The main purpose of this study was to use the Rasch measurement model to investigate the psychometric properties of the CAPP. The CAPP self-report form was administered to 156 participants aged 10 to 17. The Rasch Simple Logistic model was applied to analyse the data using the RUMM2020 software. Rasch analysis was carried out at two levels: 1) analysis on each of the eight main categories, and 2) analysis based on all the items. The main categories showed adequate internal consistency, reliability and construct validity except for the tic disorder category. The result of the analysis for this category was inconclusive because it had only two items. Analysis of all CAPP items combined also supports its use as a measure of General Mental Distress (GMD). A scale combining all 104 items showed good fit to the Rasch measurement model. The results of this study provide support for the measurement properties, internal consistency, reliability, and unidimensionality of the CAPP as a General Mental Distress Index and its seven sub-scales.
Introduction
There is a growing awareness of the need for easily administered, psychometrically sound screening instruments to identify children and adolescents with psychological disorders early. This enables early intervention, helps prevent problems from escalating and leads to a better prognosis. The Child and Adolescent PsychProfiler (CAPP) is designed to screen for the most common psychiatric and psychological disorders found in children and adolescents aged 3 to 17. This instrument provides an accessible and affordable screener that can be used in the early identification of disorders crucial to formal diagnosis, intervention and prevention of further mental health problems.
The CAPP has been used in Australia to identify children and adolescents with psychological disorders. The psychometric properties of the CAPP have been supported using classical test theory. Langsford, Houghton & Douglas (2007) have done a series of rigorous psychometric analyses to investigate the validity and reliability of the PsychProfiler. These analyses found the PsychProfiler to be a highly reliable and valid screening test. Langsford et al. also assessed the inter-rater reliability of the amended PsychProfiler forms. The lowest inter-rater reliability (0.371)
Investigating the psychometric properties of the Child and Adolescent PsychProfiler
(CAPP) using the Rasch model
PsychProfiler Supplement.indd 2 19/11/09 12:35:38 PM
PsychProfiler Research Supplement 3
COPYRIGHT © 2009 AUSTRALIAN COUNCIL FOR EDUCATIONAL RESEARCH
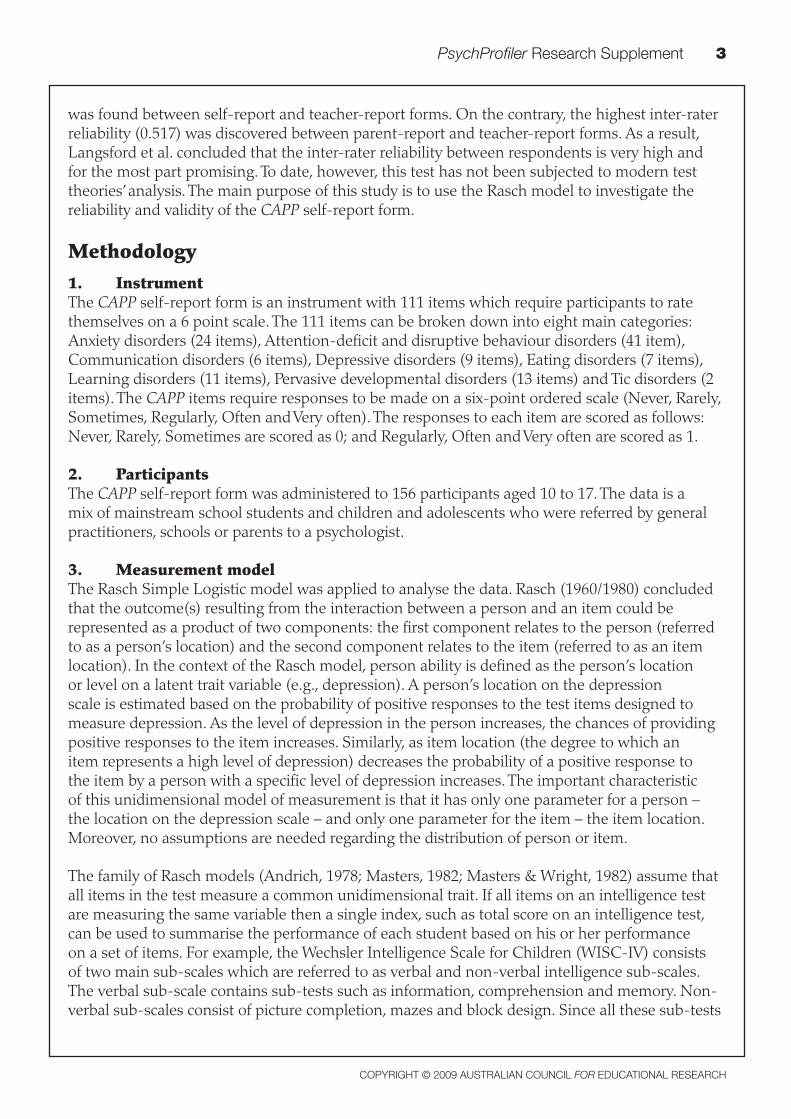
was found between self-report and teacher-report forms. On the contrary, the highest inter-rater reliability (0.517) was discovered between parent-report and teacher-report forms. As a result, Langsford et al. concluded that the inter-rater reliability between respondents is very high and for the most part promising. To date, however, this test has not been subjected to modern test theories’ analysis. The main purpose of this study is to use the Rasch model to investigate the reliability and validity of the CAPP self-report form.
Methodology
1. InstrumentThe CAPP self-report form is an instrument with 111 items which require participants to rate themselves on a 6 point scale. The 111 items can be broken down into eight main categories: Anxiety disorders (24 items), Attention-deficit and disruptive behaviour disorders (41 item), Communication disorders (6 items), Depressive disorders (9 items), Eating disorders (7 items), Learning disorders (11 items), Pervasive developmental disorders (13 items) and Tic disorders (2 items). The CAPP items require responses to be made on a six-point ordered scale (Never, Rarely, Sometimes, Regularly, Often and Very often). The responses to each item are scored as follows: Never, Rarely, Sometimes are scored as 0; and Regularly, Often and Very often are scored as 1.
2. ParticipantsThe CAPP self-report form was administered to 156 participants aged 10 to 17. The data is a mix of mainstream school students and children and adolescents who were referred by general practitioners, schools or parents to a psychologist.
3. Measurement modelThe Rasch Simple Logistic model was applied to analyse the data. Rasch (1960/1980) concluded that the outcome(s) resulting from the interaction between a person and an item could be represented as a product of two components: the first component relates to the person (referred to as a person’s location) and the second component relates to the item (referred to as an item location). In the context of the Rasch model, person ability is defined as the person’s location or level on a latent trait variable (e.g., depression). A person’s location on the depression scale is estimated based on the probability of positive responses to the test items designed to measure depression. As the level of depression in the person increases, the chances of providing positive responses to the item increases. Similarly, as item location (the degree to which an item represents a high level of depression) decreases the probability of a positive response to the item by a person with a specific level of depression increases. The important characteristic of this unidimensional model of measurement is that it has only one parameter for a person – the location on the depression scale – and only one parameter for the item – the item location. Moreover, no assumptions are needed regarding the distribution of person or item.
The family of Rasch models (Andrich, 1978; Masters, 1982; Masters & Wright, 1982) assume that all items in the test measure a common unidimensional trait. If all items on an intelligence test are measuring the same variable then a single index, such as total score on an intelligence test, can be used to summarise the performance of each student based on his or her performance on a set of items. For example, the Wechsler Intelligence Scale for Children (WISC-IV) consists of two main sub-scales which are referred to as verbal and non-verbal intelligence sub-scales. The verbal sub-scale contains sub-tests such as information, comprehension and memory. Non-verbal sub-scales consist of picture completion, mazes and block design. Since all these sub-tests
PsychProfiler Supplement.indd 3 19/11/09 12:35:38 PM

4 PsychProfiler Research Supplement
COPYRIGHT © 2009 AUSTRALIAN COUNCIL FOR EDUCATIONAL RESEARCH
are designed to measure intelligence, it is reasonable to sum the total score on each sub-test and summarise the performance of each student in a single index as verbal or non-verbal intelligence, as well as to sum verbal and non-verbal intelligence to compute a single score for each student.
The Rasch model is a mathematical model that has its own requirements. These requirements impose severe restrictions on the data. In order to use the Rasch model to estimate item and student parameters, the data must meet the model’s requirements. This model provides an explicit framework to examine the model-data fit and verifies whether the data set can be used to construct a scale, in this case a single scale of mental distress. If the data fits the model, it means that all the requirements of the model, including unidimensionality, are satisfied (Write & Stone, 1972; Wright & Masters, 1982; Andrich, 1988).
In the present study, total item chi-square and item-fit residual are used to examine the fit between the data and the Rasch unidimensional model. Total item chi-square is used to test the fit of the entire data matrix to the Rasch model while item-fit residual provides information on the data-model fit for each individual item (Sadeghi, 2006).
4. Statistical methodsThe data was analysed using the RUMM2020 (Andrich, Lyne, Sheridan & Luo, 2005) to estimate the person measure and the item locations along the latent trait scale. The summary statistics, separation index and other Rasch analysis results will be reported for the CAPP and its eight main categories.
Dimensionality and model-data fit: In the present study, total item chi-square probability and item-fit residual are used to examine the fit between the data and the Rasch unidimensional model. If items are known to satisfy the model, then a valid, reliable and precise item calibration and student measurement is possible.
Item location and person measures: Rasch developed a measurement model that has, as one of its distinctive features, enabled students and items to be located on a single scale. This scale represents the trait, and the calibrated items, which are located along the scale are manifestations of the underlying trait. The underlying trait is defined by both the nature of the items and their order on the scale. Item locations define the scale operationally, and after attempting any set of items, a person can subsequently be located on a single given scale. In other words, once a pool of items has been developed that fit the Rasch model, then it is possible to construct tests from any of the calibrated items and compare the resulting measures. Just as in the physical sciences, the construction of the scale and the measurement of the students are two separate but interrelated processes that entail different considerations.
Removal of misfitting items: In this study, items with a fit residual value smaller than -2.5 or larger than 2.5 and a chi-square probability less than 0.05 are considered as misfitting items (Tognolini, 1998).
Results
1. Reliability of the CAPP and its eight sub-scalesThe Rasch computer program used in this study (RUMM2020) provides two reliability indices referred to as Person Separation Index and Cronbach Alpha. These two indices are very close
PsychProfiler Supplement.indd 4 19/11/09 12:35:38 PM

PsychProfiler Research Supplement 5
COPYRIGHT © 2009 AUSTRALIAN COUNCIL FOR EDUCATIONAL RESEARCH
when there is no missing data. In the present study, separation index is reported as the data is incomplete. This index has an advantage over the traditional Cronbach reliability. A large separation index means that there is a high probability that persons with high estimated mental distress measures actually do have higher measures on the GMD scale than persons who have low measures on the GMD scale (Linacre, 2005).
The reliability indices for the CAPP and its eight subscales are summarised in Table 1.
Table 1: Reliability Index for the CAPP by Sub-scale Main Sub-scales Reliability Index
Anxiety disorders 0.746
Attention deficit & disruptive behaviour disorders 0.909
Communication disorders 0.828
Depressive disorders 0.689
Eating disorders 0.950
Learning disorders 0.839
Pervasive developmental disorders 0.759
Tic disorders 0.707
CAPP (General Mental Distress) 0.936
As Table 1 shows, eating disorders and depressive disorders scales have the highest and the lowest reliability respectively. In general, the reliability of the CAPP as a General Mental Distress Index is 0.936, which is classified as very strong reliability.
2 Construct validity of the CAPP and its eight sub-scalesThe CAPP was analysed in two stages. The first analysis was to subject the eight main categories to the Rasch Analysis. The second analysis was performed on all items of the CAPP to investigate the validity using a total score for this scale as a measure of general mental distress.
(a) Analysis of the anxiety disorders sub-scaleAnxiety disorders: A summary of item locations and item-fit statistics for the anxiety disorder sub-scale is shown in Table 2.
Table 2: A Summary of Item Fit Statistics for the Anxiety DisordersItem No Location SE Fit Residual Chi Square Probability
1 -1.091 0.332 -0.175 0.175 0.916
2 -0.557 0.351 1.525 1.671 0.434
7 -0.501 0.354 0.248 0.302 0.860
14 0.185 0.401 -0.503 2.016 0.365
17 1.783 0.647 -0.517 0.421 0.810
21 -1.070 0.333 -1.568 4.102 0.129
22 -0.308 0.364 -1.091 1.930 0.381
23 -0.791 0.345 0.648 1.162 0.559
27 0.351 0.417 -0.076 1.052 0.591
33 0.243 0.406 0.251 2.898 0.235
40 -0.094 0.378 -0.833 2.995 0.224
(Continued on next page)
PsychProfiler Supplement.indd 5 19/11/09 12:35:38 PM

6 PsychProfiler Research Supplement
COPYRIGHT © 2009 AUSTRALIAN COUNCIL FOR EDUCATIONAL RESEARCH
Item No Location SE Fit Residual Chi Square Probability
48 1.220 0.533 -0.116 0.312 0.856
51 0.498 0.432 0.652 0.653 0.721
60 0.287 0.413 -0.065 0.448 0.799
61 -0.157 0.374 -1.235 1.301 0.522
66 0.714 0.458 0.638 0.938 0.626
72 0.402 0.422 -0.359 1.092 0.579
87 -0.124 0.376 -0.986 3.242 0.198
102 0.198 0.402 -1.091 1.320 0.517
103 -0.901 0.338 -0.683 3.798 0.150
109 -0.910 0.337 1.295 2.284 0.319
110 0.230 0.405 -1.092 1.330 0.514
111 0.395 0.428 -0.037 1.014 0.602
As can be seen from Table 2, all items fit the Rasch measurement model and there are no misfitting items, indicating that the model’s requirements are satisfied. Item locations for anxiety disorders scale range from -1.091 to 1.783. Question 1 (I have difficulty controlling worries) was the most frequently experienced by respondents, whereas Question 17 (I complain about feeling sick when I am expected to be away from my home or parent/s) was less frequently experienced.
The distribution of persons (at the top) and items (at the bottom) plotted on the same scale for the anxiety disorders sub-scale is shown in Figure 1.
Figure 1: Person and Item Distribution on the same Scale for the Anxiety Disorders
As mentioned earlier, items with a fit residual value smaller than -2.5 or larger than 2.5 and a chi-square probability less than 0.05 are considered misfitting items. As can be seen in Figure 1, the more frequently experienced items and individuals with higher levels of anxiety disorders are closer to the top of the scale. Figure 2 also shows that the person measures on the anxiety sub-scale range from -3.782 to 1.606 logits, indicating that 71% of person measures fall below the lower limit of item locations. This suggests that this scale does not target individuals with low
PsychProfiler Supplement.indd 6 19/11/09 12:35:38 PM

PsychProfiler Research Supplement 7
COPYRIGHT © 2009 AUSTRALIAN COUNCIL FOR EDUCATIONAL RESEARCH
and acceptable levels of anxiety, which reflects the fact that this scale is developed to identify high and possibly dysfunctional levels of anxiety disorders.
(b) Analysis of attention-deficit and disruptive behaviour disorders sub-scaleA summary of item locations and item-fit statistics for the attention-deficit and disruptive behaviour sub-scale is shown in Table 3.
Table 3: A Summary of Item Fit Statistics for the Attention-deficit & Disruptive Behaviour Disorders
Item No Location SE Fit Residual Chi Square Probability
3 -1.505 0.325 0.324 0.714 0.700
4 1.466 0.639 -0.756 0.963 0.618
6 -1.365 0.328 3.011 6.095 0.047
12 0.515 0.473 -0.248 0.671 0.715
13 -0.371 0.378 -0.811 1.251 0.535
16 1.647 0.679 0.182 1.574 0.455
25 -0.159 0.396 1.352 2.753 0.252
29 -1.264 0.330 -1.406 3.320 0.190
37 -0.936 0.343 -1.098 0.544 0.762
39 -1.824 0.322 0.603 2.140 0.343
41 1.510 0.683 -0.479 0.791 0.673
43 -1.047 0.338 -0.996 1.412 0.494
47 0.019 0.413 -1.336 2.642 0.267
50 -0.272 0.386 -0.778 1.078 0.583
54 -1.587 0.324 -0.917 3.315 0.191
68 -1.642 0.327 0.901 8.802 0.012
69 1.313 0.607 -0.275 0.667 0.716
70 0.189 0.432 -0.624 1.544 0.462
71 -1.130 0.335 -1.312 1.924 0.382
73 3.720 1.522 -0.671 1.176 0.555
75 -0.783 0.350 -1.918 3.256 0.196
76 1.208 0.586 -0.812 1.602 0.449
77 -0.497 0.368 -0.099 5.108 0.078
80 0.110 0.423 -0.379 0.746 0.689
82 3.035 1.138 -0.530 0.305 0.858
83 3.720 1.522 -0.671 1.176 0.555
85 -1.403 0.327 1.138 5.170 0.075
88 1.484 0.643 -0.620 0.972 0.615
90 -2.207 0.324 0.671 2.065 0.356
92 -0.120 0.410 -0.569 1.131 0.568
93 -0.971 0.345 0.489 0.247 0.884
95 0.020 0.413 0.009 0.818 0.664
97 -0.934 0.343 -0.172 0.856 0.652
101 0.861 0.525 -0.857 0.385 0.825
104 -0.800 0.350 -0.060 0.564 0.754
PsychProfiler Supplement.indd 7 19/11/09 12:35:39 PM

8 PsychProfiler Research Supplement
COPYRIGHT © 2009 AUSTRALIAN COUNCIL FOR EDUCATIONAL RESEARCH
As Table 3 demonstrates, all items fit the Rasch measurement model except item 6 (I am forgetful). For this item, item-fit residual and chi-square probability are 3.011 and 0.047, respectively. This item did not discriminate individuals with low and high levels of attention-deficit and disruptive behaviour disorders. Item locations for the attention-deficit and disruptive behaviour sub-scale range from -2.207 to 3.720. Question 90 (I am easily distracted by other things going on around me) was the most common response, whereas Question 83 (I use a weapon when I fight e.g. a bat or brick) was the least frequently experienced by people.
The distribution of persons and items plotted on the same scale for the attention-deficit and disruptive behaviour disorders sub-scale is illustrated in Figure 2.
Figure 2: Person and Item Distribution on the same Scale for the Attention-Deficit and Disruptive Behaviour Disorders
This figure explains that the person measures on the attention-deficit and disruptive behaviour disorders sub-scale range from -4.849 to 1.630 logits indicating that 43% of person measures fall below the lower limit of item locations. This confirms that this scale does not measure the individuals with lower levels of anxiety, confirming that this scale was designed to identify high levels of attention-deficit and disruptive behaviour disorders.
(c) Analysis of the communication disorders sub-scaleA summary of item locations and item-fit statistics for the communication disorders sub-scale is shown in Table 4.
Table 4: A Summary of Item Fit Statistics for the Communication Disorders Item No Location SE Fit Residual Chi Square Probability
10 -0.220 0.514 -0.133 1.129 0.569
45 0.636 0.595 0.967 2.196 0.334
64 1.571 0.751 -0.828 1.136 0.567
74 0.313 0.561 -0.816 5.285 0.071
105 -1.343 0.506 0.279 0.706 0.703
106 -0.957 0.498 1.615 1.871 0.392
PsychProfiler Supplement.indd 8 19/11/09 12:35:39 PM

PsychProfiler Research Supplement 9
COPYRIGHT © 2009 AUSTRALIAN COUNCIL FOR EDUCATIONAL RESEARCH
As shown in Table 4, all items fit the Rasch measurement model and there are no misfitting items. Item locations for the communication disorders sub-scale range from -1.343 to 1.571, stating that the items cover a narrow range. Question 105 (I have difficulty expressing ideas) was the most common response, whereas Question 64 (I have difficulty forming speech sounds correctly) was the least common.
The distribution of persons and items plotted on the same scale for the communication disorders sub-scale is shown in Figure 3.
Figure 3: Person and Item Distribution on the same Scale for the Communication Disorders
As can be seen in Figure 3, the person measures on communication disorders sub-scale range from -3.009 to 3.54 logits indicating that the range of person measures extends beyond both limits of item locations. That is, 75% of person measures fall below the lower limit and 4% above the upper limit. This confirms that this scale does not screen for individuals with low levels of communication disorders, given that this scale was designed to capture those with clinical levels of communication disorders. This also suggests that more items are required to measure the communication disorders among those individuals with high and possibly dysfunctional levels of communication disorders.
(d) Analysis of the depressive disorders sub-scaleA summary of item locations and item-fit statistics for the depressive disorders subscale is shown in Table 5.
Table 5: A Summary of Item Fit Statistics for the Depressive Disorders Item No Location SE Fit Residual Chi Square Probability
18 0.152 0.394 0.025 0.742 0.690
26 -0.126 0.385 0.951 2.289 0.318
27 0.792 0.447 -0.607 2.042 0.360
34 -0.581 0.365 1.427 0.866 0.648
35 -0.913 0.362 -0.461 3.753 0.153
51 0.875 0.456 0.258 0.386 0.824
84 -0.200 0.382 0.495 1.494 0.474
PsychProfiler Supplement.indd 9 19/11/09 12:35:39 PM

10 PsychProfiler Research Supplement
COPYRIGHT © 2009 AUSTRALIAN COUNCIL FOR EDUCATIONAL RESEARCH
As can be seen from Table 5, all items fit the Rasch measurement model indicating that all the model’s requirements are met. Item locations for the depressive disorders sub-scale range from -0.913 to 0.875 indicating that the items cover a narrow range. Question 35 (I feel bad that I cannot do things as well as other children my own age) was the most common symptom, whereas Question 51 (People say that I am moody and irritable) was the least common one.
The distribution of persons and items plotted on the same scale for the depressive disorders sub-scale is shown in Figure 4.
Figure 4: Person and Item Distribution on the same scale for the Depressive Disorders
Figure 4 shows that the person measures on communication disorders sub-scale range from -3.189 to 1.965 logits indicating that the range of person measures extends beyond both limits of item locations. That is, 65% of person measures fall below the lower limit and 4% above the upper limit. This suggests that this scale does not target individuals with lower level of depressive disorders. This also implies that more items are required to measure the depressive disorders among those individuals with high and dysfunctional levels of depression.
(e) Analysis of the eating disorders sub-scaleA summary of item locations and item-fit statistics for the eating disorders sub-scale is shown in Table 6.
Table 6: A Summary of Item Fit Statistics for the Eating Disorders ScaleItem No Location SE Fit Residual Chi Square Probability
8 -1.287 0.467 0.073 0.839 0.657
20 2.286 1.068 -0.746 0.535 0.765
28 -1.131 0.470 1.719 8.100 0.017
42 -0.512 0.507 -0.521 2.188 0.335
63 -0.136 0.547 0.453 0.187 0.911
79 1.726 0.907 -1.263 2.364 0.307
98 -0.945 0.478 -0.204 1.621 0.445
PsychProfiler Supplement.indd 10 19/11/09 12:35:39 PM

PsychProfiler Research Supplement 11
COPYRIGHT © 2009 AUSTRALIAN COUNCIL FOR EDUCATIONAL RESEARCH
As can be seen from Table 6, all items fit the Rasch measurement model and there are no misfitting items. Item locations for the depressive disorders sub-scale range from -1.287 to .2.286, indicating that the items cover a relatively narrow range. Question 8 (I am concerned about my weight or body shape) was the most common response, whereas Question 20 (I use strict diets or hard exercise to control my weight) was the least common one.
The distribution of persons and items plotted on the same scale for the eating disorders sub-scale is shown in Figure 5.
Figure 5: Person and Item Distribution on the same scale for the Eating Disorders
Figure 5 shows that the person measures on the eating disorders subscale range from -3.296 to 3.722 logits, indicating that the range of person measures extends beyond both limits of item locations. That is, 73% of person measures fall below the lower limit and 1% above the upper limit. This implies that more infrequent symptoms experienced by those with a real problem are needed to measure the presence of eating disorders among those individuals.
(f) Analysis of the learning disorders sub-scaleA summary of item locations and Item-fit statistics for the learning disorders sub-scale is shown in Table 7.
Table 7: A Summary of Item Fit Statistics for the Learning Disorders Item No Location SE Fit Residual Chi Square Probability
11 1.676 0.482 -0.045 1.612 0.447
24 0.202 0.380 -0.062 0.260 0.878
31 -0.587 0.360 0.353 2.169 0.338
44 -0.311 0.364 0.067 0.940 0.625
53 -0.159 0.367 -0.672 1.055 0.590
55 -1.226 0.364 -0.556 2.649 0.266
62 0.689 0.401 -1.564 3.947 0.139
81 0.523 0.392 0.330 0.208 0.901
(Continued on next page)
PsychProfiler Supplement.indd 11 19/11/09 12:35:39 PM

12 PsychProfiler Research Supplement
COPYRIGHT © 2009 AUSTRALIAN COUNCIL FOR EDUCATIONAL RESEARCH
89 -0.904 0.360 0.939 1.683 0.431
96 0.423 0.391 -1.194 1.357 0.507
99 -0.326 0.373 0.052 0.893 0.640
As shown in Table 7, there are no misfitting items in this sub-scale. Item locations for the learning disorders scale range from -1.226 to 2.300, indicating that the items cover a relatively narrow range. Question 55 (I have trouble spelling correctly) was the most frequent symptom, whereas Question 11 (I have trouble recognising or reading numbers (e.g. 1, 16, 88) or maths signs (e.g. +, -, x, ÷)) was the least frequently experienced.
The distribution of persons and items plotted on the same scale for the learning disorders sub-scale is shown in Figure 6.
Figure 6: Person and Item Distribution on the same Scale for the Learning Disorders
Figure 6 demonstrates that the person measures on the learning disorders scale range from -3.118 to 2.300 logits, indicating that the range of person measures extends beyond both limits of item locations. That is, 36% of person measures fall below the lower limit and 1% above the upper limit. This suggests that this scale does not pick up individuals with minor learning impediments. This also implies that more uncommon symptoms of learning disorders are required to measure the presence of learning disorders among affected individuals.
(g) Analysis of the pervasive developmental disorders sub-scaleA summary of item locations and item-fit statistics for the pervasive developmental disorder sub-scale is shown in Table 8.
Table 8: Summary of Item Fit Statistics for Pervasive Developmental Disorders Item No Location SE Fit Residual Chi Square Probability
5 -1.131 0.348 1.483 2.046 0.359
9 -0.826 0.353 -0.727 3.349 0.187
32 0.020 0.408 -1.180 7.634 0.022
(Continued on next page)
PsychProfiler Supplement.indd 12 19/11/09 12:35:39 PM

PsychProfiler Research Supplement 13
COPYRIGHT © 2009 AUSTRALIAN COUNCIL FOR EDUCATIONAL RESEARCH
38 -0.183 0.382 1.147 1.536 0.464
46 0.128 0.401 -0.741 1.531 0.465
58 0.211 0.408 1.127 3.116 0.211
67 1.332 0.560 -1.038 2.232 0.328
78 0.626 0.451 0.108 0.915 0.633
91 0.449 0.431 -0.118 0.663 0.718
94 0.413 0.427 0.075 3.812 0.149
107 0.414 0.427 -0.022 3.813 0.149
108 -1.452 0.348 -0.659 2.771 0.250
As can be seen from Table 8, all items fit the Rasch measurement model as item fit residuals fall between -2.5 and 2.5 with no chi square probability less than 0.05. Item locations for this sub-scale range from -1.452 to 1.332. Question 108 (There are some things that I just cannot get out of my mind) was the most common symptom, whereas Question 67 (I am unaware of, or take no interest in, other people’s feelings) was the least common one.
The distribution of persons and items plotted on the same scale for the pervasive developmental disorders sub-scale is shown in Figure 7.
Figure 7: Person and Item Distribution on the same Scale for the Pervasive Developmental Disorders
Figure 7 illustrates that the person measures on pervasive developmental disorders sub-scale range from -3.191 to 0.739 logits, indicating that 69% of person measures fall below the lower limit of item locations. This confirms that this scale does not measure individuals with minor symptoms of pervasive developmental disorders.
(h) Analysis of the tic disorders sub-scaleA summary of item locations and item-fit statistics for the tic disorders sub-scale is shown in Table 9.
PsychProfiler Supplement.indd 13 19/11/09 12:35:39 PM

14 PsychProfiler Research Supplement
COPYRIGHT © 2009 AUSTRALIAN COUNCIL FOR EDUCATIONAL RESEARCH
Table 9: A Summary of Item Fit Statistics for the Tic Disorders Item No Location SE Fit Residual Chi Square Probability
52 0.458 0.776 1.830 0.305 0.000
56 -0.458 0.776 1.830 0.305 0.000
As can be seen from Table 9, there are only two items in this sub-scale and both have reasonable residual values but a high chi square probability. The overall fit for this scale is very poor (chi square probability <.000). Item locations range from -0.458 to 0.458, indicating that this sub-scale has a very narrow range. Question 56 (I have strange habits that I cannot control (e.g. eye blinking, nose twitching, shoulder shrugging or head jerking).) was the most common symptom, whereas Question 52 (I make strange sounds that I cannot control) was the least common one.
The distribution of persons and items plotted on the same scale for the tic disorders sub-scale is shown in Figure 8.
Figure 8: Person and Item Distribution on the same scale for the Tic Disorders
Figure 8 shows that the person measures on tic disorders scale range from -3.191 to 0.739 logits, indicating that the range of person measures extends beyond both limits of item locations. That is, 75% of person measures fall below the lower limit and 10% above the upper limit. This suggests that there are not enough items to measure the individuals with low levels of tic disorders. This also implies that more items are required to screen tic disorders among those individuals with different levels of tic disorders.
(i) Analysis of all items togetherThe CAPP scale: Summary statistics and item-fit statistics for the CAPP scale is shown in Table 10.
PsychProfiler Supplement.indd 14 19/11/09 12:35:39 PM

PsychProfiler Research Supplement 15
COPYRIGHT © 2009 AUSTRALIAN COUNCIL FOR EDUCATIONAL RESEARCH
Table 10: A Summary of Item Fit Statistics for the CAPP ScaleItem No Location SE Fit Residual Chi Square Probability
1 -1.124 0.319 -0.157 1.204 0.548
2 -0.652 0.339 1.476 4.683 0.096
3 -1.187 0.318 1.028 1.755 0.416
4 1.603 0.637 -0.671 1.473 0.479
5 -1.051 0.322 1.725 4.833 0.089
6 -1.185 0.318 2.124 2.167 0.338
7 -0.569 0.343 0.861 2.121 0.346
8 -0.200 0.368 0.322 2.057 0.358
9 -0.741 0.334 -1.225 2.472 0.291
10 0.233 0.414 0.334 0.162 0.922
11 0.909 0.498 -0.664 2.700 0.259
12 0.627 0.456 0.025 6.135 0.047
13 -0.164 0.371 -0.565 0.915 0.633
14 0.123 0.397 -0.538 1.527 0.466
16 1.854 0.703 0.298 0.925 0.630
17 1.599 0.636 -0.566 1.466 0.480
18 -0.176 0.370 -0.895 1.512 0.469
20 2.507 0.926 -0.936 1.803 0.406
21 -1.046 0.322 0.448 0.060 0.970
22 -0.328 0.359 -0.417 1.251 0.535
23 -0.828 0.331 -0.963 0.574 0.751
24 -0.512 0.350 0.731 7.970 0.019
25 0.072 0.392 0.671 2.121 0.346
26 -0.485 0.351 1.216 4.006 0.135
27 0.296 0.415 -0.370 2.976 0.226
28 -0.206 0.368 0.629 4.475 0.107
29 -1.032 0.322 -0.802 0.046 0.977
31 -1.205 0.317 0.589 3.973 0.137
32 0.036 0.404 -0.795 2.643 0.267
33 0.194 0.404 1.453 9.076 0.011
34 -0.932 0.326 -1.610 3.877 0.144
35 -1.187 0.318 -1.873 1.751 0.417
37 -0.696 0.337 -0.169 0.245 0.885
38 -0.226 0.369 0.280 1.387 0.500
39 -1.630 0.310 0.434 2.952 0.229
40 -0.183 0.370 -0.066 0.448 0.799
41 1.744 0.708 -0.184 0.692 0.708
42 0.494 0.438 -0.583 0.809 0.667
43 -0.797 0.332 0.077 0.033 0.984
44 -1.060 0.321 -0.788 0.543 0.762
45 0.708 0.483 0.295 0.894 0.640
46 0.150 0.400 -1.155 6.854 0.032
47 0.158 0.400 -1.177 3.383 0.184
(Continued on next page)
PsychProfiler Supplement.indd 15 19/11/09 12:35:40 PM

16 PsychProfiler Research Supplement
COPYRIGHT © 2009 AUSTRALIAN COUNCIL FOR EDUCATIONAL RESEARCH
Item No Location SE Fit Residual Chi Square Probability
48 1.065 0.524 1.244 1.924 0.382
50 -0.065 0.379 0.119 0.063 0.969
51 0.468 0.435 -0.136 2.972 0.226
52 0.451 0.433 -0.579 0.648 0.723
53 -0.889 0.328 -0.878 2.929 0.231
54 -1.284 0.315 -0.038 0.495 0.781
55 -1.789 0.310 -1.360 3.945 0.139
56 -0.102 0.379 0.558 1.989 0.370
58 0.202 0.405 1.889 8.747 0.013
60 0.197 0.411 0.639 3.438 0.179
61 -0.202 0.368 -0.807 3.082 0.214
62 -0.282 0.362 -0.262 3.952 0.139
63 0.602 0.452 0.331 1.129 0.569
64 1.199 0.549 -0.597 2.009 0.366
66 0.640 0.458 0.819 1.134 0.567
67 1.312 0.572 -0.777 0.400 0.819
68 -1.345 0.317 1.337 3.949 0.139
69 1.419 0.595 -0.129 0.362 0.834
70 0.325 0.418 -0.186 1.074 0.584
71 -0.910 0.327 -0.556 1.176 0.555
72 0.285 0.414 -0.267 1.045 0.593
73 3.342 1.354 -0.641 1.026 0.599
74 0.465 0.437 -0.371 1.494 0.474
75 -0.597 0.342 -2.198 4.053 0.132
76 1.278 0.565 -0.382 0.367 0.832
77 -0.316 0.360 0.339 1.251 0.535
78 0.611 0.454 0.336 1.129 0.569
79 1.878 0.710 -1.091 2.132 0.344
80 0.278 0.413 0.146 1.042 0.594
81 -0.287 0.362 -0.157 3.940 0.139
82 2.943 1.125 -0.506 0.504 0.777
83 3.342 1.354 -0.641 1.026 0.599
84 -0.462 0.354 0.145 0.514 0.773
85 -1.143 0.319 1.569 4.837 0.089
87 -0.147 0.373 -1.561 2.982 0.225
88 1.718 0.666 -0.997 1.691 0.429
89 -1.468 0.312 1.858 2.138 0.343
90 -1.941 0.311 0.812 3.903 0.142
91 0.461 0.437 -0.452 1.682 0.431
92 0.031 0.399 -0.529 1.043 0.594
93 -0.781 0.336 0.494 4.517 0.105
94 0.430 0.430 -0.230 1.517 0.468
95 0.199 0.405 1.027 1.002 0.606
96 -0.490 0.351 -1.349 1.643 0.440
(Continued on next page)
PsychProfiler Supplement.indd 16 19/11/09 12:35:40 PM

PsychProfiler Research Supplement 17
COPYRIGHT © 2009 AUSTRALIAN COUNCIL FOR EDUCATIONAL RESEARCH
Item No Location SE Fit Residual Chi Square Probability
97 -0.677 0.338 -0.695 0.849 0.654
98 0.100 0.395 -0.336 0.186 0.911
99 -1.131 0.323 -1.035 1.509 0.470
101 1.003 0.514 -0.860 2.918 0.232
102 0.110 0.396 -0.395 0.183 0.913
103 -0.949 0.325 -0.936 0.726 0.696
104 -0.583 0.343 0.159 2.193 0.334
105 -0.587 0.342 -0.435 3.715 0.156
106 -0.421 0.353 -0.624 1.854 0.396
107 0.386 0.425 0.882 1.980 0.372
108 -1.297 0.315 -1.122 1.701 0.427
109 -0.978 0.324 -0.225 1.057 0.589
110 0.158 0.400 -1.633 3.383 0.184
111 0.321 0.426 0.549 5.287 0.071
As shown in Table 10, all items fit the Rasch measurement model and there are no misfitting items (i.e., a fit residual value smaller than -2.5 or larger than 2.5 and a chi-square probability less than 0.05). This means that all the requirements of the model, including unidimensionality, are met. Item locations for the CAPP scale range from -1.941 to 3.342. Question 90 (I am easily distracted by other things going on around me) was the most frequently experienced, whereas Question 83 (I start physical fights) was the least frequently experienced symptom by participants.
The distribution of persons and items plotted on the same CAPP scale shown in Figure 9.
Figure 9: Person and Item Distribution on the same scale for the CAPP
As can be seen in Figure 9, the least common symptoms of GMD and individuals with higher risk for general mental distress are closer to the top of the CAPP scale (as shown by the horizontal line). Figure 9 also shows that the person measures on CAPP scale range from -5.529 to 0.900
PsychProfiler Supplement.indd 17 19/11/09 12:35:40 PM

18 PsychProfiler Research Supplement
COPYRIGHT © 2009 AUSTRALIAN COUNCIL FOR EDUCATIONAL RESEARCH
logits, indicating that 42% of person measures fall below the lower limit of item locations. This confirms that this scale does not screen for individuals with low levels of mental distress, confirming that this instrument was designed to identify individuals with clinically high levels of mental distress.
Discussion
This study has applied the Rasch measurement model successfully to investigate the psychometric properties of the CAPP and its eight main categories. The results of this study are consistent with those found by Langsford et al. and provide support for the reliability and construct validity of the CAPP as an indicator of General Mental Distress. This study also confirmed that seven main categories can be treated as seven unidimensional sub-scales embedded within the CAPP general structure. As the CAPP data meet the Rasch model’s requirements, this instrument can be viewed as a unidimensional Rasch scale, and the raw score can be transformed to equidistant interval measures. Tic disorder was the only sub-scale that did not fit the Rasch model, probably due to there being fewer items.
Overall, the item fit statistics revealed that only one item in the attention-deficit and disruptive disorders subscale (Question 6: I am forgetful) did not fit the Rasch model due to low discrimination. Removal of this item improved the overall fit to the Rasch model slightly but did not have any impact on the reliability of the attention-deficit and disruptive disorders sub-scale.
The results of the Rasch item analysis revealed that overall, the targeting of the CAPP in identifying psychological disorders is strong. However, sub-scales such as communication, depressive, eating and learning disorders will require more items to better screen for participants with high levels of mental distress. The results also suggest that the CAPP and its sub-scales have not screened for low levels of mental distress. This may be due to the fact that the research sample was largely made up of children referred to a psychologist for behavioural or emotional problems.
In conclusion, this study has applied the Rasch measurement model to investigate the psychometric properties of the CAPP self-report form. Overall, the Rasch analysis has found the CAPP to be psychometrically sound with adequate internal consistency, reliability and construct validity. Further research needs to be conducted to investigate the screening efficacy and the predictive validity of the CAPP and its sub-scales.
PsychProfiler Supplement.indd 18 19/11/09 12:35:40 PM

PsychProfiler Research Supplement 19
COPYRIGHT © 2009 AUSTRALIAN COUNCIL FOR EDUCATIONAL RESEARCH
References
Andrich, D. (1978). A rating formulation for ordered response categories. Psychometrika, 43, 357–374.
Andrich, D. (1988). Rasch models for measurement. Newbury Park, CA: Sage Publications.
Andrich, D., Lyne, A., Sheridan, B., & Luo, G. (2005). RUMM 2020: A windows interactive program for analysing item response data according to Rasch Unidimensional Measurement Model. Perth, Western Australia: RUMM Laboratory Pty Ltd.
American Psychiatric Association (2000). Diagnostic and statistical manual of mental disorders, 4th edition, Text revision. Washington DC: American Psychiatric Association.
Langsford, S., Houghton, S., & Douglas, G. (2007). PsychProfiler Manual. Melbourne: ACER Press.
Linacre, M. J. (2005). A user’s guide to Winsteps/Ministeps Rasch Model programs. MESA Press: Chicago, IL.
Masters, G. N. (1982). A Rasch model for partial credit scoring. Psychometrika, 47, 149–174.
Rasch, G. (1960). Probabilistic model for some intelligence and attainment tests. Copenhagen: Danish Institute for Educational Research, 1960. (Expanded edition, 1980. Chicago: University of Chicago Press).
Sadeghi, R. (2006). An Investigation of the consequences for students of using different procedures to equate tests as fit to the Rasch Model degenerates. Unpublished PhD Thesis, University of New South Wales.
Tognolini, J. (1998). Rasch model, advantages and limitations. Unpublished paper. Sydney, University of New South Wales.
Wright, B. D., & Masters, G. N. (1982). Rating scale analysis: Rasch measurement. Chicago: MESA Press.
Wright, B. D., & Stone, M. H. (1979). Best test design: Rasch measurement. Chicago: MESA Press.
PsychProfiler Supplement.indd 19 19/11/09 12:35:40 PM