Embed Size (px)
Citation preview
Accurately mapping unburned areas using time-sequenced airborne imaging
Robert Kremens1, Anthony Bova2, Matthew Dickenson2, Jason Faulring1
1Rochester Institute of Technology2USDA Forest Service Northeast Research Station
ABSTRACT We have used a multi-band infrared camera (WASP) to generate unburned fuel maps for prescribed fires. We over fly the fire for the entire duration of the event, with a sampling time of 5 to 10 minutes. The infrared flux calculated from many frames is integrated, the areas showing insignificant flux above background being marked as unburned. We present examples from a prescribed fire in Ohio and show the correlation between airborne data and ground observations, and also present data for ground based in-fire IR flux/weather stations. Plans for future experiments will be discussed.
Introduction• Determining the scale and patterns of unburned and heat-
affected areas is laborious • Field methods may be inaccurate – can’t sample entire
fireground• Single overhead images are snapshots of an instant in the time
history of the fire and cannot be used to accurately determine the spatial extent of the entire fire
• Post-fire overhead visible or near-infrared images require sophisticated processing to determine the spatial extent of the fire
• Time-series infrared images captured over the complete course of the fire can determine the total heat released
• We can construct a map, at minimum, of burned (threshold heat) vs. unburned (no heat) areas
Method1. Use a multi-band airborne IR camera (WASP1) to generate a
time-resolved thermal image/map2. Each frame captures the instantaneous flux emitted from the
fire at ~ 5 minute time intervals3. Flux from each point on the image (geographic location) is
integrated to produce an (uncalibrated) flux measurement 4. Comparison is made with ground-based IR flux/ weather
stations2,3 to calibrate the image and remove the effects of atmospheric and smoke/haze absorption
5. Areas of the fire ground above a threshold flux value are marked as ‘burned’, the remaining areas marked as ‘unburned’
6. Comparison is made with extensive field sampling of fuel consumption and visual post-burn condition
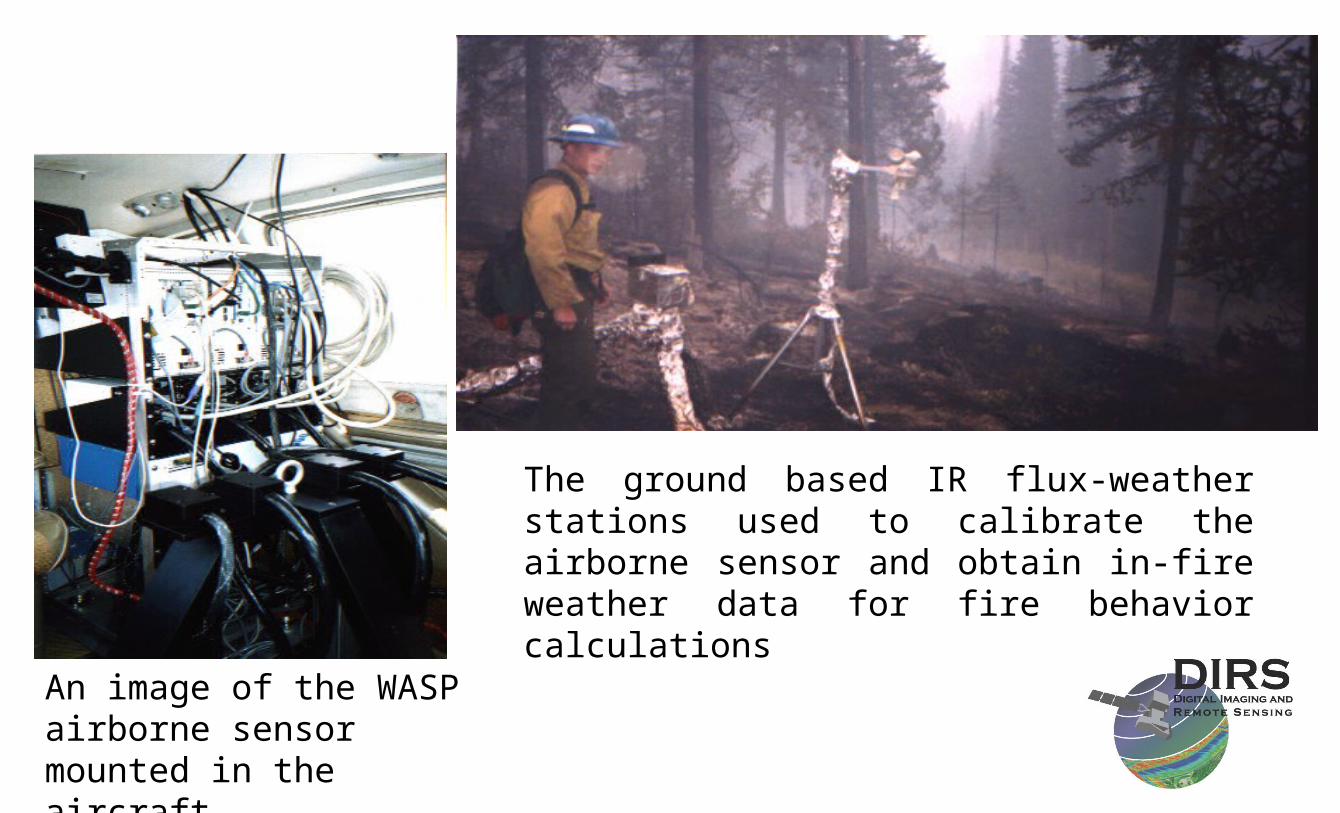
An image of the WASP airborne sensor mounted in the aircraft
The ground based IR flux-weather stations used to calibrate the airborne sensor and obtain in-fire weather data for fire behavior calculations
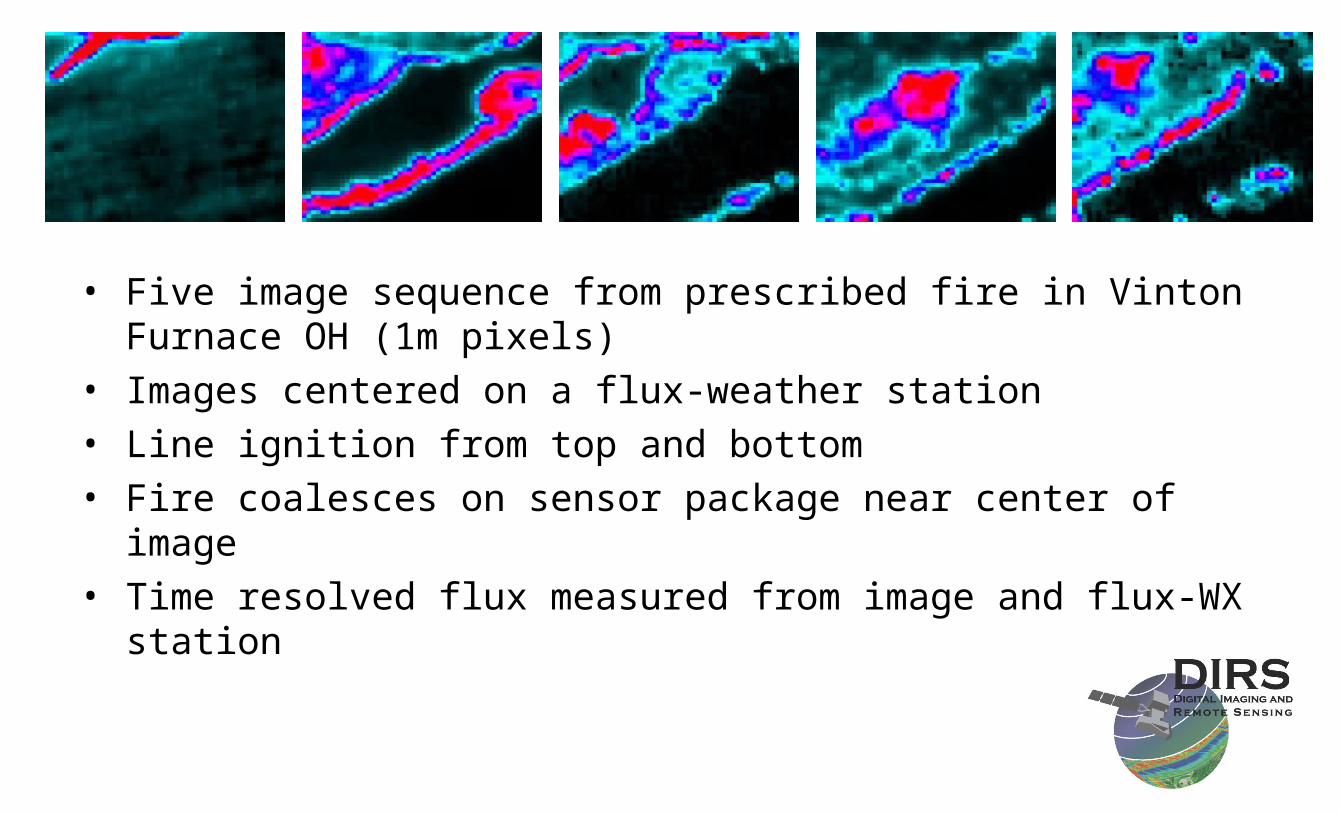
• Five image sequence from prescribed fire in Vinton Furnace OH (1m pixels)
• Images centered on a flux-weather station• Line ignition from top and bottom• Fire coalesces on sensor package near center of image• Time resolved flux measured from image and flux-WX station
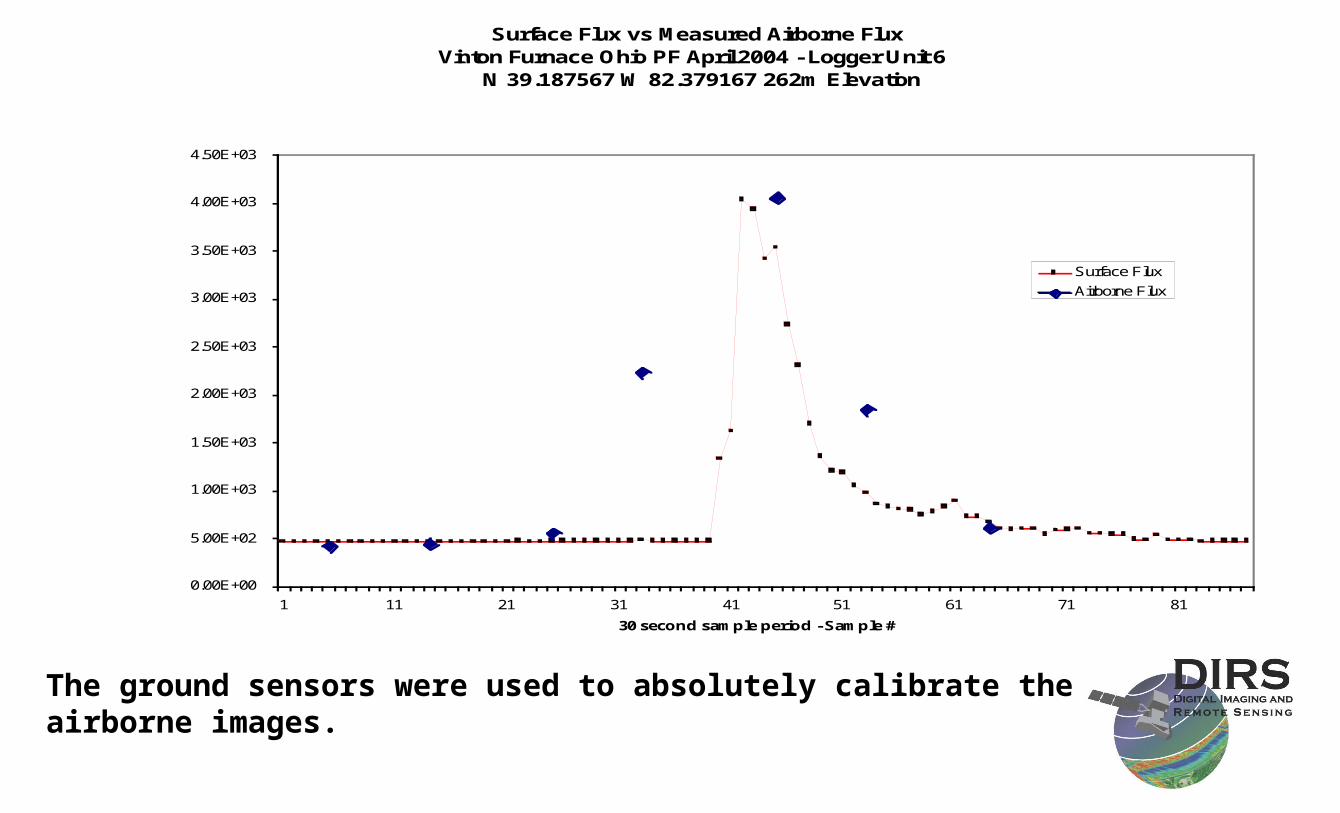
Surface Flux vs Measured Airborne FluxVinton Furnace Ohio PF April 2004 - Logger Unit 6
N 39.187567 W 82.379167 262m Elevation
0.00E+00
5.00E+02
1.00E+03
1.50E+03
2.00E+03
2.50E+03
3.00E+03
3.50E+03
4.00E+03
4.50E+03
1 11 21 31 41 51 61 71 81
30 second sample period - Sample #
Surface Flux, W/cm2
Surface Flux
Airborne Flux
The ground sensors were used to absolutely calibrate the airborne images.
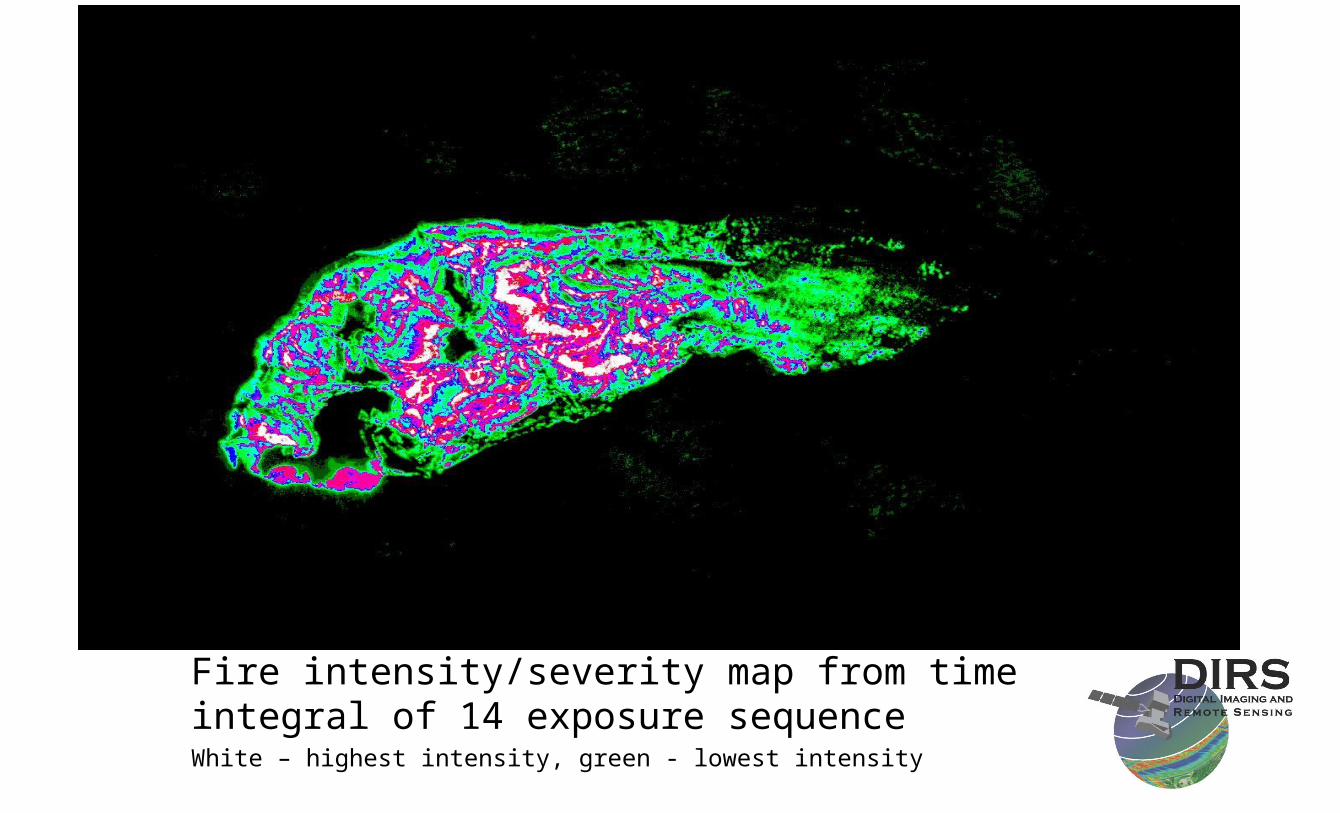
Fire intensity/severity map from time integral of 14 exposure sequenceWhite – highest intensity, green - lowest intensity
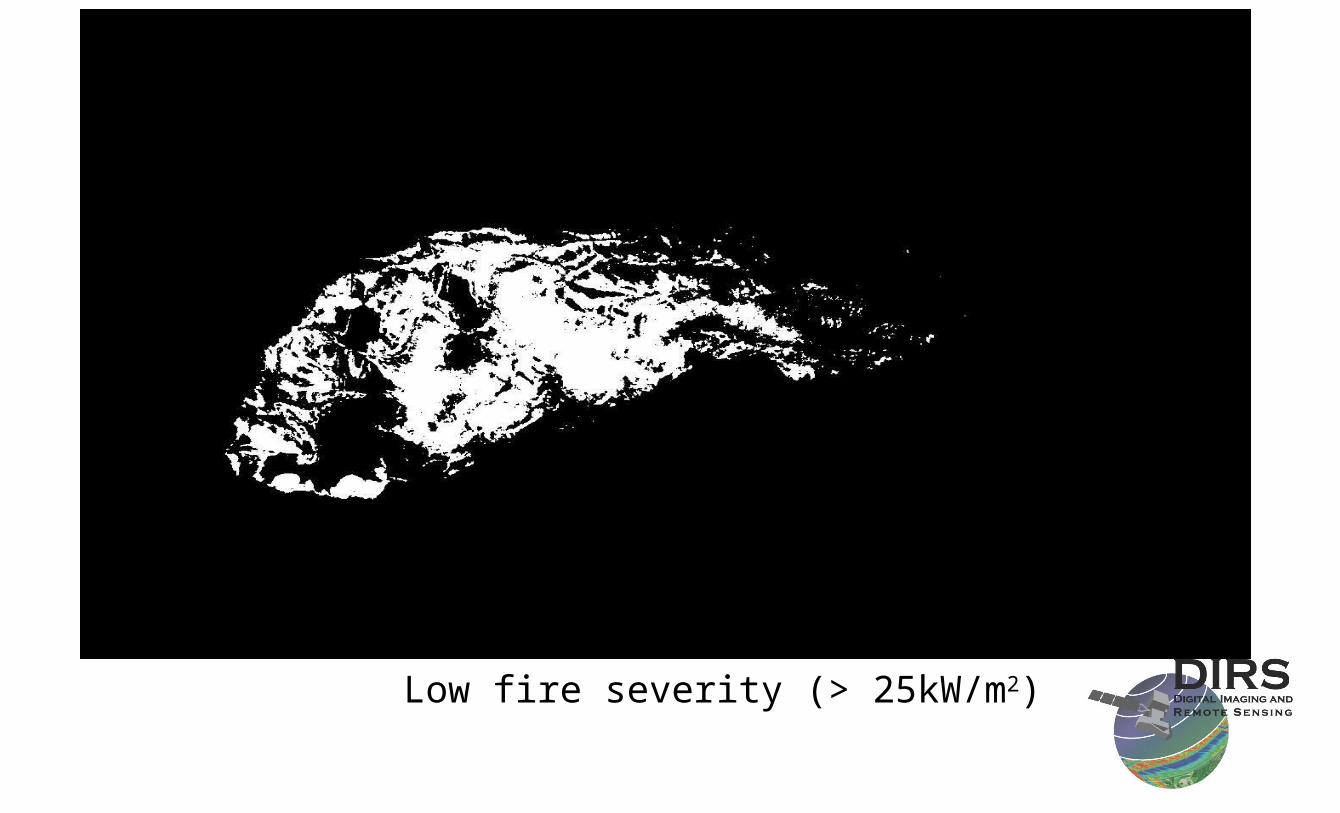
Low fire severity (> 25kW/m2)
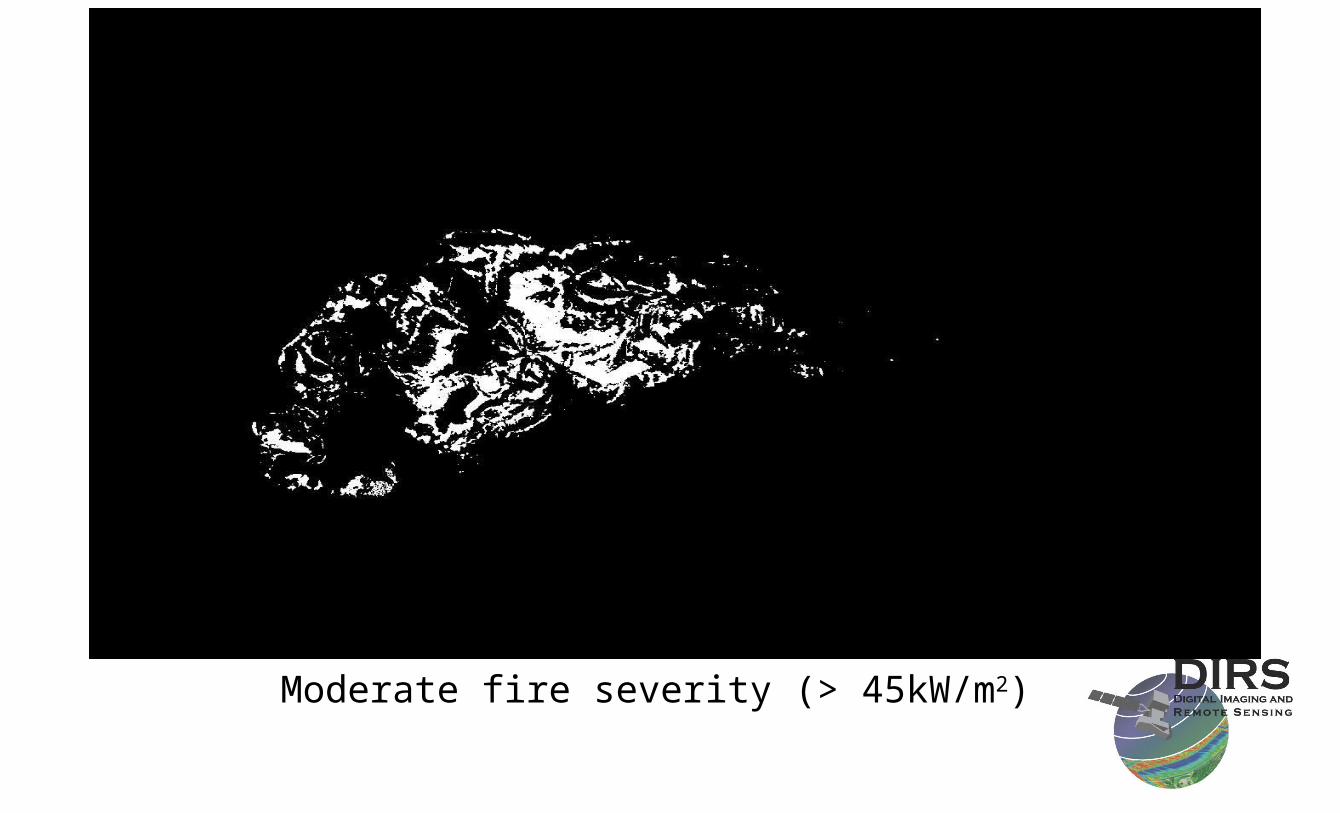
Moderate fire severity (> 45kW/m2)
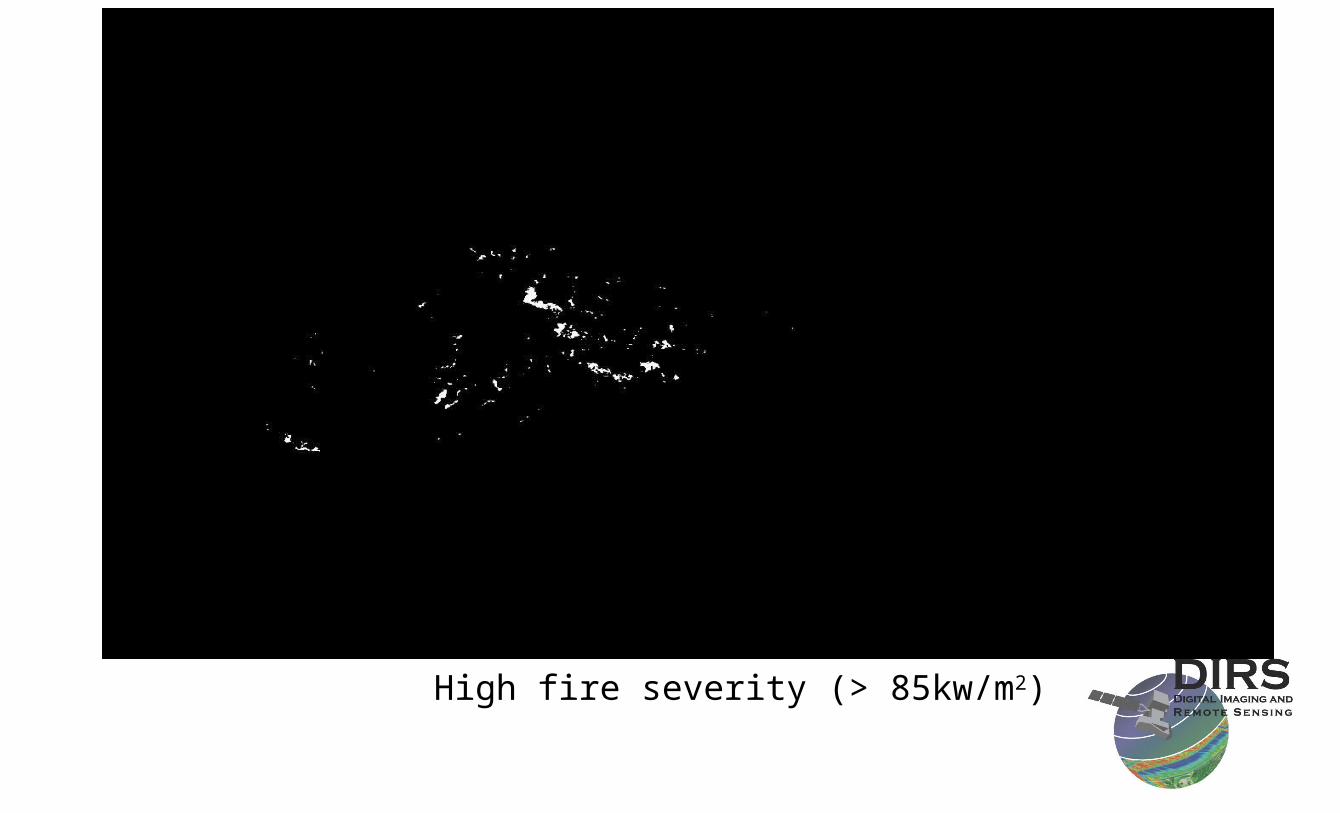
High fire severity (> 85kw/m2)
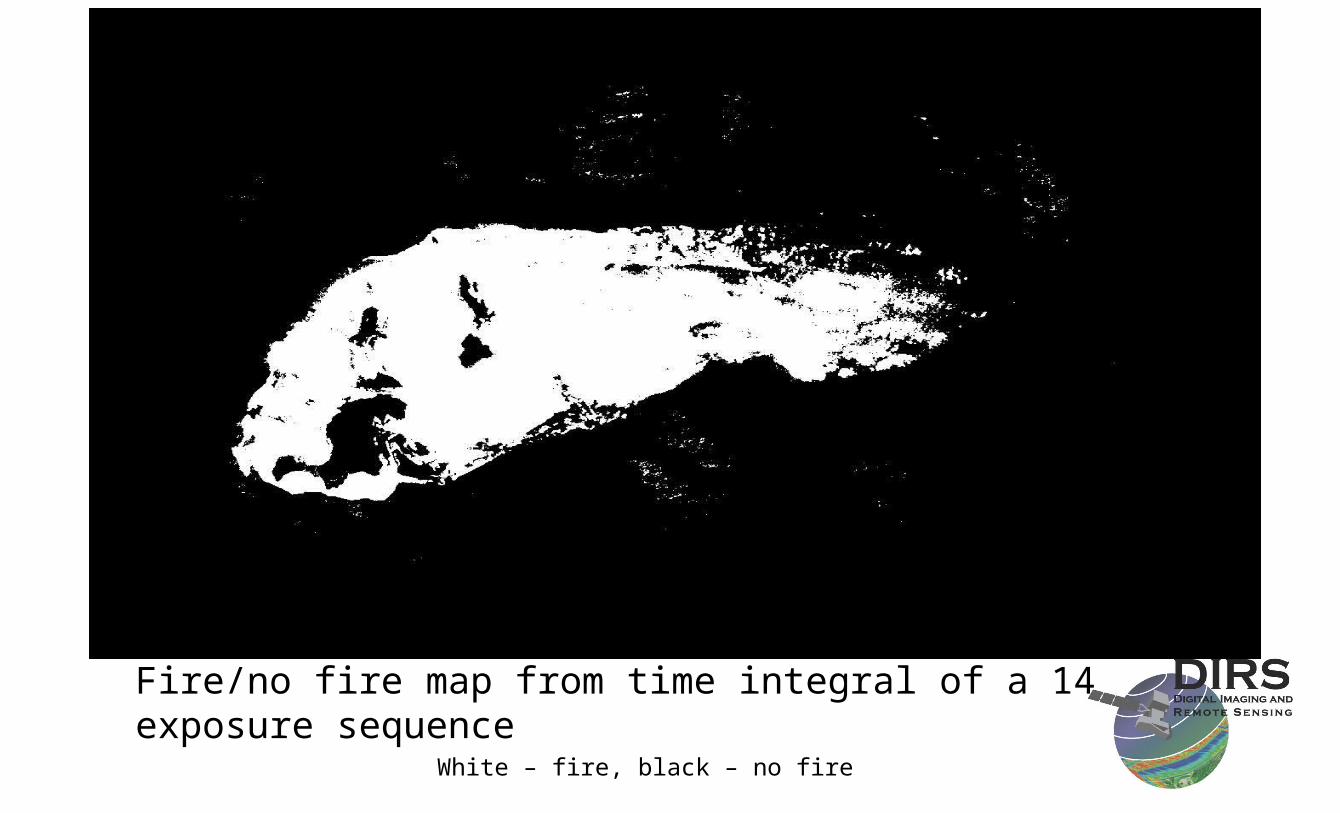
Fire/no fire map from time integral of a 14 exposure sequence White – fire, black – no fire
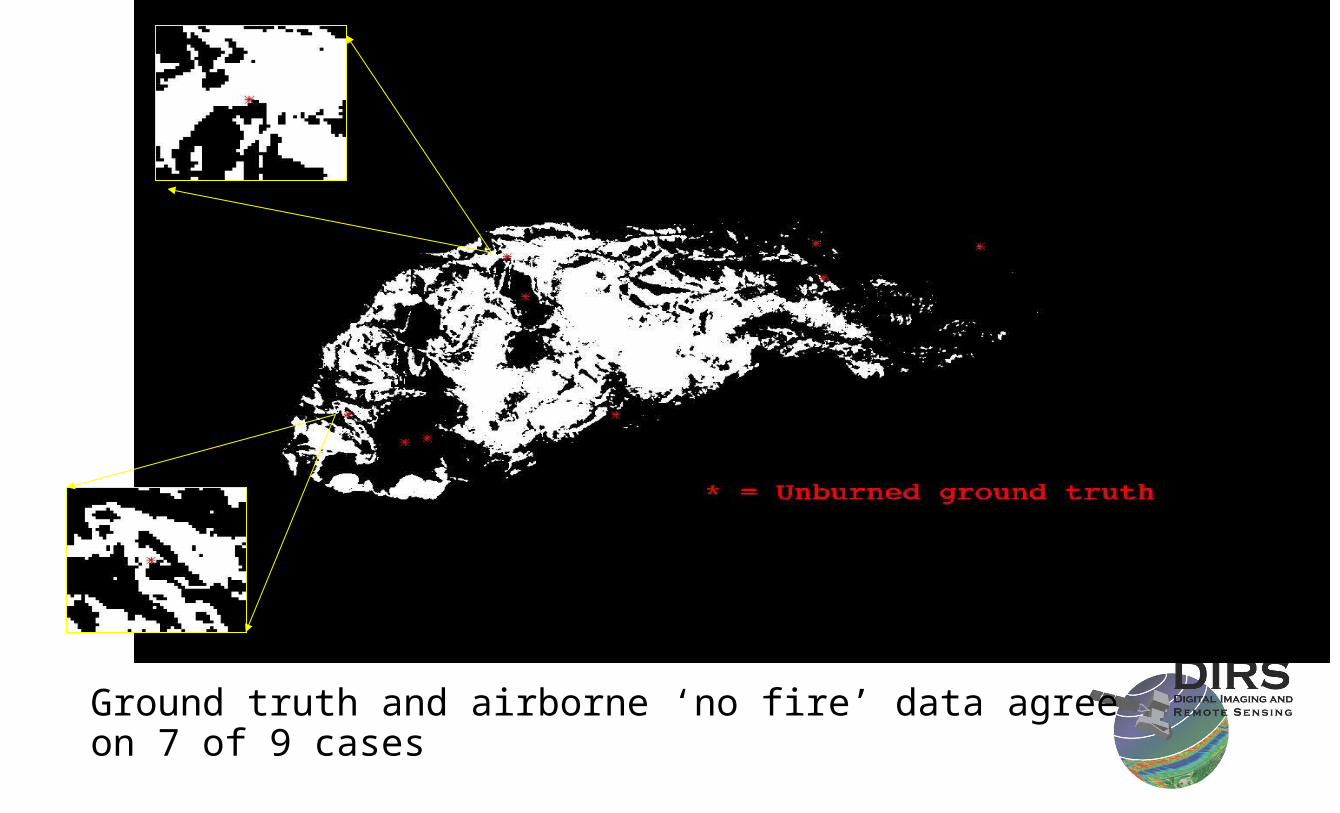
Ground truth and airborne ‘no fire’ data agree on 7 of 9 cases
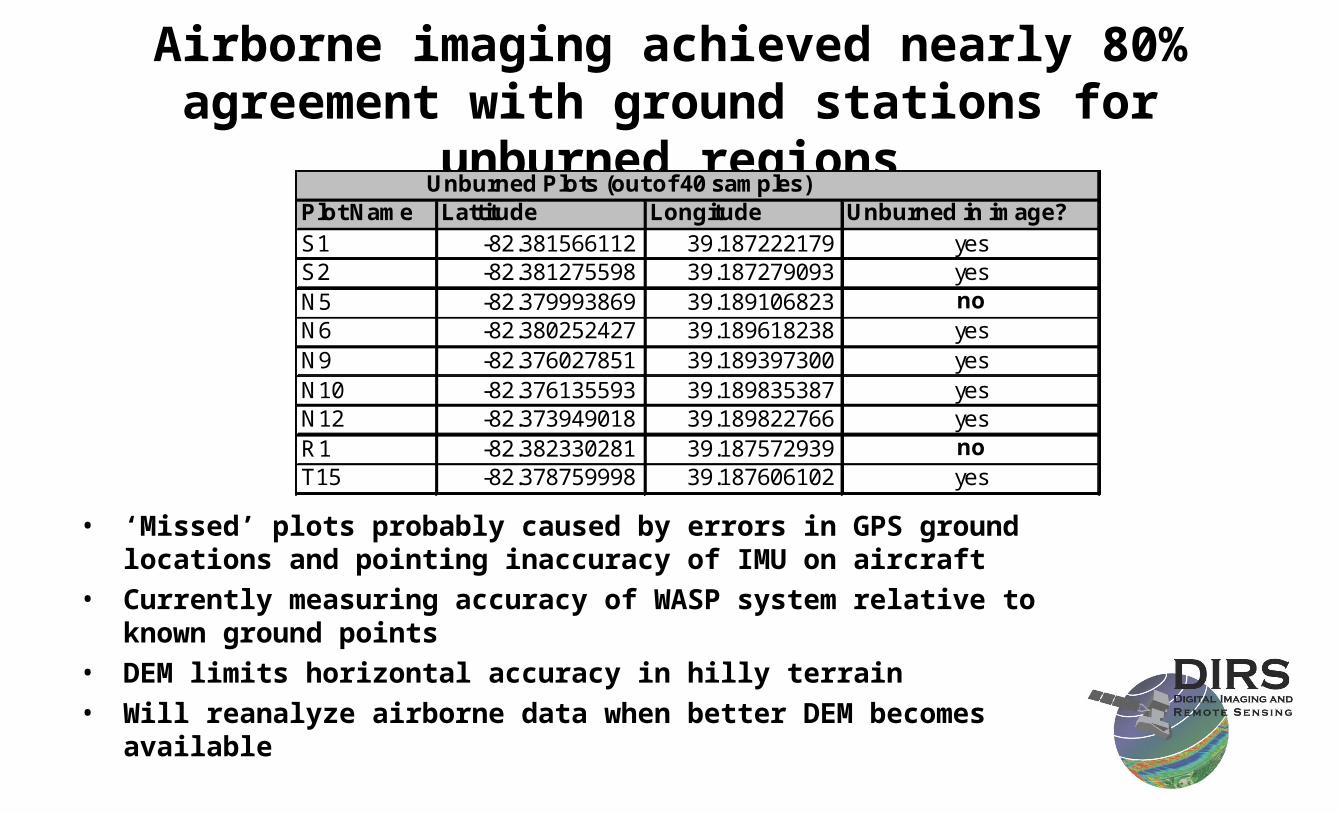
Airborne imaging achieved nearly 80% agreement with ground stations for unburned regions
Unburned Plots (out of 40 samples)Plot Name Lattitude Longitude Unburned in image?S1 -82.381566112 39.187222179 yesS2 -82.381275598 39.187279093 yesN5 -82.379993869 39.189106823 noN6 -82.380252427 39.189618238 yesN9 -82.376027851 39.189397300 yesN10 -82.376135593 39.189835387 yesN12 -82.373949018 39.189822766 yesR1 -82.382330281 39.187572939 noT15 -82.378759998 39.187606102 yes
• ‘Missed’ plots probably caused by errors in GPS ground locations and pointing inaccuracy of IMU on aircraft
• Currently measuring accuracy of WASP system relative to known ground points
• DEM limits horizontal accuracy in hilly terrain
• Will reanalyze airborne data when better DEM becomes available
Conclusions• Obtained proof of the utility of time-sequenced images for
rapidly obtaining burned/unburned area maps• Developed in-fire calibration techniques for overhead IR
imagery using fire resistant data loggers• Achieved 78% accuracy with ground truth
– Missed points are within ~ 10 m of an unburned area– This is well within the combined error of the image
georectification accuracy and GPS accuracy (used to locate the ground truth stations)
• Need further experiments to validate fire severity map data product using this technique
References:1. WASP- A high performance, multi-spectral airborne imager for wildland fire detection, R.
Kremens, D. McKeown, J. Cockburn, J. Faulring, D. Morse, H. Rhody, M. Richardson, presented at the 2nd International Wildland Fire Ecology and Fire Management Congress, Orlando, Fl, November 2003
2. Autonomous field-deployable wildland fire sensors, R. Kremens, J. Faulring, A. Gallagher, A. Seema, A. Vodacek, Int. J. of Wildland Fire, 12, 237-244 (2003)
3. Measurement of the time-temperature and emissivity history of the burn scar for remote sensing applications, R. Kremens, J. Faulring, C. Hardy, presented at the 2nd International Wildland Fire Ecology and Fire Management Congress, Orlando, Fl, November 2003
Contact InformationRobert Kremens
Rochester Institute of Technology
54 Lomb Memorial Drive
Rochester NY 14623
585.475.7286