Embed Size (px)
Citation preview
Accuracy of magnetic resonance imaging formeasuring maturing cartilage: A phantom studyJennifer R. McKinney,I Marshall S. Sussman,II Rahim Moineddin,III Afsaneh Amirabadi,I
Tammy Rayner,I Andrea S. DoriaI,II,*
IUniversity of Toronto, The Hospital for Sick Children, Department of Diagnostic Imaging, Toronto/ON, Canada. II The University Health Network, Toronto
General Hospital, Department of Medical Imaging, Toronto/ON, Canada. IIIUniversity of Toronto, Department of Family and Community Medicine,
Toronto/ON, Canada.
OBJECTIVES: To evaluate the accuracy of magnetic resonance imaging measurements of cartilage tissue-mimicking phantoms and to determine a combination of magnetic resonance imaging parameters to optimizeaccuracy while minimizing scan time.
METHOD: Edge dimensions from 4 rectangular agar phantoms ranging from 10.5 to 14.5 mm in length and 1.25to 5.5 mm in width were independently measured by two readers using a steel ruler. Coronal T1 spin echo(T1 SE), fast spoiled gradient-recalled echo (FSPGR) and multiplanar gradient-recalled echo (GRE MPGR)sequences were used to obtain phantom images on a 1.5-T scanner.
RESULTS: Inter- and intra-reader reliability were high for both direct measurements and for magnetic resonanceimaging measurements of phantoms. Statistically significant differences were noted between the mean directmeasurements and the mean magnetic resonance imaging measurements for phantom 1 when using a GREMPGR sequence (512x512 pixels, 1.5-mm slice thickness, 5:49 min scan time), while borderline differences werenoted for T1 SE sequences with the following parameters: 320x320 pixels, 1.5-mm slice thickness, 6:11 min scantime; 320x320 pixels, 4-mm slice thickness, 6:11 min scan time; and 512x512 pixels, 1.5-mm slice thickness,9:48 min scan time. Borderline differences were also noted when using a FSPGR sequence with 512x512 pixels, a1.5-mm slice thickness and a 3:36 min scan time.
CONCLUSIONS: FSPGR sequences, regardless of the magnetic resonance imaging parameter combination used,provided accurate measurements. The GRE MPGR sequence using 512x512 pixels, a 1.5-mm slice thickness and a5:49 min scan time and, to a lesser degree, all tested T1 SE sequences produced suboptimal accuracy whenmeasuring the widest phantom.
KEYWORDS: Cartilage; Dimensional Measurement Accuracy; Magnetic Resonance Imaging; Pediatrics;Phantoms.
McKinney JR, Sussman MS, Moineddin R, Amirabadi A, Rayner T, Doria AS. Accuracy of magnetic resonance imaging for measuring maturingcartilage: A phantom study. Clinics. 2016;71(7):404-411
Received for publication on March 6, 2016; First review completed on April 15, 2016; Accepted for publication on April 15, 2016
*Corresponding author. E-mail: [email protected]
’ INTRODUCTION
Magnetic resonance imaging (MRI) is a non-invasive, multi-planar imaging modality that enables three-dimensional assess-ments of joints and their surrounding soft tissue structures. MRIis the method of choice for the direct, non-invasive visualizationof cartilage (1). MRI-derived cartilage measurements are usefulfor exploring the effects of modifiable risk factors on articularcartilage prior to clinical disease and for identifying potentialpreventive strategies. Thus, these measurements are of great
value for monitoring treatment responses in childhood arthritis(2-4). However, the small dimensions of pediatric articularcartilage make themeasurement of this tissue using conventionalMRI scanners challenging, as such, it is difficult to obtainaccuracy in such measurements. While past studies haveestablished that MRI-derived cartilage measurements producehigh face validity when using cadaveric and surgical specimensfrom adults (5-12), to our knowledge, few if any prior studieshave determined the criterion validity of MRI-based measure-ments of maturing cartilage using cadaveric or surgical speci-mens or phantoms as reference standards. Currently, most of theavailable information in the literature relates to observationalstudies the effects of sex, age, growth, Tanner stage and physicalactivity on articular cartilage volume (12,13).
Determining the accuracies of different MRI sequencescurrently being used in clinical practice to assess maturingcartilage in children and adolescents is crucial given that arti-cular cartilage thickness tends to reduce during physiologicDOI: 10.6061/clinics/2016(07)09
Copyright & 2016 CLINICS – This is an Open Access article distributed under theterms of the Creative Commons License (http://creativecommons.org/licenses/by/4.0/) which permits unrestricted use, distribution, and reproduction in anymedium or format, provided the original work is properly cited.
No potential conflict of interest was reported.
404
CLINICAL SCIENCE
growth. Therefore, accurate measurements are required todiscriminate minimal arthropathy (which requires treatment)from normal physiologic growth. The goals of the currentstudy were to assess the inter- and intra-reader reliabilities ofdirect and MRI-acquired measurements of phantoms, toevaluate the accuracies of MRI-derived measurements ofpediatric articular cartilage using four different-sized agarphantoms designed to mimic the average dimensions ofpediatric cartilage tissue and to determine the combination ofMRI sequences and parameters that optimizes accuracywhile minimizing scan time.
’ MATERIALS AND METHODS
Phantom Preparation and MeasurementsFour rectangular tissue-mimicking phantoms composed of
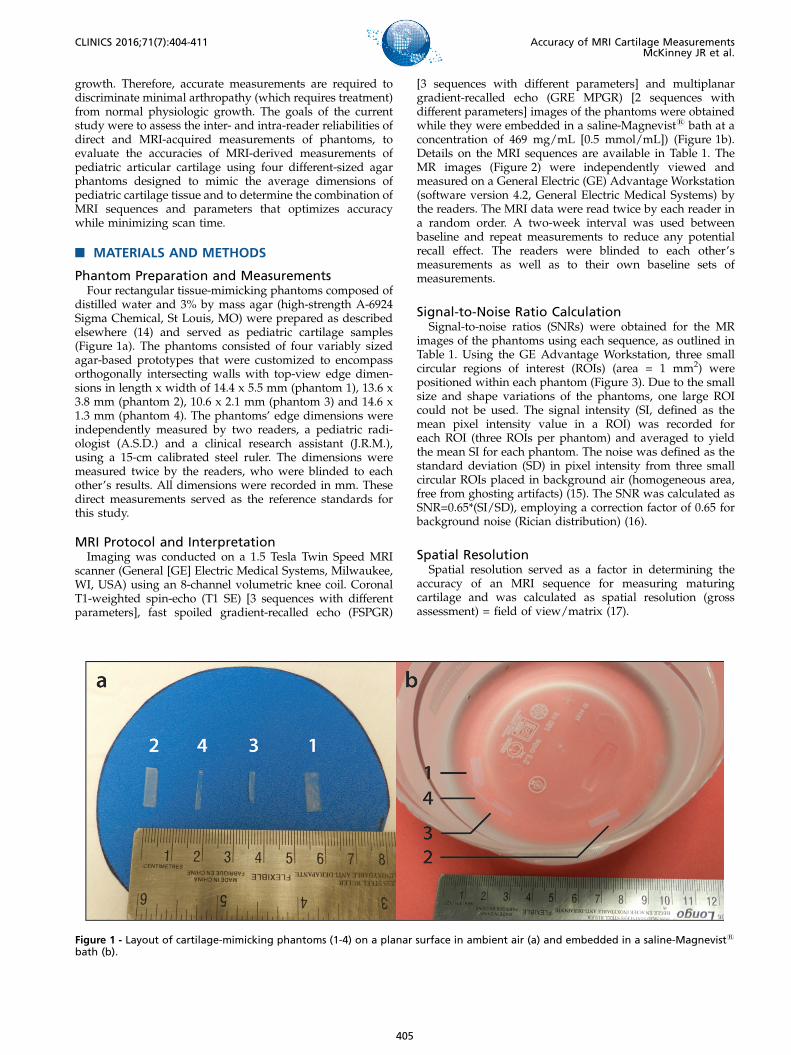
distilled water and 3% by mass agar (high-strength A-6924Sigma Chemical, St Louis, MO) were prepared as describedelsewhere (14) and served as pediatric cartilage samples(Figure 1a). The phantoms consisted of four variably sizedagar-based prototypes that were customized to encompassorthogonally intersecting walls with top-view edge dimen-sions in length x width of 14.4 x 5.5 mm (phantom 1), 13.6 x3.8 mm (phantom 2), 10.6 x 2.1 mm (phantom 3) and 14.6 x1.3 mm (phantom 4). The phantoms’ edge dimensions wereindependently measured by two readers, a pediatric radi-ologist (A.S.D.) and a clinical research assistant (J.R.M.),using a 15-cm calibrated steel ruler. The dimensions weremeasured twice by the readers, who were blinded to eachother’s results. All dimensions were recorded in mm. Thesedirect measurements served as the reference standards forthis study.
MRI Protocol and InterpretationImaging was conducted on a 1.5 Tesla Twin Speed MRI
scanner (General [GE] Electric Medical Systems, Milwaukee,WI, USA) using an 8-channel volumetric knee coil. CoronalT1-weighted spin-echo (T1 SE) [3 sequences with differentparameters], fast spoiled gradient-recalled echo (FSPGR)
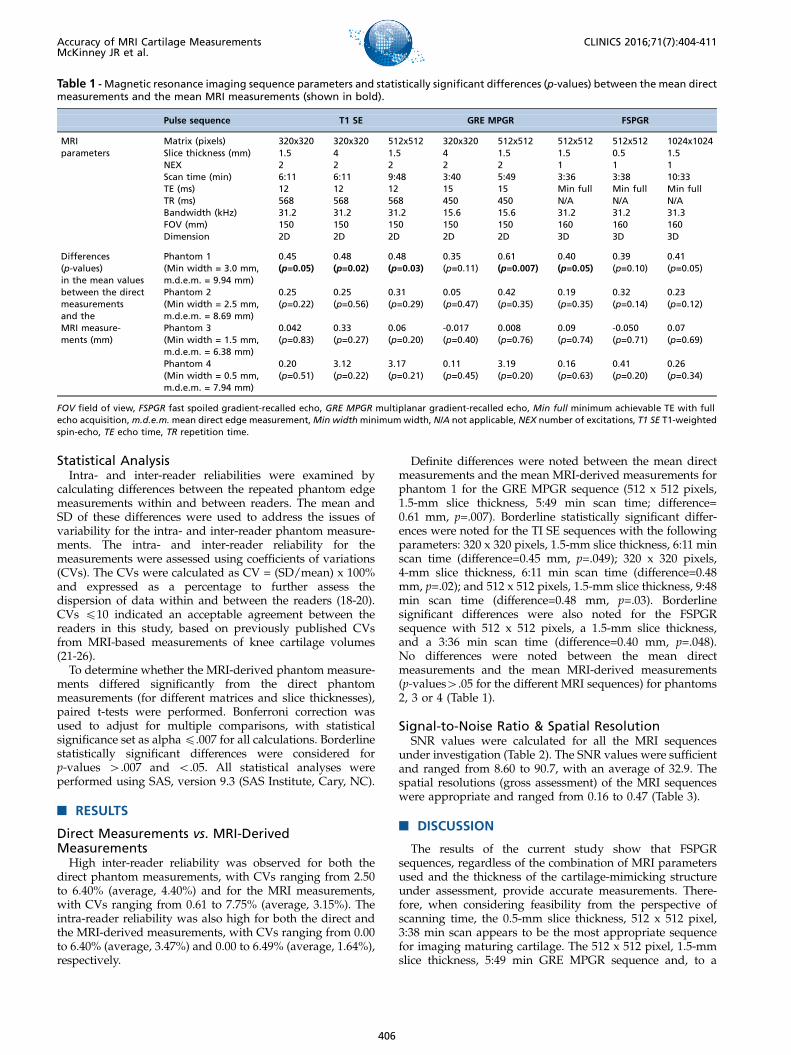
[3 sequences with different parameters] and multiplanargradient-recalled echo (GRE MPGR) [2 sequences withdifferent parameters] images of the phantoms were obtainedwhile they were embedded in a saline-Magnevists bath at aconcentration of 469 mg/mL [0.5 mmol/mL]) (Figure 1b).Details on the MRI sequences are available in Table 1. TheMR images (Figure 2) were independently viewed andmeasured on a General Electric (GE) Advantage Workstation(software version 4.2, General Electric Medical Systems) bythe readers. The MRI data were read twice by each reader ina random order. A two-week interval was used betweenbaseline and repeat measurements to reduce any potentialrecall effect. The readers were blinded to each other’smeasurements as well as to their own baseline sets ofmeasurements.
Signal-to-Noise Ratio CalculationSignal-to-noise ratios (SNRs) were obtained for the MR
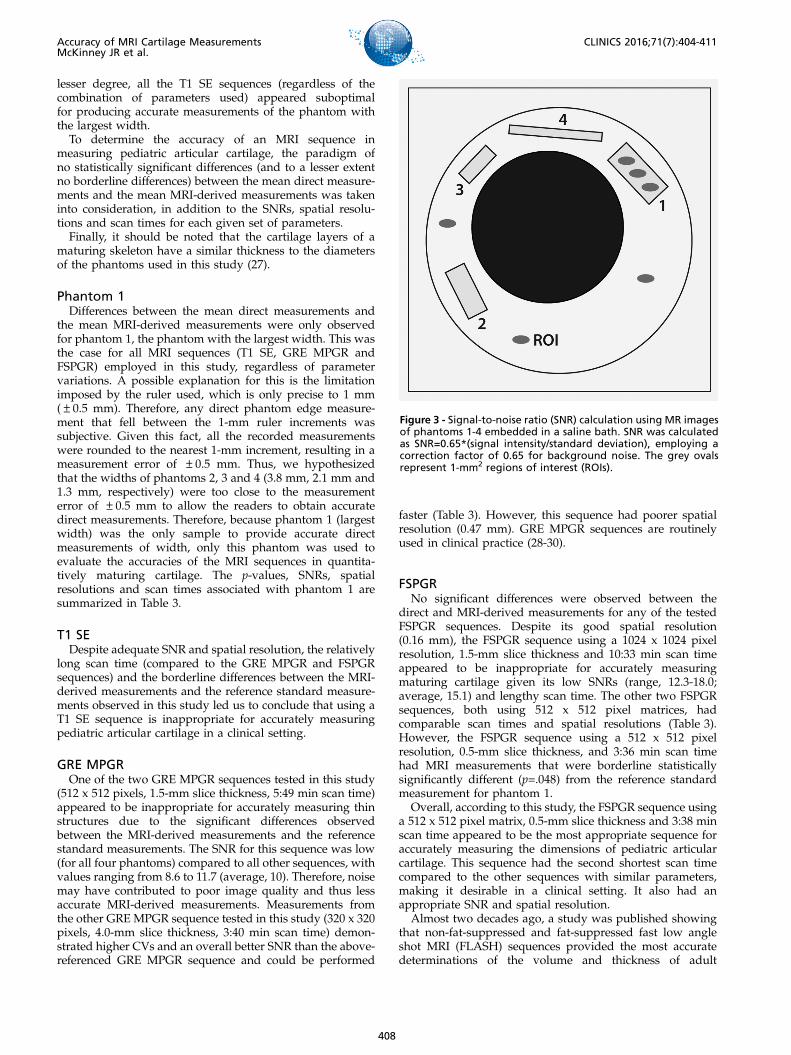
images of the phantoms using each sequence, as outlined inTable 1. Using the GE Advantage Workstation, three smallcircular regions of interest (ROIs) (area = 1 mm2) werepositioned within each phantom (Figure 3). Due to the smallsize and shape variations of the phantoms, one large ROIcould not be used. The signal intensity (SI, defined as themean pixel intensity value in a ROI) was recorded foreach ROI (three ROIs per phantom) and averaged to yieldthe mean SI for each phantom. The noise was defined as thestandard deviation (SD) in pixel intensity from three smallcircular ROIs placed in background air (homogeneous area,free from ghosting artifacts) (15). The SNR was calculated asSNR=0.65*(SI/SD), employing a correction factor of 0.65 forbackground noise (Rician distribution) (16).
Spatial ResolutionSpatial resolution served as a factor in determining the
accuracy of an MRI sequence for measuring maturingcartilage and was calculated as spatial resolution (grossassessment) = field of view/matrix (17).
Figure 1 - Layout of cartilage-mimicking phantoms (1-4) on a planar surface in ambient air (a) and embedded in a saline-Magnevists
bath (b).
405
CLINICS 2016;71(7):404-411 Accuracy of MRI Cartilage MeasurementsMcKinney JR et al.
Statistical AnalysisIntra- and inter-reader reliabilities were examined by
calculating differences between the repeated phantom edgemeasurements within and between readers. The mean andSD of these differences were used to address the issues ofvariability for the intra- and inter-reader phantom measure-ments. The intra- and inter-reader reliability for themeasurements were assessed using coefficients of variations(CVs). The CVs were calculated as CV = (SD/mean) x 100%and expressed as a percentage to further assess thedispersion of data within and between the readers (18-20).CVs p10 indicated an acceptable agreement between thereaders in this study, based on previously published CVsfrom MRI-based measurements of knee cartilage volumes(21-26).To determine whether the MRI-derived phantom measure-
ments differed significantly from the direct phantommeasurements (for different matrices and slice thicknesses),paired t-tests were performed. Bonferroni correction wasused to adjust for multiple comparisons, with statisticalsignificance set as alphap.007 for all calculations. Borderlinestatistically significant differences were considered forp-values 4.007 and o.05. All statistical analyses wereperformed using SAS, version 9.3 (SAS Institute, Cary, NC).
’ RESULTS
Direct Measurements vs. MRI-DerivedMeasurementsHigh inter-reader reliability was observed for both the
direct phantom measurements, with CVs ranging from 2.50to 6.40% (average, 4.40%) and for the MRI measurements,with CVs ranging from 0.61 to 7.75% (average, 3.15%). Theintra-reader reliability was also high for both the direct andthe MRI-derived measurements, with CVs ranging from 0.00to 6.40% (average, 3.47%) and 0.00 to 6.49% (average, 1.64%),respectively.
Definite differences were noted between the mean directmeasurements and the mean MRI-derived measurements forphantom 1 for the GRE MPGR sequence (512 x 512 pixels,1.5-mm slice thickness, 5:49 min scan time; difference=0.61 mm, p=.007). Borderline statistically significant differ-ences were noted for the TI SE sequences with the followingparameters: 320 x 320 pixels, 1.5-mm slice thickness, 6:11 minscan time (difference=0.45 mm, p=.049); 320 x 320 pixels,4-mm slice thickness, 6:11 min scan time (difference=0.48mm, p=.02); and 512 x 512 pixels, 1.5-mm slice thickness, 9:48min scan time (difference=0.48 mm, p=.03). Borderlinesignificant differences were also noted for the FSPGRsequence with 512 x 512 pixels, a 1.5-mm slice thickness,and a 3:36 min scan time (difference=0.40 mm, p=.048).No differences were noted between the mean directmeasurements and the mean MRI-derived measurements(p-values4.05 for the different MRI sequences) for phantoms2, 3 or 4 (Table 1).
Signal-to-Noise Ratio & Spatial ResolutionSNR values were calculated for all the MRI sequences
under investigation (Table 2). The SNR values were sufficientand ranged from 8.60 to 90.7, with an average of 32.9. Thespatial resolutions (gross assessment) of the MRI sequenceswere appropriate and ranged from 0.16 to 0.47 (Table 3).
’ DISCUSSION
The results of the current study show that FSPGRsequences, regardless of the combination of MRI parametersused and the thickness of the cartilage-mimicking structureunder assessment, provide accurate measurements. There-fore, when considering feasibility from the perspective ofscanning time, the 0.5-mm slice thickness, 512 x 512 pixel,3:38 min scan appears to be the most appropriate sequencefor imaging maturing cartilage. The 512 x 512 pixel, 1.5-mmslice thickness, 5:49 min GRE MPGR sequence and, to a
Table 1 -Magnetic resonance imaging sequence parameters and statistically significant differences (p-values) between the mean directmeasurements and the mean MRI measurements (shown in bold).
Pulse sequence T1 SE GRE MPGR FSPGR
MRIparameters
Matrix (pixels) 320x320 320x320 512x512 320x320 512x512 512x512 512x512 1024x1024Slice thickness (mm) 1.5 4 1.5 4 1.5 1.5 0.5 1.5NEX 2 2 2 2 2 1 1 1Scan time (min) 6:11 6:11 9:48 3:40 5:49 3:36 3:38 10:33TE (ms) 12 12 12 15 15 Min full Min full Min fullTR (ms) 568 568 568 450 450 N/A N/A N/ABandwidth (kHz) 31.2 31.2 31.2 15.6 15.6 31.2 31.2 31.3FOV (mm) 150 150 150 150 150 160 160 160Dimension 2D 2D 2D 2D 2D 3D 3D 3D
Differences(p-values)in the mean valuesbetween the directmeasurementsand theMRI measure-ments (mm)
Phantom 1(Min width = 3.0 mm,m.d.e.m. = 9.94 mm)
0.45(p=0.05)
0.48(p=0.02)
0.48(p=0.03)
0.35(p=0.11)
0.61(p=0.007)
0.40(p=0.05)
0.39(p=0.10)
0.41(p=0.05)
Phantom 2(Min width = 2.5 mm,m.d.e.m. = 8.69 mm)
0.25(p=0.22)
0.25(p=0.56)
0.31(p=0.29)
0.05(p=0.47)
0.42(p=0.35)
0.19(p=0.35)
0.32(p=0.14)
0.23(p=0.12)
Phantom 3(Min width = 1.5 mm,m.d.e.m. = 6.38 mm)
0.042(p=0.83)
0.33(p=0.27)
0.06(p=0.20)
-0.017(p=0.40)
0.008(p=0.76)
0.09(p=0.74)
-0.050(p=0.71)
0.07(p=0.69)
Phantom 4(Min width = 0.5 mm,m.d.e.m. = 7.94 mm)
0.20(p=0.51)
3.12(p=0.22)
3.17(p=0.21)
0.11(p=0.45)
3.19(p=0.20)
0.16(p=0.63)
0.41(p=0.20)
0.26(p=0.34)
FOV field of view, FSPGR fast spoiled gradient-recalled echo, GRE MPGR multiplanar gradient-recalled echo, Min full minimum achievable TE with fullecho acquisition, m.d.e.m.mean direct edge measurement,Min widthminimum width, N/A not applicable, NEX number of excitations, T1 SE T1-weightedspin-echo, TE echo time, TR repetition time.
406
Accuracy of MRI Cartilage MeasurementsMcKinney JR et al.
CLINICS 2016;71(7):404-411
Figure 2 - Coronal MR images generated by various sequences and parameters.(a) T1-weighted spin-echo (SE), 320 x 320 pixels, 1.5-mm slice thickness; (b) T1 SE, 320 x 320 pixels, 4-mm slice thickness; (c) T1 SE, 512 x512 pixels, 1.5-mm slice thickness; (d) Multiplanar gradient-recalled echo (GRE MPGR), 320 x 320 pixels, 1.5-mm slice thickness; (e) GREMPGR, 512 x 512 pixels, 1.5-mm slice thickness; (f) Fast spoiled gradient-recalled echo (FSPGR), 512 x 512 pixels, 0.5-mm slice thickness;(g) FSPGR, 1024 x 1024 pixels, 1.5-mm slice thickness; (h) FSPGR, 512 x 512 pixels, 1.5-mm slice thickness.
407
CLINICS 2016;71(7):404-411 Accuracy of MRI Cartilage MeasurementsMcKinney JR et al.
lesser degree, all the T1 SE sequences (regardless of thecombination of parameters used) appeared suboptimalfor producing accurate measurements of the phantom withthe largest width.To determine the accuracy of an MRI sequence in
measuring pediatric articular cartilage, the paradigm ofno statistically significant differences (and to a lesser extentno borderline differences) between the mean direct measure-ments and the mean MRI-derived measurements was takeninto consideration, in addition to the SNRs, spatial resolu-tions and scan times for each given set of parameters.Finally, it should be noted that the cartilage layers of a
maturing skeleton have a similar thickness to the diametersof the phantoms used in this study (27).
Phantom 1Differences between the mean direct measurements and
the mean MRI-derived measurements were only observedfor phantom 1, the phantom with the largest width. This wasthe case for all MRI sequences (T1 SE, GRE MPGR andFSPGR) employed in this study, regardless of parametervariations. A possible explanation for this is the limitationimposed by the ruler used, which is only precise to 1 mm(±0.5 mm). Therefore, any direct phantom edge measure-ment that fell between the 1-mm ruler increments wassubjective. Given this fact, all the recorded measurementswere rounded to the nearest 1-mm increment, resulting in ameasurement error of ±0.5 mm. Thus, we hypothesizedthat the widths of phantoms 2, 3 and 4 (3.8 mm, 2.1 mm and1.3 mm, respectively) were too close to the measurementerror of ±0.5 mm to allow the readers to obtain accuratedirect measurements. Therefore, because phantom 1 (largestwidth) was the only sample to provide accurate directmeasurements of width, only this phantom was used toevaluate the accuracies of the MRI sequences in quantita-tively maturing cartilage. The p-values, SNRs, spatialresolutions and scan times associated with phantom 1 aresummarized in Table 3.
T1 SEDespite adequate SNR and spatial resolution, the relatively
long scan time (compared to the GRE MPGR and FSPGRsequences) and the borderline differences between the MRI-derived measurements and the reference standard measure-ments observed in this study led us to conclude that using aT1 SE sequence is inappropriate for accurately measuringpediatric articular cartilage in a clinical setting.
GRE MPGROne of the two GRE MPGR sequences tested in this study
(512 x 512 pixels, 1.5-mm slice thickness, 5:49 min scan time)appeared to be inappropriate for accurately measuring thinstructures due to the significant differences observedbetween the MRI-derived measurements and the referencestandard measurements. The SNR for this sequence was low(for all four phantoms) compared to all other sequences, withvalues ranging from 8.6 to 11.7 (average, 10). Therefore, noisemay have contributed to poor image quality and thus lessaccurate MRI-derived measurements. Measurements fromthe other GRE MPGR sequence tested in this study (320 x 320pixels, 4.0-mm slice thickness, 3:40 min scan time) demon-strated higher CVs and an overall better SNR than the above-referenced GRE MPGR sequence and could be performed
faster (Table 3). However, this sequence had poorer spatialresolution (0.47 mm). GRE MPGR sequences are routinelyused in clinical practice (28-30).
FSPGRNo significant differences were observed between the
direct and MRI-derived measurements for any of the testedFSPGR sequences. Despite its good spatial resolution(0.16 mm), the FSPGR sequence using a 1024 x 1024 pixelresolution, 1.5-mm slice thickness and 10:33 min scan timeappeared to be inappropriate for accurately measuringmaturing cartilage given its low SNRs (range, 12.3-18.0;average, 15.1) and lengthy scan time. The other two FSPGRsequences, both using 512 x 512 pixel matrices, hadcomparable scan times and spatial resolutions (Table 3).However, the FSPGR sequence using a 512 x 512 pixelresolution, 0.5-mm slice thickness, and 3:36 min scan timehad MRI measurements that were borderline statisticallysignificantly different (p=.048) from the reference standardmeasurement for phantom 1.
Overall, according to this study, the FSPGR sequence usinga 512 x 512 pixel matrix, 0.5-mm slice thickness and 3:38 minscan time appeared to be the most appropriate sequence foraccurately measuring the dimensions of pediatric articularcartilage. This sequence had the second shortest scan timecompared to the other sequences with similar parameters,making it desirable in a clinical setting. It also had anappropriate SNR and spatial resolution.
Almost two decades ago, a study was published showingthat non-fat-suppressed and fat-suppressed fast low angleshot MRI (FLASH) sequences provided the most accuratedeterminations of the volume and thickness of adult
Figure 3 - Signal-to-noise ratio (SNR) calculation using MR imagesof phantoms 1-4 embedded in a saline bath. SNR was calculatedas SNR=0.65*(signal intensity/standard deviation), employing acorrection factor of 0.65 for background noise. The grey ovalsrepresent 1-mm2 regions of interest (ROIs).
408
Accuracy of MRI Cartilage MeasurementsMcKinney JR et al.
CLINICS 2016;71(7):404-411
cartilage (10). More recent studies have confirmed thisconclusion, stating that the use of FLASH at 1.5 T or 3 Tremains the standard for quantifying articular cartilage(31-33). In recent years, double-echo steady-state imaging(DESS) with water excitation has gained interest as analternate imaging modality for assessing cartilage due to itsfaster acquisition time and lower achievable slice thickness(34-38). However, it should be noted that DESS is stillundergoing validation with regard to its ability to accuratelymeasure cartilage dimensions (39). Other promising sequencesfor the assessment of cartilage include driven equilibriumFourier transform (DEFT), which displays greater cartilage-to-fluid contrast than FLASH (40), balanced steady-state freeprecession (bSSFP) or true fast imaging with steady state(FISP) and its variant, fluctuating equilibrium magneticresonance (FEMR) (41). Lastly, iterative decomposition ofwater and fat with echo asymmetry and least squaresestimation (IDEAL) in combination with bSSFP demonstratessuperior SNR, faster acquisition times and better contrast thanFLASH (40). Again, it should be emphasized that quantitativecartilage data have not yet been presented with respect to anyof the aforementioned sequences (DESS, DEFT, bSSFP/FISP,and IDEAL) (40). At the time of this writing, FLASH remainsthe MRI sequence of choice for accurately measuring thethickness and volume of maturing cartilage. This is con-cordant with the findings from the current study showing thatFSPGR was the most appropriate sequence for accuratelymeasuring pediatric cartilage-mimicking phantoms.
Study LimitationsOne limitation of this study was the use of a steel ruler to
obtain reference measurements. By using a ‘‘regression to themean’’ approach (42), we expected to reduce humanmeasurement error in this regard. We preferred to use‘‘human eye’’ measurements as opposed to a contact-sensingdimension gage such as a micrometer because the mechan-ical perturbations associated with the use of a micrometercould have damaged the delicate phantoms used in this
study. In addition, we preferred to use paired t-test tests withBonferroni corrections for multi-testing to compare the testand reference standard measurements rather than othermethods that account for unequal variances such as Welch’smethod (43). The rationale for this was the fact that Welch’smethod is not suitable for paired comparisons and couldover-correct the results in a pilot study with a restrictedsample size. A limitation inherent in the use of paired t-testswas the assumption that the variances in the distributions ofthe test measurements and reference standard measurementswere equal. As a consequence, one could argue that theresults of this study could be unreliable if the variancesbetween the underlying samples varied (43). Anotherlimitation of the study was the fact that the same readersperformed measurements of MR images and phantomspecimens, which could have prompted recall bias. To avoidsuch bias, a time interval between reading sessions wasestablished a priori. Finally, although the agar phantomsused in this study may not fully simulate the signal intensityor SNR of maturing cartilage on MRI, it would be extremelychallenging to assess the signal intensities of layers ofcartilage collected from cadavers of children for ethicalreasons and results from animal cadavers would notrepresent the thickness of maturing cartilage in children.In conclusion, based on scan time, reference standard
comparability and accuracy, FSPGR proved to be the mostoptimal MRI sequence for measuring maturing cartilage-mimicking phantoms. Further translation of these resultsinto the clinic should be performed to validate them and thusoptimize the use of MRI sequences for the assessment ofmaturing cartilage in the pediatric population.
’ ACKNOWLEDGMENTS
This work was presented as a scientific poster at the 2014 Society ofPediatric Radiology Scientific Assembly in Washington, D.C. All fundingwas derived from internal departmental funds and no external grantswere used.
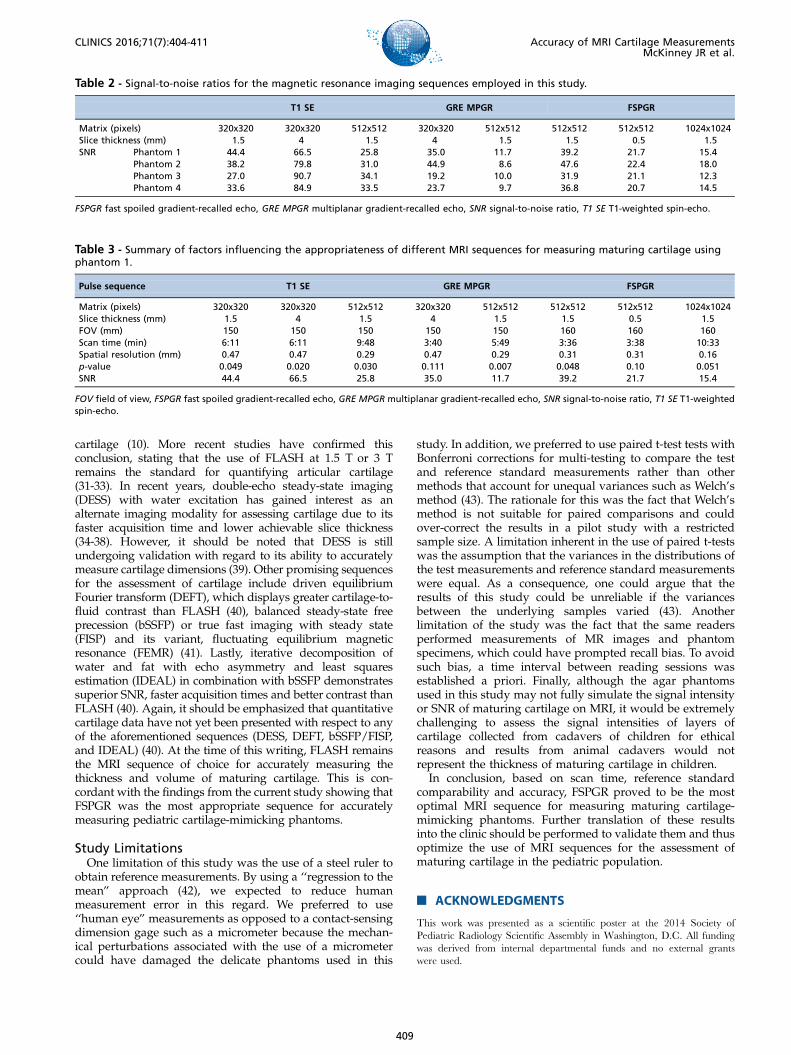
Table 2 - Signal-to-noise ratios for the magnetic resonance imaging sequences employed in this study.
T1 SE GRE MPGR FSPGR
Matrix (pixels) 320x320 320x320 512x512 320x320 512x512 512x512 512x512 1024x1024Slice thickness (mm) 1.5 4 1.5 4 1.5 1.5 0.5 1.5SNR Phantom 1 44.4 66.5 25.8 35.0 11.7 39.2 21.7 15.4
Phantom 2 38.2 79.8 31.0 44.9 8.6 47.6 22.4 18.0Phantom 3 27.0 90.7 34.1 19.2 10.0 31.9 21.1 12.3Phantom 4 33.6 84.9 33.5 23.7 9.7 36.8 20.7 14.5
FSPGR fast spoiled gradient-recalled echo, GRE MPGR multiplanar gradient-recalled echo, SNR signal-to-noise ratio, T1 SE T1-weighted spin-echo.
Table 3 - Summary of factors influencing the appropriateness of different MRI sequences for measuring maturing cartilage usingphantom 1.
Pulse sequence T1 SE GRE MPGR FSPGR
Matrix (pixels) 320x320 320x320 512x512 320x320 512x512 512x512 512x512 1024x1024Slice thickness (mm) 1.5 4 1.5 4 1.5 1.5 0.5 1.5FOV (mm) 150 150 150 150 150 160 160 160Scan time (min) 6:11 6:11 9:48 3:40 5:49 3:36 3:38 10:33Spatial resolution (mm) 0.47 0.47 0.29 0.47 0.29 0.31 0.31 0.16p-value 0.049 0.020 0.030 0.111 0.007 0.048 0.10 0.051SNR 44.4 66.5 25.8 35.0 11.7 39.2 21.7 15.4
FOV field of view, FSPGR fast spoiled gradient-recalled echo, GRE MPGR multiplanar gradient-recalled echo, SNR signal-to-noise ratio, T1 SE T1-weightedspin-echo.
409
CLINICS 2016;71(7):404-411 Accuracy of MRI Cartilage MeasurementsMcKinney JR et al.
’ AUTHOR CONTRIBUTIONS
McKinney JR, Sussman MS, Amirabadi A, Rayner T and Doria ASconceived and designed the study. McKinney JR and Doria AS acquired,analyzed and interpreted the data. Moineddin R performed all statisticalanalyses of the data. McKinney JR drafted the manuscript. All authorscritically reviewed the manuscript for important intellectual content andapproved the final version for publication.
’ REFERENCES
1. Gougoutas AJ, Wheaton AJ, Borthakur A, Shapiro EM, Kneeland JB,Udupa JK, et al. Cartilage volume quantification via Live Wire segmen-tation. Acad Radiol. 2004;11(12):1389-95, http://dx.doi.org/10.1016/j.acra.2004.09.003.
2. Wang Y, Wluka AE, Jones G, Ding C, Cicuttini FM. Use magneticresonance imaging to assess articular cartilage. Ther Adv MusculoskeletDis. 2012;4(2):77-97, http://dx.doi.org/10.1177/1759720X11431005.
3. Hemke R, Doria AS, Tzaribachev N, Maas M, van der Heijde DM,van Rossum MA. Selecting magnetic resonance imaging (MRI) outcomemeasures for juvenile idiopathic arthritis (JIA) clinical trials: first report ofthe MRI in JIA special interest group. J Rheumatol. 2014;41(2):354-8,http://dx.doi.org/10.3899/jrheum.131081.
4. Miller E, Uleryk E, Doria AS. Evidence-based outcomes of studiesaddressing diagnostic accuracy of MRI of juvenile idiopathic arthritis. AJRAm J Roentgenol. 2009;192(5):1209-18, http://dx.doi.org/10.2214/AJR.08.2304.
5. Burgkart R, Glaser C, Hyhlik-Dürr A, Englmeier KH, Reiser M, Eckstein F.Magnetic resonance imaging-based assessment of cartilage loss insevere osteoarthritis: accuracy, precision, and diagnostic value. ArthritisRheum. 2011;44(9):2072-7, http://dx.doi.org/10.1002/1529-0131(200109)44:9o2072::AID-ART35743.0.CO;2-3.
6. Cicuttini F, Forbes A, Morris K, Darling S, Bailey M, Stuckey S. Gender dif-ferences in knee cartilage volume as measured by magnetic resonance ima-ging. Osteoarthritis Cartilage. 1999;7(3):265-71, http://dx.doi.org/10.1053/joca.1998.0200.
7. Peterfy CG, van Dijke CF, Janzen DL, Gluer CC, Namba R, Majumdar S, et al.Quantification of articular cartilage in the knee with pulsed saturation transfersubtraction and fat-suppressed MR imaging: optimization and validation.Radiology. 1994;192(2):485-91, http://dx.doi.org/10.1148/radiology.192.2.8029420.
8. Dupuy DE, Spillane RM, Rosol MS, Rosenthal DI, Palmer WE,Burke DW, et al. Quantification of articular cartilage in the kneewith three-dimensional MR imaging. Acad Radiol. 1996;3(11):919-24,http://dx.doi.org/10.1016/S1076-6332(96)80299-6.
9. Eckstein F, Schnier M, Haubner M, Priebsch J, Glaser C, Englmeier KH,et al. Accuracy of cartilage volume and thickness measurements withmagnetic resonance imaging. Clin Orthop Relat Res. 1998;(352):137-48.
10. Sittek H, Eckstein F, Gavazzeni A, Milz S, Kiefer B, Schulte E, et al.Assessment of normal patellar cartilage volume and thickness using MRI:an analysis of currently available pulse sequences. Skeletal Radiol. 1996;25(1):55-62, http://dx.doi.org/10.1007/s002560050032.
11. Graichen H, von Eisenhart-Rothe R, Vogl T, Englmeier KH, Eckstein F.Quantitative assessment of cartilage status in osteoarthritis byquantitative magnetic resonance imaging: technical validation for use inanalysis of cartilage volume and further morphologic parameters.Arthritis Rheum. 2004;50(3):811-6, http://dx.doi.org/10.1002/art.20191.
12. Jones G, Ding C, Glisson M, Hynes K, Ma D, Cicuttini F. Knee articularcartilage development in children: a longitudinal study of the effect of sex,growth, body composition, and physical activity. Pediatr Res. 2003;54(2):230-6, http://dx.doi.org/10.1203/01.PDR.0000072781.93856.E6.
13. Spannow AH, Stenboeg E, Pfeiffer-Jensen M, Fiirgaard B, Haislund M,Ostergaard M, et al. Ultrasound and MRI measurements of joint cartilagein healthy children: a validation study. Ultraschall Med. 2001;32(Suppl 1):S110-6, http://dx.doi.org/10.1055/s-0029-1245374.
14. Rickey DW, Picot PA, Christopher DA, Fenster A. A wall-less vesselphantom for Doppler ultrasound studies. Ultrasound in Med Biol. 1995;21(9):1163-76, http://dx.doi.org/10.1016/0301-5629(95)00044-5.
15. McCann AJ, Workman A, McGrath C. A quick and robust method formeasurement of signal-to-noise ratio in MRI. Phys Med Biol. 2013;58(11):3775-90, http://dx.doi.org/10.1088/0031-9155/58/11/3775.
16. Firbank MJ, Coulthard A, Harrison RM, Williams ED. A comparison oftwo methods for measuring the signal to noise ratio on MR images. PhysMed Biol. 1999;44(12):N261-4, http://dx.doi.org/10.1088/0031-9155/44/12/403.
17. Nitz WR, Balzer T, Grosu DS. Principles of magnetic resonance. In:Reimer P, Parizel PM, Meaney JFM, Stichnoth FA (eds). Clinical MRimaging: a practical approach. New York: Springer; 2010. p. 1-106.
18. Spannow AH, Pfeiffer-Jensen M, Andersen NT, Herlin T. Inter- and intraobserver variation of ultrasonographic cartilage thickness assessments in
small and large joints in healthy children. Pediatr Rheumatol. 2009;7:12,http://dx.doi.org/10.1186/1546-0096-7-12.
19. Eckstein F, Burstein D, Link TM. Quantitative MRI of cartilage and bone:degenerative changes in osteoarthritis. NMR Biomed. 2006;19(17):822-54,http://dx.doi.org/10.1002/nbm.1063.
20. Blumenkrantz G, Majumdar S. Quantitative magnetic resonance imagingof articular cartilage in osteoarthritis. Eur Cell Mater. 2007;13:76-86.
21. Jaremko JL, Cheng RW, Lambert RG, Habib AF, Ronsky JL. Reliability ofan efficient MRI-based method for estimation of knee cartilage volumeusing surface registration. Osteoarthritis Cartilage. 2006;14(9):914-22,http://dx.doi.org/10.1016/j.joca.2006.03.004.
22. Eckstein F, Glaser C. Measuring cartilage morphology with quantitativemagnetic resonance imaging. Semin Musculoskelet Radiol. 2004;8(4):329-53, http://dx.doi.org/10.1055/s-2004-861579.
23. Waterton JC, Solloway S, Foster JE, Keen MC, Gandy S, Middleton BJ, et al.Diurnal variation in the femoral articular cartilage of the knee in youngadult humans. Magn Reson Med. 2000;43(1):126-32, http://dx.doi.org/10.1002/(SICI)1522-2594(200001)43:1o126::AID-MRM1543.0.CO;2-#.
24. Heudorfer L, Hohe J, Faber S, Englmeier KH, Reiser M, Eckstein F.Precision MRI-based joint surface and cartilage density analysis ofthe knee joint using rapid water-excitation sequence and semi-automaticsegmentation algorithm. Biomed Tech (Berl). 2000;45(11):304-10,http://dx.doi.org/10.1515/bmte.2000.45.11.304.
25. Glaser C, Burgkart R, Kutschera A, Englmeier KH, Reiser M, Eckstein F.Femoro-tibial cartilage metrics from coronal MR image data: technique,test-retest reproducibility, and findings in osteoarthritis. Magn ResonMed. 2003;50(6):1229-36, http://dx.doi.org/10.1002/mrm.10648.
26. Cicuttini FM, Wluka AE, Wang Y, Stuckey SL. Longitudinal study ofchanges in tibial and femoral cartilage in knee osteoarthritis. ArthritisRheum. 2004;50(1):94-7, http://dx.doi.org/10.1002/art.11483.
27. Keshava SN, Gibikote SV, Mohanta A, Poonnoose P, Rayner T, Hillard P,et al. Ultrasound and magnetic resonance imaging of healthy paediatricankles and knees: a baseline for comparison with haemophilic joints.Hemophilia. 2015;21(3):e210-22, http://dx.doi.org/10.1111/hae.12614.
28. Crema MD, Roemer FW, Marra MD, Burstein D, Gold GE, Eckstein F,et al. Articular cartilage in the knee: current MR imaging techniquesand applications in clinical practice and research. Radiographics. 2011;31(1):37-62, http://dx.doi.org/10.1148/rg.311105084.
29. Laor T, Chung T, Hoffer FA, Jaramillo D. Musculoskeletal magneticresonance imaging: how we do it. Pediatr Radiol. 1996;26(10):695-700,http://dx.doi.org/10.1007/BF01383382.
30. Greenspan P. Orthopedic imaging: a practical approach, 5th edn.Philadelphia: Lippincott Williams & Wilkins; 2011.
31. Eckstein F, Cicuttini F, Raynauld JP, Waterton JC, Peterfy C. Magneticresonance imaging (MRI) of articular cartilage in knee osteoarthritis (OA):morphological assessment. Osteoarthritis Cartilage. 2006;14(Suppl A):A46-75, http://dx.doi.org/10.1016/j.joca.2006.02.026.
32. Gold GE, Burstein D, Dardzinski B, Lang P, Boada F, Mosher T. MRI ofarticular cartilage in OA: novel pulse sequences and compositional/functional markers. Osteoarthritis Cartilage. 2006;14(Suppl A):A76-86,http://dx.doi.org/10.1016/j.joca.2006.03.010.
33. Peterfy CG, Gold G, Eckstein F, Cicuttini F, Dardzinski B, Stevens R.MRI protocols for whole-organ assessment of the knee inosteoarthritis. Osteoarthritis Cartilage. 2006;14(Suppl A):A95-111,http://dx.doi.org/10.1016/j.joca.2006.02.029.
34. Eckstein F, Hudelmaier M, Wirth W, Kiefer B, Jackson R, Yu J, et al. Doubleecho steady state magnetic resonance imaging of knee articular cartilage at3 Tesla: a pilot study for the Osteoarthritis Initiative. Ann Rheum Dis. 2006;65(4):433-41, http://dx.doi.org/10.1136/ard.2005.039370.
35. Wirth W, Nevitt M, Hellio Le Graverand MP, Benichou O, Dreher D, DaviesRY, et al. Sensitivity to change of cartilage morphometry using coronalFLASH, sagittal DESS, and coronal MPR DESS protocols-comparative datafrom the Osteoarthritis Initiative (OAI). Osteoarthritis Cartilage. 2010;18(4):547-54, http://dx.doi.org/10.1016/j.joca.2009.12.003.
36. Hardy PA, Recht MP, Piraino D, Thomasson D. Optimization of a dual echoin the steady state (DESS) free-precession sequence for imaging cartilage.J Magn Reson Imaging. 1996;6(2):329-35, http://dx.doi.org/10.1002/jmri.1880060212.
37. Eckstein F, Kunz M, Hudelmaier M, Jackson R, Yu J, Eaton CB, et al.Impact of coil design on the contrast-to-noise ratio, precision, and con-sistency of quantitative cartilage morphometry at 3 Tesla: a pilot studyfor the osteoarthritis initiative. Magn Reson Med. 2007;57(2):448-54,http://dx.doi.org/10.1002/mrm.21146.
38. Eckstein F, Kunz M, Schutzer M, Hudelmaier M, Jackson RD, Yu J, et al. Twoyear longitudinal change and test-retest-precision of knee cartilage mor-phology in a pilot study for the osteoarthritis initiative. Osteoarthritis Carti-lage. 2007;15(11):1326-32, http://dx.doi.org/10.1016/j.joca.2007.04.007.
39. Eckstein F, Wirth W. Quantitative cartilage imaging in knee osteoarthritis.Arthritis. 2011. Available from PubMed: http://www.ncbi.nlm.nih.gov/pubmed/22046518. http://dx.doi.org/10.1155/2011/475684.
40. Hargreaves BA, Gold GE, Lang PK, Conolly SM, Pauly JM, Bergman G,et al. MR imaging of articular cartilage using driven equilibrium.
410
Accuracy of MRI Cartilage MeasurementsMcKinney JR et al.
CLINICS 2016;71(7):404-411
Magn Reson Med. 1999;42(4):695-703, http://dx.doi.org/10.1002/(SICI)1522-2594(199910)42:4o695::AID-MRM1143.0.CO;2-Z.
41. Carballido J, Eckstein F. Quantitative morphological imaging ofthe knee joint. In: Majumdar S (ed) Advances in MRI of the kneefor osteoarthritis. Singapore: World Scientific Publishing Co. Pte. Ltd.;2010. p. 143-184.
42. Barnett AG, van der Pols JC, Dobson AJ. Regression to the mean:what it is and how to deal with it. Int J Epidemiol. 2005;34(1):215-20,http://dx.doi.org/10.1093/ije/dyh299.
43. Ruxton GD. The unequal variance t-test is an underused alternativeto Student’s t-test and the Mann–Whitney U test. Behav Ecol. 2006;17(4):688-90, http://dx.doi.org/10.1093/beheco/ark016.
411
CLINICS 2016;71(7):404-411 Accuracy of MRI Cartilage MeasurementsMcKinney JR et al.