Embed Size (px)
Citation preview

1
14 September 2021 accesso® Technology Group plc
(“accesso” or the “Group”)
INTERIM RESULTS
for the six-month period ended 30 June 2021 accesso Technology Group plc (AIM: ACSO), the premier technology solutions provider to leisure, entertainment and cultural markets, today announces interim results for the six months ended 30 June 2021 (‘H1 2021’). Commenting on the results, Steve Brown, Chief Executive Officer of accesso, said: “Despite the challenges of the past 18 months, these results show Accesso is squarely back on track. Our customers, staff and shareholders have stood firmly behind us during an incredibly turbulent time. We have remained steadfast in supporting our clients’ evolving needs; we have used the opportunity to further sharpen our strategic focus; and we have started to capture a sharp uptick in demand as our customers look to expand their use of revenue-generating technology. As a result, our financial performance during the first half of 2021 exceeded our previous expectations. Our revenue growth was extremely strong, and our Cash EBITDA result is significantly ahead of our initial expectations. With robust demand continuing into the start of the second half we are anticipating full year revenue of not less than 2019 levels alongside significantly improved profitability”.
Six months ended
30 June 2021 Six months ended
30 June 2020
% change Six months ended
30 June 2019
% change
Unaudited
($m) Unaudited
($m)
Unaudited
($m)
Group Revenue 50.7 24.6 106.1% 50.7 (0.1%)
Ticketing and distribution 31.7
16.8
88.7% 35.8
(11.5%)
Guest Experience 19.0 7.8 143.9% 14.9 27.3%
Cash EBITDA 9.8 (10.4) 194.7% 1.0 881.9%
Statutory profit/(loss) before tax 0.9 (18.5)
104.6% (4.6)
118.5%
Net cash / (net debt) 33.2 30.8 7.5% (15.2) 318.1%
Adjusted basic EPS (cents) 6.39 (37.94)
116.8% 14.21
(55.1%)
Basic earnings per share (cents) 1.91 (53.17)
103.6% (12.04)
115.8%
Footnotes: (1) Cash EBITDA: operating profit before the deduction of amortisation, depreciation, acquisition costs, deferred and contingent payments, and costs related to share-based payments less capitalised development costs paid in cash as per the consolidated cash flow statement (as detailed below and in note 5 to the Interim Financial Information)
(2) Net cash is calculated as cash and cash equivalents less borrowings. (3) Adjusted basic earnings per share is calculated after adjusting operating profit for impairment of intangible assets, amortisation on acquired intangibles, deferred and contingent consideration linked to continued employment, acquisition and aborted sale expenses, finance charges relating to deferred and contingent liabilities and share-based payments, net of tax at the effective rate for the period on the taxable adjusted items (as detailed in note 6 to the Interim Financial Information) (4) H1 2019 is included as a comparative period due to the exceptional impact of COVID-19 on the H1 2020 results. H1 2019 represents a period without disruption from COVID-19.
First half highlights
• Outstanding financial performance: A refreshed and refocused accesso drove revenue back to H1 2019 levels faster than expected. We captured exceptional demand across the product portfolio and saw record transactional volumes in our key markets. Cash EBITDA of $9.8m represents significant growth on 2019 resulting from higher margin revenue growth, as well as a more effective operating structure and temporarily lower costs.
• Innovative technology set enabling customer recovery: Virtual Queuing uptake drove Guest Experience revenue above H1 2019 levels, leading to record results. Demand for contactless technology and online

2
transactions supported strong eCommerce growth in key markets with transaction volumes significantly ahead of H1 2019.
• Change in customer attitudes to technology adoption: eCommerce is now seen as critical to operator success, with 36 venues signing on for online ticketing solutions in H1 2021 compared to 16 during H1 2020. The number of customers adopting multiple accesso technologies rose to 55 from 50 in the first half.
• Results benefit from rightsized and realigned operational platform: Cost action and structural realignment taken by new management team is now enabling enhanced strategic focus as well as more profitable and cash generative performance. High demand in the labour market slowed hiring for open positions and resulted in lower than anticipated staffing costs in the period.
• New debt facility committed by the Group on 19 March 2021 with Investec Bank PLC, all bank loan borrowings with Lloyds Bank PLC were settled and the Group now has access to an unutilised £18m revolving facility with a term of 3 years to March 2024.
Outlook & Guidance
• Performance trend set to continue: Key regions are now open and delivering excellent performance. As announced in our 8th September trading update, our performance during the key months of July, August, and through the Labor Day holiday period has been particularly strong and underpins our confidence in exceeding previous expectations for the full year. accesso Passport® and accesso LoQueue® delivered combined revenue growth of 50.9% in July 2021 against July 2019.
• Continued return to normal operating cost level: Profitability has increased more quickly than previously expected due to a lag in our return to normal operating cost levels and the recovery of our high margin products outpacing those with lower margins. As the Group continues to scale to address the greater revenue opportunity created by the uptick in technology demand, underlying administrative expenses are expected to rise in the region of 8-12% on an annualised basis in 2022. In FY22 we also expect a return towards our historic product mix.
• COVID-19 assumptions: We expect travel and tourism to remain somewhat restricted through H2, with capacity restrictions and reservation requirements remaining in place in certain regions, especially in APAC. Whilst our full year revenue expectations assume trends for the balance of year remain consistent with those underpinning our recent trading levels, the impact of new variants on client operations is unpredictable and we continue to monitor potential changes in our operating environment.
• Guidance: Provided we see no material impact from an escalation in COVID-19 restrictions in North America or other key markets, we expect 2021 full year revenue of not less than $117M which represents full recovery to 2019 trading performance. With continued strong demand across the business, we expect Cash EBITDA to be significantly ahead of market expectations for both the half and the full year. The Group is currently deploying additional resources across technology implementation, product development and customer support to calibrate for the new demand. As previously signaled, these investments will have a limited impact on Cash EBITDA in 2021; their full annualised effect will be felt in the 2022 financial year.
The information contained within this announcement is deemed to constitute inside information as stipulated under the Market Abuse Regulations (EU) No. 596/2014 (“MAR”). Upon the publication of this
announcement, this inside information is now considered to be in the public domain
The Company will be hosting a webcast presentation for analysts at 1pm. Analysts and institutional investors are also able to request a copy of the presentation and audio webcast conference details by
contacting [email protected]. A copy of the presentation made to analysts will be available for download from the Group’s website, shortly after the conclusion of the meeting.

3
For further information, please contact: accesso Technology Group plc +44 (0)118 934 7400 Steve Brown, Chief Executive Officer Fern MacDonald, Chief Financial Officer Numis Securities Limited +44 (0)20 7260 1000 Simon Willis, Hugo Rubinstein, Mark Lander FTI Consulting +44 (0) 203 727 1000 Matt Dixon, Adam Davidson, Chris Birt About accesso Technology Group At accesso, we believe technology has the power to redefine the guest experience. Our patented and award-winning solutions drive increased revenue for attraction operators while improving the guest experience. Currently serving over 1,000 clients in more than 30 countries around the globe, accesso's solutions help our clients streamline operations, generate increased revenues, improve guest satisfaction and harness the power of data to educate business and marketing decisions. accesso stands as the leading technology provider of choice for tomorrow's attractions, venues and institutions. We invest heavily in research and development because our industries demand it, our clients benefit from it and it makes a positive impact on the guest experience. Our innovative technology solutions allow venues to increase the volume and range of on-site spending and to drive increased transaction-based revenue through cutting edge ticketing, point-of-sale, virtual queuing, distribution and experience management software. Furthermore, COVID-19 has highlighted the benefits our technology is able to bring to venues from facilitating social distancing using our robust and sophisticated virtual queuing solutions; reservation systems delivered through our agile eCommerce platform to enable capacity management, taking queues away from front gates; and attraction eateries utilising our contactless food and beverage offerings. Many of our team members come from backgrounds working within the attractions and cultural industry. In this way, we are experienced operators who run a technology company serving attractions operators, versus a technology company that happens to serve the market. Our staff understand the day-to-day operations of managing complex venues and the challenges this creates, and together we strive to provide our clients and their guests with technology that empowers them to do more and enjoy more. From our agile development team to our dedicated client service specialists, every team member knows that their passion, integrity, commitment, teamwork and innovation are what drive our success. accesso is a public company, listed on AIM: a market operated by the London Stock Exchange. For more information visit www.accesso.com. Follow accesso on Twitter, LinkedIn and Facebook. Chief Executive’s Review
A period of recovery for an industry transformed In the first half of 2021 our industry has started to recover following the challenge and disruption of last year. We have been grateful to see many of our markets reopen and our customers’ guests return to their attractions. Most venues are still restricted in one way or another, but their gates are open, and their businesses have come back to life. For accesso, this has meant a return to meaningful trading and a revitalisation of our people and teams. I am immensely proud of the energy and commitment our people have shown in delivering work of the highest quality and creativity for our customers. They have bought in wholeheartedly to a reorganisation which has enabled us to benefit from the near-term snap-back of customer demand and ensured accesso is best positioned to keep growing sustainably into the future. The efforts have brought our first half revenues back into line with

4
pre-pandemic levels much faster than expected and reinforced some of our strongest customer relationships at the same time. Having adapted their attractions to facilitate online reservations, contactless transactions and social distancing, many of these customers are now also looking at the depth and breadth of their technology footprints with fresh eyes. As has been the case in many industries, the pandemic has accelerated a gathering trend in the leisure and entertainment space towards digital transformation, and in our case, has helped showcase the benefits of technology when it comes to operating seamless, efficient attractions which deliver great guest experiences. While we expect revenue from some recent growth areas like online reservation to gradually recede as normal conditions return, we believe the overall shift towards greater technology adoption is irreversible. Our view of market conditions so far in 2021 Since the start of 2021 we have seen the continued reopening of attractions and the partial easing of capacity restrictions in many of our key markets. While we still await the end of Government mandated lockdowns in the Asia-Pacific region and the return of the live entertainment segment globally, most of the North American and European markets are now open for business. This uptick in activity saw us sign with 18 new venues over the first half. The reopening of our key markets has allowed visitors to return and operators have been working to reduce their cost-to-serve. Although certain segments of attraction visitors, such as group outings and corporate events, have not regained momentum, we observe most venues reaching approximately 85% of 2019 volumes. With capacity and social contact restrictions still in place, they have moved quickly towards eCommerce and virtual queueing solutions which led overall demand for our services to surge well beyond historic levels. accesso Passport enabled the sale of 56.4m tickets and reservations, up 76.1% on H1 2019, and accesso LoQueue assisted 1.2m guests with its queuing technology, up 60.5% on H1 2019. Through July and August, we have seen these trends continue with the ongoing easing of restrictions providing a boost to already strong trading. Our online reservation revenues have been very strong, and we have continued to see record demand for our virtual queuing technology. Our accesso Passport and accesso LoQueue solutions delivered revenue up 50.9% in July 2021 against July 2019. An operational footprint to power our future growth In the early stages of the pandemic, we acted quickly to right size our operational footprint to ensure the resilience of our business through an uncertain period. This meant introducing shorter working weeks for many of our staff and making significant cost reductions across the board. We also used the temporary pause in trading activity to realign our business, remove duplication, increase accountability, and deploy resources more effectively in support of future growth. We are now seeing the benefit of this action. Our decision to create a single group for all software engineers working on our various eCommerce solutions is now delivering more orchestrated and efficient results, and the alignment of our operational teams with key market segments like the Ski industry has seen us deliver 11 expansions with existing accesso Passport customers in the first half. In this way our technology is helping both drive and facilitate the market trend towards eCommerce, with venues eager to push customers towards online activity that helps them manage COVID-19 restrictions and allows for more effective management of labour and resources. We have also improved our operational processes to help us benefit from this more considered organisational structure, introducing a single collaboration system and redesigning how customer system enhancement requests move through our workflow. As we indicated in our 2020 preliminary results, this process has transformed accesso from a company operating in multiple product silos to a business with a single operational platform. We are now seeing results from the programmes we have implemented to help us support our customers in a more connected way. For example, during H1 we have made it easier for an important multi-site customer to transact with its guests by rolling out Apple Pay and Google Pay across its global estate. In recent months, the combination of eased pandemic restrictions and the overall shift in customer technology preferences has enabled us to start the process of rescaling our employee base to meet a significantly expanded opportunity. Importantly, we are not simply throwing people at this new demand. We have continued with the
5
strategic deployment of resources in the areas of greatest opportunity, investing in technology implementation, product development and customer support to ensure we maintain a sustainable operating footprint commensurate with the opportunity ahead of us. As noted in our July 2021 trading statement, the full annualised effect of these investments will be felt in the 2022 financial year, where we will also see less of a benefit from overall pandemic related cost reductions such as travel and office expenses. Technology innovation enabling the new paradigm for our customers During 2021 we have continued to build on our existing product set to help customers navigate the evolving demands of their guests. Our new Head of Product is overseeing these efforts and we have seen a number of important product-led developments impact our results. The strength of our virtual queueing proposition continues to validate the work undertaken in recent years to
improve and modernise our technology in this area. We have seen excellent progress with Qsmart®, the mobile
instance of our virtual queuing product, which is now widely deployed parks alongside the accesso Prism wearable device with our largest North American customer across nine of its theme parks. Qsmart has seen high adoption rates which have now reached 37%, with the ability to access queuing technology via mobile dramatically enhancing its potential reach and significantly increasing its ease-of-use for the visitor. It also more easily allows us to include additional and customisable capability including payments, and it reduces the operational cost of providing and maintaining Prism bands which were previously used to deliver the service. Parc Asterix, a new customer signed for 100% virtual queuing in 2020, has now transitioned to a paid premium service for 2021. We continue to make progress in developing our contactless solutions which are helping venues facilitate social distancing while also reducing overall costs. A major part of this story is the growth in our mobile Food and Beverage proposition, which has continued to gain traction with our client base in the first half of the year. Our growth in this area is an important component of the progress we’re making in eCommerce overall, with growth in ticketing supplementing new revenue from our online reservation capability. While the portion of this revenue coming from guests with season passes won’t repeat in post-pandemic conditions, our success demonstrates how quickly we are able to adapt our product set and move quickly to help customers capitalise on new opportunities. Part of our strategic focus remains on delivering innovation that supports cross-selling across our product set. During the first half we have added an API Gateway between accesso Siriusware and accesso Passport which has dramatically increased data throughput to support the high volume of eCommerce demand between the products. All of our combination clients now either have or are actively involved in adding this capability to the services they take from us. Our development team is also in the process of building a ground-up accesso Siriusware API designed to optimise client performance and prepare the ground for future integration needs. Innovation like this enables us to continue to drive multi value adding accesso solutions across our customer base. Starting and ending with our people Our people remain at the core of our business which has never been more evident than the past 18 months where their unwavering commitment, determination and collective qualities is what has made this period a much-welcomed success. In recognition of their efforts, we granted long term equity incentive awards to our senior leaders during the half with conditions over continued employment, share price and cash EBITDA performance. In August 2021, we also granted share awards to all other staff which will vest with continued employment. Providing our people with an opportunity to participate in our equity and aligning their goals with our success continues to be a key component of our employment proposition. Outlook and Guidance The start we have made to the second half of the year indicates we will finish 2021 strongly. Apart from the APAC region which continues to experience a high level of government restrictions, our key regions are delivering very strong results. We are also involved in a range of promising new business conversations which give us confidence in our ability to deliver well over the remainder of the year.

6
We expect travel and tourism to remain restricted through the second half and into 2022 and this will have some financial impact on our business. Our guidance assumes these restrictions are relatively light in Europe and North America and is contingent on there being no return of full lockdown conditions given the progress of the ongoing vaccination programmes in these markets. Provided we see no material impact from an escalation in COVID-19 restrictions in North America or other key markets, we expect H2 2021 revenue performance to be at least in line with 2019 levels. With continued strong demand across the business, we expect another period of strong Cash EBITDA performance for H2 2021 and full year revenues of not less than 2019 levels. As set out in our trading update on 8 September, the rapid growth in revenue alongside a slower return to normal operating expenses will result in Cash EBITDA being significantly ahead of current market expectations for both the half and the full year. The Group is currently deploying additional resources across technology implementation, product development and customer support to calibrate for the new demand. As previously signaled, these investments will have a limited impact on Cash EBITDA in 2021; their full annualised effect will be felt in the 2022 financial year. Financial Review In the first half of 2021 the Group delivered record financial performance in our key metric of Cash EBITDA as COVID-19 restrictions began to ease in our key markets. Our revenue performance was also well ahead of our initial expectations. The cost actions and structural realignment taken during 2020 has allowed the group to be more profitable and cash generative, whilst acknowledging we have open positions to fill as revenue activity continues to scale. Our customer venues did begin to reopen at full scale during early parts of H1 2021 and we have been able to benefit from latent consumer demand through our key geographies and markets and the deeper customer relationships we worked hard to build throughout the pandemic. We have assessed the performance of H1 2021 against H1 2019 due to the impact of the COVID 19 on H1 2020. Whilst we provide H1 2020 comparators in the tables presented below we draw more meaningful and valuable analysis against H1 2019. Key performance indicators and alternative performance measures The Group uses key performance indicators to measure and control both financial and operational performance. Ticket volumes, revenues, margins, costs, cash and sales pipeline are trended to ensure plans are on track and corrective actions taken, where necessary. See below for a discussion of the metrics, their definitions and reconciliation to IFRS statutory measures. Product development performance is also monitored and tracked through measurement against agreed milestones. In addition, further key performance indicators include the proportion of business that is delivered via mobile technology and the sales mix of services offered. The Board utilises consistent alternative performance measures (“APMs”) in evaluating and presenting the results of the business, including Cash EBITDA, adjusted basic earnings per share, net cash, underlying administrative expenditure and repeatable and non-repeatable revenue analysis. The Board views these APMs as more representative of the Group’s performance as they remove certain items which are not reflective of the underlying business, including acquisition expenses, amortisation related to acquired intangibles, deferred and contingent payments related to acquisitions, changes to earn-out considerations and share-based payments. The APMs help ensure the Group is focused on translating sales growth into profit. By making these adjustments, the Group is more readily comparable to a business that does not have the same acquisition history and share-based payment policy. Additionally, these are the measures commonly used by the Group’s investor base. These APMs are reconciled to the statutory numbers in notes 5 and 6 to the Interim Financial Information.

7
Key Financial Metrics Group revenue for the first half of 2021 was $50.7m (H1 2020: $24.6m; H1 2019: $50.7m), in line with H1 2019 and 106.1% up on H1 2020. Ticketing and Distribution revenue was 11.5% below H1 2019 due primarily to revenue reductions experienced in the lower margin live entertainment area. The UK theatre sector was significantly impacted by restrictions throughout the period and globally our live entertainment and distribution business was $9.1m down on H1 2019. Excluding the Live Entertainment segment, our Ticketing Distribution segment was $4.8m up on H1 2019. Despite this revenue reduction, the Ticketing and Distribution segment still delivered excellent gross profit performance, primarily due to an excellent period for accesso Passport, one of the Group’s higher margin transactional revenue streams which delivered a $6.3m revenue increase on H1 2019, representing a 40.6% gain. Guest Experience delivered revenue growth of 27.3% on H1 2019 as accesso LoQueue’s transactional-based queuing products saw a period of significant demand. They also saw higher customer penetration at venues with 7.0% of all guests using one of our queueing products compared with 3.1% in H1 2019. Alongside this The Experience EngineTM (TE2) business delivered a solid result in excess of H1 2019 due to continued confidence in bespoke professional technology offerings, with large customers in the ski, theme parks and cruise ship markets using our services. This impressive revenue performance enabled Guest Experience and Ticketing and Distribution to deliver absolute gross profit increases of 69.8% and 4.1% to $13.0m and $28.0m respectively when compared to H1 2019. Whilst COVID-19 remained a top priority for all of our customers and mandated capacity restrictions remain in place, the financial impact in H1 2021 was more limited than in H1 2020, and in some instances encouraged our customers to harness the use of our technologies to address challenges such as capacity restrictions, removing physical queues, touchless technologies and eCommerce. Our USA and Canadian revenue benefited from an excellent start to the year in the ski market with the regions experiencing fewer restrictions. Providing existing ski customers with an eCommerce solution has been a key success in the half with 11 customers adopting accesso Passport eCommerce to excellent mutual benefit. We have experienced an increasing appetite in the ski market for eCommerce and currently provide 28% of our ski customers with accesso Passport. The adoption of our eCommerce solution has helped drive incremental revenues to our Ticketing and Distribution segment and providing our remaining ski customers with eCommerce is a medium-term strategy of the Group. Apart from the state of California which only reopened outdoor attractions from 30 April 2021, large parts of the USA’s non-ski market was also open during much of H1 2021. Our results show they experienced significant levels of pent-up demand, delivering an extremely successful period of trading. Our live entertainment customers in the USA have shown encouraging volumes from June 2021 onwards with volumes in line with 2019 for comparative months. We have also managed to go live with 23 accesso ShoWareSM new customers, compared to 11 during H1 2020. In the UK, outdoor attractions reopened from April 2021 and demonstrated encouraging transactional volumes during the second quarter. Live entertainment remained closed for the majority of H1 2021, opening with partial capacities from May 2021 and then at full capacities from July 2021. These conditions resulted in a significant revenue reduction of $7.1m on H1 2019. Other European countries mandated further countrywide closures during April and May 2021 while Central and South America experienced a number of restrictions throughout the first half which significantly hampered their ability to trade. Australia and South Pacific started 2021 with excellent volumes delivering $2.4m of revenue in the first half, up from $0.9m in H1 2019. The region saw excellent performance from accesso LoQueue, accesso Passport and TE2, although from July 2021 it has seen a return to statewide lockdowns, impacting our transactional volumes. Importantly, we are now in our off-peak season for the region and the impact is therefore immaterial on our Group revenues. Revenue on a segmental and geographical basis was as follows:

8
Six months ended 30
June 2021
Unaudited
Six months ended 30
June 2020
Unaudited
Six months ended 30
June 2019
Unaudited
$000 $000 $000
Ticketing and Distribution 31,716 16,806 35,835 Guest Experience 18,938 7,766 14,877
Total revenue 50,654 24,572 50,712
$000
$000
$000 United Kingdom 4,947 2,330 12,001 Other Europe 659 484 1,610 Australia/South Pacific 2,418 990 1,502 USA and Canada 42,318 20,098 33,598 Central and South America 312 670 2,001 Total revenue 50,654 24,572 50,712
Revenue quality The following is an analysis of the Group’s revenue visibility. Transactional revenue consisting of Virtual Queuing, Ticketing and eCommerce is defined as revenue earned as either a fixed amount per sale of an item, such as a ticket sold by a customer or as a percentage of revenue generated by a venue operator. Normally this revenue is repeatable where a multi-year agreement exists and purchasing patterns by venue guests do not significantly change, as they did in 2020 as a result of the pandemic. Other repeatable revenue is defined as revenue, excluding transactional revenue, that is expected to be earned through each year of a customer’s agreement, without the need for additional sales activity, such as maintenance and support revenue. Non-repeatable revenue is revenue that occurs one-time (e.g., up-front licence fees) or is not repeatable based upon the current agreement (e.g., billable professional services hours) and is unlikely to be repeatable without additional successful sales execution by accesso. Other revenue consists of hardware sales and other revenue that may or may not be repeatable with limited sales activity if customer behaviour remains consistent. The Group’s transactional revenue stream has rebounded better than anticipated during H1 2021 to $35.6m, down only 2.2% on a normal period of trade represented by H1 2019. In certain markets, such as the USA, where restrictions in our key states were largely removed, we have significantly outperformed H1 2019. This validates that this revenue is typically repeatable in nature when trading conditions are less impacted by government mandated restrictions. We have also gained from latent demand and a shift in consumers behaviour to purchasing online, something our attraction operators have welcomed as it facilitates the ability to manage and monitor capacities. During the period we have derived transactional revenue of $2.6m from online reservation fees which we do not expect to recur at the same level in future periods. Professional services revenue grew strongly on both H1 2019 and H1 2020, a credit to our exceptional team which continued to deliver excellent bespoke technology solutions to the ski, cruise and attractions markets. As a byproduct of this bespoke development work, we have also gained traction in repeatable platform fees for hosting mobile apps which has grown on H1 2019 and H1 2020 to $1.3m for the period. We have seen increased demand for touchless technology such as our mobile food and beverage apps which both reduce physical contact points and help our attraction operators to remove labour costs.

9
The period also benefited from $2.1m of hardware sales following a $1.4m sale of Prism 2 wristbands which helped us deliver accesso LoQueue transactional revenue. Hardware sales also include equipment related to the addition of 6 new implementations for attractions utilising our accesso Siriusware point of sale systems.
The Group’s reported gross profit margin was 80.6% in H1 2021 which is comparable with H1 2020 at 81.8%. Our gross margin in H1 2019 was 74.9%. This 5.7% gross margin increase primarily results from a change in sales mix compared with H1 2019. Our lower margin distribution business is now a smaller portion of our revenue while higher margin streams such as virtual queuing, ticketing and eCommerce, maintenance and support and platform fees are proportionately greater. Administrative expenses Reported administrative expenses increased 0.9% to $39.2m in H1 2021 (H1 2020: $38.8m) but remained 6.8% lower than H1 2019, reflecting the Group’s ongoing efforts to control its cost footprint as well as the significant number of open positions during the first half of the year. The Group continued to benefit from the cost reductions implemented during H1 2020 but also experienced COVID-19 related impacts such as spend on office related costs, travel, marketing and tradeshows remaining lower than normal due to our workforce being remote for the majority of H1 2021 and continued restrictions across the Group’s key markets. Share-based payment costs have increased on H1 2020 to $1.1m, reflective of key management incentive arrangements being granted in January and September 2020. Underlying administrative expenditure increased by 10.7% to $31.8m on H1 2020 due to the cost reduction plans implemented following the onset of the pandemic in April 2020 and a return of staff to full work schedules during the period to capture the available revenue opportunities presented in H1 2021. Costs have been further increased due to the employment market conditions which have led to an increase in salaries in order to recruit and retain staff; these conditions also resulting in offsetting delays in hiring. During the period the Group also took action to rationalise its property leases and exited properties in San Diego, London, Sydney and Belfast which on an annual basis will save the Group $0.5m in property lease payments.
Six months ended 30
June 2021 Unaudited
Six months ended 30
June 2020 Unaudited
Six months ended 30
June 2019 Unaudited
$000
$000 % $000
%
Virtual queuing 10,152 2,270 347.1% 8,912 13.9% Ticketing and eCommerce 22,815 9,681 135.7% 27,458 (16.9%) Reservation fees 2,614 121 2,060.3% - -
Transactional revenue 35,581 12,072 194.7% 36,370 (2.2%) Maintenance and support 3,640 3,967 (8.2%) 4,511 (19.3%) Platform fees 1,256 1,079 16.4% 578 117.5% Total Repeatable 40,477 17,118 136.5% 41,459 (2.4%)
Licence revenue 913 1,253 (27.1%) 1,777 (48.6%) Professional services 6,752 5,155 31.0% 6,116 10.4%
Non-repeatable revenue 7,665 6,408 19.6% 7,893 (2.9%)
Hardware 2,088 524 298.6% 1,004 107.9% Other 424 522 (18.8%) 356 19.1% Other revenue 2,512 1,046 140.0% 1,360 84.7%
Total revenue 50,654 24,572 106.1% 50,712 (0.1%)
Total Repeatable as % of total 79.9% 69.7% 81.8%

10
No government assistance has been received during or since the end of H1 2021.
Six months ended 30
June 2021
Six months ended 30
June 2020
Six months ended 30
June 2019
Unaudited Unaudited Unaudited $000 $000 $000
Administrative expenses as reported 39,163 38,804 42,034 Capitalised development expenditure (1) 669 3,010 10,040 Deferred equity settled acquisition consideration - (138) (1,076) Amortisation related to acquired intangibles (1,253) (1,505) (5,812) Share-based payments (1,076) (333) (1,080) Amortisation and depreciation (2) (6,504) (7,565) (7,120) Property lease payments not in administrative expense 785 820 686 Impairment of intangible assets - (1,360) - Costs related to formal sale process - (446) - Professional service cost (3) - (2,585) (3,349) Underlying administrative expenditure 31,784 28,702 34,323
(1) See consolidated cash flow statement. (2) This excludes acquired intangibles but includes depreciation on right of use assets. (3) Professional service costs incurred in the delivery of professional services revenue adjusted in H1 2019 to be comparable with H1
2021 and H1 2020.
Cash EBITDA
The Group delivered record Cash EBITDA for the period of $9.8m, an $8.8m increase from $1.0m recorded in H1 2019. This $8.8m increase is a combined result of our higher margin sales; improved productivity and efficiencies from the structural realignments implemented during 2020; and lower than normal headcount during the period where revenues recovered quicker than the Group could fill positions, made more challenging by an extremely competitive job market in our key regions. Since the end of the half, we have secured a number of key positions however still have some way to go to reach optimal headcount levels. The table below sets out a reconciliation between statutory operating profit/(loss) and cash EBITDA:
Six months ended 30 June
2021
Six months ended 30
June 2020
Six months ended 30 June
2019
Unaudited Unaudited Unaudited $000 $000 $000
Operating profit/(loss) 1,655 (18,706) (4,043)
Add: Aborted sale process - 446 -
Add: Deferred equity settled acquisition consideration
- 138 1,076
Add: Amortisation related to acquired intangibles 1,253 1,505 5,812
Add: Share-based payments 1,076 333 1,080
Add: Impairment of intangible assets - 1,360 -
Add: Amortisation and depreciation (excluding acquired intangibles)
6,504 7,565 7,120
Less: Capitalised internal development costs paid in cash
(669) (3,010) (10,040)
Cash EBITDA 9,819 (10,369) 1,005

11
The Group recorded an operating profit of $1.7m in H1 2021 (H1 2019 operating loss: $4.0m); and adjusted earnings per share in the first half of 2021 increased to 6.39 cents (H1 2020: Loss per share of 37.94 cents; H1 2019: earnings per share of 14.21 cents). Development expenditure
Six months ended 30
June 2021
Six months ended 30
June 2020
Six months ended 30
June 2019
Development expenditure by segment Unaudited Unaudited Unaudited
Ticketing and distribution 11,108 10,135 12,547
% of ticketing and distribution segment revenue 35.0% 60.3% 35.0% Guest Experience (1) 3,810 2,374 3,417 % of guest experience segment revenue 20.1% 30.6% 23.0%
Total development expenditure 14,918 12,509 15,964
% of total revenue 29.5% 50.9% 31.5%
(1) H1 2020 and H1 2019 have been adjusted to remove professional service costs incurred in the delivery of professional services revenue to be comparable with H1 2021.
2021 has been a tremendous period of innovation for accesso, with frontline and technical teams working at great pace to deliver solutions to enable business continuity for our customers throughout the COVID-19 pandemic. Total development expenditure for H1 2021 increased to $14.9m, 19.3% higher than H1 2020 due to the impact of 4-day working weeks and a reduction of 30 contractors in H1 2020. The 6.6% decrease relative to H1 2019, a more typical period, reflects that the business has not yet scaled back to its pre-pandemic cost base. The Group capitalises elements of development expenditure where it is appropriate and in accordance with IAS 38 Intangible Assets. Capitalised development expenditure of $0.7m (H1 2020: $3.0m), representing 4.5% (H1 2020: 24.1%) of total development expenditure. This material decrease in the proportion of development expenditure being capitalised is not a reflection of lesser importance of the work being undertaken. Development continues to expand the product set and add features that will be important for our customers’ operations in the future. Cash and net cash Net cash at the end of the period has increased to $33.2m from 31 December 2020.
30 June 2021
31 December 2020
$000 $000 Borrowings - (26,699) Less: Cash in hand & at bank 33,157 56,355
Net cash 33,157 29,656
This strong net cash position has benefited from cash generated from operating activities of $6.3m (H1 2020 Net outflow of $11.9m; H1 2019 outflow of $2.7m) delivered by a period of strong revenue performance in high margin accesso Passport and accesso LoQueue business, diligent working capital management and lower headcount. The Group continues to be cost conscious and as such maintained a low level of capital expenditure into property, plant and equipment of $0.2m (H1 2020: $0.3m, H1 2019: $1.4m). The Group's 31 December 2020 year end drawn borrowing facility of $26.7m was settled on 19 March 2021 following a successful refinancing of its lending facilities with Investec Bank plc at a total cost of $0.7m in fees

12
paid during H1 2021. The Group has a 3-year, £18m Coronavirus Large Interruption Scheme Loan revolving credit facility at a 3.75% margin with a commitment fee of 1.5% expiring in March 2024. Quarterly covenant tests are in place on minimum revenue and minimum liquidity for 2 years to December 2022. From March 2023 additional covenants are added for leverage and interest cover. No drawings have been made on this facility. Impairment In line with relevant accounting standards, the Group reviews the carrying value of all intangible assets on an annual basis or at the interim where indicators of impairment exist. No indicators of impairment were identified in respect of the intangible assets of the Group as at 30 June 2021 following a period of strong performance and expected future performance. Taxation The tax rate used by the Board on the half year to 30 June 2021 represents the actual effective tax rate for the period, this is a result of the unprecedented challenges presented by COVID-19 in reliably estimating annual effective rates. The actual effective tax rate on the statutory profit before tax for the half year is 8.4% (Year ended 31 December 2020: 9.2%). The year ended 31 December 2020 rate was reduced to 9.2% from the statutory tax rates due to $8.3m of unrecognised deferred tax asset on US losses, net of $0.4m of prior year items and $2.6m US carry forward credits, excluding these items the adjusted effective tax would have been 25%, reflective of the US tax rates where the majority of the Group’s earnings are derived. The actual effective rate for the period ended 30 June 2021 is reduced from statutory rates due to the combined impact of $0.2m of prior year over provisions and rate changes. At 30 June 21 the Group continues to apply a $10.7m restriction in recognition of the Group’s deferred tax asset on available losses in the US, due to the uncertainty of short-term profitability, the Group will revisit this restriction as at 31 December 2021 in light of current and projected performance.
– ENDS –

13
Consolidated statement of comprehensive income for the six-month period ended 30 June 2021
30 June 2021 Unaudited
30 June 2020 Unaudited
31 December 2020
Audited Notes $000 $000 $000
Revenue 50,654 24,572 56,094
Cost of sales (9,836) (4,474) (13,109)
Gross profit 40,818 20,098 42,985
Administrative expenses
(39,163) (38,804) (73,339)
Operating profit / (loss) before impairment of intangible assets
1,655 (17,346) (27,727)
Impairment of intangible assets - (1,360) (2,627)
Operating profit / (loss) 1,655 (18,706) (30,354)
Finance expense (809) (438) (2,518)
Finance income 12 666 10
Profit / (Loss) before tax 858 (18,478) (32,862)
Income tax (charge) / benefit 4 (72) 2,980 3,008
Profit / (Loss) for the period 786 (15,498) (29,854)
Other comprehensive income / (loss)
Items that will be reclassified to income statement
Exchange differences on translating foreign operations 1,151 (1,034) 4,910
Income tax credit on items recorded in other comprehensive income
193 - 1,129
1,344 (1,034) 6,039
Total comprehensive income / (loss) 2,130 (16,532) (23,815)
All loss and comprehensive loss is attributable to the owners of the parent
Earnings per share expressed in cents per share:
Basic 6 1.91 (53.17) (84.78)
Diluted 6 1.85 (53.17) (84.78)
All activities of the company are classified as continuing.

14
Consolidated statement of financial position as at 30 June 2021
30 June 2021 30 June 2020 31 December 2020 Unaudited Unaudited Audited $000 $000 $000
Assets Non-current assets Intangible assets 124,560 135,073 129,503
Property, plant and equipment 1,958 3,160 2,439
Right of use assets 3,611 4,666 4,166
Contract assets 266 1,843 1,109
Deferred tax 7,674 10,794 7,701
138,069 155,536 144,918
Current assets
Inventories 533 1,052 1,927
Contract assets 7,182 4,661 3,404
Trade and other receivables 19,889 8,616 15,968
Derivative financial asset - 645 -
Income tax receivable 2,299 105 1,858
Cash and cash equivalents 33,157 55,786 56,355
63,060 70,865 79,512
Liabilities
Current liabilities
Trade and other payables 23,429 12,813 17,328
Derivative financial liabilities - - 758
Lease liabilities 937 1,270 1,163
Contract liabilities 4,321 6,875 7,525
Corporation tax payable 94 1,318 667
28,781 22,276 27,441
Net current assets 34,279 48,589 52,071
Non-current liabilities
Deferred tax 6,871 9,880 7,580
Contract liabilities 1,084 1,672 1,303
Other non-current liabilities - 254 -
Lease liabilities 3,373 4,203 3,790
Borrowings - 24,937 26,699
11,328 40,946 39,372
Total liabilities 40,109 63,222 66,813
Net assets 161,020 163,179 157,617
Shareholders' equity
Called up share capital 595 595 595
Share premium 153,337 153,327 153,327
Own shares held in trust - (665) -
Retained earnings (13,622) (3,767) (15,864)
Merger reserve 19,641 19,641 19,641
Translation reserve 1,069 (5,952) (82)
Total shareholders' equity 161,020 163,179 157,617

15
Consolidated statement of cash flows for the six-month period ended 30 June 2021
30 June 2021 Unaudited
30 June 2020 Unaudited
31 December 2020 Audited
$000 $000 $000
Cash flows from operations
Profit/(loss) for the period 786 (15,498) (29,854)
Adjustments for:
Depreciation (excluding finance leased assets) 1,067 781 1,758
Depreciation on finance leased assets 558 982 1,461
Amortisation on acquired intangibles 1,253 1,505 2,573
Amortisation on development costs and other intangibles 4,879 5,802 11,446
Impairment of intangibles - 1,360 2,627
Loss on disposal of fixed assets - 6 22
Share-based payments 1,076 333 1,398
Deferred consideration charge (note 10) - 138 150
Finance expense 809 438 2,518
Finance income (12) (666) (10)
Foreign exchange loss/(gain) 317 131 1,308
Income tax credit 72 (2,980) (3,008)
RDEC tax credits - - (384)
Operating cashflow before movement in working capital 10,805 (7,668) (7,995)
Decrease/(increase) in inventories 918 (109) (923)
(Increase)/decrease in trade and other receivables (4,257) 14,836 6,658
Increase/(decrease) in trade and other payables 6,481 (18,470) (14,444)
(Increase)/decrease in contract assets/contract labilities (6,315) 2,244 4,847
Cash generated from/(used in) operations 7,632 (9,167) (11,857) Tax paid (1,375) (2,728) (2,657)
Net cash inflow /(outflow) from operating activities 6,257 (11,895) (14,514)
Cash flows from investing activities
Deferred consideration settlement (13) (269) (477)
Capitalised internal development costs (669) (3,010) (2,969)
Purchase of property, plant and equipment (227) (285) (437)
Interest received 11 5 6
Net cash used in investing activities (898) (3,559) (3,877)
Cash flows from financing activities
Share issue 11 48,215 48,215
Share issue costs - (2,123) (2,123)
Sale of shares held in trust - - 198
Interest paid (332) (170) (633)
Payments to finance lease creditors (785) (820) (1,622)
Net payments made to settle Forward FX contracts (409) - -
Capitalised arrangement fees (685) - -
Proceeds from borrowings - 10,115 10,116
Repayment of borrowings (27,033) - -
Net cash generated from financing activities (29,233) 55,217 54,151
(Decrease)/increase in cash and cash equivalents in the period (23,874) 39,763 35,760
Cash and cash equivalents at beginning of year 56,355 16,205 16,205
Exchange gain/(loss) on cash and cash equivalents 676 (182) 4,390
Cash and cash equivalents at end of period 33,157 55,786 56,355

16
Consolidated statement of changes in equity for the six-month period ended 30 June 2021
Share capital
Share premium
Retained earnings
Merger reserve
Own shares held in trust
Translation reserve
Total
$000 $000 $000 $000 $000 $000 $000
Balance at 31 December 2020 595 153,327 (15,864) 19,641 - (82) 157,617
Comprehensive loss for the period Profit for period - - 786 - - - 786 Other comprehensive income - - - - -
1,151 1,151
Income tax credit on items recorded in other comprehensive income - - 193 - - - 193
Total comprehensive income for the period - - 979 - - 1,151 2,130
Contributions by and distributions by owners Issue of share capital - 10 - - - - 10
Share-based payments - - 1,076 - - - 1,076 Share option tax charge - deferred - - 187 - - - 187
Total contributions by and distributions by owners - 10 1,263 - - - 1,273
Balance at 30 June 2021 595 153,337 (13,622) 19,641 - 1,069 161,020
Balance at 31 December 2019 427 107,403 11,331 19,641 (665) (4,918) 133,219
Comprehensive Income for the year
Loss for period - - (15,498) - - - (15,498) Other comprehensive income - - - - -
(1,034) (1,034)
Total comprehensive loss for the year - - (15,498) - - (1,034) (16,532)
Contributions by and distributions by owners Issue of share capital 168 48,047 - - - - 48,215 Transaction fees - (2,123) - - - - (2,123) Share-based payments - - 333 - - - 333 Equity-settled deferred consideration - - 138 - - - 138 Share option tax charge - deferred - - (71) - - - (71)
Total contributions by and distributions by owners 168 45,924 400 - - - 46,492
Balance at 30 June
2020 595 153,327 (3,767) 19,641 (665) (5,952) 163,179
17
Notes to the Interim Financial Information 1. Basis of preparation accesso Technology Group plc (the "Group") is a company domiciled in England. The basis of preparation of this financial information is consistent with the basis that will be adopted for the full year accounts. The interim financial information has been prepared in accordance with the recognition and measurement requirements of international accounting standards in conformity with the requirements of the Companies Act 2006 that are used for the annual financial statements. While the financial figures included in this half-yearly report have been computed in accordance with IFRS applicable to interim periods, this half-yearly report does not contain sufficient information to constitute an interim financial report as that term is defined in IAS 34. There are no changes to significant accounting policies. This interim financial information has neither been audited nor reviewed pursuant to guidance issued by the FRC and the financial information contained in this report does not constitute statutory accounts within the meaning of Section 434 of the Companies Act 2006. The comparative figures for the financial year ended 31 December 2020 are not the Company’s statutory accounts for that financial year. Those accounts have been reported on by the Company’s auditor and delivered to the registrar of companies. The report of the auditor was (i) unqualified, (ii) did not include a reference to any matters to which the auditor drew attention by way of emphasis without qualifying their report, and (iii) did not contain a statement under section 498 (2) or (3) of the Companies Act 2006. 1.1 Going concern
The directors, having reassessed the principal risks and uncertainties, consider it appropriate to adopt the going concern basis of accounting in the preparation of the Interim Financial Information. In reaching this conclusion, the directors noted the Group’s unutilised £18.0m/$24.8m revolving credit facility and net cash position of $45.8m as at 31 August 2021, providing total available liquidity to the Group of $70.6m as at 31 August 2021. The directors have three forecast scenarios, being a conservative base case, a severe but plausible downside case and a plausible upside case through to 31 December 2022. Actual results to date have been consistently trading ahead of all scenarios. In all scenarios modelled the Group maintains sufficient funding headroom and is in compliance with its debt covenants throughout the period of assessment. Consequently, the directors are satisfied that the Group's forecasts take into account reasonably possible changes in trading performance, including no anticipated breach of covenants and the ability to satisfy its liabilities as they fall due for a period of at least 15 months. Therefore there are no material uncertainties over going concern and the going concern basis of preparation continues to be appropriate. 2. Accounting policies The condensed consolidated interim financial information has been prepared using accounting policies consistent with those set out on pages 64 to 108 in the audited financial statements for the year ended 31 December 2020. These accounting policies have been applied consistently to all periods presented in this financial information. The policy for recognising and measuring income taxes in the interim period is described in Note 4.

18
3. Business segments and revenue analysis Segmental analysis The Group’s operating segments under IFRS have been determined with reference to the financial information presented to the Board of directors. The Board of the Group is considered the Chief Operating Decision Maker (“CODM”) as defined within IFRS 8, as it sets the strategic goals for the Group and monitors its operational performance against this strategy.
The Group’s Ticketing and Distribution operating segment comprises the following products:
• accesso Passport ticketing suite using our hosted proprietary technology offering to maximise up selling, cross selling and selling greater volumes.
• accesso Siriusware software solutions providing modules in ticketing & admissions, memberships, reservations, resource scheduling, retail, food service, gift cards, kiosks and eCommerce.
• The accesso ShoWare ticketing solution for box office, online, kiosk, mobile, call centre and social media sales. • Ingresso operate a consolidated distribution platform which connects venues and distributors, opening up a larger
global channel for clients to sell their event, theatre and attraction tickets. The Group’s virtual queuing solution (accesso LoQueue) and experience management platform (The Experience Engine ‘TE2’) are headed by segment managers who discuss the operating activities, financial results, forecasts and plans of their respective segments with the CODM. These two distinct operating segments share similar economic characteristics, customers and markets; the products are heavily bespoke, technology and software intensive in their delivery and are directly targeted at improving a guest’s experience of an attraction or entertainment venue, whilst providing cross-selling opportunities and increased revenues to the venues. Management therefore conclude that they meet the aggregation criteria. The Group’s Guest Experience operating segment comprises the following aggregated segments:
• accesso LoQueue providing leading edge virtual queuing solutions to take customers out of line, improve guest experience and increase revenue for theme parks
• The Experience Engine (“TE2”) experience management platform which delivers personalised real time immersive customer experiences at the right time elevating the guest’s experience and loyalty to the brand
The Group’s assets and liabilities are reviewed on a group basis and therefore segmental information is not provided for the statements of financial position of the segments. The CODM monitors the results of the operating segments prior to charges for interest, depreciation, tax, amortisation and non-recurring items but after the deduction of capitalised development costs. The Group has a significant amount of central unallocated costs which are not segment specific. These costs have therefore been excluded from segment profitability and presented as a separate line below segment profit.
The following is an analysis of the Group’s revenue and results from the continuing operations by reportable segment which represents revenue generated from external customers. During 2020 the Group structurally realigned their key functions of Operations, Engineering, Product, Human Resources, Finance, Administration, Commercial Sales and Marketing to have single teams spanning across the group and supporting the operating segments which has driven productivity and efficiency, from 1 January 2021 the Group no longer attribute their related costs to the segments for management reporting purposes. Consequently, our 30 June 2020 segment note has been restated to reflect a consistent presentation with 30 June 2021.
Six months
ended 30 June 2021
Six months ended 30 June
2020
Year ended 31 December 2020
Unaudited Unaudited Audited $000 $000 $000
Ticketing 31,716 16,806 37,966 Guest Experience 18,938 7,766 18,128
Total revenue 50,654 24,572 56,094
19
Ticketing
Guest Experience
Central unallocated
costs
Capitalised development
costs
Group
Period ended 30 June 2021 - Unaudited $000 $000 $000 $000
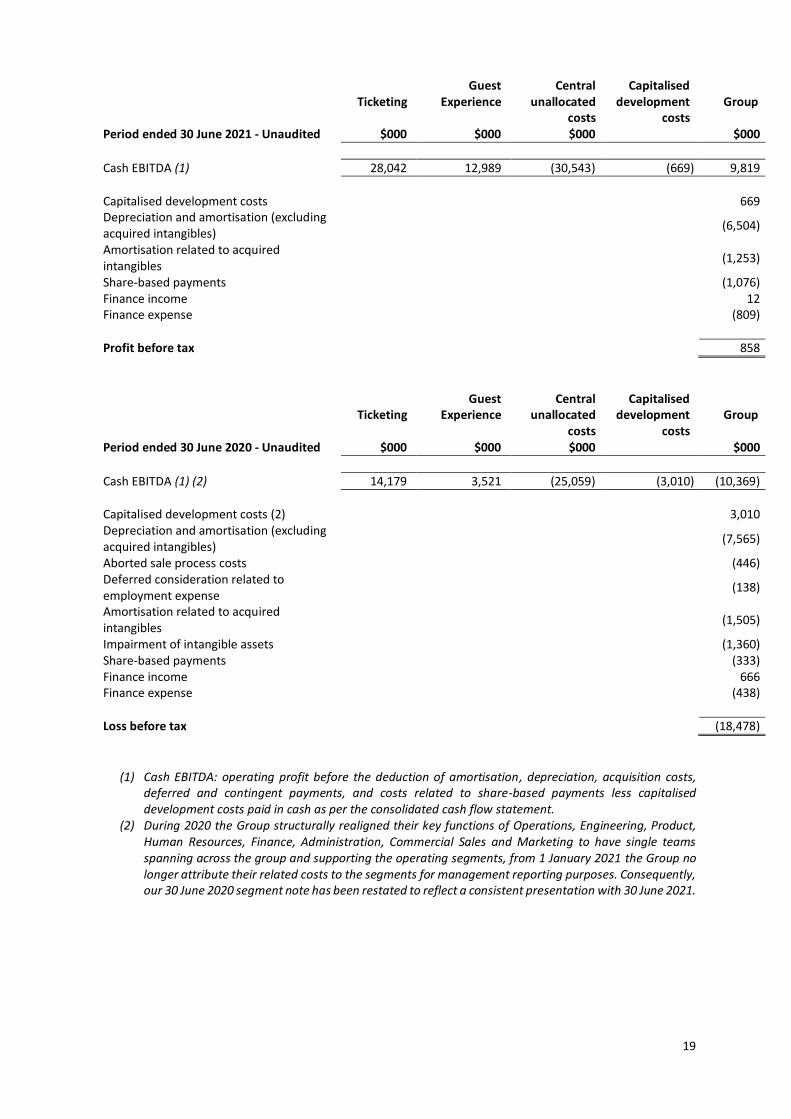
Cash EBITDA (1) 28,042 12,989 (30,543) (669) 9,819
Capitalised development costs 669 Depreciation and amortisation (excluding acquired intangibles)
(6,504)
Amortisation related to acquired intangibles
(1,253)
Share-based payments (1,076) Finance income 12 Finance expense (809)
Profit before tax 858
Ticketing Guest
Experience
Central unallocated
costs
Capitalised development
costs
Group
Period ended 30 June 2020 - Unaudited $000 $000 $000 $000
Cash EBITDA (1) (2) 14,179 3,521 (25,059) (3,010) (10,369)
Capitalised development costs (2) 3,010 Depreciation and amortisation (excluding acquired intangibles)
(7,565)
Aborted sale process costs (446) Deferred consideration related to employment expense
(138)
Amortisation related to acquired intangibles
(1,505)
Impairment of intangible assets (1,360) Share-based payments (333) Finance income 666 Finance expense (438)
Loss before tax (18,478)
(1) Cash EBITDA: operating profit before the deduction of amortisation, depreciation, acquisition costs, deferred and contingent payments, and costs related to share-based payments less capitalised development costs paid in cash as per the consolidated cash flow statement.
(2) During 2020 the Group structurally realigned their key functions of Operations, Engineering, Product, Human Resources, Finance, Administration, Commercial Sales and Marketing to have single teams spanning across the group and supporting the operating segments, from 1 January 2021 the Group no longer attribute their related costs to the segments for management reporting purposes. Consequently, our 30 June 2020 segment note has been restated to reflect a consistent presentation with 30 June 2021.

20
4. Taxation The tax expense for both the periods ended 30 June 2021 and 30 June 2020 have been based on the actual effective tax rate due to the unprecedented challenges caused by COVID-19 in the ability to estimate the full year effective tax rate reliably. The adjusted earnings per share (note 6) has been presented using an estimated adjusted rate for the period, which has been adjusted to remove the effect of amortisation related to acquired intangibles, share-based payment charges, deferred and contingent consideration linked to employment in relation to the acquisitions of TE2 and the aborted sale expenses and any related tax effect on those items. For tax purposes, both aborted sale expenses and deferred and contingent consideration are not deductible for tax purposes, all other adjusted items to arrive at adjusted (loss)/profit before tax have a related tax credit or expense. 5. Reconciliation of alternative performance measure Management present Cash EBITDA as its alternative performance measure below because it monitors performance at a consolidated level and provides a better understanding of the Group’s underlying financial performance. The definition of Cash EBITDA is the same as in the last annual financial statements.
Cash EBITDA is not a defined performance measure under IFRS. The Group’s definition may not be comparable with similarly titled performance measures and disclosures by other entities.
Six months ended 30
June 2021
Six months ended 30
June 2020
Year ended 31 December
2020 Unaudited Unaudited Audited Cash EBITDA $000 $000 $000
Operating profit/(loss) 1,655 (18,706) (30,354)
Add: Aborted sale expenses/acquisition expenses - 446 461
Add: Deferred acquisition consideration (1) - 138 150
Add: Amortisation related to acquired intangibles 1,253 1,505 2,573
Add: Impairment of intangibles - 1,360 2,627
Add: Share-based payments 1,076 333 1,398
Add: Amortisation and depreciation (excluding acquired intangibles) 6,504 7,565 14,664
Capitalised internal development costs (669) (3,010) (2,969)
Cash EBITDA 9,819 (10,369) (11,450)
(1) Under IFRS 3, consideration paid to employees of the acquired entity, who must remain employees post-
acquisition to receive earn out or deferred consideration, is treated as compensation expense rather than consideration.
6. Earnings per share ("EPS") The calculation of the basic earnings per share is based on the earnings attributable to ordinary shareholders divided by the weighted average number of shares in issue during the period.
Diluted earnings per share is calculated by dividing the profit attributable to ordinary shareholders by the weighted average of ordinary shares outstanding during the period adjusted for the effects of dilutive instruments. Adjusted basic earnings per share is calculated by dividing the profit attributable to ordinary shareholders adjusted for costs related to acquisition expenses or aborted sales processes, the amortisation and impairment on acquired intangibles, share-based compensation, deferred and contingent payments arising from acquisitions by the weighted average number of shares used in basic EPS. The denominator for adjusted diluted earnings per share is the weighted average number of shares used in diluted EPS.

21
Six months ended
30 June 2021
Six months ended
30 June 2020
Year ended
31 December 2020
Unaudited Unaudited Audited
$000 $000 $000 Profit/(loss) attributable to ordinary shareholders 786 (15,498) (29,854)
Basic EPS Denominator Weighted average number of shares used in basic EPS 41,222 29,150 35,213
Basic earnings/(loss) per share – cents 1.91 (53.17) (84,78)
Diluted EPS
Denominator Weighted average number of shares used in basic EPS 41,222 29,150 35,213 Deferred share consideration on business combinations 17 -
Effect of dilutive securities Options 1,369 869 983
Weighted average number of shares used in diluted EPS 42,591 30,036 36,196 Diluted earnings/(loss) per share – cents 1.85 (53.17) (84.78)
The Group made a loss in the prior periods presented and therefore the options and equity settled deferred consideration are anti-dilutive. As a result, basic and diluted earnings per share are presented on the same basis for those prior periods presented. Adjusted EPS
Profit/(loss) attributable to ordinary shareholders 786 (15,498) (29,854) Adjustments to loss for the period:
Aborted sale expenses - 446 462
Amortisation relating to acquired intangibles 1,253 1,505 2,573
Impairment of intangible assets - 1,360 2,627
Deferred and contingent consideration linked to employment - 138 150
Shared based payments 1,076 333 1,398 Adjusted profit /(loss) before tax 3,115 (11,716) (22,644) Net tax related to above adjustments: (H1 2021: 20.7%, H1 2020: 20.5%; H1 FY 2020: 17.9%) (483) 656 1,291
Adjusted profit /(loss) attributable to ordinary shareholders 2,632 (11,060) (21,353) Adjusted basic EPS
Denominator Weighted average number of shares used in basic EPS 41,222 29,150 35,213
Adjusted earnings/(loss) per share - cents 6.39 (37.94) (60.64)
Adjusted diluted EPS
Denominator Weighted average number of shares used in diluted EPS 42,591 30,036 36,196
Adjusted earnings per share - cents 6.18 (37.94) (60.64)
The Group has made an adjusted loss in the prior periods presented and therefore the options and equity settled deferred consideration are anti-dilutive. As a result, adjusted basic and adjusted diluted earnings per share are the same for those periods.

22
7. Dividend No dividend has been proposed or recommended during the period. The Board maintains the view that the payment of a dividend is unlikely in the medium term with cash better invested on growth-focused investment opportunities.


![Guide AN1044: CP2615 Customization User Interface/Pages ......If the accesso-ry has its own power supply, then choose [ Self Powered]. If the accesso-ry does not have its own power](https://img.pdfslide.us/doc/110x75/5f494ff772862a21696b19be/guide-an1044-cp2615-customization-user-interfacepages-if-the-accesso-ry.jpg)


![[F5 Hit Refresh] Pierpaolo Basile - Accesso alle informazioni con apache lucene](https://img.pdfslide.us/doc/110x75/557d62c0d8b42ac43c8b45c2/f5-hit-refresh-pierpaolo-basile-accesso-alle-informazioni-con-apache-lucene.jpg)