Embed Size (px)
Citation preview

1Accelerating into Uncertainty
Accelerating into Uncertainty

Table of Contents
Introduction 1
Executive Summary 2
Macroeconomics: Optimism Amid Uncertainty 5
The Logistics Industry in 2016 11
Motor Carriers: Back in Gear 11
Parcel: Torrid Demand Reshapes Networks and Relationships 16
Rail: Another Down Year, Followed by an Upturn 19
Water: A Stormy Year 21
Air Freight: Gravity Reasserts Itself 23
Pipeline: Pullback Positions Industry for Growth 25
Freight Forwarding: Disruption Stalks a Slumping Sector 28
Third-Party Logistics: Growth and Change 29
Warehousing: Growing Pains at the Heart of the Supply Chain 31
Logistics Trends and Outlook: Technology Drives the Action While Policy Sets the Pace 34
Technological Innovations: Firm Steps on a Long Journey 34
Regulation and Policy: A Game of Dice 37
Appendix 40
Estimating USBLC 40
Historical Comparisons 42

1Accelerating into Uncertainty
Introduction
“It behooves us to adapt ourselves to the times if one wants to enjoy continued good fortune.”
—Niccolò Machiavelli (1469–1527)
Welcome to the 28th Annual Council of Supply Chain Management Professionals (CSCMP) State of Logistics Report. This year’s report reveals an industry buffeted by crosswinds as the pace of change accelerates, a state of affairs we refer to as Accelerating into Uncertainty.
This year’s report shows the first decline in United States business logistics costs (USBLC) since 2009, even as a surging e-commerce sector propelled demand for parcel delivery services. Other sectors—namely motor carrier, rail, and water—were challenged by the familiar millstones of overcapacity, rate pressure, and sluggish demand. When coupled with nominal GDP growth of 2.93 percent, USBLC as a percentage of GDP declined 34 basis points to 7.50 percent. At the midpoint of 2017, we see a backdrop of economic and political uncertainty. An array of mixed signals vexes decision-makers, who see consumer confidence rise while GDP growth disappoints, and government officials struggle to take clear action related to stimulating growth, addressing infrastructure requirements, and trade policy. The logistics industry appears destined for a prolonged bout of cognitive dissonance, coupling frustration over subpar growth with the optimism reflected in rising stock market values, technology investments, and consumer confidence data. Yet uncertainty hasn’t slowed the pace of change. On the contrary, industries are churning with disruption as newcomers and incumbents vie for market share, and innovation undermines old business models. One thing is certain: “business as usual” won’t return.
Similar in structure and content to last year’s report, in this 28th edition we provide a narrative on macroeconomic factors affecting logistics, insights from industry leaders, discussion of important trends, detailed analysis of each major logistics sector, and a strategic assessment of the industry. This year, we added a new section on warehousing and expanded the industry outlook section with a greater focus on technology. Also unchanged is the method of calcu-lating USBLC, co-developed by A.T. Kearney, CSCMP, and a diverse set of industry partners.
Once again, A.T. Kearney is honored to partner with CSCMP and Penske Logistics in authoring the State of Logistics Report. In compiling the report, we collaborated with a long list of contrib-utors, including: Marc Althen, Penske Logistics; James Welch, YRC Worldwide; Ties Soeters, AB Inbev; Scott Leveridge, TForce; Miguel Gonzalez, DuPont; Scott Collignon, Cabela’s; Ravi Shanker, Morgan Stanley; Evan Armstrong, Armstrong & Associates; Roxane Bullard, Truckstop.com; Charles Clowdis, IHS Markit; and Drewry Shipping Consultants Ltd. We thank all of them, and others too numerous to name, for sharing their time and perspectives with us.
We hope the data and analysis in this report helps you plan your business strategy for 2017 and beyond. Please contact us with any questions or comments on the issues covered in the report or to suggest improvements that could make next year’s edition more useful.

2Accelerating into Uncertainty
Executive SummaryThe global economy emerged from a sluggish 2016 poised for faster growth. The International Monetary Fund predicted 3.5 percent worldwide growth in 2017, and burgeoning consumer and business confidence augured well for logistics demand across a range of sectors.
Expectations collided with reality early this year, when US GDP rose an underwhelming 1.2 percent in the first quarter—ahead of last year’s 0.8 percent but only the fourth-fastest first quarter in the last six years. The disconnect was the latest unsettling discrepancy between soft indicators of sentiment and hard data on actual economic activity.
The conflicting signals leave shippers and logistics providers with little clarity on economic funda-mentals for the remainder of 2017. Further complicating the outlook are variables such as currency exchange levels, interest rates, and political trends. Against that uncertain backdrop, executives must make vital decisions about capacity, pricing, technology deployment, and strategy.
Along with lackluster economic growth last year came the first decline in USBLC since 2009 (see figure 1). USBLC dropped 1.5 percent in 2016 after rising at a 4.6 percent compound annual rate from 2010 to 2015. Costs fell across all three USBLC components: transportation costs, inventory carrying costs, and other costs. The declines reflect overcapacity, slack volumes, and rate pressures in several sectors, even as demand and prices rose in others.
($ billion)
Figure 12016 saw the first drop in US business logistics costs since 2009
Note: YoY is year-on-year. WACC is weighted average cost of capital.Sources: CSCMP’s 28th Annual State of Logistics Report; A.T. Kearney analysis
Transportation costs
Full truckload
Less-than-truckload
Private or dedicated
Motor carriers
Parcel
Carload
Intermodal
Rail
Air freight (includes domestic, import, export, cargo, and express)
Water (includes domestic, import, and export)
Pipeline
Subtotal
Inventory carrying costs
Storage
Financial cost (WACC x total business inventory)
Other (obsoloscence, shrinkage, insurance, handling, others)
Subtotal
Other costs
Carriers’ support activities
Shippers’ administrative costs
Subtotal
Total US business logistics costs
2016
269.4
58.0
268.1
595.5
86.3
52.6
19.3
71.9
66.9
40.6
33.6
894.7
143.5
143.4
122.9
409.8
44.7
43.3
88.1
1,392.64
YoY 16/15
–1.6%
0.5%
0.7%
–0.4%
10.0%
–13.8%
–2.5%
–11.0%
1.5%
–10.0%
1.1%
–0.7%
1.8%
–7.7%
–3.2%
–3.2%
0.7%
–4.6%
–2.0%
–1.5%
5-yr. CAGR
4.3%
–1.2%
5.7%
4.3%
6.4%
–1.4%
–0.5%
–1.1%
2.4%
–0.1%
4.2%
3.6%
3.6%
–2.2%
0.5%
0.5%
4.2%
2.8%
3.5%
2.6%

3Accelerating into Uncertainty
Notably, overall spending on logistics dropped despite a rise in energy prices. This marks the second straight year in which the two have moved in opposite directions, indicating energy prices are no longer the primary factor in logistics costs. We suggested last year that consumers have become the driving force behind logistics spending, and this year’s results confirm the powerful impact of rising consumer demand for e-commerce deliveries.
While overall transportation costs fell 0.7 percent last year, spending on package delivery services jumped 10 percent. Parcel and express delivery has surpassed railroads as the second-largest logistics sector behind motor freight. Meanwhile, energy-sensitive pipelines and railroads saw rates and volumes stall or drop as oil prices remained at historically low levels despite the upturn in 2016.
Cross-currents also affected inventory carrying costs last year. Storage expenditures rose 1.8 percent and are now as important as the financial carrying cost of inventory. Until last year, storage costs grew at a compound annual rate of 4.7 percent. Nevertheless, a 54-basis-point drop in weighted average cost of capital pulled down overall inventory carrying costs by 3.17 percent.
After modest progress in 2015, logistics efficiency posted a sharper improvement last year. USBLC dropped 34 basis points as a percentage of nominal GDP, reaching levels not seen since the great recession of 2009–2010 (see figure 2).
During 2016, a few common trends drove the action across various logistics sectors. Overcapacity and rate pressures fueled cost-cutting and consolidation, particularly among motor carriers and ocean freight companies. Cutting-edge technologies brought new efficiencies to sectors such as warehousing, parcel delivery, and motor freight. Along with technological advances came new business models in third-party logistics (3PL), freight forwarding, and rail, among others. Parcel carriers and warehouses capitalized on surging e-commerce volumes to raise rates and continued reconfiguring their networks to meet consumer expectations for faster delivery.
Figure 2Business logistics costs have fallen to 7.5 percent of GDP
Note: bp is basis points.
Sources: CSCMP’s 28th Annual State of Logistics Report; A.T. Kearney analysis
US business logistics costs as a share of nominal GDP (%)
6
8
10
2016201520142013201220112010200920082007
7.50%7.84%7.89%7.91%7.89%7.89%
7.53%7.37%
8.46%8.59%–34 bp
4Accelerating into Uncertainty
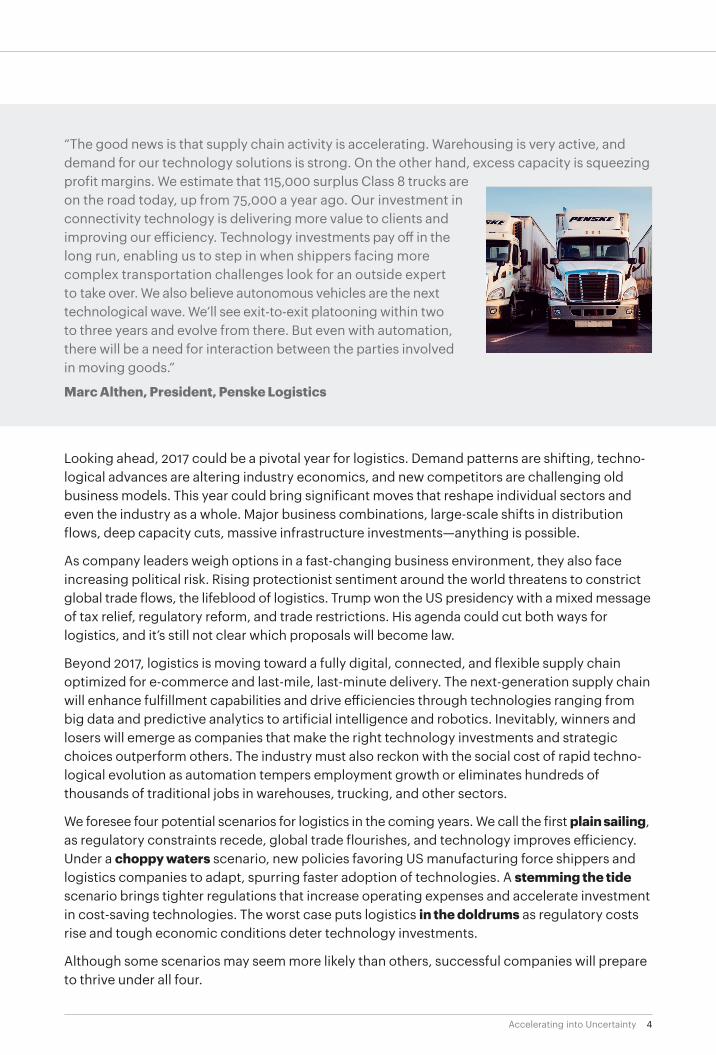
“The good news is that supply chain activity is accelerating. Warehousing is very active, and demand for our technology solutions is strong. On the other hand, excess capacity is squeezing profit margins. We estimate that 115,000 surplus Class 8 trucks are on the road today, up from 75,000 a year ago. Our investment in connectivity technology is delivering more value to clients and improving our efficiency. Technology investments pay off in the long run, enabling us to step in when shippers facing more complex transportation challenges look for an outside expert to take over. We also believe autonomous vehicles are the next technological wave. We’ll see exit-to-exit platooning within two to three years and evolve from there. But even with automation, there will be a need for interaction between the parties involved in moving goods.”
Marc Althen, President, Penske Logistics
Looking ahead, 2017 could be a pivotal year for logistics. Demand patterns are shifting, techno-logical advances are altering industry economics, and new competitors are challenging old business models. This year could bring significant moves that reshape individual sectors and even the industry as a whole. Major business combinations, large-scale shifts in distribution flows, deep capacity cuts, massive infrastructure investments—anything is possible.
As company leaders weigh options in a fast-changing business environment, they also face increasing political risk. Rising protectionist sentiment around the world threatens to constrict global trade flows, the lifeblood of logistics. Trump won the US presidency with a mixed message of tax relief, regulatory reform, and trade restrictions. His agenda could cut both ways for logistics, and it’s still not clear which proposals will become law.
Beyond 2017, logistics is moving toward a fully digital, connected, and flexible supply chain optimized for e-commerce and last-mile, last-minute delivery. The next-generation supply chain will enhance fulfillment capabilities and drive efficiencies through technologies ranging from big data and predictive analytics to artificial intelligence and robotics. Inevitably, winners and losers will emerge as companies that make the right technology investments and strategic choices outperform others. The industry must also reckon with the social cost of rapid techno-logical evolution as automation tempers employment growth or eliminates hundreds of thousands of traditional jobs in warehouses, trucking, and other sectors.
We foresee four potential scenarios for logistics in the coming years. We call the first plain sailing, as regulatory constraints recede, global trade flourishes, and technology improves efficiency. Under a choppy waters scenario, new policies favoring US manufacturing force shippers and logistics companies to adapt, spurring faster adoption of technologies. A stemming the tide scenario brings tighter regulations that increase operating expenses and accelerate investment in cost-saving technologies. The worst case puts logistics in the doldrums as regulatory costs rise and tough economic conditions deter technology investments.
Although some scenarios may seem more likely than others, successful companies will prepare to thrive under all four.

5Accelerating into Uncertainty
Macroeconomics: Optimism Amid UncertaintyAfter a lackluster 2016, the global economy is expected to strengthen in the next two years. The International Monetary Fund predicts 3.5 percent worldwide economic growth in 2017 as prospects brighten in key developed and emerging markets. An improving outlook should lift consumer spending, a key driver of demand for logistics services, particularly in parcel, air freight, and third-party logistics.
Stronger performance in the United States is a big factor in global growth expectations this year (see figure 3). Resurgent domestic demand lifted growth in the second half of 2016, and businesses added inventory to keep pace with anticipated sales growth. Optimism carried over into 2017 as incomes rose, job prospects improved, household wealth increased, and inflation remained low. Consumer spending has averaged 4.5 percent monthly growth since last fall, and the National Retail Federation forecasts 3.7 to 4.2 percent retail sales growth in 2017. Retailers account for a big share of business at third-party logistics providers, while surging digital sales channels drive growth at parcel delivery companies and others involved in e-commerce fulfillment.
At the same time, logistics providers will contend with a side effect of the stronger US economy: the rising American dollar. Although the dollar has reversed some of its late-2016 gains, interest rate hikes are expected to lift a US currency still trading at high levels relative to recent years, making American goods even more expensive abroad while foreign imports become cheaper in the United States (see figure 4 on page 6). As a result, logistics companies will have to adjust their networks to handle more US-bound shipments and a related decline in outbound American cargo.
Another concern is the gap between hard and soft US economic data. Measures of consumer and business confidence are soaring, but actual economic activity is lagging. For example, the University of Michigan’s consumer sentiment survey in March signaled a 2.7 percent rise in
Figure 3US economic growth is projected to be strong in the near term
Source: International Monetary Fund
Real GDP growth(%)
0.0
0.5
1.0
1.5
2.0
2.5
3.0
2019f2018f2017f201620152014201320122011
2.1
2.52.3
1.6
2.62.4
1.7
2.2
1.6

6Accelerating into Uncertainty
Figure 4Rising interest rates and an appreciating US dollar could increase the costsof doing business
Average monthly interest rate, US dollar value(US prime rate, US dollar trade-weighted index)
Note: Upward movement of the US dollar trade-weighted index indicates an appreciation of the US dollar against major currencies.
Sources: FRED, Federal Reserve Bank of St. Louis
3.00
3.25
3.50
3.75
4.00
4.25
60
70
90
80
100
Apr
-17
Jan-
17
Oct
-16
Jul-1
6
Apr
-16
Jan-
16
Oct
-15
Jul-1
5
Apr
-15
Jan-
15
Oct
-14
Jul-1
4
Apr
-14
Jan-
14
Oct
-13
Jul-1
3
Apr
-13
Jan-
13
Oct
-12
Jul-1
2
Apr
-12
Jan-
12
US prime rate (left axis)
US dollar (right axis)
consumer sentiment this year, but first-quarter GDP posted a disappointing 1.2 percent increase (see figure 5). Similarly, orders for non-defense capital goods (a proxy for business investment) edged down even as business confidence indicators remained sky-high. More broadly, economic growth models based only on hard data forecast 1 percent growth this year, compared with 3 percent for models incorporating hard and soft data.
Figure 5Consumers are watching the administration’s economic policies closely
University of Michigan Consumer Sentiment Index
Sources: University of Michigan: Consumer Sentiment© [UMCSENT], FRED, Federal Reserve Bank of St. Louis
60
80
100
Apr
-17
Jan-
17
Oct
-16
Jul-1
6
Apr
-16
Jan-
16
Oct
-15
Jul-1
5
Apr
-15
Jan-
15
Oct
-14
Jul-1
4
Apr
-14
Jan-
14
Oct
-13
Jul-1
3
Apr
-13
Jan-
13
Oct
-12
Jul-1
2
Apr
-12
Jan-
12

7Accelerating into Uncertainty
Figure 6Business inventory productivity improved during the second half of 2016
Business inventory and inventory to sales ratio($ billion)
Sources: US Bureau of the Census, Total Business Inventories [BUSINV], FRED, Federal Reserve Bank of St. Louis; US Bureau of the Census, Total Business: Inventories to Sales Ratio [ISRATIO], FRED, Federal Reserve Bank of St. Louis
1.25
1.35
1.15
1,500
500
1.45
0
1,000
2,000
Apr
-17
Jan-
17
Oct
-16
Jul-1
6
Apr
-16
Jan-
16
Oct
-15
Jul-1
5
Apr
-15
Jan-
15
Oct
-14
Jul-1
4
Apr
-14
Jan-
14
Oct
-13
Jul-1
3
Apr
-13
Jan-
13
Oct
-12
Jul-1
2
Apr
-12
Jan-
12
Business inventory
Inventory to sales ratio
Retail inventory
Retail inventory to sales ratio
Retail inventory and inventory to sales ratios ($ billion)
Sources: US Bureau of the Census, Retailers: Inventories to Sales Ratio [RETAILIRSA], FRED, Federal Reserve Bank of St. Louis; US Bureau of the Census, Retailers Inventories [RETAILIMSA], FRED, Federal Reserve Bank of St. Louis
1.25
1.45
1.55
1.35
400
100
0
200
700
600
500
300
Apr
-17
Jan-
17
Oct
-16
Jul-1
6
Apr
-16
Jan-
16
Oct
-15
Jul-1
5
Apr
-15
Jan-
15
Oct
-14
Jul-1
4
Apr
-14
Jan-
14
Oct
-13
Jul-1
3
Apr
-13
Jan-
13
Oct
-12
Jul-1
2
Apr
-12
Jan-
12
Uncertainty is also evident in business inventory-to-sales ratios, which continue to fall after peaking in mid-2016 (see figure 6). Strong consumer demand and improved supply chain efficiency may explain part of the decline. But companies unsure about future demand appear to be holding inventory levels closer to actual retail sales numbers rather than stocking up in anticipation of faster growth. Continued uncertainty over future economic trends impedes longer-term planning throughout the supply chain, forcing companies to continuously monitor inventory levels and exacerbating month-to-month fluctuations in freight volumes (see figure 7 on page 8).

8Accelerating into Uncertainty
Figure 7Fluctuations in truck tonnage demand are expected to continue as businesses adjust their outlook over time
Note: January 2012 = 100
Sources: US Bureau of Economic Analysis, Personal Consumption Expenditures [PCE], FRED, Federal Reserve Bank of St. Louis; US Bureau of Transportation Statistics, Truck Tonnage [TRUCKD11], FRED, Federal Reserve Bank of St. Louis; A.T. Kearney analysis
85
105
115
95
125
Apr
-17
Jan-
17
Oct
-16
Jul-1
6
Apr
-16
Jan-
16
Oct
-15
Jul-1
5
Apr
-15
Jan-
15
Oct
-14
Jul-1
4
Apr
-14
Jan-
14
Oct
-13
Jul-1
3
Apr
-13
Jan-
13
Oct
-12
Jul-1
2
Apr
-12
Jan-
12
Personal consumption expenditures and truck tonnage(Base 100)
Personal consumption expenditures
Truck tonnage
Mixed economic signals are likely to persist throughout 2017, as business leaders assess not only conditions on the ground but also administrative progress in turning pro-growth campaign promises into governmental policy. The administration’s economic platform of lower taxes, less regulation, and more infrastructure spending has been a major catalyst for the rise in business confidence after Trump’s unexpected victory in November. The Organisation for Economic Co-operation and Development’s US business confidence index has been rising since November, when it surpassed 100 for the first time in two years.
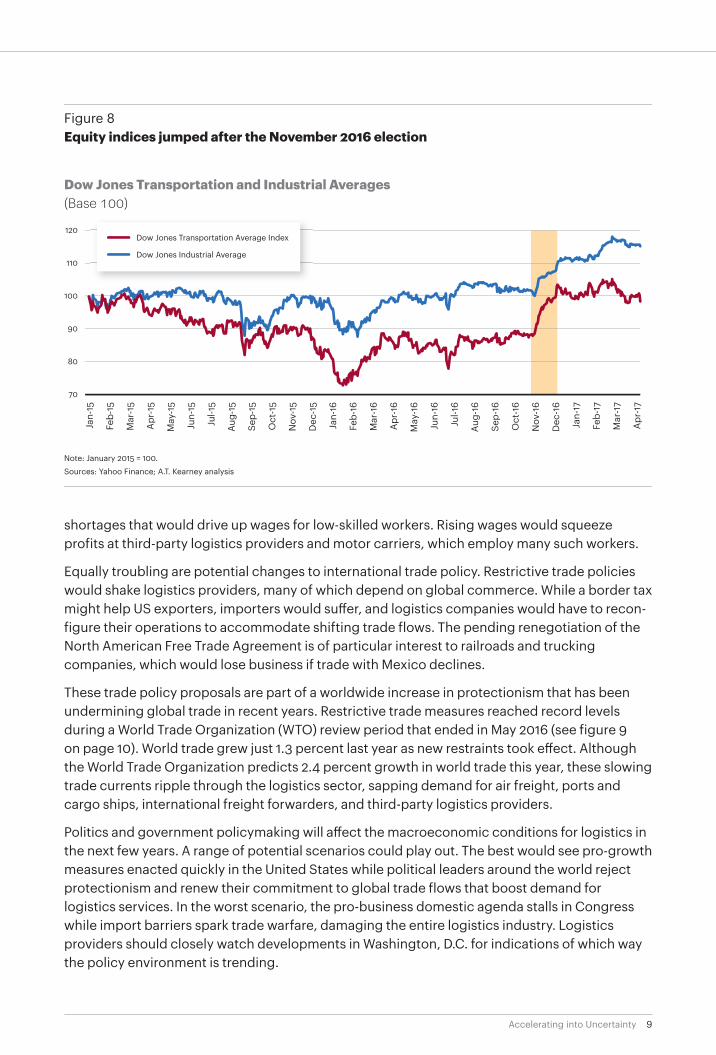
Economists expect business optimism to trigger more investment and hiring, which would spur economic growth and demand for logistics services. A broad regulatory rollback would reduce costs in all sectors, benefiting logistics providers from pipelines to trucking. Lower emissions standards would generate even more savings for motor carriers and railroads, with the latter potentially enjoying a boost in demand if coal shipments rise. If the administration’s infrastructure investment plan comes to fruition, trucking companies could reap additional efficiencies from highway improvements. On the employment front, smaller logistics providers might add workers if the National Labor Relations Board is reinforced with pro-business appointees and pushes through legislation easing employee health-insurance mandates. In a sign that investors expected the current administration to help logistics companies in many ways, the Dow Jones Transportation Average leapt after the election (see figure 8 on page 9).
Of course, there is no guarantee that business-friendly proposals will become law this year. The fate of the healthcare bill thus far illustrates the difficulty of winning Congressional support for new policies.
Further complicating the US economic outlook are elements of the administration’s agenda that could potentially restrain growth. Immigration restrictions, for example, could create labor
9Accelerating into Uncertainty
Figure 8Equity indices jumped after the November 2016 election
Note: January 2015 = 100.
Sources: Yahoo Finance; A.T. Kearney analysis
Dow Jones Transportation and Industrial Averages(Base 100)
70
80
100
110
90
120
Oct
-16
Nov
-16
Dec
-16
Jan-
17
Feb-
17
Mar
-17
Apr
-17
Sep-
16
Aug-
16
Jul-1
6
Jun-
16
May
-16
Apr
-16
Mar
-16
Feb-
16
Jan-
16
Dec
-15
Nov
-15
Oct
-15
Sep-
15
Aug-
15
Jul-1
5
Jun-
15
May
-15
Apr
-15
Mar
-15
Feb-
15
Jan-
15
Dow Jones Transportation Average Index
Dow Jones Industrial Average
shortages that would drive up wages for low-skilled workers. Rising wages would squeeze profits at third-party logistics providers and motor carriers, which employ many such workers.
Equally troubling are potential changes to international trade policy. Restrictive trade policies would shake logistics providers, many of which depend on global commerce. While a border tax might help US exporters, importers would suffer, and logistics companies would have to recon-figure their operations to accommodate shifting trade flows. The pending renegotiation of the North American Free Trade Agreement is of particular interest to railroads and trucking companies, which would lose business if trade with Mexico declines.
These trade policy proposals are part of a worldwide increase in protectionism that has been undermining global trade in recent years. Restrictive trade measures reached record levels during a World Trade Organization (WTO) review period that ended in May 2016 (see figure 9 on page 10). World trade grew just 1.3 percent last year as new restraints took effect. Although the World Trade Organization predicts 2.4 percent growth in world trade this year, these slowing trade currents ripple through the logistics sector, sapping demand for air freight, ports and cargo ships, international freight forwarders, and third-party logistics providers.
Politics and government policymaking will affect the macroeconomic conditions for logistics in the next few years. A range of potential scenarios could play out. The best would see pro-growth measures enacted quickly in the United States while political leaders around the world reject protectionism and renew their commitment to global trade flows that boost demand for logistics services. In the worst scenario, the pro-business domestic agenda stalls in Congress while import barriers spark trade warfare, damaging the entire logistics industry. Logistics providers should closely watch developments in Washington, D.C. for indications of which way the policy environment is trending.

10Accelerating into Uncertainty
Figure 9Global trade growth is slowing as protectionist measures rise
Trade barriers and export growth(Number of barriers initiated, % of export growth)
Sources: WTO, Integrated Trade Intelligence Portal (I-TIP); A.T. Kearney analysis
0
1,000
2,000
3,000
–15%
–5%
0%
10%
–10%
5%
20%
15%
201620152014201320122011201020092008200720062005200420032002
Initiated nontari� barriers (left axis) Export volume growth (right axis)

11Accelerating into Uncertainty
The Logistics Industry in 2016Motor Carriers: Back in Gear
The $595 billion motor carrier market gained traction after a dismal 2015. An A.T. Kearney analysis of Truckstop.com data shows spot rates for dry van shipments rising 10 percent in 2016, reversing much of 2015’s steep decline (see figure 10 ). Full truckload rates also overcame early weakness to close 2016 above 2015 levels, according to Morgan Stanley’s Full Truckload Index.
Yet rates remained below $2 per mile, too low to relieve financial woes for some carriers. Winnowing of weaker players accelerated as bankruptcy filings rose. More than 14,000 trucks were removed from service last year, triple the number idled in 2015, according to Avondale Partners. Across the industry, low average rates and overcapacity pressured dry van carriers, small operators struggled to compete with larger rivals, and major players saw revenues fall and operating ratios climb (see figure 11 on page 12). Performance varied among carrier business units: truckload and intermodal segments were weak, while less-than-truckload (LTL) managed to push through moderate rate increases even as volume declines depressed overall revenues. Bright spots were dedicated contract carriage (DCC) and brokerage services, where new business models are taking shape.
Mergers and acquisitions dropped sharply in 2016, with no marquee transaction similar to XPO Logistics’ $3 billion 2015 acquisition of Con-Way. But deal-making picked up in April 2017 when Swift Transportation and Knight Transportation announced plans to merge, creating a combined company with more than 20,000 tractors, $5 billion in revenue, and a sub-90 percent operating ratio, according to the companies’ investor presentation. The deal marks a return to Swift for Knight family members who held senior management positions at the larger company before leaving to launch their namesake carrier in 1990. Credited with driving Swift’s growth
Dry van spot market rates($ per mile)
Figure 102016 dry van spot rate volatility continues into 2017
Note: Includes fuel
Sources: Truckstop.com; A.T. Kearney analysis
+10%
1.4
1.6
1.8
2.0
2017201614105150454035302520151051

12Accelerating into Uncertainty
during the 1980s, they earned a reputation for superior management and profitability at Knight Transportation. Knight executives will run the combined company, giving them an opportunity to instill best practices and improve financial performance across a larger organization.
In a sign that carriers believe the worst is over, orders for new tractors picked up late last year. Although net orders for Class 8 tractors declined 36 percent for the full year, they surged 106 percent between July and December (see figure 12). Historical data show that Class 8 orders
Figure 11Overcapacity caused carriers to struggle with declining revenues and increasing operating ratios
1 Revenue shown in millions
2 Operating ratio is operating costs / operating revenue; lower is more favorable.
Sources: Annual reports; A.T. Kearney analysis
Swift Transportation
Werner Enterprises
Knight Transportation
Marten Transport
Heartland Express
FY16
$4,031
$2,008
$1,118
$671
$612
FY15
$4,229
$2,093
$1,182
$664
$736
Revenue1
%Δ
–4.7%
–4.0%
–5.4%
1.0%
–16.8%
FY16
94.0%
93.7%
86.7%
91.3%
86.0%
FY15
91.2%
90.4%
85.0%
90.8%
84.1%
Operating ratio2
%Δ
3.0%
3.6%
2.0%
<1.0%
2.2%
Figure 12In 2016, Class 8 orders lagged 2015 levels, despite rebounding in the second half of the year
Sources: FTR Associates, Monthly Class 8 Net Orders
Class 8 net orders (thousand)
10
0
30
20
40
Oct
-16
Nov
-16
Dec
-16
Jan-
17
Feb-
17
Mar
-17
Apr
-17
May
-17
Sep-
16
Aug-
16
Jul-1
6
Jun-
16
May
-16
Apr
-16
Mar
-16
Feb-
16
Jan-
16
Dec
-15
Nov
-15
Oct
-15
Sep-
15
Aug-
15
Jul-1
5
Jun-
15
May
-15
Apr
-15
Mar
-15
Feb-
15
Jan-
15

13Accelerating into Uncertainty
often surge after rates bottom out, but every new truck creates additional capacity that could slow rate recovery. As new truck orders rise, estimates from J.D. Power and others show a steep decline in prices for used tractors, forcing carriers to mark down asset values and creating a financial headwind in the first half of 2017.
Early results for 2017 appear to support carrier optimism. Rates have continued to rise, and publicly traded carriers generally met or exceeded Wall Street earnings expectations for the first quarter. Carriers are hoping rates will firm up throughout the year as stronger economic growth and a looming electronic log deadline reduce excess capacity.
Shipper–carrier relationships evolve with technology
As markets begin to improve, advanced technologies and better processes are reshaping business models and redefining relationships between shippers and carriers. Methods such as multiple-round annual bidding, closer collaboration, and detailed feedback drive efficiencies for shippers and carriers. Augmented by cutting-edge sourcing and geolocation platforms, these approaches help shippers find the best mix of common, dedicated, and brokerage-based carriers.
More shippers are embracing DCC arrangements that lock in capacity, rates, and service levels while mitigating potential service disruptions caused by regulatory changes. While carriers benefit from DCC, which guarantees predictable revenue streams regardless of equipment usage levels, shippers are asking them to find backhauls and share revenues.
Major DCC carriers distinguish themselves from one-way common carriers with advanced transportation management systems and other technologies that reduce costs by improving asset use. They are also better positioned to meet increasing shipper demand for vertically integrated relationships. DCC carriers offer vertical solutions such as dedicated fleets, managed routing guides to one-way carriers, and additional capacity through in-house brokerage services. Smaller DCC carriers rely on brokerages or client 3PLs to raise DCC fleet use.
“The distribution process is evolving faster and faster. So much is happening now: the move to same-day shipping and delivery, the desire for convenience, and the expectation that the shipping process adds value such as white-glove services. Everybody wants everything everywhere and right now, putting tremendous pressure on the supply chain.
LTL has the foundation and reach to be a value-add partner in this dynamic, new supply chain. However, much needs to be accom-plished. To meet increasing speed-to-market demands, networks will have to be reshaped based on their level of retail shipping: inventory needs to be closer to large concentrations of consumers. Specialized equipment will need to be part of any last-mile fleet, and drivers will need to be trained with new skills for residential deliveries.
Retailers may have figured out parcel shipping, but they haven’t cracked the LTL calculus of delivering the big items, such as barbecue grills and swing sets. LTL carriers could help but aren’t convinced there’s enough money to be made in home delivery. Free shipping doesn’t exist; somebody has to bear that cost. Partnerships hold promise here.

14Accelerating into Uncertainty
Another important trend is a technology-driven value shift that makes information about trans-portation more valuable than the transportation itself. But implementing advanced information systems is easier said than done. All shippers vary widely in their needs and systems. Common interfaces and technology compatibility initiatives are a must to make this seamless from the beginning to the end of the supply chain.
Technology also allows us to adopt dimensional pricing, which has already taken hold in every other sector. The move can’t happen soon enough. We need to abandon the antiquated tariff system, which causes so much waste and unnecessary work.
The demands of this new dynamic supply chain must be met with the promise of adoption and integration of technologies that will bring us new efficiencies and value to the supply chain.
It’s up to all of us to make it happen.”
James Welch, CEO, YRC Worldwide
New technology has also sparked an evolution in brokerage business models. Technologically advanced brokers often match or exceed the service levels of asset-based carriers at lower prices. Using big data and advanced analytics, they quickly assess capacity across vast carrier networks, forecast demand and pricing more accurately, and offer fixed rates as primary carriers on key lanes. These systems benefit carriers and shippers alike. They help carriers find cargo for “interhaul” segments between contracted loads, when trailers often run empty. For shippers, advanced brokerage capabilities open the door to new sources of capacity at smaller carriers that lack the scale and capabilities to work directly with major shippers.
More-recent technological innovations include mobile platforms that enable brokers to efficiently match trucks with loads. Next-generation brokers such as Transfix use real-time data to allocate loads based on truck locations, a significant improvement over time-consuming manual processes that require brokers to comb through hierarchies of carriers and owner–operators in search of capacity for shippers.
“A third wave of technology is transforming brokerage as mobile platforms replace systems based on Internet and satellite communications, which supplanted landline phones and faxes not so long ago. The new model saves time and money by helping drivers choose the best routes, find low-cost gas stations, and even crowdsource fuel purchasing. Mobile platforms also reduce risk and enhance safety by monitoring driving behavior and detecting cargo theft and other criminal activity.
Third-generation technologies benefit shippers, too, giving them more information on their shipments. Granular details on arrival and loading times, augmented by real-time analytics, help shippers manage internal operations, and supplier and customer relationships more effectively.

15Accelerating into Uncertainty
However, technology adoption isn’t keeping pace with innovation. Too many shippers and carriers still rely on antiquated electronic data interchange (EDI) systems, even though appli-cation programming interface (API) works so much better. But the bigger problem is the persistent disconnect between logistics and IT departments at large shippers.
Another challenge is asset utilization, which ties into the driver shortage. Estimates peg the driver shortage at 15 percent, which also happens to be the percentage of miles that trucks are driven with empty trailers. That makes the problem look more like an efficiency challenge than a supply–demand mismatch. Better asset utilization and capacity management might be the answer.
More broadly, shippers are starting to appreciate the value of logistics, which they once viewed as a cost center. In an economy driven by e-commerce, shippers that deliver goods faster, cheaper, and more reliably gain a competitive edge.”
Andrew McElroy, CEO, Transfix
2017 and beyond
The capacity declines of 2016 eased in the first quarter of 2017, thanks to stronger demand and better business conditions for carriers. Motor freight companies also took advantage of an improving supply–demand balance to push through rate increases.
Another catalyst for rising rates is concern about the potential impact of electronic logging devices (ELDs) that track driver hours for compliance with regulatory limits. However, execu-tives interviewed for this report say initial predictions that ELDs would reduce available capacity by 3 to 10 percent appear to have overstated the amount of “cheating” under the old manual tracking regime. The capacity impact is probably in the 2 to 3 percent range, they estimate.
“We want to be a facilitator of new technologies and a safety leader as new ideas and technological innovations disrupt the US logistics industry. That’s why we have invested time and effort in a partnership that made the first-ever self-driving commercial truckload shipment last October. We believe self-driving technologies have the potential to deliver great benefits in the areas of safety, fuel efficiency, asset maintenance, produc-tivity, and service levels. Self-driving trucks allow for improved driver focus, which has a direct impact on safety, as human error has been shown responsible for 80 to 90 percent of all Class 8 tractor accidents. Furthermore, this equipment maintains steadier speeds, reducing wear and tear and improving fuel economy, thereby reducing carbon emissions.
It is AB InBev’s belief that this type of technology will be commonplace in long-haul trucking in the not-so-distant future, likely occurring before self-driving trucks are routinely seen on congested city streets. We think truck drivers will still be crucial in this future state but that their

16Accelerating into Uncertainty
role will evolve into that of a monitor for a complex system and in the execution of the initial and final miles of the trip. Remember, autopilot systems on aircraft haven’t replaced pilots. But the technology won’t reach its full potential until regulators at all levels of government write rules of the road for self-driving trucks. We plan to be a part of creating a safe and comprehensive national regulatory framework while building public confidence in self-driving trucks.”
Ties Soeters, NA VP Logistics Procurement, AB InBev
Farther down the road loom autonomous driving systems and other technological break-throughs likely to alter industry economics. While the timeline for adoption is uncertain, forecasters expect autonomous driving to improve safety and reduce carriers’ costs. In another potentially significant development, Tesla and others are developing electric-powered engines for Class 8 tractors. Electric engines could spawn a new business model allowing carriers to “rent” power through interchangeable batteries that are swapped out at stations along highways as they run out of juice. This approach, based on aviation industry practices under which airlines rent power from engine manufacturers, could drive down operating expenses and equipment costs for truckers.
Parcel: Torrid Demand Reshapes Networks and Relationships
E-commerce has turned parcel delivery into the hottest logistics sector. Parcel volumes rose 6 percent last year as online retailers flooded delivery networks with small packages destined for individual consumers in their houses, apartments, offices, and dorm rooms. The surge shows no sign of abating as volumes rose 3 percent in early 2017, and forecasters predict parcel shipping revenues will climb to $93 billion by 2019 from $78 billion in 2015 (see figure 13 on page 17).
Major parcel carriers capitalized on rising demand to push through price hikes early this year, a trend likely to continue as they expand truck fleets to meet rapidly growing demand for ground delivery, a lower-value service category. UPS and FedEx announced general rate increases of 3.9 to 4.9 percent on average, and the US Postal Service (USPS) raised prices 3.3 percent on standard Priority Mail shipments and 3.9 percent on Priority Mail flat rate service. Both UPS and FedEx also increased various accessorial surcharges. The residential surcharge rate rose $0.15 for UPS and $0.20 at FedEx. Adjustments to dimensional weight factors (DIM) at both carriers will boost rates even higher, although UPS changed the DIM factor only for packages larger than 1,728 cubic inches.
Rapid growth raises the bar
Booming business brings new challenges for parcel carriers under pressure to meet the escalating service expectations of shippers and consumers. E-commerce retailers are winning customers away from traditional brick-and-mortar stores by promising fast, free delivery to innumerable locations across the country. To fulfill this promise without crushing profit margins, they are looking to reduce shipping costs and reconfigure distribution networks.
As shippers move distribution centers closer to customers, couriers must also increase the density of their local delivery networks. These investments intensify competition for parcel volumes among carriers that need to offset the costs of adding vehicles and other last-mile

17Accelerating into Uncertainty
Figure 13Growth in parcel will be fueled by B2C customers and ground shipping
Source: A.T. Kearney analysis
US parcel market by customer segment:size and growth ($ billion)
US parcel market by product type:size and growth ($ billion)
2015 2019e 2015 2019e
36.948.8
35.3
6.378.4
93.1
36.4
7.9
62.375.7
9.6
6.5
78.4
93.1
10.2
7.26.0%
4.4%
CAGR
0.8%
7.3%
2.6%
4.4%
CAGR
1.6%
5.0%
B2C B2B C2C Ground Express Deferred
capabilities. Yet their efforts to maximize volume are up against increasingly sophisticated shippers armed with new technological tools for managing logistics costs and finding the best rate in every product category, region, and lane.
Unprecedented growth also alters industry relationships, creating opportunity for new compet-itors and spurring adoption of new technologies. In some cases, parcel delivery companies find themselves competing with customers, while in others, they join forces with longtime competitors.
For example, Amazon is UPS’s largest customer, but the online retailing giant launched its own delivery service in 2016. Amazon Logistics has already expanded beyond internal logistics to offer delivery services to external customers. We expect Amazon and other large shippers to keep adding logistics capabilities, even taking control of distribution in areas where they have sufficient density. Traditional parcel carriers stand to lose significant volumes as shippers expand in-house logistics operations.
Incumbents face another threat from start-ups using advanced technologies to develop new package delivery business models. Collaborative relationships such as crowdsourcing and vehicle-sharing figure prominently in their strategies. One such start-up, Onibag, offers next-day delivery in 70 cities across five states without owning vehicles or distribution centers. Onibag crowdsources first-mile pickups and last-mile drop-offs and uses ridesharing and excess capacity on cross-country buses to transport packages over longer distances.

18Accelerating into Uncertainty
Traditional carriers are also embracing technology, parrying new competitors and working to generate the efficiencies and service improvements shippers have come to expect. Rapidly advancing cloud-based analytics, real-time connectivity, and image-recognition sensors help carriers accelerate deliveries and track packages more closely.
Some parcel delivery companies are collaborating to meet common challenges. UPS and FedEx, for example, have augmented their local route density through partnerships with the USPS that provide access to the postal service’s vast home delivery network.
“Mobile technology is changing consumer purchasing behavior in dramatic ways. People tap out orders on their phones all day long and expect packages to show up at their doors within hours at minimal cost. New wireless capabilities now enable consumers to remotely unlock storage lockers and even their front doors to receive package deliveries. No longer must packages sit unattended outside houses or in apartment building lobbies, vulnerable to theft. Remote access also clears the way for direct shipments of bulky items such as furniture and appliances and allows shippers to offer more installation and assembly services. The shipping of bulk consumables is where we expect the biggest growth. However, these non-conveyable goods fit right in between the small packages and the heavy goods, and traditional parcel carriers will need to adapt their handling equipment to process them. To meet growing demand for same-day delivery, they’ll need more small cross-dock facilities, which are becoming harder to find. A longer-term challenge is network reconfiguration. Shippers of large consumer goods learned long ago to put their distribution centers closer to densely populated areas. Parcel carriers need to follow suit but could face pushback from residents of urban neighborhoods where an influx of delivery trucks would worsen traffic congestion.”
Scott Leveridge, President, TForce US
Three trends to watch
Steadily rising package volumes are driving fundamental change in distribution networks, a process reflected in three trends that will play out over the next five to 10 years:
Regional distribution centers. Regionally oriented distribution centers have emerged as linchpins of advanced networks as retailers offering same-day delivery move goods closer to densely populated areas. Parcel carriers will follow suit with their own region-focused delivery networks.
New route configurations. Redesigned distribution networks require new trucking routes. Carriers are shifting line-haul routes to transport merchandise from national distribution centers and rebalance volumes between local and regional centers.
Last-mile focus. Last-mile capabilities are essential to same-day delivery. Carriers continue striving to build the local route densities necessary to provide last-mile services profitably. We expect many to increase density through partnerships such as the alliances UPS and FedEx have formed with the USPS.

19Accelerating into Uncertainty
Rail: Another Down Year, Followed by an Upturn
The $72-billion-a-year North American railroad industry suffered a second straight year of decline in 2016 as slumping demand for coal depressed revenues and shipping volumes. Revenues fell 7 percent at Class I railroads, while volumes dropped 5 percent (see figure 14). Even intermodal, a key growth segment for railroads, saw weak volume and pricing growth as a result of over-capacity and competition in the over-the-road truck market (see figure 15 on page 20). As in 2015, traffic dropped sharply late last year. But carload volumes rose in the first quarter of 2017 after the US presidential inauguration ended months of political uncertainty.
The recovery gathered steam in early 2017, with volumes up 8 percent through April, the fourth straight monthly rise. At the same time, railroads are becoming more efficient. Despite last year’s revenue and volume declines, operating ratios improved 100 basis points on average as railroads focused on productivity; and service levels went up as railroads reduced dwell times and increased train speeds.
Precision railroading comes to CSX
The biggest news in North American railroading came when CSX appointed Hunter Harrison as CEO at the behest of an activist shareholder. Harrison has promised to introduce his precision railroading operating philosophy to the CSX network. Precision railroading imposes strict schedule discipline to improve service, increase operational efficiency, and boost asset utilization. Precision railroading also involves longer trains and faster yard throughput, which could reduce congestion and limit the need for infrastructure investments.
CSX may be Harrison’s biggest challenge so far, requiring the veteran rail chief to drive efficiencies in the dense “spaghetti bowl” rail network on the East Coast. If he makes good on
US railroad tra�ic(Thousand carloads)
Note: YoY is year-on-year.
Sources: Association of American Railroads; A.T. Kearney analysis
Figure 142016 carloads trended below 2015 for most of the year, but 2017 had a strong start with an 8% YoY increase in April
240
270
300
310
280
290
250
260
220
230
2017
2016
2015
2014
Dec.Nov.Oct.Sep.Aug.Jul.Jun.MayApr.Mar.Feb.Jan.
+8%

20Accelerating into Uncertainty
Figure 15Revenue per carload, a key measure of core pricing, was weak across all railroadsand multiple commodities in 2016
Revenue per carload, by commodity1(% change versus previous year)
UnionPacific
Agricultural
Chemicals
Automotive
Industrial andconsumerproducts2
Coal
Intermodal
NorfolkSouthern
Kansas CitySouthernBNSF CSX
1 Carload is the unit for all commodities, and container/box for intermodal.
2 Industrial and consumer products include metals, construction, minerals, and forest products.
Sources: Annual reports; A.T. Kearney analysis
–3%
–3%
–6%
–3%
–7%
+0.2%
–6%
Included inconsumer products
Included inconsumer products
Included inconsumer products
–7%
–6%
–1%
–1%
+1%
+2%
+0.2%
–1%
+3%
–8%
–2%
–1%
–2%
+4%
+2%
–3%
–11%
–2%
–18%
+1%
his vow to “eat the spaghetti,” other US railroads may face shareholder pressure to adopt Harrison’s operating philosophy.
No turning back
Events at CSX brought a dramatic end to a year that saw little change in rate and volume trends across the rail sector. Railroads face a new era and will need to adapt to a new reality. Despite the recent rally in coal volumes, coal and crude shipments will likely remain well below previous highs. Operating models are ripe for change, and supply chain innovations promise sharper cross-modal competition in coming years.
“We’re concerned about congestion points in US logistics. Ocean shippers are forming alliances and building bigger ships that handle more containers. This trend might suggest a cutback in the number of sailings, which could worsen the congestion in ports. In rail, carriers are streamlining their operations and consolidating cars into fewer and longer trains. Fortunately, the ocean ports and railroads are investing in capacity upgrades. Automated container terminals and new railcars and switching yards are improving carrying capacity and fluidity. However,

21Accelerating into Uncertainty
many of our logistics service providers and customers are not set up to deal with the volume of cars that will be delivered to them during peak shipping periods, backing up the local rail network. That is why companies are investing in platforms away from the ports and congested shipping areas to make sure they can handle larger volumes.
One of the things we’ve been experimenting with is milestone-based visibility for ocean freight, seeking visibility capability similar to what consumers already have with parcel shipping. We’re also interested in autonomous vehicle technology. Self-driving trucks could tip the balance between rail and road shipping in many cases. Today, rail is safer and more efficient over long distances. The picture might change if autonomous trucking allows motor carriers to operate with fewer drivers and higher capacity utilization. At this point, new trucking options are in the what-if phase. We need more research on costs and benefits, along with solid evidence on safety, which is our top priority.”
Logistics sourcing executive, global chemical company
Water: A Stormy Year
Waterborne shipping rates fluctuated dramatically in a tumultuous year for the $41 billion industry, with ripples across both the deep-sea and inland waterway segments, worth $25 billion and $16 billion respectively. Excess capacity drove rates to historic lows below $1,000 per TEU early in the year until a major carrier’s bankruptcy roiled markets. Shippers that went to market in the spring locked in price reductions of 20 to 40 percent on average, with some saving as much as 50 percent. But spot rates shot up as much as 200 percent for shippers that were forced to scramble for cargo space after Hanjin Shipping went under during the peak retail shipping season.
Carriers have managed to hold onto a good portion of those rate gains so far in 2017, largely by idling ships and accelerating scrapping to constrain capacity. But if history is any guide, capacity discipline will crumble as carriers continue building ever-larger ships that swamp the market with new supply and send prices plunging (see figure 16 on page 22). Already, Alphaliner predicts carriers will boost net capacity 3.4 percent in 2017, well above the 2.4 percent 10-year compound annual growth rate of containers in the NAFTA area.
Along with financial turmoil, 2016 brought structural change as carriers realigned their vessel-sharing agreements for the first time in a decade and M&A activity continued apace. Infrastructure also evolved with the widening of the Panama Canal and the opening of an automated terminal at Long Beach. In 2017, consolidation, capacity issues, and carrier finances will continue shaping the market. Meanwhile, ports will seek efficiencies from new technologies and invest in infrastructure as cargo volumes shift from West Coast ports to Eastern harbors.
And then there were three: consolidation under pressure
A seismic shift shook the vessel-sharing landscape in April 2016, when four carrier alliances became three larger groups collectively representing more than 90 percent of capacity on major trade routes across Europe, Asia, and North America. The realignment requires shippers to reconfigure their networks to mitigate the risk of service interruptions and shipment delays.

22Accelerating into Uncertainty
Global container shipping capacity(million TEU and TEU per ship)
Note: TEU is 20-foot equivalent unit. Numbers may not resolve due to rounding.
Sources: Alphaliner; A.T. Kearney analysis
Figure 16Over the past decade, the industry has added capacity at a rate of nearly 10% per year
33%5,100 – 10,000
14%10,000 – 13,30014%
13,300 –17,999
6%18,000+
12%0 – 1,999
26%2,000 – 5,099
32%5,100 – 10,000
23%0 – 1,999
44%2,000 – 5,099
2017:21.9
2007:8.8
Fearing the worst, shippers are looking to distribute cargo among alliances, seeking out carriers with stable networks and considering alternative shipping modes.
Mergers and acquisitions continued among carriers hoping to gain pricing leverage with shippers. CMA CGM absorbed APL, and COSCO merged with CSCL, extending a merger wave that has further concentrated the industry. The top three companies now control 40 percent of capacity, up from 12 percent in 2012. Yet the Herfindahl measure of market concentration rates cargo shipping as a moderately concentrated industry, easing worries of imminent sustained price increases.
Indeed, the Hanjin bankruptcy underscored the financial weakness of major carriers. In addition to a short-term rate increase, the episode triggered concerns about carrier financial risk among shippers negotiating new contracts. While rates are likely to remain near historic lows, carriers’ long-term viability remains questionable.
Similar trends are playing out in domestic shipping. Inland waterway transporters saw petro-chemical volumes decline in the Midwest, and Kirby reported that rates and barge utilization fell in coastal markets during the first quarter.
Infrastructure and innovation
Consolidation is sparking infrastructure investment and technology adoption across the industry. Ports are investing in automated systems to handle larger ships carrying more containers.

23Accelerating into Uncertainty
The first stage of a $1.3 billion automated Middle Harbor Terminal at Long Beach opened last year. Like TraPac’s automated terminal at Los Angeles, it cuts truck turn times in half.
Union resistance may slow automation of US ports. A work slowdown in response to automation at the Port of Charleston early this year confirms labor still has power to affect port operations. Another impediment to technology investment is the reluctance of money-losing carriers to pay higher terminal fees necessary to cover the cost of automation.
New Panama Canal locks, which opened in 2016, increase the need for additional infrastructure. Ports along the Gulf and East Coasts expect a shift in traffic from West Coast terminals to emerge slowly in coming years, although recent data show no such migration (see figure 17). Louisiana ports are seeking approval for dredging that will enable them to accommodate massive Neo-Panamax ships, while the Port Authority of New York and New Jersey recently raised the Bayonne Bridge so larger vessels can pass under the span.
Looking ahead, a structural capacity overhang, coupled with lax pricing discipline among carriers, will likely keep rates at historic lows for the next few years. Carriers will continue to seek economies through scale and automation, eventually creating a more-consolidated industry with a lower cost base, but increasing financial risks for carriers and service risks for shippers in the short term.
Air Freight: Gravity Reasserts Itself
Air freight volumes surged in late 2016, rising 9.8 percent on a year-over-year basis as disruption in ocean shipping temporarily offset chronic overcapacity in airline cargo holds. Rising demand lifted rates 20 percent in the first quarter of 2017 over the same period in 2016, but prices remain more than 25 percent below first-quarter 2015 levels (see figure 18 on page 24).
Container tra�ic at major West and East Coast ports(TEU)
Notes: TEU is 20-foot equivalent unit. LA/LB is Los Angeles/Long Beach. Hou-Sav-NYC is Houston-Savannah-New York City.
Sources: Alphaliner; A.T. Kearney analysis
Figure 17There are no signs of tra�ic shift from West to East Coast since the Panama Canal expansion
600,000
800,000
1,000,000
1,200,000
Apr-17Jan-17Oct-16Jul-16Apr-16Jan-16Oct-15Jul-15Apr-15Jan-15
Expansion ofPanama Canal
HOU-SAV-NYCLA/LB

24Accelerating into Uncertainty
Demand is expected to be strong for the next five years, powered by e-commerce and pharma-ceutical shipments. Such pricey cargo is the lifeblood of air freight, which represented less than 1 percent of global shipping volumes last year but more than one-third of total value. Used primarily on intercontinental routes as a speedier alternative to cargo ships, air freight depends heavily on international trade. A subdued global economy dampened demand during much of 2016, until Hanjin Shipping’s bankruptcy sent ocean shippers scrambling to find capacity at any price. Looking forward, however, air freight demand likely will suffer if increasing protectionist sentiment around the world constrains global trade.
A fundamental disconnect
Despite healthy demand, excess capacity keeps rates in check. Air freight capacity is driven by demand for commercial passenger service, not cargo shippers’ needs. Expanding global air travel means more planes aloft with room in their bellies for cargo. Airline pricing dynamics further depress air cargo rates; unlike freight haulers, which set rates based on costs to ensure profitability, airlines view freight fees as “found money” and therefore accept lower prices. Still, carriers sometimes adjust networks to accommodate freight shippers. American Airlines, for example, expanded service between Philadelphia, where many drug companies are headquartered, and Puerto Rico, where many have production facilities.
Customer interactions remain tied to the forwarding industry, as airlines and shippers display no interest in forming direct relationships. Shippers rely on forwarders to secure enough capacity to maintain stability in their air networks.
Drewry Air Freight Index from Shanghai to Los Angeles($ per kilo)
Notes: Intel shows average of all-in air freight buy rates paid by forwarders to airlines for standard deferred airport-to-airport air freight services. YoY is year-on-year.
Source: Drewry’s Sea & Air Shipper Insight
Figure 18Despite a slight YoY rate increase, air freight prices in Q1 2017 remain lower than those of Q1 2015
2.0
3.0
4.0
5.0
May-17Jan-17Sep-16May-16Jan-16Sep-15May-15Jan-15

25Accelerating into Uncertainty
Freighter airlines enjoy some pricing leverage for premium services such as transporting hazard-ous materials and oversized cargo. Today, freighter airlines transport more than 70 percent of all cargo shipped on the two largest air freight routes: Asia to North America and Asia to Europe.
“We’re a big user of air freight because of the nature of our products. Prices are starting to rise after last year’s trough. We’re also finding it harder to determine who is handling our shipments at any given time, which poses a challenge when something goes wrong. While these trends might be cyclical, we do observe four structural problems in the logistics market. The first is limited organizational learning within large integrated service providers. Very few provide the uniform service levels and consistent best practices I expect as a shipper. A second concern is rising labor costs, particularly for low-skill, labor-intensive services. If the increases continue unchecked, our costs could rise 25 to 35 percent. That’s unsustainable for us. We’re disappointed that providers have been so slow to offset higher wages by adopting new technologies that improve efficiency. The third issue is accessorial models that leave us without visibility into 30 to 40 percent of the services we’re paying for. Fourth, we’re frustrated by the prevalence of paper in logistics. When will the industry go green and digital and stop relying on tools from Paul Revere’s day?”
Director of logistics procurement, high-tech company
Cost-cutting and consolidation
To offset depressed load factors, freighter airlines are developing innovative cost-cutting tactics, such as dedicated hubs at smaller airports that offer lower freight handling fees and greater scheduling flexibility. Investment in software is growing as creative routing techniques become essential to profitability. In January, Lufthansa launched a tech incubator for air freight start-ups. Simple steps also help: American Airlines saved $1.2 million a year on fuel by substi-tuting iPads for 40-pound protocol manuals in every cockpit.
Along with cost-cutting, airlines are consolidating to reduce supply. Expect more deals like Atlas Air’s 2016 acquisition of niche player Southern Airlines. Internationally, freighters are forming code-sharing alliances, including a partnership announced earlier this year by Lufthansa and Cathay Pacific. The two mega-carriers are cooperating on network planning, sales, IT, terminal space, and more. Like passenger airline alliances, freighter partnerships will cut costs for carriers while lowering rates for shippers.
Pipeline: Pullback Positions Industry for Growth
The midstream oil and gas pipeline industry retrenched last year as volumes and rates flattened out under pressure from substandard oil prices. Pricing came under new pressure when federal regulators reduced the index level for calculating interstate oil pipeline rate ceilings during the five-year period starting July 1, 2016. Pipeline companies focused on conserving capital last year, rather than adding infrastructure for a resurgent US energy sector. However, the newfound fiscal discipline positions operators to benefit from improving demand trends this year, and to capitalize on the improving political climate for energy investment.

26Accelerating into Uncertainty
Risk appetite declines with oil prices
West Texas Intermediate crude oil prices hovered below $55 per barrel—roughly half the prior peak price—throughout 2016, triggering a wave of cutbacks at pipeline operators. Capital spending fell, headcounts declined, and major players such as Kinder Morgan slashed dividends as much as 75 percent.
Recognizing that the steep downturn was not unprecedented, companies adroitly managed unfavorable conditions (see figure 19). They bolstered their balance sheets and sharpened their P&L management. Survivors emerged stronger and more resilient.
Crude oil prices: WTI ($ per barrel, constant 2016)
Time to recovery (months)
Note: WTI is West Texas Intermediate.
Sources: EIA; A.T. Kearney analysis
Figure 19West Texas Intermediate crude prices experienced a steep but not unprecedented downturn in 2016
$0
$30
$60
$90
$120
$150
2016201420122010200820062004200220001998
Economic crisis inAsia; OPEC increasesproduction quotas
Weak USeconomy;increases innon-OPECproduction
OPEC holdsto productionquotas in faceof shale
–80%
–60%
–40%
–20%
0%
2014–present
2001–02 1996–99
4035302520151050
31 months

27Accelerating into Uncertainty
Demand trends improve
Recent figures from the US Energy Information Administration show oil supply and demand coming into closer balance, a trend likely to bolster prices and benefit pipeline companies in 2017.
By 2019, ripple effects of low oil prices are expected to generate a full recovery in demand for line pipe, the largest midstream business segment (see figure 20). Petrochemical companies tend to ramp up production when declining oil prices drive down the cost of their primary feedstock, petroleum. Midstream companies are well-positioned to capitalize because their pipes can transport petrochemicals as easily as oil.
Demand for gas transport also is expected to rise in 2017. An increase in oil drilling will release significant quantities of natural gas, and gas wells in the Northeastern United States are running full-tilt. Liquefied natural gas (LNG) for export is another potential source of new pipeline demand.
The brighter demand outlook strengthens the case for expanding pipeline systems that still haven’t caught up with the surge in US oil and gas production since 2011. Less clear is how much new infrastructure the industry needs. Capacity requirements hinge on such variables as the evolving US energy mix and global demand for American LNG.
Political barriers fall, incentives to invest rise
A changing political environment may encourage pipeline companies to add capacity. The administration is following through on campaign promises to ease regulatory restraints on domestic energy production, having removed obstacles to construction of the Keystone XL and Dakota Access pipelines. Trump also has the opportunity to fill three vacancies on the
US liquid chemicals demand (million barrels per day)
Figure 20Low oil prices are expected to lead to increased demand for pipelines
Sources: EIA: A.T. Kearney analysis
35.8
36.0
36.2
36.4
36.6
36.8
37.0
37.2
37.4
37.6
37.8
38.0
2015 2016 2017 2018f
HistoricForecast
3.24% increase
1.55% increase

28Accelerating into Uncertainty
five-member Federal Energy Regulatory Commission, which has considerable authority over interstate pipelines.
With leaner cost structures, improving industry fundamentals, and favorable political condi-tions, pipeline companies can grow profitably at lower prices. Strong signs that demand will continue to outpace capacity growth in several regions should spur investment by a risk-averse industry that generally commits capital only when firm transport volumes justify the outlays. And the industry’s increasingly sophisticated financial practices are likely to improve returns on those investments.
Freight Forwarding: Disruption Stalks a Slumping Sector
The freight-forwarding business is on the verge of disruption as global economic trends pressure profit margins while new competitors and technologies undermine longstanding business models. Subdued global trade threatens short-term demand for forwarding services, which focus heavily on international air and ocean shipping. Traffic is easing on primary east–west trade routes, and the Chinese economy—once a boon to forwarders—has cooled off.
More troubling from a long-term perspective is rising protectionism around the world. This trend snuffed out the Trans-Pacific Partnership, a potential trade catalyst, and now threatens existing trade deals such as the North American Free Trade Agreement. Any retrenchment in globalization is bad news for freight forwarders. Even worse would be large-scale repatriation of manufacturing to the United States and other developed countries.
Macroeconomic worries come at a bad time for an industry battling profit pressures. Consoli-dation and overcapacity among ocean carriers are squeezing forwarders. As carriers combine, they are gaining leverage over middlemen. Compounding the problem is a broad-based volume shift to ocean from air freight as excess capacity depresses seaborne shipping rates.
Meanwhile, forwarders face increasing service demands. Supply chains have become more complex as e-commerce scatters shipments across more destinations and ramps up shipping frequencies. Shippers want greater transparency and reliability, not to mention advanced pricing and routing capabilities—all at the same or lower prices.
New competitors and technologies change the game
As freight forwarders struggle to adapt, outsiders see opportunity to disrupt a largely paper-based industry filled with intermediaries and clinging to outdated practices. The traditional forwarding model relies on big customers for scale, and bolsters margins by charging higher rates to smaller shippers. That approach is under threat from digital platforms such as Flexport and Freightos, which create new options for shippers.
Deep-pocketed interlopers including technology giants IBM, Verizon, and T-Systems offer cutting-edge digital capabilities unavailable from most forwarders. And e-commerce power-houses Alibaba and Amazon are inviting other shippers to help fill space in their cargo containers, cutting forwarders out of the loop. In air freight, Delta and Etihad airlines are working to bypass forwarders and deal directly with shippers. Some forwarders have answered with their own technology initiatives. For example, DAMCO recently launched a digital freight-forwarding service called Twill.
Yet many forwarders lack the capital to place big technology bets. Smaller players still dominate the business, with the 20 largest providers controlling just 58 percent of the market.

29Accelerating into Uncertainty
As commoditization of ocean and air forwarding compresses profit margins, forwarders are turning to consolidation. Last year, DSV acquired UTi Worldwide in a $1.4 billion deal.
We expect consolidation to continue as forwarders look to build scale, expand their reach, and acquire new capabilities. Eventually, the industry is likely to coalesce around a base of big players with about 80 percent of the market. These larger forwarders will be better-positioned to compete with new entrants, keep pace with innovation, and meet evolving service expectations.
Third-Party Logistics: Growth and Change
The US 3PL market expanded again in 2016, as outsourced logistics spending rose 3.6 percent from 2015 to 2016, reaching $166.8 billion (see figure 21). Early indications for 2017 show demand continuing to rise with a strengthening economy, although growth has slowed since 2014. As demand grows, the industry is evolving away from a transactional business model focused on discrete services such as transportation management or warehousing and toward a one-stop-shop model for end-to-end logistics solutions.
Shippers seek one-stop shops and control towers
Our conversations with shippers revealed that demand for one-stop logistics services is strongest among small companies that spend less than $30 million a year on logistics and large shippers that spend more than $300 million (see figure 22 on page 30). Smaller shippers say one-stop shops offer access to larger volumes across various transportation modes, while large shippers hope single-source providers can better manage complex worldwide logistics networks and global P&L requirements. Less interested in a one-stop shop model are mid-sized shippers with sufficient volumes to handle the function in-house and a desire for greater control of their logistics.
The rise of the one-stop-shop model has sparked consolidation among providers scrambling to assemble a comprehensive package of services. Major recent deals include XPO’s acquisition
Figure 21The US 3PL market grew for a 7th consecutive year in 2016
Note: 3PL is third-party logistics.
Sources: Armstrong & Associates, Inc.; A.T. Kearney analysis
US 3PL provider revenue($ billion)
20162015201420132012201120102009
167161158147142134127
107
8.1%
2.8%

30Accelerating into Uncertainty
of Norbert Dentressangle, the parent company of Jacobson Warehouse Company, and the subsequent purchase of XPO’s truckload business by TransForce in October 2016. Last May, FedEx expanded its European presence with the $4.8 billion acquisition of Dutch delivery company TNT Express. In early 2017, UPS acquired Freightex, and Genpro bought Cargo Chief. Other 3PL providers are building one-stop capabilities through partnerships; for example, supply chain consultancy Tompkins International joined forces with Kenco Logistics, NFI Interactive Logistics, and JDA Software Group to offer rapid deliveries across the country.
“As the world becomes more complex and interconnected, businesses need to focus on their core competencies and form value-driven partnerships in other areas, such as supply chain management. Partnerships should be based on trust and a strategic mindset, rather than a transactional focus. Define clear goals and empower the experts to make it happen. The right external relationships are more important than ever, with so many new technologies on the horizon. I see great potential benefits from automation, artificial intelligence, big data, blockchain, and other advances. You can accomplish a lot in a relatively short time; look how far retailers have come in the past few years. Unfortunately, we in logistics still haven’t overcome our tendency to embrace innovation slowly, if at all.”
Miguel Gonzalez, Director of Global Logistics, DuPont
Figure 22One-stop-shop services are an emerging 3PL revenue segment and represent a substantial combination of others
Note: 3PL is third-party logistics.
Sources: Armstrong & Associates, Inc.; A.T. Kearney analysis
Brokerage
Freight forwarding
Value-added warehousing and distribution
Dedicated contract carriage
Contract software/systems
One-stop-shop
Non-asset-based value-added transportation management services dealing with shipments originating in and destined to North American points
Non-asset-based value-added international transportation management services dealing with shipments originating in or destined to North American points
Long-term contract warehousing or distribution center operations with a host of value-adds
Dedicated contract carriage services supplying tractors, drivers, and management; trailers are normally included
Software solutions for the purposes of transportation management
A substantial combination of the above services provided in-house by 3PL, as needed by the shipper, without sub-contracting to other providers
Service type Description
Descriptions of main 3PL provider revenue segments

31Accelerating into Uncertainty
In another sign of rising customer expectations, some shippers are asking 3PLs for control tower systems in which a dedicated team oversees an entire logistics network. Control towers help manage risk and drive efficiency across complex global networks. But most are custom-tailored for a single shipper, making off-the-shelf systems hard to find. As a result, some shippers are setting up in-house control towers.
The one-stop shop: assembly required
The one-stop shop is already boosting profits at providers such as XPO, but customers are still waiting for operational efficiency and service to improve. In our conversations, smaller shippers said true end-to-end solutions remain hard to find. Larger shippers told us 3PLs are good at solving complex operational problems and implementing new software but don’t provide enough thought leadership, share best practices, or offer solutions across industry verticals. For their part, shippers tend to deal with 3PLs on a transactional basis, hammering down unit prices rather than forming strategic relationships that deliver greater overall savings.
3PLs face many challenges as they absorb acquisitions and fashion integrated service offerings that benefit shippers. They are working to rationalize their own systems while reconciling the vagaries of shippers’ operations, which often include myriad IT systems that impede visibility across logistics networks, and fragmented procurement practices that frustrate efforts to create value through bundled services.
3PLs that offer the right combination of integrated services to small shippers and sophisticated expertise to larger customers will differentiate themselves from competitors. Cross-selling opportunities and new efficiencies will increase their profits, generating funds to invest in capabilities that sharpen their competitive edge. We expect the one-stop shop to become the dominant 3PL business model in five to 10 years as large providers offering end-to-end logistics move beyond price-focused, transactional relationships with shippers to form true partnerships that generate long-term value by improving processes.
Warehousing: Growing Pains at the Heart of the Supply Chain
Warehouses are filling up fast as the economy strengthens and e-commerce surges. Space availability fell to a historic low of 8.2 percent by the fourth quarter of 2016, driving rental rates up 6.9 percent. The record didn’t last long: availability dropped to a new low of 8 percent in the first quarter of 2017 (see figure 23 on page 32). Total US expenditures on public and private warehousing rose 1.8 percent to $143.5 billion last year, and forecasters predict steady industry growth of 3 percent annually through 2021.
Yet rising demand and shrinking supply haven’t lifted warehouse operators’ profit margins, which range from 3 percent to 6 percent. And warehouse companies face multiple headwinds as labor costs rise, investment needs escalate, and political uncertainty increases. The year ahead will challenge warehouse operators to navigate these trends while building holistic, flexible networks capable of providing the rapid order fulfillment today’s consumers have come to expect.
Everybody wants more
Warehouse companies are under pressure to move goods faster as consumers demand same- day delivery and omnichannel ordering explodes. These new requirements add complexity

32Accelerating into Uncertainty
Figure 23Average availability of US warehouse space continues to decline
US warehouse availability(%)
Source: A.T. Kearney analysis
Q1 2016 Q2 2016 Q3 2016 Q4 2016 Q1 2017
8.9 8.7 8.4 8.2 8.0
–10%
to every aspect of warehouse operations, from networks to warehouse layouts and fulfill- ment processes. Operators looking for tools to manage these complexities efficiently will increasingly turn to new technologies such as automation and advanced warehouse management systems.
Rising labor costs will create additional incentive to automate. Some 21 states have raised minimum wage above the federal minimum of $7.25 per hour, action likely to boost warehouse wages from today’s average of about $11.80 per hour. Since labor represents 50 percent or more of warehouse costs, owners may try to recoup the increase by raising rates. That worries customers, who would prefer that operators offset rising costs by improving productivity.
Potential changes in US trade policy add more uncertainty for warehouse owners, which depend on international commerce for a major slice of revenue. Tariffs or other policies that limit imports could drive up costs, depress revenues, and squeeze profits. And a rise in domestic manufacturing could overburden US warehouses and force operators to reconfigure their networks at considerable expense.
Turning to technology
Warehouse operators are responding to these interrelated challenges with all-encompassing strategies that rely on technology to enhance both network structure and productivity. To accelerate fulfillment and meet an expanding array of service-level requirements, operators are building forward-deployed networks and dedicated e-commerce warehouses. Many are also designing seamless inventory systems that integrate warehouse fulfillment across various customer purchasing channels to create omnichannel delivery capabilities. Widespread adoption of fulfillment methods such as ship-from-store and in-store pickup of online orders is improving inventory allocation, speed-to-market, and peak-season varia- bility management.

33Accelerating into Uncertainty
“Customer service is paramount for any retailer. At Cabela’s, supply chain management and logistics play a crucial role in getting customers what they want when they want it. That’s why we own and manage distribution centers ourselves and invest heavily in automation, labor management software, and other productivity enhancements. We treat all our assets as logistics tools, incorporating stores into our order preservation strategies by fulfilling some online orders from retail locations when the product is out of stock in our distribution centers. Third-party logistics providers that want to grow in retail should realize that their value depends on knowing what consumers want and helping retailers give it to them.”
Scott Collignon, Senior Director SC Ops and Strategy, Cabela’s
These capabilities entail significant investment by an industry that is not used to spending big money on technology. Narrow profit margins leave warehouse owners with little excess cash for investment, holding back technological evolution at many warehouses.
Yet automation and other advanced systems can ease the cost pressures that are squeezing warehouse margins and give operators the new capabilities they need. With wages increasing, some operators are boosting employee productivity with technologies such as pick-to-light, voice, and automated picking requests. Robotics, the ultimate labor-saving technology, also holds great promise for warehouses; self-guiding robots move materials quickly while learning the warehouse landscape, further improving efficiency.
Advances in warehouse management systems create more opportunities to boost productivity. New mobile apps allow managers to monitor distribution center floor activity, benchmark performance with analytics, and optimize labor costs in real time. These systems have generated savings in the range of 15 to 25 percent for companies focused on labor optimization. As a cautionary note, any warehouse operator looking to boost productivity should also pay attention to employee satisfaction because workforce attrition can dilute the efficiencies gained from new systems.
Warehouse operators maximize the benefits of technology when they use it end to end. Sophisticated warehousing software and cloud-based services reach beyond the warehouse, gathering upstream order information and downstream transportation data. Players throughout the supply chain benefit as seamless connectivity creates a fully integrated system capable of responding quickly to constantly changing customer needs.
Customer expectations of ever-faster delivery pose a significant challenge for any company with warehouses in its distribution network. Such companies must make informed decisions about how they will meet those expectations. Some will choose to manage warehouses inter-nally, and others will engage third-party warehouse operators. Companies that manage their own warehouses must adopt new technologies quickly and continuously improve productivity to offset rising labor costs and the effects of political uncertainty. Companies that outsource the function should collaborate closely with their third-party warehouse operators to combat capacity constraints and rising costs.

34Accelerating into Uncertainty
Logistics Trends and Outlook: Technology Drives the Action While Policy Sets the Pace
“We believe the global transportation industry is in the early innings of secular change brought on by new technologies and new players. As we’ve seen in other sectors that have undergone similar secular change, there remains healthy investor skepticism on the timing and pace of change as well as the likely winners and losers. Traditional business models are being challenged, but for now, incumbents believe they can invest or adapt to the change.
In road, the advent of platooning (2018) could drive powerful near-term benefits, followed by additional efficiencies when autonomous trucks hit the highways (2020). Early adopters will gain from significantly lower costs, higher utilization, and industry consolidation. Technology also could introduce the first significant barriers to entry in the trucking space as capital and technology expertise become necessary to compete.
In logistics, new start-up disrupters as well as insourcing by e-commerce and transportation giants, asset based carriers, and even OEMs could convert a ‘people business’ to a ‘technology business’ and pressure margins.
In parcel, we are cautious on the legacy US parcel carriers as we foresee pressure on volumes, pricing, and margins from a range of factors, including insourcing at e-commerce companies, the omnichannel shift, a resurgent USPS, and the fundamentally deflationary nature of e-commerce shipping.
In rails, we do not see as much potential for direct technology disruption but believe that lower costs of trucking driven by new technologies could constrain growth in the intermodal business.”
Ravi Shanker, Lead Freight Transportation Analyst, Morgan Stanley
Technological Innovations: Firm Steps on a Long Journey
Changing consumer trends and innovations catalyzed by today’s nascent technology are shaping the next-generation supply chain. Customers will expect immediacy, personalization, and convenience; new technologies and advanced analytics will be the enablers.
A fluid, connected digital supply chain would allow manufacturers and retailers to fulfill shipments from assembly lines, warehouses, urban distribution centers, and brick-and-mortar stores. Inventory requirements may decline as 3-D printing enables manufacturers to fabricate spare parts on demand and retailers to personalize merchandise for individual customers. With shipping focused on same-day, last-mile delivery, new vehicles such as sidewalk robots and aerial drones would proliferate. Algorithms matching carrier or OEM assets to shippers’ needs would give rise to a ride-sharing model for long haul shipping, further encouraging shared

35Accelerating into Uncertainty
vehicle ownership and reducing demand for vehicles. Carriers would invest in sustainable assets that save money and resonate with environmentally conscious consumers.
This compelling vision is also a distant one. Many of the most impactful new technologies are still in their early stages. Combine that with a logistics industry that traditionally is a slow adopter of new trends, and a cautious regulatory environment, and it becomes clear that the promises of innovations will not be fulfilled any time soon.
However, some significant advances are already taking root. The logistics community is devel-oping a wide range of next-generation capabilities that will disrupt multiple modes of transpor-tation. In figure 24, we categorize these innovations based on the underlying driving forces that enable their development.
Connected vehicles and “Uberization” have the greatest near-term disruptive potential. Several manufacturers already produce connected trucks outfitted with hundreds of sensors that collect and transmit vehicle performance data, enabling carriers to increase uptime through predictive maintenance. “Uberization,” on the other hand, is an asset-light model that many companies are using to connect shippers and carriers directly, potentially displacing traditional brokers over time. Uber Freight has been launched and promises instant supply and demand matching and real-time pricing. Still, some shippers and carriers are reluctant to adopt the ride-sharing model that is so popular among consumers. After all, moving enormous quantities of cargo worth millions of dollars across continents and oceans requires higher levels of planning, qualification, and service than ferrying passengers across town.
Figure 24A range of new technological innovations is expected to impact the transportation industry over the next 10 years
Innovation grid: a 10-year outlook
Impact
Sharing economy
IoT and analytics
On-demand logistics
Alternative energy
Autonomous solutions
Notes: IoT is Internet of Things. UAV is unmanned aerial vehicle. OTA is over-the-air.
Source: A.T. Kearney analysis
Timing
High
Medium
Low0 years 5 years 10+ years
Uber for truckersElectric fleets
Fleet monitoring system
Predictive cruise control
OTA engine updates
Coopetition supplychains
Semi-autonomous trucks
On-demand courier delivery
Remote diagnostics
Warehouse sharing
Cloud logistics
Anticipatory logistics
Augmented reality
Vehicle e-wallet
Platooning
Circular economy logistics
Tube logistics
Omnichannellogistics
Hydrogen fuel cells
Fully autonomous trucks
Drone and UAV delivery
Logistics marketplace
On-demand 3-D printing
Airless tires
Bionic enhancements
Multipurpose networks

36Accelerating into Uncertainty
Figure 25A number of logistics industry trends could transform the industry
Con
nect
ed v
ehic
les
Description and implications• IoT devices will transform vehicles into a fully-connected asset for driver management, vehicle management, and logistics management• Connected vehicles provide visibility to improve vehicle/driver performance and monitor equipment condition, enabling predictive maintenance and risk management• Enabler of new business models related to ownership and operations
2020 outlook• ELD requirements and the desire for more transparency will push carriers to install more monitoring capabilities in trucks• The number of trucks connected will rapidly increase, as will the scope of their connectivity—shippers, third-party logistics providers, other trucks, and regulators
Progress to date• There are nearly 1,000,000 vehicles on the road that are part of a network of companies such as Daimler and Navistar• Mercedes-Benz monitors truck systems using the FleetBoard Truck Data Center to avoid breakdowns, predict repairs, and provide real-time support
Aut
onom
ous
vehi
cles
Description and implications• With driver-assisted vehicles, drivers have time to perform other tasks in the carriage—paperwork, communication with shippers or destinations, and preparation for the next trip• Fully autonomous trucks will enable financial and operational e�iciency
2020 outlook• Platooning will be the first mainstream application• Adoption of driver-assisted trucks that are autonomous on the highway will emerge• Fully autonomous trucks will be in advanced stages of development and testing in urban environments
Progress to date• Start-ups rapidly enter the driverless vehicle space• Technology is essentially already developed for the highway• Otto successfully tested autonomous truck to transport a Budweiser trailer across 120 miles in Colorado
Elec
tric
flee
ts
Description and implications• Government regulators, shippers, and consumers have pushed logistics providers to use alternatives for fossil fuels and reduce emissions
2020 outlook• Alternative powertrains—mainly electrified powertrains for city use—will gain market share• Hydrogen fuel cells will be applied to other warehousing operations as a power source
Progress to date• Amazon invests in hydrogen fuel cell forklifts• Alternative powertrains in development for trucks• Tesla Semi is to be released in September 2017 • Nikola Motor Co. unveils Nikola One Hydrogen Semi-Truck
“Ube
riza
tion”
for f
reig
ht
Description and implications• Computer-enabled matching can decrease excess capacity through e�icient matching of supply and demand• Such an app would enable increased transparency and streamlined communication, bypassing significant manual or personal intervention• Requires increasing development of standards for communication of requirements (on behalf of shippers) and capabilities (by carriers)
2020 outlook• Uber Freight will gain traction in the next few years as shippers and carriers transition from legacy manual/personal practices to a digital platform
Progress to date• Multiple start-ups—including Cargomatic, Convoy, Cargo Chief, Transfix, and Trucker Path—have entered the space, successfully raised millions in funding, and piloted the concept at smaller scales, in select regions• Uber launches Uber Freight for long-haul trucking
Ant
icip
ator
y lo
gist
ics
Description and implications• IoT devices connect, measure, and detect activity throughout the entire logistics value chain from origin to destination• Data provided by IoT can be utilized for performance visibility as well as enhanced predictive and prescriptive analytics (including artificial intelligence) to optimize scheduling, routing, asset utilization, and overall performance
2020 outlook• Analytics and AI will be embraced by leading shippers and carriers (top-quartile performers) to optimize supply chain performance• The logistics industry recognizes the importance of predictive analytics, which was identified as having the biggest impact on supply chain this decade
Progress to date• In-transit shipment monitoring is enabling risk manage- ment and real-time schedule/route optimization• Analytics and AI are optimizing asset repair and maintenance of in-transit vehicles• Only 17% of supply chain professionals use predictive analytics today
Source: A.T. Kearney analysis

37Accelerating into Uncertainty
Although we understand concerns about the viability of a low-touch Uber-model in a more demanding and sophisticated supply chain, many find it hard to bet against Uber and the value of platforms.
Fully developed big data and analytics capabilities require significant investments in digital technologies that derive insights from huge swaths of data and drive action throughout the supply chain. Merely collecting information on transportation assets and cargo isn’t enough. All links in the supply chain need greater digital capabilities. Fortunately, many components of the digital supply chain, including sensors developed by the Honeywell–Intel partnership and data storage with Amazon or Microsoft, are becoming much more affordable.
Consumers’ desire for on-demand availability at all times affects the entire logistics process. Warehouse-sharing and instant 3-D printing are two examples of how these expectations are migrating from the consumer sector to business activities.
At the same time, new technologies reduce the importance of energy and labor costs as economic inputs in logistics. Energy efficient technologies and practices have weakened the link between energy prices and logistics costs, a trend likely to continue as electric powertrains and hydrogen fuel cells create alternatives to gasoline-powered vehicles. On the labor front, automation in cargo-handling and client-supplier communication makes the logistics sector less dependent on labor availability.
Several of these capabilities are coming on faster, with greater potential to transform logistics. Figure 25 on page 36 outlines some of the most tangible and impactful trends, their implica-tions, and their likely evolution between now and 2020.
Of course, any company hoping to fully exploit digital opportunities should realize that techno-logical self-sufficiency is an oxymoron. Partners across the value chain must also be connected and digitally capable. And companies aiming to capitalize on innovations will also have to navigate the new regulations that inevitably accompany new technology.
The nation’s supply chain is on the cusp of the fourth industrial revolution, driven by potential technological innovations that offer great promise but also bring the threat of disruption. Increased connectivity, advanced analytics, artificial intelligence, wearables, robotics, and other breakthroughs could transform today’s supply chain in fundamental ways. While technology will shape the next-generation supply chain over the long term, decisions by regulators and policy-makers in the near term will determine the speed and direction of its evolution.
Regulation and Policy: A Game of Dice
Policy, regulation, and technology are key variables for a logistics industry entering a transfor-mative period. Several outcomes are possible, depending on how those factors interact—with the foreign trade and regulatory policies of the new US administration playing a major short-term role. A.T. Kearney has developed four potential scenarios for the industry and assessed the implications of each (see figure 26 on page 38):
Scenario 1: Plain Sailing
With trade barriers and onerous regulations minimized, a truly frictionless market emerges, and competition among carriers drives down costs. Shippers benefit from lower costs and better service as carriers differentiate themselves through innovation. Investment in support-ing infrastructure is essential, but regulators try to balance safety and sustainability with

38Accelerating into Uncertainty
Figure 26Logistics providers face four possible strategic planning scenarios
Source: A.T. Kearney analysis
Leni
ent
Free Trade
Protectionism
Rest
rict
ive
Glo
bal t
rade
pol
icy
US regulatory environment
Stemming the Tide
stringent regulationwill accelerate the adoption of disruptive technology andautomation
Plain SailingA barrier-free openmarket will increase competitiveness among carriers across modes
In the DoldrumsTough investment and operating conditionswill raise costs and hinder technologicaladvancements
Choppy WatersBoosting Americanproduction will bring shifts in modal volumes but no major logistics growth
business-friendly deregulation. Meanwhile, powerful incentives to reduce trade inefficiencies spur adoption of new technologies like blockchain-enabled “smart contracts.”
Scenario 2: Choppy Waters
A renewed emphasis on American manufacturing and labor revives domestic industries such as heavy manufacturing and steel. The unique logistical needs of these industries lead to modal shifts: rail traffic increases while cross-border trucking and port activity decline as import tariffs and other trade barriers force companies to source more raw materials and components domestically. Carriers scramble to adjust their service offerings and assets, and shippers prepare for possible supply disruptions as carriers navigate the shift. From a technology perspective, “Uberization” of freight accelerates, taking on a key role in realigning inflexible freight networks to serve a growing domestic manufacturing base.
Scenario 3: Stemming the Tide
Tighter regulations on emissions and driving hours—perhaps accompanied by unionization of truck owner–operators—boost shipping costs and possibly diminish service levels. But rising global trade volumes motivate major carriers to pump capital into new technologies that reduce costs for shippers. Initial investments focus on established solutions that face fewer regulatory hurdles, such as truck platooning and clean-fuel vehicles. Carriers that can’t afford such investments fall behind.

39Accelerating into Uncertainty
Scenario 4: In the Doldrums
Restrictive US trade policies create strong headwinds for carriers while tough economic condi-tions impede adoption of new technology that might improve matters. A price-slashing race to the bottom ensues, leaving only the financially strongest carriers standing as overall volume in the industry declines. Shippers benefit from lower prices at first but eventually face higher rates as carrier attrition reduces industry capacity and import costs rise. Some carriers with financial wherewithal turn to technology for survival, adopting productivity-boosting tools such as predictive analytics and connected vehicles.
Each potential scenario carries distinct and specific implications for various US logistics stake-holders, but the likely net impact of any possible outcome is unclear. Forecasting the future is always difficult, especially in times such as these when an unsettled political environment makes it hard to predict the likelihood, breadth, and speed of potential policy changes. The first step in dealing with such uncertainty is to identify the major forces at play and articulate the most extreme manifestations of each. This analysis enables us to think about how each combination of factors could influence potential strategic responses. We consider technological innovations separately from regulatory and global trade policy scenarios because policy and regulation tend to follow, rather than lead, emerging societal and technical developments. In that context, regulation and trade policy can shape how technological advances affect logistics. Our goal in this report is to offer supply chain professionals a clear view on the current state of logistics and a flexible framework to guide their thoughts and actions as they prepare for—and work to shape—their futures. A well-informed evaluation of strategic choices will become more important for companies charting routes to growth in a world accelerating toward a new era of uncertainty.
Authors
Sean Monahan, partner, New York [email protected]
Michael Zimmerman, partner, New York [email protected]
Maxim Vanhencxthoven, consultant, Chicago [email protected]
Jeff Ward, partner, Chicago [email protected]
Balika Sonthalia, director, Chicago [email protected]
The authors would like to thank the following A.T. Kearney colleagues for their valuable contributions: Korhan Acar, Josh Brogan, Rupal Deshmukh, Matt Engel, Kushal Fernandes, Alex Frank, Jordan Hesterman, Jung Hong, Diane Johnson, Kai Kang, Ben Kuo, Dickson Li, Rosanna Lim, Shay Luo, Arsenio Martínez Simón, Alberto Oca, Courtney Rickert McCaffrey, Chris Shriver, Yan Sun, Rajesh Swaminathan, Daniela Taborga, Blake Ward.

40Accelerating into Uncertainty
AppendixEstimating USBLC
The CSCMP and A.T. Kearney strive to maintain maximum transparency and consistency. The assessment of assumptions, data sources, and methodologies that was made last year resulted in a robust research procedure that can be replicated for consecutive years. Because the structure of the supply chain did not significantly change compared to last year, it was deemed appropriate to keep the approach to estimate the USBLC unchanged. The report has been complemented with one additional section on warehousing so that each of the important components of the USBLC estimate now has its own specific describing commentary.
Historical comparability has been preserved and the three main categories of the past have been retained: transportation costs, inventory carrying costs, and other costs (see figure A on page 41).
Transportation costs
Transportation costs are based on Bureau of Economic Analysis (BEA) industry output. BEA US input-output accounts are a primary component of national income and product accounts and GDP. BEA uses the widest variety of available source data as input to the industry accounts. It incorporates domestic and import–export revenues where applicable. In other words, it includes any spend attributable to an establishment within the United States. It is rebalanced every five years against US Business Census data.
Our data partner IHS Markit used detailed BEA data, its proprietary databases IHS Markit Transearch™ and IHS Markit Business Market Index, and public company information to categorize sub-segments in a way that better reflects how transportation and logistics is purchased and used. Data was thoroughly reviewed to avoid double counting between segments.
No changes were made to last year’s segmentation and definitions:
• Motor carriers are segmented into full truckload, less-than-truckload, and private or dedicated carriers.
• Parcel includes US-based couriers and messengers and the USPS parcel segment, net of purchased transportation. The numbers are based on BEA output, modified to remove duplicate transportation from other modes (arising from, for example, intra-mode purchases).
• Air freight includes both cargo and air express. Consistent with BEA definitions, it incorporates both domestic and import–export revenues.
• Water includes coastal and Great Lakes, inland waterways, and deep sea. It incorporates domestic and import–export revenues.
• Pipeline reflects all commodity products.
• Freight forwarder is included, net of purchased transportation cost estimates, under carriers’ support activities in the “Other costs” category.
Inventory carrying costs
Inventory carrying costs are calculated from the bottom up using the sum of their three subcomponents: storage, financial costs, and other. Financial costs estimates the weighted

41Accelerating into Uncertainty
Figure A
Source: A.T. Kearney analysis
• Courier and messenger• USPS parcel segment
• Carload• Intermodal
• Full truckload• Less-than-truckload• Private or dedicated
Parcel • BEA input–output accounts, annual, production of commodities by industry, gross value
• IHS Markit• FedEx and UPS financial statements• US Bureau of Transportation, Form 41 Air Carrier Reports• USPS financial statements• USPS Cost Segment and Components Report
Rail • BEA input–output accounts, annual, production of commodities by industry
• IHS Markit• Association of American Railroads
• Domestic and import–export cargo and express
Air freight • BEA input–output accounts, annual, production of commodities by industry
• US Bureau of Transportation, Form 41 Air Carrier Reports• IHS Markit
• Inland• Coastal and Great Lakes• Deep sea: domestic,
import–export
Water • BEA input–output accounts, annual, production of commodities by industry
• IHS Markit
Motor carriers
Transportation costs
• BEA input–output accounts, annual, production of commodities by industry
• IHS Markit TransearchTM
Inventory carrying costs
Storage • BEA input–output accounts, annual, production of commodities by industry
• Armstrong & Associates, total US warehouse market
Other costs
Carriers’ supportactivities
• Freight transportation arrangement
• Packing and crating• Marine cargo, port, and
other shipping-related services
• All other support services to transportation
• BEA input–output accounts, annual, production of commodities by industry
• Public company financial statements• IHS Markit Business Market Index
• Cost of equity, debt, and taxes
Weighted average cost of capital
• Aswath Damodaran, New York University Stern School of Business
• Wages• Benefits• IT costs
Weighted average cost of capital
• BLS, occupational employment statistics, occupation by industry sector• BLS, employer costs for employee compensation, private workers
Total business inventory
• Federal Reserve Bank of St. Louis, Series ID A371RC1Q027SBEA: private inventories, quarterly, seasonally adjusted (from BEA). Private inventories includes manufacturing, retail, and wholesale and represents end-of-month stock and goods available for sale on the last day of the reporting period.
Other (obsolescence, shrinkage, insurance, handling, others)
• A.T. Kearney estimate based on various internal and external studies
• Crude oil• Natural gas• Other products
Pipeline • BEA input–output accounts, annual, production of commodities by industry
• IHS Markit
Data element Sub-elements Source

42Accelerating into Uncertainty
average cost of capital for all US public companies and multiplies it by the value of total business inventory. The value for “other” is calculated as a proportion of the overall inventory carrying cost. This proportion is smaller than the other two sub-segments and is based on consensus estimates from various sources.
Other costs
We use the same definitions as last year.
Carriers’ support activities reflect a broad range of services that support shipping. Examples include freight transportation arrangement (freight forwarders and brokers), customs services, packing or crating, port handling, and other freight yard management, container leasing, navigation services, and a number of other related activities. In the case of freight transpor-tation arrangement (forwarders and brokers), purchased transportation has been estimated and removed to eliminate duplicate counting of freight.
Shippers’ administrative costs are built on two specific cost areas: labor and logistics IT. Labor costs are calculated using a weighted average of mean annual wages for manufacturing, retail, and wholesale industries for logistics-related occupations plus the estimated value of total benefits paid to employees in addition to wages. Logistics IT spend is based on industry reports of the supply chain management software market for the United States.
Historical Comparisons
To facilitate comparisons with the historical series, the USBLC table has been recalculated back to 2007 using current sources and methodologies (see figure B on page 43). In some cases, government data has been revised or updated, so some figures such as GDP and inventory may differ from previous reports.

43Accelerating into Uncertainty
Metric
Nominal GDP $ billion
Units
14,478
2007
14,719
2008
14,419
2009
14,964
2010
15,518
2011
16,155
2012
16,692
2013
17,393
2014
18,037
Total businessinventory
$ billion 2,047 2,195 1,933 2,032 2,271 2,344 2,413 2,514 2,470
Inventorycarrying rate
% 21% 18% 19% 18% 18% 17% 18% 16% 17%
Transportationcosts
$ billion
Inventorycarrying costs(ICC)
$ billion
Other costs $ billion 73 74 68 70 74 79 83 87 90
Total USBLC $ billion 1,243 1,245 1,063 1,127 1,224 1,274 1,321 1,373 1,414
Total USBLC as % of GDP
% 8.6% 8.5% 7.4% 7.5% 7.9% 7.9% 7.9% 7.9% 7.8%
Total businessinventory as% of GDP
% 14.1% 14.9% 13.4% 13.6% 14.6% 14.5% 14.5% 14.5% 13.7%
Transportationas % of GDP
ICC as %of GDP
%
Transportationas % of GDP(2010 = 100)
base 100
ICC as % of GDP(2010 = 100)
base 100
Total USBLCas % of GDP(2010 = 100)
base 100 114 112 98 100 105 105 105 105 104
2015
Figure B: Ten-year summary of USBLC
421 397 372 375 400 409 428 407 423
749 774 623 682 749 786 810 879 901
% 2.9% 2.7% 2.6% 2.5% 2.6% 2.5% 2.6% 2.3% 2.3%
Total businessinventory as % of GDP(2010=100)
104 110 99 100 108 107 107 106 101
% 5.2% 5.3% 4.3% 4.6% 4.8% 4.9% 4.9% 5.1% 5.0%
116 108 103 100 103 101 102 93 94
114 115 95 100 106 107 106 111 110
18,566
2,493
16%
88
1,393
7.5%
13.4%
100
2016
410
895
2.2%
99
4.8%
88
106
base 100
Source: A.T. Kearney analysis

About CSCMP
Since 1963, the Council of Supply Chain Management Professionals (CSCMP) has been the leading worldwide professional association dedicated to education, research, and the advancement of the supply chain management profession. With more than 9,000 members globally, representing business, government, and academia from 62 countries, CSCMP members are the leading practitioners and authorities in the fields of logistics and supply chain management. To learn more, visit www.cscmp.org.
About Penske Logistics
Penske Logistics is a wholly owned subsidiary of Penske Truck Leasing. With operations in North America, South America, Europe, and Asia, Penske Logistics provides supply chain management and logistics services to major industrial and consumer companies throughout the world. Penske Logistics delivers value through design, planning, and execution in transportation, warehousing, and international freight forwarding and carrier management. To learn more, visit www.penskelogistics.com.
About A.T. Kearney
A.T. Kearney is a leading global management consulting firm with offices in more than 40 countries. Since 1926, A.T. Kearney has served as trusted advisors to the world's foremost organizations. A.T. Kearney is a partner-owned firm, committed to helping clients achieve immediate impact and growing advantage on their most mission-critical issues. To learn more, visit www.atkearney.com.