Embed Size (px)
Citation preview
7.6 TROPOSPHERIC AIRBORNE METEOROLOGICAL DATA REPORTING (TAMDAR) SENSOR DEVELOPMENT
Taumi S. Daniels* and George TsoucalasNASA Langley Research Center, Hampton, Virginia
Mark Anderson and Daniel MulallyAirDat, LLC, Evergreen, Colorado
William MoningerNOAA Forecast Systems Laboratory, Boulder, Colorado
Richard MamroshNOAA National Weather Service, Green Bay, Wisconsin
1. INTRODUCTION
One of the recommendations of the NationalAviation Weather Program Council was to expand andinstitutionalize the generation, dissemination, and useof automated pilot reports (PIREPS) to the full spectrumof the aviation community, including general aviation. Inresponse to this and other similar recommendations,NASA initiated cooperative research into thedevelopment of an electronic pilot reporting capability(Daniels 2002).
The ultimate goal is to develop a small low-costsensor, collect useful meteorological observationsbelow 25,000 ft., downlink the data in near real time,and use the data to improve weather forecasts. Primaryusers of the data include pilots, who are one targetedaudience for the improved weather information that willresult from the TAMDAR data. The weather data will bedisseminated and used to improve aviation safety byproviding pilots with enhanced weather situationalawareness. In addition, the data will be used to improvethe accuracy and timeliness of weather forecasts. Otherusers include air traffic controllers, flight servicestations, and airline weather centers. Additionally, themeteorological data collected by TAMDAR is expectedto have a significant positive impact on forecastaccuracy for ground based applications.
A system of TAMDAR sensors and datalinks on asufficient number of aircraft would provide hightemporal- and spatial-resolution wind and temperaturedata in the lower troposphere. Such a system has thepotential to substantially improve weather forecasting.Moreover, the high-resolution humidity data producedby TAMDAR is unprecedented, and may providesubstantial benefits. The meteorological community iskeenly interested in additional observations of the lowertroposphere and in particular moisture data as
evidenced by the American Meteorological SocietyStatement (AMS Council, 2003).
NASA is working with AirDat, LLC., of Raleigh, NC(formerly Optical Detection Systems of Rapid City, SD)to develop the sensor. AirDat has developed a fewprototype sensors that were subjected to numeroustests in ground and flight facilities. As a result of theseearlier tests, many design improvements were made tothe sensor. The results of tests on a final version of thesensor are the subject of this report.
Figure 1. TAMDAR sensor
After all the aircraft are equipped, a planned six-month fleet experiment will commence. This experimentwill involve equipping 64 Mesaba Airlines Saab 340aircraft with the TAMDAR sensor, collecting the data,and analyzing the impact on model and local forecasts.
1
*Corresponding author address: Taumi Daniels,NASA Langley Research Center, MS 473, Hampton, VA23681; email: [email protected].
https://ntrs.nasa.gov/search.jsp?R=20040161135 2018-05-19T10:43:35+00:00Z
2. SENSOR DESCRIPTION
The sensor is capable of measuring temperature,relative humidity, pressure, and icing. It can computepressure altitude, indicated air speed, true air speed,turbulence (MacCready, 1964), and winds. Refer to theAppendix for a mechanical schematic of the probe anda list of reported parameters.
The sensor, shown in figure 1, is configured withtwo capacitive humidity sensors. The temperaturemeasurement device is a platinum RTD (resistivetemperature device). Static and dynamic pressure aremeasured by absolute and differential pressure gauges.Two independent infrared emitter/detector pairsmounted in a leading edge recess detect ice accretion.Internal heaters melt the ice and the measurementcycle repeats. All other reported parameters arecomputed by processors in a signal processing unit(SPU). A GPS receiver chip is incorporated into theSPU. A separate satellite transceiver downlinks thedata to a ground facility.
2.1 Observations Intervals
All observation intervals are based on pressurewith a timed default. Departure field pressure isautomatically determined at the moment the aircraft trueair speed exceeds 80 knots. An observation is madeevery 10 hPa for the first 100 hPa, then every 50 hPaTo avoid constant triggering of observations if theaircraft altitude is “hovering” about a particular thresholdpoint, simple logic will be applied before a pressurebased observation is triggered. Once a threshold iscrossed, crossing that same threshold again will nottrigger a new observation unless a higher or lowerthreshold is crossed first.
The time defaults for observation intervals arerequired in case the aircraft is in cruise (no significantchange in measured ambient pressure). An observationis made after three minutes if the pressure is greaterthan 465 hPa or seven minutes if the pressure is lessthan 465 hPa. The observation default time periods areadjustable by remote command.
Special observations are triggered by an icingonset. The minimum time between observations due toicing is 1 minute. De-icing heaters automatically removeice from the probe upon detection. The heaters remainpowered for at least 1 minute. The large electricalcurrent flow to the probe affects the othermeasurements, so all data is flagged during deicing.The de-icing cycle repeats if more ice is detected.
All observation parameters pass through afirmware implemented low-pass filter with a timeresponse of about 10 seconds with the exception ofturbulence and icing. Peak and median turbulencestatistics at the end of a report will apply to the totalreporting interval.
Upon landing, the last ten 10 hPa intervalobservations will be transmitted. The TAMDAR unitalways archives the last ten observations. Thisassumes the default sampling interval is 10 hPa. For a5 hPa interval, twenty 5 hPa spaced observations willbe sent.
2.2 Reporting Intervals
Reports are attempted after a specific number ofaccumulated observations, with a report time default if areport has not been made within a certain period. Thenumber of observations can be set by remotecommand. The observations are accumulated then areport is issued. If a report has not been issued for adefault period of fifteen minutes, then a report is issued.The default period is adjustable by remote command.After a report has been issued, the time is reset and thenext report occurs when the next set of observationshave been accumulated, or at the end of the defaultperiod, whichever comes first.
These observation and reporting intervals areconsistent with World Meteorological OrganizationAMDAR (Aircraft Meteorological Data Relay)specifications (WMO 2003).
Figure 2. TAMDAR at the Cox Icing Wind Tunnel
3. GROUND-BASED SENSOR TESTING
The TAMDAR sensor was designed to meet thespecifications in Appendix B. Various ground-based andflight tests have been conducted to verify performance.Wind tunnels, environmental chambers, and differentatmospheric research aircraft have been utilized toimprove the sensor performance. In addition,computational fluid dynamics (CFD) studies wereconducted to determine optimum locations for pressureports and nozzle shapes.
2
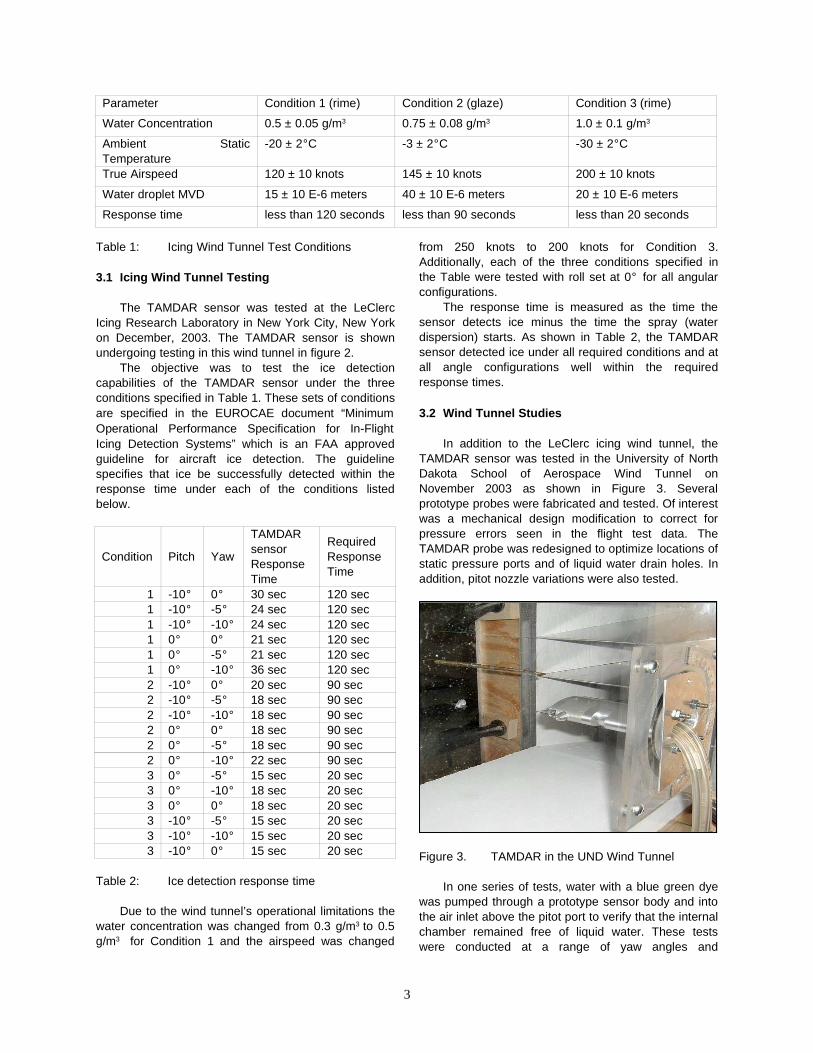
Table 1: Icing Wind Tunnel Test Conditions
3.1 Icing Wind Tunnel Testing
The TAMDAR sensor was tested at the LeClercIcing Research Laboratory in New York City, New Yorkon December, 2003. The TAMDAR sensor is shownundergoing testing in this wind tunnel in figure 2.
The objective was to test the ice detectioncapabilities of the TAMDAR sensor under the threeconditions specified in Table 1. These sets of conditionsare specified in the EUROCAE document “MinimumOperational Performance Specification for In-FlightIcing Detection Systems” which is an FAA approvedguideline for aircraft ice detection. The guidelinespecifies that ice be successfully detected within theresponse time under each of the conditions listedbelow.
Condition Pitch Yaw
TAMDARsensorResponseTime
RequiredResponseTime
1 -10° 0° 30 sec 120 sec1 -10° -5° 24 sec 120 sec1 -10° -10° 24 sec 120 sec1 0° 0° 21 sec 120 sec1 0° -5° 21 sec 120 sec1 0° -10° 36 sec 120 sec2 -10° 0° 20 sec 90 sec2 -10° -5° 18 sec 90 sec2 -10° -10° 18 sec 90 sec2 0° 0° 18 sec 90 sec2 0° -5° 18 sec 90 sec2 0° -10° 22 sec 90 sec3 0° -5° 15 sec 20 sec3 0° -10° 18 sec 20 sec3 0° 0° 18 sec 20 sec3 -10° -5° 15 sec 20 sec3 -10° -10° 15 sec 20 sec3 -10° 0° 15 sec 20 sec
Table 2: Ice detection response time
Due to the wind tunnel’s operational limitations thewater concentration was changed from 0.3 g/m3 to 0.5g/m3 for Condition 1 and the airspeed was changed
from 250 knots to 200 knots for Condition 3.Additionally, each of the three conditions specified inthe Table were tested with roll set at 0° for all angularconfigurations.
The response time is measured as the time thesensor detects ice minus the time the spray (waterdispersion) starts. As shown in Table 2, the TAMDARsensor detected ice under all required conditions and atall angle configurations well within the requiredresponse times.
3.2 Wind Tunnel Studies
In addition to the LeClerc icing wind tunnel, theTAMDAR sensor was tested in the University of NorthDakota School of Aerospace Wind Tunnel onNovember 2003 as shown in Figure 3. Severalprototype probes were fabricated and tested. Of interestwas a mechanical design modification to correct forpressure errors seen in the flight test data. TheTAMDAR probe was redesigned to optimize locations ofstatic pressure ports and of liquid water drain holes. Inaddition, pitot nozzle variations were also tested.
Figure 3. TAMDAR in the UND Wind Tunnel
In one series of tests, water with a blue green dyewas pumped through a prototype sensor body and intothe air inlet above the pitot port to verify that the internalchamber remained free of liquid water. These testswere conducted at a range of yaw angles and
3
Parameter Condition 1 (rime) Condition 2 (glaze) Condition 3 (rime)
Water Concentration 0.5 ± 0.05 g/m3 0.75 ± 0.08 g/m3 1.0 ± 0.1 g/m3
Ambient StaticTemperature
-20 ± 2°C -3 ± 2°C -30 ± 2°C
True Airspeed 120 ± 10 knots 145 ± 10 knots 200 ± 10 knots
Water droplet MVD 15 ± 10 E-6 meters 40 ± 10 E-6 meters 20 ± 10 E-6 meters
Response time less than 120 seconds less than 90 seconds less than 20 seconds
airspeeds. The internal chamber houses the PC boardwith the RH sensors.
The goal of another series of tests was to optimizethe probe tip design to be independent of flow angle.The plot shown in Figure 4 is a result of the nozzle testsconducted in this wind tunnel. Total pressure recoveryas a function of probe angle at flow speeds of 48 m/sand 75 m/s. Various probe dynamic pressure tips weretested over a range of off-axis flow angles. Theperformance of the TAMDAR sensor is shown to beconsistent to 10° pitch (or yaw flow) angle.
The TAMDAR sensor was also tested at the RollsRoyce wind tunnel facility at transonic velocities up toMach 0.9. This testing was conducted to verify thefunctionality of the sensor on higher performanceaircraft (such as regional jets), and to refine TAMDARalgorithms for accuracy at higher velocities. Preliminaryresults from the tests demonstrated the suitability of theTAMDAR sensor for high performance aircraft.
Figure 4. Effect of Probe Angle Variation onTotal Pressure Recovery
3.3 Computational Fluid Dynamics Analyses
Several CFD simulations were performed on theTAMDAR sensor. The TAMDAR geometry wasrecreated based on mechanical drawings. A controlvolume was created that measured 25 X 25 X 70 inchesand that allowed for pitch and yaw simulations. Thesensor was attached to the top of the control volume,with its central axis located 20 inches downstream ofthe flow inlet. This orientation matches that of under-fuselage or under-wing aircraft installations.
The TAMDAR simulations were set up to emulate awind tunnel. At the flow inlet, a uniform velocityboundary condition was set up normal to the face, andthis value was varied in order to test the differentvelocities. At the outlet, the valid assumption was madefor fully compressible flows and low subsoniccompressible flows. For all interior walls of the controlvolume, a slip boundary condition was assigned.
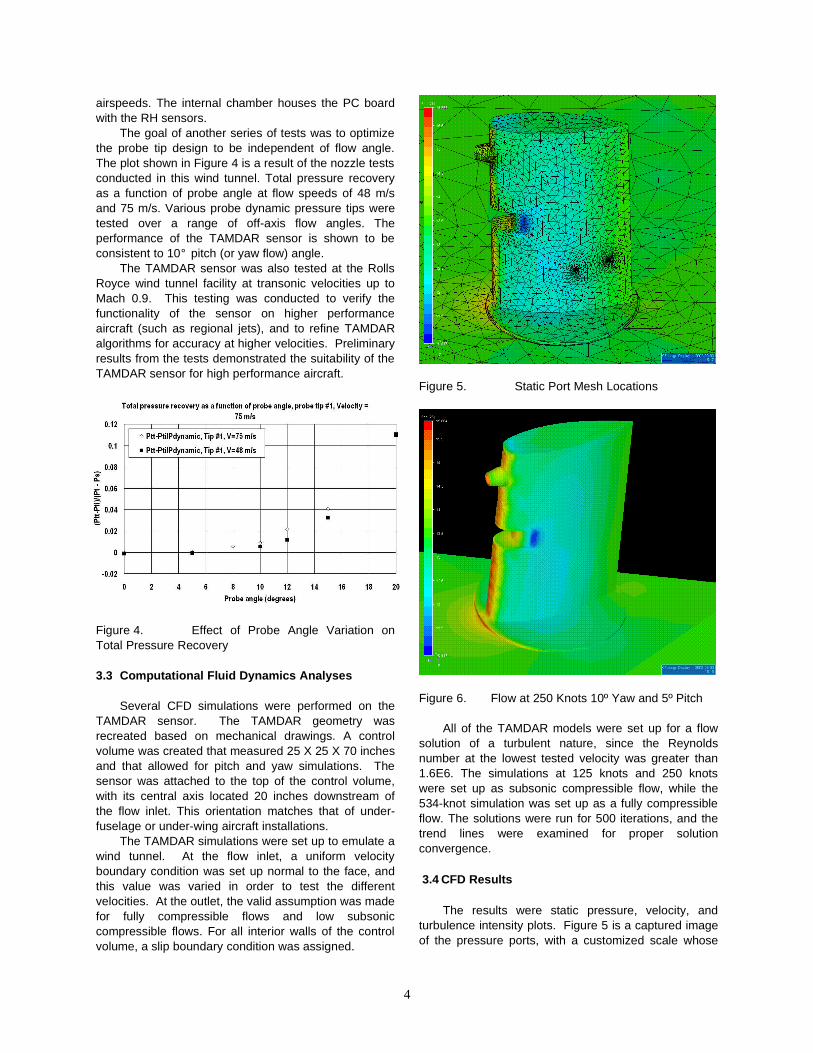
Figure 5. Static Port Mesh Locations
Figure 6. Flow at 250 Knots 10º Yaw and 5º Pitch
All of the TAMDAR models were set up for a flowsolution of a turbulent nature, since the Reynoldsnumber at the lowest tested velocity was greater than1.6E6. The simulations at 125 knots and 250 knotswere set up as subsonic compressible flow, while the534-knot simulation was set up as a fully compressibleflow. The solutions were run for 500 iterations, and thetrend lines were examined for proper solutionconvergence.
3.4 CFD Results
The results were static pressure, velocity, andturbulence intensity plots. Figure 5 is a captured imageof the pressure ports, with a customized scale whose
4
intention was to aid in interpreting the results with moreprecision. Baseline pressure plots were takenperpendicular to the flow inlet and parallel to thesensor’s chord length, in between the sensor andcontrol volume wall.
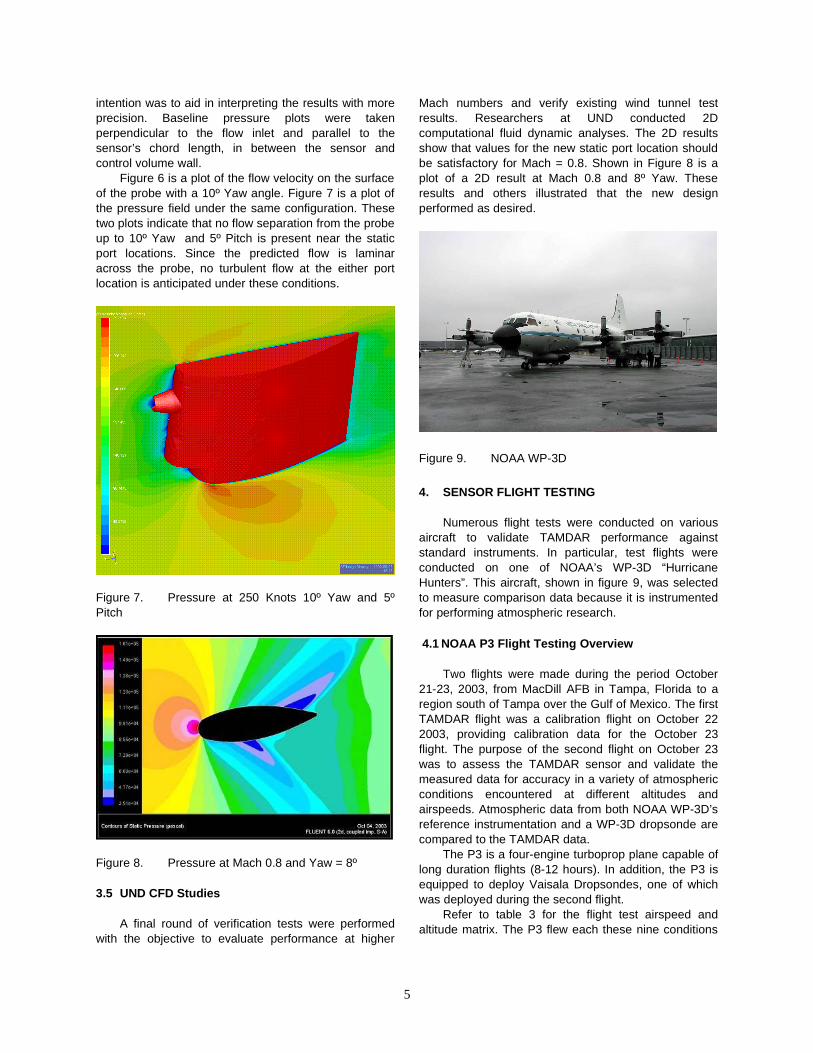
Figure 6 is a plot of the flow velocity on the surfaceof the probe with a 10º Yaw angle. Figure 7 is a plot ofthe pressure field under the same configuration. Thesetwo plots indicate that no flow separation from the probeup to 10º Yaw and 5º Pitch is present near the staticport locations. Since the predicted flow is laminaracross the probe, no turbulent flow at the either portlocation is anticipated under these conditions.
Figure 7. Pressure at 250 Knots 10º Yaw and 5ºPitch
Figure 8. Pressure at Mach 0.8 and Yaw = 8º
3.5 UND CFD Studies
A final round of verification tests were performedwith the objective to evaluate performance at higher
Mach numbers and verify existing wind tunnel testresults. Researchers at UND conducted 2Dcomputational fluid dynamic analyses. The 2D resultsshow that values for the new static port location shouldbe satisfactory for Mach = 0.8. Shown in Figure 8 is aplot of a 2D result at Mach 0.8 and 8º Yaw. Theseresults and others illustrated that the new designperformed as desired.
Figure 9. NOAA WP-3D
4. SENSOR FLIGHT TESTING
Numerous flight tests were conducted on variousaircraft to validate TAMDAR performance againststandard instruments. In particular, test flights wereconducted on one of NOAA’s WP-3D “HurricaneHunters”. This aircraft, shown in figure 9, was selectedto measure comparison data because it is instrumentedfor performing atmospheric research.
4.1 NOAA P3 Flight Testing Overview
Two flights were made during the period October21-23, 2003, from MacDill AFB in Tampa, Florida to aregion south of Tampa over the Gulf of Mexico. The firstTAMDAR flight was a calibration flight on October 222003, providing calibration data for the October 23flight. The purpose of the second flight on October 23was to assess the TAMDAR sensor and validate themeasured data for accuracy in a variety of atmosphericconditions encountered at different altitudes andairspeeds. Atmospheric data from both NOAA WP-3D’sreference instrumentation and a WP-3D dropsonde arecompared to the TAMDAR data.
The P3 is a four-engine turboprop plane capable oflong duration flights (8-12 hours). In addition, the P3 isequipped to deploy Vaisala Dropsondes, one of whichwas deployed during the second flight.
Refer to table 3 for the flight test airspeed andaltitude matrix. The P3 flew each these nine conditions
5
to simulate the anticipated in-service operational flightenvelop of the TAMDAR sensor.
Altitude (ft) Indicated Airspeed (knots)1500 185 195 220
10000 180 205 23020000 180 210 235
Table 3. P3 Flight Test Matrix
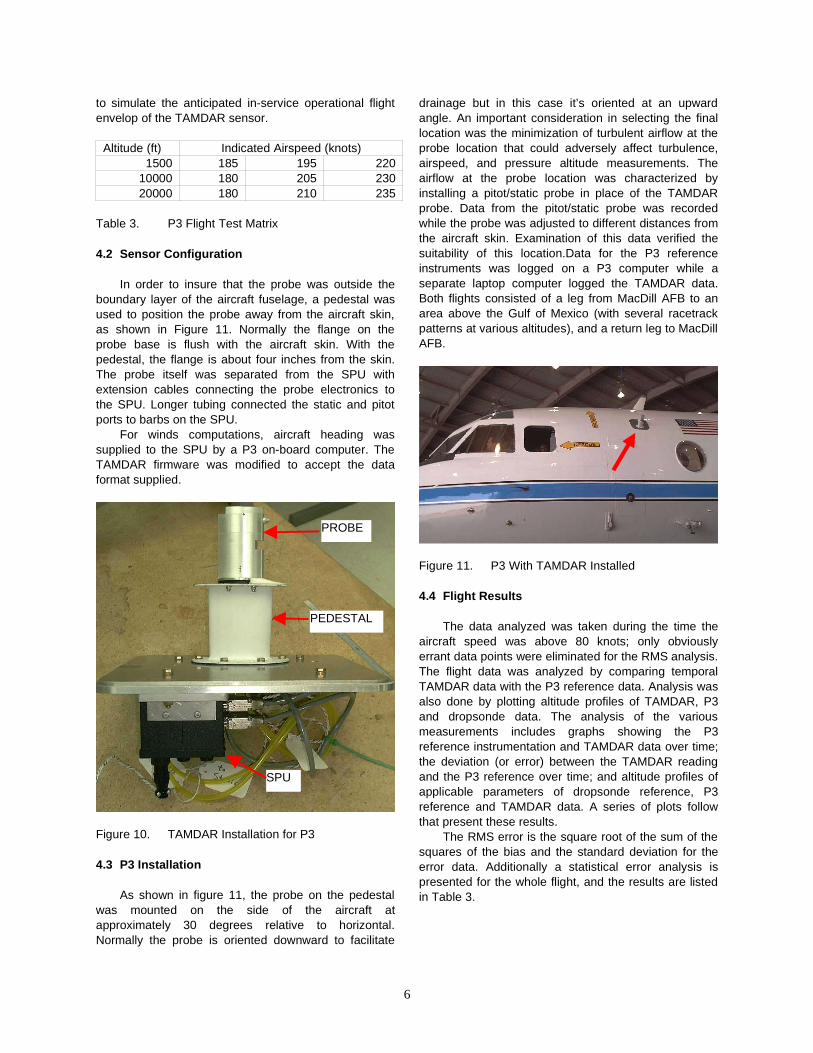
4.2 Sensor Configuration
In order to insure that the probe was outside theboundary layer of the aircraft fuselage, a pedestal wasused to position the probe away from the aircraft skin,as shown in Figure 11. Normally the flange on theprobe base is flush with the aircraft skin. With thepedestal, the flange is about four inches from the skin.The probe itself was separated from the SPU withextension cables connecting the probe electronics tothe SPU. Longer tubing connected the static and pitotports to barbs on the SPU.
For winds computations, aircraft heading wassupplied to the SPU by a P3 on-board computer. TheTAMDAR firmware was modified to accept the dataformat supplied.
Figure 10. TAMDAR Installation for P3
4.3 P3 Installation
As shown in figure 11, the probe on the pedestalwas mounted on the side of the aircraft atapproximately 30 degrees relative to horizontal.Normally the probe is oriented downward to facilitate
drainage but in this case it’s oriented at an upwardangle. An important consideration in selecting the finallocation was the minimization of turbulent airflow at theprobe location that could adversely affect turbulence,airspeed, and pressure altitude measurements. Theairflow at the probe location was characterized byinstalling a pitot/static probe in place of the TAMDARprobe. Data from the pitot/static probe was recordedwhile the probe was adjusted to different distances fromthe aircraft skin. Examination of this data verified thesuitability of this location.Data for the P3 referenceinstruments was logged on a P3 computer while aseparate laptop computer logged the TAMDAR data.Both flights consisted of a leg from MacDill AFB to anarea above the Gulf of Mexico (with several racetrackpatterns at various altitudes), and a return leg to MacDillAFB.
Figure 11. P3 With TAMDAR Installed
4.4 Flight Results
The data analyzed was taken during the time theaircraft speed was above 80 knots; only obviouslyerrant data points were eliminated for the RMS analysis.The flight data was analyzed by comparing temporalTAMDAR data with the P3 reference data. Analysis wasalso done by plotting altitude profiles of TAMDAR, P3and dropsonde data. The analysis of the variousmeasurements includes graphs showing the P3reference instrumentation and TAMDAR data over time;the deviation (or error) between the TAMDAR readingand the P3 reference over time; and altitude profiles ofapplicable parameters of dropsonde reference, P3reference and TAMDAR data. A series of plots followthat present these results.
The RMS error is the square root of the sum of thesquares of the bias and the standard deviation for theerror data. Additionally a statistical error analysis ispresented for the whole flight, and the results are listedin Table 3.
6
PROBE
PEDESTAL
SPU
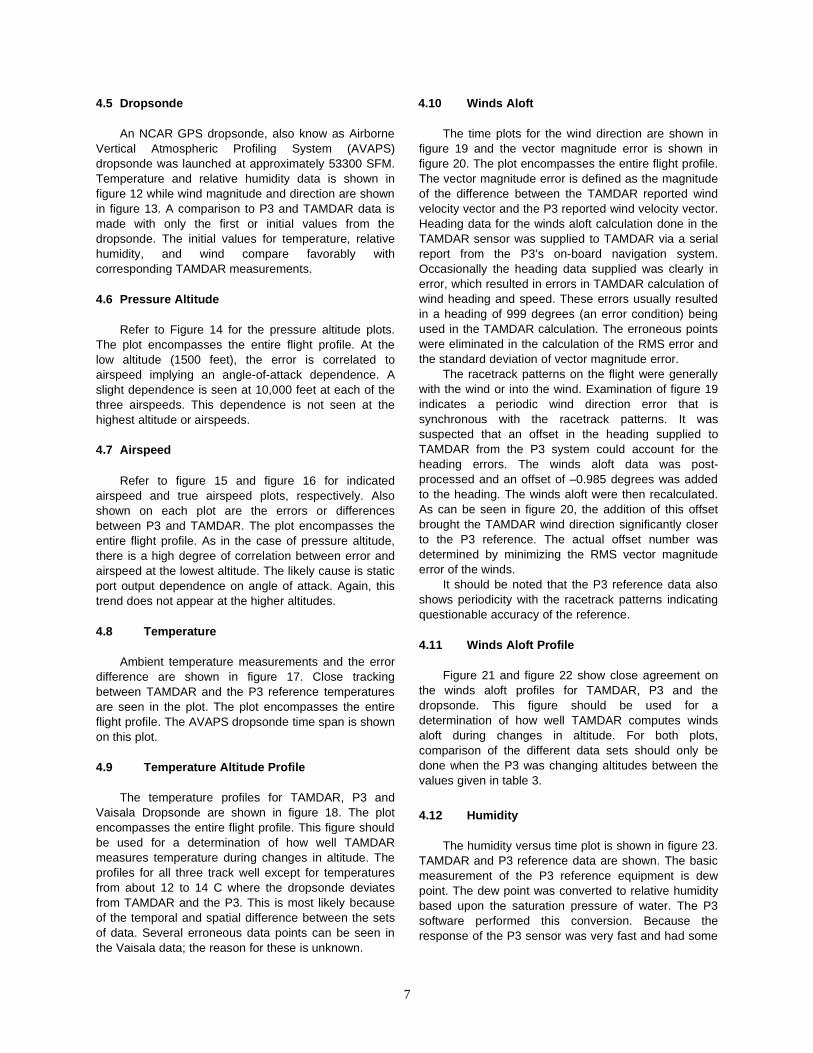
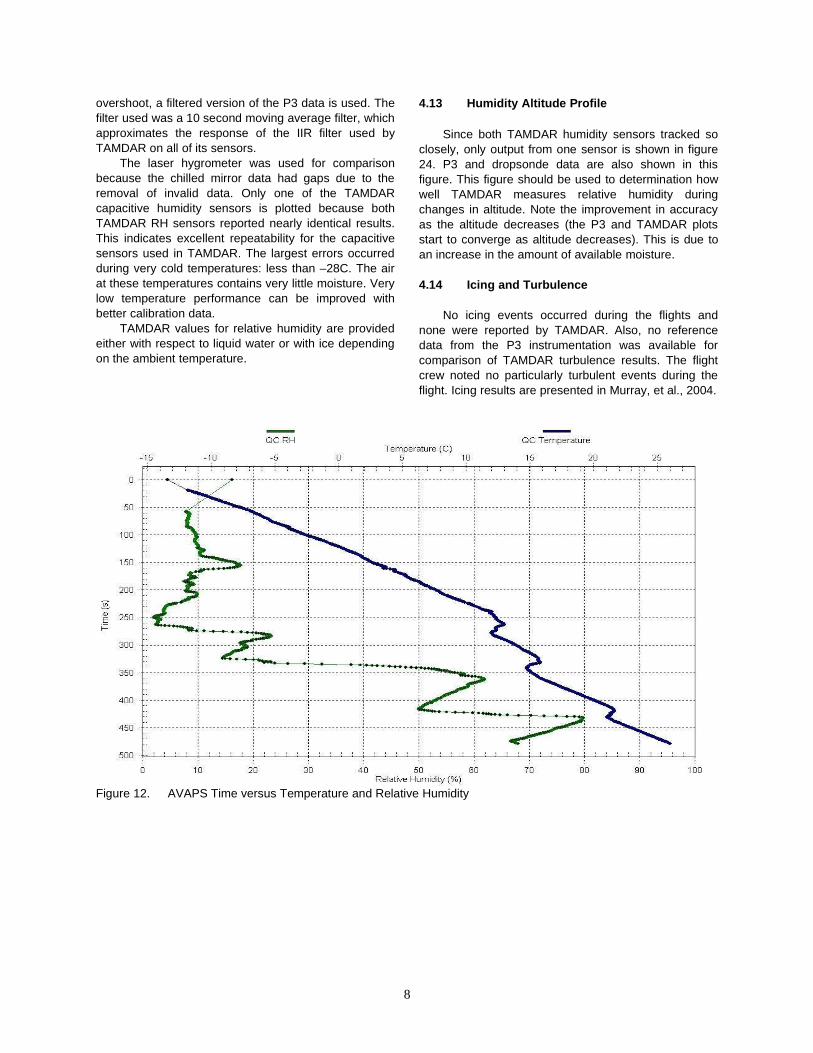
4.5 Dropsonde
An NCAR GPS dropsonde, also know as AirborneVertical Atmospheric Profiling System (AVAPS)dropsonde was launched at approximately 53300 SFM.Temperature and relative humidity data is shown infigure 12 while wind magnitude and direction are shownin figure 13. A comparison to P3 and TAMDAR data ismade with only the first or initial values from thedropsonde. The initial values for temperature, relativehumidity, and wind compare favorably withcorresponding TAMDAR measurements.
4.6 Pressure Altitude
Refer to Figure 14 for the pressure altitude plots.The plot encompasses the entire flight profile. At thelow altitude (1500 feet), the error is correlated toairspeed implying an angle-of-attack dependence. Aslight dependence is seen at 10,000 feet at each of thethree airspeeds. This dependence is not seen at thehighest altitude or airspeeds.
4.7 Airspeed
Refer to figure 15 and figure 16 for indicatedairspeed and true airspeed plots, respectively. Alsoshown on each plot are the errors or differencesbetween P3 and TAMDAR. The plot encompasses theentire flight profile. As in the case of pressure altitude,there is a high degree of correlation between error andairspeed at the lowest altitude. The likely cause is staticport output dependence on angle of attack. Again, thistrend does not appear at the higher altitudes.
4.8 Temperature
Ambient temperature measurements and the errordifference are shown in figure 17. Close trackingbetween TAMDAR and the P3 reference temperaturesare seen in the plot. The plot encompasses the entireflight profile. The AVAPS dropsonde time span is shownon this plot.
4.9 Temperature Altitude Profile
The temperature profiles for TAMDAR, P3 andVaisala Dropsonde are shown in figure 18. The plotencompasses the entire flight profile. This figure shouldbe used for a determination of how well TAMDARmeasures temperature during changes in altitude. Theprofiles for all three track well except for temperaturesfrom about 12 to 14 C where the dropsonde deviatesfrom TAMDAR and the P3. This is most likely becauseof the temporal and spatial difference between the setsof data. Several erroneous data points can be seen inthe Vaisala data; the reason for these is unknown.
4.10 Winds Aloft
The time plots for the wind direction are shown infigure 19 and the vector magnitude error is shown infigure 20. The plot encompasses the entire flight profile.The vector magnitude error is defined as the magnitudeof the difference between the TAMDAR reported windvelocity vector and the P3 reported wind velocity vector.Heading data for the winds aloft calculation done in theTAMDAR sensor was supplied to TAMDAR via a serialreport from the P3’s on-board navigation system.Occasionally the heading data supplied was clearly inerror, which resulted in errors in TAMDAR calculation ofwind heading and speed. These errors usually resultedin a heading of 999 degrees (an error condition) beingused in the TAMDAR calculation. The erroneous pointswere eliminated in the calculation of the RMS error andthe standard deviation of vector magnitude error.
The racetrack patterns on the flight were generallywith the wind or into the wind. Examination of figure 19indicates a periodic wind direction error that issynchronous with the racetrack patterns. It wassuspected that an offset in the heading supplied toTAMDAR from the P3 system could account for theheading errors. The winds aloft data was post-processed and an offset of –0.985 degrees was addedto the heading. The winds aloft were then recalculated.As can be seen in figure 20, the addition of this offsetbrought the TAMDAR wind direction significantly closerto the P3 reference. The actual offset number wasdetermined by minimizing the RMS vector magnitudeerror of the winds.
It should be noted that the P3 reference data alsoshows periodicity with the racetrack patterns indicatingquestionable accuracy of the reference.
4.11 Winds Aloft Profile
Figure 21 and figure 22 show close agreement onthe winds aloft profiles for TAMDAR, P3 and thedropsonde. This figure should be used for adetermination of how well TAMDAR computes windsaloft during changes in altitude. For both plots,comparison of the different data sets should only bedone when the P3 was changing altitudes between thevalues given in table 3.
4.12 Humidity
The humidity versus time plot is shown in figure 23.TAMDAR and P3 reference data are shown. The basicmeasurement of the P3 reference equipment is dewpoint. The dew point was converted to relative humiditybased upon the saturation pressure of water. The P3software performed this conversion. Because theresponse of the P3 sensor was very fast and had some
7
overshoot, a filtered version of the P3 data is used. Thefilter used was a 10 second moving average filter, whichapproximates the response of the IIR filter used byTAMDAR on all of its sensors.
The laser hygrometer was used for comparisonbecause the chilled mirror data had gaps due to theremoval of invalid data. Only one of the TAMDARcapacitive humidity sensors is plotted because bothTAMDAR RH sensors reported nearly identical results.This indicates excellent repeatability for the capacitivesensors used in TAMDAR. The largest errors occurredduring very cold temperatures: less than –28C. The airat these temperatures contains very little moisture. Verylow temperature performance can be improved withbetter calibration data.
TAMDAR values for relative humidity are providedeither with respect to liquid water or with ice dependingon the ambient temperature.
4.13 Humidity Altitude Profile
Since both TAMDAR humidity sensors tracked soclosely, only output from one sensor is shown in figure24. P3 and dropsonde data are also shown in thisfigure. This figure should be used to determination howwell TAMDAR measures relative humidity duringchanges in altitude. Note the improvement in accuracyas the altitude decreases (the P3 and TAMDAR plotsstart to converge as altitude decreases). This is due toan increase in the amount of available moisture.
4.14 Icing and Turbulence
No icing events occurred during the flights andnone were reported by TAMDAR. Also, no referencedata from the P3 instrumentation was available forcomparison of TAMDAR turbulence results. The flightcrew noted no particularly turbulent events during theflight. Icing results are presented in Murray, et al., 2004.
Figure 12. AVAPS Time versus Temperature and Relative Humidity
8
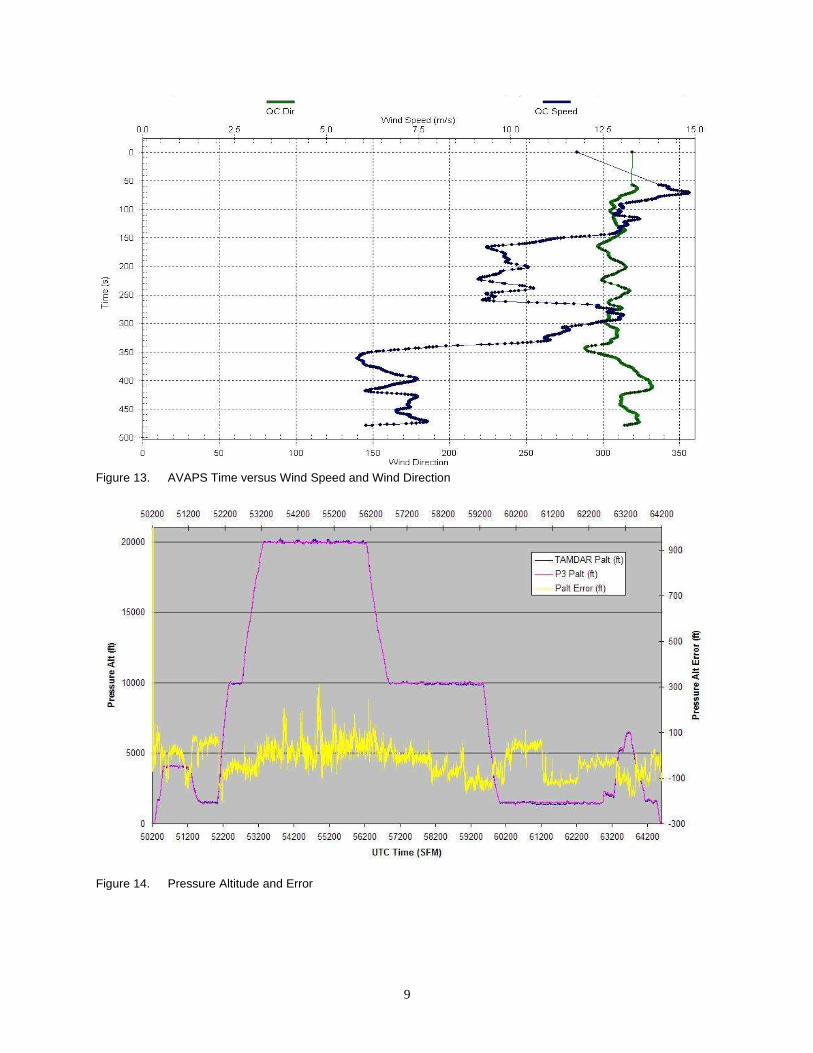
Figure 13. AVAPS Time versus Wind Speed and Wind Direction
Figure 14. Pressure Altitude and Error
9
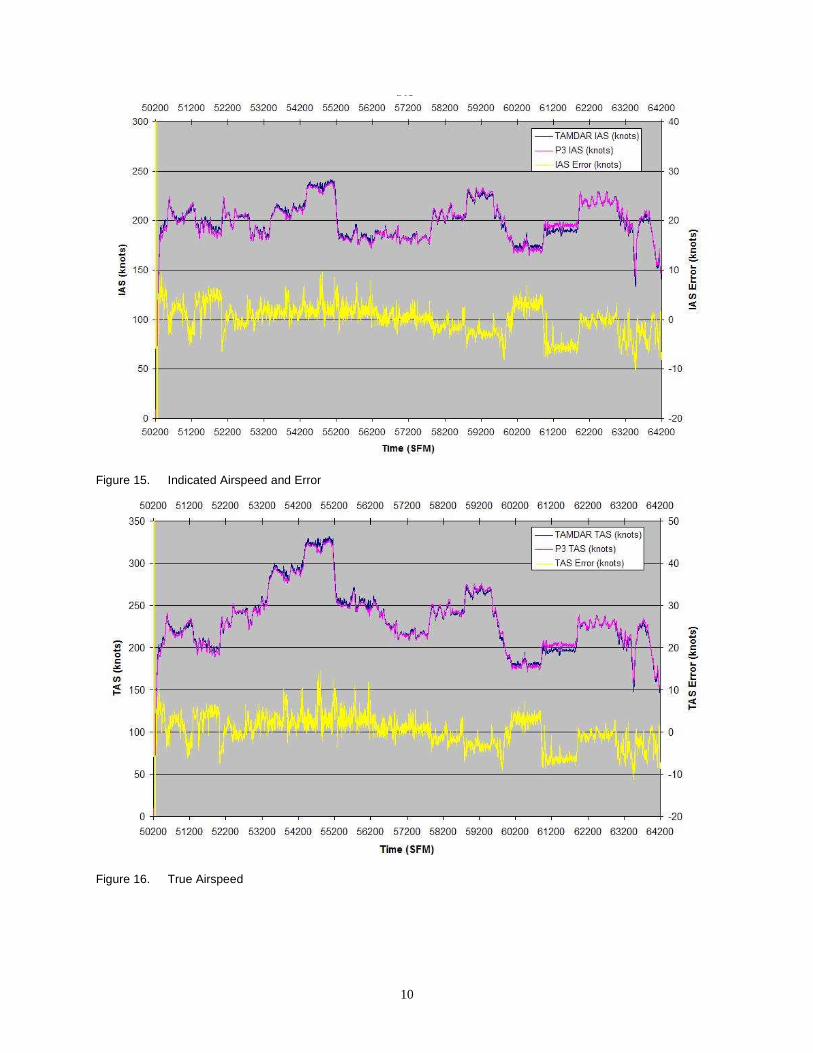
Figure 15. Indicated Airspeed and Error
Figure 16. True Airspeed
10
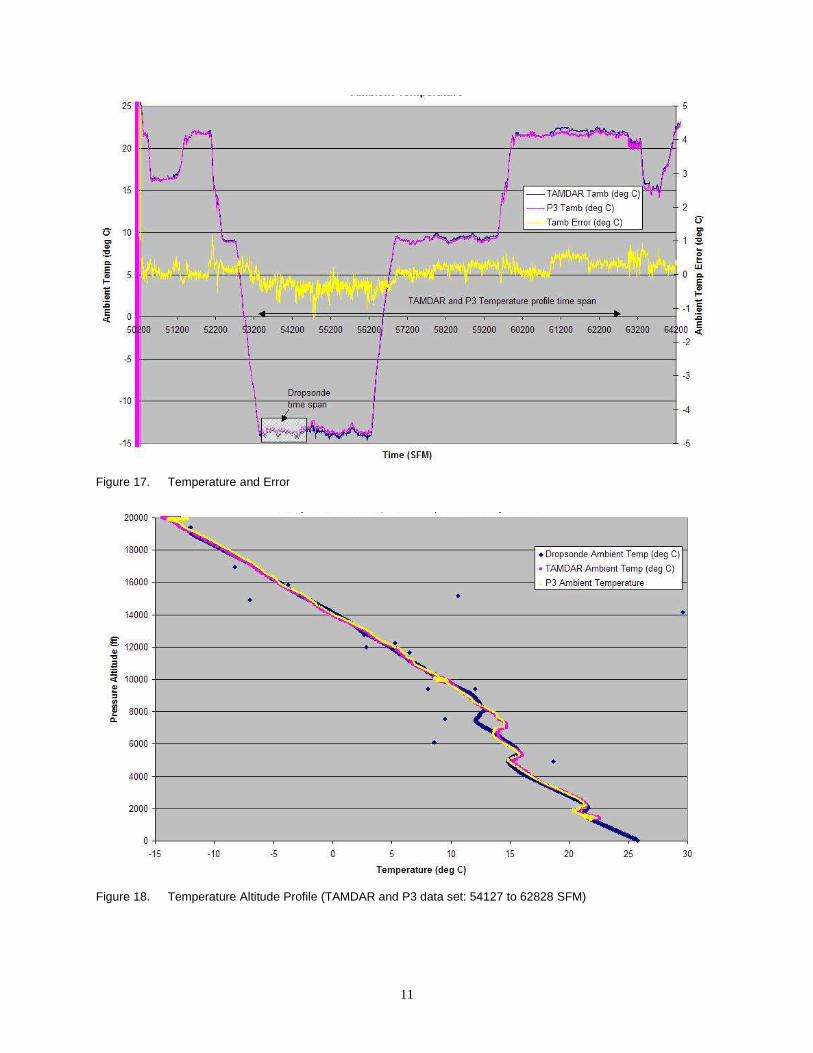
Figure 17. Temperature and Error
Figure 18. Temperature Altitude Profile (TAMDAR and P3 data set: 54127 to 62828 SFM)
11
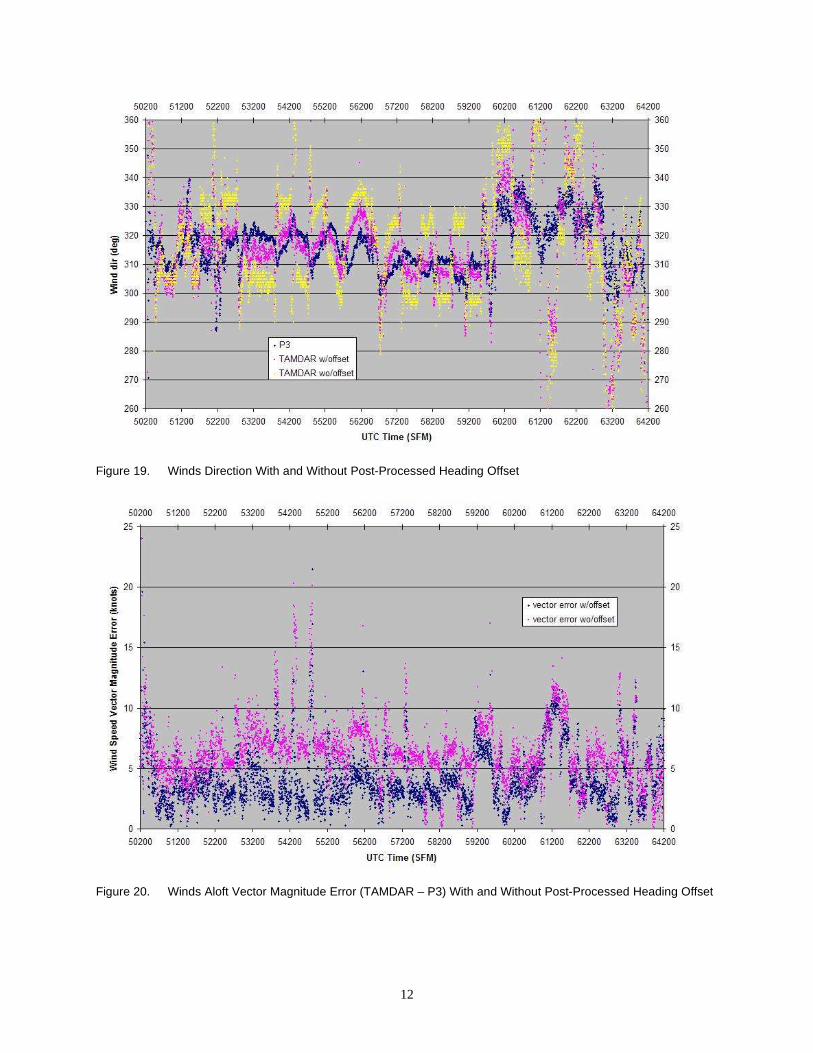
Figure 19. Winds Direction With and Without Post-Processed Heading Offset
Figure 20. Winds Aloft Vector Magnitude Error (TAMDAR – P3) With and Without Post-Processed Heading Offset
12
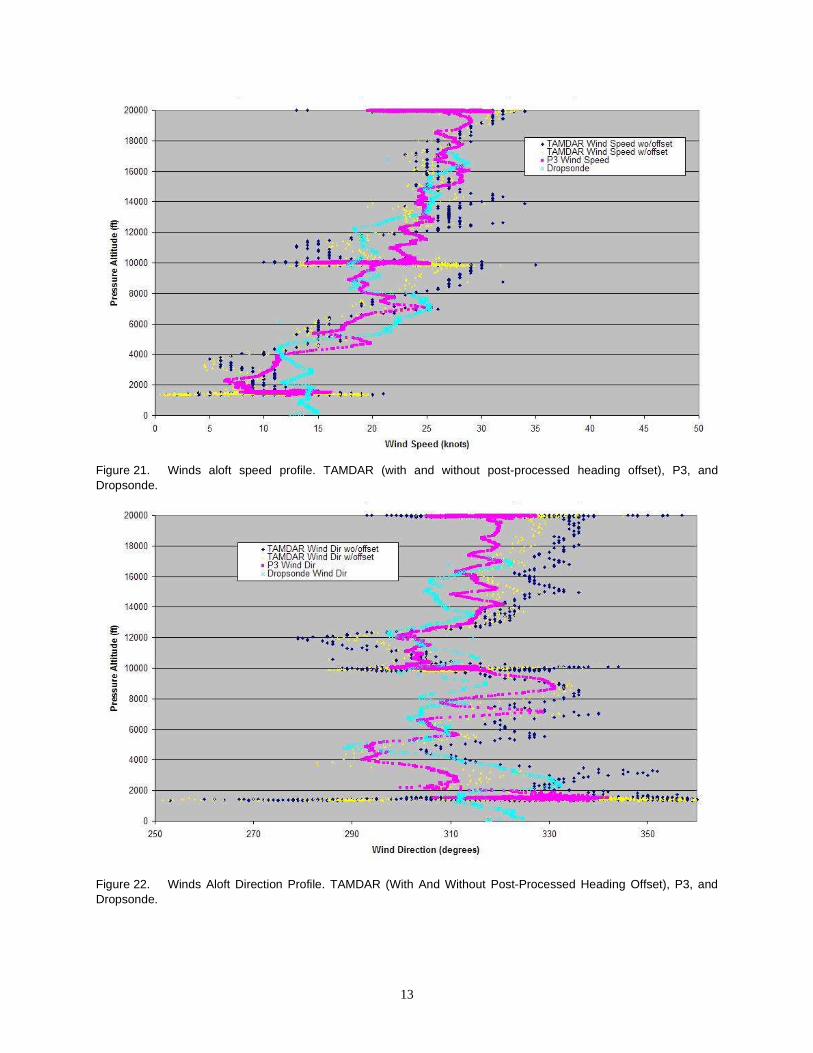
Figure 21. Winds aloft speed profile. TAMDAR (with and without post-processed heading offset), P3, andDropsonde.
Figure 22. Winds Aloft Direction Profile. TAMDAR (With And Without Post-Processed Heading Offset), P3, andDropsonde.
13
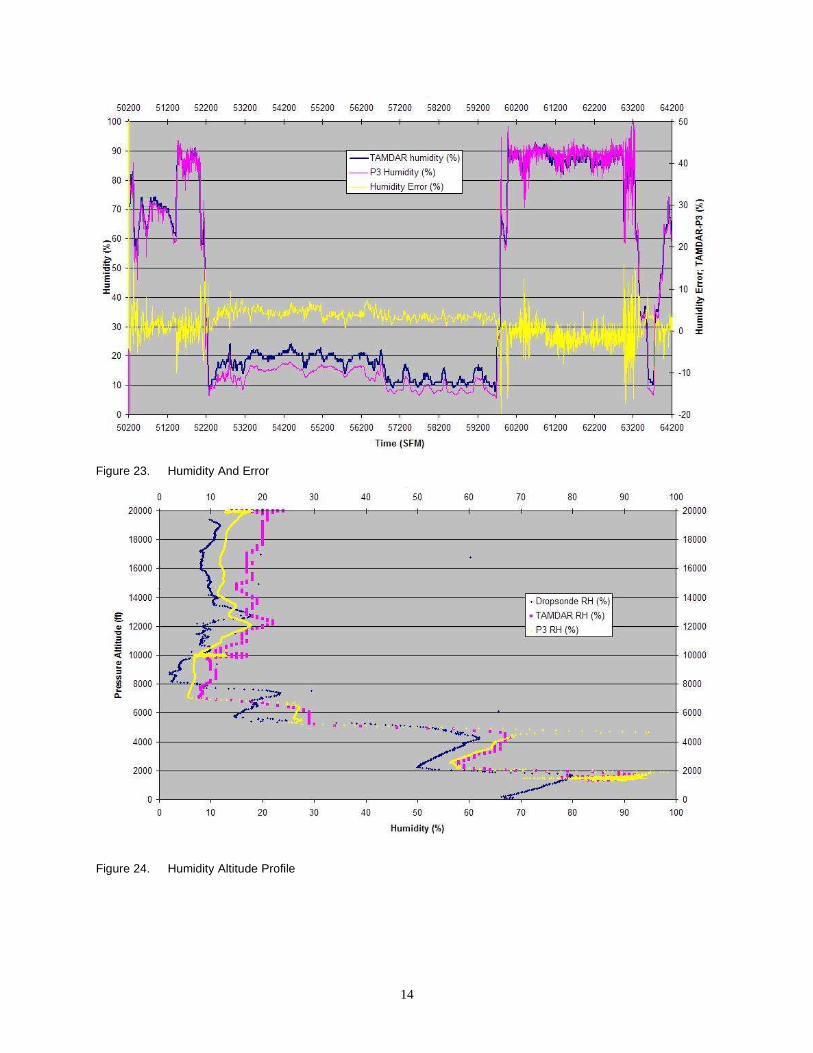
Figure 23. Humidity And Error
Figure 24. Humidity Altitude Profile
14
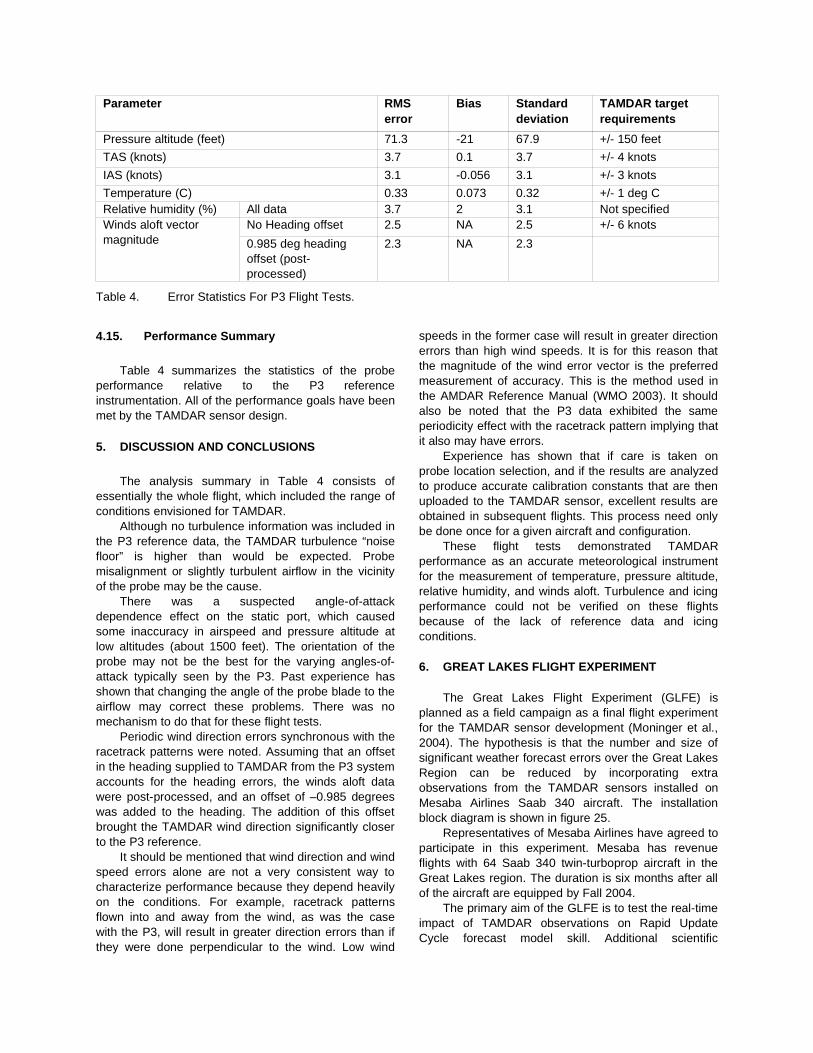
Parameter RMSerror
Bias Standarddeviation
TAMDAR targetrequirements
Pressure altitude (feet) 71.3 -21 67.9 +/- 150 feet
TAS (knots) 3.7 0.1 3.7 +/- 4 knots
IAS (knots) 3.1 -0.056 3.1 +/- 3 knots
Temperature (C) 0.33 0.073 0.32 +/- 1 deg CRelative humidity (%) All data 3.7 2 3.1 Not specifiedWinds aloft vectormagnitude
No Heading offset 2.5 NA 2.5 +/- 6 knots
0.985 deg headingoffset (post-processed)
2.3 NA 2.3
Table 4. Error Statistics For P3 Flight Tests.
4.15. Performance Summary
Table 4 summarizes the statistics of the probeperformance relative to the P3 referenceinstrumentation. All of the performance goals have beenmet by the TAMDAR sensor design.
5. DISCUSSION AND CONCLUSIONS
The analysis summary in Table 4 consists ofessentially the whole flight, which included the range ofconditions envisioned for TAMDAR.
Although no turbulence information was included inthe P3 reference data, the TAMDAR turbulence “noisefloor” is higher than would be expected. Probemisalignment or slightly turbulent airflow in the vicinityof the probe may be the cause.
There was a suspected angle-of-attackdependence effect on the static port, which causedsome inaccuracy in airspeed and pressure altitude atlow altitudes (about 1500 feet). The orientation of theprobe may not be the best for the varying angles-of-attack typically seen by the P3. Past experience hasshown that changing the angle of the probe blade to theairflow may correct these problems. There was nomechanism to do that for these flight tests.
Periodic wind direction errors synchronous with theracetrack patterns were noted. Assuming that an offsetin the heading supplied to TAMDAR from the P3 systemaccounts for the heading errors, the winds aloft datawere post-processed, and an offset of –0.985 degreeswas added to the heading. The addition of this offsetbrought the TAMDAR wind direction significantly closerto the P3 reference.
It should be mentioned that wind direction and windspeed errors alone are not a very consistent way tocharacterize performance because they depend heavilyon the conditions. For example, racetrack patternsflown into and away from the wind, as was the casewith the P3, will result in greater direction errors than ifthey were done perpendicular to the wind. Low wind
speeds in the former case will result in greater directionerrors than high wind speeds. It is for this reason thatthe magnitude of the wind error vector is the preferredmeasurement of accuracy. This is the method used inthe AMDAR Reference Manual (WMO 2003). It shouldalso be noted that the P3 data exhibited the sameperiodicity effect with the racetrack pattern implying thatit also may have errors.
Experience has shown that if care is taken onprobe location selection, and if the results are analyzedto produce accurate calibration constants that are thenuploaded to the TAMDAR sensor, excellent results areobtained in subsequent flights. This process need onlybe done once for a given aircraft and configuration.
These flight tests demonstrated TAMDARperformance as an accurate meteorological instrumentfor the measurement of temperature, pressure altitude,relative humidity, and winds aloft. Turbulence and icingperformance could not be verified on these flightsbecause of the lack of reference data and icingconditions.
6. GREAT LAKES FLIGHT EXPERIMENT
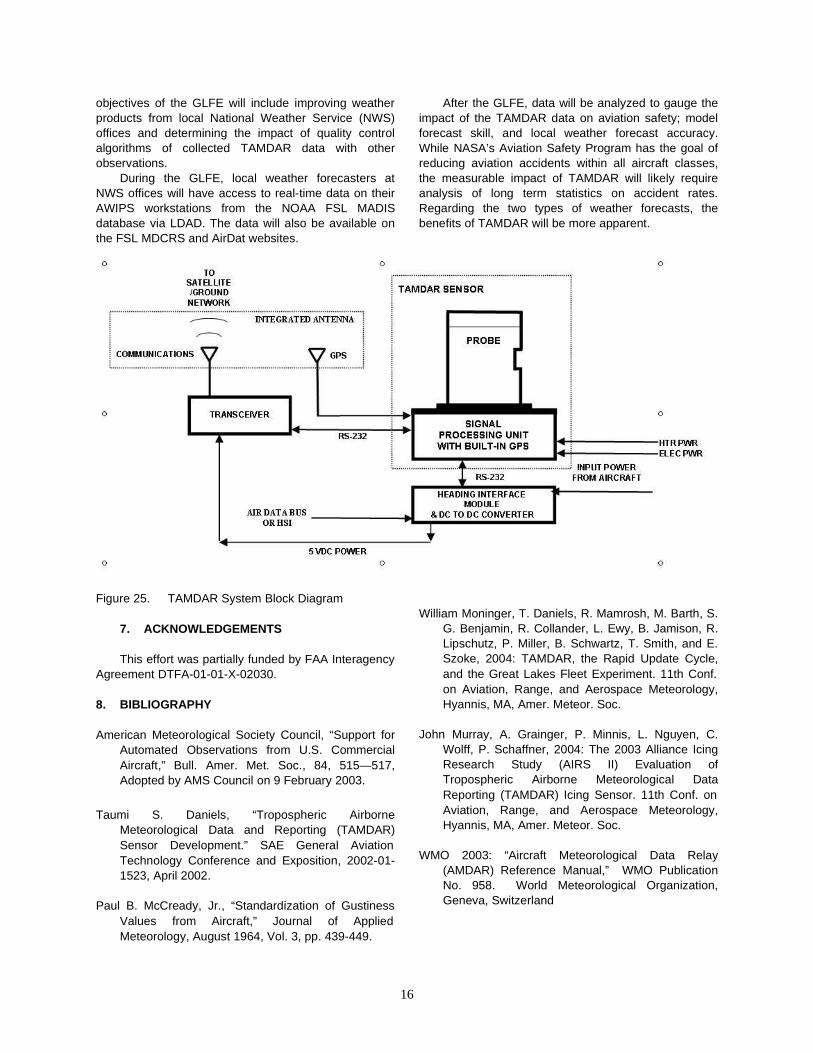
The Great Lakes Flight Experiment (GLFE) isplanned as a field campaign as a final flight experimentfor the TAMDAR sensor development (Moninger et al.,2004). The hypothesis is that the number and size ofsignificant weather forecast errors over the Great LakesRegion can be reduced by incorporating extraobservations from the TAMDAR sensors installed onMesaba Airlines Saab 340 aircraft. The installationblock diagram is shown in figure 25.
Representatives of Mesaba Airlines have agreed toparticipate in this experiment. Mesaba has revenueflights with 64 Saab 340 twin-turboprop aircraft in theGreat Lakes region. The duration is six months after allof the aircraft are equipped by Fall 2004.
The primary aim of the GLFE is to test the real-timeimpact of TAMDAR observations on Rapid UpdateCycle forecast model skill. Additional scientific
objectives of the GLFE will include improving weatherproducts from local National Weather Service (NWS)offices and determining the impact of quality controlalgorithms of collected TAMDAR data with otherobservations.
During the GLFE, local weather forecasters atNWS offices will have access to real-time data on theirAWIPS workstations from the NOAA FSL MADISdatabase via LDAD. The data will also be available onthe FSL MDCRS and AirDat websites.
After the GLFE, data will be analyzed to gauge theimpact of the TAMDAR data on aviation safety; modelforecast skill, and local weather forecast accuracy.While NASA’s Aviation Safety Program has the goal ofreducing aviation accidents within all aircraft classes,the measurable impact of TAMDAR will likely requireanalysis of long term statistics on accident rates.Regarding the two types of weather forecasts, thebenefits of TAMDAR will be more apparent.
Figure 25. TAMDAR System Block Diagram
7. ACKNOWLEDGEMENTS
This effort was partially funded by FAA InteragencyAgreement DTFA-01-01-X-02030.
8. BIBLIOGRAPHY
American Meteorological Society Council, “Support forAutomated Observations from U.S. CommercialAircraft,” Bull. Amer. Met. Soc., 84, 515—517,Adopted by AMS Council on 9 February 2003.
Taumi S. Daniels, “Tropospheric AirborneMeteorological Data and Reporting (TAMDAR)Sensor Development.” SAE General AviationTechnology Conference and Exposition, 2002-01-1523, April 2002.
Paul B. McCready, Jr., “Standardization of GustinessValues from Aircraft,” Journal of AppliedMeteorology, August 1964, Vol. 3, pp. 439-449.
William Moninger, T. Daniels, R. Mamrosh, M. Barth, S.G. Benjamin, R. Collander, L. Ewy, B. Jamison, R.Lipschutz, P. Miller, B. Schwartz, T. Smith, and E.Szoke, 2004: TAMDAR, the Rapid Update Cycle,and the Great Lakes Fleet Experiment. 11th Conf.on Aviation, Range, and Aerospace Meteorology,Hyannis, MA, Amer. Meteor. Soc.
John Murray, A. Grainger, P. Minnis, L. Nguyen, C.Wolff, P. Schaffner, 2004: The 2003 Alliance IcingResearch Study (AIRS II) Evaluation ofTropospheric Airborne Meteorological DataReporting (TAMDAR) Icing Sensor. 11th Conf. onAviation, Range, and Aerospace Meteorology,Hyannis, MA, Amer. Meteor. Soc.
WMO 2003: “Aircraft Meteorological Data Relay(AMDAR) Reference Manual,” WMO PublicationNo. 958. World Meteorological Organization,Geneva, Switzerland
16
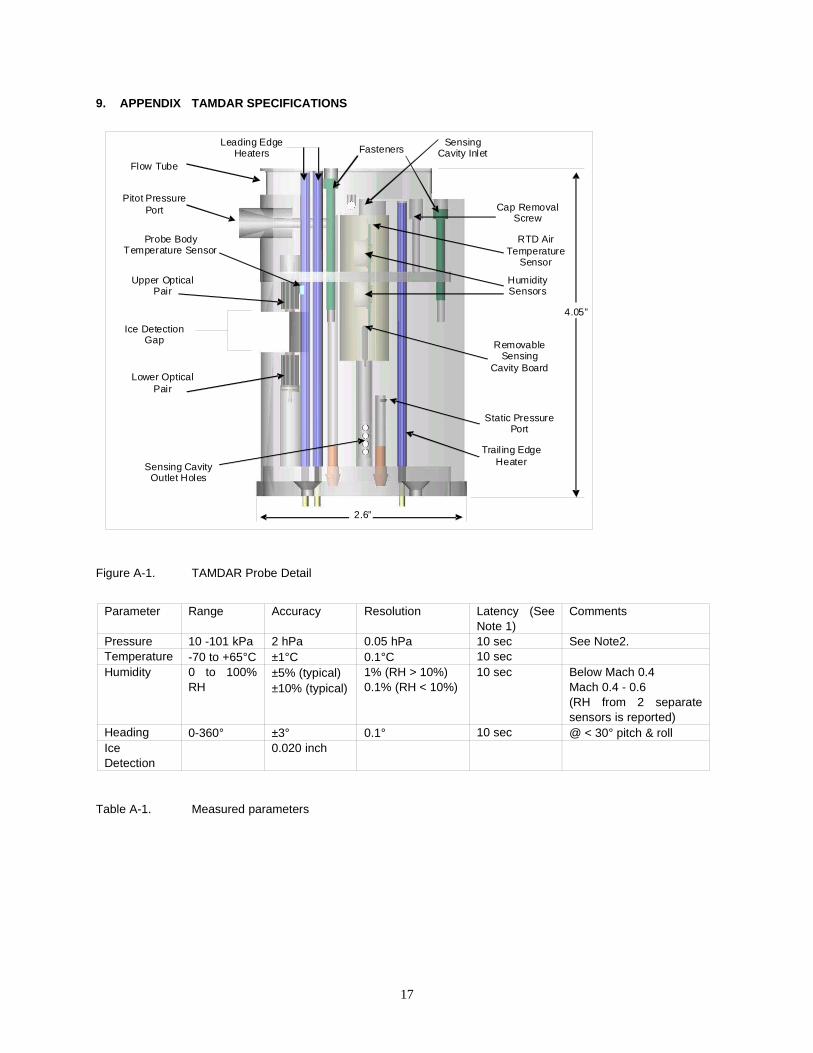
9. APPENDIX TAMDAR SPECIFICATIONS
Figure A-1. TAMDAR Probe Detail
Table A-1. Measured parameters
17
Parameter Range Accuracy Resolution Latency (SeeNote 1)
Comments
Pressure 10 -101 kPa 2 hPa 0.05 hPa 10 sec See Note2.Temperature -70 to +65°C ±1°C 0.1°C 10 secHumidity 0 to 100%
RH±5% (typical)±10% (typical)
1% (RH > 10%)0.1% (RH < 10%)
10 sec Below Mach 0.4Mach 0.4 - 0.6(RH from 2 separatesensors is reported)
Heading 0-360° ±3° 0.1° 10 sec @ < 30° pitch & rollIceDetection
0.020 inch
Flow Tube
Pitot Pressure Port
Sensing Cavity Inlet Fasteners
Leading Edge Heaters
Ice Detection Gap
Trail ing Edge Heater
Static Pressure Port
4.05”
2.6”
RTD Air Temperature
Sensor
Humidity Sensors
Removable Sensing
Cavity Board
Sensing Cavity Outlet Holes
Lower Optical Pair
Upper Optical Pair
Cap Removal Screw
Probe Body Temperature Sensor
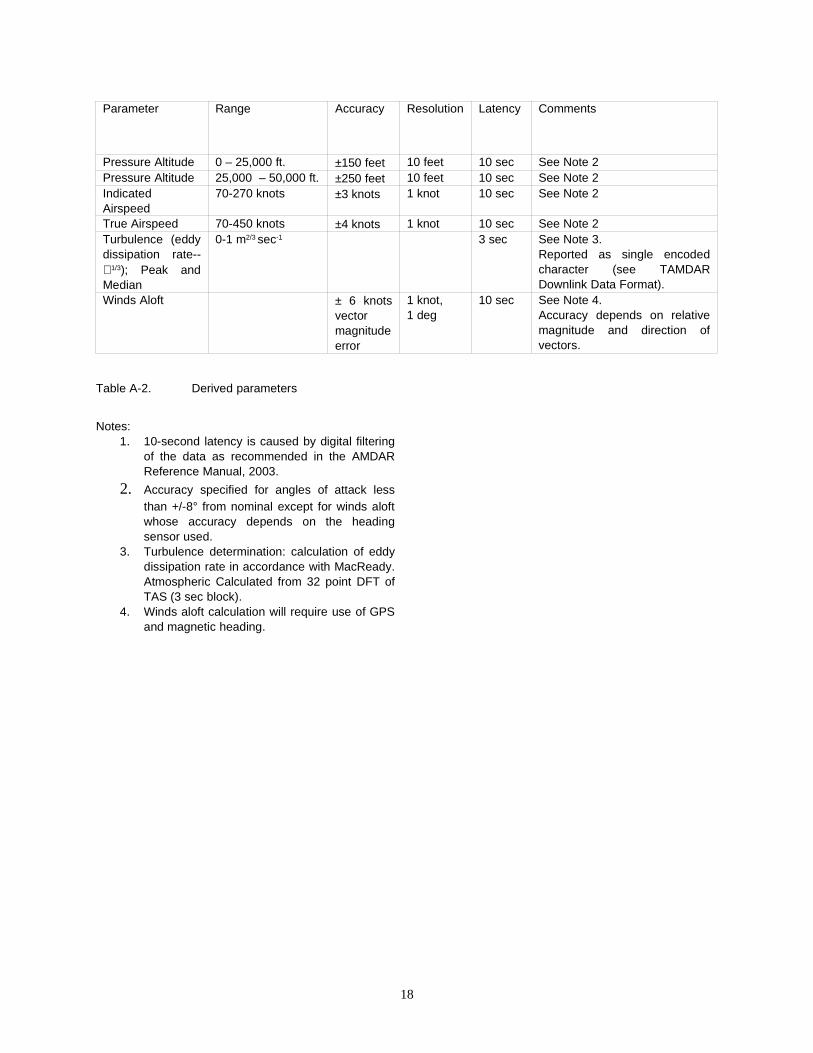
Table A-2. Derived parameters
Notes: 1. 10-second latency is caused by digital filtering
of the data as recommended in the AMDARReference Manual, 2003.
2. Accuracy specified for angles of attack lessthan +/-8° from nominal except for winds aloftwhose accuracy depends on the headingsensor used.
3. Turbulence determination: calculation of eddydissipation rate in accordance with MacReady.Atmospheric Calculated from 32 point DFT ofTAS (3 sec block).
4. Winds aloft calculation will require use of GPSand magnetic heading.
18
Parameter Range Accuracy Resolution Latency Comments
Pressure Altitude 0 – 25,000 ft. ±150 feet 10 feet 10 sec See Note 2Pressure Altitude 25,000 – 50,000 ft. ±250 feet 10 feet 10 sec See Note 2IndicatedAirspeed
70-270 knots ±3 knots 1 knot 10 sec See Note 2
True Airspeed 70-450 knots ±4 knots 1 knot 10 sec See Note 2Turbulence (eddydissipation rate--∈1/3); Peak andMedian
0-1 m2/3 sec-1 3 sec See Note 3.
Reported as single encodedcharacter (see TAMDARDownlink Data Format).
Winds Aloft ± 6 knotsvectormagnitudeerror
1 knot,1 deg
10 sec See Note 4.Accuracy depends on relativemagnitude and direction ofvectors.