Embed Size (px)
Citation preview
ABSTRACT
Title of Document: THE EFFECTS OF USING MENTAL
IMAGERY AS A COMPREHENSION
STRATEGY FOR MIDDLE SCHOOL
STUDENTS READING SCIENCE
EXPOSITORY TEXTS
Margaret H. Jenkins, Doctor of Philosophy, 2009
Directed By: Professor Mariam Jean Dreher
Department of Curriculum and Instruction
This study investigated the effects of mental imagery instruction using science
expository texts on middle school students. Using a quasi-experimental pretest-
posttest design, four intact classes (56 students) were randomly assigned to either an
experimental or comparison group. Students in the experimental group received
instruction on mental imagery strategies while comparison group students received no
mental imagery instruction. After the 2-week intervention, students took Posttest 1.
The comparison group students then received mental imagery instruction. Throughout
the rest of the school year, all students were prompted at least two to three times a
week to use mental imagery strategies. At the end of the school year, all participants
took Posttest 2.
Results indicated that there was a statistically significant interaction of time
and group for the selected response (SR) portion of expository science text
comprehension measure. Both groups appeared to make gains between Posttest 1 and
Posttest 2, once both had received mental imagery instruction. The comparison group,
which by chance included stronger readers, outperformed the experimental group.
There were no statistically significant differences on the brief constructed response
(BCR) measure.
Analysis of the performance of low-, middle-, and high-comprehenders
revealed statistically significant main effects for time and for type of comprehender
on the SR portion of the comprehension task. While all students appeared to make
gains between Posttest 1 and 2, the high- and middle-comprehenders consistently
outperformed the low-comprehenders. For the BCR, there were no statistically
significant effects of time or interaction; however, there was a statistically significant
effect for type of comprehender.
Pearson's product moment correlations revealed a statistically significant
positive relation between vividness of mental imagery and motivation to read for
middle-comprehenders and a statistically significant negative correlation between
comprehension and vividness of mental imagery for high-comprehenders. Both
experimental and comparison groups showed no statistically significant difference in
motivation to read before and after mental imagery intervention.
These results suggest that middle school students may benefit from mental
imagery strategies when reading science expository texts. It is recommended that
these strategies be used as a continuous effort in the classroom rather than a short
term “quick-fix.”
THE EFFECTS OF USING MENTAL IMAGERY AS A COMPREHENSION
STRATEGY FOR MIDDLE SCHOOL STUDENTS READING SCIENCE
EXPOSITORY TEXTS
By
Margaret H. Jenkins
Dissertation submitted to the Faculty of the Graduate School of the University of Maryland, College Park, in partial fulfillment
of the requirements for the degree of Doctor of Philosophy
2009
Advisory Committee: Professor Mariam Jean Dreher, Chair Associate Professor Marilyn Chambliss Professor Olivia Saracho Associate Professor Wayne Slater Associate Professor William Strein

© Copyright by
Margaret H. Jenkins
2009

ii
DEDICATION
This study is dedicated to my parents Kwan-Tung Ho and Shui-Fong To, who
nourished in me a life-long yearning for learning; my husband, Kenneth, for his
concern and support; to my children Syltinsy, Kennie, and Tze, for their patience and
encouragement.
iii
ACKNOWLEDGEMENT
This study gave me the opportunity to learn so much more in the field of
educational research. I wish to first express sincere thanks to my Advisor, Dr. Mariam
Jean Dreher, whose support and guidance made it possible for me to complete this
long project. I also would like to thank the committee members, Dr. Marilyn
Chambliss, Dr. Olivia Saracho, Dr. Wayne Slater, and Dr. William Strein, who
generously shared their time and expertise with me.
In addition, I wish to thank my co-worker Anita Baines, a fellow practitioner
in imagery strategies, for participating in my study and being Teacher Two for my
study. Together we may continue the teacher-as-researcher model and come up with
more ideas that work in a real classroom based on the confines and limitations that
are real to teachers. My next heart-felt thanks go to my principal, Darren Prioleau,
who believed in research-based ideas and was supportive as I continued this study.
Last, and certainly not least, I also wish to thank all my students, for whom I toil.
They are my inspiration.
iv
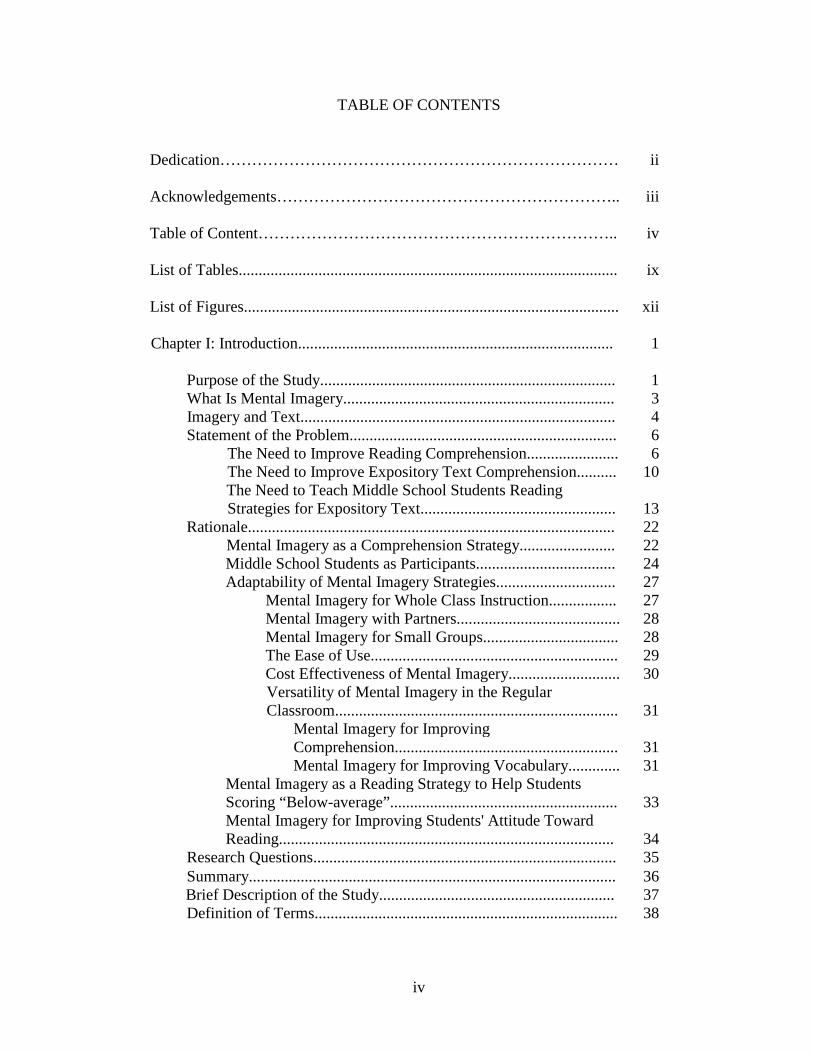
TABLE OF CONTENTS
Dedication………………………………………………………………… Acknowledgements……………………………………………………….. Table of Content………………………………………………………….. List of Tables............................................................................................... List of Figures..............................................................................................
ii
iii
iv
ix
xii Chapter I: Introduction...............................................................................
1
Purpose of the Study..........................................................................
1
What Is Mental Imagery.................................................................... 3 Imagery and Text............................................................................... 4 Statement of the Problem................................................................... 6
The Need to Improve Reading Comprehension....................... 6 The Need to Improve Expository Text Comprehension.......... 10
The Need to Teach Middle School Students Reading Strategies for Expository Text.................................................
13
Rationale............................................................................................ 22 Mental Imagery as a Comprehension Strategy........................ 22 Middle School Students as Participants................................... 24 Adaptability of Mental Imagery Strategies.............................. 27 Mental Imagery for Whole Class Instruction................. 27 Mental Imagery with Partners......................................... 28 Mental Imagery for Small Groups.................................. 28 The Ease of Use.............................................................. 29 Cost Effectiveness of Mental Imagery............................ 30 Versatility of Mental Imagery in the Regular Classroom.......................................................................
31
Mental Imagery for Improving Comprehension........................................................
31
Mental Imagery for Improving Vocabulary............. 31 Mental Imagery as a Reading Strategy to Help Students Scoring “Below-average”.........................................................
33
Mental Imagery for Improving Students' Attitude Toward Reading....................................................................................
34
Research Questions............................................................................ 35 Summary............................................................................................ 36 Brief Description of the Study........................................................... 37 Definition of Terms............................................................................ 38
v
Chapter II: Review of the Literature............................................................
41
Overview............................................................................................ Historic Use of Mental Imagery............................................... Basic Theories of Mental Imagery........................................... Early Experimental Use of Mental Imagery.............................
Contemporary Experimental Use of Mental Imagery....................... Experimental Studies in Mental Imagery as a Comprehension Strategy with No Instruction........................... Studies with No Instruction and No Reported Gains......... Studies with No Instruction and Positive Gains................ Experimental Studies in Mental Imagery with Instruction....... A Mental Imagery Study with Instruction and No Statistically Significant Gains............................................ Background of Imagery Instructional Techniques............................. Representational Imagery Instruction....................................... Transformational Instruction..................................................... Combination Instruction Using Representational and Transformational Strategies............................................... Difficulty in Measuring Mental Imagery.................................. Difficulty in Teaching and Creating Mental Imagery.............. Summary............................................................................................. How This Study Extends Prior Research............................................ Chapter III: Methodology............................................................................
41 41 41 45 46
49 49 54 56
56 58 59 67
69 72 74 79 87
89
Introduction......................................................................................... 89 Setting................................................................................................. 90
School....................................................................................... 90 Participants............................................................................... 91 Teachers.......................................................................... 91 Student Participants........................................................ 92 Measures............................................................................................ 95 The Gates-MacGinitie Reading Test ………………………... 95 The Vividness of Imagery Questionnaire................................. 96 The Motivation to Read Profile................................................ 97 Pretest and Posttest for Expository Text................................... 98 Reliability Check for Pretest and Posttests for Expository Texts.............................................................
100
Scoring of the Pretest and Posttests for Expository Texts...............................................................................
104
Selected Response.................................................. 104 Brief Constructed Response................................... 104 Research Design................................................................................. 106
Instructional Materials........................................................................ 107
vi
How Do the Expository Instructional Passages Compare with the Text from a Science Textbook?....................
108
Procedures.......................................................................................... 111 Time Allocations..................................................................... Time Allocations for Assessment..................................... Time Allocations for Instruction......................................
111 111111
Instructional Method................................................................ 112 Experimental Group Instructional Stages........................ 113 Representational Instruction Using Visual Aids..........................................................................
113
Representational Instruction Using Mental Pictures and Self-generated Drawings.....................
113
Representational Instruction Using Mental Imagery and Think-along Ideas...............................
114
Representational Instruction Targeting Unfamiliar Vocabulary in Context.............................................
116
Representational Instruction with Devices of Students' Choice (Illustrations, Mental Picture, or Think-along).............................................................
117 Comparison Group............................................................. 117 Post-Assessment....................................................................... Summary of Instructional Components for the Experimental and Comparison Group............................................................................
118
118 Follow-up Instruction........................................................................ Experimental Group................................................................ Comparison Group..................................................................
122 122 122
Data Analysis.................................................................................... 123 Effect Size Calculation............................................................ Summary...........................................................................................
Chapter IV: Results...................................................................................... Introduction.......................................................................................
127 128
130
130
The Initial Performance of the Students............................................ 130 Students' Performance on Comprehension for Expository Text........ Results for Question 1.............................................................. Expository Reading Comprehension Results for Selected Response………………………………………. Expository Reading Comprehension Results for Brief Constructed Response…………………………….. Results for Question 2................................................................ Selected Response for the Type of Comprehenders..…… Brief Constructed Response for the Type of Comprehenders..………………………………………… Results for Question 3………………………………………… Results for Question 4…………………………………………
133 133
134
137 140 140
143 146 153
vii
Summary.............................................................................................
Chapter V: Discussion................................................................................. Introduction........................................................................................ Study Summary.................................................................................. Review of Results...............................................................................
Students' Performance on Comprehension for Expository Text.............................................................................................. The Effects of Mental Imagery Instruction............................. The Effects of Mental Imagery Instruction on Low-, Middle-, and High-Comprehenders………............................ Relations between Variables................................................... Mental Imagery Instruction and Motivation........................... Study Conclusions and Implications.................................................. Analysis of the Limitations................................................................ Recommendations for Future Research.............................................
156
158
158 158 160
161 161
163 167 169 170 173 177
Appendix A: Model for Imagery Instruction.............................................. 178 Appendix B: Passages............................................................................... 178 1. The Mariana Trench..................................................................... 178
2. Volcanic Eruptions....................................................................... 183 3. Earthquake Resistant Buildings.................................................... 187
4. Is There Life on Mars?................................................................. 191 5. What It Is Like on the Moon........................................................ 195 6. Mount Everest.............................................................................. 198 7. The Unusual Puffer Fish............................................................... 202 8. Piranhas....................................................................................... Extra Practice Passage: Bees and Wasps..........................................
206 210
Appendix C: Pretest and Posttests............................................................. 214
1. Pretest: Crocodiles and Alligators................................................. 214 2. Posttest 1A: Octopus and Squid.................................................... 3. Posttest 2: Butterflies and Moths................................................... 4. Posttest 1B: Poisonous and Nonpoisonous Snakes of America..........................................................................................
217 221
225
Appendix D: Lesson Plans........................................................................... 229
Experimental Group Instruction.......................................................... 229 Set 1.......................................................................................... 229
Set 2........................................................................................... 232 Set 3........................................................................................... 235 Set 4........................................................................................... 238 Set 5........................................................................................... 242
Comparison Group Instruction........................................................... 244
viii
Appendix E: Images Chart........................................................................... Appendix F: Sheveland Vividness of Imagery Questionnaire.....................
246
247
Appendix G: Mental Imagery Planning Framework: Auxiliary Instruction………………….…………………………………...
248
Background.......................................................................................... Set 1..........................................................................................
248249
Set 2.......................................................................................... 251 Set 3.......................................................................................... 254 Set 4.......................................................................................... 257 Set 5.......................................................................................... Appendix H: Informal Study The Use of Mental Imagery as a Comprehension Strategy for middle School Students Reading Science Expository Texts................................... Introduction………………………………………………………….. Summary of Informal Study………………………………………… Discussion……………………………………………………………
261
263 263 263 266
References…................................................................................................
268
ix
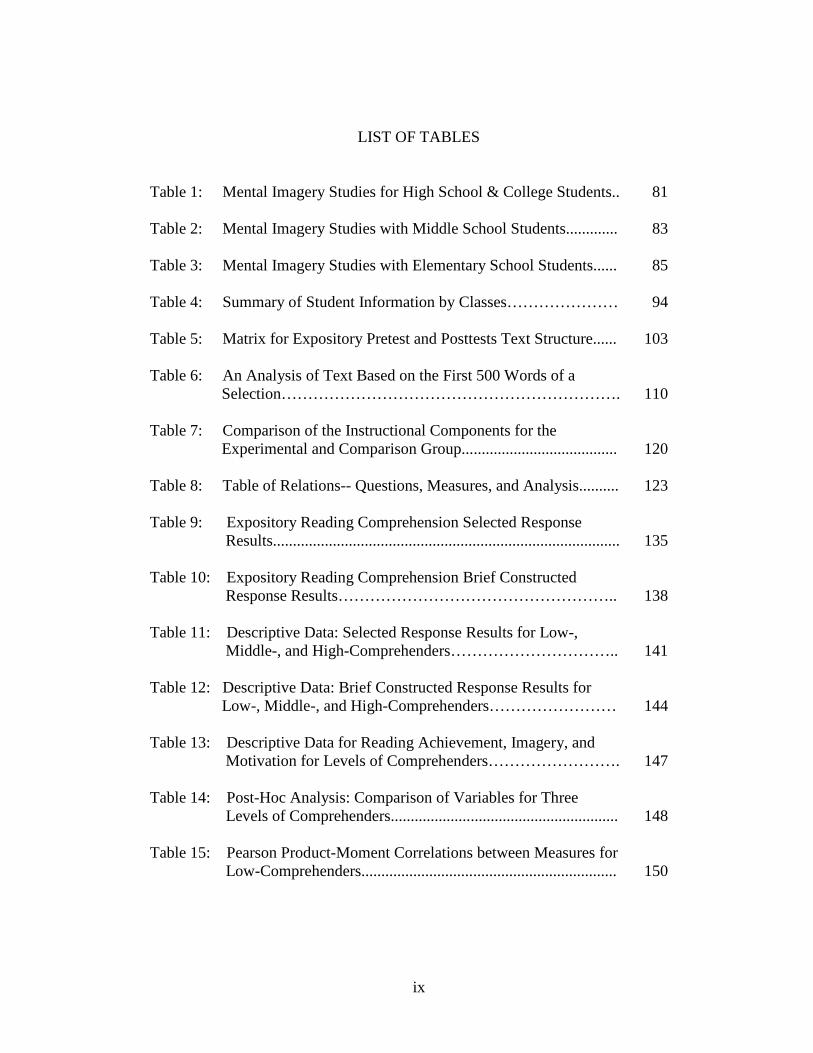
LIST OF TABLES
Table 1: Mental Imagery Studies for High School & College Students..
81
Table 2: Mental Imagery Studies with Middle School Students.............
83
Table 3: Mental Imagery Studies with Elementary School Students......
85
Table 4: Summary of Student Information by Classes………………… 94 Table 5: Matrix for Expository Pretest and Posttests Text Structure......
103
Table 6: An Analysis of Text Based on the First 500 Words of a Selection……………………………………………………….
110
Table 7: Comparison of the Instructional Components for the Experimental and Comparison Group.......................................
120
Table 8: Table of Relations-- Questions, Measures, and Analysis..........
123
Table 9: Expository Reading Comprehension Selected Response Results.......................................................................................
135
Table 10: Expository Reading Comprehension Brief Constructed Response Results……………………………………………..
138
Table 11: Descriptive Data: Selected Response Results for Low-, Middle-, and High-Comprehenders…………………………..
141
Table 12: Descriptive Data: Brief Constructed Response Results for Low-, Middle-, and High-Comprehenders……………………
144
Table 13: Descriptive Data for Reading Achievement, Imagery, and Motivation for Levels of Comprehenders…………………….
147
Table 14: Post-Hoc Analysis: Comparison of Variables for Three Levels of Comprehenders.........................................................
148
Table 15: Pearson Product-Moment Correlations between Measures for Low-Comprehenders................................................................
150
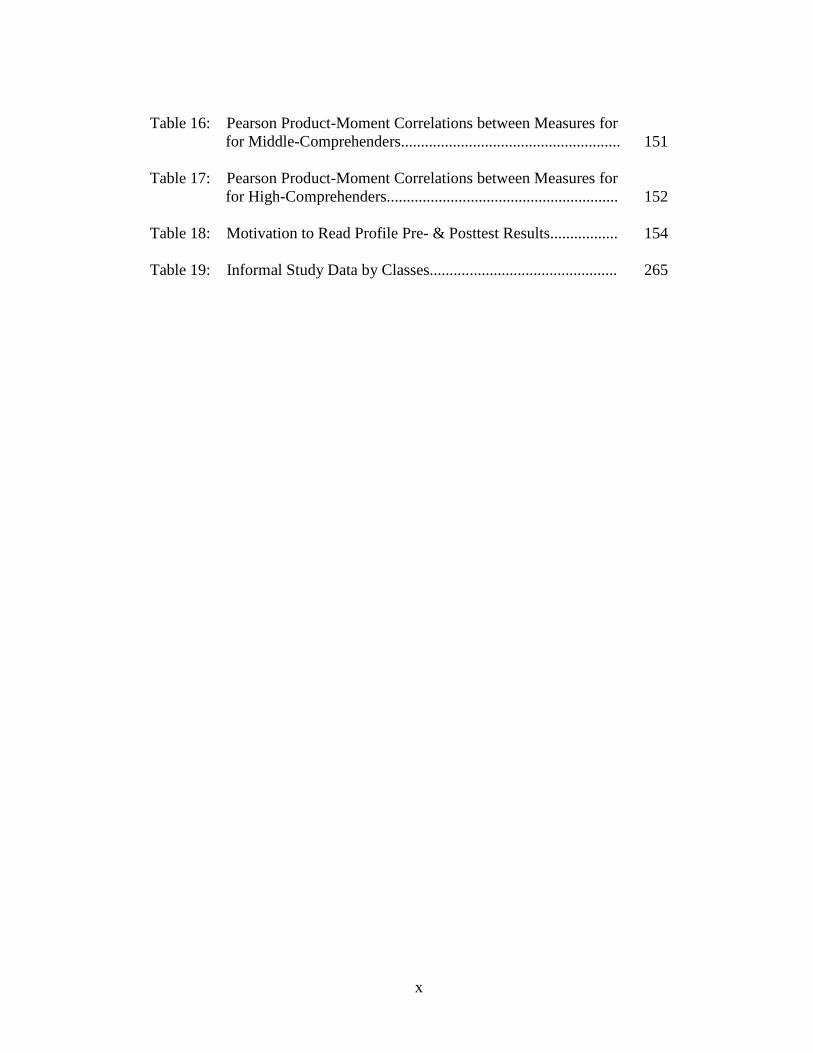
x
Table 16: Pearson Product-Moment Correlations between Measures for for Middle-Comprehenders.......................................................
151
Table 17: Pearson Product-Moment Correlations between Measures for for High-Comprehenders..........................................................
152
Table 18: Motivation to Read Profile Pre- & Posttest Results................. 154 Table 19: Informal Study Data by Classes...............................................
265
xi
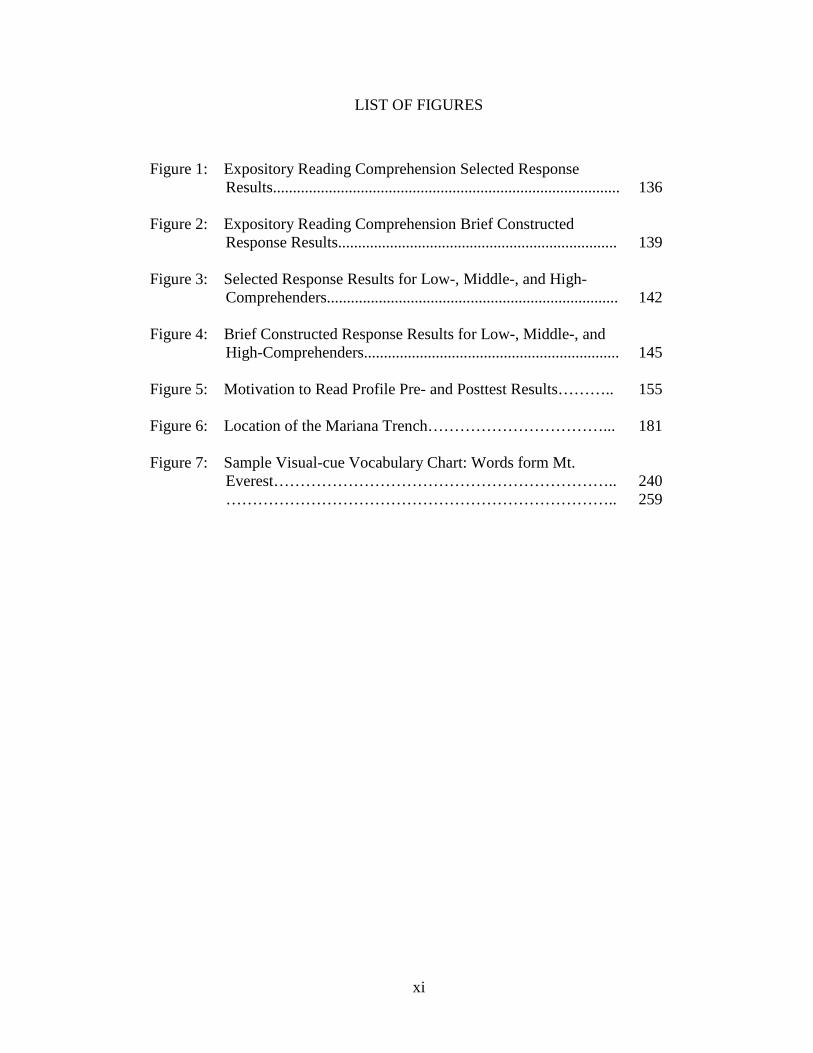
LIST OF FIGURES
Figure 1: Expository Reading Comprehension Selected Response Results....................................................................................... Figure 2: Expository Reading Comprehension Brief Constructed Response Results...................................................................... Figure 3: Selected Response Results for Low-, Middle-, and High- Comprehenders......................................................................... Figure 4: Brief Constructed Response Results for Low-, Middle-, and High-Comprehenders................................................................
136
139
142
145
Figure 5: Motivation to Read Profile Pre- and Posttest Results……….. 155
Figure 6: Location of the Mariana Trench……………………………... 181
Figure 7: Sample Visual-cue Vocabulary Chart: Words form Mt. Everest……………………………………………………….. ………………………………………………………………..
240 259
1
CHAPTER I
INTRODUCTION
Purpose of the Study
Mental imagery has long been a subject that has fascinated researchers (e. g.,
Levin, 1981; Paivio, 1986; Sadoski, 1983). Prior research in the field suggests that
mental imagery is not only an effective strategy to improve reading comprehension
(Bourduin, Bourduin, & Manley, 1993; Gambrell & Bales, 1986; Pressley, 1976;
Shriberg, Levin, McCormick, & Pressley, 1982), but it is also positively related to
motivation to read (e. g., Cramer, 1980; Irwin, 1979; Macomber, 2001; Sadoski &
Quast, 1990). Some studies have also shown that poor readers benefit more than good
readers when given instructions or practice in forming mental images during reading
(Gambrell, Koskinen, & Cole, 1981; Oakhill & Patel, 1991). However, most past
research that used mental imagery as a comprehension strategy involved elementary
students reading narrative texts (e. g., Bourduin, Bourduin, & Manley, 1993;
Gambrell & Bales, 1986; Macomber, 2001; Oakhill & Patel, 1991; Pressley, 1976).
There are very few studies that used mental imagery as a comprehension strategy for
middle school students reading science expository texts (Gunston-Parks, 1985; Peters
& Levin, 1986). Further, the few studies involving middle school students and
expository text have left much to be investigated. For example, in the study by
Gunston-Parks (1985), the focus was to investigate the effects of guided imagery. It
was not designed to teach students how to use mental imagery as a comprehension
strategy. In Peters and Levin's study (1986), the focus was to investigate recall of
information, not reading comprehension. Peters and Levin (1986) used training and
2
testing materials that consisted of sentences and short paragraphs (each three
sentences long). The materials were not the typical expository texts students
encounter when they read textbooks or take standardized tests. Thus, while prior
investigators have accumulated a vast amount of knowledge regarding mental
imagery, the area of teaching middle school students to use mental imagery as a
comprehension strategy for expository texts has been underdeveloped.
The purpose of this study was to investigate the effectiveness of mental
imagery as a comprehension strategy for sixth-grade middle school students reading
science expository text. This study provided middle school students with mental
imagery instruction over a two-week period so that students might learn and practice
these strategies when reading science expository texts. In addition, this study
examined whether there were sustained effects of using mental imagery strategies
when, after the instructional period, students were prompted at least two to three
times a week to use the strategies until the end of the school year. This investigation
would add to that body of research that seeks to improve reading comprehension
instruction by examining the effects of mental imagery instruction on students'
comprehension of science expository texts in a regular classroom setting.
This chapter begins with an explanation of what mental imagery is, then
continues with the need to improve students' reading comprehension, pointing out the
importance of expository texts and why middle school students need strategies for
comprehending them. Then the chapter presents the rationale for using mental
imagery as a comprehension strategy to help middle school students when reading
expository texts. Next, the following components are presented: mental imagery as a
3
comprehension strategy, middle school students as participants, the adaptability of
mental imagery strategies, mental imagery for whole class instruction, mental
imagery with partners, mental imagery for small groups, the ease of use, cost-
effectiveness of mental imagery, versatility of mental imagery in the regular
classroom, mental imagery as a reading strategy to help students scoring “below-
average,” improving student's attitude toward reading, research questions, summary
of the chapter, and a brief discussion of the current study. This chapter closes with
“Definition of Terms.”
What Is Mental Imagery
Mental imagery refers to any image created in the mind without the presence
of the real object or event, including the images of sight, sound, taste, touch, smell,
sensations, and feelings. Although mental imagery has been defined in various ways
in the fields of psychology and education, it is generally agreed to be the process of
forming internal sensations of objects or events not physically present (Hibbing &
Rankin-Erickson, 2003; Paivio, 1986; Paivio & Csapo, 1969; Sadoski, 2001; Sadoski
& Paivio, 2001). Many researchers think of mental imagery as visual imagery, and
what they call “pictures in the mind” (Gambrell & Bales, 1986, Gunston-Parks,
1985). However, Sadoski and Paivio (2001) claimed that if there is a “mind's eye,”
there is also the “mind's ear,” and other senses of the mind as well, since mental
imagery is based on sensory memories (p. 11). Sadoski and Paivio (2001) claimed
that “imagery pervades all aspects of our mental lives, including what we experience
when we read and write” (p. 11). They explained mental imagery as the sensations
and memories that people use to remember things and experiences. Sadoski (2005)
4
argued that mental imagery is the “primary cognitive form of nonverbal
representation” (p. 222). Mental imagery includes memories of sights, sounds, tastes,
touch, smells, feelings, events, and stories that may be replayed in the mind (Long,
Winograd, & Bridge, 1989). Douville and Algozzine (2004) stated that mental
imagery serves as a kind of internal blackboard or personal movie screen that aids in
dynamic problem-solving of both verbal and spatial tasks.
Researchers such as Goetz, Sadoski, Fatemi, and Bush (1994) claimed that
mental imagery plays an important part with the complex task of reading. Researchers
in reading have produced direct evidence linking reading and mental imagery (e. g.,
Levin, 1981; Sadoski, 1983). Research has also shown that being able to use mental
imagery with reading positively impacts the affective domain, and that many readers
who employ mental imagery tend to find texts more interesting as well as more
comprehensible and more memorable (Goetz et al., 1994; Long, Winograd, & Bridge,
1989; Sadoski, 1984; Sadoski & Paivio, 2001; Sadoski & Quast, 1990). Nell's study
(1988) presented anecdotal evidence that readers reported imagery during pleasure
reading. Prior research in the field also supported the use of mental imagery as an
enhancer of memory (Shriberg, Levin, McCormick, & Pressley, 1982) and as an
effective strategy for improving reading comprehension (Gambrell, 1982; Gambrell
& Bales, 1986; Oakhill & Patel, 1991; Pressley, 1976).
Imagery and Text
According to Long, Winograd, and Bridge (1989), one factor that seems likely
to influence the spontaneous generation of imagery while reading is the genre of the
text. Traditionally, reading texts are categorized into two types of writing: expository
5
texts and narrative texts (Downing, Bakken, & Whedon, 2002; Weaver & Kintsch,
1984). Weaver and Kintsch (1984) stated that the main thrust of expository texts is
“to communicate information so that the reader might learn something,” and that the
main focus of narrative texts is “to tell a story so that the reader will be entertained”
(p. 230). Weaver and Kintsch further explained that expository texts have rhetorical
structures that may be categorized into three main groups: (a) General-particular
relationships which include identification, definition, classification, and illustration;
(b) Object-object relations which include comparison and contrast; and (c) Object-
part relations which include technical analysis, structural analysis, functional analysis,
and casual analysis. Other researchers in the field listed similar structures, including
specific structures such as chronological order, listing, argument, problem and
solution, description, and process (Barr, Blanchowicz, Katz, & Kaufman, 2002; Barr,
Kamil, & Mosenthal, 1984; Langan, 1992; Olsen & Gee, 1991).
Expository texts include writings in textbooks, training manuals, and software
documentations (Weaver & Kintsch, 1984). Based on the definition that expository
text relates information, this study also categorizes as expository reading material
such as graphs, charts, maps, instructions, diagrams, memos, manuals, news, Internet
articles, and other similar materials.
As mentioned before, many researchers have examined mental imagery with
narrative texts. Long, Winograd, and Bridge (1989) explained that one reason for this
is the intuitive assumption that narrative texts would be more compatible with
imagery use than expository texts because of “the chronological event structure and
the subjective, experiential stance of the author” (p. 357). However, studies by
6
McCallum and Moore (1999) and Sadoski (1983, 1984) indicated that participants
reported using imagery when reading expository texts. Based on the idea that readers
can generate mental imagery when reading expository texts, this study investigated
the effects of teaching middle school students various mental imagery strategies to
use when reading expository texts similar to what may be found in sections of a
science textbook or portions of a typical state or national assessment.
Statement of the Problem
The Need to Improve Reading Comprehension
Most educators would agree that reading comprehension is very important.
Mason (2004) claimed that reading comprehension is the essential key not only to in-
school academic learning, but also to life-long learning. Other people may argue that
with new technology, many people need to read less. In fact, Griswold (2001)
claimed that America no longer has a “reading culture” because power and influence
of the society are shared with “less-than articulate” sports stars, pop musicians,
wealthy businessmen, and talk show queens (p. 5). In today's world, icons represent
words on sales registers or doors, recordings may give instruction or present an entire
novel in audio format, and many people choose television and movies for
entertainment over books. However, even Griswold acknowledged that many
influential people still hold that reading is important and that to be well-read is one
way to access power (p. 4).
In order to fully function in society and be able to tackle problems and have
access to important texts (whether literary, philosophical, or technical), people need
to read. Allington and Cunningham (2002) presented a projection indicating that the
7
shifting U.S. economy will require a future workforce in which the workers, and not
just the people in charge, will need some college or some form of post-secondary
education. They also argued that our nation’s literacy needs for the 21st-century
require “strong academic skills, thinking, reasoning, teamwork skills, and proficiency
in using technology” (Allington & Cunningham, 2002, p. 2).
Yet today many students nationwide are not achieving in reading. According
to the National Center for Educational Statistics, in the 2007 National Assessment of
Education Program (NAEP) report, only 33% of the fourth-grade students and 31% of
the eighth-grade students in the nation scored at or above “Proficient” in reading.
While the fourth-grade sample group of students made a 2% gain since 2005, the
eighth-grade sample group of students remained at the same proficient rate.
In addition to national testing, some educators use the students' state test
performance as another indicator for reading achievement. For instance, one mid-
Atlantic state assessment for 2006 indicated that 46.9% of the sixth-grade students
scored at the “Basic” level, and 53.1% of the students scored at the “Proficient” level
and above. While these state assessment scores appear to be better than the NAEP
scores, some researchers have noticed that the standards for state tests are quite
different than the NAEP (McGill-Franzen & Allington, 2006). McGill-Franzen and
Allington (2006) noted disparity between the NAEP and state assessments; in fact
they claimed that some of the state assessments allow for more accommodations for
students with deficits and disabilities, therefore allowing for more “improvement”
than the NAEP (p. 765). For example, some state accommodations may include
verbatim reading of the entire reading test; however, that is not allowed on the NAEP
8
(National Center for Educational Statistics, NAEP Inclusion Policy, 2007). Another
researcher, Lee (2006), found that nearly all the 43 states which have both NAEP and
state assessments showed lower standards on their state assessments.
Furthermore, state assessments may also be quite different from the normed
standardized tests such as the Gates-MacGinitie Reading Test (2000). When some
students who score at or above the “Proficient” range on a state test take a
standardized normed reading test such as the Gates-MacGinitie, they may score
below grade level. For example, in the 2005-2006 school year, I used the Gates-
MacGinitie Reading Test (2000, Form S) to test my sixth-grade students. Results
showed that one of my classes had an average reading level of 3.7 (grade
equivalence). Yet on average, these students were scoring in the “Proficient” range
according to the state assessment.
While it is a challenge to help the students who score “Basic” improve their
reading, it is also a challenge to make sure that the students who score “Proficient”
for a given year have the skills to do well the following year. The students who score
“Proficient” may not necessarily be “Proficient” with a different test. In addition, as
students progress through the grades, assessments become more challenging. One
way to help students perform well on any reading task is to provide them with reading
strategies that they can use.
The seriousness of the need to improve students’ reading achievement is
evident to many educators and administrators. For intervention, some school systems
have adopted expensive reading programs that publishers have guaranteed to be
“research based” and “tested,” with the hope that these programs will be a quick
9
answer to the problem. Most of these “canned” reading programs are expensive. For
example, the READ 180 program by Scholastic Incorporated is designed for students
who read a year or more below grade level. It may cost $10,000 for initial setup for
computer programs (software only) and reading materials for one classroom. The
classroom also needs to be equipped with at least seven computers linked to a
mainframe, which also adds to a sizable sum for computer hardware. The optimal
class size for that program to be effective is between 7 to 14 students (Scholastic,
READ 180 Classroom, 2008).
Other intervention reading programs such as Soar to Success published by the
Houghton- Mifflin Publishing Company (2007) may be useful in small group tutorial
settings only, and may not be practical for the classroom teacher, with 25 students or
more, to implement. The Houghton-Mifflin Publishing Company designed the
reading intervention materials to be used with a group size of no more than seven, and
the price in 2007 was about $948 for a set of materials of 18 titles, seven copies each,
with six consumable student guides (Houghton-Mifflin, 2007).
Some of these reading programs also may be “scripted,” which means using
one model of teaching for all students. The teacher would have to read directly from
the manual, and not be able to adjust to the learning styles or interests of her students.
An example of a scripted reading program is Scholastic's Guided Reading Program
(2005). Scripted programs may not be the answer to all students’ needs. Some
teachers such as Ms. Soran, who was interviewed for an article in the NEA Today
magazine, spoke against the use of scripted programs, claiming that scripted
programs remove “teacher creativity” (Winans, 2005). In view of these problems,
10
many school systems are looking into various inexpensive, teacher-friendly, student-
oriented, and result-producing approaches to teaching reading strategies that may be
implemented in the regular classroom. Thus, this study used one such approach--
teaching mental imagery strategies to students in a regular classroom with the intent
of helping students improve reading comprehension when they read expository texts.
Mental imagery instruction does not need extra money, and it is teacher-friendly and
student-oriented. Since results from my informal study in the school year 2005-2006
indicated that the instruction benefitted my students, I began this study (a more
refined model compared to the informal study) with the assumption that mental
imagery instruction would benefit the current group of students as well. Information
regarding my informal study is included in Appendix H.
The Need to Improve Expository Text Comprehension
When students read or take tests, they commonly encounter narrative and
expository texts. Narrative texts tell a story or relate a sequence of events. Narrative
texts demonstrate a “story grammar” in which there is a setting, events that unfold,
usually some problems, bringing forth reaction and more events, and then a solution
and conclusion (Rumelhart, 1975). On the other hand, expository texts mainly relate
information, and may use rhetorical structures such as cause and effect, analysis,
compare and contrast, explanation, description, classification, illustration, argument
and persuasion, and definition (VanderMey, Meyer, Van Rys, Kemper, & Sebranek,
2007).
When students first learn to read, they often read story books that are narrative
in nature. As noted, narrative text refers to the type of writing that tells a story or
11
presents a series of events (Smith & Ellis, 2003). The story grammar or schema in
narratives is familiar to many children because they are used to the story-telling
conventions (Rumelhart, 1975). Sheveland (1992) noted that narrative texts typically
found in literature books are written to allow students "to comprehend, store, and
retrieve a sense of story" (p. 11). However, when students reach the upper elementary
grades, they are exposed to more expository texts as they read texts in subjects such
as science and social studies. The importance of expository text seems to increase
even more as students move into middle school since the students now have
textbooks in science, mathematics, social studies, technical education, health, family
consumer science, and maybe even a foreign language. The only narrative texts many
students encounter in school are literature anthologies or selected novels in their
reading or English classes.
Does this increased focus on expository text reflect the world and the tasks
demanded of the average person? A report by the U.S. Department of Labor on
achieving necessary skill (SCANS, 1992) identified eight areas considered essential
to the preparation of all students, and reading achievement is one of them. It
specifically mentions that future workers must be able to productively use
information and have competence in reading. It states, “Without the ability to read a
diverse set of materials, employees will not be able to locate the descriptive and
quantitative information needed to make decisions or to recommend courses of
action” (p. xvi). Bovee, Thill, and Schatzman (2003) claimed that with the
advancement of technology such as the Internet, it is important for today’s worker to
12
be able to read information and make good choices (pp. 6- 8). Many of these tasks
require the reading of expository texts.
As Allington and Cunningham (2002) have predicted, the future worker needs
to be literate, and highly effective with technology skills-- skills that require the
understanding of expository texts since technical knowledge, manuals, and
procedures are mainly written as expository texts. The high-tech world literacy
revolves around expository texts-- from learning how to operate a computer program,
doing research using the Internet, to putting a presentation ready for clients.
Expository texts are very important to a student's future success in the job market.
Expository texts are also very important when it comes to testing. When
students take high-stakes, state-mandated reading tests, many of the selections are
expository in nature. An example is the National Assessment of Education Program
(NAEP) reading test. For 2005, both the fourth- and eighth-grade tests contain four
narratives and five expository passages (National Center for Educational Statistics,
2005). This means that for both the fourth- and eighth-grade NAEP tests, 44% are
narrative and 56% are expository texts. An examination of the sixth-grade public
release task of another standardized test, the California Standard Test (CST), reveals
that three passages are narrative and thirteen text selections are expository (California
Department of Education, 2007). This means that for the sixth-grade CST test, 19%
are narrative and 81% are expository texts. Among the text selections are a form, a
diagram, and a letter to the editor. Although these items are not the typical
informational texts similar to those from science or social studies textbooks, they are
13
included in the expository category based on the definition that expository texts
provide information or explanation.
Similarly, in the sixth-grade Gates-MacGinitie Reading Test (Form S, 2000),
half of the comprehension test portion uses expository passages. These various test
samples show that expository texts form a large part of today's reading assessment. If
students have difficulty understanding expository texts, how can they do well on the
typical standardized tests or high-stakes state tests when half or more than half the
test contains expository passages? Poor performance on tests may cause the students
to be placed in lower level programs, or be placed in academic tracks where they have
less opportunity to all the academic chances available. Thus, facility with expository
texts appears to have a big impact on a student's future.
The Need to Teach Middle School Students Reading Strategies for Expository Text
It is important that middle school students learn strategies to comprehend
expository texts and improve their reading skills. Performing well in school on a day-
to-day basis depends largely on reading skills associated with expository texts, doing
well on standardized tests and state tests depends on such skills, and achieving goals
in the students' future jobs may also depend on them. The need to teach middle school
students reading strategies for expository text is indeed intense. In addition to the
greater demand for students to use expository texts, this type of text is usually more
difficult for many students (Saenz & Fuchs, 2002). Furthermore, many content
teachers usually do not teach reading strategies (Alverman & Moore, 1991;
Armbruster, Anderson, Armstrong, Wise, Janisch, & Meyer, 1991), and the reading
teachers often do not teach reading strategies for expository texts (Hoffman, Roser, &
14
Battle, 1993; Winograd & Greenlee, 1986). These points are explained in later
sections of this paper.
As noted, there is a greater demand for students to use expository texts in the
middle school when compared to that of the elementary school. In a typical day,
middle school students may read a variety of materials. For example, they may read
an excerpt from a novel in their literature-based basal in Reading class, directions for
sewing in Home Economics class, directions for making a catapult in Tech Ed class,
information on an ancient civilization in Social Studies class, steps for solving an
equation in Math class, health information in Physical Education and Health class,
and information about rocks and minerals from the science textbook in Science class.
Other than the excerpt from a novel from the basal reader, the other types of texts
may be classified as expository.
When students read narrative texts, they rely on sequence of events and a
certain pattern that researchers term “story grammar” (Rumelhart, 1975). Students are
exposed to this method of presenting information even at an early age, when they
start listening to stories. Narration is usually the most familiar style of reading for
students. In fact by fourth grade, the pattern of narratives comes so easily to the
students that except for academically challenged students, most do not need to be
taught story grammar (Dreher & Singer, 2001). However, when students read
expository text, instead of story grammar, different structures are evident.
Expository writing includes various structures such as classification, cause
and effect, argument and persuasion, compare and contrast, definition, description,
explanation, and process (VanderMey et al., 2007). Expository texts may have
15
technical vocabulary that may be difficult for students to decode and understand. For
example, a typical sixth-grade science textbook such as Holt's Earth Science (2001)
contains terms such as “photosynthesis” and “centripetal.” Smith and Ellis (2001)
analyzed various expository texts and noted some special features. They stated that
expository texts may have general statements in the opening and closing, repetitions
of the topical theme, and unique structure for sentences, such as timeless verb
constructions. For example, the statement, “The life cycle of every butterfly begins
with an egg,” indicates a timeless verb construction (Smith & Ellis, 2003, p. 1).
Students who are not accustomed to reading this type of writing may be confused
about what the most important key word is and how the things mentioned are related.
Smith and Ellis also pointed out generic noun constructions in expository texts, which
may be difficult for some readers to grasp. For example, from the statement “Batik
designers create a picture in wax on a piece of cloth” (Smith & Ellis, 2003, p. 1),
students have to think about the noun phrase “batik designers” and who these people
are in order to understand what they do. The task of identifying and understanding
generic noun phrases is quite different and more complicated than reading about
characters named Jack or Alice.
In addition, Sadoski and Paivio (2001) have argued that expository texts found
in social studies and science textbooks are often written in a very dry and factual
manner. They also noted that critics point out that much expository text is "lifeless"
and "insipid," while some other expository texts contain "bland facts set off by
dazzling graphics" (p. 264).
16
The average course load for a middle school student will result in the student
encountering more expository reading than narrative reading. Yet reading strategy
instruction for expository texts is often overlooked (Smith, Ellis, & Reed, 2003;
Williams, Hall, Lauer, Stafford, DeSisto, & de Cani, 2005). In 2002, Barry conducted
a survey of secondary teachers of all subject areas to find what strategies teachers
claim they use. Of the 123 teachers who responded, 84% claimed that their top most
favored instructional strategy was using visual aids. When the students go to science
or other content classes, they are expected to already know how to read. Alverman
and Moore (1991) noted that the content teachers are mainly focused on delivering
their content. They suggested that students rely on the teacher's lecture and notes as
the main source for information and that there is actually very little reading in many
of the content classes. Yet to be successful, students need to read the text to complete
tasks such as answering questions and taking tests.
Similarly, Raphael, Kirshner, and Englert (1989) noted that when children
reach the upper elementary grades, they are not taught how to read and learn from
informational or content area texts. The lack of reading instruction in science and
social studies is carried over to the middle schools, where reading strategies are
usually only taught in reading classes. It is quite ironic that despite the vast amounts
of expository texts and expository reading tasks students have in the middle school,
little is done to help them understand these texts or tasks. In their study, Armbruster,
Anderson, Armstrong, Wise, Janisch, and Meyer (1991) documented that lecture and
discussion type activity predominate in science and social studies classes, with
actually very little reading of the content textbook or trade books.
17
In an informal survey of five science teachers in the middle schools where I
have worked, I found that the science teachers claimed that they mainly used notes to
teach the class because the science text book was “too hard.” When students used the
science book, they mainly looked at illustrations, graphs, charts, vocabulary, and
located information to answer questions. Students were not expected to read the full
text in its entirety. Most of the text was explained to the students. One science teacher
said that she used the science book with her Honors class (also known as the Gifted
class in other districts), although she did not use the textbook with the On-grade-level
class except to look at charts, graphs, diagrams, graphics, or look for information to
complete tasks. While there was little reading in these science classrooms, students
were expected to complete tasks and take tests that require reading. As a result, many
students experienced difficulty when taking their unit tests.
In their study, Saenz and Fuchs (2002) noted that their participants, 111 high
school students in special education and remedial classes, did comparatively worse on
reading comprehension tasks with expository texts than narrative texts. Saenz and
Fuchs (2002) argued that features in expository texts such as headings, subheadings,
topic sentences, cueing devices such as “first,” “second,” and “in contrast” were
difficult for the students (p. 32). They explained that in contrast to expository texts,
narrative writing has a pattern which is similar to the everyday language experienced
by children, and therefore, their students performed better on the narrative texts
(Saenz & Fuchs, 2002).
Even among expository texts, science expository text is particularly difficult
for students when compared with social studies texts. Social studies texts may contain
18
narrative components which may be easier to follow. The following excerpt from a
sixth-grade social studies textbook titled The World: Harcourt Brace Social Studies
(2000) demonstrates the narrative nature of a typical social studies passage:
Sargon the Conqueror
The first known conqueror in the region of Mesopotamia was
a warrior named Sargon. He lived in the city-state of Kish. As
a young man he served as an official in the king’s government.
Sargon later killed the king and took control of Kish. Gathering
an army, Sargon then marched through Mesopotamia, establishing
a vast empire. An empire is a conquered land of many people and
places governed by one ruler. Sargon became the region’s first
emperor, or ruler of the empire. (p. 80)
Many students are familiar with narrative type development, consistent with
stories and “story grammar” they have been exposed to at an early age. In contrast,
the following excerpt from a sixth-grade science textbook demonstrates a different
writing style, using expository writing structures-- explanation, definition, and cause
and effect:
What causes earthquakes?
As tectonic plates push, pull, or scrape against each other, stress
builds up along faults near the plates' edges. In response to this
stress, rocks in the plates deform. Deformation is the change in
the shape of rock in response to stress. Rock in a fault line
deforms in mainly two ways-- in a plastic manner, like a piece
19
of molded clay, or in an elastic manner, like a rubber band.
Plastic deformation ... does not lead to earthquakes. Elastic
deformation, however, does lead to earthquakes. While rock
can stretch farther than steel without breaking, it will break at
some point... Like the return of the broken rubber pieces to
their unstretched shape, elastic rebound is the sudden return
of elastically deformed rock to its original shape... During
elastic rebound, rock releases energy that causes an earthquake...
(Holt, Rinehart, & Winston, 2001, p. 197)
Informational texts such as the one above may be difficult for students who
have not been reading much expository texts, especially if they have not been taught a
reading strategy to use with such texts.
Tierney and Readence (2000) listed a variety of reading strategies available for
classroom teachers to use-- from predictions, story mapping, questioning the author,
investigating themes, to character analysis. These strategies are all useful for students
to comprehend text and make connections with the text, and teachers mainly use them
with narrative texts. What about specific instruction and reading strategies for
expository texts? Since the students are not likely to get reading strategies in content
classes, will they get them in reading class? The answer is probably not. Many
schools systems still use literature based basal readers for reading instruction while
other school systems may use novels and selected books. In both cases, the materials
are mainly narrative. Many basal readers are literature-based with few expository
texts. For example, in a typical literature-based sixth-grade basal reader, Introduction
20
to Literature (Holt, 2000), there are eight units based on genres, each with about four
or five short pieces of writing or excerpts from longer pieces of literary work. Of the
eight units, only one is expository. The total number of narrative selections is 35
whereas the number of expository selections is 8, with the ratio of narrative to
expository is 15:1. Another basal-- the Scott Foresman's sixth-grade Literature
(2000)-- contains more expository texts compared to the Holt. It is organized by
theme, and there are usually four or five selections for each theme, including short
stories, poetry, and some informational writing. For example, in the first theme
related to “growing up,” the basal reader contains the following pieces of writing: (a)
a diary entry by a thirteen year old student about her first experiences in junior high,
(b) a short story about a young girl who is gifted in music but has challenges in
reading, (c) a short article about growing up rites of passage from different cultures
around the world, (d) a poem, and (e) a folk tale with a setting in Africa. An analysis
of the section shows that out of the five selections, three are narrative. Some may
consider the diary to be similar to documentaries, and therefore qualify as expository
writing because it explains and gives information; yet the format of that piece is also
narrative. The only informational piece of writing is the one about rites of passage,
only two pages long. The ratio for the first unit for narrative versus expository is 4:1.
This information is similar to the findings of Flood and Lapp (1986). The
researchers examined eight reading programs and found that on average, 65% of the
selections and 72% of pages are narratives or poems. It is rather surprising that the
reading basals, even today, do not reflect the recommendations of many researchers
in the field who called for a “balanced program” and suggested that students read
21
both narrative and information books (Dreher, 2003; Rasinski & Padak, 2004;
Winograd & Greenlee, 1986). The two recent sample basal reading programs do not
appear to be much different than the reading programs twenty years ago-- students are
still not exposed to enough expository texts in their reading programs.
In addition to the small amount of expository texts in the basal readers,
sometimes, the reading teachers may skip the teaching of expository selections.
Researchers such as Armbruster et al. (1991) have found that some reading teachers
do not feel as comfortable teaching expository texts when compared to teaching
narrative texts, and opt to skip some expository selections. It is ironic that when the
students go to reading class, they are usually not taught the strategies that may work
well with expository texts because many reading teachers favor the narrative style.
According to a survey of read aloud practices in 537 elementary classrooms
nationwide, none of the most frequently read titles at any grade level were
informational books (Hoffman, Roser, & Battles, 1993). Similarly, Yopp and Yopp
(2000) surveyed 126 elementary teachers, and found that only 14% of the materials
teachers reported reading aloud on a given day were expository. It is not surprising
that many students struggle with expository texts.
Regardless of the how the expository text is written and whether students had
reading strategies to handle expository texts or not, students are expected to read and
comprehend the materials. The students who are more challenged or “at-risk”
definitely need some extra help. Dreher (2000) stated that it is particularly important
for “at-risk” students to have the opportunity to interact with information text (p. 73).
Chall, Jacobs, and Baldwin (1990) pointed out that students from low income families
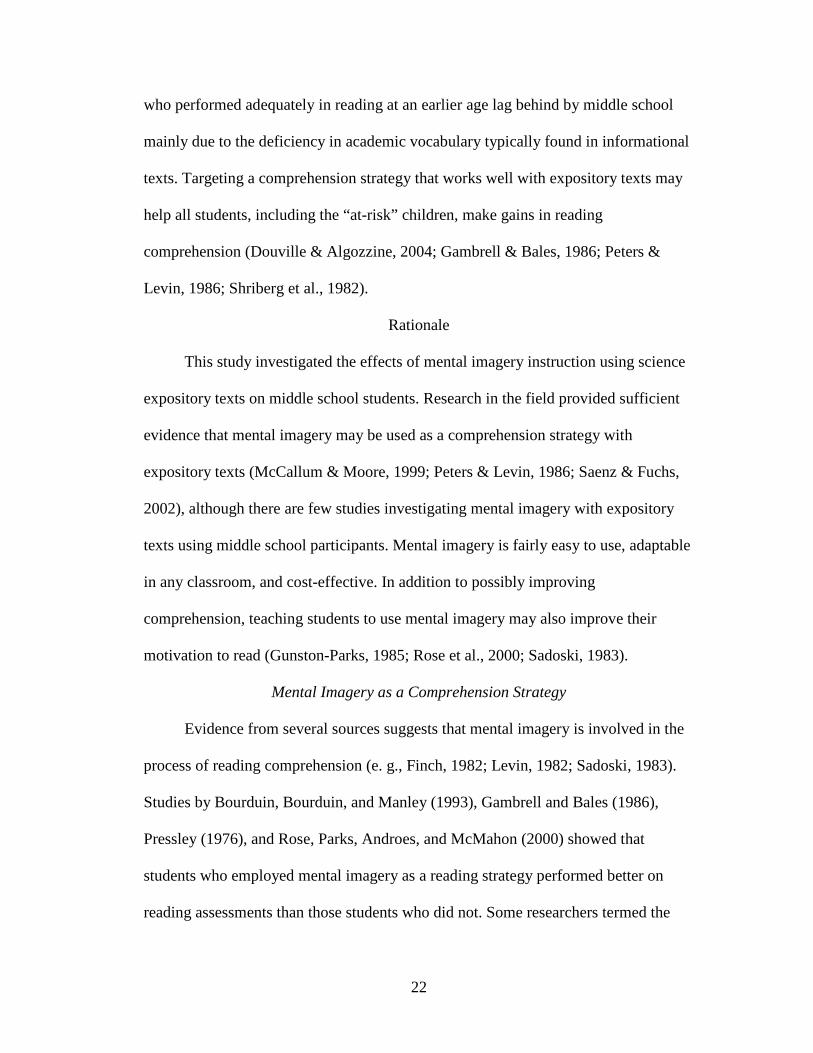
22
who performed adequately in reading at an earlier age lag behind by middle school
mainly due to the deficiency in academic vocabulary typically found in informational
texts. Targeting a comprehension strategy that works well with expository texts may
help all students, including the “at-risk” children, make gains in reading
comprehension (Douville & Algozzine, 2004; Gambrell & Bales, 1986; Peters &
Levin, 1986; Shriberg et al., 1982).
Rationale
This study investigated the effects of mental imagery instruction using science
expository texts on middle school students. Research in the field provided sufficient
evidence that mental imagery may be used as a comprehension strategy with
expository texts (McCallum & Moore, 1999; Peters & Levin, 1986; Saenz & Fuchs,
2002), although there are few studies investigating mental imagery with expository
texts using middle school participants. Mental imagery is fairly easy to use, adaptable
in any classroom, and cost-effective. In addition to possibly improving
comprehension, teaching students to use mental imagery may also improve their
motivation to read (Gunston-Parks, 1985; Rose et al., 2000; Sadoski, 1983).
Mental Imagery as a Comprehension Strategy
Evidence from several sources suggests that mental imagery is involved in the
process of reading comprehension (e. g., Finch, 1982; Levin, 1982; Sadoski, 1983).
Studies by Bourduin, Bourduin, and Manley (1993), Gambrell and Bales (1986),
Pressley (1976), and Rose, Parks, Androes, and McMahon (2000) showed that
students who employed mental imagery as a reading strategy performed better on
reading assessments than those students who did not. Some researchers termed the
23
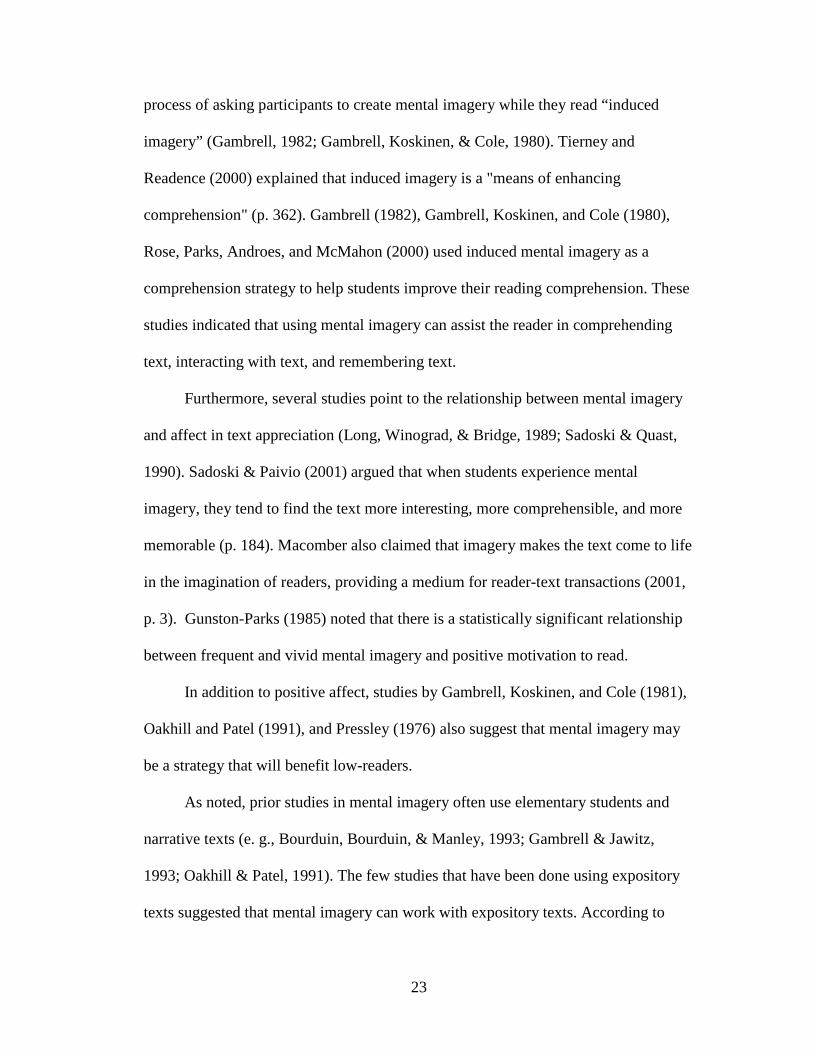
process of asking participants to create mental imagery while they read “induced
imagery” (Gambrell, 1982; Gambrell, Koskinen, & Cole, 1980). Tierney and
Readence (2000) explained that induced imagery is a "means of enhancing
comprehension" (p. 362). Gambrell (1982), Gambrell, Koskinen, and Cole (1980),
Rose, Parks, Androes, and McMahon (2000) used induced mental imagery as a
comprehension strategy to help students improve their reading comprehension. These
studies indicated that using mental imagery can assist the reader in comprehending
text, interacting with text, and remembering text.
Furthermore, several studies point to the relationship between mental imagery
and affect in text appreciation (Long, Winograd, & Bridge, 1989; Sadoski & Quast,
1990). Sadoski & Paivio (2001) argued that when students experience mental
imagery, they tend to find the text more interesting, more comprehensible, and more
memorable (p. 184). Macomber also claimed that imagery makes the text come to life
in the imagination of readers, providing a medium for reader-text transactions (2001,
p. 3). Gunston-Parks (1985) noted that there is a statistically significant relationship
between frequent and vivid mental imagery and positive motivation to read.
In addition to positive affect, studies by Gambrell, Koskinen, and Cole (1981),
Oakhill and Patel (1991), and Pressley (1976) also suggest that mental imagery may
be a strategy that will benefit low-readers.
As noted, prior studies in mental imagery often use elementary students and
narrative texts (e. g., Bourduin, Bourduin, & Manley, 1993; Gambrell & Jawitz,
1993; Oakhill & Patel, 1991). The few studies that have been done using expository
texts suggested that mental imagery can work with expository texts. According to
24
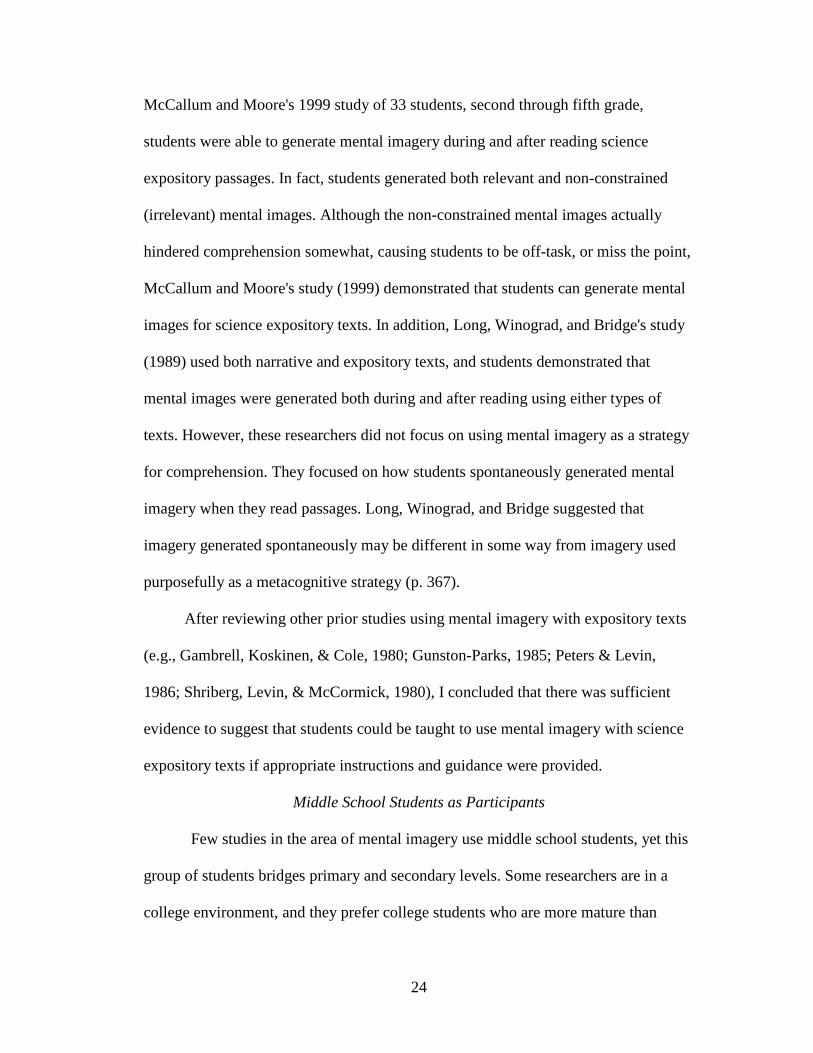
McCallum and Moore's 1999 study of 33 students, second through fifth grade,
students were able to generate mental imagery during and after reading science
expository passages. In fact, students generated both relevant and non-constrained
(irrelevant) mental images. Although the non-constrained mental images actually
hindered comprehension somewhat, causing students to be off-task, or miss the point,
McCallum and Moore's study (1999) demonstrated that students can generate mental
images for science expository texts. In addition, Long, Winograd, and Bridge's study
(1989) used both narrative and expository texts, and students demonstrated that
mental images were generated both during and after reading using either types of
texts. However, these researchers did not focus on using mental imagery as a strategy
for comprehension. They focused on how students spontaneously generated mental
imagery when they read passages. Long, Winograd, and Bridge suggested that
imagery generated spontaneously may be different in some way from imagery used
purposefully as a metacognitive strategy (p. 367).
After reviewing other prior studies using mental imagery with expository texts
(e.g., Gambrell, Koskinen, & Cole, 1980; Gunston-Parks, 1985; Peters & Levin,
1986; Shriberg, Levin, & McCormick, 1980), I concluded that there was sufficient
evidence to suggest that students could be taught to use mental imagery with science
expository texts if appropriate instructions and guidance were provided.
Middle School Students as Participants
Few studies in the area of mental imagery use middle school students, yet this
group of students bridges primary and secondary levels. Some researchers are in a
college environment, and they prefer college students who are more mature than
25
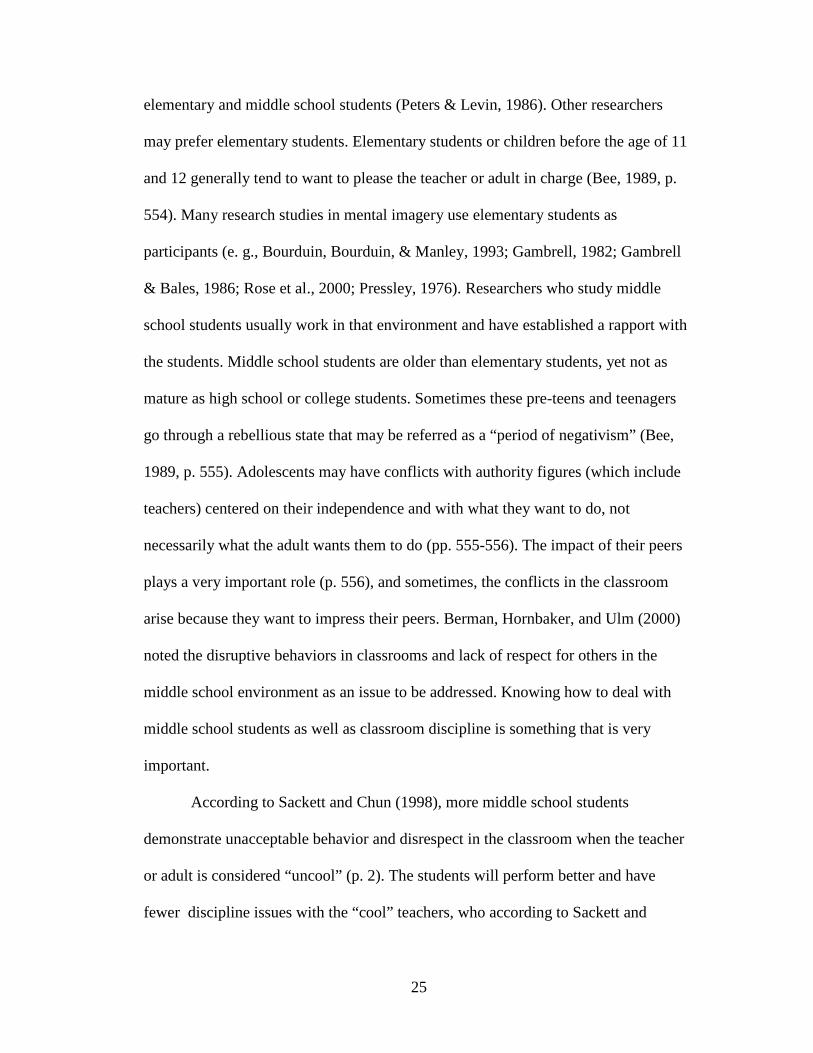
elementary and middle school students (Peters & Levin, 1986). Other researchers
may prefer elementary students. Elementary students or children before the age of 11
and 12 generally tend to want to please the teacher or adult in charge (Bee, 1989, p.
554). Many research studies in mental imagery use elementary students as
participants (e. g., Bourduin, Bourduin, & Manley, 1993; Gambrell, 1982; Gambrell
& Bales, 1986; Rose et al., 2000; Pressley, 1976). Researchers who study middle
school students usually work in that environment and have established a rapport with
the students. Middle school students are older than elementary students, yet not as
mature as high school or college students. Sometimes these pre-teens and teenagers
go through a rebellious state that may be referred as a “period of negativism” (Bee,
1989, p. 555). Adolescents may have conflicts with authority figures (which include
teachers) centered on their independence and with what they want to do, not
necessarily what the adult wants them to do (pp. 555-556). The impact of their peers
plays a very important role (p. 556), and sometimes, the conflicts in the classroom
arise because they want to impress their peers. Berman, Hornbaker, and Ulm (2000)
noted the disruptive behaviors in classrooms and lack of respect for others in the
middle school environment as an issue to be addressed. Knowing how to deal with
middle school students as well as classroom discipline is something that is very
important.
According to Sackett and Chun (1998), more middle school students
demonstrate unacceptable behavior and disrespect in the classroom when the teacher
or adult is considered “uncool” (p. 2). The students will perform better and have
fewer discipline issues with the “cool” teachers, who according to Sackett and
26
Chun's findings through surveys, observations, and interviews, are the ones who have
developed positive relationships with the students and showed that they care (p. 12).
A researcher who does not regularly work with the middle school students needs to
find time to develop relationships with the students as well as some means to
demonstrate caring if he or she wants to conduct a smooth study. Less research is
done in the middle school level even though it is a very critical stage of a student's
development because of these factors. This research used middle school students as
participants since I work in a middle school and have been teaching middle school for
twelve years. This age group of students is special to me.
Middle school students are required to take national and state reading tests;
therefore, useful strategies that will improve their reading scores will be welcomed in
most school systems. Furthermore, it is important that these students embrace
strategies they can use for life-long learning. It is important that the middle school
students grasp these reading strategies before they reach high school, because the
middle school, in most districts, is the last place where there is any formal reading
instruction in a regular classroom. High school students are expected to already know
how to read. If students have not mastered their reading skills in middle school, they
will most likely have a difficult time in high school. Teaching students a
comprehension strategy that works well with expository texts may help them make
gains in reading comprehension and establish a firm reading foundation for future
learning.
27
Adaptability of Mental Imagery Strategies
A strategy that works well in a classroom should be adaptable, since
classrooms may vary in student number, physical set-up, student ability, student
cooperation and various other factors. While some classes could learn in small
learning groups without problems, other classes may be very active and would need
teacher direction at all times. Under certain circumstances, small group instruction
may become a management feat because of students who wanted to do things such as
socializing, establishing influence over others, playing, or even doing nothing instead
of cooperating and learning. In a class with many challenging students, a reading
comprehension strategy that is flexible enough to keep students interested and yet
allow the teacher to maintain control is needed. Mental imagery is flexible enough to
apply to a whole group or small cooperative group.
In one study, Gambrell (1982) used mental imagery for a whole class. In other
studies by Gambrell, Koskinen, and Cole (1980) and Rose et al. (2000), the
researchers used small groups. Evidence suggests that mental imagery is a flexible
and adaptable strategy. The students may be organized as a whole group, paired with
partners, or divided into smaller groups depending on their manageability and group
dynamics.
Mental Imagery for Whole Class Instruction
Mental imagery can work well in a whole class situation because it provides a
framework for the whole class, yet each student will relate in his or her own manner,
calling up images that are based on personal experiences, hence differentiating on the
individual level. At the same time, the teacher does not have to manage several small
28
groups. Mental imagery instruction is useful for all classes, and will work even in
classes with challenging students because behaviors can be monitored while the
students' minds are kept active. For classes in which students are not cooperative, or
in situations when the teacher wants the most direct way to give information, whole
class instruction may be the model. After direct instruction, the teacher may lead
discussions related to mental imagery that students formed. Seidenstricker's study
(1999) pointed out that teacher-led whole class discussion has value because the
teacher can guide the class in a positive direction related to the topic studied. This is
important especially for students who needed more guidance. The teacher can guide
the students toward images that relate to the text and away from unrelated or off-topic
images. McCallum and Moore (1999) argued that unrelated or off-topic images,
which they term “non-constrained” images, inhibit rather than facilitate reading
comprehension.
Mental Imagery with Partners
Working with partners may be another effective way to use mental imagery.
Conversing with another person to discuss ideas and sharing images derived from the
text make the reading task more interesting to many students. Alverman, Dillion, and
O'Brien (1987) and Kelch (2005) have shown that working with a peer may actively
engage students and promote better comprehension.
Mental Imagery for Small Groups
Mental imagery can also work well in small groups because students may be
able to share ideas and images. Rose et al. (2000) organized their students into small
groups for mental imagery training and sharing. In addition, students acted out parts
29
of the stories they read based on their imagery. Rose et al.'s study showed that
students made statistically significant gains in factual understanding of the reading
material. Studies in cooperative groups suggest that students in small groups have a
more positive attitude toward learning when compared with students in whole class
instruction (Johnson, Johnson, Holubec, & Roy, 1984; Slavin, 1983). Small group
instruction also allows for differentiation in instruction (Anderson, 2007; Tomlinson,
2001). The mental imagery instruction presented in this study can be adapted for
small groups so that students may benefit from sharing mental images and discussing
reading text with their peers.
The Ease of Use
Mental imagery is easy to use once the teacher understands the basic concepts
of how to activate students’ imaging processes. The National Reading Panel (2000)
mentioned its ease of use, and how imagery would “actively engage the reader to use
mental processes...” (p. 4-104). Once the teacher has instructed the students, it is very
easy to prompt the students to use mental imagery in most classroom situations. The
mental imagery instruction procedure presented in this paper is user-friendly, and has
incorporated some other popular strategies that work for entire groups such as
metacognition (Pressley, 1999, p. 92), think-along think-aloud (Farr, 1997), and
verbal-visual cue vocabulary (Pressley, 1999, p. 180). These points are further
discussed in later portions of this paper to show the links these strategies have with
mental imagery and how they are integrated into the mental imagery instruction for
students.
30
Furthermore, a single classroom teacher can use this instructional method for
a whole class of 23- 30 students, even if some students are reading below grade level.
There is no need for an assistant. Prompting students to use mental imagery strategies
throughout the year may ensure that the students maintain their skills. Another reason
to choose mental imagery as a comprehension aid for the classroom is that it is so
flexible and versatile. Once the students have been instructed in mental imagery, a
teacher may pick and choose any part of the mental imagery-inducing strategies to
use with students as needed, and the lesson may be tailored to fit the needs of
students, even with classes with some behavior challenges. There are several parts to
the mental imagery instruction. The Method section of this paper explained the
instruction in detail. As a brief overview, these parts include teacher-guided imagery,
self-generated imageries, and self-generated illustrations. The strategies may also be
adjusted for reading comprehension or vocabulary learning.
Cost-Effectiveness of Mental Imagery
While many pre-canned reading intervention programs cost a lot of money,
mental imagery strategy does not cost any extra. Programs such as the READ 180 and
Soar to Success are quite expensive. Another set of materials that included pre-
reading, during reading, and after reading strategies is the 9 Good Habits (Zaner-
Bloser, 2007). The price in 2008 was about $24.99 per copy. For a class set of 25
resource books, that would cost about $625 per classroom. In addition, to effectively
use this set of materials, the teacher would need a Teacher Resource Package costing
$127.99. Yet the book 9 Good Habits is designed as a resource, not a main textbook
or basal because there is not enough material in that book to cover a whole school
31
year. The resource book does not take the place of a basal reader. Another reading
resource book is The Reader's Handbook (Houghton-Mifflin, 2006). In 2008, a soft
cover student book cost $19.95 and a hardcover student book cost $23.75. Such
resource books with strategy instruction may complement the basal textbook, but they
all cost. On the other hand, mental imagery can be used with any material that the
schools already have, eliminating the need to spend extra money.
Versatility of Mental Imagery in the Regular Classroom
Mental imagery strategies are very versatile and may be used in the classroom
in many ways to help students connect with the text and vocabulary.
Mental imagery for improving comprehension. As noted, prior research in the
field has documented gains in reading comprehension when students were instructed
to use metal imagery (e. g., Gambrell & Bales, 1986; Oakhill & Patel, 1991; Pressley,
1976). This study builds upon the insights gained from other studies to provide
sufficient instruction for the students to learn this strategy so they may become better
readers when reading expository texts. In addition to helping students improve
comprehension, mental imagery is also effective for helping students improve
vocabulary.
Mental imagery for improving vocabulary. It is generally accepted by many
researchers that in order for students to read well, they need a wide vocabulary
(National Reading Panel, 2000; Wood, Watson, & Soares, 2006). Yet in order for
students to have a wide range of vocabulary, they need to read more. One problem
that students face when reading expository texts is that many students do not take
time or use strategy to learn new vocabulary. Science terms are particularly difficult
32
for many students. Mental imagery may also be an effective strategy to help students
learn new vocabulary. One such activity is the visual-cue vocabulary cards. For
example, if the teacher finds that the text has a lot of difficult vocabulary, he or she
may elect to use mental imagery to focus on learning certain vocabulary words.
Researchers such as Bean, Valerio, and Stevens (1999), and Tierney and Readence
(2000) have noted the effectiveness of visual-cue cards, or its equivalent-- the LINCS
vocabulary card. In visual-cue vocabulary, students are prompted to create mental
imagery as well as illustration links and written links for the vocabulary words. This
process was explained in detail in the Methodology section of this paper.
This visual-cue vocabulary strategy is even marketed by some SAT prep
books such as Picture These SAT Words by Geer and Geer (2004), Vocabbusters
SAT: Make Vocabulary Fun, Meaningful and Memorable by Howell and Howell
(2004), and Vocabulary Cartoons: Building an Educated Vocabulary with Visual
Mnemonics by Burchers, Burchers, and Burchers, III (1998). The difference between
these vocabulary training books and visual-cue cards made by students in the
classroom is that the SAT prep books provide for students the vocabulary, the visual
image, and the connection as a prepackaged product. All the student has to do is to
memorize them. It is considered easier by many people to learn vocabulary this way
because of the imagery provided. The continued sales and production of these books
show evidence that people are finding them useful, and there is a good market for
these books. The visual-cue vocabulary cards made in the classroom is even better
because there are no extra costs. Furthermore, the students make their own cards and
they find the links that are unique for them based on their own prior knowledge, and
33
they draw the pictures themselves. All these processes activate mental imagery. Prior
research related to imagery and vocabulary learning has shown that activating mental
imagery has helped students recall better (Shriberg, Levin, McCormick, & Pressley,
1982; Zhang & Schumm, 2000).
Peters and Levin (1986), and Hibbing and Rankin-Erickson (2003)
demonstrated that illustrations also helped students understand and remember
expository texts. For example, Peters and Levin used illustrations to cue students
about certain key concepts. For Hibbing and Rankin-Erickson, students were
prompted to draw scenes and stages of what may be happening after reading a portion
of the text or the whole text. Rose et al. (2000) also found that the drawing of scenes
had been useful for elementary students using narrative texts. Based on the evidence
from prior research, drawings are likely to help middle school students as well,
whether they are reading narrative or expository texts. This portion of the imagery
instruction can be used anytime in the classroom when the teacher may find this
strategy useful.
Mental Imagery as a Reading Strategy to Help Students Scoring “Below-average”
The No Child Left Behind Act (2001) has made all public schools accountable
for the students' achievement, requiring these schools to be evaluated by certain
acceptable measures. One such measure is the standardized state reading assessment.
Students in public schools are expected to score successfully on these state
assessment tests. While the most challenged students in special education programs
are allowed to take an alternative test, the majority of the students (including students
with low achievement, students with special education accommodations, and students
34
with limited English proficiency) are not exempt from the standardized assessment. It
is no surprise that some students will end up scoring “below-average” or in the
“Basic” range for the reading assessment. How can teachers help these children
achieve more in reading is a big question, and it is more complex than what one
person or one program can do. Of the many reading strategies that have been
researched and shown to be easily adaptable and successful in a typical classroom,
mental imagery strategies show lots of promise for the students who are scoring
“below-average.” Good readers read well already, and while there are activities the
teachers can do to encourage them to advance even more, it is undoubtedly true that
the teachers need to reach the students who scored “below-average.” Studies by
Gambrell, Koskinen, and Cole (1981), Oakhill & Patel (1991), and Pressley (1976)
showed that induced mental imagery helped all students, but the low-comprehenders
benefitted the most.
Mental Imagery for Improving Students' Attitude toward Reading
Other than reading ability, a reader's attitude often affects his or her
achievement in reading. Cramer' study (1980) using elementary students showed that
a reader's general attitude toward reading was significantly related to comprehension
as well as imagery vividness. Irwin's study (1979) showed essentially similar
findings, except that he used college students. Macomber's study (2001) using middle
school participants indicated that students with more vivid mental images had better
attitudes towards reading. While the main purpose of this study was to investigate the
effects of mental imagery strategies on middle school students reading expository
texts, it was hoped that students might develop better attitudes toward reading after
35
instruction, as some prior studies have shown (Gunston-Parks, 1985; Hibbing &
Rankin-Erickson, 2003). Better attitudes toward reading would hopefully encourage
students to read more and achieve more.
Research Questions
In past research about imagery, there are very few studies that focused on how
to induce imagery for comprehending text in a step-by-step process (Center, Freeman,
Robertson, & Outhred, 1999; Finch, 1982; Gambrell & Bales, 1986; Gambrell,
Kapinus, & Wilson, 1987; Pressley, 1976). Fewer still, are studies that used mental
imagery instruction with expository texts (Gunston-Parks, 1985; Shriberg et al., 1982;
Peters & Levin, 1986). To ensure that students learn how to use mental imagery
strategies, this study used step-by-step processes to guide middle school students to
create mental images.
This study addressed the following main questions:
1. What are the effects of mental imagery strategies on students' reading
comprehension achievement when they read science expository texts?
2. How do the low-, middle-, or high-comprehenders compare in their reading
achievement after mental imagery instruction?
3. Are there relationships between the variables of comprehension achievement,
vividness of mental imagery, motivation to read, and the types of
comprehenders?
4. Is attitude toward reading improved after mental imagery strategies?
36
Summary
The reasons for choosing mental imagery as a comprehension strategy with
expository text in this study can be summarized as follows:
1. Prior research in the field demonstrated that mental imagery may be an
effective reading strategy (Bourduin & Bourduin, 1993; Gambrell & Bales,
1986; Pressley, 1976; Rose, Parks, Androes, & McMahon, 2000). Studies by
Long, Winograd, and Bridge (1989) and McCallum and Moore (1999) showed
that mental images could be created when students read expository texts;
therefore, mental imagery strategies may be useful to middle school students
reading expository texts.
2. Mental imagery is fairly easy to use. As explained in the procedures that
follow in the Methodology portion of this paper (Chapter III), the teacher
guides the students to create mental images. In one of Gambrell's studies
(1986), she asked the students to make pictures in their minds. The result of her
study was positive, and it is an example that demonstrates the ease of prompting
students to use mental imagery strategy.
3. The instructional method encourages students to participate. Mental imagery
is not difficult for most students to do, although some students may not have
memory experiences as vivid as others. However, using this instructional
method, the students have a chance to share their mental images with partners,
small groups, or with the whole class. Sadoski and Paivio (2001) noted that
mental imagery is positively related to engagement and motivation to read.
4. The mental imagery strategy calls for easy classroom management; it can be
37
used with the entire class or small groups, and even with more challenging
classes.
5. There is no need to purchase new text books or materials. The teacher can
continue cueing students to use imaging strategies for any reading task after
students have been instructed.
6. Mental imagery instruction may also be helpful in improving students'
motivation and attitudes toward reading.
Brief Description of the Study
This study used a quasi-experimental pretest-posttest research design. My
coworker and I, certified reading teachers who taught in a mid-Atlantic public middle
school, provided the instruction. Each teacher taught two reading classes and three
Language Arts classes a day. For this study, each teacher randomly assigned one
intact reading class as the experimental group and the other intact reading class as the
comparison group. After some pre-assessments, the experimental group received
mental imagery instruction for two weeks using science expository passages as
reading materials. The comparison group used the same reading materials without
mental imagery instruction. After the two week period, all students took the reading
post-assessments. Students of the comparison group then received mental imagery
instruction. (Details are included in Appendix G, in the Auxiliary Instruction section.)
After instruction, students in all the participating classes were cued to use mental
imagery at least two to three times a week. At the end of the school year, sequential
sampling was used with all classes to investigate any sustained effects for the
38
experimental group and to measure any possible gains for the comparison group since
this group of students also received mental imagery instruction.
Definition of Terms
The following definitions are pertinent to this investigation:
Combination instruction-- training method that combines the various mental imagery
instructional techniques, both representational and transformational aspects,
so that whatever constrained image comes to the readers' mind, they will be
able to relate to the text.
Comprehension-- the understanding of text and the ability to extend and have
personal interactions with the text (Anderson & Pearson, 1984).
Constrained imagery-- mental imagery that is limited or consistent with the text that is
read (McCallum & Moore, 1999).
Expository text-- written text that gives information and explanations, often
employing various text structures such as definition, analysis, comparison and
contrast, cause and effect, persuasion and argument (VanderMey et al., 2007).
Although graphs, charts, lists, and various other textual aids are generally
considered expository in nature, those were not considered in this study.
Imagens-- mental images that involve any of the senses, activating nonverbal
processes of the brain (Sadoski & Paivio, 2001).
Induced mental imagery-- mental imagery that formed as a result of some purposeful
strategy, cues, or prompts (Gambrell, 1982).
39
Learning strategy-- a learning strategy is “in education, a systematic plan, consciously
adapted and monitored, to improve one's performance in learning” (Harris &
Hodges, 1995, p. 244).
Logogens-- the graphic representations such as words, numbers, or icons, activating
the verbal processes of the brain (Sadoski & Paivio, 2001).
Mental imagery-- Mental imagery refers to any image created in the mind without the
presence of the real object or event, including the images of sight, sound,
taste, touch, smell, sensations, and feelings. Sadoski and Paivio (2001)
explained mental imagery as the sensations and memories that people use to
remember things and experiences. Long et al. (1989) claimed that mental
imagery includes memories of sights, sounds, tastes, touch, smells, feelings,
events, and stories that may be replayed in the mind.
Narrative text-- written text that tells a story or relates a series of events (Weaver &
Kintsch, 1984).
Non-constrained imagery-- mental imagery that is not limited to the ideas of the
texts, and may be off target (McCallum & Moore, 1999).
Representational instruction-- instruction method that prompts the students to
generate sensory images to link with the text, using images that represent the
idea on the printed text. It is the “fairly direct translation of the text into an
image” Oakhill & Patel, 1992, p. 108). For example, the term “buttery
popcorn” may invoke the following representational images: yellow puffy
kernels (sight) with a delicious aroma (smell), crunchy noise and feel when
one bites a popcorn kernel (hearing and feeling), plus a salty and buttery taste
40
in the mouth (taste). The popcorn may also invoke the feeling of fullness in
the stomach (gustatory), or a general sense of happiness (emotional). Some
people may recall the sensations of eating popcorn while watching a movie
(event).
Think-aloud Think-along-- the ideas that come to a reader's mind when interacting
with the text. In this study, think-along ideas are preferred because students
may write them down for sharing later rather than everyone talking out loud.
These ideas may be questions, summaries, reactions, connections,
clarifications, or predictions.
Transformational instruction-- instructional method that prompts the students to use
other linking mechanisms to help them understand the text or words from the
text. This includes any mnemonic, keyword, hook, latch, or linking device that
helps a person understand a vocabulary term, a date, a detail, a name, or an
event (Peters & Levin, 1986). For example, to get the idea that explosive
volcanic eruptions can be associated with soda shaken in the bottle, some
students may link “magma” to “soda,” and the idea of the magma from inside
the earth will become gaseous and pop out during an eruption will be similar
to the soda that will fizz and pop out of a shaken bottle. Mnemonic devices
may be used if it is helpful.
41
CHAPTER II
REVIEW OT THE LITERATURE
Overview
This chapter begins with the historic use of mental imagery, continuing with
reviews of the basic theories of mental imagery and contemporary experimental use
of mental imagery. Then the chapter presents various studies in mental imagery,
mental imagery instructional strategies in the past, and ends with an explanation of
how this study may extend previous research efforts in the field.
Historic Use of Mental Imagery
The use of mental imagery dates far back in human history. The ancient
Greeks have been known to use mental imagery to aid memory (Pressley, 1976). The
ancient method of Loci was attributed to Simonides of Keos (556 BCE). This “loci”
method focused on using memory “hooks” or mnemonic devices to help people recall
the sequence of events. Another Greek philosopher, Aristotle (384-322 BCE), gave
imagery a prominent place in his teaching, and even claimed that thought never
occurred without a mental image (Sadoski & Paivio, 2001, p. 15). The Roman
teacher and rhetorician, Quintilian (30-96 A.D.), taught his students to remember key
objects as reminders for them to address certain issues. For example, an anchor would
remind them to speak about matters of the navy, and a spear would remind them to
address military operations (Sadoski & Paivio, 2001, p. 13).
Basic Theories of Mental Imagery
While the method was used in the ancient days, few reasons were given as to
why the strategy was employed. Recent theories in mental imagery that attempted to
explain what it is and how it works started in the fields of philosophy and psychology.
42
Theorists who studied mental imagery agree that thought processes may be
nonverbal, and that verbal stimuli may activate the nonverbal processes, and vice
versa (Paivio, 1986; Sadoski & Paivio, 2001; Sadoski & Quast, 1990). Vygotsky
(1962) claimed that “thought and speech have different roots... At a certain point
these lines meet, whereupon thought becomes verbal and speech rational” (p. 44). He
also mentioned that sensory material and words join together for concept formation
(p. 52).
Other researchers link mental imagery to schema theory (Anderson &
Pearson, 1984; Rumelhart, 1975). According to Rumelhart, schema theory is about
knowledge (1980, p. 3). He stated that schema is data structure for representing the
generic concepts stored in memory. There are schemata representing all concepts.
These include objects, situations, events, and actions. Rumelhart claimed that human
knowledge consists of schemata based on the procedures used to interpret events. As
people meet new conditions, they will constantly create new schemata based on the
existing knowledge (Rumelhart & Norman, 1983). Rumelhart also explained that the
human brain processes information using parallel computational devices which are
different than that of a traditional computer (Rumelhart, Widrow, & Lehr, 1994).
Using schema is how a person links new experiences to past experiences. In relation
to reading, a reader links new information that is read to past experiences to make
sense of it. Anderson and Pearson (1984) discussed schemata as the reader's
knowledge already stored in memory, functioning in the process of interpreting new
information and allowing the new information to be part of the combined knowledge.
The “interaction of new information and old knowledge” is what is termed as
43
“comprehension” (Anderson & Pearson, 1984, p. 225). Schema may be stored as
verbal information or nonverbal information. Researchers in the field of mental
imagery may find overlapping concepts with the schema theory. To be more explicit
about the understanding of mental imagery, which is nonverbal in nature, Paivio and
Sadoski's Dual Coding Theory can explicate its nature and process.
Paivio has been studying the connections of words, imagery, and memory
codes since the 1960s. Throughout these studies, he noted that when words are
interpreted, they are in turn processed through memory organization, generating
retrieval of information and mental imagery. The relations are complex, and
interdependent upon many factors such as the individual's memory organization or
memory capacity. Even imagery itself is dependent upon the attributes of words, such
as their frequency of usage, their meaningfulness, and their concreteness (Paivio,
1983). In 1986, Paivio studied the use of mnemonic techniques to help participants
recall symbolic modes and their sensorimotor counterparts. His study prompted him
to formulate the basis of the Dual Coding Theory. He theorized that verbal and
nonverbal stimuli may operate independently, parallel, or connected to each other. He
later conducted many other studies, some in conjunction with other researchers
(Paivio & Clark, 1988; Paivio, Clark, & Lambert, 1988).
In 2001, Sadoski and Paivio published a book titled Imagery and Text, which
further clarified how the dual-coding works. They explained that people receive two
types of stimuli: verbal stimuli (logogens) and nonverbal stimuli (imagens). Examples
of logogens or verbal stimuli include words that people hear or read. Examples of
imagens or nonverbal stimuli may include a setting, smells, music, noises, and
44
various other sensory input, including feelings of happiness or anger. These logogens
and imagens may operate independently, parallel, or connected to each other. Sadoski
and Paivio further explain that the imagens enhance comprehension of verbal stimuli
(p. 53). When people read texts, the verbal stimuli may be processed as such and
understood, or the verbal stimuli may activate other stimuli (verbal and nonverbal),
which in turn give the readers sensory experiences. Furthermore, sensory experiences
may activate other verbal stimuli and build a deeper experience and understanding.
Sadoski and Paivio (2001) theorized that the activation of sensory experiences helps
people make sense of the text, relate to the text, and remember the text.
The most popular idea about mental imagery is that it is the ability to create
pictures in the mind's eye, a form of mental representation with visual properties
(Macomber, 2001, p. 3). Some readers can invoke a series of images while reading
novels that their reading experience may be more entertaining than a movie.
However, mental imagery is not limited to just the visual sense. Sadoski and Paivio
(2001) stated that mental imagery is comprised of representations that refer to internal
forms of information used in memory (p. 43). Therefore, the sensations and
memories one gets from reading or listening in the absence of the real experience or
any gross motor movements that pertain to sight, touch, taste, hearing, smell, even
gustatory sensations and the sense of being may be categorized as mental imageries
(Sheehan, 1972). Several studies point to the relationship between mental imagery
and affect in text appreciation (Long, Winograd, & Bridge, 1989; Macomber, 2001;
Sadoski & Quast, 1990). When students experience mental imagery, they tend to find
the text more interesting, more comprehensible, and more memorable (Sadoski &
45
Paivio, 2001, p. 184). Furthermore, imagery makes the text come to life in the
imagination of readers, providing a medium for reader-text transactions (Macomber,
2001, p. 3).
Induced imagery may be perceived as a "means of enhancing comprehension"
(Tierney & Readence, 2000, p. 362). The study by McCallum & Moore (1999)
revealed that mental imagery is not a precondition for understanding written text;
however, many good readers report that they employ mental imagery while reading.
Studies by Bourduin and Bourduin (1993), Gambrell and Bales (1986), Pressley
(1976), and Rose, Parks, Androes, and McMahon (2000) showed that students who
employed mental imagery as a reading strategy performed better on reading
assessments than those students who did not. These studies suggest that using mental
imagery in reading comprehension may assist the reader in comprehending text,
interacting with text, and remembering text.
Early Experimental Use of Mental Imagery
Early experimental use of mental imagery can be traced back to Sir Francis
Galton in 1893, who created the first questionnaire regarding images (Holt, 1964). In
this measure of individual imaging differences, Galton attempted to measure an
individual's imaging ability by asking people to describe what they had for breakfast.
Later, another researcher, Betts (1909), studied the frequency and clarity of the
occurrences of seven sensory modalities (vision, auditory, olfactory, touch, gustatory
or taste, sense of movement or action, and sense of feel). He came to the conclusion
that most participants imaged more than they recognized; however, it is possible to
think without imaging.
46
In the 1960s, Paivio did extensive studies with imagery. He worked with young
children and picture-word pairs, and he found that picture-word pairs promoted more
recall and imagery than picture-picture pairs. He suggested that while pictures
facilitate associative learning stimuli, they hindered the verbal response of the four- to
six-year-olds (Paivio & Yarmey, 1966). He also noted that participants performed
better with imaging and recall when he used concrete nouns as opposed to abstract
nouns (Dilley & Paivio, 1968). In another study, Paivio and Csapo (1969) found that
memory for sequential order was poorer for pictures than for words, but pictures were
superior to words in non-sequential tasks.
Contemporary Experimental Use of Mental Imagery
Despite the amount of research in the field, all of which are enlightening,
mental imagery has not been studied extensively as a reading strategy, nor has it
received much attention as such. However, mental imagery is listed as one of the
useful comprehension strategies by many experts (Mowey & Conahan, 1995;
National Reading Panel, 2000; Pearson, 1984; Tierney & Readence 2000).
Research reviews on mental imagery as a reading strategy, in general, has not
attributed great success to its use. In one study, Alverman and Moore (1986)
investigated and reported research studies in secondary school reading practices.
Among these varied reading practices for improving comprehension, they included
the use of mental imagery. Their report on the mental imagery strategy is not all that
positive. Out of the seven experimental studies on mental imagery that they reviewed
(Anderson & Kulhavy, 1972; Cramer, 1982; Gunston-Parks, 1985; Peters & Levin,
1986; Rasco et al, 1975; Weinstein, 1982; and Warner, 1977), only two were reported
47
to have brought forth some positive gain (Peters & Levin, 1986; Weinstein, 1977).
However, the report did not do full justice to all the studies. For example, Cramer's
study (1981) was not designed to use mental imagery as treatment; it was designed to
understand the relationships between mental imagery, attitudes, and learning. The
study by Weinstein (1982), though reported as bringing positive gains in
comprehension, was not a study for mental imagery but for training students to use
elaboration learning strategies. The students were taught to use elaboration to enhance
learning, and while students elaborated and retold, they might have drawn upon
imagery. However, the study did not specifically teach students to use mental imagery
as a technique; therefore, it should not even be included in the category of using
mental imagery as a strategy.
In another instance, Alverman and Moore (1986) rated the outcome for Rasco,
Tennyson, and Boutwell's study (1973) to be negative. However, that is not all true.
Rasco et al. investigated the use of mental imagery instructions and drawings in
enhancing verbal learning on three populations: college, high school, and fourth- and
fifth-graders. Although the study reported no gains for the high school experimental
group, there was a statistically significant main effect for the college experimental
group that used the imagery instructional strategy. The college group showed no
significant effects on the use of drawings though. For the elementary experimental
group, using either the imagery strategy or the drawings significantly improved the
posttest comprehension performance.
Alverman and Moore’s study (1991) was insightful in mentioning that the
seven mental imagery studies they investigated did not use materials that were part of
48
regular classroom instruction. A more careful observation showed that of these seven
studies, only two studies provided students with instruction on how to use mental
imagery. In one study, Warner (1977) provided 30 minutes on visual imagery
instruction for students with learning disability. His study did not indicate that there
was any comprehension gain for the students. The other study in Alverman and
Moore’s report that provided students with instruction on how to use mental imagery
was the study by Peters and Levin (1986). They provided the students with
instructions on how to create images with the text as well as pneumonic devices for
recall. That study reported positive gains for students.
The National Reading Panel (2000) also reviewed several experimental studies
in mental imagery (Bourduin, Bourduin, & Manley, 1994; Gambrell & Bales, 1986;
Peters & Levin, 1986; Pressley, 1976; Shriberg, Levin, McCormick, & Pressley,
1982). The Panel did not give a strong report to recommend its use except a statement
that claims “the main effect of imagery is to increase memory for the sentence
imagined” (p, 4-77). Some of these studies were explored more fully in the following
sections.
This study reports 27 contemporary studies using mental imagery to enhance
students' reading comprehension in some manner. Of these studies, the school levels
of the participants vary. Fourteen of the studies had elementary participants, 7 studies
had middle school participants, 3 studies had high school participants, and 5 had
college participants. One study, Rasco et al. (1975) used three different groups of
participants (college, high school, and elementary), and is counted repeatedly for each
group of students. Examination of these studies showed a different scenario from
49
Alverman and Moore’s report: twenty-two of these studies reported some form of
positive result, whether the gain is in one aspect of reading comprehension or the
affective domain. Only four showed no positive results at all. In these studies, the
type of text used also vary: 16 studies used narrative texts, 7 used expository texts, 3
used both types of texts, and 1 study used sentences only. It is interesting to note that
the amount of mental imagery strategy instruction also varies: 14 studies provided no
instruction at all while 13 provided students with some sort of instruction. Within the
studies that gave students instruction on how to use mental imagery with their reading
task, the amount of time spent on instruction varies from several minutes to 30
minutes per week for six sessions. The following sections discussed the two
divisions—experimental studies that provided no instruction, and the studies that
gave students instructions on how to use some form of mental imagery.
Experimental Studies in Mental Imagery as a Comprehension
Strategy with No Instruction
It is fascinating to note that many of the studies using mental imagery as a
comprehension strategy really did not give participants any instruction on how to
create mental images that may enhance the text they are reading. For most of these
studies, the researchers simply told the participants to create mental images during
reading. Some of these studies in metal imagery with no instruction did not report any
positive gains.
Studies with No Instruction and No Reported Gains
An example of a study that investigated whether mental imagery facilitates
learning from prose reading without focusing on mental imagery instruction is the
50
study by Anderson and Kulhavy (1972). They investigated the effects of prompting
students to engage in mental imagery while these students read a 200-word textbook
(Social Studies type) expository passage. The 62 high school seniors were randomly
assigned to be in the experimental group or comparison group. The experimental
group received no instruction in how to form mental images. They were just told to
form vivid pictures of everything described in the booklet. The comparison group was
asked to read carefully. The results showed that there was no statistical difference
between the learning of the two groups. On a post-experiment questionnaire, more
than half of the students in the comparison group claimed they used imagery even
though they did not receive any prompts to do so, while about a third of the
experimental group did not use any imagery. There is also a relationship between the
amount of learning and the amount of time during which imagery was reported as
being used. Since the researchers did not give any instruction on how to create mental
imagery, it is not surprising that a third of the students in the experimental group did
not engage in mental imagery. Nor is it surprising that there is no evidence of better
learning. Why do half the students in the comparison group report that they used
imagery? Is it because it is natural for them to do so? Are many of these students
already proficient readers with many strategies? The study does not explain, but it
does offer some interesting things to consider when using mental imagery as a
strategy for comprehension in the future.
Another study in mental imagery that Alverman and Moore (1991) reported
on was Cramer's study (1982). Cramer's purpose was to better understand the
relationship between mental imagery, attitude towards reading, and higher reading
51
achievement; therefore, not having an instructional method is not a deficit of his
study.
Cramer used 30 eleventh-grade students as participants to determine whether
students who reported higher degrees of mental imagery would score better on a
reading comprehension test and also have a more positive attitude towards reading
when compared to students who had lower mental imagery scores. The students all
took the Estes Reading Attitude Scale. Three days later, the students read two prose
passages, one of a high image-evoking nature, and the other of a low image-evoking
nature. Students then took a short answer test and a modified cloze test. A visual-
recall task was also given, following a brief questionnaire in which the students had
to reveal whether or not they used imagery, how much imagery, which passage was
easier, and whether or not they liked to read. The results indicated that students who
claimed they used lots of imagery scored best on comprehension, and also had the
best attitude towards reading. The students who reported the least imagery also
performed the worst on reading comprehension, yet surprisingly, the moderate
imagers had the lowest mean score on the attitude test. Cramer suggested that the
study supported the idea that imagery is related to comprehension as well as attitude.
Although Alverman and Moore's critique about Cramer’s research as not
providing instruction is unjustified (since it is not a treatment design), their other
comments about the experiment being contrived, carried on by the experimenter and
not the classroom teacher, and that the testing and reading materials are designed just
for the study, and hence not part of a normal classroom routine are true. Another
limitation to Cramer’s study is the relatively small sample size pertaining to high
52
school seniors, so it may not be representative of other situations; however, his study
did give others more understanding about the relationships between imagery, reading
achievement, and attitudes.
Yet another study without imagery instruction is Gunston-Parks' study (1985).
She investigated how mental imagery audio prompting may improve the reading
comprehension of low readers using science-type texts. She termed it “text-bound
guided imagery,” and defined it as “a guided imagery procedure which provides little
to no elaboration of the text passage beyond reorganization and condensation of the
material” (p.36). Gunston-Parks used 160 students (grades 7, 8, and 9 from two
middle schools) who are considered low readers, as indicated by them scoring at or
below the fourth Stanine on the IOWA test. She randomly divided the students into
four groups. Group one received a science text for reading followed by the text-bound
guided imagery, group two only listened to the text-bound guided imagery, group
three only read the text, and group four is the comparison and received no treatment.
Students then took a ten-item test measuring knowledge of the passage content. The
students who listened to the text-bound guided imagery really did not receive any
other instruction such as how to create imagery in their minds as they listen to the
audio tape. The results did not show there is any significant difference in
comprehension achievement between the groups; however, the researcher did find a
statistically significant main effect of imagery ability on the comprehension of
expository science-type texts. Her study supported the idea that students can create
imagery while using expository science-type texts. Gunston-Parks suggested that
more could be done with the instruction of the students. She also concluded that the
53
students who are low readers and have low imaging ability are at a deficit, and more
research is needed to help these students.
Another study that was designed to investigate the effects of two
comprehension strategies, text-relevant illustrations and mental imagery, on the
reading comprehension recall of adult learners in a teacher college showed no
statistical differences between the scores of the experimental and comparison groups.
Walker, Truscott, Gambrell, and Almasi (1994) engaged 78 university students in a
study in which participants were asked to read and respond to an African folk tale.
The participants were randomly assigned to four groups: (a) students used illustrated
text and were asked to attend to the illustrations and form mental images, (b) students
used non-illustrated text and were told to use mental imagery only, (c) students used
illustrated text and were given general instructions to remember, and (d) students
were given non-illustrated text and were given general instructions to remember. The
researchers asked the participants to recall and answer questions about the story one
week later. Walker and her colleagues found no statistical difference in recall
performance between the groups; however, they presented some interesting insight. In
an interview after the experiment, 95% of the participants claimed that they were
using mental imagery while reading, whether they were cued to do so or not. These
participants were, after all, university students in a teacher preparatory program who
probably had many reading strategies that they might call upon. The reading passage
was a narrative text about Anansi the Spider, which also followed a typical story-
telling schema that might not be difficult to these college students.
54
Studies with No Instruction and Positive Gains
Several studies in mental imagery fit in this category. In some instances,
simply prompting the students to create mental images was sufficient for them to
make some type of gain-- whether it is in literal comprehension or motivation towards
reading. The following section described the studies that fall in this category.
A researcher who did several studies using mental imagery is Linda Gambrell.
In one of the earlier models, Gambrell, Koskinen, and Cole (1980) used 63 sixth-
grade students and two expository passages, “Blue Swamp,” or “Pine Folks.” These
passages were classified as expository (Social Studies type), and they relate to the
description of a special place and the people who lived there. The students were
randomly assigned to two conditions-- listen first and then read, or read first and then
listen. For instruction, she mainly told all the students to make pictures in their minds
to help them remember. Student were interviewed later about whether they were able
to create imagery or not, and they had to retell the information they heard or read. The
results show that there was no difference between the creating of imagery whether
they read or listened, and that the good readers responded to the prompt of creating
pictures more than the low readers. Some poor readers (17%) claimed that they could
not create any imagery even while listening, whereas only very few (3%) of the above
level readers claimed they could not create a mental image. The study supported the
finding that poor readers suffer from specific comprehension difficulties not related to
decoding. The researchers also suggested that they look into methodology when
trying to induce mental imagery.
55
Another study that only prompted students to form pictures in their heads is
the study by Finch (1982). Eighty fifth-grade students from six schools participated in
this study, either in the experimental or comparison group. The experimental students
were prompted to form pictures in their heads as a way to remember what they have
read. Those in the comparison group were simply told to remember what they have
read. Students read two stories each-- one familiar text and one unfamiliar text.
Results indicated significant differences between the two groups in the cued recall
test only, not on the free recall test. In a post-evaluative questionnaire, 90% of the
above readers in the study reported that they used mental imagery during reading and
65% of the below average students reported that they used mental imagery. Students
also scored better when they use familiar as opposed to unfamiliar text. Finch
proposed more extensive instruction in the use of mental imagery.
After examining the above mentioned studies, it is clear that some definite
instructional program should be used to help students learn how to create mental
images. It cannot be assumed that just telling the students once will be sufficient to
bring on mental images when students read. Furthermore, without instruction, some
students may not know what to image. McCallum and Moore (1999) reported that
sometimes students generate random spurious images not related to the text which
may hinder rather than help comprehension. Students need to be guided toward
strategies that help create images related to what they read. This study was designed
based on the premise that students needed strategies that would keep generated
mental images in sync with the text.
56
Experimental Studies in Mental Imagery with Instruction
Many of the studies that included mental imagery instruction showed positive
effects on reading comprehension. Some of these studies used sentences as training
materials, or very short passages containing three sentences each (Peters & Levin,
1986; Shriberg et al., 1982). As a result, the National Reading Panel has concluded
that mental imagery is effective with sentence recall and sentence comprehension.
This conclusion, while valid, did not give credit to mental imagery being useful for
longer passages. The studies that employed instructional methods were discussed in
the section under the various instructional models. This study combined the best
practices in imagery instruction to use with middle school students and science-type
expository text, which is usually challenging for the average middle school student.
Of the many studies reviewed that used middle school students reading science texts,
there is only one study (Warner, 1977) that provided some instruction for the
students, yet there was no reported gain. Warner’s study was briefly described in the
next section.
A Mental Imagery Study with Instruction and No Statistically Significant Gains
In 1977, Michael Warner investigated whether instructing junior high students
with learning disability in the use of visual imagery would result in improved recall in
prose passage content. His definition of students with learning disability are those
already in remedial reading or intervention programs, who are reading at least a year
below grade placement, yet not functioning below the third-grade level. He had 30
participants from five different schools. These students range from seventh to ninth-
grade, with the average age being 14 years old.
57
Warner's study used science and social studies type expository texts from a
series titled Reading for Concepts published by Liddle, 1970. The passages were
about 160-200 words long, and used controlled vocabulary that ranged from 2.9 to 4.3
reading level. Warner used parochial students in regular education classes to rate the
passages that he would use for pretest, instruction, and posttest. The students rated
passages sentence by sentence, deciding whether or not each sentence helped them
effectively create a visual image using a scale from one to four. Warner used the
averages to classify the passages into high imagery or low imagery passages, and he
included one of each type for the pretest and posttests. High imagery passages rated
around 3.2, and low imagery passages rated around 2.3.
After a paraphrase recall pretest, Warner instructed the students by giving
them five concepts and having them practice creating visual images line by line. The
five concepts are as follows: (1) Making a picture in your head can help one better
remember what one has read. (2) Images should represent as much of the content as
possible. (3) Sentences vary in the difficulty associated with making images for them.
(4) Use sentence boundaries as cues for imagery. (5) Images can be used to link
sentences together.
The study took three sessions. The first session was mainly for the pretest.
Warner gave participants a pair-association test to determine whether they are in high,
medium, or low pair-associate groups. Then he gave the students a paraphrase recall
pretest. The second session was instruction, which took about 30 minutes. The third
session, which took place ten days later, was for the posttest.
58
From his study, Warner noticed that the type of text made a difference. He
found statistical evidence that students recall better on high imagery passages than on
low imagery passages. Students who were in the high pair-associate group also had
slightly higher scores when compared to the other students although there was no
statistical significance. His conclusion suggested that he may need more time with
these students with learning disabilities-- instructing them once may be too little.
Warner's study, though did not show any gains, provided insight and guidance for
future researchers in the field. Some ideas to note include providing students with
interesting text that could yield imagery, and to provide more instruction to ensure
that students can use this imagery strategy. Warner also targeted visual imagery alone.
It is possible that students may invoke more images if they were prompted to create
mental images that included all the senses, such as touch, taste, smell, and feel.
Warner used pair-association as an indicator of whether or not students were good
with creating imagery; however, that process does not necessarily measure the ability
to create mental imagery. Students might use rote memory, they might use verbal
clues, or they might use other strategies to remember rather than use mental imagery.
Background of Mental Imagery Instructional Techniques
Past studies show that researchers have used various mental imagery methods.
These methods can be divided into two main types: representation instruction and
transformational instruction. Representational imagery is the direct translation of the
text into an image. Transformational imagery is the use of mnemonic device,
keyword, or other indirect link to represent the text (Oakhill & Patel, 1991).
59
Representational Imagery Instruction
Some researchers use representational imagery in a pure mental sense. For
example, Gambrell (1982) used first- and third-grade students to study the effects of
induced mental imagery and reading comprehension. She randomly divided 58
students into experimental or comparison groups and informed all participants that
they were to read a story about a “monfur.” In the experimental group, she gave the
students these instructions: “make pictures in your head about what you read to help
you remember...” The comparison group had instruction such as “think about what
you read to help you remember” (p. 132). The results indicated that the students who
were prompted to use mental imagery performed significantly better than the
comparison group in factual recall and predictions based on statistical analysis.
In another study, Gambrell and Bales (1986) studied imagery and
comprehension-monitoring in fourth and fifth graders. The researchers developed
three high imagery sentences, two high imagery paragraphs, and four expository
passages for training and testing. The 30-minute instructional session for the
experimental group involved acquainting students to making mental pictures and
guiding students to make images with the full details, such as the kind of car and the
type of road it was on. Students were reminded to “make pictures in your mind” (p.
458). The students in the comparison group were told to do whatever they can to
understand and remember. The results show that the use of mental imagery is
positively associated with comprehension-monitoring performance.
A study by Rose, Cundick, and Higbee (1983) investigated the effectiveness of
two separate strategies-- verbal rehearsal, and visual imagery. They used 30 students
60
with learning disabilities from 10 elementary schools, the average age being 9.7. The
children were randomly assigned to one of three groups: a verbal rehearsal group, a
mental imagery group, and a comparison group. The instruction or reading
assignment was done in one session, although the students were tested twice-- once
immediately after reading and once after one week. The instructional materials were
narrative in nature, about five paragraphs long, and had no pictures. The examiner
demonstrated to both treatment groups how to verbally rehearse or form a mental
image. Students in the verbal rehearsal group talked about what they read at certain
stopping points. Students in the mental imagery group formed mental images at
certain stopping points in the story. The comparison group students had “unaided”
practice.
The results of Rose, Cundick, and Higbee's study indicated that both the verbal
rehearsal group and mental imagery group outperformed the comparison group. They
concluded that students with learning disabilities could benefit from these strategies.
Another study that uses representational mental imagery instruction is the
study by Bourduin, Bourduin, and Manning (1993). In fact, these researchers used
both visual and verbal representations. These researchers investigated the
effectiveness of mental imagery instruction for young children in second grade.
Twenty-eight students from four different classrooms participated in the study which
took 30 minutes of instruction over six weeks, totaling six sessions. One group had
imagery instruction which included visual and verbal representations, two groups had
corrective feedback from different teachers, and the last group was the comparison
group with another teacher. The students took a comprehension test after the
61
instruction, and then they took another test again as a follow-up after six weeks. The
findings indicated that students in the imagery instruction group outperformed all the
other groups by follow-up time in the inference portion of the comprehension test.
There was also a marginal significance (p <.07) in this group outperforming all the
other groups in the details portion of the comprehension test. It is not clear what these
students initial performance was like, but it is apparent that the study showed that
mental imagery is a useful comprehension strategy for young children in second
grade.
Other than visual representations and verbal representations, researchers such
as Douville and Algozzine (2004) discussed using all the sensory modalities in a
method they call SAM, which stands for Sensory Activated Model. They suggest the
activation of all sensory modalities, including auditory, kinesthetic, gustatory, and
olfactory because that process of sensory activation was more elaborated and
therefore more memorable for students. In a prior study by Douville (1998), she noted
that fifth grade students who used the SAM method constructed significantly more
images in written responses to reading that reflected both literal and applied text
knowledge than those students who only used the visual imagery method.
Another study that used representational imagery is the study by Clark,
Deshler, Schumaker, Alley, and Warner (1984). They used six students in special
education (one 8th grade, four 9th grade, one 11th grade) in their study. They gave the
students seven pretests and then instruction using visual and verbal representations.
First the students established their baseline through the pretests. For example, Student
1 took the tests and the results showed that the pretest for ability-level reading
62
comprehension without prompt for mental imagery was 23%, and the pretest for
grade-level reading comprehension without prompt for mental imagery was 50%. The
pretest for ability-level reading comprehension with prompt for mental imagery was
28% and the pretest for grade-level reading comprehension with prompt for mental
imagery was 33%. The students then were instructed in mental imagery following
procedures that showed them five steps. The steps were as follows:
One: Read the first sentence.
Two: Try to make an image-- a picture in your mind
Three: Describe your image (with more guided details)
Four: Evaluate your image for completeness (with more details)
Five: Repeat. Read the next sentence and repeat the steps.
During the seven instructional sessions (about a class period of 45 minutes
long each), students practiced on ability-level materials and then grade-level
materials. Then they took the posttest on the four conditions again-- using ability-
level materials, without prompt, and then with prompt, and then grade-level materials
with prompt and then without prompt. It was not mentioned whether these passages
were narrative or expository in nature. Results show that there were gains after mental
imagery instruction. What is perplexing is that the student who was in the 9th grade
but read on a 5th grade level scored higher on grade-level materials than ability-level
materials. For the posttest, using ability-level materials, Student 1 scored 63%
without prompt and 72% with prompt; using grade-level materials, Student 1 scored
78% without prompt and 100% with prompt. Detailed statistics for other students
were not shared.
63
While the instructional method is viable, it is unusual that a low-achieving
student would perform better on grade-level materials rather than ability-level. The
researchers reported that they used passages from a book titled 66 Passages to
Develop Reading Comprehension by Gilmore, Sack, and Yourman. An analysis into
the text and topics for fifth-grade level material and ninth-grade material may provide
more information. Could it be that some passages were expository and others
narrative? It may be easier for some high school students to identify with narrative
writing about a young person training for a boxing match written on ninth-grade
level, as opposed to reading about the formation of the Mariana Trench written on
fifth-grade level. There was no discussion of the types or topics of passages the
students were using. Aside from the materials used, the researchers also claimed that
their student sample was very small, and that they recommend replication with a
larger sampling with alternative procedures. However, the study did show that mental
imagery worked for that group of special education students, and that the study used
representational instruction alone for the mental imagery portion.
The strength of the pure mental imagery instructional method is that it
requires no additional text preparation or illustrations. It is relatively easy to do and
can be done in a short instructional period. The drawback is that some students may
need imagery techniques that are more concrete, such as illustrations.
Researchers in the field used illustrations as a method to form representational
mental imagery. After showing students pictures about the passages, the researchers
may then guide students to create their own pictures either by drawing, making an
image in the head, or even acting it out. In his 1976 study with eight-year old
64
students, Pressley first showed the students in the experimental group pictures that
went along with certain sentences. Then he prompted these students to make mental
images using a booklet that consisted of alternating text and blank pages. Students in
the comparison group were told to do whatever they could to remember. Results
indicated that students who had mental imagery instruction had statistically
significant higher comprehension scores than the students in the comparison group
although the differences between the scores were relatively small. Pressley (1976)
speculated the idea that since the students in the comparison group were told to do
whatever they could, some students might be imagining anyway (p. 358). Using
factor interaction analysis, Pressley concluded that poor readers benefit from learning
mental imagery strategy more than good readers.
Pressley's (1976) method using illustrations has been modified and used in
various other studies (Peters & Levin, 1986; Shriberg et al., 1982; Rose et al., 2000);
however, no other study used the method of using text pages with blank pages. There
may be many reasons why although these are just conjectures. The preparation of
these special texts with blank pages may require extra work. Also, each participant
had to take the test individually, so the whole process would take a long time. There
may also be a concern that some students may not be able to project their images on
the blank pages.
In a different study, Rose, Parks, Androes, and McMahon (2000) used a drama-
based imagery method to help fourth-grade students improve reading comprehension.
The 20-day program spanned over 10 weeks. At different stages, leaders or trainers
guided the students in the experimental group to read stories, to visualize what they
65
read in their heads, to illustrate scenes, to discuss sensory details, and to dramatize
self-selected episodes. The students in the comparison group received the standard
reading curriculum, which emphasized the “read-and drill” exercises. The results
indicated that the higher scores of the experimental group for factual comprehension
were statistically significant. However, the scores for inference questions did not
reach statistical significance. There was also no statistical significance between
groups for verbal scores. The researchers discussed the idea that their method was
open to refinement, and that through interviews with the trainers, they found out that
some classrooms did not finish the final stages, which were linked to inferential
skills.
The strength of the multi-sensory drama method is the various techniques
students can employ. The difficulty in the instruction lies in having teachers and
students dramatize certain parts of what they read. The researchers had actors to come
into the classroom as part of the program, but most schools will not be able to provide
such a resource, and some teachers and students may not feel comfortable acting out a
scene. A more easily adapted method of imagery instruction is preferable for most
public schools.
In a qualitative study, two teacher practitioners, Hibbing and Rankin-Erickson
(2003), described their work with children in the classroom using a variety of mental
imagery techniques to build comprehension for middle school students. These
reported strategies were all representational in nature. They used prompts, drawings,
and illustrations in texts, picture books, and movies.
66
One strategy Hibbing and Rankin-Erickson used to instruct their students was to
tell students to read and form images as if they were watching “television in their
heads.” At various times, students were also asked to illustrate their images. In
addition, they used text illustrations to help students build background. They stated
that sometimes a simple spatial diagram-- whether it was about the setting or about a
device-- was helpful because the students might need some guidance. Some students
might needed clarification when they came to a static spot, where a lack of
background or context became a hindrance to comprehension. For example, they
described one student who read about a man paying off his Caterpillar. The student
did not know that a Caterpillar could be the name of a tractor. He thought a caterpillar
was a type of worm and so the story did not make sense to him. After he saw a picture
of one, he could read on without confusion.
When Hibbing and Rankin-Erickson noted that their students need more
background, they chose to use a movie clip to introduce the setting and characters
before reading. Then the students might watch the next segment of the movie clip and
read some more. They describe this as the W-R-W-R cycle, in which students watch
and then read, watch and then read. They found this method particularly useful with
the reluctant and low-achieving students as indicated by their positive comments.
Some students claimed that after the W-R-W-R cycle, they were “getting it.” At
times, the researchers asked students whether they preferred the movie or the book,
and many of the students said they preferred the book because it gave more details
and allowed them to understand the characters more. Many students also claimed that
67
they preferred the images they created in their heads more than those shown in the
movie.
In their study, Hibbing and Rankin-Erickson provided some insights into how
students felt about their mental imagery and how these related to the text they were
reading. Providing external visual images for students appears to be a positive way to
help students get a basic understanding of the setting and context so they may
improve their comprehension. The constant reminders to create mental imagery also
appear to be beneficial for students in the middle school classroom to help them make
connections to the texts. The text examples described in Hibbing and Rankin-
Erickson’s study appear to be narrative in nature, but it was likely that students may
respond positively to expository texts if given similar external visual supports.
Transformational Instruction
Another mental imagery method is transformational instruction, also known as
the keyword method, or the mnemonic method. The keyword is simply a concrete
word that resembles or links to an unfamiliar vocabulary. The study by Shriberg et al.
(1982) applied the keyword method to a prose-learning task. In that study, the
researchers trained eighth-grade students to use mnemonic imagery to picture famous
people with their accomplishments. For example, in order to remember that Charlene
McKlune was famous for training a cat that could count, students could transform
McKlune into a similar-sounding word-- raccoon, and then generate a picture of a cat
counting raccoons jumping over a fence. The results show that the students who had
imagery instruction out-performed those who did not receive the instruction in text
comprehension. Shriberg et al. showed that the keyword method is effective for
68
recalling important names and difficult facts. However, the instruction in their study
was limited to sentences and their purpose was to test recall.
Peters and Levin (1986) also studied the use of mnemonic imagery to aid
comprehension using seventh- and eighth-grade students. In the first phase of
instruction, students learn the keyword method using pictures that offer them a link to
a name or event when they read the first eight short passages (three sentences per
passage). The passages were stories about famous people, and the students were
supposed to remember important facts about them, such as what they invented. The
experimenters then shuffled the passages and asked students in the experimental
group to say the keyword aloud for each passage and make mental connections with
the main concept. Students in the comparison group read the cards silently the first
time and then read them aloud when the cards were shuffled. In the recall test,
students who had keyword imagery instruction had higher comprehension scores
when compared to students of the comparison group. Even one week later, the good
readers who had the keyword method were able to score higher than the good readers
in the comparison group, although there was no statistical difference between the
poor readers of both groups. Their study mainly showed that imagery and mnemonics
helped students recall passages better.
The mnemonic or transformational imagery instruction is useful when helping
students retain factual information such as names and numbers. This method,
however, may not help with the comprehension of the overall longer text since only
the keywords are targeted.
69
Although the use of mnemonics has shown that students improved on their
comprehension scores, the focus is mainly recall of important facts. Therefore, while
these studies are helpful in understanding the different ways mental imagery can
work, this study did not include mnemonic instruction since the focus was on the
improvement of students' reading comprehension when using expository passages.
The students were able to look back at the reading passage at any time, similar to the
standardized tests.
Combination Instruction Using Representational
and Transformational Strategies
Some researcher combined various methods to instruct their students,
sometimes using transformational strategies, and other times using representational
strategies. An example of this is Hodes' study (1994), in which she provided
instruction for participants using elaboration and mnemonics. According to Hodes,
elaboration could be mental imagery or adding anything to make connections, and
that elaboration strategies “require learners to actively adding information to the
information they are learning” (p. 54). Hodes did not describe the full details of this
elaboration instruction or the mnemonic instruction, but she found that there was a
speed-accuracy trade off using mental imagery as indicated in her study.
Hodes' study investigates the effectiveness of mental imagery in a recall task.
Forty college students participated in her study, with 20 in the experimental group
and 20 in the comparison group. Hodes used a single independent variable, posttest-
only comparison group design, giving instruction to the experimental group prior to
the one session of task-completion and test-taking. Participants read a 5-page, 1200-
70
words instructional manual about a graphic user interface computer operating system.
Afterwards, participants took a survey, a drawing test, and a recognition test on
twenty of the graphic user interface component. Hodes' study indicated that the
experimental group took significantly longer to read the materials (94 seconds more),
but took a shorter amount of time for the recall tasks (103 seconds faster) when
compared to the comparison group. There was no difference between the performance
accuracy of the two groups.
In her discussion, Hodes concluded that mental imagery is an activity high in
the continuum that improves retention, and that it may be a useful device for
remembering things that may later be brought upon for split-second decisions. One
reason that there was no difference in performance between the two groups may be
that she used college students as participants. They are usually the successful ones
throughout school and may have many strategies to call upon. Hodes’ study is useful
in finding out the speed and accuracy trade-off using mental imagery among college
students.
Researchers such as Oakhill & Patel (1991) also used combination instruction.
The researchers Oakhill and Patel studied 192 children aged 9-10 years. They used
four passages for instruction and five passages during testing. The imagery instruction
took three sessions on different days.
For Oakhill and Patel's first instructional session, students read stories and saw
representational drawings of the sequence of events. They were then asked to form
the pictures in their minds and they discussed their images with the researchers. The
71
story and pictures were taken away before the students answered questions on the
story.
In the second instructional session, both representational and transformational
drawings were used. The students learned that the transformational drawings were
used to help them with specific details and they discussed the images with the
trainers. Then the students answered questions after the researchers put away the
story and pictures.
In the third instructional session, students were not shown any drawings. The
students were to use their own mental pictures. The students again discussed their
images with the researchers and then answered questions.
Students in the comparison group read the same stories and spent the same
amount of time with the researchers, but they did not receive any imagery instruction.
The researchers told the students that they had to read the stories very carefully. The
results of Oakhill and Patel's study showed that there was a statistically significant
difference between the comprehension recall scores of the experimental group and the
comprehension recall scores of the comparison group. Poor readers of the
experimental group also performed significantly better than the poor readers of the
comparison group. Furthermore, the poor readers of the experimental group
performed about the same as the good readers of the comparison group after they had
mental imagery instruction. Oakhill and Patel's study showed great promise for using
combination mental imagery instruction, even though the instruction was fairly short
(three sessions) and the texts were all narrative.
72
The Oakhill and Patel’s study (1991) demonstrated an effective model for
mental imagery instruction; however, this study did not replicate Oakhill and Patel's
method since that study tested recall. For this study, students had their passages in
front of them for reference when they took the post-assessments. Similar to most of
the reading tasks in the classroom and the state assessment in reading, students were
not assessed on recall, therefore, transformational strategies or mnemonics instruction
were not used here.
Difficulty in Measuring Mental Imagery
It is difficult to measure mental imagery. The nature of mental imagery makes
it difficult to measure. People evoke different images even if they read the same text.
A simple word “chair” may evoke different images to different people. For some, the
chair is soft with padding, for others the chair is made of hard wood. The chair may
be of various colors, from red to brown. It may be large as a sofa chair or small as a
child's chair. Some people imagine what it feels like to sit in one, others think of
events related to a chair, from reading on mother's lap in a big armchair to the time
when another 3rd grader pulled the chair from under oneself, or to the memory of
sitting in a comfortable chair in a fine restaurant, ready to order. A couple of people
even have the image of the word “chair” as if it were written on a flash card. The
concept that different people create different mental images is one reason that the
researchers McCallum and Moore (1999) warned about the non-constrained imagery.
This is the same reason that researchers such as Rumelhart (1981), Anderson and
Pearson (1984) linked comprehension with schema. If readers form imagery within
73
the context of the passage, then the images are constrained and will promote
understanding.
Not only does each person's imagery vary, the vividness of mental imagery
evoked is also another issue. Gunston-Parks (1985) claimed that people with more
vivid imagery were more motivated to read. But how does one measure the ability to
create mental imagery? It is not an easy task. Two measures researchers in the field
use are the Revised Minnesota Paper Form Board Test (Quasha & Likert, 1937) and
the Sheveland Vividness of Imagery Questionnaire (1992), which was modified from
the “Betts QMI Vividness of Imagery Scale” (Betts, 1909).
These two instruments, though frequently used, are not perfect. For example,
the Revised Minnesota Paper Form Board Test is based on students performing tasks
of spatial reasoning-- visualizing and mentally manipulation 2-dimensional objects to
form other 2- or 3-dimensional objects. This only tests one part of mental imagery--
mainly visual, which leaves out all the other sensations. Furthermore, the task
requires students to use some logic, which is not directly related to vividness of
imagery. The other measure, the Sheveland Vividness of Imagery Questionnaire, is a
self-assessment. It covers the senses of vision, sound, feel, taste, action, taste, sound,
and sensations. It is a very useful instrument to measure students' self-perceived
vividness of imagery, with the drawback that sometimes students do not accurately
rate themselves.
To better understand my students, I gave the Sheveland Vividness of Imagery
Questionnaire to the students in my on-grade-level Language Arts classes. Many
students tend to rate themselves excellent on everything (school years 2005, and
74
2006). It might be exactly how the students felt, but their true ability to image was
questionable. Some studies indicated that students who reported more vivid mental
imagery scored better on reading comprehension (Cramer, 1980, 1981). In Anderson
and Kulhavy's study (1972), results based on students' self-generated reports on a
questionnaire showed that the amount of learning was directly related to the amount
of time during which imagery was reportedly used. Using self-assessments means that
the teacher or researcher has to trust the students to accurately report what they
experienced, and not to just select the highest ratings just because they may perceive
higher ratings to be what the teacher or researcher would want. These difficulties in
measuring mental imagery remain. Researchers who used qualitative interviews had
better understanding of when, how, and what imageries are generated (McCallum &
Moore, 1999), but there is no absolute measure to decide what is considered high
imaging ability or what degree of imaging is considered most vivid. Researchers need
to use the existing measures with caution.
One of the questions this study investigated was whether vividness of imagery
has a relation to comprehension achievement and motivation to read. This study did
not focus on whether vividness of imagery was increased after mental imagery
instruction.
Difficulty in Teaching and Creating Mental Imagery
Other than the difficulty of measuring the degree of vividness of mental
imagery and how actively students are using that strategy, another big issue is
teaching the skill. Mowey and Conahan (1995) claimed that there are learning
strategies and there are teaching strategies. Mental imagery is a learning strategy that
75
teachers expect students to employ, yet very few studies really teach the students how
exactly to create mental images. The study by McCallum and Moore (1999) showed
that unrelated incongruous mental images which they termed “non-constrained
images” can actually hinder comprehension; therefore, it is important that mental
imagery strategy is taught to the students properly. The students need to know that the
imagery created must be within the context of the passages they are reading.
In addition to non-constrained mental images, students may be side-tracked by
seductive details presented in the texts, which also deters comprehension. Seductive
details in reading refer to the highly entertaining and personally appealing extra
details that do not support the main ideas of the text (Choi, 2006). For example, the
idea that monarch butterflies taste bad to a bird may be considered as a seductive
detail in an article about the monarch butterflies’ migration habits. Researchers claim
that “the negative effects on comprehension were due to a combination of reduced
attentional allocation and disruption of text coherence” (Lehman, Schraw,
McCrudden, & Hartley, 2007). Students needed to focus on only important
information and create relevant images for those that support the main points. Studies
that target the issue of seductive details in the text report that seductive details detract
from students' comprehension and recall (Choi, 2006; Harp & Maslich, 2005;
Lehman, Schraw, McCrudden, & Hartley, 2007). Therefore, the passages used in this
study did not intentionally include any seductive details. Furthermore, this study did
not focus on teaching students what details are relevant and what are not relevant.
The passages for this study were written with the intent to inform and explain with
factual details. They were written based on interesting topics suggested by students in
76
the 2005-2006 school year, and the new additions were added in the year 2007-2008.
It was not within the scope of this study to introduce text with seductive details or
instruct student how to manage these details. If any seductive details happened to be
in the passages, they were not the original intent.
Another issue that emerged when teaching students mental imagery is the
concept of concrete and abstract words. It was argued that concrete words would
generate more imagery and that abstract terms do not generally promote imagery or
better recall (Sadoski, Goetz, & Fritz, 1993; Sadoski, Goetz, & Rodriguez, 2000).
Early researchers in the field, Toglia and Battig (1978), had published a handbook
that rated a total of 2854 terms according to dimensions of concreteness, imagery,
categorizability, meaningfulness, familiarity, number of attributes or features, and
pleasantness. Words such as “sun” rated high on the scale as being concrete and
imaginable, with many other favorable attributes. On the other hand, the word “fault”
rated low on concreteness and imaginableness. Researchers such as Marschark and
Surian (1992) noted that the presence or absence of concreteness effects in free recall
depends on the relative salience of distinctive and relational information.
What happens when a passage contains lots of abstract words or concepts?
Can students create mental imagery with abstract words? A study by Franco-Watkins
and Dougherty (2006) investigated the effects of word concreteness and encoding
instructions on context-dependent discrimination in verbal contexts. They used a
theoretic framework that targeted the item, the context, and the ensemble. One
hundred and fifty undergraduate college students participated in the study. They were
randomly assigned to one of the three treatment groups: rote, mental imagery, and
77
item only. Sixty word pairs (30 concrete and 30 abstract) were randomly presented on
a computer screen for a three-second duration. In the rote condition, the participants
were instructed to repeat both words in the word pair over and over (subvocally) until
the words disappeared from the screen. In the imagery condition, the participants
were instructed to integrate both words into a vivid image. In the item-only condition,
the participants were instructed to repeat once (subvocally) the word that appeared in
green. All the participants were told that they would be tested for the words that
appeared in green. The results indicated that context-dependent discrimination is not
dependent solely on the use of interactive imagery instructions or on word
concreteness. They noted that mental imagery occurred for both concrete and abstract
words, and that the rote memory group was able to create contextual links for both
sets of words as well. Although the abstract pairs had fewer imaginable properties (as
reflected in imaginableness ratings in word norms), the results indicated that the
interactive imagery encoding instruction was successful even when the words were
relatively abstract. However, concrete pairs seemed to have had an advantage in
comparison with abstract pairs, but only for the imagery condition. This is consistent
with previous findings that it is possible to form images for abstract pairs of words.
Toglia and Battig (1978) rated abstract words such as “Happiness” relatively low on
concreteness, yet moderately high for imaginableness.
Regardless of concreteness or imaginableness of the words, the purpose of this
study was to investigate the effects of mental imagery instruction on middle-school
students using science expository texts. The topics of the instructional materials as
well as pre- and posttests were based on interests expressed by the students. In
78
addition, these topics were concrete items that actually exist. For example, topics
span the deepest part of the ocean to the tallest mountain, from objects in space such
as Mars and the moon to interesting sea creatures such as piranhas and puffer fish.
The pretest and posttests were about creatures such as crocodiles, alligators, octopus,
squid, butterflies, and moths. It was not the intent of this study to introduce abstract
themes and therefore this issue would not be one of importance for this study. If
abstract terms were introduced in the passages, such as scientific names for the
animals, they were explained. Any other abstract terms in the passage might have
been part of any explanation, but they were not intentional, not should they present a
major problem with the mental imagery instruction.
Even without worrying over concreteness and imaginableness of words, one
main question for mental imagery instruction still exist. How exactly does one teach
others how to create mental imagery? Some protocol for creating imagery included
the dimming of lights and playing soft music-- the practices which Gunston-Parks
(1985) felt unnecessary. Some studies did not teach students to image at all, but only
told them to create images in their heads (Anderson & Kulhavy, 1972; Gambrell,
Koskinen, & Cole, 1980; Gunston-Parks, 1985). Gambrell (1986) later improved on
her instructional strategy and suggested that there should be a purpose established,
then teacher modeling, after which the students are told to “make pictures in your
mind” (p. 458). Her method was also cited in Tierney and Readence's Reading
Strategy Instruction in the Primary Grades: A compendium (2000) as an effective
way for mental imagery instruction. While Gambrell and Bales were able to get some
positive gains in comprehension monitoring, there needs to be more inquiry into the
79
various ways to instruct students to create mental imagery, and also explore more
than just relying on the visual sense. In some cases, students who created mental
images still may not fully understand or can interact with the text to perform well on a
test or assessment. It may be like a person watching a movie and not paying close
attention, so some of the meaning or purpose may be lost to that person. As more
research is available in the field, researchers may look into various methods to
instruct students and do more than a mere prompt to use mental imagery. While
creating mental imagery can help the students relate to the text they are reading (the
input mode), students also need rehearsing-- whether it is verbal or written-- to
express what they have understood (the output mode). This study included both the
input and output modes of mental imagery instruction so students might actively
respond to their mental imagery, make sense of the text, and interact with the text,
which in turn, might lead to better reading comprehension.
Summary
The concept of using mental imagery strategies to improve reading
comprehension is still an area waiting to be explored, particularly when pertaining to
the use of mental imagery with expository text. Related studies are summarized in
three tables that follow. Table 1 reports the use of mental imagery as a
comprehension strategy for high school and college students. Some studies do not
show any positive gains in reading or recall, and the reason may be that most of these
studies did not instruct the students at all regarding how to create mental imagery.
The two studies that show positive gains in reading comprehension had imagery
instruction for the students. Another reason that some of these studies may not show
80
gains may be that many high school and college students already have enough
reading strategies to make them successful so far, and in fact, some of them may be
already using mental imagery. Oakhill and Patel (1991) as well as Pressley (1975)
discussed this condition, in which good readers were already using various reading
strategies, including mental imagery. One of the two studies in this category that
showed gains is the study by Clark et al. (2001), in which the researchers used mental
imagery instruction (5- 7 hours) with learning disabled students who were reading at
least two years below grade level. These students had made gains. Another study with
positive results is the study by Hodes (1994). Using college students as participants,
Hodes provided some mental imagery instruction and then tested the participants on
comprehension and recall. Results indicated that the experimental group performed
better than the comparison group in regards to the speed of recall; however, there was
no difference between the two groups regarding comprehension. (Mental Imagery
studies for high school and college students are summarized in Table 1.)
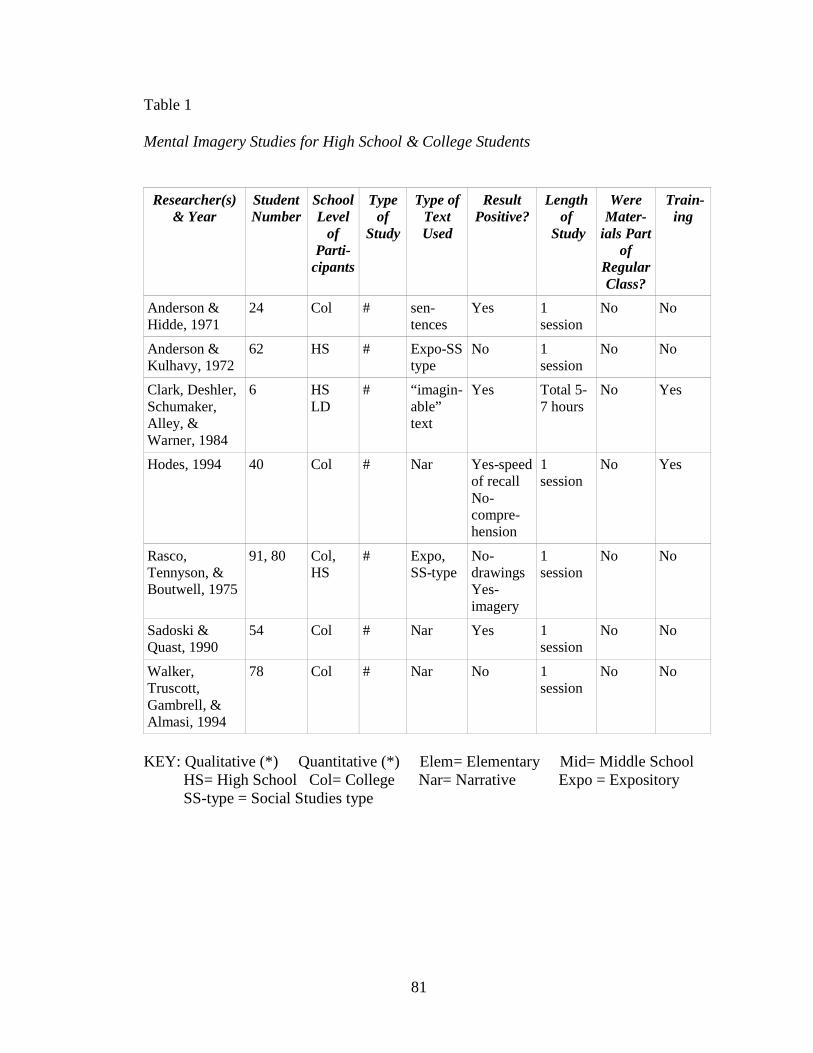
81
Table 1
Mental Imagery Studies for High School & College Students
Researcher(s)& Year
Student Number
School Level
of Parti-
cipants
Type of
Study
Type of Text Used
Result Positive?
Length of
Study
Were Mater-
ials Part of
Regular Class?
Train-ing
Anderson & Hidde, 1971
24 Col # sen-tences
Yes 1 session
No No
Anderson & Kulhavy, 1972
62 HS # Expo-SS type
No 1 session
No No
Clark, Deshler, Schumaker, Alley, & Warner, 1984
6 HS LD
# “imagin-able” text
Yes Total 5-7 hours
No Yes
Hodes, 1994 40 Col # Nar Yes-speed of recall No- compre-hension
1 session
No Yes
Rasco, Tennyson, & Boutwell, 1975
91, 80 Col, HS
# Expo, SS-type
No- drawings Yes- imagery
1 session
No No
Sadoski & Quast, 1990
54 Col # Nar Yes 1 session
No No
Walker, Truscott, Gambrell, & Almasi, 1994
78 Col # Nar No 1 session
No No
KEY: Qualitative (*) Quantitative (*) Elem= Elementary Mid= Middle School HS= High School Col= College Nar= Narrative Expo = Expository SS-type = Social Studies type
82
There are few studies in mental imagery research using middle school
students. An interesting point to note is that for the seven studies included in Table 2,
more than half of these used expository text. This may be an indication that some
researchers are aware that expository texts are a major part of middle school
curriculum. However, many of these studies did not have any instruction for the
students at all. Most of these studies took only one session and used contrived
materials that were not part of regular classroom instruction. The exceptions are
Hibbing & Rankin-Erickson's study (2003) and Warner's study (1977). Yet
interestingly, most of these studies yield positive results in at least some area of
learning. One study in this group that did not yield positive results is Gunston-Parks'
study (1985), which used expository science type text, but gave no instruction to the
students. The other study that shows no statistically significant gain is Warner's study.
He provided students with one session of instruction, and noted in his conclusion that
since the participants were students with learning disabilities, he perhaps needed to
give them more time to learn the strategy. In a later study with Clark, Deshler,
Schumaker, and Alley (1984), Warner and his team of researchers offered seven
training sessions for some high school students with learning disabilities and found
some positive gains. (See Table 2 for a summary of middle school studies.)
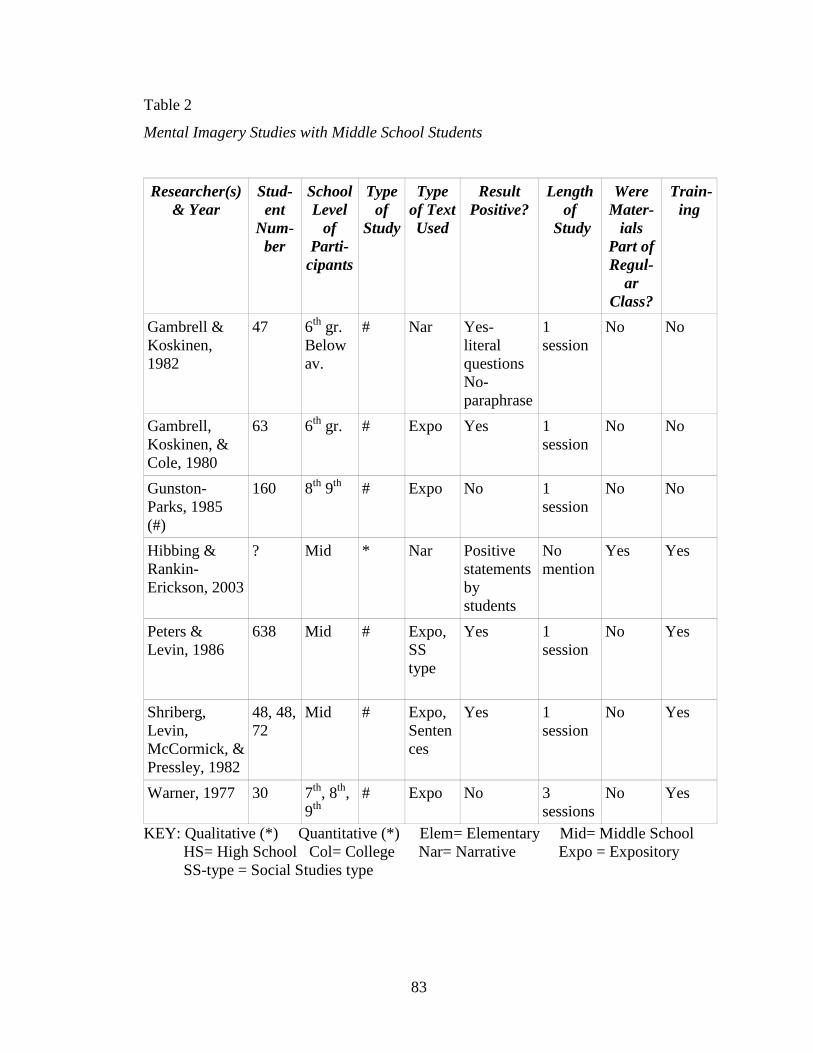
83
Table 2
Mental Imagery Studies with Middle School Students
Researcher(s)& Year
Stud-ent
Num-ber
School Level
of Parti-
cipants
Type of
Study
Type of Text Used
Result Positive?
Length of
Study
Were Mater-
ials Part of Regul-
ar Class?
Train-ing
Gambrell & Koskinen, 1982
47 6th gr. Below av.
# Nar Yes- literal questions No- paraphrase
1 session
No No
Gambrell, Koskinen, & Cole, 1980
63 6th gr. # Expo Yes 1 session
No No
Gunston-Parks, 1985 (#)
160 8th 9th
# Expo No 1
session No No
Hibbing & Rankin-Erickson, 2003
? Mid
* Nar Positive statements by students
No mention
Yes Yes
Peters & Levin, 1986
638
Mid # Expo, SS type
Yes 1 session
No Yes
Shriberg, Levin, McCormick, & Pressley, 1982
48, 48, 72
Mid # Expo, Sentences
Yes 1 session
No Yes
Warner, 1977 30 7th, 8th, 9th
# Expo No 3 sessions
No Yes
KEY: Qualitative (*) Quantitative (*) Elem= Elementary Mid= Middle School HS= High School Col= College Nar= Narrative Expo = Expository SS-type = Social Studies type
84
Most mental imagery studies in the field of reading comprehension use
elementary school students. It is fascinating to note that all the studies reported in
Table 3 showed a positive gain regarding some aspect of learning, yet six of the
studies did not really provide the students with instructions on how to create mental
imagery (Gambrell, 1992; Gambrell & Jawitz, 1993; Macomber, 2001; Oliver, 1982;
Rasco et al., 1975; Sadoski, 1984). Students were just told to create pictures in their
minds. Again, most of these studies took only one session to complete, and used
materials made for the study and not materials that the students will normally use in
the classroom. Only one study used expository texts (Rasco et al.), and three of the
studies used some expository texts along with some narrative texts (Douville &
Algozzine, 2004; Finch, 1982; Gambrell & Bales, 1986); all the other studies used
narrative texts. From these studies, findings suggest that elementary students would
benefit from using mental imagery as a reading strategy, although the use of this
strategy with expository text was still not fully explored. (See Table 3.)
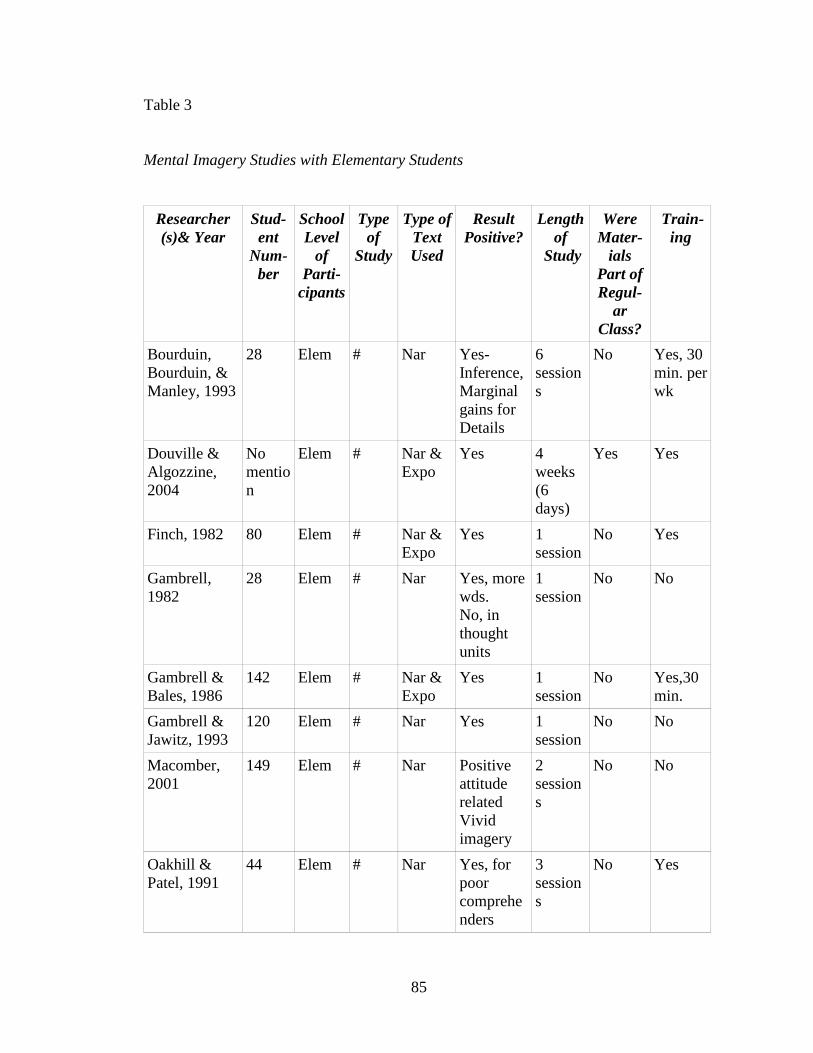
85
Table 3
Mental Imagery Studies with Elementary Students
Researcher (s)& Year
Stud-ent
Num-ber
School Level
of Parti-
cipants
Type of
Study
Type of Text Used
Result Positive?
Length of
Study
Were Mater-
ials Part of Regul-
ar Class?
Train-ing
Bourduin, Bourduin, & Manley, 1993
28 Elem # Nar Yes- Inference, Marginal gains for Details
6 sessions
No Yes, 30 min. per wk
Douville & Algozzine, 2004
No mention
Elem # Nar & Expo
Yes 4 weeks (6 days)
Yes Yes
Finch, 1982 80 Elem # Nar & Expo
Yes 1 session
No Yes
Gambrell, 1982
28 Elem # Nar Yes, more wds. No, in thought units
1 session
No No
Gambrell & Bales, 1986
142 Elem # Nar & Expo
Yes 1 session
No Yes,30 min.
Gambrell & Jawitz, 1993
120 Elem # Nar Yes 1 session
No No
Macomber, 2001
149 Elem #
Nar Positive attitude related Vivid imagery
2 sessions
No No
Oakhill & Patel, 1991
44 Elem # Nar Yes, for poor comprehenders
3 sessions
No Yes
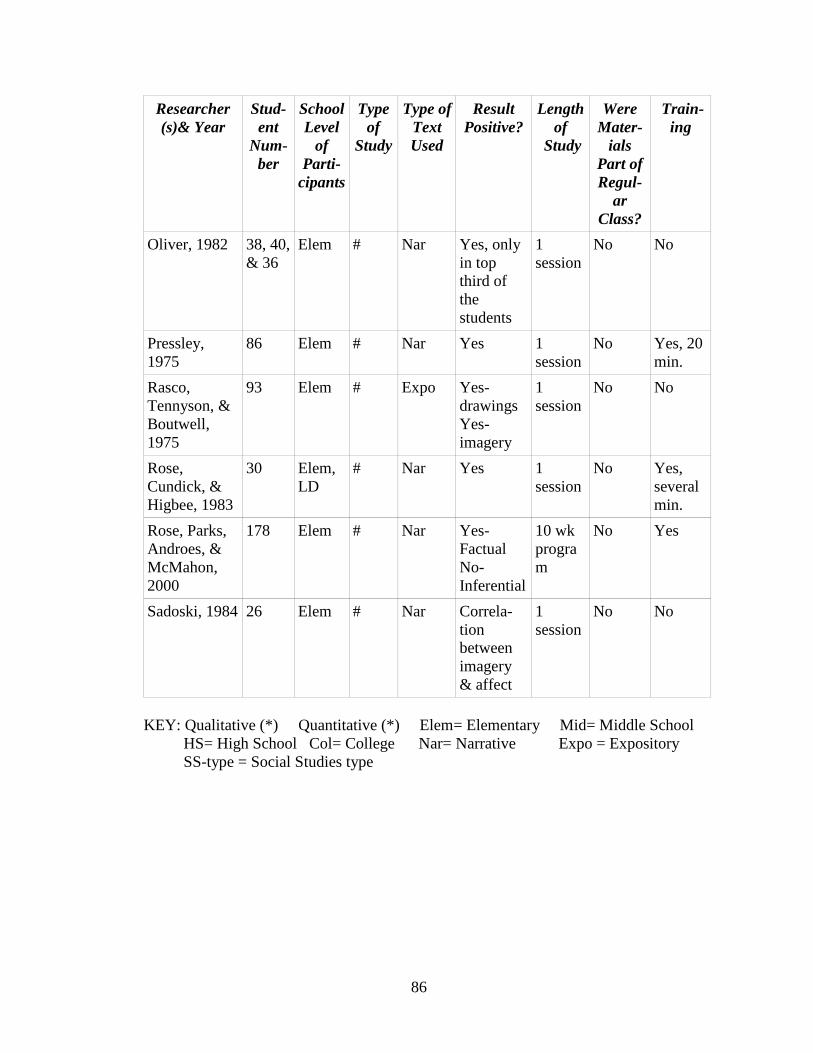
86
Researcher (s)& Year
Stud-ent
Num-ber
School Level
of Parti-
cipants
Type of
Study
Type of Text Used
Result Positive?
Length of
Study
Were Mater-
ials Part of Regul-
ar Class?
Train-ing
Oliver, 1982 38, 40, & 36
Elem # Nar Yes, only in top third of the students
1 session
No No
Pressley, 1975
86 Elem # Nar Yes
1 session
No Yes, 20 min.
Rasco, Tennyson, & Boutwell, 1975
93 Elem # Expo Yes- drawings Yes- imagery
1 session
No No
Rose, Cundick, & Higbee, 1983
30
Elem, LD
# Nar Yes 1 session
No Yes, several min.
Rose, Parks, Androes, & McMahon, 2000
178 Elem # Nar Yes- Factual No- Inferential
10 wk program
No Yes
Sadoski, 1984 26 Elem # Nar Correla-tion between imagery & affect
1 session
No No
KEY: Qualitative (*) Quantitative (*) Elem= Elementary Mid= Middle School HS= High School Col= College Nar= Narrative Expo = Expository SS-type = Social Studies type
87
How This Study Extends Prior Research
This study extends prior research efforts related to teaching students mental
imagery as a comprehension strategy when reading expository texts in several
important ways. First, this study used a combination method of representational
instruction, including self-generated illustrations, think-along ideas, as well as
vocabulary instruction, so students may use whatever it takes to help them
comprehend better. Research in this area shows that many studies did not provide any
instruction at all. This study employed a series of instructional strategies with
students. Prior studies also show that the few studies that had instruction for the
students often had limited instruction-- usually only one session. This study provided
10 sessions of mental imagery instruction during the two-week intervention period,
and then frequent prompts (at least two to three times a week) for the rest of the
school year to help students maintain the mental imagery skills. These methods were
adopted to ensure that the students can create mental imagery in different ways to
help them understand and make connections with the text, and to help students
maintain their acquired mental imagery skills.
Second, this study targeted the reading materials to be science-type expository
texts. Few studies in the field of mental imagery involve middle school students and
expository texts (Gambrell, Koskinen, & Cole, 1989; Gunston Parks, 1985; Peters &
Levin, 1986; Shriberg et al., 1982), and some of those training materials were just
sentences (Shriberg et al., 1982). The lack of mental imagery studies using
expository texts may even have led to some misconception that mental imagery is
useful only for narratives. This study showed that mental imagery may be a useful
88
reading strategy for expository texts as well (see Results section, Chapter IV). The
study of McCallum and Moore (1999) paved the way to show that students do
generate mental imagery when they read exposition, and this study builds upon that
finding. This study showed various ways students may create mental imagery when
reading science expository texts, helping them make connections and enhancing their
reading comprehension. This study also provided more information on middle school
students using mental imagery as a reading strategy with expository text.
This study is unique in combining the following: the use of a systematic two-
week instructional period, the use of researched mental imagery strategies, the use of
expository texts constructed similar to regular classroom materials, the use of middle
school students, and the use of qualified regular classroom teachers to conduct the
study, and the use of assessments typical of a middle school classroom. The findings
of this study provide references for other educators and researchers when selecting
reading strategies to help students comprehend expository texts, particularly for
middle school aged students.
89
CHAPTER III
METHODOLOGY
Introduction
The purpose of this study was to investigate the effects of mental imagery
instruction using science expository texts on middle school students. Specifically, this
study examined a combination mental imagery instructional method that extended
two weeks. The investigation took place in the early part of the year in 2008. During
the week of January 14-18, 2008, students took pretests to establish baseline scores
for reading achievement, vividness of mental imagery, motivation to read, and the
comprehension of science expository text. The metal imagery instruction took two
weeks, January 22, 2008, through February 4, 2008, one period (45 minutes) each
day. Post-assessment took about two more days and data were collected. Then
throughout the rest of the school year, experimental group students were prompted to
use mental imagery strategies at least two to three times a week. After the initial two
weeks of practice, comparison group students were taught the same imagery
strategies experimental students had received. Comparison group students were also
prompted to use mental imagery strategies at least two to three times a week until the
end of the school year. Near the end of the school year, all participating students used
one more expository passage similar to the other instructional materials to prepare
them for one more task-- the second posttest.
This study posed four research questions: (a) What are the effects of mental
imagery strategies for science expository texts on middle school students' reading
comprehension achievement? (b) How do the low-, middle-, or high-comprehenders
90
compare in their reading achievement after mental imagery instruction? (c) Are there
relations between the variables of reading comprehension, vividness of mental
imagery, and motivation to read for low-, middle- and high-comprehenders? (d) Is
motivation to read improved after mental imagery instruction using science
expository texts?
This chapter outlines the research methodology that is used to conduct the
investigation. It provides detailed description of the following: (a) setting, (b)
measures, (c) research design, (d) instructional materials, (e) instructional method, (f)
summary of informal study (2005-2006), and (g) limitations of this study.
Setting
School
The study was conducted in the middle school where I had been teaching for the
last six years. It was a rural-suburban school, located in the mid-Atlantic region, that
had been in operation since the year 2000. For the 2007-2008 school year, it served
689 students from grade six to eight, of whom 209 were six-graders. The racial
distribution for sixth-grade was 71.2% Caucasian, 25.5% African American, and 3%
Hispanic. Other ethnicity such as Asian or Native American represented was less than
1%. Of the sixth-grade population, 10.2% were in special educational programs, and
20.9% receive free or reduced priced meals (FARMS).
In this middle school, students did not have one subject for English; instead
they had a Reading class and a Language Arts class. Based on the curriculum, some
of the skills in Reading class and Language Arts class overlap. The main difference
was that the focus in Language Arts class was writing, whereas the focus in Reading
91
class was reading and answering comprehension questions. Students in Reading and
Language Arts classes were tracked for (a) Honors level (students reading
approximately two grade levels above grade placement), (b) On-grade-level or
Comprehensive level, and (c) Basic level (students reading approximately two grade
levels below grade placement). The students placed in the Basic class do not receive
special education services for Reading or Language Arts. The students' placements
were based on teacher recommendation, state assessment scores, county benchmark
scores, and Gates-MacGinitie Reading Test (2000) scores from the previous year.
Most students did not take the Gates-MacGinitie Reading Test prior to entering
middle school. Only students who were identified by their teachers as performing
poorly in reading took the Gates-MacGinitie Reading Test to validate whether or not
they should be placed in a Basic class. Within each class, there was still a range of
reading ability.
Participants
Teachers
My co-worker and I were the teachers involved in this study. At the time of this
study, both my co-worker and I had advanced certification in reading and had taught
at the middle school level for over 12 years. We also had a common planning time so
we could plan and discuss concerns. For the 2007-2008 school year, we both taught
three Language Arts and two Reading classes a day. I taught one On-grade-level
Reading class and one Basic Reading class. My co-worker taught two Honors
Reading classes. Some of our Language Arts students were the same ones we had in
Reading class; therefore, for this study, we only involved our Reading classes. In
92
later parts of this report, I may refer to myself as Teacher One, and my co-worker as
Teacher Two.
Student Participants
The student participants were from four intact classes of sixth-grade students
that my co-worker and I taught. For the 2007-2008 school year, I taught a Basic class
(13 students) and an On-grade-level Reading class (23 students). My co-worker
taught two classes of Honors students (class numbers were 32 and 22 respectively).
The students in these classes were expected to be somewhat diverse in ability even
though they were assigned to be in a certain reading class level based on their past
academic performance. For the random class assignment-- it was decided that the
first class each teacher taught would be assigned as part of the experimental group,
and the other class would be assigned as part of the comparison group.
Since the overall student sample was small and the experimental time period
rather short (two weeks), I also used sequential sampling for this study. Although
initially the students in the comparison group were not taught the mental imagery
strategies, after two weeks of experimental study and the first set of data was
collected, the students in the comparison group were also taught mental imagery
strategies. All students were prompted to use these strategies throughout the rest of
the year. At the end of the school year, all students took another posttest. Their data
were collected and analyzed. According to Krathwohl (2004), in sequential sampling,
data from samples are cumulatively analyzed to determine if the needed statistical
precision has been met. It is useful where the study itself has not caused an increased
awareness of the topic (Krathwohl, 2004, p. 174). In this case, since comparison
93
students were not taught mental imagery strategies in the early part of the school year,
they were not aware of the techniques. Instructing them later in the school year
provided more data on the effects of mental imagery instruction on the
comprehension of expository texts for a larger sample of students.
Before conducting the study, I gave the parents consents forms to allow their
students' scores to be included in the study. Students whose parents agreed to let their
scores be used in this study also signed an assent form so that they also showed
agreement to allow their scores to be included in the study. Data for those students
whose parents did not give consent or who did not sign assent forms were not used in
the analysis of this study. The final numbers of students included in the study are as
follows: (a) Experimental Group 1 (Basic level), 11 students-- 8 girls and 3 boys;
Experimental Group 2 (Honors level), 14 students-- 6 girls and 8 boys; Comparison
Group 1 (On-grade-level) 19 students-- 4 girls and 15 boys; Comparison Group 2
(Honors level), 12 students-- 8 girls and 4 boys. The total number of students
involved was 56, with 25 in the experimental group (14 girls, 11 boys) and 31 in the
comparison group (12 girls, 19 boys).
A summary of student information is presented in Table 4. The table provides
information about the students in the four classes such as teacher, original class size,
participating numbers, type of comprehenders, gender, free and reduced meal
(FARMS) status, and ethnicity. The average age for this group of sixth-graders is
between 11 and 12 years.
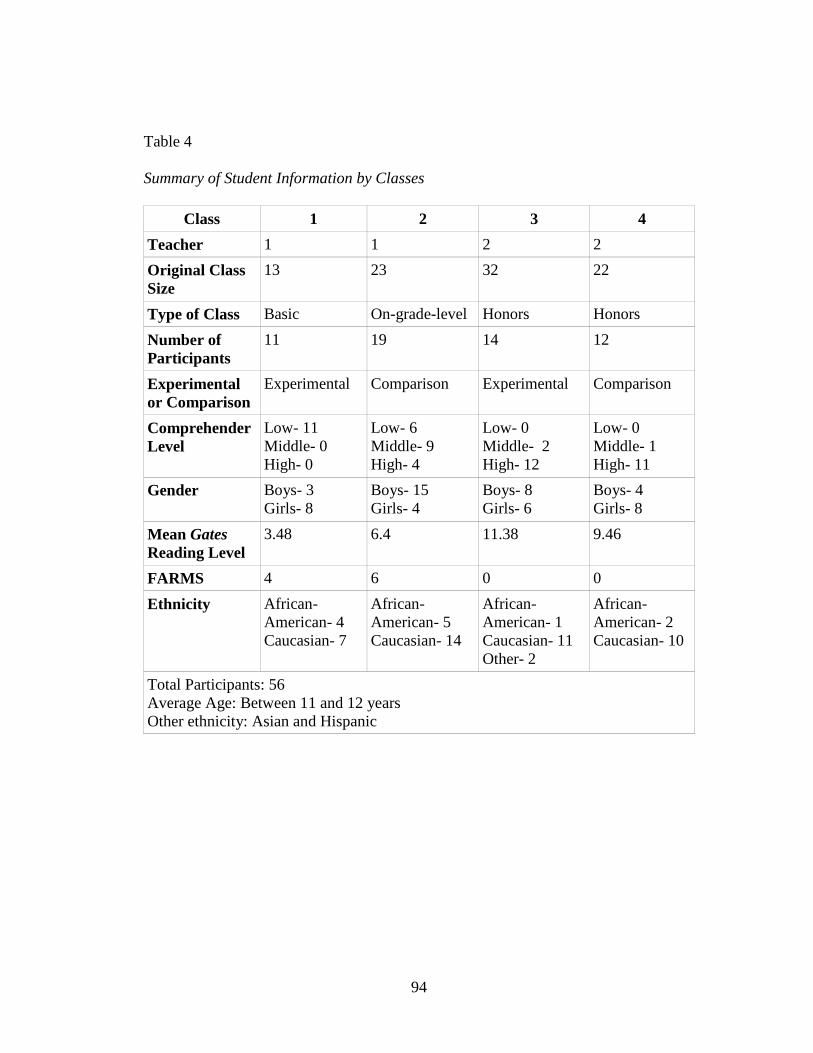
94
Table 4
Summary of Student Information by Classes
Class 1 2 3 4
Teacher 1 1 2 2
Original Class Size
13 23 32 22
Type of Class Basic On-grade-level Honors Honors
Number of Participants
11 19 14 12
Experimental or Comparison
Experimental Comparison Experimental Comparison
Comprehender Level
Low- 11 Middle- 0 High- 0
Low- 6 Middle- 9 High- 4
Low- 0 Middle- 2 High- 12
Low- 0 Middle- 1 High- 11
Gender Boys- 3 Girls- 8
Boys- 15 Girls- 4
Boys- 8 Girls- 6
Boys- 4 Girls- 8
Mean Gates Reading Level
3.48 6.4 11.38 9.46
FARMS 4 6 0 0
Ethnicity African-American- 4 Caucasian- 7
African-American- 5 Caucasian- 14
African-American- 1 Caucasian- 11 Other- 2
African-American- 2 Caucasian- 10
Total Participants: 56 Average Age: Between 11 and 12 years Other ethnicity: Asian and Hispanic
95
Measures
This study used several measures to identify the reading performance levels of
students, imaging vividness, motivation to read, and their comprehension
performance on expository passages. The Gates-MacGinitie Reading Test (2000) was
used to help identify students as low-, middle-, and high-comprehenders. Two tests,
The Vividness of Imagery Questionnaire (Sheveland, 1992) and The Motivation to
Read Profile (Gambrell, Palmer, Codling, & Mazzoni, 1996) were used as both pre-
and posttest. I developed the Pretest for science expository text: “Crocodiles and
Alligators” and three different posttests. The posttest “Poisonous and Nonpoisonous
Snakes of America” was first developed for an informal study in the 2005-2006
school year. The other two posttests, “Octopus and Squid” and “Butterflies and
Moths,” were developed in the school year 2007-2008. These passages all used the
comparison text structure and had similar comprehension questions (see Appendix
C). These measures are explained with more details in the following section.
The Gates-MacGinitie Reading Test
The first baseline measure was the Gates-MacGinitie Reading Test, Form S
(2000). This reading test, developed by W. MacGinitie, R. MacGinitie, K. Maria, and
L. Dreyer, provided information about students' reading achievement in the categories
of vocabulary and comprehension. Students’ reading level as indicated by grade
equivalence results on this test and their state assessment scores were used to identify
them as low-, middle-, or high-comprehenders for later data analysis. This test was
not used as a posttest.
96
This test was needed because other than the state assessment scores which
placed students in one of the three categories (Basic, Proficient, and Advanced), there
was usually no other up-to-date standardized reading test information on the students.
Students varied in their reading achievement within each class. The Gates-MacGinitie
Reading Test (2000) showed normed reading performance levels of the students and
offered a baseline of reading achievement as reference. In addition to the raw score, a
stanine score, and an outcome indicator score, the test also provided each test-taker a
grade equivalence score for vocabulary, comprehension, and total reading
achievement.
The Vividness of Imagery Questionnaire
A measure that was used as pretest and posttest for this study was the
Vividness of Imagery Questionnaire (Sheveland, 1992), which was designed to
measure the vividness of a person's natural use of mental imagery. Sheveland (1992)
adapted this questionnaire from The Betts OMI Vividness of Imagery Scale (1967),
reducing the 35 items to 21 items. The instrument used 21 Likert-type items covering
seven sense modalities-- visual, auditory, cutaneous, kinesthetic, gustatory, olfactory,
and organic (p. 3). The items each had five possible responses, ranging from "Very
Clear: Vivid" (4 point) to "No Image, Just Know" (0 point). This questionnaire was
tested on 380 children in an elementary school in southern California, ranging from
grade three to six. Statistical analysis among items indicated that the measure had
internal reliability, with an overall Cronbach alpha reliability of .88.
In this study, students took the Vividness of Imagery Questionnaire
(Sheveland, 1992) as both pre- and post- assessment. Prior studies in the field showed
97
significant correlations between vivid mental imagery and affect (Cramer, 1980,
1981; Macomber, 2001) as well as vivid imagery and reading comprehension
(Cramer, 1981). I was interested to learn if vividness of mental imagery may have an
impact on sixth-grade students' affect and comprehension.
The Motivation to Read Profile
For this study, the Motivation to Read Profile (MRP) was also used as pretest
and posttest. Developed by Gambrell, Palmer, Codling, and Mazzoni (1996), it was
used to measure students' motivation to read and attitude towards reading. Past
research literature suggested a link between reading motivation and reading
achievement (Walbert & Tsai, 1985, Wigfield, 1997). I was also interested to learn if
motivation to read increased after students receive mental imagery instruction.
According to Gambrell, Palmer, Codling, and Mazzoni (1996), the MRP was
designed to elicit information about student's self-perceived competence in reading
and self-perceived performance relative to peers. In addition, it also provides insight
into the value students place on reading tasks and reading-related activities. The MRP
consists of two basic instruments: The Reading Survey, and the Conversational
Interview. For this study, only The Reading Survey was used. This portion contains
selected response style questions that assess self-concept as a reader as well as value
of reading. Questions include items such as whether the student thinks he or she is a
good reader, and whether reading is important or not. Gambrell et al. (1996) took
measures to ensure that the MRP was valid and reliable. To ensure construct validity
of the items in the survey, they used the items that 100% of experienced teachers
judged to measure self-concept and value of reading. Teachers also rated students as
98
having low, average, and high reading performance. Using the data collected,
Gambrell et al. found statistically significant differences in the mean scores of the
self-concept subscale related to those groups. Based on teacher ratings of student
performance, the students who had higher scores on the MRP also demonstrated
better reading performance. To ensure internal consistency of the survey, Gambrell et
al. examined the instrument and found a moderately high reliability for both subscales
when using Cronbach's alpha statistic (Self-concept = .75; Value of Reading = .82).
Pretest and Posttests for Expository Text
In addition to the MRP, students took a pretest consisting of an expository
passage titled “Crocodiles and Alligators,” which was followed by 10 multiple-choice
questions also known as selected response questions (SR) and one short essay
question, known as brief constructed response (BCR). Similar to state assessments,
students may refer back to the text when they answer questions. The measure was
designed for assessing reading comprehension using science expository texts and not
for assessing recall. The text structure of this passage uses the compare and contrast
model (Appendix C).
The posttest was also a task consisting of an expository passage about two
similar animals. Three posttests were developed over the course of this study. In the
school year 2005-2006, an informal study was conducted to investigate the use of
mental imagery strategies with science expository texts. (For more information on the
informal study, please refer to Appendix H.) The first posttest was written for that
purpose, and was titled “Poisonous and Nonpoisonous Snakes of America.” (This
posttest is also referred to as Posttest 1B or Alternative.)
99
When students take the posttests, they may refer back to the text when they
answer questions since the assessment was for comprehension and not recall. The
posttests were written similar to the pretest. Each has ten SR questions and one BCR.
The expository pretest and posttests were used to compare students' reading
achievement before and after the two-week intervention as well as their reading
achievement at the end of the school year. The pre- and posttests are similar for
several reasons. First, they are about natural science-- the topic is about two similar
animals. Second, the texts used similar structure (compare and contrast) as the main
exposition writing model. Third, all were leveled for sixth-grade readability. Fourth,
all used similar test item construction. Each test contains questions in the following
reading skill categories: main idea (1 question), author's purpose (1 question), details
(2 questions), inference (1 question), prediction (1 question), compare and contrast (1
question), conclusion (1 question), fact and opinion (1 question), vocabulary in
context (1 question).
The test items of the pretest “Crocodiles and Alligators” and the posttest
“Poisonous and Nonpoisonous Snakes of America” were examined for construct
reliability using item analysis in the 2005-2006 and the 2006-2007 school years. The
SR questions for both tests were similar, with 10 questions each, matching item-by-
item in comprehension skills such as main idea and vocabulary in context. The BCR
questions were similar; both asked how to differentiate the two creatures. The test
items for the posttests “Octopus and Squid” and “Butterflies and Moths” were
examined for reliability in the school year 2007-2008. No one question seems to be
more frequently missed than another. For the sake of simplicity, the pretest may be
100
referred to as Pretest or “Crocodiles,” the expository posttest “Octopus and Squid”
may be referred as Posttest 1A or “Octopus,” the expository posttest “Poisonous and
Nonpoisonous Snakes of America” may be referred to ad Posttest 1B or “Snakes,”
and the expository posttest “Butterflies and Moths” may be referred to as Posttest 2 or
“Butterflies.”
Reliability Check for Pretest and Posttests for Expository Texts
In the Fall of 2005, I conducted a reliability check for the Pretest and Posttest
1B using an On-grade-level class. For this class of 24 students, half the class was
randomly given the “Crocodiles and Alligators” passage as a pretest, and the other
half of the class was given the “Poisonous and Nonpoisonous Snakes of America”
passage as the pretest. The scores were then analyzed using the independent samples
t-test. The categorical, independent variable was the class, and the continuous,
dependent variable was the scores on the expository reading tests. Results indicated
that there was no statistically significant difference when comparing students'
performance on the two tests. For the posttest, those students who had the
“Crocodiles” passage as pretest used the “Snakes” passage as posttest, and those who
used the “Snakes” as pretest then used “Crocodiles” as posttest. Again, analysis show
that the there was no statistical difference regarding students' performance. The
Selected Response mean score was 68.5% (6.85 out of 10 questions) for the
“Crocodiles” passage and 73.5% (7.35 out of 10 questions) for the “Snakes” passage.
The Standard Deviation was 1.8. Analysis using t-tests indicated that there was no
statistically significant difference between the two results. For the BCR, the mean
scores were 2.1 and 1.8 respectively (on a 3 point scale), indicating that the students
101
were, on average, performing in the “Proficient” or middle range. Again, there was no
statistically significant difference between the students' performance on either test.
The main difference between the “Crocodiles” passage and the “Snakes” passage is
that the first passage uses a point-by-point method of comparison, whereas the second
uses a one-side-at-a-time method of comparison. It was brought to my attention that
the text structures, though both used compare and contrast, were not exactly alike.
The “Snakes” passage was longer. There were a few more facts presented in the
“Snakes” passage as well. In order to make this a better study with valid and reliable
posttests, I designed two other posttests for this study.
In the Fall of 2007, I prepared and tested two more posttests: “Octopus and
Squid” and “Butterflies and Moths.” These passages are better matches for the pretest
“Crocodiles and Alligators” in text structure than the “Poisonous and Non-poisonous
Snakes of America.” These passages use the point-by-point comparison structure. The
questions were also designed to parallel the pretest. Each test contains questions in
the following reading skill categories: main idea (1 question), author's purpose (1
question), details (2 questions), inference (1 question), prediction (1 question),
compare and contrast (1 question), conclusion (1 question), fact and opinion (1
question), vocabulary in context (1 question). Even the BCRs basically ask the same
question– How are the two creatures different? (Main text structures and supports for
the expository pre- and posttests are presented in a comparison matrix in Table 5.
Complete pretest and posttests are presented in the Appendix C section.)
Students in the Language Arts class (24 students) randomly read and answered
the questions to any two of the three test passages. Paired samples t-test was
102
conducted to evaluate the differences of the students' performance between the
“Crocodiles and Alligators” test and the “Octopus and Squid” or “Butterflies and
Moths” tests for both SR and BCR portions of the tests. In this analysis, each student
had provided matching sets of test scores, and where work was avoided or a score is
missing, the student's set of scores was not included in the analysis. The independent
variable was time tested and the independent variables were the scores. Data analysis
revealed that there were no statistical significant differences between the SR scores
from Time 1 (“Crocodiles”) [M = 62.08, SD = 20.85] to Time 2 (“Octopus”) [M =
65.88, SD = 21.53, t (15) = -.239, p = .814], to Time 3 (“Butterflies”) [M = 65.08, SD
= 21.70, t (11) = .034, p = .973]. An analysis of the BCR scores also revealed that
there were no statistical significant differences between the scores from Time 1
(“Crocodiles”) [M = 55.23, SD = 32.86] to Time 2 (“Octopus”) [M = 55.00, SD =
34.06, t (14) = .265, p = .795], to Time 3 (“Butterflies”) [M = 53.00, SD = 32.68, t (8)
= .800, p = .447]. Therefore, it appeared that the students performed similarly on all
constructed tests for this study. It can be concluded that these tests can be used as
reliable post-assessments. Table 5 provides information on the text structure for the
four expository text assessments.
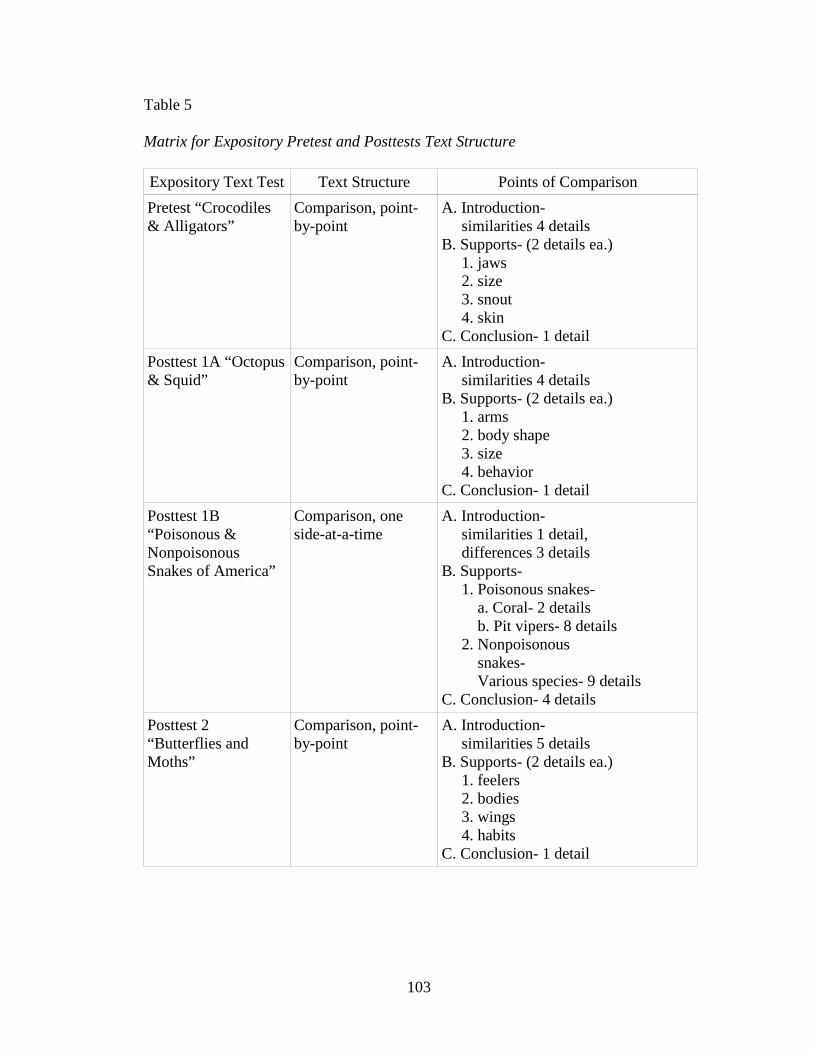
103
Table 5
Matrix for Expository Pretest and Posttests Text Structure
Expository Text Test Text Structure Points of Comparison
Pretest “Crocodiles & Alligators”
Comparison, point-by-point
A. Introduction- similarities 4 details B. Supports- (2 details ea.) 1. jaws 2. size 3. snout 4. skin C. Conclusion- 1 detail
Posttest 1A “Octopus & Squid”
Comparison, point-by-point
A. Introduction- similarities 4 details B. Supports- (2 details ea.) 1. arms 2. body shape 3. size 4. behavior C. Conclusion- 1 detail
Posttest 1B “Poisonous & Nonpoisonous Snakes of America”
Comparison, one side-at-a-time
A. Introduction- similarities 1 detail, differences 3 details B. Supports- 1. Poisonous snakes- a. Coral- 2 details b. Pit vipers- 8 details 2. Nonpoisonous snakes- Various species- 9 details C. Conclusion- 4 details
Posttest 2 “Butterflies and Moths”
Comparison, point-by-point
A. Introduction- similarities 5 details B. Supports- (2 details ea.) 1. feelers 2. bodies 3. wings 4. habits C. Conclusion- 1 detail
104
Scoring of the Expository Pretest and Posttests
Selected Response. For the selected response (SR) section, an answer key was
used for scoring. There is only one correct answer for each question. The raw scores
were then converted into percents.
Brief Constructed Response. For the brief constructed response (BCR) section,
my colleague and I both read the short essays and scored them based on a scoring
guide which is similar to the BCR scoring guide for state assessments. A score point
of 0 represents performance below Basic level-- the response may be totally off topic,
wrong, demonstrates little understanding; there may be even be no response or an “I
don't know.” A score point of 1 represents a Basic performance level-- the response
demonstrates a limited amount of understanding of the text as well as providing
limited support from the text. A score point of 2 represents a Proficient performance
level-- the response demonstrates proficient understanding of the text and provides
sufficient supports for the answer. A score point of 3 represents an Advanced
performance level-- the response demonstrates excellent understanding of the text and
provides plenty of supports for the answer. The raw score is then converted into
percentages using the following guide: 0= 0%, 1= 50%, 2= 75%, 3= 100%.
All responses were scored by both teachers separately first. In most cases, the
two raters gave similar scores. In the event where the scores were different, the essay
was re-examined and final scores were agreed on based on consensus. The average
percent of agreement between the two raters for all tests was 82.5%. According to
Huck, Cormier, and Bounds (1974, p. 335), an agreement score of 85% between
105
observers or raters is considered high. Therefore, the first time ratings for the BCRs
for this study were close to the mark; in addition, the raters were able to meet and
reach a consensus on each BCR for which there was an initial disagreement. BCR
(first time scoring) results for rater consistency was 88.5% for the Pretest “Alligators
and Crocodiles,” 84.8% for Posttest 1A “Octopus and Squid,” 71.4% for the
Alternative Posttest 1B “Poisonous and Non-poisonous Snakes of America,” and
85.2% for Posttest 2 “Butterflies and Moths.” Based on the close match for initial
scoring and the consensus scoring procedures, it may be concluded that the BCR
scoring is consistent.
106
Research Design
This study employed a quasi-experimental pretest-posttest comparison group
design. Students took the pre- and posttests in the following areas: (a) the reading
comprehension tests for science expository texts, (b) the Motivation to Read Profile
(Gambrell et al., 1996), and (c) the Vividness of Imagery Questionnaire (Sheveland,
1992). Information from these pre-assessments as well as other background
information was gathered for later data analysis.
Independent variables were (a) group memberships (i. e. experimental group
and comparison group in four different classes-- two experimental groups and two
comparison groups) and (b) types of readers (i. e. low-, middle- and high-
comprehenders).
Dependent variables were (a) Vividness of Imagery Questionnaire (Sheveland,
1992), (b) Motivation to Read Profile (Gambrell, Palmer, Codling, & Mazzoni,
1996), and (c) Expository Pretest and Posttests 1A, 1B, and 2.
In the beginning of the school year, students took the Gates-MacGinitie
Reading Test (2000) to identify their reading achievement level. The Gates scores and
the students' state assessment scores were used to categorize students into three types
of comprehenders. Students who score in the grade equivalence range of 7.5 and
above on the Gates test and in the “Advanced” range on the state assessment were
considered high-comprehenders. Students who score in the grade equivalence range
of 5.0 to 7.5 on the Gates test and in the “Proficient” range on the state assessment
were considered middle-comprehenders. Students who score in the grade equivalence
range of 4.9 and below on the Gates test and in the “Basic” range on the state
107
assessment were considered low-comprehenders. Students whose scores vary greatly
between the two measures were considered on an individual basis, where classroom
performance and teacher input would also be considered when placing a student in a
category. For example, a student who scored “Advanced” on the state test but scored
at a 4.6 grade equivalence on the Gates-MacGinitie test may be categorized as a
middle-comprehender when this student’s overall performance in the classroom was
also considered. Students' performance levels vary within the classroom. For
example, an Honors class may have high-comprehenders as well as a few middle-
comprehenders. An On-grade-level class may have all three types of readers. The
identification of the three levels of performance was for data analysis only; students
were not informed regarding what category readers they were. Information from these
assessments as well as other background information such as ethnicity and FARMS
data were used for analysis.
Instructional Materials
In the Spring of 2005, I developed several expository exercises to supplement
my classroom reading instruction. Where do these topics come from? I asked my
students what they wanted to know about. Many of the students told me they wanted
to know about the tallest mountain and the deepest sea. They wanted to know what it
is like on the moon or Mars. They were interested in earthquakes, volcanoes, and
creatures such as crocodiles, piranhas, and wasps. So I took their suggestions, did
some research using science textbooks, encyclopedias, and internet sources, and
developed the passages and tests.
108
In the Fall of 2005, I used these passages in an informal study. (For more
information on the Informal Study, refer to Appendix H.) The reading exercises
included expository text passages, multiple choice questions, and short essay
questions. The readability level of these teacher-prepared passages, as indicated by
the Flesch-Kincaid readability formula, was in the sixth-grade range. At the end of
each passage, there are ten multiple-choice questions (Selected Response or SR) and
one short essay question, also known as a brief constructed response (BCR). Both
experimental and comparison groups used the same materials. Eight expository
instructional sets were used in the ten-day instructional stage of this study. The titles
are as follows: (1) The Mariana Trench, (2) Volcanic Eruptions, (3) Earthquake
Resistant Buildings, (4) Is There Life on Mars? (5) What Is It Like on the Moon? (6)
Mount Everest, (7) The Unusual Puffer Fish, and (8) Piranhas. Before taking the final
posttest, all participating students read one more instructional passage titled “Bees
and Wasps.” (Expository passages and questions are presented in Appendix B.)
How Do These Expository Passages Compare with the Science Textbook?
The passages and tests for this study were written on topics that sixth-grade
students found interesting and had vocalized their preferences. Each passage contains
approximately 500 words. On the other hand, the science textbook that was used for
the school system covered a wide curriculum, with objectives that matched the
voluntary state curriculum. Since the topics were decided by the curriculum
developers, students had no input in what they had to read. The science textbook is
divided into 7 units, with an average of 3 chapters each unit, and each unit has 5 sub-
sections. The passages used in this study are about the same length as a sub-section,
109
except that the science textbook has plenty of diagrams, pictures, and other graphic
aids. In contrast to the science textbook, the passages for this study were not written
with the intention of providing graphic aids. With the exception of the first passage,
where graphic images were used to prompt students to visualize the Marianna Trench,
all the other passages were written with the idea that the students will generate their
own mental images. Both the expository passages and the science textbook seem to
provide enough concrete words. The expository passages used in this study were
written on a sixth-grade readability (using the Flesch-Kincaid formula). However,
unlike the passages written for this study, the science textbook is written on a much
higher reading level than the grade for which it is assigned. It is, therefore, not
surprising that the average student has a difficult time reading the science textbook.
The following table shows an analysis of the text for both the expository passages and
the science textbook on two topics.
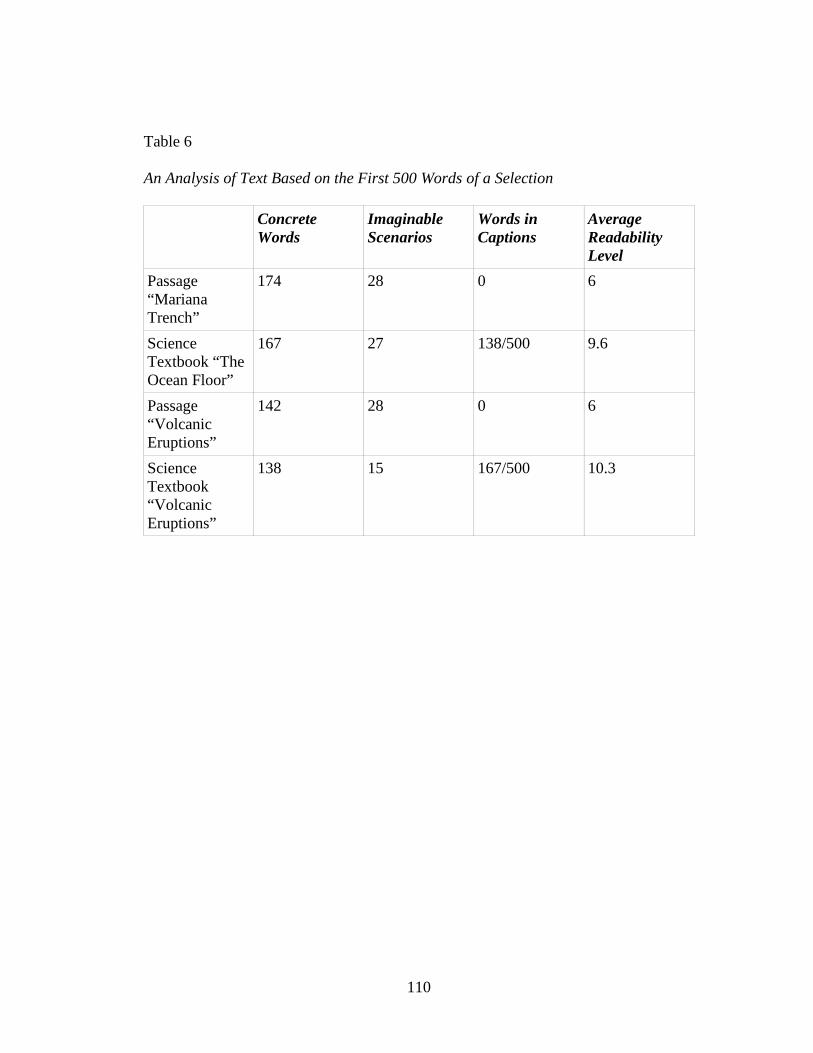
110
Table 6
An Analysis of Text Based on the First 500 Words of a Selection
Concrete Words
Imaginable Scenarios
Words in Captions
Average Readability Level
Passage “Mariana Trench”
174 28 0 6
Science Textbook “The Ocean Floor”
167 27 138/500 9.6
Passage “Volcanic Eruptions”
142 28 0 6
Science Textbook “Volcanic Eruptions”
138 15 167/500 10.3
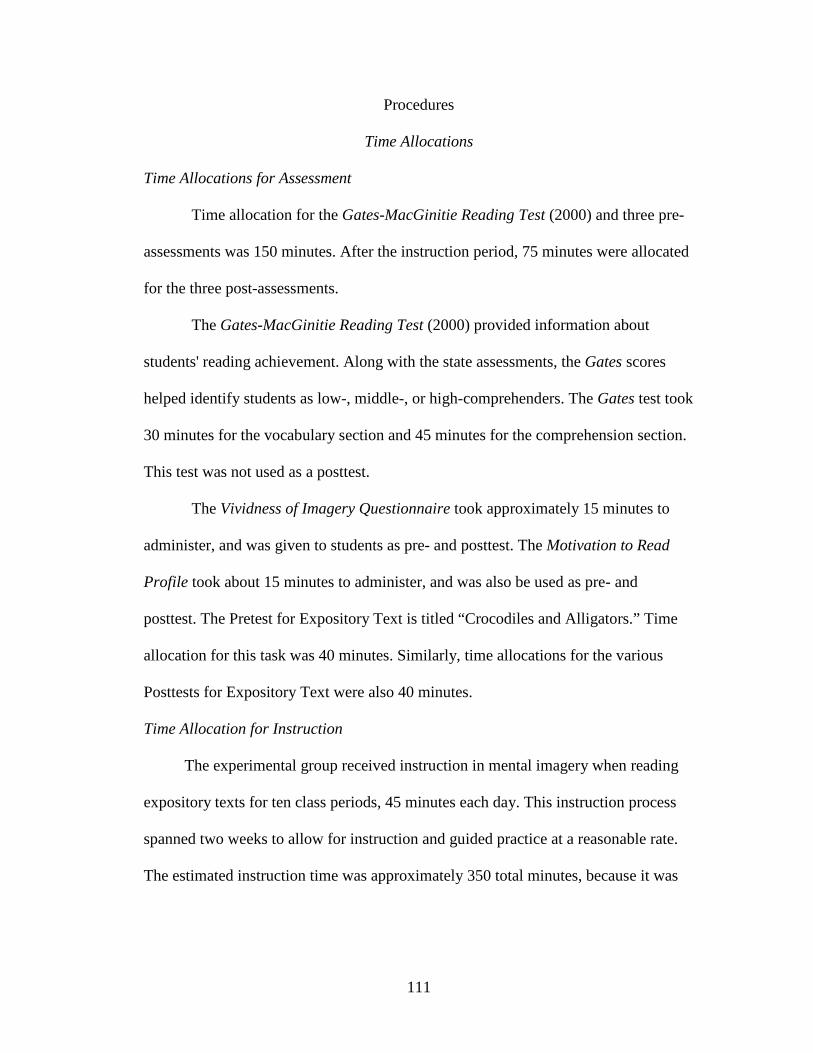
111
Procedures
Time Allocations
Time Allocations for Assessment
Time allocation for the Gates-MacGinitie Reading Test (2000) and three pre-
assessments was 150 minutes. After the instruction period, 75 minutes were allocated
for the three post-assessments.
The Gates-MacGinitie Reading Test (2000) provided information about
students' reading achievement. Along with the state assessments, the Gates scores
helped identify students as low-, middle-, or high-comprehenders. The Gates test took
30 minutes for the vocabulary section and 45 minutes for the comprehension section.
This test was not used as a posttest.
The Vividness of Imagery Questionnaire took approximately 15 minutes to
administer, and was given to students as pre- and posttest. The Motivation to Read
Profile took about 15 minutes to administer, and was also be used as pre- and
posttest. The Pretest for Expository Text is titled “Crocodiles and Alligators.” Time
allocation for this task was 40 minutes. Similarly, time allocations for the various
Posttests for Expository Text were also 40 minutes.
Time Allocation for Instruction
The experimental group received instruction in mental imagery when reading
expository texts for ten class periods, 45 minutes each day. This instruction process
spanned two weeks to allow for instruction and guided practice at a reasonable rate.
The estimated instruction time was approximately 350 total minutes, because it was
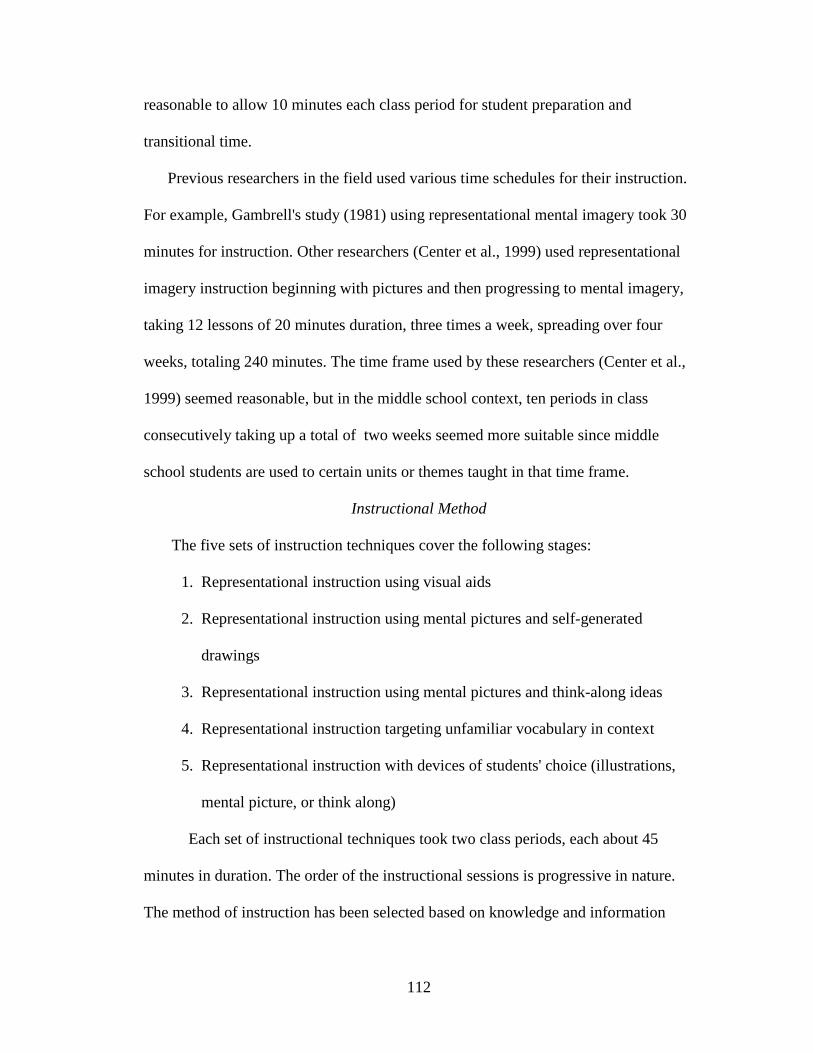
112
reasonable to allow 10 minutes each class period for student preparation and
transitional time.
Previous researchers in the field used various time schedules for their instruction.
For example, Gambrell's study (1981) using representational mental imagery took 30
minutes for instruction. Other researchers (Center et al., 1999) used representational
imagery instruction beginning with pictures and then progressing to mental imagery,
taking 12 lessons of 20 minutes duration, three times a week, spreading over four
weeks, totaling 240 minutes. The time frame used by these researchers (Center et al.,
1999) seemed reasonable, but in the middle school context, ten periods in class
consecutively taking up a total of two weeks seemed more suitable since middle
school students are used to certain units or themes taught in that time frame.
Instructional Method
The five sets of instruction techniques cover the following stages:
1. Representational instruction using visual aids
2. Representational instruction using mental pictures and self-generated
drawings
3. Representational instruction using mental pictures and think-along ideas
4. Representational instruction targeting unfamiliar vocabulary in context
5. Representational instruction with devices of students' choice (illustrations,
mental picture, or think along)
Each set of instructional techniques took two class periods, each about 45
minutes in duration. The order of the instructional sessions is progressive in nature.
The method of instruction has been selected based on knowledge and information
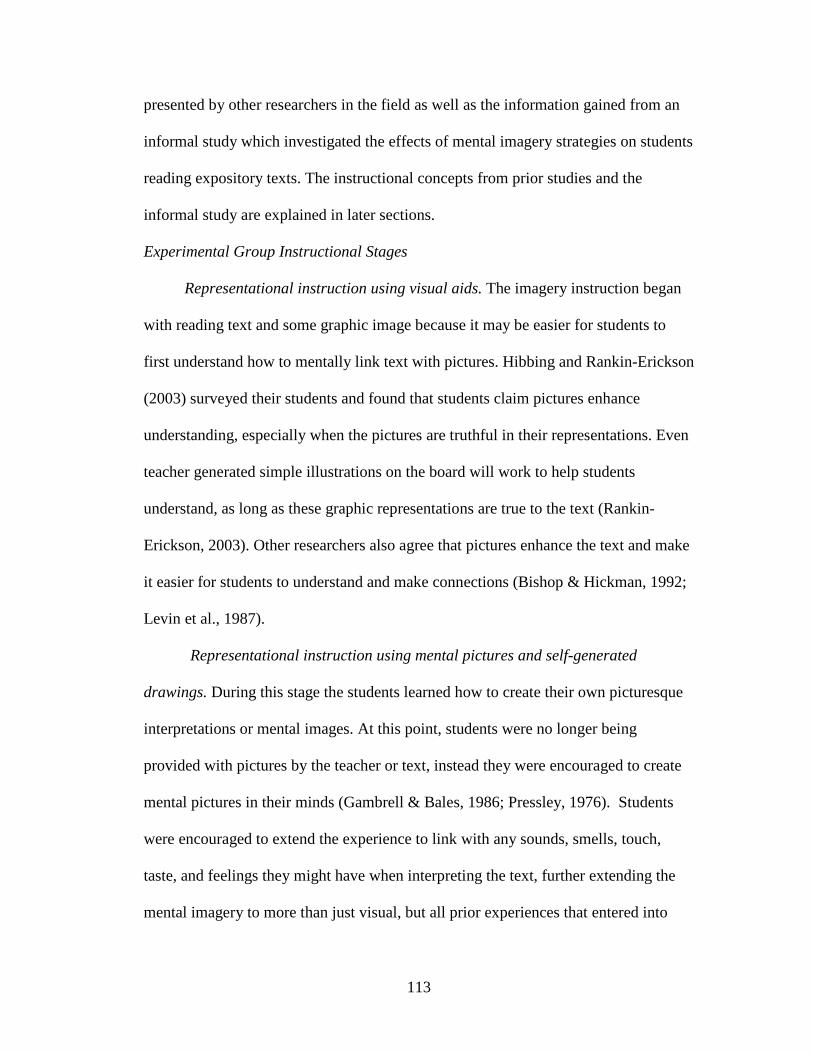
113
presented by other researchers in the field as well as the information gained from an
informal study which investigated the effects of mental imagery strategies on students
reading expository texts. The instructional concepts from prior studies and the
informal study are explained in later sections.
Experimental Group Instructional Stages
Representational instruction using visual aids. The imagery instruction began
with reading text and some graphic image because it may be easier for students to
first understand how to mentally link text with pictures. Hibbing and Rankin-Erickson
(2003) surveyed their students and found that students claim pictures enhance
understanding, especially when the pictures are truthful in their representations. Even
teacher generated simple illustrations on the board will work to help students
understand, as long as these graphic representations are true to the text (Rankin-
Erickson, 2003). Other researchers also agree that pictures enhance the text and make
it easier for students to understand and make connections (Bishop & Hickman, 1992;
Levin et al., 1987).
Representational instruction using mental pictures and self-generated
drawings. During this stage the students learned how to create their own picturesque
interpretations or mental images. At this point, students were no longer being
provided with pictures by the teacher or text, instead they were encouraged to create
mental pictures in their minds (Gambrell & Bales, 1986; Pressley, 1976). Students
were encouraged to extend the experience to link with any sounds, smells, touch,
taste, and feelings they might have when interpreting the text, further extending the
mental imagery to more than just visual, but all prior experiences that entered into
114
their coding system (Sadoski & Paivio 2001; Sheveland, 1992). Furthermore, the
students were asked to draw some pictures or diagrams of their own to illustrate what
they understood from the text they read. Prior studies that engage students with
illustrations suggested that students creating drawings can enhance reading
comprehension (Hibbing & Rankin-Erickson, 2003; Rose et al., 2000). Researchers
Bean, Valerio, and Stevens (1999) suggested that illustrations or drawings should be
included as part of content area literacy instruction. In my informal study (2005-
2006), many of the students seemed to enjoy drawing about the text they have read.
Representational instruction using mental imagery and think-along ideas. In
this part of the instruction, the students learned to use mental images and expressed
their thoughts with words. The teachers modeled and demonstrated the mental
imagery in their heads as they read parts of a passage aloud and discussed the ideas
with the students. When teachers model and tell the students the thought procedures
that went through their minds, the process is termed “think-aloud” (Davey, 1983;
Farr, 1997). Then the teachers coached the students to generate ideas and pair share
orally. After that, the teachers continued the instruction process by guiding the
students to read a passage, then generate images of their own and write them down.
This process is termed “think-along” since the students are not orally calling out
every thought and image (Farr, 1997). For the think-along process, the focus was on
mental imagery; however, any response was fine since the scope of mental imagery
included the remembering of past experiences and linking them with the current text.
Therefore, if a student read about Hutton's geologic processes at school and learned
that natural forces would break rocks down to smaller particles (Earth Science, p.
115
134), he might recall that he had smashed a piece of sandstone into smaller rocks
before. That concept was a think-along idea which showed that the student was
making connections with the text. Although the particular idea might not seem like a
picture, it certainly was an experience that was visual, tactile, and linked with the text.
Think-aloud think-along ideas are not new. Olshavsky (1976) used it as a
means to study the cognitive process that readers and writers use as they develop
meaning. Farr (1997) and other researchers (Baumann, Jones, & Seifert-Kessell,
1993; Davey, 1983; Duffy & Roehler, 1987; Flower & Hayes, 1980; Kucan & Beck,
1997) have researched the concept and used it as a comprehension strategy. It is listed
as one of the many reading strategies to use in Tierney and Readence's Reading
Strategies and Practices: A Compendium (2000) and Pearson and Fielding's
Handbook of Reading Research (1991). The foundations of think-along think-aloud
can be linked to schema (Rumelhart, 1976) and metacognition (Baker, 1984; Frey,
2006). When students think about what they read and try to make sense of it, they
make connections with past experiences, drawing upon the schemata related to what
they have read, often bringing up mental imagery (Wade, Buxton, & Kelly, 1999).
When they express their ideas out loud or write it on paper, they are aware and
reflective of their own cognitive processes, which is the basis of metacognition
(Baker & Brown, 1984). Using the think-aloud think-along strategy may help
students purposefully choose to make connections with the text so that they may
share with the class or in small groups.
When the students were taught mental imagery and the think-aloud think-
along strategy, they might express their thoughts about the reading as think-alouds.
116
The teachers would ask students to share their mental imagery with the whole class
one at a time, or pair share with a partner. The teacher then guided them to write
some of these ideas down. To use written think-alongs may be a manageable strategy
in the classroom because the teacher can maintain effective classroom management
while students are engaged. Fast thinkers and writers may raise their hands and be
selected to share their think-alongs with the whole class. Considering the dynamics of
the classroom, the teacher may choose to let students do pair share or group share.
The think-along strategy can be very flexible to use. Students may also use graphic
organizers that help them organize their mental images in the categories of sight,
hearing, touch, smell, taste, or other senses. In the last five years, I have incorporated
the mental imagery think-along strategy in my classroom and found it to be one of the
most useful strategies to use with classes of all ability levels.
Representational instruction targeting unfamiliar vocabulary in context. Often
when students read expository text, they may encounter technical vocabulary that
may be difficult for them (Smith & Ellis, 2003). This next stage was designed to help
students use mental images to create connections that may help them with the
meaning of unfamiliar vocabulary. Students might use context clues to figure out
what a difficult word may mean, and then express the meaning through a written
linking vocabulary that required an illustration. One method that is linked to mental
imagery is the verbal-visual vocabulary square (Bean, Valerio, & Stevens, 1999;
Readence, Bean, & Baldwin, 1998). The method includes writing the new vocabulary
in the center of a card about half the size of a regular sheet of paper, then on the four
corners add the definition, the part of speech, make a sentence, and draw an image.
117
Another similar vocabulary strategy is the LINCS card strategy (Ellis, 2004).
The idea of the LINCS card is as follows: (1) write the vocabulary word, (2) write the
definition, (3) find a linking word (also known as the reminding word) that links or
reminds one of the vocabulary word, (4) draw a picture that relates to the word, and
(5) write a linking sentence that makes sense using the reminding word (It does not
matter if the student does not use the original vocabulary in this strategy).
The common factors among these visual vocabulary strategies are the picture
and the connection with the vocabulary word. The students may be prompted to do
either one of the two visual vocabulary strategies to enhance their vocabulary.
Representational instruction with devices of students' choice (illustrations,
mental picture, or think-along). The last stage was for students to learn how to choose
any imagery technique they wish to use on their own. The basic structure of the
instruction lesson was always divided into three segments. First, the teachers
demonstrated the imagery technique. Second, students partnered with another student
for imagery practice. Third, students practiced the imagery technique on their own.
After reading and interacting with the entire passage, students answered
comprehension questions about the passage they read as an assessment for
understanding. The teachers then shared the correct answers. The scores for the
independent activities were collected for analysis.
Comparison Group
For the comparison group, the students used the same instructional materials
and had the same amount of time as the experimental group. Since there were three
118
parts to each set, comparison group students also had a teacher-guided portion, work-
with-a-partner portion, and an independent work portion.
During the first part of each set, the teachers told the students to read the
passage carefully. For the second part of each set, the students read the passage with a
partner. For the third part of each set, the students read silently and then they
answered questions independently. After students completed the questions at the end
of each passage, the teachers shared the correct answers. In the case of the written
response or BCR, the teachers shared what would be an effective answer. All student
answers for the five instructional sets were collected.
Post-Assessment
After the five sets of instruction, students took the post-assessment. Students
read the passages silently and answered questions, using whatever imagery technique
they felt most comfortable. In addition to the test passages and questions, students in
the experimental group received blank paper (for drawing), an "Images Chart"
(Appendix E), and writing paper. Students in the comparison group received the test
passages, questions, and writing paper.
Summary of Instructional Components for the
Experimental and Comparison Group
This study provides students with eight different sets of science expository
passages as practice materials. During the initial two-week intervention period,
students in the experimental group had mental imagery instruction to go along with
these passages while students in the comparison group were asked to read carefully
and answer the questions. Table 7 illustrates how the experimental group and

119
comparison group vary in mental imagery instruction. Detailed lesson plans are
attached in Appendix D.
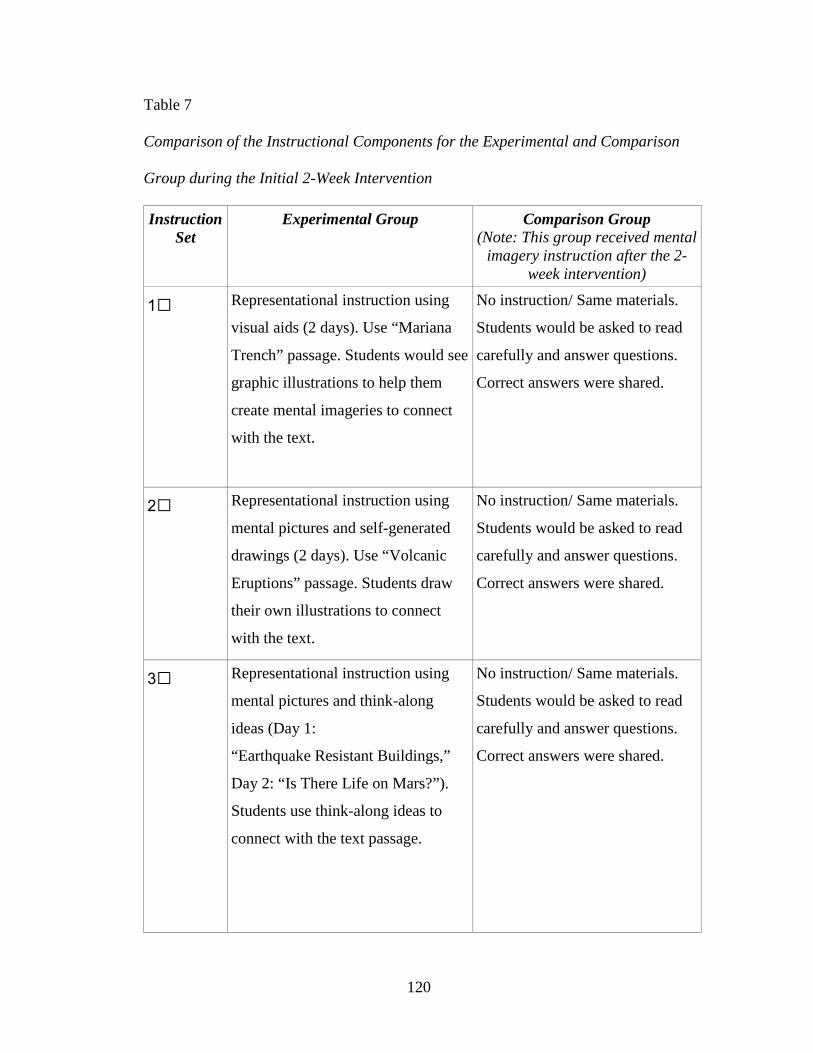
120
Table 7
Comparison of the Instructional Components for the Experimental and Comparison
Group during the Initial 2-Week Intervention
Instruction Set
Experimental Group Comparison Group (Note: This group received mental
imagery instruction after the 2-week intervention)
1 Representational instruction using
visual aids (2 days). Use “Mariana
Trench” passage. Students would see
graphic illustrations to help them
create mental imageries to connect
with the text.
No instruction/ Same materials.
Students would be asked to read
carefully and answer questions.
Correct answers were shared.
2 Representational instruction using
mental pictures and self-generated
drawings (2 days). Use “Volcanic
Eruptions” passage. Students draw
their own illustrations to connect
with the text.
No instruction/ Same materials.
Students would be asked to read
carefully and answer questions.
Correct answers were shared.
3 Representational instruction using
mental pictures and think-along
ideas (Day 1:
“Earthquake Resistant Buildings,”
Day 2: “Is There Life on Mars?”).
Students use think-along ideas to
connect with the text passage.
No instruction/ Same materials.
Students would be asked to read
carefully and answer questions.
Correct answers were shared.
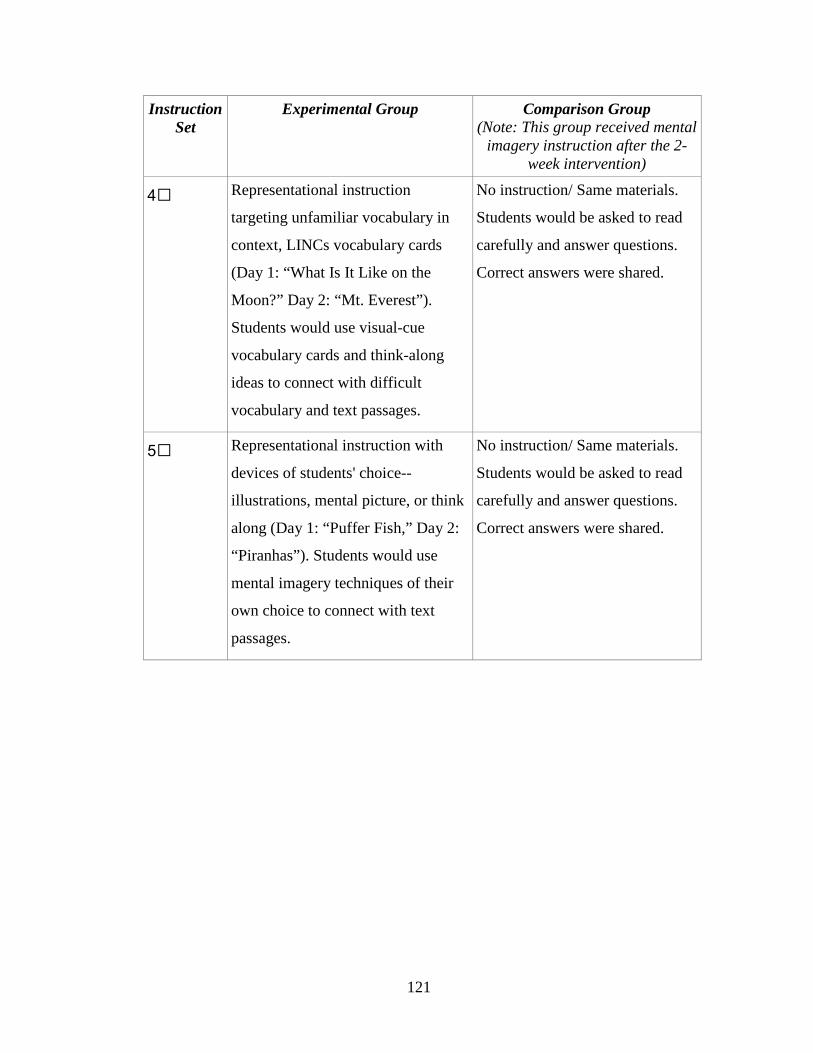
121
Instruction Set
Experimental Group Comparison Group (Note: This group received mental
imagery instruction after the 2-week intervention)
4 Representational instruction
targeting unfamiliar vocabulary in
context, LINCs vocabulary cards
(Day 1: “What Is It Like on the
Moon?” Day 2: “Mt. Everest”).
Students would use visual-cue
vocabulary cards and think-along
ideas to connect with difficult
vocabulary and text passages.
No instruction/ Same materials.
Students would be asked to read
carefully and answer questions.
Correct answers were shared.
5 Representational instruction with
devices of students' choice--
illustrations, mental picture, or think
along (Day 1: “Puffer Fish,” Day 2:
“Piranhas”). Students would use
mental imagery techniques of their
own choice to connect with text
passages.
No instruction/ Same materials.
Students would be asked to read
carefully and answer questions.
Correct answers were shared.
122
Follow-up Instruction
Experimental Group
After the two-week instruction, students in the experimental group continued to
receive mental imagery prompts about two to three times a week in their regular
reading instruction. They were asked to write think-along ideas or create mental
images with parts of the text.
Comparison Group
Students in the comparison group were also taught the same mental imagery
strategies experimental students had received as outlined in the lesson plans, except
that the regular text book and other classroom resources were used for instruction.
Mental imagery strategies were targeted all year. At the end of the school year,
students in all four classes used one more instructional passage titled “Bees and
Wasps” to prepared them for one more task– the second posttest titled “Butterflies
and Moths” (Posttest 2).
The instructional methods presented in this study had been tried previously. The
two-week instructional period was smooth-flowing and fit in the regular curriculum
similar to a thematic unit. During the school year 2005-5006, I conducted an informal
study to investigate the effects of mental imagery instruction on science expository
texts. Findings suggest that the Honors students made gains in the SR portion of the
comprehension task and the Basic students made gains in the BCR portion of the
comprehension task. These findings were encouraging and established part of the
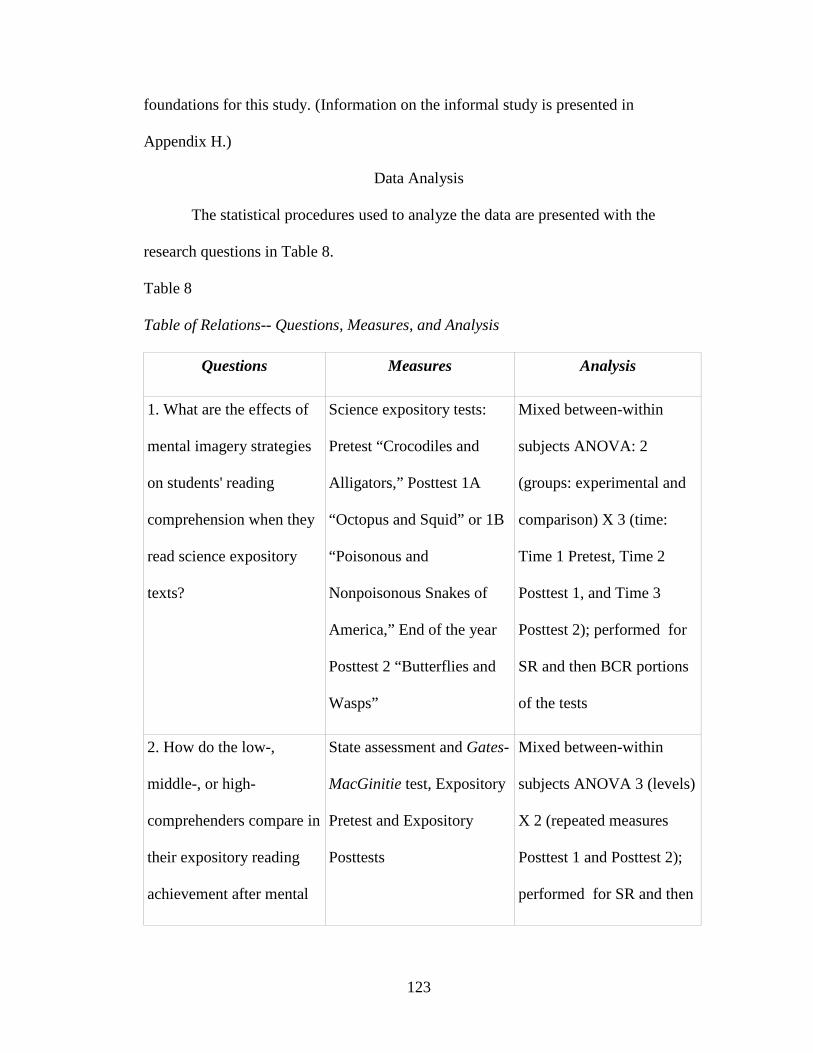
123
foundations for this study. (Information on the informal study is presented in
Appendix H.)
Data Analysis
The statistical procedures used to analyze the data are presented with the
research questions in Table 8.
Table 8
Table of Relations-- Questions, Measures, and Analysis
Questions Measures Analysis
1. What are the effects of
mental imagery strategies
on students' reading
comprehension when they
read science expository
texts?
Science expository tests:
Pretest “Crocodiles and
Alligators,” Posttest 1A
“Octopus and Squid” or 1B
“Poisonous and
Nonpoisonous Snakes of
America,” End of the year
Posttest 2 “Butterflies and
Wasps”
Mixed between-within
subjects ANOVA: 2
(groups: experimental and
comparison) X 3 (time:
Time 1 Pretest, Time 2
Posttest 1, and Time 3
Posttest 2); performed for
SR and then BCR portions
of the tests
2. How do the low-,
middle-, or high-
comprehenders compare in
their expository reading
achievement after mental
State assessment and Gates-
MacGinitie test, Expository
Pretest and Expository
Posttests
Mixed between-within
subjects ANOVA 3 (levels)
X 2 (repeated measures
Posttest 1 and Posttest 2);
performed for SR and then
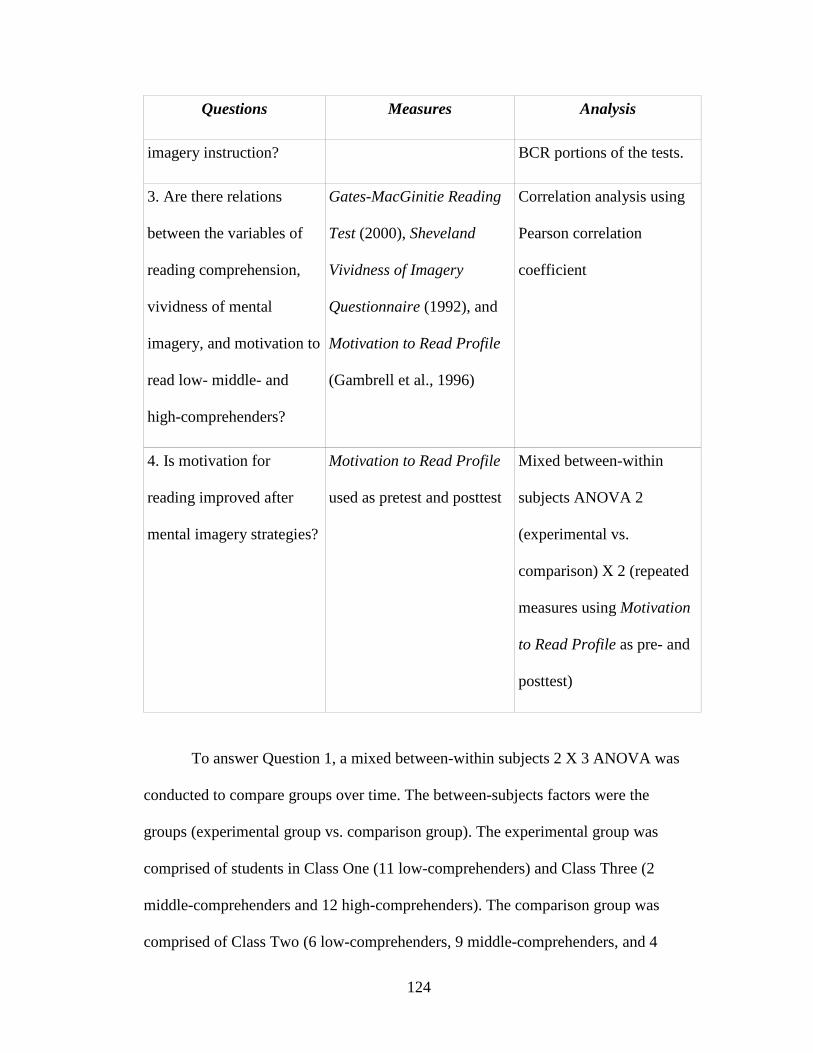
124
Questions Measures Analysis
imagery instruction? BCR portions of the tests.
3. Are there relations
between the variables of
reading comprehension,
vividness of mental
imagery, and motivation to
read low- middle- and
high-comprehenders?
Gates-MacGinitie Reading
Test (2000), Sheveland
Vividness of Imagery
Questionnaire (1992), and
Motivation to Read Profile
(Gambrell et al., 1996)
Correlation analysis using
Pearson correlation
coefficient
4. Is motivation for
reading improved after
mental imagery strategies?
Motivation to Read Profile
used as pretest and posttest
Mixed between-within
subjects ANOVA 2
(experimental vs.
comparison) X 2 (repeated
measures using Motivation
to Read Profile as pre- and
posttest)
To answer Question 1, a mixed between-within subjects 2 X 3 ANOVA was
conducted to compare groups over time. The between-subjects factors were the
groups (experimental group vs. comparison group). The experimental group was
comprised of students in Class One (11 low-comprehenders) and Class Three (2
middle-comprehenders and 12 high-comprehenders). The comparison group was
comprised of Class Two (6 low-comprehenders, 9 middle-comprehenders, and 4
125
high-comprehenders) and Class Four (1 middle-comprehender and 11 high-
comprehenders). The within-subject factor or repeated factor was the time that the
students were tested on expository reading comprehension: Time 1 (prior to the
intervention), Time 2 (following the intervention), and Time 3 (end-of-year). Scores
for students who were absent at the end of the year or had missing data were not
included in the final analyses. The analysis was conducted first on the selected
response (SR) portion of the tests and then the brief constructed response (BCR)
portion of the tests.
The initial plan of this study was to use the two posttests, Posttest 1 “Octopus
and Squid” and Posttest 2 “Butterflies and Moths,” developed in the 2007-2008
school year as the evaluative measures. The “Octopus and Squid” test would be used
immediately as the posttest after the ten-day instruction, and the “Butterflies and
Moths” test would be used at the end of the school year as a final assessment. In the
actual study, Class Three and Class Four were accidentally given the posttest
developed in 2005-2006, “Poisonous and Nonpoisonous Snakes of America,” because
it had not been pulled out from the testing information from the year before. I decided
to go ahead analyze the data and see how the students performed anyway. I made this
decision mainly because the timing is important, and there was no extra time to retest
the students if the program were to move forward. In addition, the data from the
informal study conducted in the 2005-2006 school year seemed promising enough.
Even though I was aware that the “Snakes” passage was longer and organized
somewhat differently when compared to the Pretest, I did not think that it would
make that much of a difference. Furthermore, these students would have another
126
chance to show their reading competence using the posttest “Butterflies and Moths”
at the end of the school year. Therefore, for the first expository posttest, Class One
and Two used Posttest 1A, and Class Three and Four, the Honors classes, used
Posttest 1B. All classes used the final assessment “Butterflies and Moths” as Posttest
2.
The final assessment (Posttest 2: “Butterflies and Moths”) given at the end of
the school year measured sustained effects for the experimental group and assessed
gains for the comparison group, which had been taught the mental imagery strategies
since the third quarter of the school year.
For Question 2, “How do the low-, middle-, or high-comprehenders compare
in their reading achievement after mental imagery instruction?” a mixed between-
within-subjects 3 X 2 ANOVA was conducted to compare types of comprehenders
over time. The between-subjects factor was the level (3 levels of low-, middle-, and
high-comprehenders), and the within-subjects factor or repeated factor was the time:
Time 1 (Posttest 1 following two-week intervention) and Time 2 (Posttest 2, end-of-
year assessment). Analysis was done for both the selected response part of the test
(SR) and the essay or brief constructed response (BCR) portion of the test. For this
analysis, the time between Posttest 1 and Posttest 2 established a period when all
students-- low-, middle-, and high-comprehenders-- have received mental imagery
instruction.
Question 3, “Are there relations between the variables of reading
comprehension, vividness of mental imagery posttest, and motivation to read for
low-, middle- and high-comprehenders?” was answered by data analysis using the
127
Pearson correlation coefficient. The Pearson correlation coefficient is a parametric
technique using continuous data, such as the scores for the various measures (Huck,
1974, p. 31). Data analysis using this method showed the three components of
correlations: (1) the Gates-MacGinitie Reading Test (2000) scores, (2) the Sheveland
Vividness of Imagery Questionnaire (1992) pretest, and (3) the Motivation to Read
Profile (Gambrell et al. 1996) pretest, and how they relate to the three types of
readers: low-, middle-, and high-comprehenders.
Question 4, “Is motivation to read improved after mental imagery instruction
using science expository texts?” was answered by using a mixed between-within
subjects 2 X 2 ANOVA to compare groups over time. The between-subjects factor
was the group (experimental vs. comparison), and the within-subject or repeated
factor was time (measures on the Motivation to Read Profile, Gambrell et al., 1996,
used both before intervention and after intervention).
Effect Size Calculations
Where indicated by statistically significant results, effect size was calculated
by obtaining partial Eta squared (ŋp2) using the sum of squares of the effect divided by
the sum of squares of the effect and sum of squares error. Partial Eta squared is the
proportion of the effect and the error variance that is attributed to the effect.
Evaluating the effect size was based on the guidelines proposed by Cohen (1988): .01
= small effect, .06 = moderate effect, and .14 = large effect.
128
Summary
This study employed a quasi-experimental pretest-posttest group design to
investigate the effects of mental imagery instruction using science expository texts on
middle school student. The sample was comprised of 56 sixth-grade students from a
predominantly white middle-class rural-suburban school in a Mid-Atlantic region.
Two teachers were involved with this investigation; each had two reading classes.
Each teacher randomly assigned one class to be in the experimental group and the
other to be in the comparison group. It was decided that the first reading class each
teacher taught would be assigned as experimental, and the other class would be
assigned as comparison. All classes took the pre-assessments. Students in the
experimental group were taught mental imagery techniques as comprehension
strategies for two weeks (10 sessions), using eight different on-grade-level science
expository passages with practice questions. Students in the comparison group had
the same time for the expository text unit, but were told mainly to read carefully and
answer the questions carefully. Data were collected following the intervention. The
comparison students then received mental imagery instruction. Throughout the rest of
the school year, all students were prompted at least two to three times a week to use
mental imagery strategies. A follow-up expository reading comprehension test was
given at the end of the school year, and data were collected for analysis.
To investigate whether mental imagery instruction using science expository
texts had helped students improve reading comprehension, a mixed between-within
subjects 2 (experimental vs. comparison) X 3 (Time 1, Time 2, Time 3) ANOVA
129
was performed for data analysis for both the SR and BCR portions of the expository
comprehension tests. To compare the expository reading comprehension performance
of the three levels of comprehenders (low-, middle-, and high-), a mixed between-
within-subjects 3 (levels) X 2 (Time 1 & Time 2) ANOVA was conducted to analyze
any differences in performance for the three types of comprehenders over time.
Additionally, effect sizes using partial Eta squared were calculated to support the
interpretation of the statistical analysis conducted on the expository comprehension
posttest measures. To investigate the relationship between the variables of reading
achievement, vividness of imagery, and motivation to read for the three levels of
comprehenders, the Pearson correlation analysis was conducted. Measures used for
this analysis were the Gates-MacGinitie Reading Test, Sheveland Vividness of
Imagery Questionnaire (1992), and Motivation to Read Profile (Gambrell et al.
1996). To investigate whether students improved in their motivation for reading after
mental imagery strategies with expository text, a mixed between-within subjects 2
(experimental vs. comparison) X 2 (repeated measures) analysis of variance was
used.
130
CHAPTER IV
RESULTS
Introduction
The purpose of this study was to investigate the effects of mental imagery as a
comprehension strategy for middle school students using science expository texts.
This chapter presents data and analysis, with statistical analysis corresponding to the
research questions: (a) What are the effects of mental imagery strategies on students’
reading comprehension achievement when they read science expository texts? (b)
How do the low-, middle-, or high- comprehenders compare in their reading
achievement after mental imagery instruction? (c) Are there relations between the
variables of reading comprehension, vividness of mental imagery, and motivation to
read for low-, middle- and high-comprehenders? (d) Is motivation to read improved
after mental imagery instruction using science expository texts?
In each section, tables and graphs reporting the results supplement the
explanation of the analysis. For each measure, statistical significance was set at an
alpha level of .05. This chapter begins with a description of the initial levels of the
students in the various classes. Then the results of each research question are
presented. This chapter concludes with a summary.
The Initial Performance of the Students
The students' initial performance was assessed with two measures: The Gates-
MacGinitie Reading Test (2000) and the expository pretest, “Crocodiles and
Alligators.” The scores indicated that three of the classes were quite different. Class
One, experimental group, was a below-grade-level class. This class was set up to be a
131
Basic class with a small class size (only 14 students). Class Two, comparison group,
was an on-grade-level class with a total number of 23 students. Class Three was an
Honors class of 24 students. Class Four was an Honors class of 20 students. Some
students and their parents chose not to participate in this study. The students who did
not have a signed participation form received the same treatment; however, their
scores were not included in the analyses. All data reporting on these classes reflected
only the scores of students who agreed to participate and whose parents agreed for
them to participate. Participation in this study means to allow the scores to be used for
analysis. The “Expository Unit” was designed as a classroom unit as a supplement to
the sixth-grade reading program since the textbooks contained so little expository
texts. As a result, the student numbers reported on the analyses were smaller than the
actual class size.
The number of participants and average reading performance by class based
on participating students were as follows:
Class One, Experimental Group One (n = 11): Based on the Gates-MacGinitie
Reading Test (2000), the mean reading grade level equivalence for Class One was
3.4. The selected response (SR) mean score for Class One using the science
expository pretest was 47.27% (SD = 16.79), and the brief constructed response
(BCR) mean score was 40.91% (SD = 30.15).
Class Two, Comparison Group One (n = 19): Based on the Gates-MacGinitie
Reading Test (2000), the mean reading grade level equivalence for Class Two was
6.35. The SR mean score for Class Two using the science expository pretest was
70.00% (SD = 15.28), and the BCR mean score was 69.74% (SD = 34.94).
132
Class Three, Experimental Group Two (n = 14): Based on the Gates-
MacGinitie Reading Test (2000), the mean reading grade level equivalence for Class
Three was 11.5. The SR mean score for Class Three using the science expository
pretest was 83.57% (SD = 14.99), and the BCR mean score was 89.29% (SD =
16.16).
Class Four, Comparison Group Two (n = 12): Based on the Gates-MacGinitie
Reading Test (2000), the mean reading grade level equivalence for Class Four was
9.46. The SR mean score for Class Four using the science expository pretest was
80.00% (SD = 10.44), and the BCR mean score was 95.83% (SD = 9.73).
In some cases, a few students were absent and did not make up certain tests, or
they did not come to school during the last three days of school and missed the last
assessment. The scores of those missing students were not used as part of the
analysis.
133
Students' Performance on Reading Comprehension for Expository Text
Four comprehension tests using science expository passages written on sixth-
grade reading level were used in this study. Prior to the intervention, all students took
the pretest “Crocodiles and Alligators.” Following the intervention, Class One and
Two used Posttest 1A, “Octopus and Squid,” while Class Three and Four used
Posttest 1B, “Poisonous and Nonpoisonous Snakes of America.” At the end of the
school year, all students took the Posttest 2, “Butterflies and Moths.” These
comprehension tests are furthermore divided into two portions: Selected Response
(SR) and Brief Constructed Response (BCR) or short essay.
Results for Question 1
What are the effects of mental imagery strategies on students' reading
comprehension when they read science expository texts? To answer this question, a
mixed between-within subjects 2 X 3 analysis of variance (ANOVA) was conducted
to compare groups over time. The between-subjects factor was the group
(experimental group vs. comparison group): the experimental group was comprised of
students in Class One (a class with low-comprehenders) and Class Three (a class with
mostly high-comprehenders); the comparison group was comprised of students in
Class Two (a class with mostly middle-comprehenders) and Class Four (a class with
mostly high-comprehenders). The within-subject or repeated factor was the time that
the students were tested on expository reading comprehension: Time 1 (prior to the
intervention), Time 2 (following the intervention), and Time 3 (end-of-year). The
analysis was conducted first for the selected response (SR) portion of the test, and
then the brief constructed response (BCR) portion of the test.
134
Expository Reading Comprehension Results for Selected Response
The means and standard deviations for the SR portion of the expository
comprehension tests are presented in Table 9. Results indicated that there was a
statistically significant interaction for time and group [Wilks' Lambda = .863, F (2,
53) = 4.210, p =.020, partial Eta squared = .137]. Using the commonly used
guidelines for interpreting the effect size indicated by partial Eta squared proposed by
Cohen (1988)– .01 = small, .06 = moderate, .14 = large effect – this result suggests a
moderate effect size. The statistically significant interaction of time and group on the
mental imagery strategies using expository test indicated differential change in the
two groups' application of strategies over the three time periods, from the Pretest to
Posttest 1, and to Posttest 2 at the end of the year.
Figure 1 shows a graph of the interaction. The experimental group was
comprised of 11 low-comprehenders, 2 middle-comprehenders, and 12 high-
comprehenders. This group did not appear to have made any gains immediately after
the mental imagery instruction, but appeared to have made gains by the end of the
school year. The comparison group was comprised of 6 low-comprehenders, 10
middle-comprehenders, and 15 high-comprehenders. This group also did not appear
to make much gain immediately after the two-week of practice in which they received
no mental imagery instruction. However, the comparison group was taught the mental
imagery strategies during the third quarter and made gains by the end of the school
year. Thus, both groups appeared to make gains between Posttest 1 and Posttest 2,
once both had received mental imagery instruction. The comparison group, which by
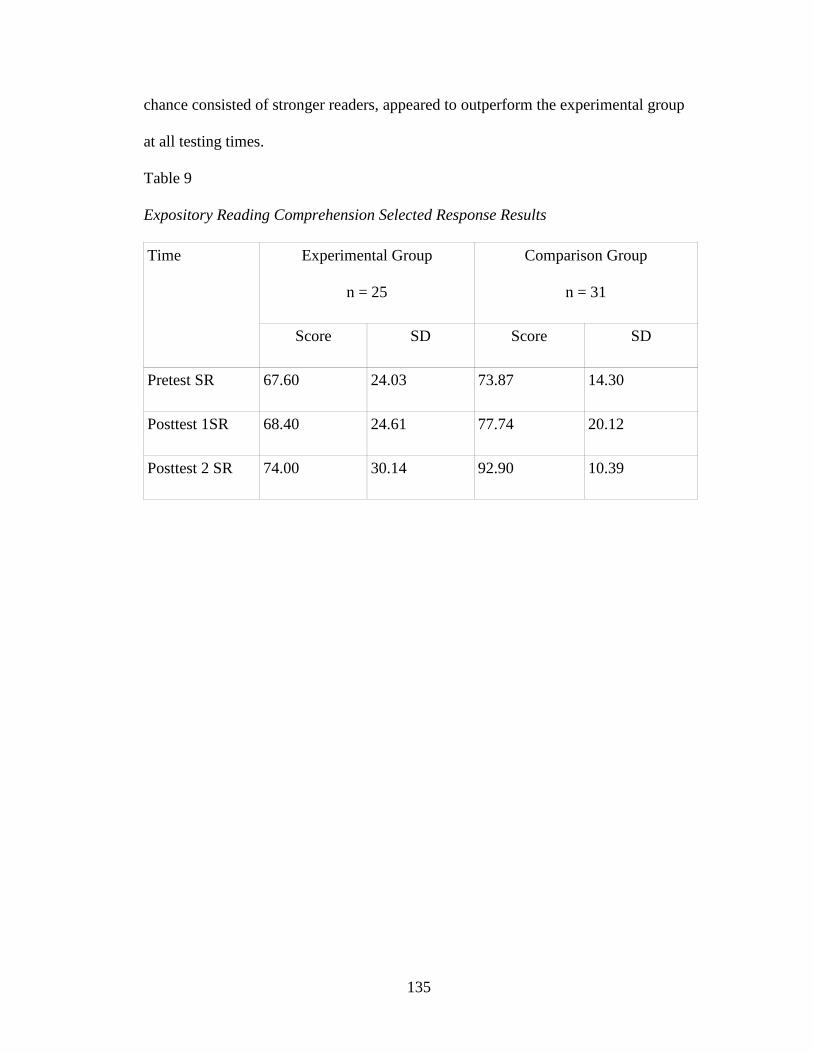
135
chance consisted of stronger readers, appeared to outperform the experimental group
at all testing times.
Table 9
Expository Reading Comprehension Selected Response Results
Time Experimental Group
n = 25
Comparison Group
n = 31
Score SD Score SD
Pretest SR 67.60 24.03 73.87 14.30
Posttest 1SR 68.40 24.61 77.74 20.12
Posttest 2 SR 74.00 30.14 92.90 10.39
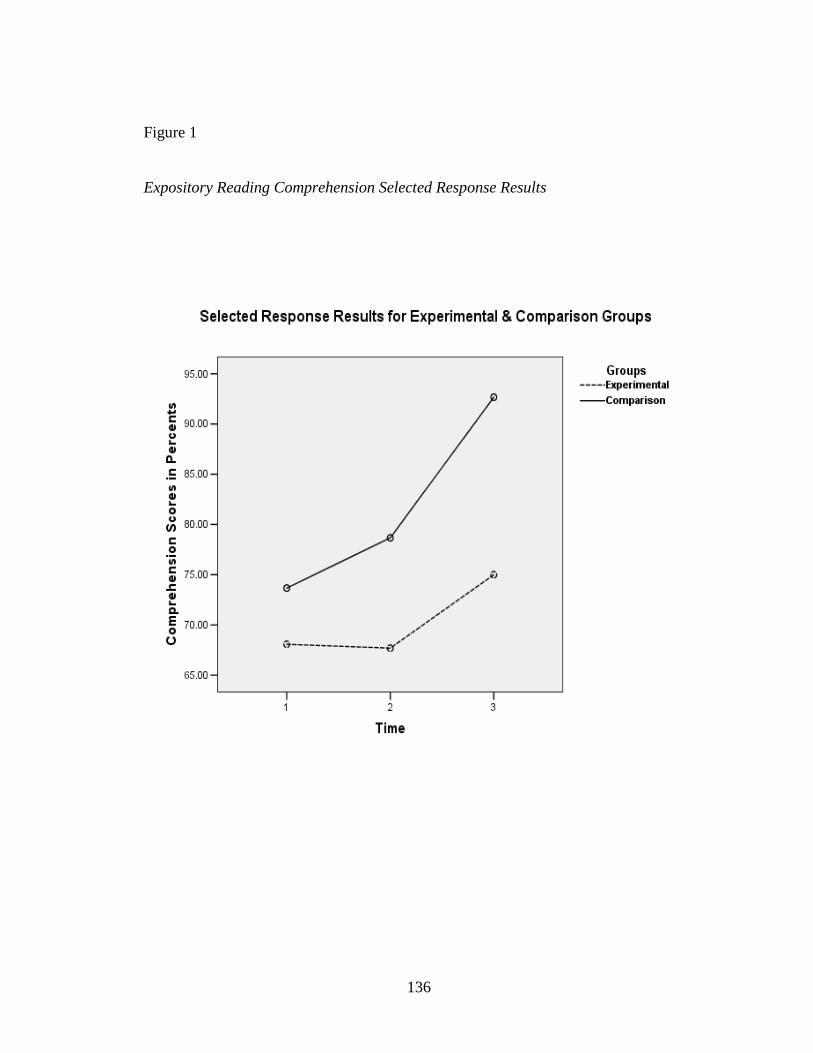
136
Figure 1
Expository Reading Comprehension Selected Response Results
137
Expository Reading Comprehension Results for Brief Constructed Response
Results indicated that there were no significant changes in scores over time for
either group (Experimental and Comparison) for the Brief Constructed Response
(BCR) portion of the expository tests. The means and standard deviations for the
BCR portion of the expository comprehension tests are presented in Table 10. Figure
2 presents graphic information for this analysis.
Data analysis for the BCR portion of the comprehension task indicated no
statistically significant interaction for time and group [Wilks' Lambda = .954, F (2,
53) = 1.291, p = .283, partial Eta squared = .046]. There was also no statistically
significant main effect on BCR scores for time [Wilks' Lambda = .918, F (2, 53) =
2.369, p = .103 partial Eta squared = .082], nor was there a statistically significant
main effect for group [F (1, 54) = 1.053, p = .310, partial Eta squared = .019]. The
mean BCR scores of the Experimental Group went from 68.00% to 81.00%; however,
the change over time was not statistically significant. The comparison group's BCR
mean score dropped a bit immediately after the two-week practice, during which time
they had no mental imagery instruction, but their BCR mean score went back up on
Posttest 2 at the end of the year. Again, the changes in scores were not statistically
significant.
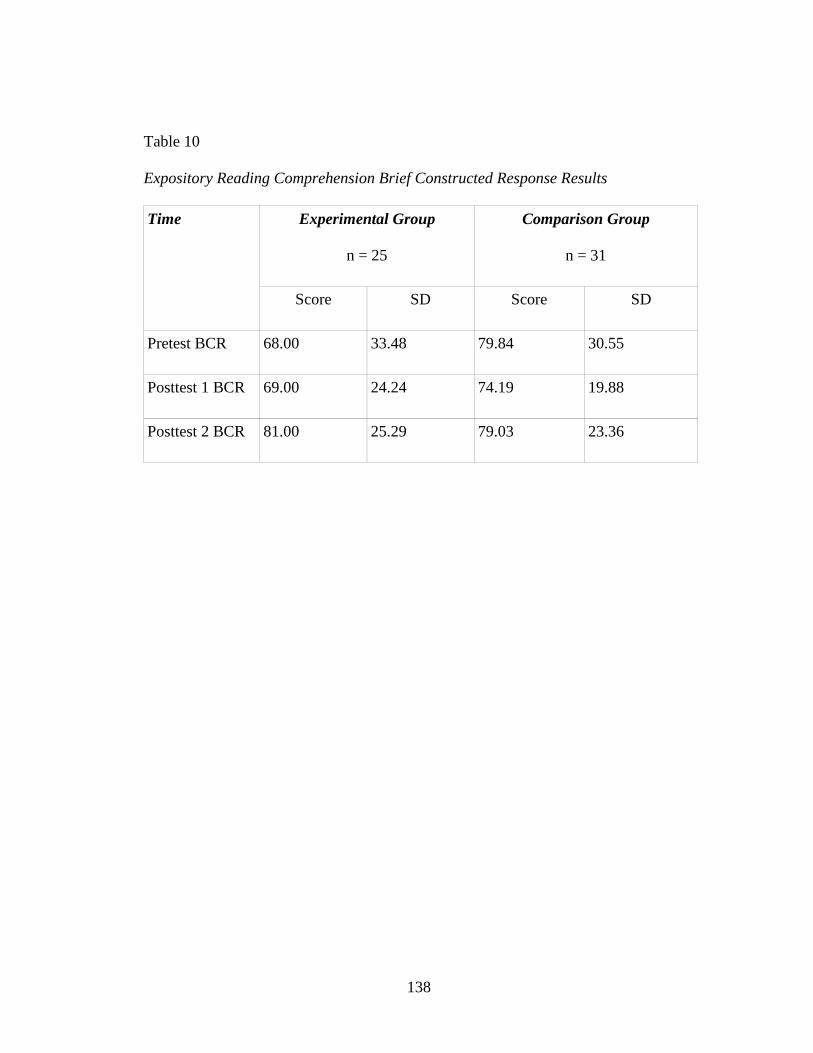
138
Table 10
Expository Reading Comprehension Brief Constructed Response Results
Time Experimental Group
n = 25
Comparison Group
n = 31
Score SD Score SD
Pretest BCR 68.00 33.48 79.84 30.55
Posttest 1 BCR 69.00 24.24 74.19 19.88
Posttest 2 BCR 81.00 25.29 79.03 23.36
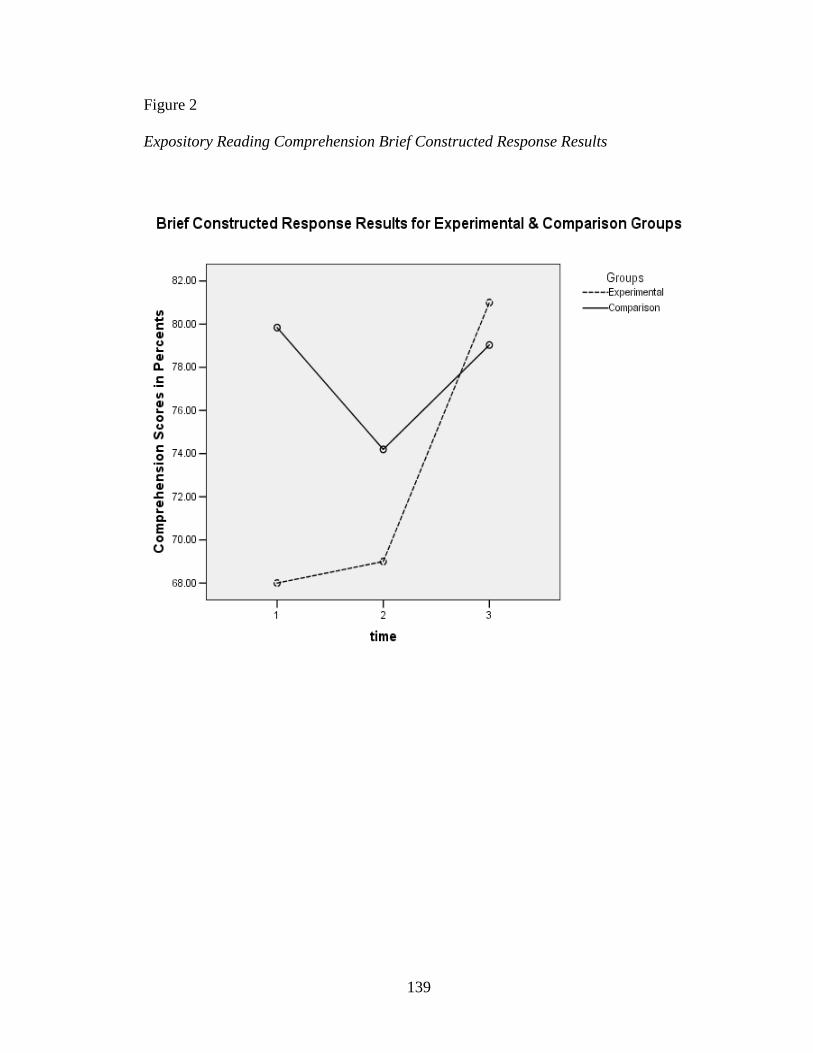
139
Figure 2
Expository Reading Comprehension Brief Constructed Response Results
140
Results for Question 2
How do the low-, middle-, or high-comprehenders compare in their expository
reading achievement after mental imagery instruction? A mixed between-within
subjects 3 X 2 ANOVA was conducted to investigate differences in performance for
the three types of comprehenders over time. The between-subjects factor was the
three types of comprehenders (low-, middle-, and high-comprehenders). The within-
subjects or repeated factor was the time that the students were tested on expository
reading comprehension: Time 1 (Posttest 1), Time 2 (Posttest 2 at the end of the
school year). The time between Posttest 1 and Posttest 2 was the period when all
students (low-, middle-, and high-comprehenders) had received mental imagery
instruction. The analysis was conducted first for the selected response (SR) portion of
the test, and then for the brief constructed response (BCR) portion of the test.
Selected Response Results for the Type of Comprehenders
The SR mean scores and standard deviations for the type of comprehenders
are presented in Table 11. Figure 3 shows a graph of the results. Results indicated
that there was no statistically significant interaction for time and type of
comprehenders [Wilks' Lambda = .972, F (2, 53) = .755, p = .475, partial Eta squared
= .028]. Data analysis for the SR portion of the comprehension tests indicated that
there was a statistically significant main effect for time [Wilks' Lambda = .717, F (1,
53) = 20.887, p =.000, partial Eta squared = .283]. This result suggests a large effect
size. The statistically significant result for time indicated that the three levels of
comprehenders scored differently from Posttest 1 to Posttest 2. After Posttest 1, all
participants had received mental imagery instruction. The students appeared to have
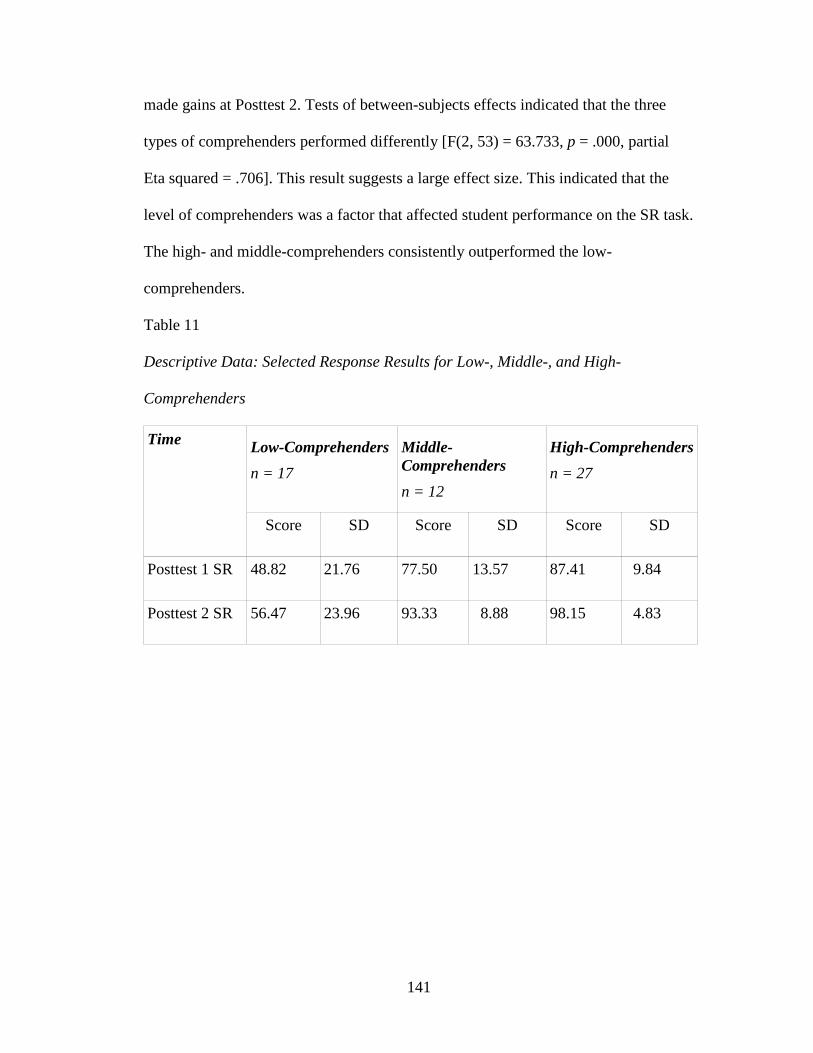
141
made gains at Posttest 2. Tests of between-subjects effects indicated that the three
types of comprehenders performed differently [F(2, 53) = 63.733, p = .000, partial
Eta squared = .706]. This result suggests a large effect size. This indicated that the
level of comprehenders was a factor that affected student performance on the SR task.
The high- and middle-comprehenders consistently outperformed the low-
comprehenders.
Table 11
Descriptive Data: Selected Response Results for Low-, Middle-, and High-
Comprehenders
Time Low-Comprehenders
n = 17
Middle-Comprehenders
n = 12
High-Comprehenders
n = 27
Score SD Score SD Score SD
Posttest 1 SR 48.82 21.76 77.50 13.57 87.41 9.84
Posttest 2 SR 56.47 23.96 93.33 8.88 98.15 4.83
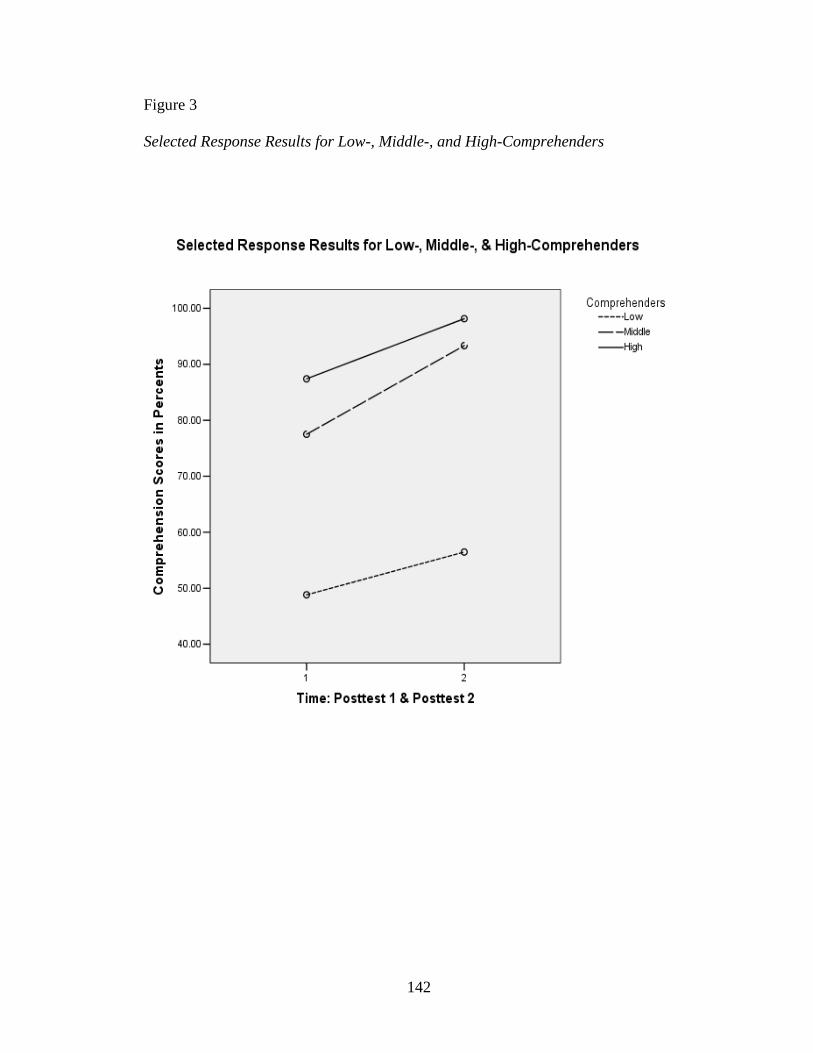
142
Figure 3
Selected Response Results for Low-, Middle-, and High-Comprehenders
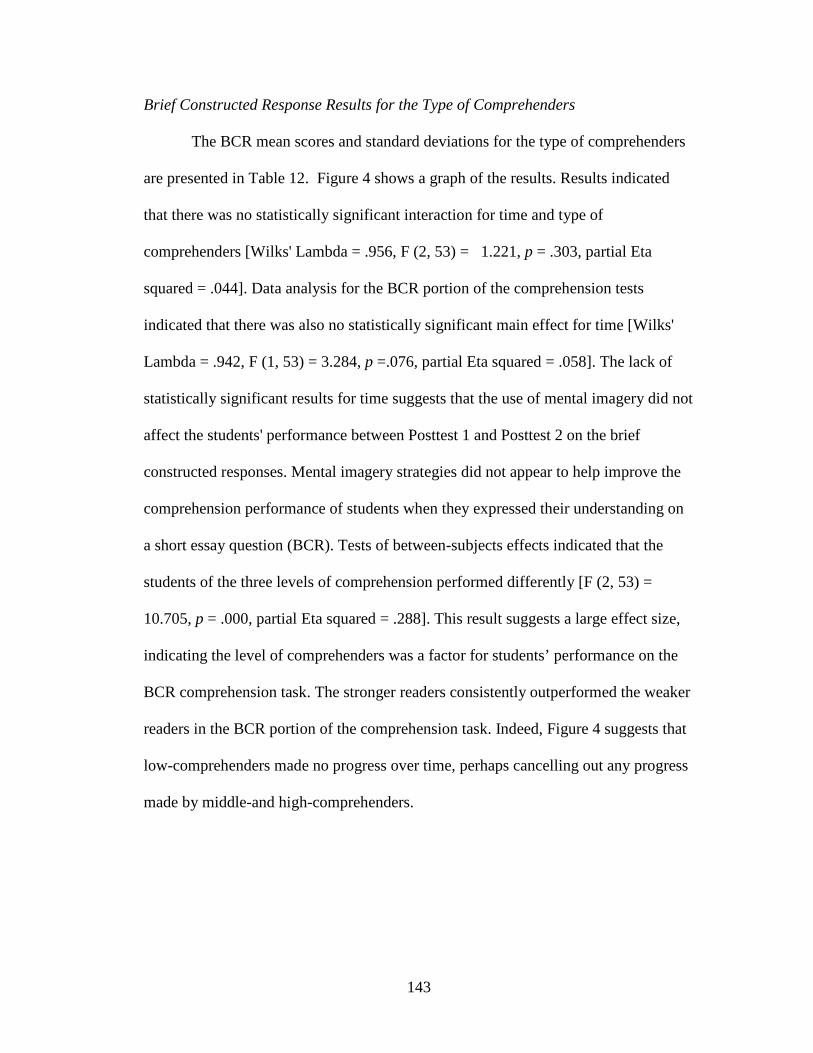
143
Brief Constructed Response Results for the Type of Comprehenders
The BCR mean scores and standard deviations for the type of comprehenders
are presented in Table 12. Figure 4 shows a graph of the results. Results indicated
that there was no statistically significant interaction for time and type of
comprehenders [Wilks' Lambda = .956, F (2, 53) = 1.221, p = .303, partial Eta
squared = .044]. Data analysis for the BCR portion of the comprehension tests
indicated that there was also no statistically significant main effect for time [Wilks'
Lambda = .942, F (1, 53) = 3.284, p =.076, partial Eta squared = .058]. The lack of
statistically significant results for time suggests that the use of mental imagery did not
affect the students' performance between Posttest 1 and Posttest 2 on the brief
constructed responses. Mental imagery strategies did not appear to help improve the
comprehension performance of students when they expressed their understanding on
a short essay question (BCR). Tests of between-subjects effects indicated that the
students of the three levels of comprehension performed differently [F (2, 53) =
10.705, p = .000, partial Eta squared = .288]. This result suggests a large effect size,
indicating the level of comprehenders was a factor for students’ performance on the
BCR comprehension task. The stronger readers consistently outperformed the weaker
readers in the BCR portion of the comprehension task. Indeed, Figure 4 suggests that
low-comprehenders made no progress over time, perhaps cancelling out any progress
made by middle-and high-comprehenders.
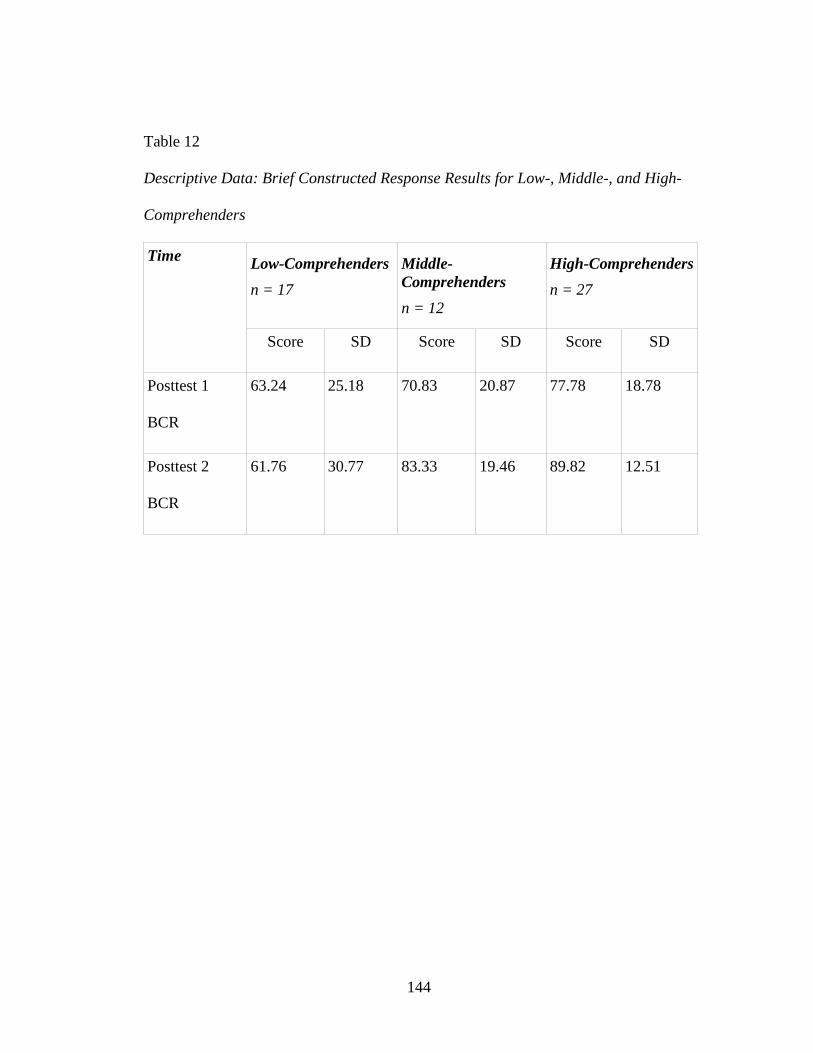
144
Table 12
Descriptive Data: Brief Constructed Response Results for Low-, Middle-, and High-
Comprehenders
Time Low-Comprehenders
n = 17
Middle-Comprehenders
n = 12
High-Comprehenders
n = 27
Score SD Score SD Score SD
Posttest 1
BCR
63.24 25.18 70.83 20.87 77.78 18.78
Posttest 2
BCR
61.76 30.77 83.33 19.46 89.82 12.51
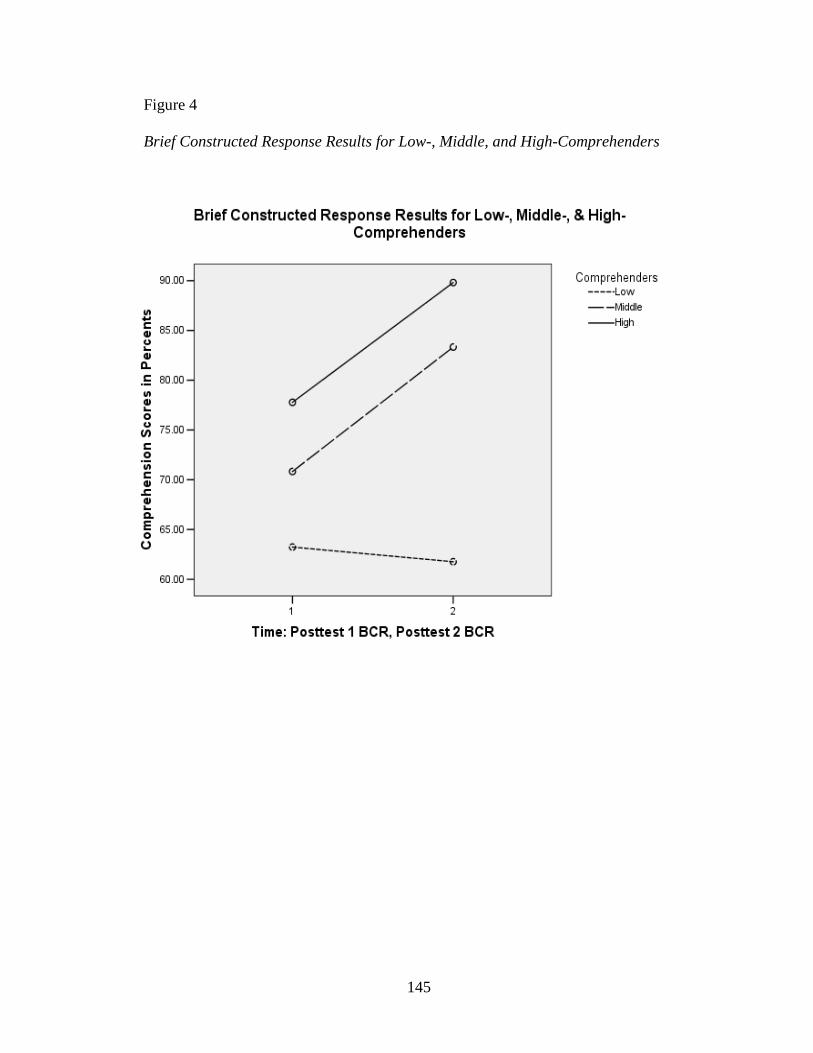
145
Figure 4
Brief Constructed Response Results for Low-, Middle, and High-Comprehenders
146
Results for Question 3
Are there relationships between the variables of comprehension achievement,
vividness of mental imagery, motivation to read, and type of comprehenders? To
investigate the relationships between the variables of comprehension achievement,
vividness of mental imagery, and motivation to read for each type of comprehender,
the Pearson product-moment correlation coefficient was used. The variable selected
for reading comprehension at the beginning of the study was the Gates-MacGinitie
Reading Test (2000) since it is recognized as a reliable and valid measure for overall
reading achievement. The second variable selected for this analysis was the
Sheveland Vividness of Mental Imagery Questionnaire (1992) pretest because the
scores represented students' self-reported ratings of the vividness of the images they
formed in their minds prior to the investigation. The third variable selected for this
analysis was the Motivation to Read Profile (Gambrell et al., 1996) pretest as it
reported students' value of reading and motivations for reading before this study. The
variables were correlated with the three levels of comprehenders. Preliminary
analyses were performed to ensure no violations of the assumptions of normality,
linearity, and homoscedasticity. Descriptive data are presented in Table 13. The
numbers for this analysis were smaller than the numbers of students who participated
due to missing Gates-MacGinitie Reading Test data on several students.
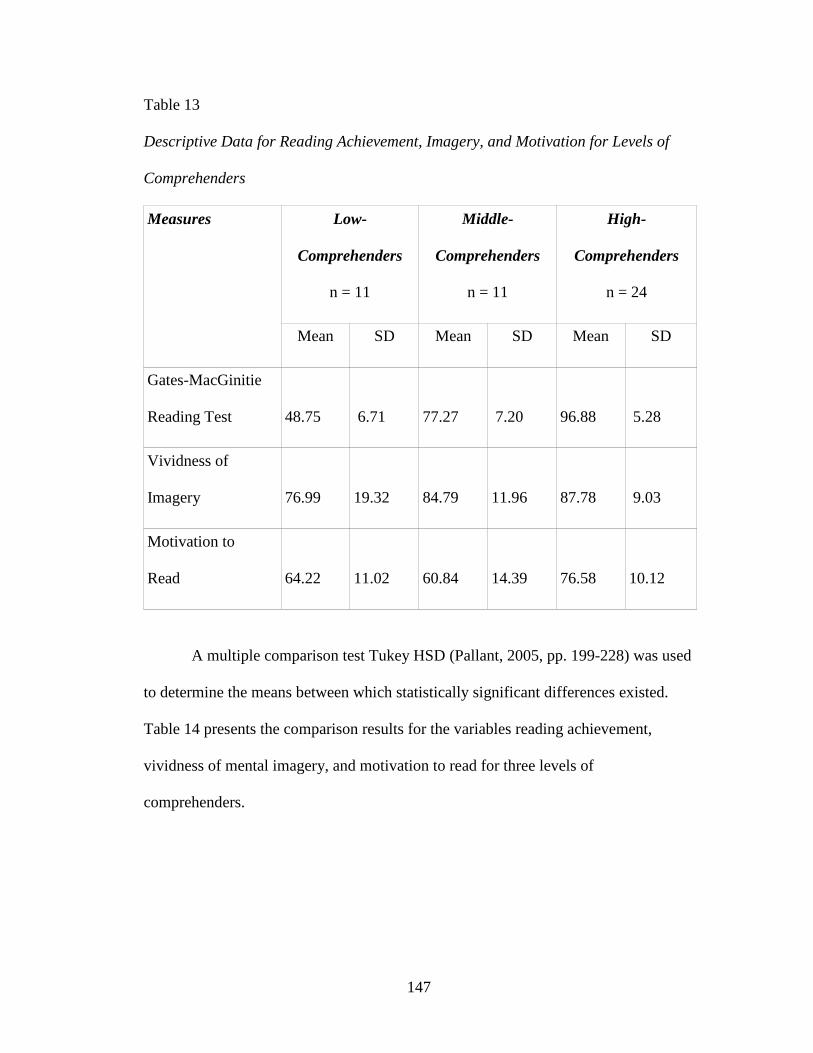
147
Table 13
Descriptive Data for Reading Achievement, Imagery, and Motivation for Levels of
Comprehenders
Measures Low-
Comprehenders
n = 11
Middle-
Comprehenders
n = 11
High-
Comprehenders
n = 24
Mean SD Mean SD Mean SD
Gates-MacGinitie
Reading Test
48.75
6.71
77.27
7.20
96.88
5.28
Vividness of
Imagery
76.99
19.32
84.79
11.96
87.78
9.03
Motivation to
Read
64.22
11.02
60.84
14.39
76.58
10.12
A multiple comparison test Tukey HSD (Pallant, 2005, pp. 199-228) was used
to determine the means between which statistically significant differences existed.
Table 14 presents the comparison results for the variables reading achievement,
vividness of mental imagery, and motivation to read for three levels of
comprehenders.
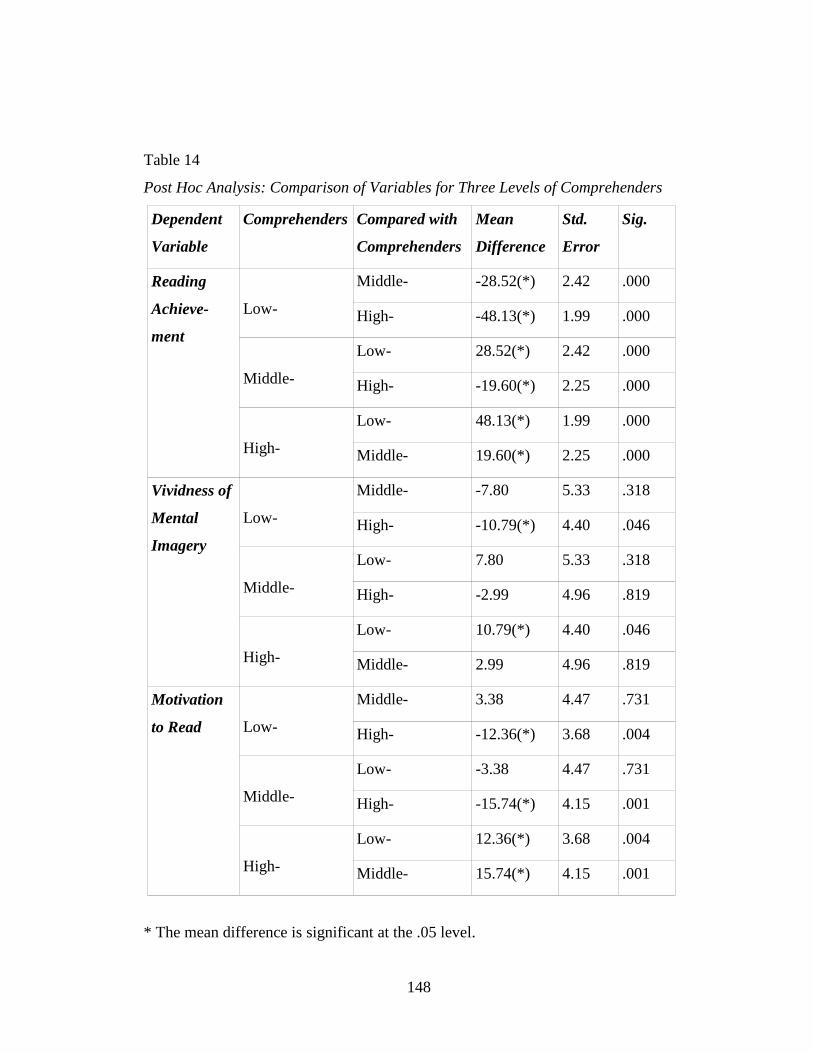
148
Table 14
Post Hoc Analysis: Comparison of Variables for Three Levels of Comprehenders
Dependent
Variable
Comprehenders Compared with
Comprehenders
Mean
Difference
Std.
Error
Sig.
Reading
Achieve-
ment
Low-
Middle- -28.52(*) 2.42 .000
High- -48.13(*) 1.99 .000
Middle-
Low- 28.52(*) 2.42 .000
High- -19.60(*) 2.25 .000
High-
Low- 48.13(*) 1.99 .000
Middle- 19.60(*) 2.25 .000
Vividness of
Mental
Imagery
Low-
Middle- -7.80 5.33 .318
High- -10.79(*) 4.40 .046
Middle-
Low- 7.80 5.33 .318
High- -2.99 4.96 .819
High-
Low- 10.79(*) 4.40 .046
Middle- 2.99 4.96 .819
Motivation
to Read
Low-
Middle- 3.38 4.47 .731
High- -12.36(*) 3.68 .004
Middle-
Low- -3.38 4.47 .731
High- -15.74(*) 4.15 .001
High-
Low- 12.36(*) 3.68 .004
Middle- 15.74(*) 4.15 .001
* The mean difference is significant at the .05 level.
149
Results indicated that the differences in reading achievement mean scores for
the three levels of comprehenders based on the Gates-MacGinitie Reading Test were
statistically significant. Furthermore, low-comprehenders had statistically significant
lower mean scores on the Motivation to Read Profile and the Sheveland Vividness of
Imagery Questionnaire when compared to the mean scores of the high-
comprehenders. However, their mean scores on the Motivation to Read Profile and
the Sheveland Vividness of Imagery Questionnaire did not show statistically
significant differences when compared to the mean scores of the middle-
comprehenders. The difference in mean scores on the Sheveland Vividness of Imagery
Questionnaire between middle-comprehenders and the other two types of
comprehenders was not statistically significantly; however, the difference in mean
scores on the Motivation to Read Profile when comparing scores of the middle-
comprehenders to the scores of the high-comprehenders was statistically significant.
High-comprehenders' mean scores on the Gates-MacGinitie Reading Test and
Motivation to Read were higher when compared to the mean scores of the other two
types of comprehenders and the differences were statistically significant.
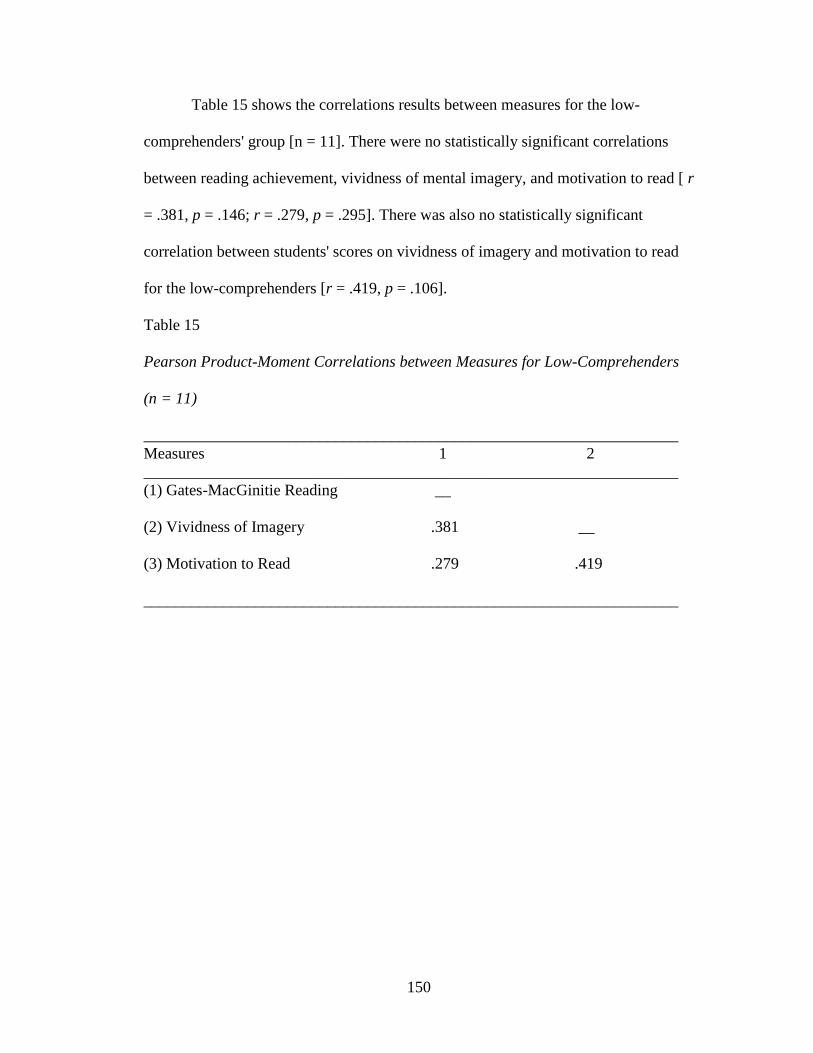
150
Table 15 shows the correlations results between measures for the low-
comprehenders' group [n = 11]. There were no statistically significant correlations
between reading achievement, vividness of mental imagery, and motivation to read [ r
= .381, p = .146; r = .279, p = .295]. There was also no statistically significant
correlation between students' scores on vividness of imagery and motivation to read
for the low-comprehenders [r = .419, p = .106].
Table 15
Pearson Product-Moment Correlations between Measures for Low-Comprehenders
(n = 11)
___________________________________________________________________ Measures 1 2 ___________________________________________________________________ (1) Gates-MacGinitie Reading __
(2) Vividness of Imagery .381 __
(3) Motivation to Read .279 .419
___________________________________________________________________
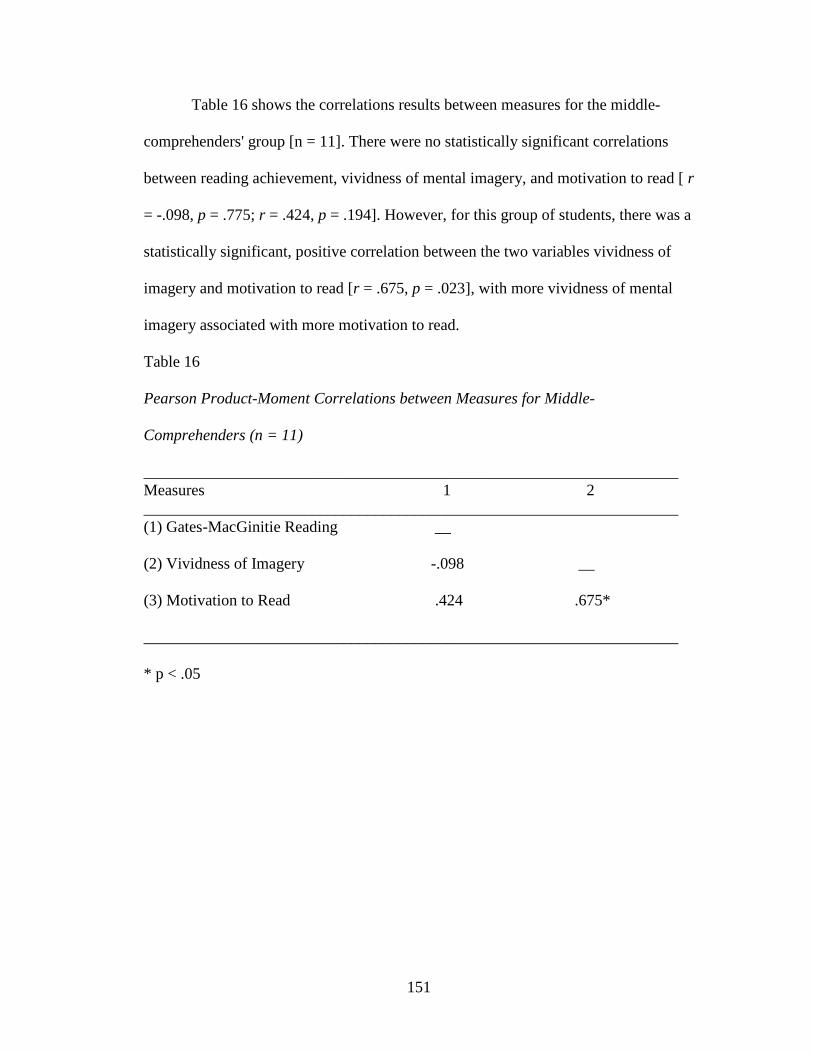
151
Table 16 shows the correlations results between measures for the middle-
comprehenders' group [n = 11]. There were no statistically significant correlations
between reading achievement, vividness of mental imagery, and motivation to read [ r
= -.098, p = .775; r = .424, p = .194]. However, for this group of students, there was a
statistically significant, positive correlation between the two variables vividness of
imagery and motivation to read [r = .675, p = .023], with more vividness of mental
imagery associated with more motivation to read.
Table 16
Pearson Product-Moment Correlations between Measures for Middle-
Comprehenders (n = 11)
___________________________________________________________________ Measures 1 2 ___________________________________________________________________ (1) Gates-MacGinitie Reading __
(2) Vividness of Imagery -.098 __
(3) Motivation to Read .424 .675*
___________________________________________________________________
* p < .05
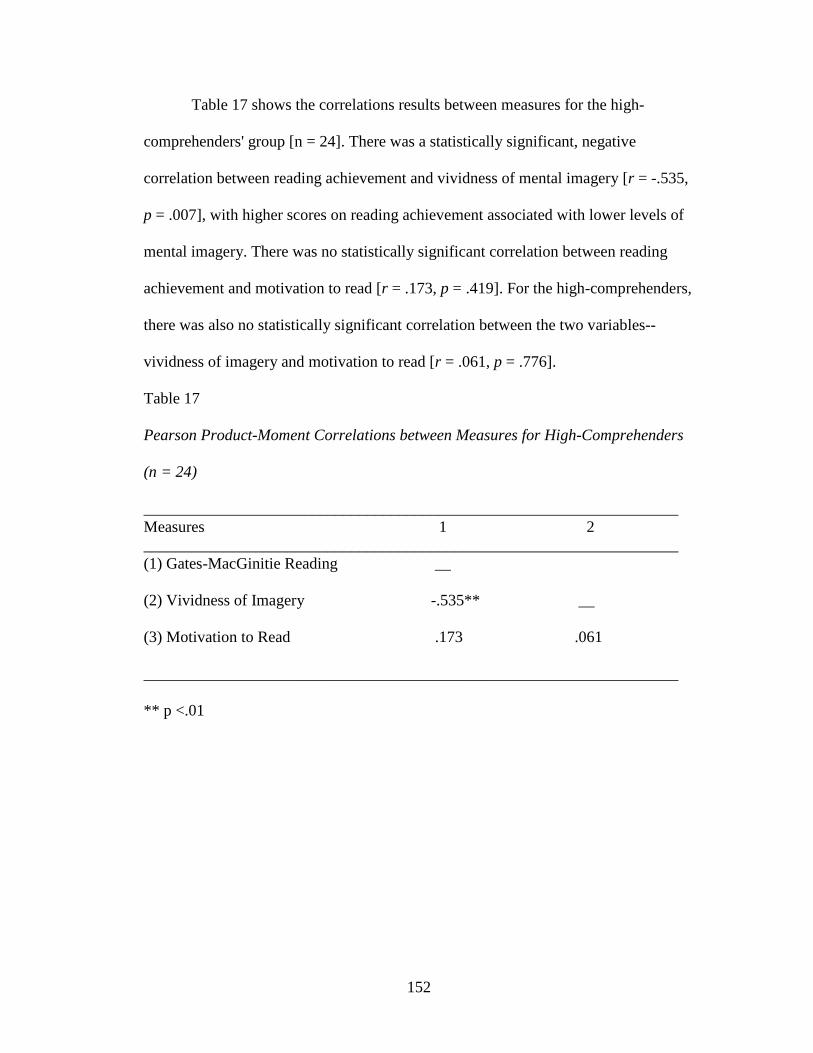
152
Table 17 shows the correlations results between measures for the high-
comprehenders' group [n = 24]. There was a statistically significant, negative
correlation between reading achievement and vividness of mental imagery [r = -.535,
p = .007], with higher scores on reading achievement associated with lower levels of
mental imagery. There was no statistically significant correlation between reading
achievement and motivation to read [r = .173, p = .419]. For the high-comprehenders,
there was also no statistically significant correlation between the two variables--
vividness of imagery and motivation to read [r = .061, p = .776].
Table 17
Pearson Product-Moment Correlations between Measures for High-Comprehenders
(n = 24)
___________________________________________________________________ Measures 1 2 ___________________________________________________________________ (1) Gates-MacGinitie Reading __
(2) Vividness of Imagery -.535** __
(3) Motivation to Read .173 .061
___________________________________________________________________
** p <.01
153
Results for Question 4
Is motivation to read improved after mental imagery instruction using science
expository texts? To answer this question, a mixed between-within subjects 2 X 2
analysis of variance (ANOVA) was conducted to compare groups over time. The
between-subjects factor was the group (experimental group vs. comparison group):
the experimental group had 25 students, comprised of students in Class One (a class
with low-comprehenders) and Class Three (a class with mostly high-comprehenders);
the comparison group had 31 students, comprised of students in Class Two (a class
with mostly middle-comprehenders) and Class Four (a class with mostly high-
comprehenders). The within-subject or repeated factor was time-- the students were
measured using the Motivation to Read Profile (Gambrell et al., 1996) at two
different intervals: Time 1 (prior to the intervention) and Time 2 (following the
intervention).
The means and standard deviations for students' scores on the Motivation to
Read Profile are reported on Table 18. Results indicated that there was no statistically
significant interaction for time and group [Wilks' Lambda = 1.000, F (1, 53) = .003, p
=.957, partial Eta squared = .000]. In addition, the main effect result for time did not
reach statistical significance [Wilks' Lambda = .996, F (1, 53) = .003, p =.648, partial
Eta squared = .004], nor was the main effect for group statistically significant [F (1,
53) = 1.599, p =.212, partial Eta squared = .029].
Figure 5 shows a graph of the non-statistically significant interaction for time
and group on motivation to read. The experimental group was comprised of 11 low-
comprehenders, 2 middle-comprehenders, and 12 high-comprehenders. The
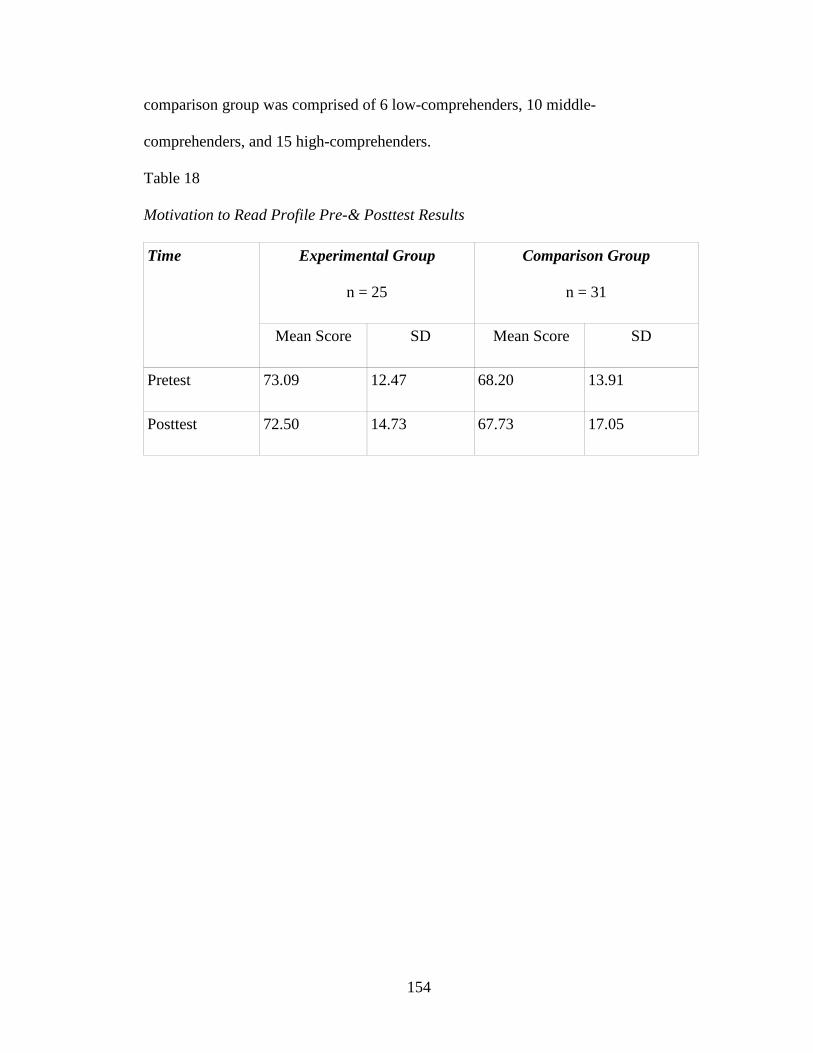
154
comparison group was comprised of 6 low-comprehenders, 10 middle-
comprehenders, and 15 high-comprehenders.
Table 18
Motivation to Read Profile Pre-& Posttest Results
Time Experimental Group
n = 25
Comparison Group
n = 31
Mean Score SD Mean Score SD
Pretest 73.09 12.47 68.20 13.91
Posttest 72.50 14.73 67.73 17.05
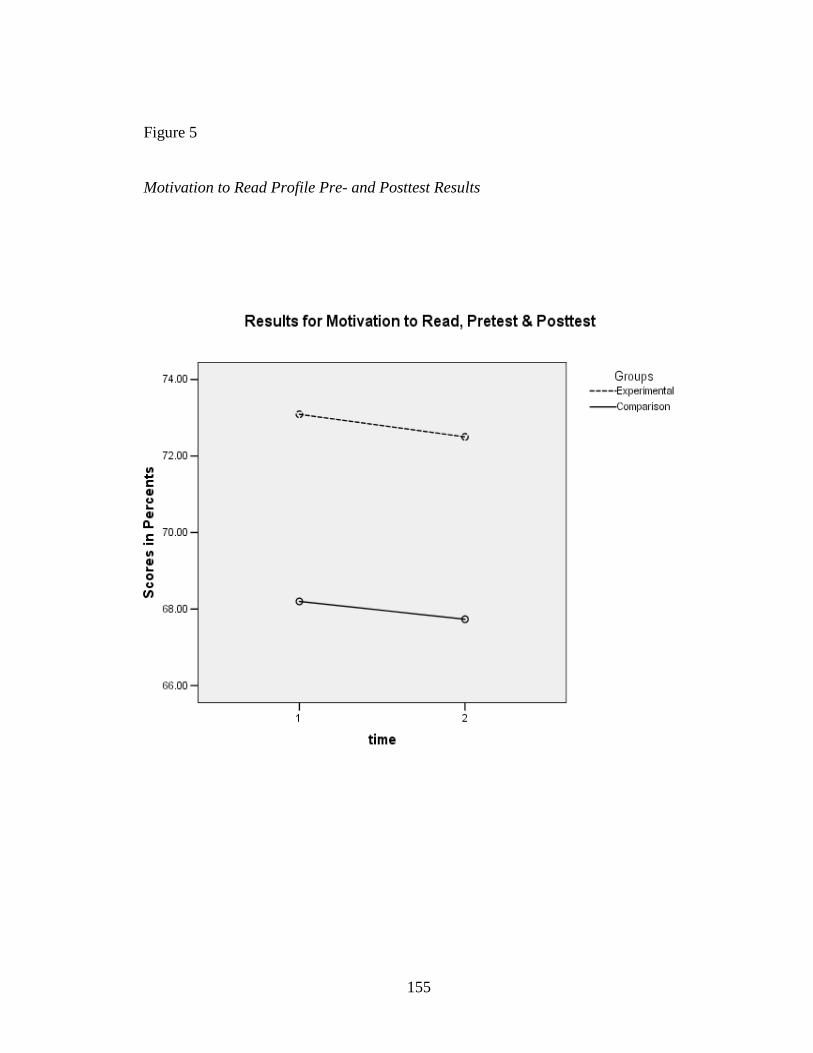
155
Figure 5
Motivation to Read Profile Pre- and Posttest Results
156
Summary
This chapter presents data and analysis of the results regarding using mental
imagery instruction with middle school students reading expository texts. Data
analyses revealed a statistically significant interaction for time and group on the
selected response (SR) portion of the comprehension task. Both experimental and
comparison groups appeared to make gains between Posttest 1 and Posttest 2, once
both had received mental imagery instruction. Although both groups improved, the
comparison group, which by chance consisted of stronger readers, appeared to
outperform the experimental group. There were no statistically significant effects for
the brief constructed response (BCR) portion of the comprehension task.
Data analysis on the performance of low-, middle-, and high-comprehenders
revealed statistically significant main effects for time and for type of comprehender
on the SR portion of the comprehension task, but no interaction. While all students
appeared to make gains between Posttest 1 and 2, the high- and middle-
comprehenders consistently outperformed the low-comprehenders. For the BCR
portion of the task, there was no statistically significant effect for the interaction or
for the main effect of time. However, the tests of between-subjects effects indicated
that the three levels of comprehenders performed differently. Thus, level of
comprehension was a factor affecting students’ SR and BCR performance.
Correlation analysis revealed that there were no statistically significant
relations between reading achievement, vividness of mental imagery, and motivation
to read for low-comprehenders, who scored significantly lower on all three measures
157
when their scores were compared to the scores of the high-comprehenders. There was
a statistically significant correlation between the vividness of mental imagery scores
and the motivation to read scores for the middle-comprehenders, with higher
vividness of metal imagery scores associated with higher motivation to read scores.
For the high-comprehenders, the only statistically significant correlation was their
reading achievement and vividness of mental imagery, which was negatively related–
with higher reading achievement associated with lower vividness of mental imagery
scores. Results also indicated that there was no statistical significance when
comparing motivation to read scores before and after mental imagery instruction
using science expository texts.
158
CHAPTER V
DISCUSSION
Introduction
This chapter is organized into five sections. The first section summarizes the
study rationale, purpose, questions, and methodology. The second section reviews the
results and information regarding the statistical findings and interpretations of these
findings. The third section presents study conclusions and implications. Section four
follows with an analysis of the limitations of the investigation. The last section,
section five, presents recommendations for future research.
Study Summary
Past studies of mental imagery have provided information about its
importance as well as the possibilities of using it in various ways to enhance
comprehension and memory. Mental imagery has been mainly used with narrative
texts, as the major studies show. Mental imagery has also been studied more in the
elementary grades than middle school or high school. Several past studies provided
limited mental imagery instruction for students, and few studies have extended
instruction beyond one session. Even more limited are the mental imagery studies that
engage middle school students reading science expository texts. For instruction, some
researchers simply mentioned to the participants to create pictures in their minds and
did not provide instruction on how to actually create such images. The purpose of this
study was to investigate the effects of mental imagery instruction using expository
texts with middle school students. This study provided two weeks of instruction for
the students, one class period each day (45 minutes), with a total of 450 minutes.
159
Using a quasi-experimental design, four intact classes were randomly assigned to be
in either a treatment or comparison group. During the course of this study, four main
research questions were investigated: (a) What are the effects of mental imagery
strategies on students' reading comprehension when they read science expository
texts? (b) How do the low-, middle-, and high-comprehenders compare in their
reading achievement after mental imagery instruction? (c) Are there relations between
the variables of reading comprehension, vividness of mental imagery, and motivation
to read for low-, middle- and high-comprehenders? (d) Is motivation to read
improved after mental imagery instruction using science expository texts?
Seven measures were used to obtain data on students' performance on reading
comprehension, motivation to read, and ability to create mental imageries. These
measures were the Gates-MacGinitie Reading Test (2000), the Motivation to Read
Profile (Gambrell et al., 1996), the Sheveland Vividness of Imagery Questionnaire
(1992), the Expository Pretest “Crocodiles and Alligators,” Posttest 1A “Octopus and
Squid,” Posttest 1B “Poisonous and Nonpoisonous Snakes of America,” and Posttest
2 “Butterflies and Moths.”
Statistical analyses of the data varied according to the questions, the measures,
and the group of students being analyzed. A mixed between-within subjects 2 (group:
experimental vs. comparison) X 3 (time: Time 1 before intervention, Time 2
following intervention, and Time 3 at the end of the year) ANOVA was used to
compare reading comprehension scores using expository texts on the groups of
students over time. A mixed between-within subjects 3 (three levels of
comprehenders) X 2 (Time 1 at Posttest 1, and Time 2 at Posttest 2) ANOVA was
160
used to analyze the effects of treatment and the three reading competency levels.
Effect sizes were calculated to support the interpretation of the statistical results.
Pearson's correlations were calculated to find the relations between reading
achievement, vividness of mental imagery, and motivation to read for low-, middle-,
and high-comprehenders. To compare the effects of mental imagery instruction on
motivation to read for the three levels of comprehenders, a mixed between-within
subjects, 2 (group) X 2 (time), analysis of variance was used.
Review of Results
Initial testing using the Gates-MacGinitie Reading Test (2000) indicated that
the reading performance of the students varied by classes. Class One, experimental
group, was a Below-grade-level class. This class was set up to be a Basic class with a
small class size (only 14 students). Based on the Gates-MacGinitie Reading Test
(2000), the mean reading grade level equivalence for Class One was 3.4. Of the class,
11 students participated in this study. Class Two, comparison group, was an On-
grade-level class with a total number of 23 students. Of the group, 19 students
participated in the study. Based on the Gates-MacGinitie Reading Test (2000), the
mean reading grade level equivalence for participants in Class Two was 6.35. Class
Three was an Honors class of 24 students. Of this group, 14 students participated.
Based on the Gates-MacGinitie Reading Test (2000), the mean reading grade level
equivalence for participants in Class Three was 11.5. Class Four was an Honors class
of 20 students. Of this group, 12 students participated in the study. Based on the
Gates-MacGinitie Reading Test (2000), the mean reading grade level equivalence for
participants in Class Four was 9.46.
161
Some students chose not to participate or their parents did not sign a
permission form for them to participate. These students' scores were not included in
the analyses even though these students received the same treatment in the classroom.
All data reporting on these classes reflected only the scores of students who agreed to
participate and whose parents agreed for them to participate. Participation in this
study meant allowing the scores to be used for analysis. The total number of
participating students was 56 students.
Students' Performance on Comprehension for Expository Text
The Effects of Mental Imagery Instruction
Four comprehension tests using science expository texts provided pretest and
posttest data for this group of middle school students. These comprehension tests
were furthermore divided into two portions: Selected Response (SR) and Brief
Constructed Response (BCR) or short essay. To investigate the effects of mental
imagery instruction on middle school students, a mixed between-within subjects 2
(experimental vs. comparison) X 3 (Time 1, Time 2, Time 3) ANOVA was
conducted. Results for the SR portion of the expository reading comprehension test
indicated that there was a statistically significant interaction for group and time. The
mean scores for the experimental group went from 67.60% on the Pretest to 68.40%
on Posttest 1, and then to 74% by Posttest 2. The experimental group received mental
imagery instruction between the Pretest and Posttest 1. The mean scores for the
comparison group, which received mental imagery instruction after Posttest 1 in the
third quarter of the school year, went from 73.87% on the Pretest to 77.74% on
Posttest 1, and then to 92.90% by Posttest 2.
162
It is important to note that the two groups were quite different since intact
classes were randomly assigned to be in these groups. As noted in Chapter IV, the
experimental group had 11 low-, 2 middle-, and 12 high-comprehenders. The
comparison group had no low-comprehenders at all, but had 10 middle- and 15 high-
comprehenders. Indeed, as can be seen in Figure 1, the graph of the interaction of
time and group for SR, the comparison group scored higher than the experimental
group initially and for both posttests. The comparison group-- with stronger readers--
appeared to have responded well to imagery instruction once they received it after
Posttest 1. Between Posttest 1 and Posttest 2, both groups improved on SR, with the
comparison group showing more improvement, as reflected in the statistically
significant interaction.
Since the posttests were written on sixth-grade level, the low-comprehenders,
who were reading on a third-grade reading level (based on the Gates-MacGinitie
Reading Test, 2000), probably had difficulties understanding the passages and
responding to the comprehension questions. These low-comprehenders, all in the
experimental group, may have needed a longer time to learn how to effectively use
mental imagery strategies with expository texts that were challenging to them. Hence,
there was little change on SR from the Pretest to Posttest 1 for the experimental
group. Nevertheless, by Posttest 2, both groups of students appeared to have made
gains in the SR portion of the test. Other factors such as maturity may also have
influenced higher comprehension scores by the end of the school year; however,
mental imagery strategies were the target for these classes from the time following
the intervention to the end of the school year, and the moderate effect size– very close
163
to large (ŋp2 = .137) as indicated by the analysis– showed that the gain was probably
not due to chance alone. While other studies in the field may find mental imagery to
be a “quick-fix,” this study revealed that using mental imagery with science
expository text may take more than two weeks to be effective.
In contrast to the SR score results, results for the short essay or BCR portion
of the test showed no statistically significant gain for either group. For the
experimental group, the BCR mean scores over the three measured times were
68.00%, 69.00%, and 81.00%. Even though the scores appeared to have risen 13
percentage points, the result was not statistically significant. The standard deviation
varied from 33.48, 24.24, to 25.29. This indicated that students were scoring in a wide
range and were not scoring consistently as a group. While some students improved
greatly, there were those who scored low.
The BCR results for the comparison group also showed no statistically
significant gains. The BCR scores for the three measured times were 79.84%,
74.19%, and 79.03%. It appears that mental imagery strategies did not help students
improve their reading comprehension score when asked to express their
understanding in essay format.
The Effects of Mental Imagery Instruction on Low-, Middle-, and High-
Comprehenders
Past research has indicated that mental imagery may benefit the low readers in
particular. This study provided some data and insight regarding the effects of mental
imagery instruction for low-, middle-, and high-comprehenders using expository
texts. A mixed between-within subjects 3 (three levels of comprehenders– low-,
164
middle-, and high-) X 2 (time– Time 1, Time 2) ANOVA was conducted to analyze
the data.
For this analysis, the between-subject factor was the type of comprehender
(low-, middle, and high-comprehenders). To categorize students into the three levels
of comprehenders, students' reading achievement levels on the Gates-MacGinitie
Reading Test (2000) and state reading assessment scores were reviewed. Students
who scored in the grade equivalence range of 4.9 and below on the Gates test and in
the “Basic” range on the state reading assessment were considered low-
comprehenders. Students who scored in the grade equivalence range of 5.0 to 7.5 on
the Gates test and in the “Proficient” range on the state assessment were considered
middle-comprehenders. Students who scored in the grade equivalence range of 7.5
and above on the Gates test and in the “Advanced” range on the state assessment
were considered high-comprehenders. Students whose scores vary greatly between
the two measures were considered on an individual basis, where classroom
performance and teacher input would also be considered when placing a student in a
category. For example, a student who scored “Advanced” on the state test but scored
at a 4.6 grade equivalence on the Gates-MacGinitie test may be categorized as a
middle-comprehender when this student’s overall performance in the classroom was
also considered. In addition, the information was cross-referenced with students' state
testing scores from the previous school year as well as teacher input when current
state test scores were not available. The following were numbers of low-, middle-,
and high-comprehenders in each class who participated in the study: Class One
experimental group-- 11 low-comprehenders (n = 11); Class Two comparison group--
165
6 low-, 9 middle-, and 4 high-comprehenders (n = 19); Class Three experimental
group-- 2 middle- and 12 high-comprehenders (n = 14); Class Four comparison
group-- 1 middle- and 11 high-comprehender (n = 12). The total numbers for the
three types of comprehenders are as follows: low-comprehenders, n = 17; middle-
comprehenders, n = 12; and high-comprehenders, n = 27. Based on the Gates-
MacGinitie Reading test (2000), the average reading grade equivalency for these
students were 3.24 for the low-comprehenders, 6.45 for the middle-comprehenders,
and 10.55 for the high-comprehenders.
The within-subject factor for this analysis was time. Time 1 refers to the time
students took Posttest 1. At that time, only students in the experimental group had
received mental imagery instruction. After Posttest 1, students in the comparison
group also received mental imagery instruction. Throughout the rest of the school
year, all students were prompted at least two to three times a week to use mental
imagery strategies. Time 2 refers to the time when students took Posttest 2, which
was at the end of the school year.
Statistical analysis of the SR data indicated no significant interaction effect;
however, there was a statistically significant main effect for time as well as a
statistically significant main effect for type of comprehender. An inspection of the SR
data suggests that while all students appeared to make gains by Posttest 2, the high-
comprehenders outperformed the middle-comprehenders on both tests ( high-
comprehenders Posttest 1 M = 87.41%, Posttest 2 M = 98.15%; middle-
comprehenders Posttest 1 M = 77.5%, Posttest 2 M = 93.33%), and the middle-
comprehenders outperformed the low-comprehenders on both tests ( middle-
166
comprehenders Posttest 1 M = 77.5%, Posttest 2 M = 93.33%; low-comprehenders
Posttest 1 M = 48.82%, Posttest 2 M = 56.47%). (For details, refer to data Table 11
and the graph in Figure 3). Mental imagery instruction using science expository texts
appeared to work for the different levels of comprehenders, and the large effect size
(ŋp2 = .283) suggests that the gains were probably not due to chance. In addition, it is
noteworthy that after mental imagery instruction, the middle-comprehenders
performed better than high-comprehenders before mental imagery instruction (the SR
mean score for Posttest 2 for middle-comprehenders was 93.33%, while the SR mean
score for Posttest 1 for high-comprehenders was 87.41%). The middle-
comprehenders’ Posttest 2 SR mean score was also close in range to the high-
comprehenders’ Posttest 2 SR mean score (middle-comprehenders 93.33% and high-
comprehenders 98.15%). Although the low-comprehenders seemed to have made
some gains after mental imagery instruction, their mean score for Posttest 2 was at
56.47%. When that score is compared to the 93.33% for middle-comprehenders and
98.15% for high-comprehenders, it suggests that they probably needed more support.
These readers would most likely have benefitted from texts on their own reading
level, additional instruction in areas such as vocabulary, and perhaps even word
analysis.
The analysis for the BCR portion of the reading task showed no statistically
significant effects for interaction and time; however, tests of between-subjects effects
indicated a statistically significant effect for type of comprehender. For example, the
Posttest 2 BCR mean scores for low-, middle, and high-comprehenders were 61.76%,
83.33%, and 89.82% respectively. It may be concluded that students with different
167
levels of comprehension performed differently on their short essay answers. (For
more details, refer to data Table 12 and the graph in Figure 4.) The findings suggest
that mental imagery strategies alone may not be sufficient to help students improve
their brief constructed responses. In addition to comprehension strategies, students
may need more support to help them write proficient short essay answers.
Relations between Variables
Past studies noted that students who scored high on comprehension tests also
reported more vivid mental imagery and more frequent use of mental imagery. Other
studies have noted that students who had more vivid imagery had better attitude and
more motivation to read. This study also explored the relationships between the
variables of comprehension achievement, vividness of mental imagery, and
motivation to read. Data collection for this part of the study included scores from the
Gates-MacGinitie Reading Test (2000), the Sheveland Vividness of Imagery
Questionnaire (1992) pretest, and Motivation to Read Profile (Gambrell et al., 1996)
pretest. The Pearson product-moment correlation coefficient was used to investigate
the relationship between the variables and the three types of comprehenders (low-,
middle-, and high-).
Results indicated that for the low-comprehenders, there were no statistically
significant correlations between reading achievement, vividness of mental imagery,
and motivation to read. These students scored significantly lower on all three
measures when compared to the high-comprehenders. Results of this study also show
that poor readers have less vivid mental imagery than good readers. The findings of
this study echoed the findings of prior research (Gambrell et al., 1980), which noted
168
that below-average readers were less capable of inducing mental imagery when
compared to the above-average readers.
For the middle-comprehenders, there were no statistically significant
correlations between reading achievement, vividness of mental imagery, and
motivation to read; however, there was a statistically significant, positive correlation
between vividness of mental imagery and motivation to read [ r = .675, p = .023].
This indicated that more vividness of mental imagery is associated with more
motivation to read. This finding is consistent with Gunston-Park's study (1985) as
well as Macomber's study (2001). Both studies reported that vividness of imagery is
associated with better attitudes and motivation towards reading.
For the high-comprehenders, there was no statistically significant correlation
between reading achievement and motivation to read. There also was no statistically
significant correlation between vividness of mental imagery and motivation to read.
However, there was a statistically significant, negative correlation between reading
achievement and vividness of mental imagery, with higher reading achievement
scores related to lower vividness of mental imagery scores [r = -.535, p = .007]. The
high-comprehenders' mean score for vividness of mental imagery was 87.78%, which
was significantly higher than the scores for the low-comprehenders [mean score
76.99%], but it was not significantly different than the scores of the middle-
comprehenders [mean score 84.79%]. It is likely that the high-comprehenders have
other reading strategies they call upon and they do not completely rely on vividness
of mental imagery to make sense of the text and answer questions. This condition was
discussed in Oakhill and Patel's study (1991). Oakhill and Patel suggested that good
169
readers might have other efficient strategies for putting what they have read into
meaningful context and remembering information from text.
The findings of this study are somewhat similar to part of the conclusions of
Cramer's study (1982), which indicated that students who used lots of imagery scored
best on comprehension and also had the best attitude towards reading. The correlation
analyses of this study supported the findings of previous studies that good readers
perform better on expository tests and have more vivid imagery. Good readers are
also more motivated to read (Macomber, 2000).
Mental Imagery Instruction and Motivation
Prior studies in the field indicated that some students had more motivation to
read after mental imagery instruction (Hibbing & Rankin-Erickson, 2003). This study
employed a mixed between-within subjects 2 (groups: experimental vs. comparison)
X 2 (time: Time 1, Time 2) analysis of variance to compare groups over time. Time 1
refers to the time when students took all the Pretests, including the Motivation to
Read Profile (Gambrell, Palmer, Codling, & Mazzoni, 1996). After a two-week
intervention period for the experimental group (in which students received mental
imagery instruction) and a practice period for the comparison group (in which no
mental imagery instruction was given), students took the Motivation to Read Profile
again as a Posttest. Results indicated that there was no statistical significance for any
variance between the Motivation to Read Profile pretest and posttest scores. In this
study, the students did not show more motivation to read on this measure after mental
imagery instruction using science expository texts. The reasons for this were not
understood. Could it be that students did not find expository texts interesting and
170
therefore they were not more motivated to read after the intervention? If they used
narrative texts, would the results be similar? Could it be that the task was perceived as
just another classroom reading unit, and not very motivating at all? Were there other
values that affected this particular group of students? These questions could not be
answered based on the results of this study, but may be possible ideas for future
investigations.
Study Conclusions and Implications
In recent years, educators have been clamoring for “balanced instruction”
(Rasinski & Padak, 2004) in which students are expected to both learn to read and
read to learn. However, this type of knowledge acquisition necessitates attention to
expository texts (Dreher, 2000). The mental imagery strategies used in this study
appeared to be effective for middle school students reading science expository texts
answering selected response questions. Results also indicated that mental imagery
appeared to be more effective for the average and above-grade-level middle school
students when they read science expository texts and answered selected response
questions. The below-grade-level students appeared to have made some
improvements, but they were consistently outperformed by the other two groups. This
conclusion is different from Oakhill and Patel's study (1991), in which students with
low reading achievement benefitted the most from imagery instruction. A major
difference between the two studies is that this study investigated middle school
students reading science expository texts whereas Oakhill and Patel's study involved
elementary students reading narrative texts.
171
The students in the experimental group also performed better on Posttest 2
(given at the end of the year) when compared to Posttest 1 (following the two-week
intervention). While these students appeared to have made some small improvements
after two weeks of mental imagery instruction, it was by the end of the school year
when they demonstrated the most gain. These findings imply that the use of mental
imagery strategies with science expository texts should be a long-term process and
not a “quick-fix.”
To contextualize the use of mental imagery for students while reading
expository texts, the following instructional strategies appeared to be effective in the
classroom:
1. Prompting students to use visualization with the text:
Many students respond to sight, and generally will respond when prompted to
create a picture in the mind's eye. This recommendation is consistent with the
instructional method used in several prior studies (Finch, 1982; Gambrell,
Koskinen, & Cole, 1980; Pressley 1975).
2. Guiding students to draw diagrams and pictures may help them with the
understanding of the text:
Self-generated pictures and diagrams have been useful in many classrooms.
This method was used partly by Rose, Parks, Androes, and McMahon (2000)
and Hibbing and Rankin-Erickson (2003).
3. Guiding students to make metacognitive connections with the text by
activating all the sensory modalities:
172
Students can make connections with the text when prompted to link the text to
something they have experienced. The recall of personal images and events
activates all of their sensory modalities. This strategy was also used by
Douville and Algozzine (2004) in a model they termed as SAM, or sensory
activated model.
4. Asking students to use think-along ideas (oral or written) while using
imagery:
Also known as think-aloud think-along, this strategy is effective because it
helps students use the strategies of predicting, questioning, clarifying,
summarizing, and making personal connections. This strategy was used by
researchers such as Davey (1983), Farr (1997), and Olshavsky (1976). In
addition to responding aloud, having students write down their think-along
ideas was found to be a very effective classroom practice that engages all
students.
5. Creating a sensory chart:
A sensory chart or some form of graphic organizer is useful as an alternate
way to let students select information from the text that may be linked to
specific images. Charts and organizers have been known to be effective ways
to organize concepts from text, especially for content fields such as science
and social studies (Bean, Valerio, & Stevens, 1999). The use of sensory charts
may be useful to help students comprehend specific elements and make
connections with the text. (A sample sensory chart titled “Images Chart” is
included in Appendix E.)
173
6. Using visual-cue vocabulary cards to enhance vocabulary:
Whether called LINCs (Ellis, 2004) or visual-cue cards (Bean, Valerio, &
Stevens, 1999; Readence, Bean, & Baldwin, 1998), this strategy helps
students learn and remember important vocabulary words. To create a visual-
cue vocabulary card, students have to write the vocabulary word, copy
definitions, create their own reminding words, draw their own pictures, and
write their own sentences using the vocabulary words. Furthermore, having
students share with the class makes the vocabulary words more memorable
because of the repetition as well as the presentation of other imaginable
scenarios that students share using the same word.
Analysis of the Limitations
One limitation of this study was that the sample size was relatively small, not
large enough to analyze data for all the subgroups. In addition, the way these students
disperse ability-wise did not follow the normal curve. When these 56 students were
examined by ability groupings, 11 students were categorized as low-comprehenders
(30.36%), 12 students as middle-comprehenders (21.43%), and 27 students (48.21%)
as high-comprehenders. It would have been more ideal to have a larger number of
middle-comprehenders, but those classes with many middle-comprehenders were
taught by two other teachers in the school not involved in this study.
Furthermore, this study adopted a quasi-experimental design, with the
sampling population from one school only, which further limits the variability of the
population. The students were from a suburban middle school, with students in the
free and reduced lunch program at 20%; therefore, it was most likely that the results
174
may not be generalized to a different population with higher or lower free and
reduced lunch status. However, the school, as a microcosm, did resemble the state
where it was located. For example, in reading achievement, the school also scored
similar to other schools across the nation. Using the 8th grade NAEP scores in
Reading, the mean score of this school was around 32% at or above the proficient
level, which was similar to the state and nation in which it is located. Therefore, it is
possible that successful intervention methods for this school may also be successful
elsewhere.
Recommendations for Future Research
The field of reading comprehension research using mental imagery for
expository text is open for new ideas. There is still much that we do not know. For
example, how much scaffolding would students need if they were in the low-
comprehenders group and they needed to be brought up to on-grade-level
performance? What type of imagery instruction would best suit them? This study
used passages that were written on 6th grade readability level, but the students reading
below-grade-level had a difficult time with them. It would be beneficial to know how
low-comprehenders would perform if they had text passages that matched their
reading ability. It would also be interesting to know if they would perform well if the
passages progressively increased in difficulty (based on readability). Future research
may include dividing students into subgroups and have varying levels of reading
materials for them to use, with the target of using imagery to improve their
comprehension so that they may be reading on the level of their grade placement as
soon as possible.
175
Another investigation could involve imaginable text and dealing with texts
that may be considered unfriendly for imagery. For example, an analysis of students'
basal readers as well as science and social studies textbooks for imaginable features
may shed light into the materials they are currently reading in school. Research can
also bring this one step further and devise ways to help students create imagery and
make connections even with texts that are typically unfriendly for imagery.
Many questions remain unanswered. Do students use more vivid mental
imagery with narrative text than with expository texts? Are there relations between
age and gender and the use of mental imagery with science expository text? Young
readers seem to delight in books that are scientific. For example, many children are
curious about the world, the planets, the animals, computers, and other technological
items. When and why do some students perceive science texts to be difficult? Do
students change their interests over time or are the science textbooks too boring?
These are questions that require new investigations. Case studies of students using
mental imagery as a comprehension strategy would also be enlightening.
This study also revealed that good readers do not totally rely on mental
imagery as a comprehension strategy; so what are some other strategies these students
use? Furthermore, it would be interesting to find out whether students could create
more images with narrative or expository texts if the passages were matched for
imagery-evoking words. Would students be more motivated to read after mental
imagery instruction with one type of text versus another? Does gender play a part in
the preference? Future research involving a larger, more diverse sample could allow
for analysis involving subgroups with more students.
176
In this study, students did not show more motivation to read after they were
taught mental imagery strategies. Could this result be due to the fact that the students
read expository texts for this study? Do more students prefer narratives and find
science expository texts less engaging? If they had read narratives instead of
expository texts, would there be an increase in motivation to read? What about ways
to improve the brief constructed response? These questions are beyond the scope of
this study, and may be good topics to explore in future research.
Although this study provides a bit more information to the vast field of
reading research, it is my hope that more research will be conducted using strategies
that may be classroom friendly for expository text, giving more students a boost in
reading achievement, perhaps equipping these students with something extra when
they face expository texts in science class, in reading class, on county benchmark
tests, on the state tests, and one day, in real life or work situations.
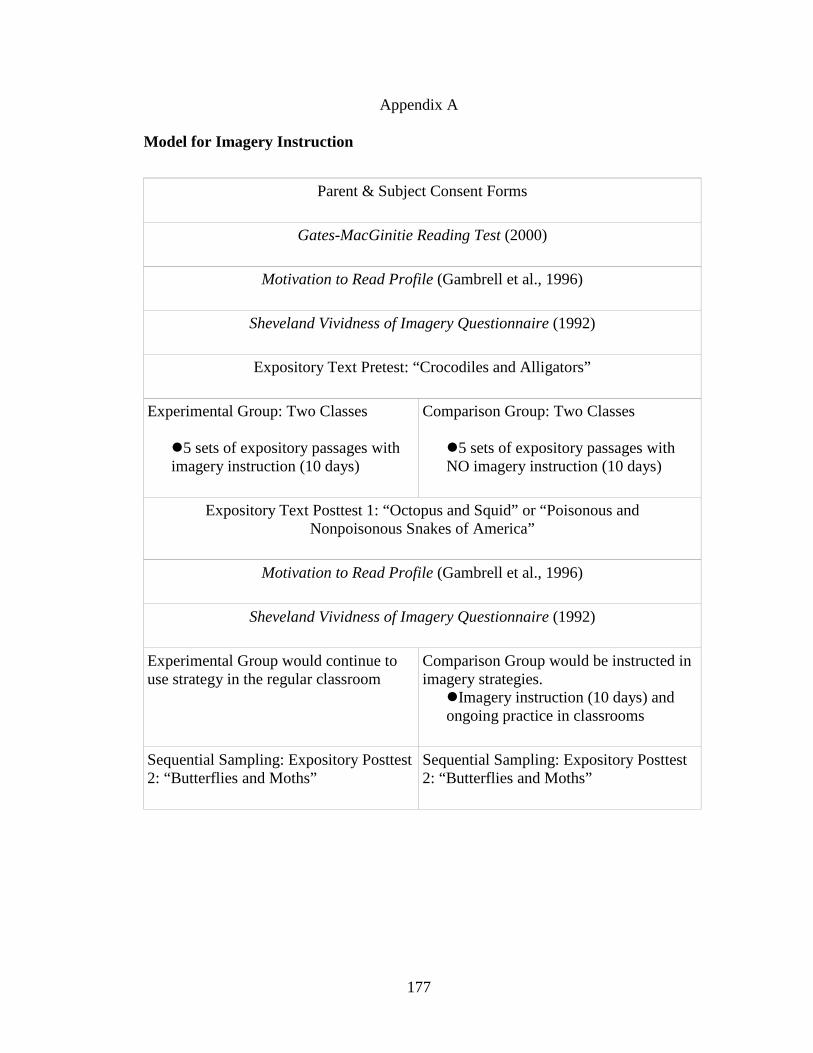
177
Appendix A
Model for Imagery Instruction
Parent & Subject Consent Forms
Gates-MacGinitie Reading Test (2000)
Motivation to Read Profile (Gambrell et al., 1996)
Sheveland Vividness of Imagery Questionnaire (1992)
Expository Text Pretest: “Crocodiles and Alligators”
Experimental Group: Two Classes
�5 sets of expository passages with imagery instruction (10 days)
Comparison Group: Two Classes
�5 sets of expository passages with NO imagery instruction (10 days)
Expository Text Posttest 1: “Octopus and Squid” or “Poisonous and Nonpoisonous Snakes of America”
Motivation to Read Profile (Gambrell et al., 1996)
Sheveland Vividness of Imagery Questionnaire (1992)
Experimental Group would continue to use strategy in the regular classroom
Comparison Group would be instructed in imagery strategies.
�Imagery instruction (10 days) and ongoing practice in classrooms
Sequential Sampling: Expository Posttest 2: “Butterflies and Moths”
Sequential Sampling: Expository Posttest 2: “Butterflies and Moths”
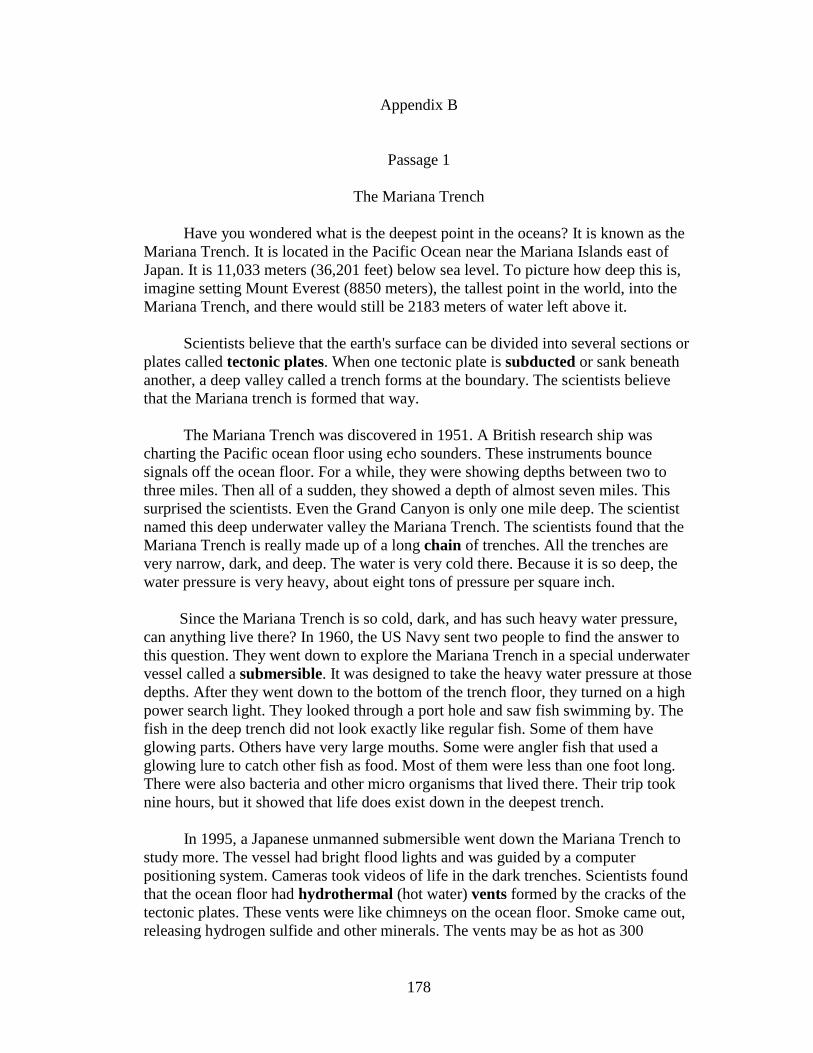
178
Appendix B
Passage 1
The Mariana Trench Have you wondered what is the deepest point in the oceans? It is known as the Mariana Trench. It is located in the Pacific Ocean near the Mariana Islands east of Japan. It is 11,033 meters (36,201 feet) below sea level. To picture how deep this is, imagine setting Mount Everest (8850 meters), the tallest point in the world, into the Mariana Trench, and there would still be 2183 meters of water left above it. Scientists believe that the earth's surface can be divided into several sections or plates called tectonic plates. When one tectonic plate is subducted or sank beneath another, a deep valley called a trench forms at the boundary. The scientists believe that the Mariana trench is formed that way. The Mariana Trench was discovered in 1951. A British research ship was charting the Pacific ocean floor using echo sounders. These instruments bounce signals off the ocean floor. For a while, they were showing depths between two to three miles. Then all of a sudden, they showed a depth of almost seven miles. This surprised the scientists. Even the Grand Canyon is only one mile deep. The scientist named this deep underwater valley the Mariana Trench. The scientists found that the Mariana Trench is really made up of a long chain of trenches. All the trenches are very narrow, dark, and deep. The water is very cold there. Because it is so deep, the water pressure is very heavy, about eight tons of pressure per square inch. Since the Mariana Trench is so cold, dark, and has such heavy water pressure, can anything live there? In 1960, the US Navy sent two people to find the answer to this question. They went down to explore the Mariana Trench in a special underwater vessel called a submersible. It was designed to take the heavy water pressure at those depths. After they went down to the bottom of the trench floor, they turned on a high power search light. They looked through a port hole and saw fish swimming by. The fish in the deep trench did not look exactly like regular fish. Some of them have glowing parts. Others have very large mouths. Some were angler fish that used a glowing lure to catch other fish as food. Most of them were less than one foot long. There were also bacteria and other micro organisms that lived there. Their trip took nine hours, but it showed that life does exist down in the deepest trench. In 1995, a Japanese unmanned submersible went down the Mariana Trench to study more. The vessel had bright flood lights and was guided by a computer positioning system. Cameras took videos of life in the dark trenches. Scientists found that the ocean floor had hydrothermal (hot water) vents formed by the cracks of the tectonic plates. These vents were like chimneys on the ocean floor. Smoke came out, releasing hydrogen sulfide and other minerals. The vents may be as hot as 300
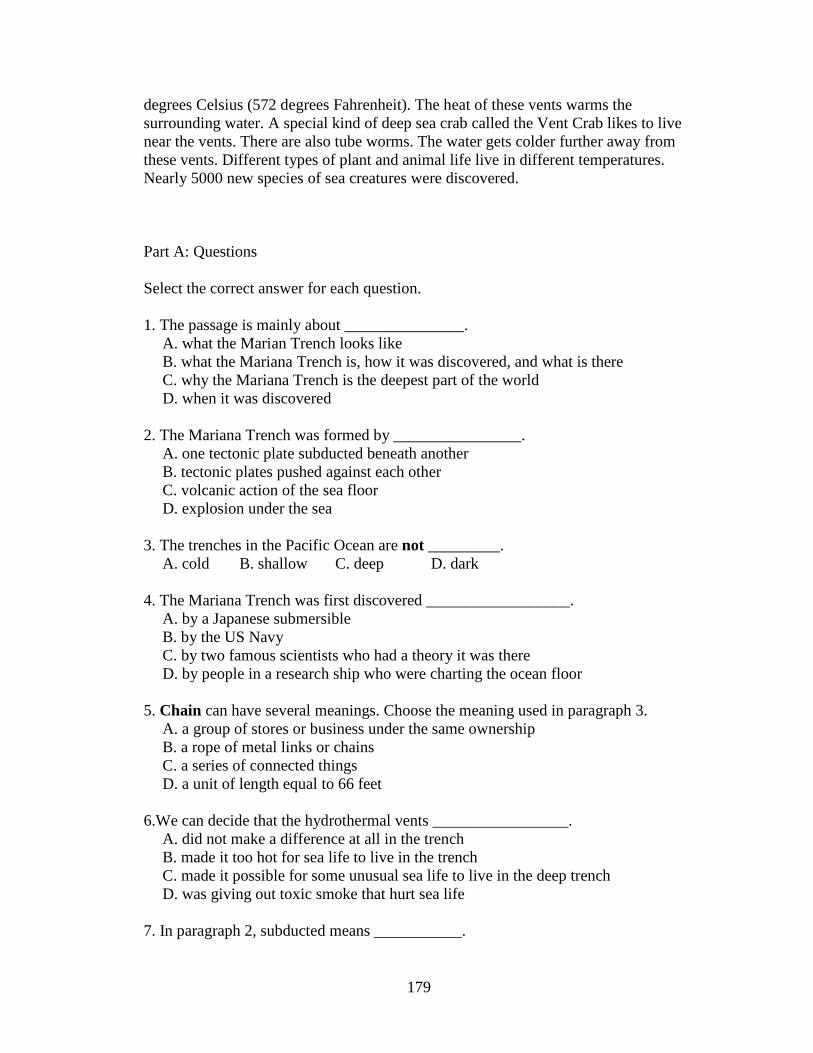
179
degrees Celsius (572 degrees Fahrenheit). The heat of these vents warms the surrounding water. A special kind of deep sea crab called the Vent Crab likes to live near the vents. There are also tube worms. The water gets colder further away from these vents. Different types of plant and animal life live in different temperatures. Nearly 5000 new species of sea creatures were discovered. Part A: Questions Select the correct answer for each question. 1. The passage is mainly about _______________.
A. what the Marian Trench looks like B. what the Mariana Trench is, how it was discovered, and what is there C. why the Mariana Trench is the deepest part of the world D. when it was discovered
2. The Mariana Trench was formed by ________________. A. one tectonic plate subducted beneath another B. tectonic plates pushed against each other C. volcanic action of the sea floor D. explosion under the sea
3. The trenches in the Pacific Ocean are not _________. A. cold B. shallow C. deep D. dark
4. The Mariana Trench was first discovered __________________. A. by a Japanese submersible B. by the US Navy C. by two famous scientists who had a theory it was there D. by people in a research ship who were charting the ocean floor
5. Chain can have several meanings. Choose the meaning used in paragraph 3. A. a group of stores or business under the same ownership B. a rope of metal links or chains C. a series of connected things D. a unit of length equal to 66 feet
6.We can decide that the hydrothermal vents _________________. A. did not make a difference at all in the trench B. made it too hot for sea life to live in the trench C. made it possible for some unusual sea life to live in the deep trench D. was giving out toxic smoke that hurt sea life
7. In paragraph 2, subducted means ___________.
180
A. to crush B. to go under C. to go over D. to crack
8.We can decide that the fish looked different in the deep trench because they have to adapt to the living conditions. Which of the following may describe one type of fish found in the trench?
A. Some fish have large eyes B. Some fish have long teeth C. Some fish have glowing parts D. Some fish are very large, more than 8 feet
9.We can decide that ____________________. A. Vent Crabs like heat. B. Angler fish is large and dangerous. C. People can swim in the Mariana trench. D. Scientists found everything they needed to know about the Mariana Trench.
10. A submersible is ___________________.
A. a vessel that is very large and must be manned B. a ship that charts the depths of the ocean C. a vessel that goes down into the depths of the ocean D. a vessel that is operated by remote control Part B: BCR. Answer by writing a paragraph with supports from the text. Would you like to explore the ocean floor? Why or why not? What would you want to learn about? Explain your choice by using information from the passage.

181
Figure 6
Location of the Mariana Trench
(The image is copied from the "English Wikipedia," which is generated by {{User|Dcfleck}} at [http://www.planiglobe.com www.planiglobe.com] with the licensing, according to the original source, as follows. == Licensing == {{cc-by-2.5}}) A diagram of the Mariana Trench showing the abyssal region and the deep trench is accessible from the following website: http://www.marianatrench.com/mariana_trench-oceanography.htm
182
___________________________________________________________________
Information Sources
Holt, Rinehart, and Winston. (2001). Revealing the ocean floor. In R. W. Todd, D. F. Bowman, & R. V. Tucek (Eds.), Holt science and technology: Earth science (pp. 338-339). Austin, TX: Holt, Rinehart and Winston. The Mariana Trench. (2003). Last modified April 04, 2003. Retrieved July 11, 2005,
from Web site: www.marianatrench.com
Marianas Trench. (2005). In Encyclopedia Americana (Vol. 18, p. 314). Danbury, CT: Scholastic Library Publishing, Inc.
183
Appendix B
Passage 2
Volcanic Eruptions
You probably already know a lot about volcanoes. Volcanoes are mountains that form when magma is forced to the earth's surface. Magma is hot, molten rock formed under the earth’s surface. Are volcanoes always explosive? The answer is no. Scientists classified volcanic eruptions into two kinds: explosive and nonexplosive. The explosive type of eruption can be very destructive. Think about the force of the explosion produced by the first atomic bomb used in World War II. Now imagine an explosion 10,000 times stronger. That can be compared to the power of an explosive eruption. When Krakatau in Indonesia erupted, it blew half the island away. In 1902, Mount Pelee erupted. It was on a small volcanic island in the Caribbean Sea known as Martinique. The hot steam, toxic gas, and volcanic debris killed all but one person on the island. The survivor was a prisoner held in a dungeon. In an explosive eruption, clouds of hot debris and gas can shoot out at supersonic speeds. Dust particles from molten rock are blown into the air. Sometimes the dust circles the earth for years in the upper atmosphere. An explosive eruption can blast a million tons of solid rock. In 1980, Mt. St. Helens erupted. It blasted away a whole side of a mountain. Explosive eruptions are usually caused by magma that contains two substances-- water or silica. When a volcano has magma with high water content, it is likely to explode. This can be compared to a bottle of soda. When you shake up a bottle of soda, the gas that was dissolved in the soda is released. If you open the shaken bottle, soda will come shooting out. The same thing happened with water in the magma. The heat caused the water to turn into steam. As the steam pressure builds up, it will burst with great force. Another substance that can cause a volcano to erupt explosively is silica. Silica is a nonmetallic substance. Magma with a large amount of silica is usually very thick. Silica hardens quickly. This can plug up the vent. If enough pressure builds up, an explosive eruption results. Explosive eruptions are usually very destructive. For example, Mount Vesuvius erupted in A.D. 79 and destroyed the city of Pompeii. On the other hand, the nonexplosive eruptions are relatively calm. These are just outpourings of lava. Lava is magma that flows onto the earth's surface. Imagine rivers of red-hot lava flowing out of a volcano. That scene shows a typical nonexplosive eruption. An example of this is Mount Kilauea in Hawaii. As lava oozes out, it flows many kilometers. The lava then cools and hardens. Tourists go there to see the sight at a safe distance.
184
Some of the largest mountains on earth grew from repeated lava flows. They grow over hundreds of thousands of years. An example is Hawaii's Mauna Kea. It is the largest mountain on earth. Measured from its base on the sea floor, Mauna Kea is taller than Mount Everest, the tallest mountain on land. Once in a while, even nonexplosive eruptions can spray lava into the air. These sprays rarely exceed a few hundred meters in height. Lava flow from the nonexplosive eruptions is slow. This type of eruption is more of a threat to property than to human life. Part A: Questions Select the correct answer for each question. 1. The passage is mainly about _________________.
A. the damage volcanic eruptions can cause B. the presence of water and silica cause volcanoes to be explosive C. how tourists can visit nonexplosive volcanoes D. comparing two types of volcanic eruptions, explosive and nonexplosive
2. Debris from a volcano probably contains _________________. A. magma, gas B. steam, froth C. rocks, ashes D. trash, rocks
3. The explosive volcanic eruption was comparable to ___________________. A. the power of an atom bomb B. ten thousand times the power of an atom bomb C. the power of the sun D. the destruction of tidal waves
4. Why was there one man who survived in the eruption of Mount Pelee at St. Martinique?
A. He escaped on a boat. B. He predicted the eruption and hid in a cellar. C. He was a prisoner held in an underground cell. D. He was rescued on a beach.
5. Which of these is not an example of the destruction of an explosive eruption? A. hot steam, toxic gas, and debris killed people B. half an island was blown off C. lava oozed out on the slope D. a million tons of solid rock was blasted
185
6. What caused some eruptions to be explosive?
A. steam and ash in the magma B. water and silica in the magma C. chemical change in the magma D. presence of toxic gases
7. Why is Mauna Kea so tall?
A. It was formed by volcanic action, and layers of lava were added on over the years. B. It was formed by a large explosive eruption. C. It was formed by plate tectonics, and the earth folded up very high. D. It was taller than Mount Everest.
8. Comparing the two kinds of eruptions, _____________________.
A. the explosive eruptions are definitely more studied by scientists B. the nonexplosive eruptions are more dangerous C. the explosive eruptions are not as much a threat to property D. the nonexplosive eruptions are less of a threat to life
9. The nonexplosive eruptions are ______________________.
A. probably very dangerous because it can burn people up B. probably not dangerous to human life because we can run away from it C. probably not dangerous because of tourists D. probably dangerous because they can quickly turn into explosive eruptions
10. The author compared the presence water in the magma to ________________.
A. gas in a bottle of soda B. rocks that plug up a vent C. a steam engine D. a dust cloud
Part B: BCR. Answer by writing a paragraph with supports from the text. Explain the causes of an explosive eruption. Use information from the text to support your answer.
186
_____________________________________________________________________
Information Sources
Leet, L. D. (2005). Volcano. In Encyclopedia Americana (Vol. 28, pp. 216-221).
Danbury, CT: Scholastic Library Publishing, Inc.
Rowland, S. K. (2005). Volcano. In World book student. Retrieved July 7, 2005, from
World Book Student database: http://www.worldbookonline.com/student/
article?id=ar587920
Holt, Rinehart, and Winston. (2001). Volcanoes. In R. W. Todd,
D. F. Bowman, & R. V. Tucek (Eds.), Holt science and technology: Earth
science (pp. 220-228). Austin, TX: Holt, Rinehart and Winston.
187
Appendix B
Passage 3
Earthquake Resistant Buildings
There are parts of the world today that are frequently disturbed by earthquakes. Some earthquakes damage entire cities. You may have seen scenes like that in a movie. The ground splits, everything shakes, and tall buildings topple over. These quakes have happened in many places. For example, the San Francisco Bay area, Kobe in Japan, the West coast of Mexico, and Western Turkey all had earthquakes. Sometimes, earthquakes cause many lives to be lost. In Tangshan, China, the earthquake of 1976 caused 255,000 deaths. Why do so many people die in an earthquake? The main reason is that buildings are shaken badly in an earthquake. They crumble and fall, crushing the people. In order for the people to live more safely, architects and engineers have invented some earthquake resistant buildings. These buildings can keep standing even in a major earthquake. In fact, some of these buildings have been made so that they feel hardly any shaking at all. What is the secret behind these buildings? The truth is that they actually move. They are designed to move in the opposite way of the shake. There are several ways to make this work. One of the most frequently used methods is shifting weights. Base isolators are placed on the base of the building. They act as shock absorbers during an earthquake. They are made of layers of rubber and steel. On the bottom part of the building, engineers place a special system called the “active tendon system.” Sensors notify a computer when the building is moving. Then the computer activates devices to shift a large weight to counteract the movement. The roof also has one of the sensors to show building movement in an earthquake. That sensor may also add information to activate the shifting of the weight to balance the building. Another method uses strong ropes or braces to pull the building back in place. Even jets of water or air may be used to push the building back in place. All the methods use computer controls. In addition, all the buildings use flexible pipes. This means that the rubbery joints will not have to break during an earthquake. To make the floors and sides sturdy, the engineers use steel cross-braces. The braces are like X-shaped crosses. They can counteract pressure that pushes and pulls at the sides of buildings during an earthquake. Scientists hope that more earthquake resistant buildings are built in areas with frequent earthquakes. With these buildings, people are more prepared for such an event.
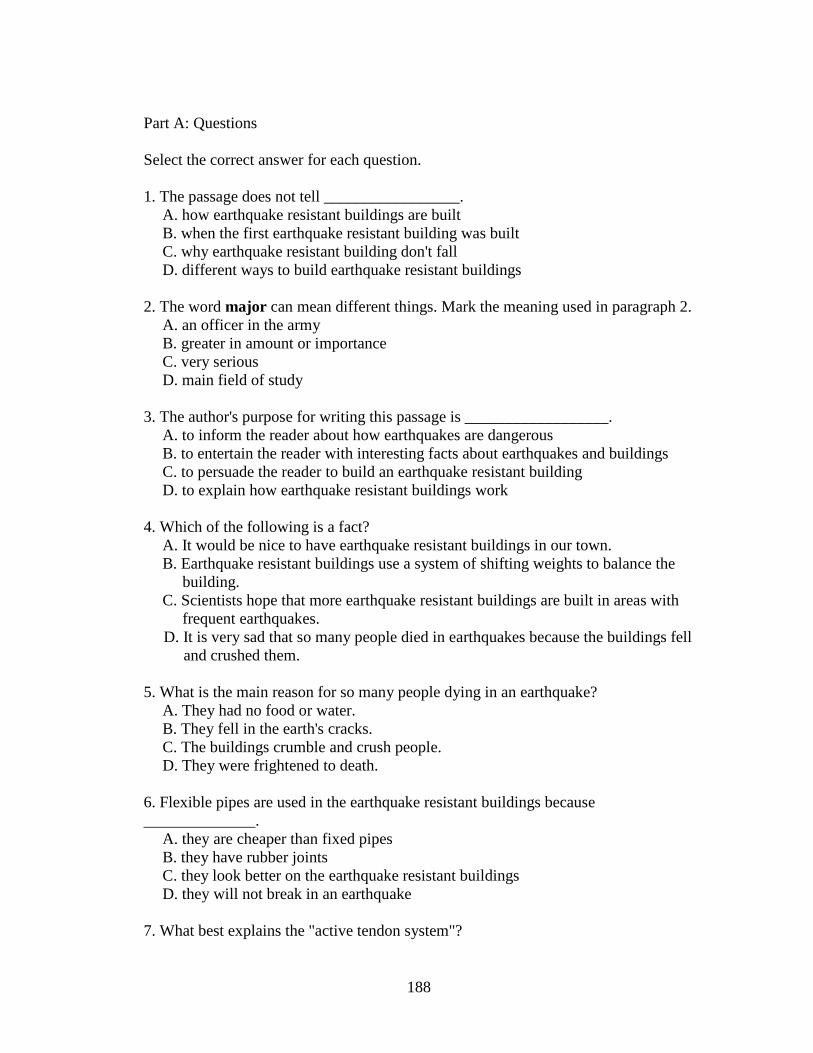
188
Part A: Questions Select the correct answer for each question. 1. The passage does not tell _________________.
A. how earthquake resistant buildings are built B. when the first earthquake resistant building was built C. why earthquake resistant building don't fall D. different ways to build earthquake resistant buildings
2. The word major can mean different things. Mark the meaning used in paragraph 2.
A. an officer in the army B. greater in amount or importance C. very serious D. main field of study
3. The author's purpose for writing this passage is __________________. A. to inform the reader about how earthquakes are dangerous B. to entertain the reader with interesting facts about earthquakes and buildings C. to persuade the reader to build an earthquake resistant building D. to explain how earthquake resistant buildings work
4. Which of the following is a fact?
A. It would be nice to have earthquake resistant buildings in our town. B. Earthquake resistant buildings use a system of shifting weights to balance the building. C. Scientists hope that more earthquake resistant buildings are built in areas with frequent earthquakes.
D. It is very sad that so many people died in earthquakes because the buildings fell and crushed them. 5. What is the main reason for so many people dying in an earthquake?
A. They had no food or water. B. They fell in the earth's cracks. C. The buildings crumble and crush people. D. They were frightened to death.
6. Flexible pipes are used in the earthquake resistant buildings because ______________.
A. they are cheaper than fixed pipes B. they have rubber joints C. they look better on the earthquake resistant buildings D. they will not break in an earthquake
7. What best explains the "active tendon system"?
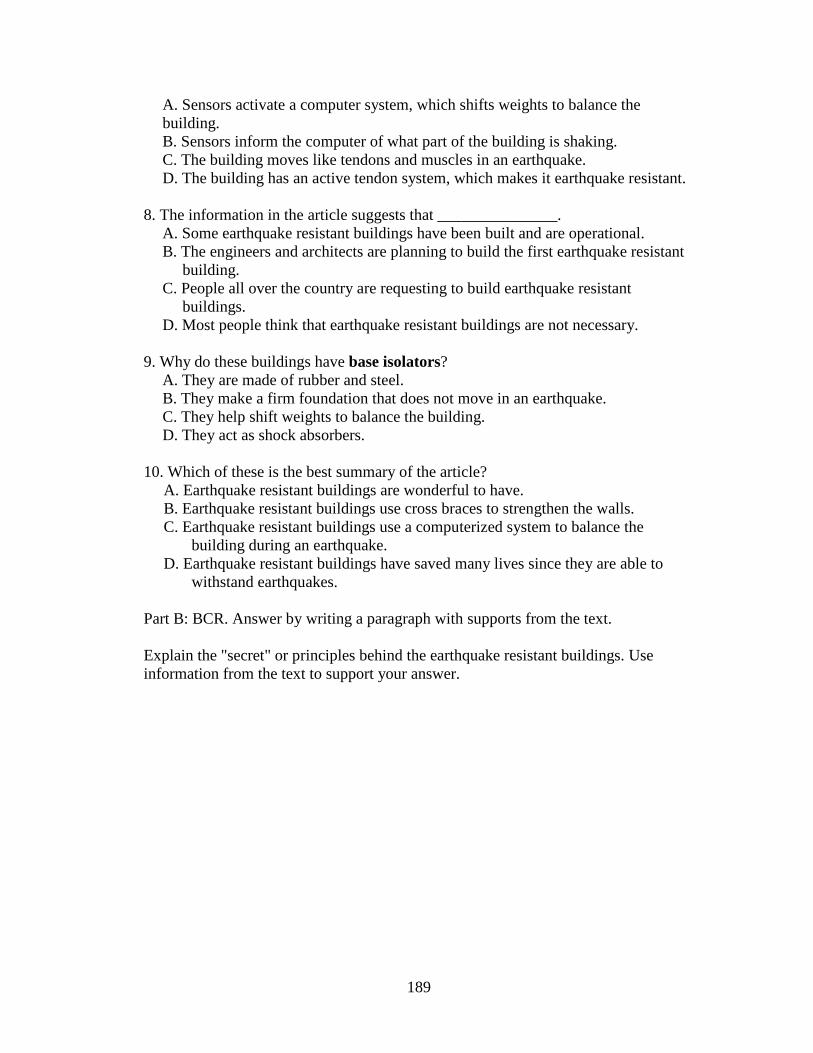
189
A. Sensors activate a computer system, which shifts weights to balance the building. B. Sensors inform the computer of what part of the building is shaking. C. The building moves like tendons and muscles in an earthquake. D. The building has an active tendon system, which makes it earthquake resistant.
8. The information in the article suggests that _______________. A. Some earthquake resistant buildings have been built and are operational. B. The engineers and architects are planning to build the first earthquake resistant building. C. People all over the country are requesting to build earthquake resistant buildings. D. Most people think that earthquake resistant buildings are not necessary.
9. Why do these buildings have base isolators?
A. They are made of rubber and steel. B. They make a firm foundation that does not move in an earthquake. C. They help shift weights to balance the building. D. They act as shock absorbers.
10. Which of these is the best summary of the article? A. Earthquake resistant buildings are wonderful to have. B. Earthquake resistant buildings use cross braces to strengthen the walls. C. Earthquake resistant buildings use a computerized system to balance the
building during an earthquake. D. Earthquake resistant buildings have saved many lives since they are able to withstand earthquakes. Part B: BCR. Answer by writing a paragraph with supports from the text. Explain the "secret" or principles behind the earthquake resistant buildings. Use information from the text to support your answer.
190
___________________________________________________________________
Information Sources
Earthquakes. (2003). The World book encyclopedia: Vols. E . Chicago: World Book,
Inc.
Holt, Rinehart, and Winston. (2001). Earthquakes and society. In R. W. Todd, D. F.
Bowman, & R. V. Tucek (Eds.), Holt science and technology: Earth science
(pp. 205-210). Austin, TX: Holt, Rinehart and Winston.
McNally, K. C. (2003). Damage by earthquakes. In World book student. Retrieved
June 3, 2005, from World Book Student database:
http://www.worldbookonline.com
The science of earthquakes. (2005). Earthquake hazards program. Retrieved April 5,
2005, from US Department of Interior: United States Geological Survey
Web site: http://earthquake.usgs.gov/learning/kids/eqscience.php
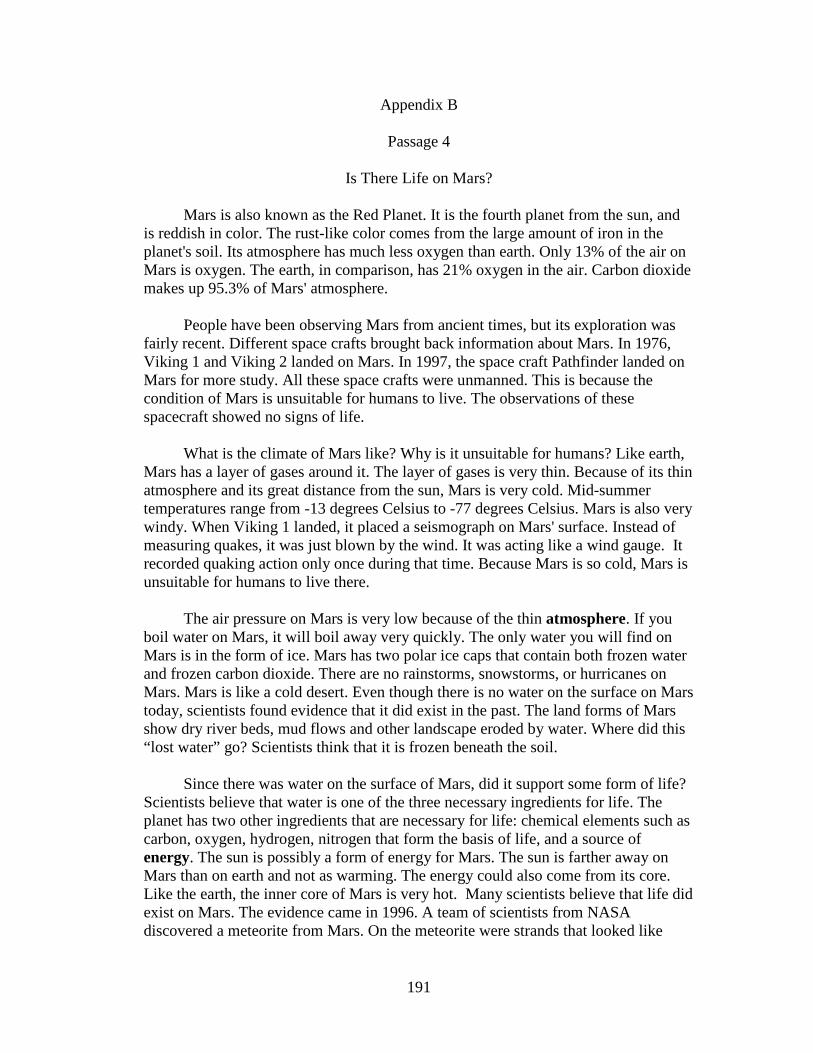
191
Appendix B
Passage 4
Is There Life on Mars?
Mars is also known as the Red Planet. It is the fourth planet from the sun, and is reddish in color. The rust-like color comes from the large amount of iron in the planet's soil. Its atmosphere has much less oxygen than earth. Only 13% of the air on Mars is oxygen. The earth, in comparison, has 21% oxygen in the air. Carbon dioxide makes up 95.3% of Mars' atmosphere. People have been observing Mars from ancient times, but its exploration was fairly recent. Different space crafts brought back information about Mars. In 1976, Viking 1 and Viking 2 landed on Mars. In 1997, the space craft Pathfinder landed on Mars for more study. All these space crafts were unmanned. This is because the condition of Mars is unsuitable for humans to live. The observations of these spacecraft showed no signs of life. What is the climate of Mars like? Why is it unsuitable for humans? Like earth, Mars has a layer of gases around it. The layer of gases is very thin. Because of its thin atmosphere and its great distance from the sun, Mars is very cold. Mid-summer temperatures range from -13 degrees Celsius to -77 degrees Celsius. Mars is also very windy. When Viking 1 landed, it placed a seismograph on Mars' surface. Instead of measuring quakes, it was just blown by the wind. It was acting like a wind gauge. It recorded quaking action only once during that time. Because Mars is so cold, Mars is unsuitable for humans to live there. The air pressure on Mars is very low because of the thin atmosphere. If you boil water on Mars, it will boil away very quickly. The only water you will find on Mars is in the form of ice. Mars has two polar ice caps that contain both frozen water and frozen carbon dioxide. There are no rainstorms, snowstorms, or hurricanes on Mars. Mars is like a cold desert. Even though there is no water on the surface on Mars today, scientists found evidence that it did exist in the past. The land forms of Mars show dry river beds, mud flows and other landscape eroded by water. Where did this “lost water” go? Scientists think that it is frozen beneath the soil. Since there was water on the surface of Mars, did it support some form of life? Scientists believe that water is one of the three necessary ingredients for life. The planet has two other ingredients that are necessary for life: chemical elements such as carbon, oxygen, hydrogen, nitrogen that form the basis of life, and a source of energy. The sun is possibly a form of energy for Mars. The sun is farther away on Mars than on earth and not as warming. The energy could also come from its core. Like the earth, the inner core of Mars is very hot. Many scientists believe that life did exist on Mars. The evidence came in 1996. A team of scientists from NASA discovered a meteorite from Mars. On the meteorite were strands that looked like
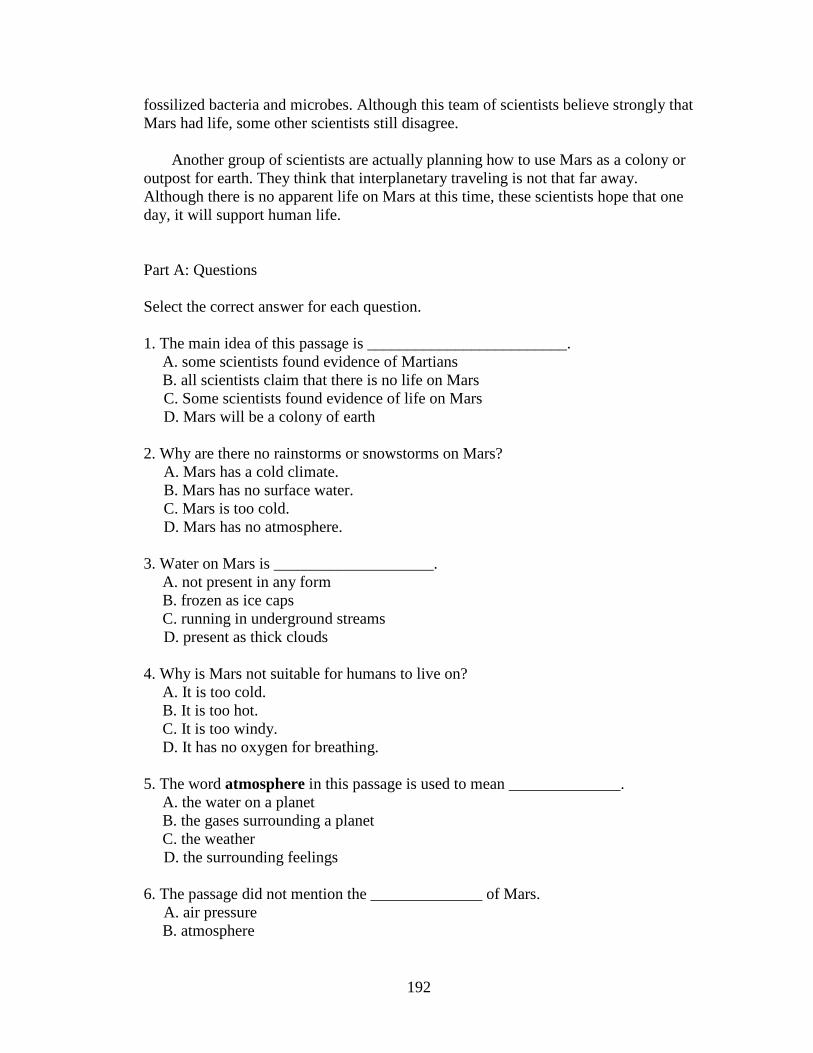
192
fossilized bacteria and microbes. Although this team of scientists believe strongly that Mars had life, some other scientists still disagree. Another group of scientists are actually planning how to use Mars as a colony or outpost for earth. They think that interplanetary traveling is not that far away. Although there is no apparent life on Mars at this time, these scientists hope that one day, it will support human life. Part A: Questions Select the correct answer for each question. 1. The main idea of this passage is _________________________.
A. some scientists found evidence of Martians B. all scientists claim that there is no life on Mars
C. Some scientists found evidence of life on Mars D. Mars will be a colony of earth 2. Why are there no rainstorms or snowstorms on Mars? A. Mars has a cold climate. B. Mars has no surface water. C. Mars is too cold. D. Mars has no atmosphere. 3. Water on Mars is ____________________.
A. not present in any form B. frozen as ice caps C. running in underground streams
D. present as thick clouds 4. Why is Mars not suitable for humans to live on?
A. It is too cold. B. It is too hot. C. It is too windy. D. It has no oxygen for breathing.
5. The word atmosphere in this passage is used to mean ______________. A. the water on a planet B. the gases surrounding a planet C. the weather
D. the surrounding feelings 6. The passage did not mention the ______________ of Mars. A. air pressure
B. atmosphere
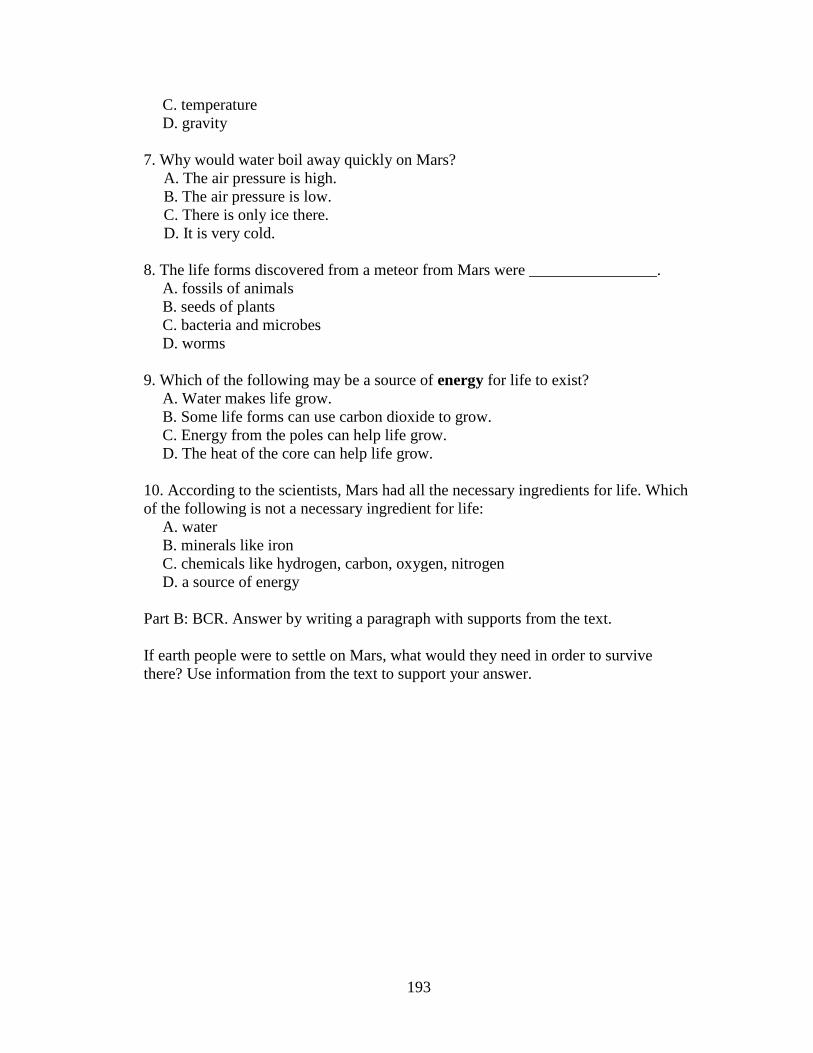
193
C. temperature D. gravity
7. Why would water boil away quickly on Mars? A. The air pressure is high. B. The air pressure is low. C. There is only ice there. D. It is very cold. 8. The life forms discovered from a meteor from Mars were ________________.
A. fossils of animals B. seeds of plants C. bacteria and microbes D. worms
9. Which of the following may be a source of energy for life to exist? A. Water makes life grow. B. Some life forms can use carbon dioxide to grow. C. Energy from the poles can help life grow. D. The heat of the core can help life grow.
10. According to the scientists, Mars had all the necessary ingredients for life. Which of the following is not a necessary ingredient for life:
A. water B. minerals like iron C. chemicals like hydrogen, carbon, oxygen, nitrogen D. a source of energy
Part B: BCR. Answer by writing a paragraph with supports from the text. If earth people were to settle on Mars, what would they need in order to survive there? Use information from the text to support your answer.
194
_________________________________________________________________
Information Sources
Carr, M. H. (2005). Mars. In Encyclopedia Americana (Vol. 18, pp. 355-360).
Danbury, CT: Scholastic Library Publishing, Inc.
Holt, Rinehart, and Winston. (2001). Mars-- The red planet. In R. W. Todd, D. F.
Bowman, & R. V. Tucek (Eds.), Holt science and technology: Earth science
(pp. 542- 543). Austin, TX: Holt, Rinehart and Winston.
Mars. (2003). The World book encyclopedia: Vols. M . Chicago: World Book, Inc.
Squyres, S. W. (2005). Mars. Retrieved April 1, 2005, from World Book Student
database: http://www.worldbookonline.com/student/article?id=ar346000
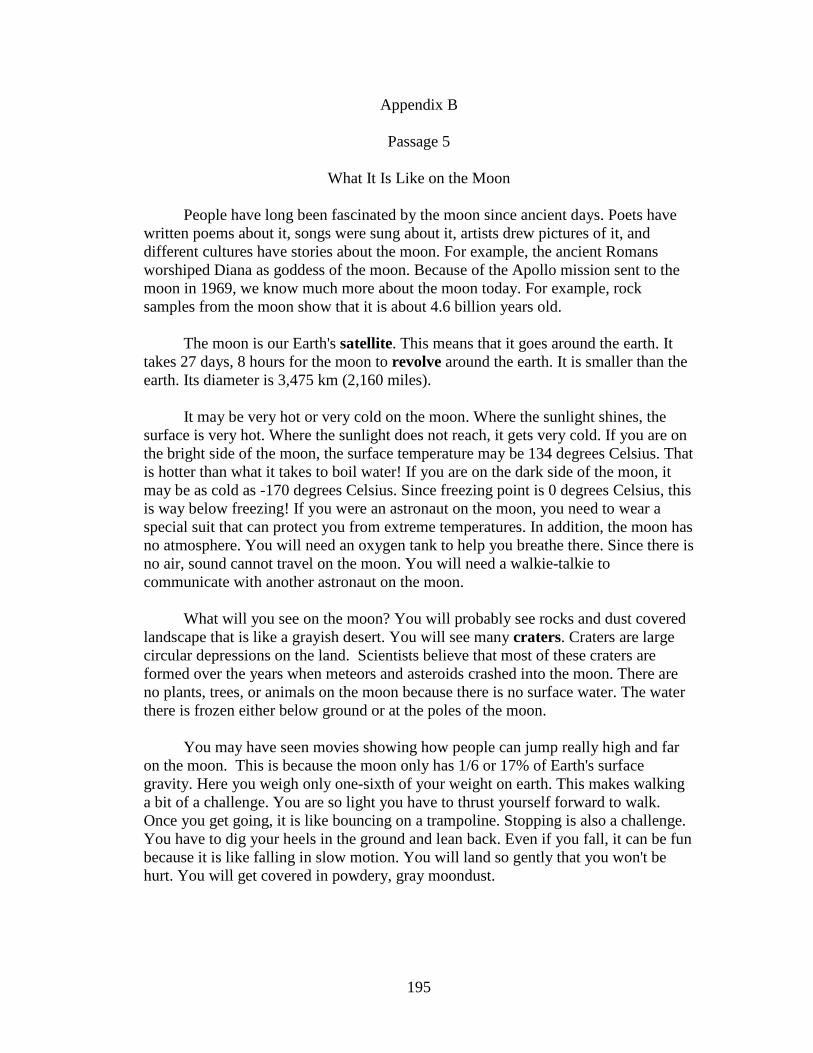
195
Appendix B
Passage 5
What It Is Like on the Moon
People have long been fascinated by the moon since ancient days. Poets have written poems about it, songs were sung about it, artists drew pictures of it, and different cultures have stories about the moon. For example, the ancient Romans worshiped Diana as goddess of the moon. Because of the Apollo mission sent to the moon in 1969, we know much more about the moon today. For example, rock samples from the moon show that it is about 4.6 billion years old. The moon is our Earth's satellite. This means that it goes around the earth. It takes 27 days, 8 hours for the moon to revolve around the earth. It is smaller than the earth. Its diameter is 3,475 km (2,160 miles). It may be very hot or very cold on the moon. Where the sunlight shines, the surface is very hot. Where the sunlight does not reach, it gets very cold. If you are on the bright side of the moon, the surface temperature may be 134 degrees Celsius. That is hotter than what it takes to boil water! If you are on the dark side of the moon, it may be as cold as -170 degrees Celsius. Since freezing point is 0 degrees Celsius, this is way below freezing! If you were an astronaut on the moon, you need to wear a special suit that can protect you from extreme temperatures. In addition, the moon has no atmosphere. You will need an oxygen tank to help you breathe there. Since there is no air, sound cannot travel on the moon. You will need a walkie-talkie to communicate with another astronaut on the moon. What will you see on the moon? You will probably see rocks and dust covered landscape that is like a grayish desert. You will see many craters. Craters are large circular depressions on the land. Scientists believe that most of these craters are formed over the years when meteors and asteroids crashed into the moon. There are no plants, trees, or animals on the moon because there is no surface water. The water there is frozen either below ground or at the poles of the moon. You may have seen movies showing how people can jump really high and far on the moon. This is because the moon only has 1/6 or 17% of Earth's surface gravity. Here you weigh only one-sixth of your weight on earth. This makes walking a bit of a challenge. You are so light you have to thrust yourself forward to walk. Once you get going, it is like bouncing on a trampoline. Stopping is also a challenge. You have to dig your heels in the ground and lean back. Even if you fall, it can be fun because it is like falling in slow motion. You will land so gently that you won't be hurt. You will get covered in powdery, gray moondust.
196
Part A: Questions Select the correct answer for each question.
1.This passage is mainly about ______________________.
A. how you can't hurt yourself if you fall on the moon B. how the moon looks bare, with nothing but craters and dust C. how long it takes for the moon to revolve around the earth D. what it is like to be on the moon
2. One opinion about the moon is _____________________. A. ancient Romans worshiped a goddess of the moon B. poets wrote poems about the moon, and artists drew pictures of it C. it is fun to fall on the moon since you won't be hurt D. sound cannot travel on the moon
3. The passage does not say, but we can decide that ______________________. A. astronauts use walkie-talkies on the moon just because it is fun to use B. a walkie-talkie does not depend on air to send signals C. a walkie-talkie uses sound waves for communicating D. a walkie-talkie is not needed for communication on the moon
4. The word satellite in paragraph 2 means _________________________. A. a man-made device launched into orbit B. a small heavenly body that revolves around a planet C. a form of TV based on signals sent from space D. a follower of someone of importance
5. A simile compares two things that may be alike in some way. A simile used in the passage is _______________________.
A. you will be covered in powdery, gray moondust B. jumping on the moon is like bouncing on a trampoline C. you are so light you have to thrust yourself forward to walk D. craters are large circular depressions on the land
6. The moon has less gravity than the earth. The proportion of the gravity moon compared to that of the earth can be expressed as ________________.
A. 1: 17 B. 1: 6 C. 1: 27 D. 1: 4.6
7. According to rock samples, the moon is ______________ years old. A. 100 billion B. 4.6 million
197
C. 10 million D. 4.6 billion
8. How did we find out more information about the moon? A. A communication device set up on the surface of the moon sends pictures and other information. B. The Apollo space mission brought back rock samples and pictures. C. There were many landings on the moon so scientists were able to study it. D. The space station monitored the moon since 1969.
9. You won't get hurt falling on the moon because ___________________. A. there is no gravity on the moon B. there is less gravity so you fall slowly C. you are like a feather on the moon D. you are one-tenth lighter
10. The moon's surface looks like it is _________________________. A. covered with dust and has lots of craters B. hot with sand dunes like a tropical desert C. cold and bare like the polar regions D. full of volcanic craters and has lava oozing out of the craters Part B: BCR. Answer by writing a paragraph with supports from the text. Explain the challenges you will face on the moon and what you would do to overcome those challenges.
_________________________________________________________________
Information Sources
Burke, J. D. (2005). Moon. In Encyclopedia Americana (Vol. 19, pp. 429-437).
Danbury, CT: Scholastic Library Publishing, Inc.
Holt, Rinehart, and Winston. (2001). Moons. In R. W. Todd, D. F. Bowman, & R. V.
Tucek (Eds.), Holt science and technology: Earth science (pp. 5409-550).
Austin, TX: Holt, Rinehart and Winston.
Spudis, P. D. (2005). Surface features of the moon. In World book student.
Retrieved June 3, 2005, from World Book Student database:
http://www.worldbookonline.com/student/article?id=ar370060&st=moon
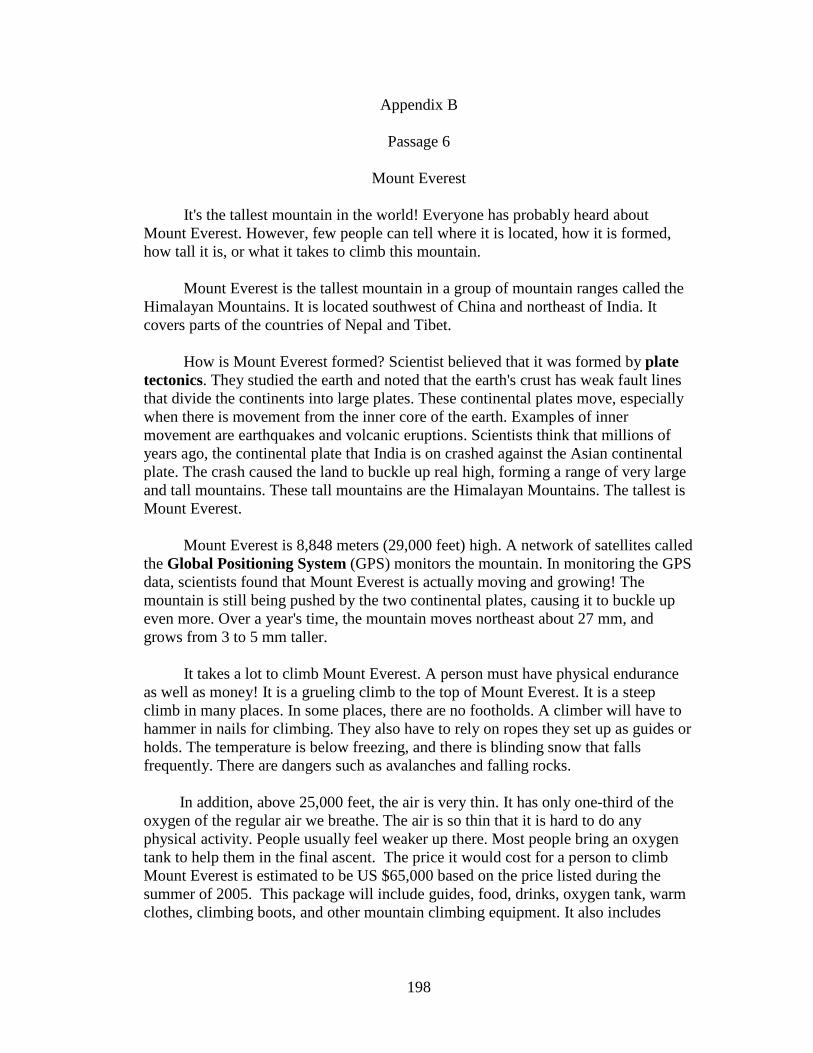
198
Appendix B
Passage 6
Mount Everest It's the tallest mountain in the world! Everyone has probably heard about Mount Everest. However, few people can tell where it is located, how it is formed, how tall it is, or what it takes to climb this mountain. Mount Everest is the tallest mountain in a group of mountain ranges called the Himalayan Mountains. It is located southwest of China and northeast of India. It covers parts of the countries of Nepal and Tibet. How is Mount Everest formed? Scientist believed that it was formed by plate tectonics. They studied the earth and noted that the earth's crust has weak fault lines that divide the continents into large plates. These continental plates move, especially when there is movement from the inner core of the earth. Examples of inner movement are earthquakes and volcanic eruptions. Scientists think that millions of years ago, the continental plate that India is on crashed against the Asian continental plate. The crash caused the land to buckle up real high, forming a range of very large and tall mountains. These tall mountains are the Himalayan Mountains. The tallest is Mount Everest. Mount Everest is 8,848 meters (29,000 feet) high. A network of satellites called the Global Positioning System (GPS) monitors the mountain. In monitoring the GPS data, scientists found that Mount Everest is actually moving and growing! The mountain is still being pushed by the two continental plates, causing it to buckle up even more. Over a year's time, the mountain moves northeast about 27 mm, and grows from 3 to 5 mm taller. It takes a lot to climb Mount Everest. A person must have physical endurance as well as money! It is a grueling climb to the top of Mount Everest. It is a steep climb in many places. In some places, there are no footholds. A climber will have to hammer in nails for climbing. They also have to rely on ropes they set up as guides or holds. The temperature is below freezing, and there is blinding snow that falls frequently. There are dangers such as avalanches and falling rocks. In addition, above 25,000 feet, the air is very thin. It has only one-third of the oxygen of the regular air we breathe. The air is so thin that it is hard to do any physical activity. People usually feel weaker up there. Most people bring an oxygen tank to help them in the final ascent. The price it would cost for a person to climb Mount Everest is estimated to be US $65,000 based on the price listed during the summer of 2005. This package will include guides, food, drinks, oxygen tank, warm clothes, climbing boots, and other mountain climbing equipment. It also includes
199
some medical equipment in case a person gets sick while climbing. It does not include a plane trip to Nepal, where the foothills are located. Why do people still want to climb Mount Everest? It represents nature's challenge. There are people who would like to climb it just “because it's there.” Part A: Questions Select the correct answer for each question. 1. This passage is mainly about ______________. A. how tall and famous Mount Everest is B. how Mount Everest is formed by tectonic plates crushing against each other C. where Mount Everest is located, how it was formed, its height, and what it takes to climb it D. It takes about US $65,000 to climb Mount Everest 2. Where is Mt. Everest located? A. Southwest of India B. South of Nepal C. Northeast of Tibet D. Southwest of China 3. How is Mount Everest formed? A. The continent plates crashed against each other, causing the land to buckle up. B. It is formed by volcanic action. C. It is the result of an earthquake. D. It is divided from a large range of tall mountains. 4. Why do people usually feel weak up on Mount Everest? A. They have little food and water. B. The air is thin. C. There are no footholds on some parts. D. They were sick and needed medical treatment. 5. Why does Mt. Everest grow every year? A. The mountain grows 3 to 5 mm taller every year. B. It grows because more snow and ice fall on it. C. Plate tectonics are continually pushing the land together. D. The wind causes erosion and the rocks on the peak were exposed. 6. Which of the following statements about Mount Everest is an opinion? A. It's the tallest mountain in the world! B. Mount Everest is actually moving and growing! C. The temperature is below freezing.
200
D. It represents nature's challenge. 7. The passage does not say, but we can decide that _____________. A. A Global Positioning System is used for directing traffic to Mt. Everest. B. Scientists have a special interest in Mt. Everest, and developed a Global Positioning System for Mt. Everest only. C. Scientists use a Global Positioning System to monitor major changes about the earth’s surface. D. Scientists believe that a Global Positioning System is better without a network of satellites. 8. Dangers on a climb up Mt. Everest would not include: A. falling off the mountain B. a poor guide C. avalanche D. lack of air 9. Why is the climb so difficult? A. There is blinding snow. B. There are earthquakes. C. The sun is too hot. D. The rocks are too sharp. 10. According to the passage, why do some people climb Mt. Everest? A. People wanted to see how the mountain grows. B. Because it’s there. C. It is the most challenging thing any person can do. D. Some people wanted to show that they are rich enough to afford it. Part B: BCR. Answer by writing a paragraph with supports from the text. Explain what a person needs to do to climb Mount Everest and what to expect climbing this mountain.
201
___________________________________________________________________
Information Sources
Everest cents. (2005). National Geographic Adventure. Retrieved May 7, 2005, from
National Geographic Society Web site: http://www.nationalgeographic.com/
adventure/0305/expert_everest.html
Hillary, E. P. (2005). Mount Everest. Retrieved March 25, 2005, from World Book
Student database: http://worldbookonline.com
Holt, Rinehart, and Winston. (2001). Plate tectonics. In R. W. Todd, D. F. Bowman,
& R. V. Tucek (Eds.), Holt science and technology: Earth science (pp. 164-
165). Austin, TX: Holt, Rinehart and Winston.
Robertson, D. (2005). Everest, Mount. In Encyclopedia Americana (Vol. 10, p. 722).
Danbury, CT: Scholastic Library Publishing, Inc.
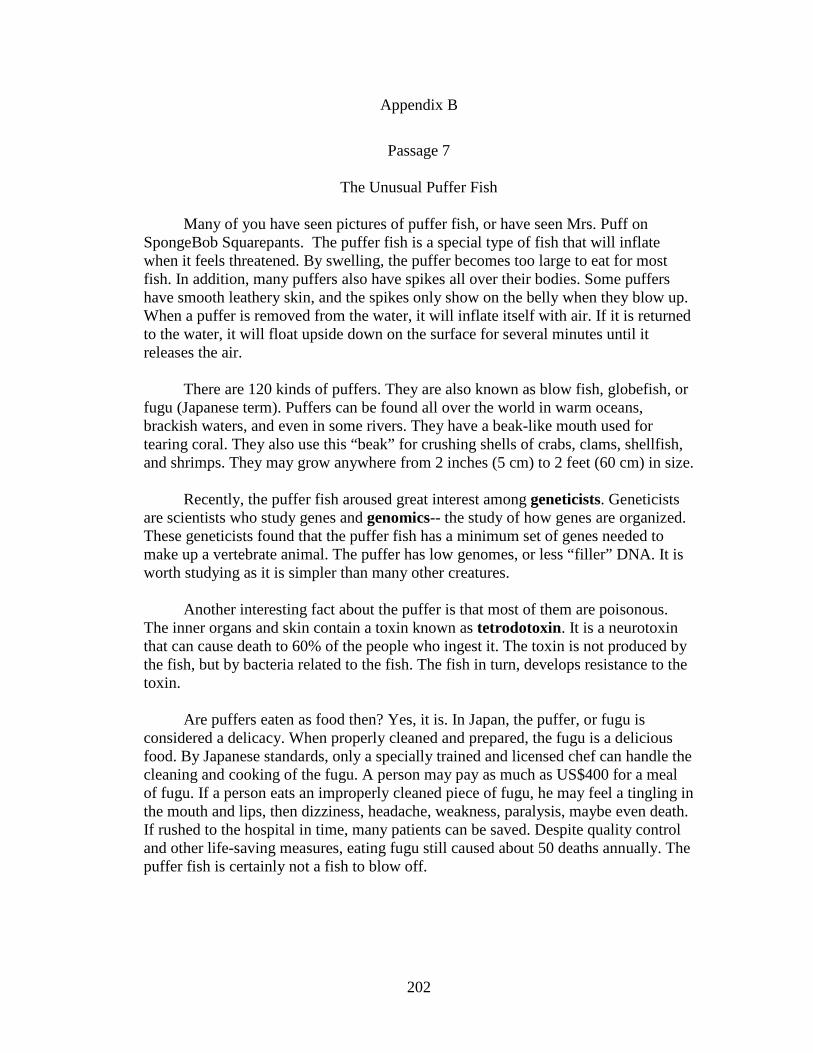
202
Appendix B
Passage 7
The Unusual Puffer Fish
Many of you have seen pictures of puffer fish, or have seen Mrs. Puff on SpongeBob Squarepants. The puffer fish is a special type of fish that will inflate when it feels threatened. By swelling, the puffer becomes too large to eat for most fish. In addition, many puffers also have spikes all over their bodies. Some puffers have smooth leathery skin, and the spikes only show on the belly when they blow up. When a puffer is removed from the water, it will inflate itself with air. If it is returned to the water, it will float upside down on the surface for several minutes until it releases the air. There are 120 kinds of puffers. They are also known as blow fish, globefish, or fugu (Japanese term). Puffers can be found all over the world in warm oceans, brackish waters, and even in some rivers. They have a beak-like mouth used for tearing coral. They also use this “beak” for crushing shells of crabs, clams, shellfish, and shrimps. They may grow anywhere from 2 inches (5 cm) to 2 feet (60 cm) in size. Recently, the puffer fish aroused great interest among geneticists. Geneticists are scientists who study genes and genomics-- the study of how genes are organized. These geneticists found that the puffer fish has a minimum set of genes needed to make up a vertebrate animal. The puffer has low genomes, or less “filler” DNA. It is worth studying as it is simpler than many other creatures. Another interesting fact about the puffer is that most of them are poisonous. The inner organs and skin contain a toxin known as tetrodotoxin. It is a neurotoxin that can cause death to 60% of the people who ingest it. The toxin is not produced by the fish, but by bacteria related to the fish. The fish in turn, develops resistance to the toxin. Are puffers eaten as food then? Yes, it is. In Japan, the puffer, or fugu is considered a delicacy. When properly cleaned and prepared, the fugu is a delicious food. By Japanese standards, only a specially trained and licensed chef can handle the cleaning and cooking of the fugu. A person may pay as much as US$400 for a meal of fugu. If a person eats an improperly cleaned piece of fugu, he may feel a tingling in the mouth and lips, then dizziness, headache, weakness, paralysis, maybe even death. If rushed to the hospital in time, many patients can be saved. Despite quality control and other life-saving measures, eating fugu still caused about 50 deaths annually. The puffer fish is certainly not a fish to blow off.
203
Part A: Questions Select the correct answer for each question. 1. The passage mainly is about_________________. A. what the puffer fish eats and who eats the puffer B. what puffer fish does when it is threatened C. what the puffer fish is like and what is important about them D. how the puffer is poisonous 2. The puffer “blows up” because ______________________________. A. it wants to fight other puffer fish B. it wants to release tetrodotoxin C. it feels like floating D. it feels threatened
3. Geneticist are interested in puffers because _________________________. A. it has a minimum set of genes and is a good sample to study because it is simpler B. it has a maximum set of genes for fish and is worth studying because it is complex C. it has tetrodotoxin and therefore worth geneticists' attention D. it is a vertebrate animal 4. “Low genomes” means __________________________. A. it has less well-organized genes B. it has less “filler” DNA C. it has poisonous substances like tetrodotoxin D. it is a low calorie but high risk food 5. What is not another name for the puffer fish? A. Balloon fish B. Blow fish C. Globe fish D. Fugu 6. Knowing that the puffer fish is poisonous, why do some people eat it? A. They think the poison is not so bad. B. It is considered to be a delicious “delicacy” in Japan. C. Americans like to try Japanese foods. D. Some people want to take risks. 7. The tetrodotoxin is produced by ______________________. A. bacteria in the inner organs and on the skin B. neurotoxin in the spikes
204
C. poisonous glands under the skin D. bacteria in the meat of the puffer 8. Which of the following is an opinion? A. The fugu is a delicious food that is worth trying at least once in a lifetime. B. The fugu meal may cost as much as US$400. C. The fugu is considered a delicacy in Japan. D. The fugu has neurotoxin that can cause death when ingested. 9. Why do Japanese standards insist on having a licensed and trained chef to prepare the puffer fish meal? A. A licensed and trained chef will be able to charge top dollar since he or she is l licensed to prepare the puffer fish meal. B. A licensed and trained chef will be able to spice the puffer fish up to make a most delicious meal. C. A licensed and trained chef has insurance in case the restaurant gets sued for poisoning the food. D. A licensed and trained chef will ensure all organs and skin of the puffer fish are removed properly without allowing bacteria to go on the meat. 10.What are some of the symptoms of puffer fish poisoning? A. Death B. Headache, coughing and sneezing C. Tingling in the mouth, dizziness, paralysis D. Dizziness, weakness, throwing up Part B: BCR. Answer by writing a paragraph with supports from the text. Explain why the puffer is such an unusual fish. Use information from the text to support your answer.
205
_________________________________________________________________
Information Sources
Puffer. In Encyclopedia Americana (Vol. 22, p. 791). Danbury, CT: Scholastic
Library Publishing, Inc.
Puffer fish. (2005). June 2005. Retrieved July 15, 2005, from Web site:
www.whozoo.org/Anlife99/casskeck/puffer.html
Taylor, L. R. (2005). Puffer. Retrieved August 15, 2005, from World Book Student
database: http://worldbookonline.com
Wade, N. (2002, July 26). Fish genes aid human discoveries. The New York Times, p.
A19. Retrieved from http://www.nytimes.com/2002/07/26/us/
fish-genes-aid-human-discoveries.html
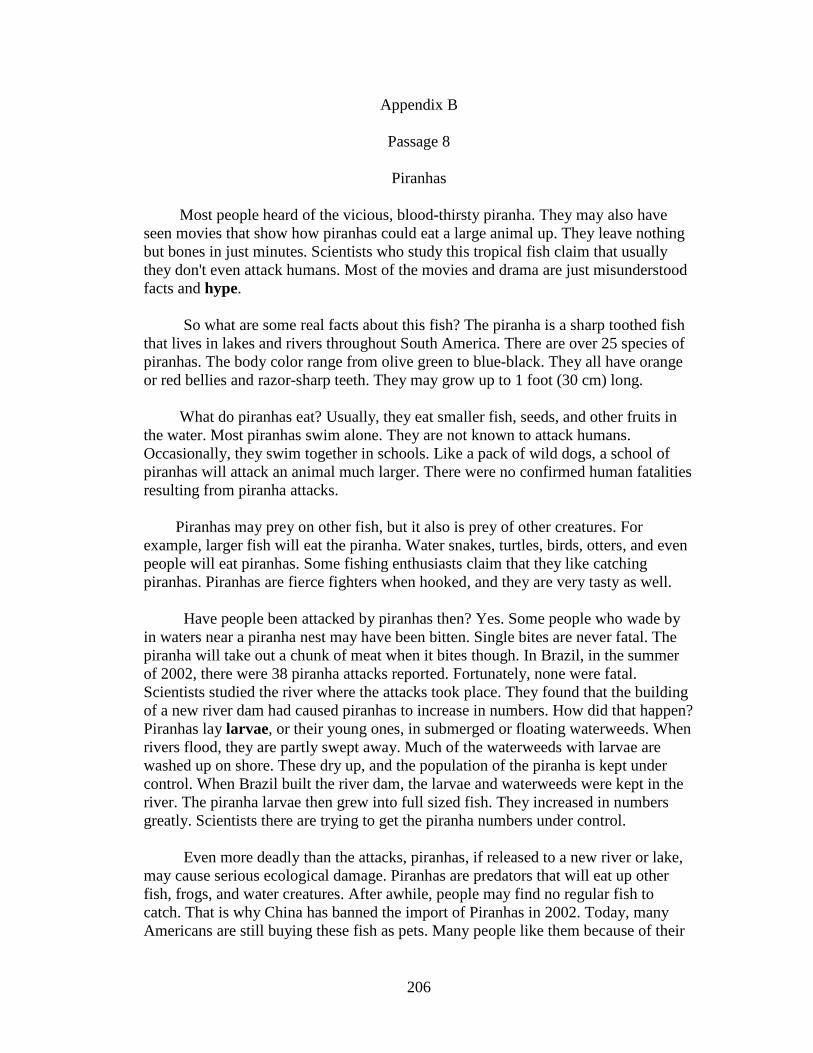
206
Appendix B
Passage 8
Piranhas Most people heard of the vicious, blood-thirsty piranha. They may also have seen movies that show how piranhas could eat a large animal up. They leave nothing but bones in just minutes. Scientists who study this tropical fish claim that usually they don't even attack humans. Most of the movies and drama are just misunderstood facts and hype. So what are some real facts about this fish? The piranha is a sharp toothed fish that lives in lakes and rivers throughout South America. There are over 25 species of piranhas. The body color range from olive green to blue-black. They all have orange or red bellies and razor-sharp teeth. They may grow up to 1 foot (30 cm) long. What do piranhas eat? Usually, they eat smaller fish, seeds, and other fruits in the water. Most piranhas swim alone. They are not known to attack humans. Occasionally, they swim together in schools. Like a pack of wild dogs, a school of piranhas will attack an animal much larger. There were no confirmed human fatalities resulting from piranha attacks. Piranhas may prey on other fish, but it also is prey of other creatures. For example, larger fish will eat the piranha. Water snakes, turtles, birds, otters, and even people will eat piranhas. Some fishing enthusiasts claim that they like catching piranhas. Piranhas are fierce fighters when hooked, and they are very tasty as well. Have people been attacked by piranhas then? Yes. Some people who wade by in waters near a piranha nest may have been bitten. Single bites are never fatal. The piranha will take out a chunk of meat when it bites though. In Brazil, in the summer of 2002, there were 38 piranha attacks reported. Fortunately, none were fatal. Scientists studied the river where the attacks took place. They found that the building of a new river dam had caused piranhas to increase in numbers. How did that happen? Piranhas lay larvae, or their young ones, in submerged or floating waterweeds. When rivers flood, they are partly swept away. Much of the waterweeds with larvae are washed up on shore. These dry up, and the population of the piranha is kept under control. When Brazil built the river dam, the larvae and waterweeds were kept in the river. The piranha larvae then grew into full sized fish. They increased in numbers greatly. Scientists there are trying to get the piranha numbers under control. Even more deadly than the attacks, piranhas, if released to a new river or lake, may cause serious ecological damage. Piranhas are predators that will eat up other fish, frogs, and water creatures. After awhile, people may find no regular fish to catch. That is why China has banned the import of Piranhas in 2002. Today, many Americans are still buying these fish as pets. Many people like them because of their
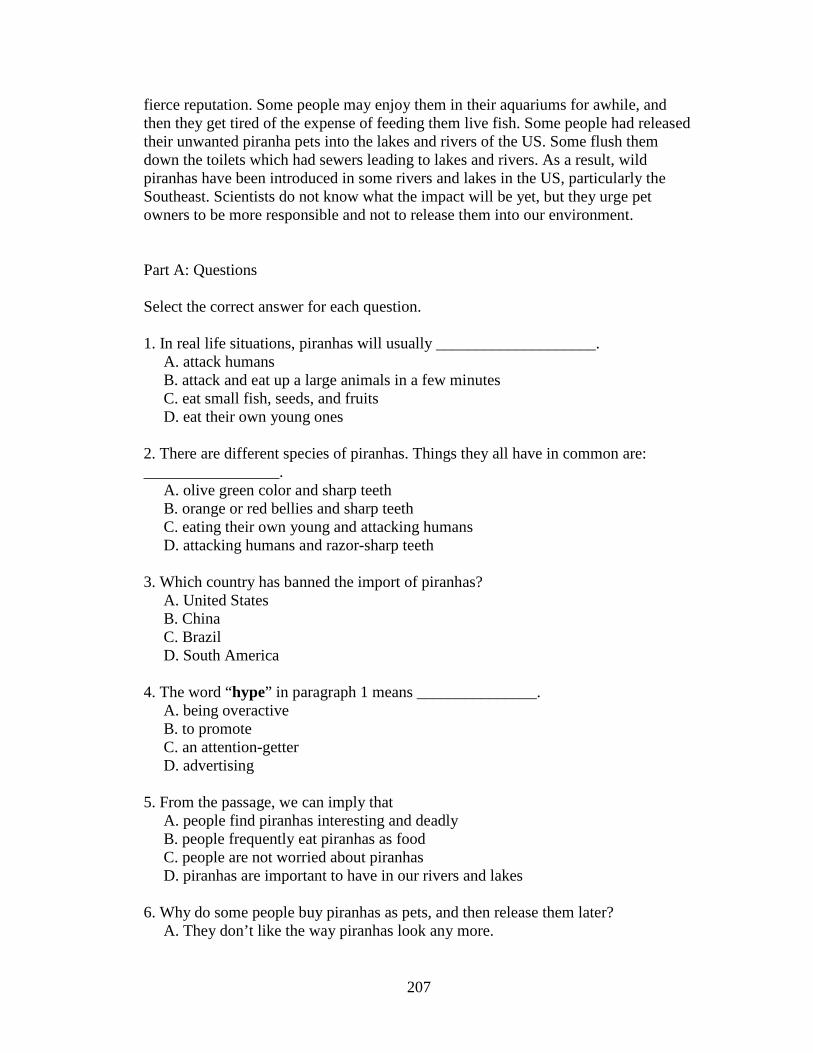
207
fierce reputation. Some people may enjoy them in their aquariums for awhile, and then they get tired of the expense of feeding them live fish. Some people had released their unwanted piranha pets into the lakes and rivers of the US. Some flush them down the toilets which had sewers leading to lakes and rivers. As a result, wild piranhas have been introduced in some rivers and lakes in the US, particularly the Southeast. Scientists do not know what the impact will be yet, but they urge pet owners to be more responsible and not to release them into our environment. Part A: Questions Select the correct answer for each question. 1. In real life situations, piranhas will usually ____________________. A. attack humans B. attack and eat up a large animals in a few minutes C. eat small fish, seeds, and fruits D. eat their own young ones 2. There are different species of piranhas. Things they all have in common are: _________________. A. olive green color and sharp teeth B. orange or red bellies and sharp teeth C. eating their own young and attacking humans D. attacking humans and razor-sharp teeth 3. Which country has banned the import of piranhas? A. United States B. China C. Brazil D. South America 4. The word “hype” in paragraph 1 means _______________. A. being overactive B. to promote C. an attention-getter D. advertising 5. From the passage, we can imply that A. people find piranhas interesting and deadly B. people frequently eat piranhas as food C. people are not worried about piranhas D. piranhas are important to have in our rivers and lakes 6. Why do some people buy piranhas as pets, and then release them later? A. They don’t like the way piranhas look any more.
208
B. They want to pollute the rivers and streams with piranhas. C. They want the piranhas to clean-up the lakes and streams by eating insects. D. Feeding piranhas live fish all the time gets expensive. 7. This passage is mainly about _______________________. A. what piranhas look like and how they attack B. what piranhas are like, what they eat, and how they can be damaging C. how myths about the piranhas are not true D. how America should ban piranhas into this country 8. In Brazil, 2002, there were 38 incidents of piranha attacks on humans. Scientists claim that it was because ___________________. A. much of the waterweeds containing piranha larvae remained in the river due to a new river dam, and the number of piranhas increased B. the piranhas increased in numbers when the river flooded C. the piranhas were dangerous and vicious creatures and attacked because they were hungry D. the waterweeds containing piranha eggs were flooded to new areas and help them increase in numbers 9. An opinion about the piranhas is _____________________. A. they eat smaller fish, seeds, and other fruits in the water B. they are vicious, bloodthirsty, and dangerous to humans C. they may cause serious ecological damage if released into streams where they were not there before D. some people will fish and eat piranhas 10. We can assume that ____________________. A. piranhas are now present in some American rivers and lakes B. piranhas are not found in any American rivers and lakes C. piranhas are peaceful and safe to be around D. piranhas have caused fatalities and should be banned in America Part B: BCR. Answer by writing a paragraph with supports from the text. Explain why releasing piranhas into the streams and lakes of America is not a good idea.
209
_________________________________________________________________
Information Sources
Piranha. (2005). In Encyclopedia Americana (Vol. 22, p. 132). Danbury, CT:
Scholastic Library Publishing, Inc.
Piranhas. (2003). Retrieved June 21, 2005, from Web site:
www.junglephotos.com/animals/fishes/piranhas.htm
Rincon, P. (2003). Piranha increase “due to dams.” BBC News. Sunday, 28,
December 2003. Retrieved June 21, 2005, from Web site:
http://news.bbc.co.uk/1/hi/sci/tech/3346301.stm
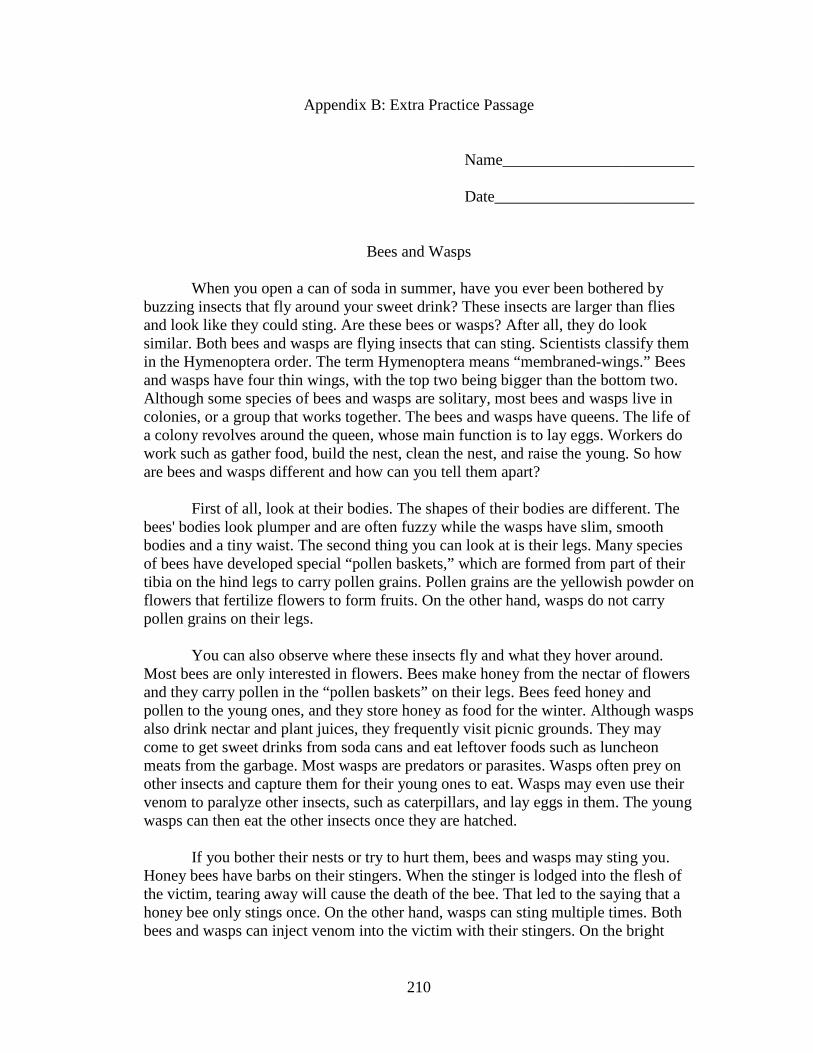
210
Appendix B: Extra Practice Passage
Name________________________
Date_________________________
Bees and Wasps
When you open a can of soda in summer, have you ever been bothered by buzzing insects that fly around your sweet drink? These insects are larger than flies and look like they could sting. Are these bees or wasps? After all, they do look similar. Both bees and wasps are flying insects that can sting. Scientists classify them in the Hymenoptera order. The term Hymenoptera means “membraned-wings.” Bees and wasps have four thin wings, with the top two being bigger than the bottom two. Although some species of bees and wasps are solitary, most bees and wasps live in colonies, or a group that works together. The bees and wasps have queens. The life of a colony revolves around the queen, whose main function is to lay eggs. Workers do work such as gather food, build the nest, clean the nest, and raise the young. So how are bees and wasps different and how can you tell them apart? First of all, look at their bodies. The shapes of their bodies are different. The bees' bodies look plumper and are often fuzzy while the wasps have slim, smooth bodies and a tiny waist. The second thing you can look at is their legs. Many species of bees have developed special “pollen baskets,” which are formed from part of their tibia on the hind legs to carry pollen grains. Pollen grains are the yellowish powder on flowers that fertilize flowers to form fruits. On the other hand, wasps do not carry pollen grains on their legs. You can also observe where these insects fly and what they hover around. Most bees are only interested in flowers. Bees make honey from the nectar of flowers and they carry pollen in the “pollen baskets” on their legs. Bees feed honey and pollen to the young ones, and they store honey as food for the winter. Although wasps also drink nectar and plant juices, they frequently visit picnic grounds. They may come to get sweet drinks from soda cans and eat leftover foods such as luncheon meats from the garbage. Most wasps are predators or parasites. Wasps often prey on other insects and capture them for their young ones to eat. Wasps may even use their venom to paralyze other insects, such as caterpillars, and lay eggs in them. The young wasps can then eat the other insects once they are hatched. If you bother their nests or try to hurt them, bees and wasps may sting you. Honey bees have barbs on their stingers. When the stinger is lodged into the flesh of the victim, tearing away will cause the death of the bee. That led to the saying that a honey bee only stings once. On the other hand, wasps can sting multiple times. Both bees and wasps can inject venom into the victim with their stingers. On the bright
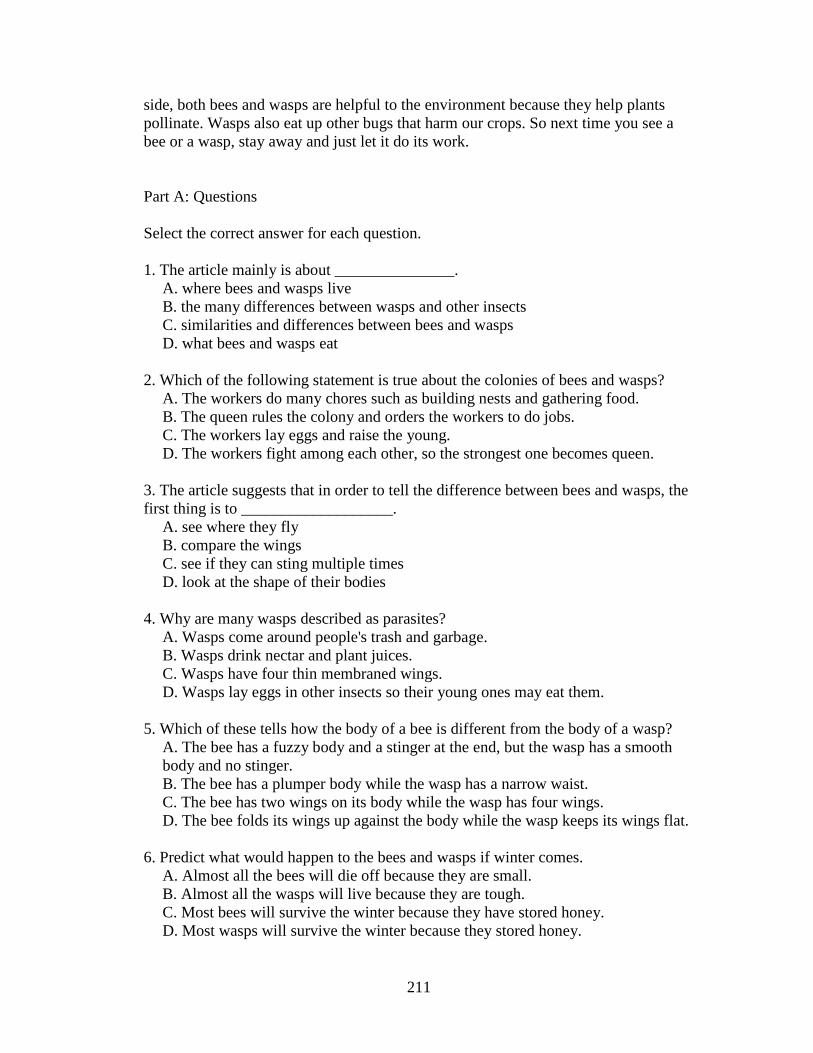
211
side, both bees and wasps are helpful to the environment because they help plants pollinate. Wasps also eat up other bugs that harm our crops. So next time you see a bee or a wasp, stay away and just let it do its work. Part A: Questions Select the correct answer for each question. 1. The article mainly is about _______________.
A. where bees and wasps live B. the many differences between wasps and other insects C. similarities and differences between bees and wasps D. what bees and wasps eat
2. Which of the following statement is true about the colonies of bees and wasps?
A. The workers do many chores such as building nests and gathering food. B. The queen rules the colony and orders the workers to do jobs. C. The workers lay eggs and raise the young. D. The workers fight among each other, so the strongest one becomes queen.
3. The article suggests that in order to tell the difference between bees and wasps, the first thing is to ___________________.
A. see where they fly B. compare the wings C. see if they can sting multiple times D. look at the shape of their bodies
4. Why are many wasps described as parasites?
A. Wasps come around people's trash and garbage. B. Wasps drink nectar and plant juices. C. Wasps have four thin membraned wings. D. Wasps lay eggs in other insects so their young ones may eat them.
5. Which of these tells how the body of a bee is different from the body of a wasp?
A. The bee has a fuzzy body and a stinger at the end, but the wasp has a smooth body and no stinger. B. The bee has a plumper body while the wasp has a narrow waist. C. The bee has two wings on its body while the wasp has four wings. D. The bee folds its wings up against the body while the wasp keeps its wings flat.
6. Predict what would happen to the bees and wasps if winter comes. A. Almost all the bees will die off because they are small. B. Almost all the wasps will live because they are tough. C. Most bees will survive the winter because they have stored honey. D. Most wasps will survive the winter because they stored honey.
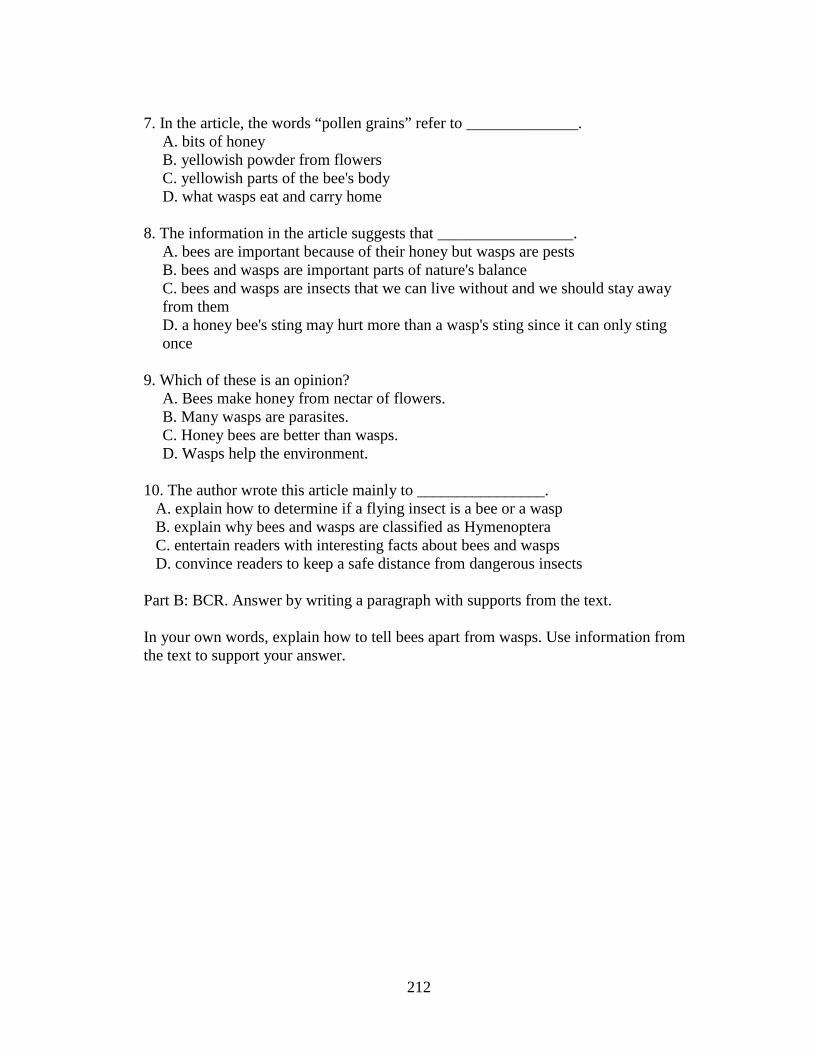
212
7. In the article, the words “pollen grains” refer to ______________.
A. bits of honey B. yellowish powder from flowers C. yellowish parts of the bee's body D. what wasps eat and carry home
8. The information in the article suggests that _________________. A. bees are important because of their honey but wasps are pests B. bees and wasps are important parts of nature's balance C. bees and wasps are insects that we can live without and we should stay away from them D. a honey bee's sting may hurt more than a wasp's sting since it can only sting once
9. Which of these is an opinion? A. Bees make honey from nectar of flowers. B. Many wasps are parasites. C. Honey bees are better than wasps. D. Wasps help the environment.
10. The author wrote this article mainly to ________________. A. explain how to determine if a flying insect is a bee or a wasp B. explain why bees and wasps are classified as Hymenoptera C. entertain readers with interesting facts about bees and wasps D. convince readers to keep a safe distance from dangerous insects Part B: BCR. Answer by writing a paragraph with supports from the text. In your own words, explain how to tell bees apart from wasps. Use information from the text to support your answer.
213
_________________________________________________________________
Information Sources
Duncan, C. D. (1964). Wasp. In The world book: Vols. 20. W. X. Y. Z. Chicago: Field
Enterprises Educational Corporation.
Iowa insect information notes. (2005). Bees and wasps. Retrieved March 23, 2008,
from Iowa State University of Science and Technology, Department of
Entomology Web site:
http://www.ipm.iastate.edu/ipm/iiin/taxonomy_menu/2/97
McShaffrey, D. (1996). Bees, wasps, and hornets. In Marietta Natural Historical
Society. Retrieved March 24, 2008, from Marietta College, Biology
Department Web site: http://www.marietta.edu/~biol/mnhs/mnhsbees.html
Oertel, E. (1964). Bee. The world book: Volume 2. B. Chicago: Field enterprises
Educational Corporation.
Yellow jackets and other wasps. (2008, March 3). Retrieved March 23, 2008, from
http://www.ebeehoney.com/beeid.html
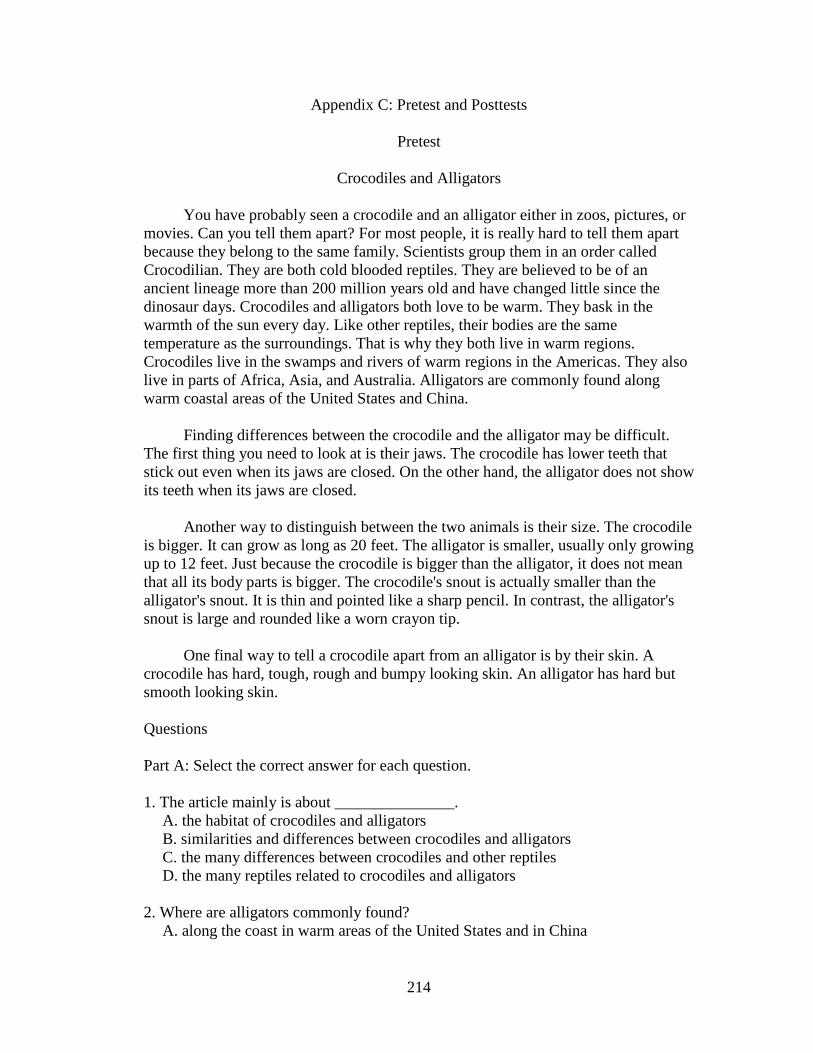
214
Appendix C: Pretest and Posttests
Pretest
Crocodiles and Alligators You have probably seen a crocodile and an alligator either in zoos, pictures, or movies. Can you tell them apart? For most people, it is really hard to tell them apart because they belong to the same family. Scientists group them in an order called Crocodilian. They are both cold blooded reptiles. They are believed to be of an ancient lineage more than 200 million years old and have changed little since the dinosaur days. Crocodiles and alligators both love to be warm. They bask in the warmth of the sun every day. Like other reptiles, their bodies are the same temperature as the surroundings. That is why they both live in warm regions. Crocodiles live in the swamps and rivers of warm regions in the Americas. They also live in parts of Africa, Asia, and Australia. Alligators are commonly found along warm coastal areas of the United States and China. Finding differences between the crocodile and the alligator may be difficult. The first thing you need to look at is their jaws. The crocodile has lower teeth that stick out even when its jaws are closed. On the other hand, the alligator does not show its teeth when its jaws are closed. Another way to distinguish between the two animals is their size. The crocodile is bigger. It can grow as long as 20 feet. The alligator is smaller, usually only growing up to 12 feet. Just because the crocodile is bigger than the alligator, it does not mean that all its body parts is bigger. The crocodile's snout is actually smaller than the alligator's snout. It is thin and pointed like a sharp pencil. In contrast, the alligator's snout is large and rounded like a worn crayon tip. One final way to tell a crocodile apart from an alligator is by their skin. A crocodile has hard, tough, rough and bumpy looking skin. An alligator has hard but smooth looking skin. Questions Part A: Select the correct answer for each question. 1. The article mainly is about _______________.
A. the habitat of crocodiles and alligators B. similarities and differences between crocodiles and alligators C. the many differences between crocodiles and other reptiles D. the many reptiles related to crocodiles and alligators
2. Where are alligators commonly found?
A. along the coast in warm areas of the United States and in China
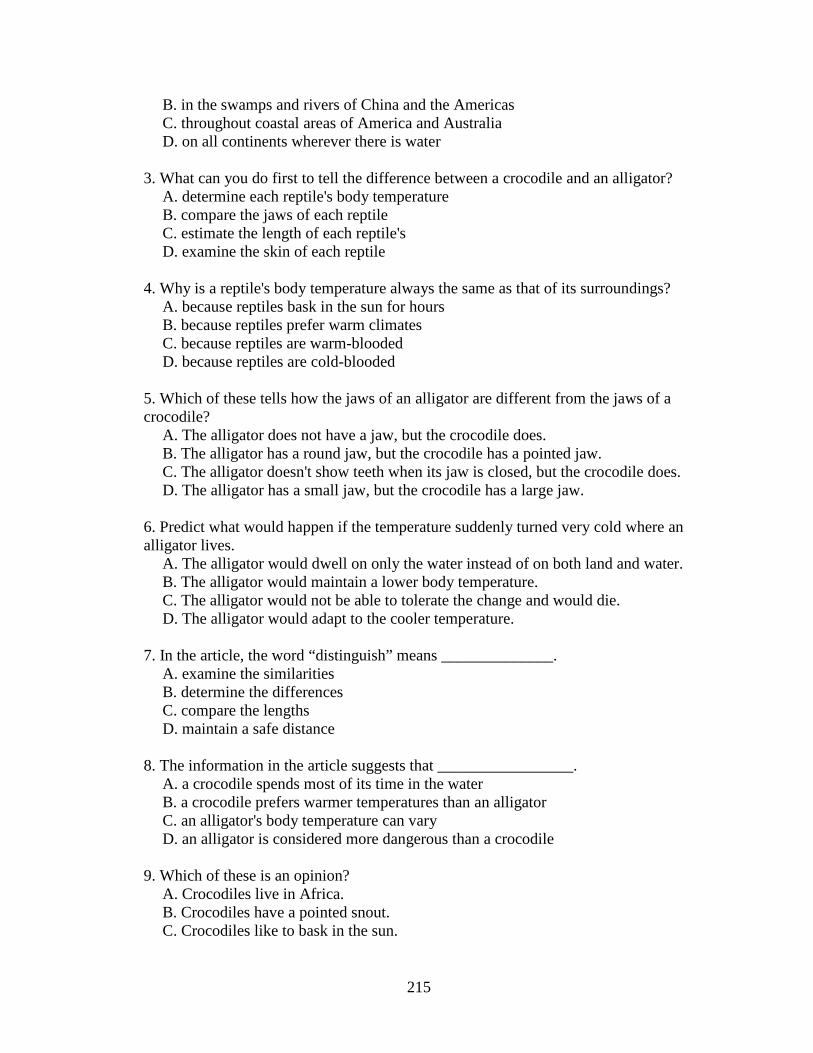
215
B. in the swamps and rivers of China and the Americas C. throughout coastal areas of America and Australia D. on all continents wherever there is water
3. What can you do first to tell the difference between a crocodile and an alligator?
A. determine each reptile's body temperature B. compare the jaws of each reptile C. estimate the length of each reptile's D. examine the skin of each reptile
4. Why is a reptile's body temperature always the same as that of its surroundings?
A. because reptiles bask in the sun for hours B. because reptiles prefer warm climates C. because reptiles are warm-blooded D. because reptiles are cold-blooded
5. Which of these tells how the jaws of an alligator are different from the jaws of a crocodile?
A. The alligator does not have a jaw, but the crocodile does. B. The alligator has a round jaw, but the crocodile has a pointed jaw. C. The alligator doesn't show teeth when its jaw is closed, but the crocodile does. D. The alligator has a small jaw, but the crocodile has a large jaw.
6. Predict what would happen if the temperature suddenly turned very cold where an alligator lives.
A. The alligator would dwell on only the water instead of on both land and water. B. The alligator would maintain a lower body temperature. C. The alligator would not be able to tolerate the change and would die. D. The alligator would adapt to the cooler temperature.
7. In the article, the word “distinguish” means ______________. A. examine the similarities B. determine the differences C. compare the lengths D. maintain a safe distance
8. The information in the article suggests that _________________. A. a crocodile spends most of its time in the water B. a crocodile prefers warmer temperatures than an alligator C. an alligator's body temperature can vary D. an alligator is considered more dangerous than a crocodile
9. Which of these is an opinion? A. Crocodiles live in Africa. B. Crocodiles have a pointed snout. C. Crocodiles like to bask in the sun.
216
D. Crocodiles are interesting reptiles.
10. The author wrote this article mainly to ________________. A. explain how to determine if a reptile is a crocodile or an alligator B. explain why crocodiles and alligators are classified as reptiles C. entertain readers with interesting facts about crocodiles and alligators D. convince readers to keep a safe distance from dangerous reptiles Part B: BCR. Answer by writing a paragraph with supports from the text. In your own words, explain how crocodiles and alligators are different. Use information from the text to support your answer.
_________________________________________________________________
Information Sources
American alligator. (2005). Marine wildlife. Retrieved May 8, 2005, from National
Parks Conservation Association Web site: http://www.npca.org/
marine_and_coastal/marine_wildlife/alligator.html
American crocodile. (2005). Marine wildlife. Retrieved May 8, 2005, from National
Parks Conservation Association Web site: http://www.npca.org/
marine_and_coastal/marine_wildlife/crocodile.html
McDowell, S. (2005). Alligator. In Encyclopedia Americana (Vol. 1, p. 600).
Danbury, CT: Scholastic Library Publishing, Inc.
Pope, C. H. (2005). Crocodile. In Encyclopedia Americana (Vol. 8, pp. 231-233).
Danbury, CT: Scholastic Library Publishing, Inc.
217
Appendix C
Posttest 1 A
Name__________________________
Date___________________________
Octopus and Squid
Have you seen an octopus before? What about a squid? You probably remembered that they were both sea creatures and that they both have lots of tentacles, or long arms with suction cups. You are right, of course. They use their tentacles to move as well as to capture fish, crabs, and other sea creatures for food. They belong to the family of invertebrates, which means that they do not have skeletal backbones. Instead, these creatures have a mantle or skin cover that protects their body. Both can live in shallow waters or the deep oceans. Many species of the octopus and squid can change color to blend with their backgrounds and even squirt out ink to confuse their enemies, such as the sperm whale. While these two creatures have a lot in common, they also have differences. One main difference between the octopus and the squid is that they do look different. First, count their arms. An octopus has eight arms or tentacles. On the other hand, the squid has ten arms. Some scientists say that eight of the squid's arms are arms with suction cups, and the other two are tentacles because they are longer than the other eight arms. Next, look at their body shapes. The octopus is more rounded, with the tentacles attached to a bulb-like head. There is hardly any body at all. In contrast, the squid has a tube-like body and the arms are all attached to a small head on one end. Another major difference between the two creatures is the size. Some octopuses only grow to be 2 inches, but larger species of octopus can have arms that are 16 feet long. Similarly, some squids only grow to be 2 inches; however, the giant squid can grow 20 to 50 feet. From observing suction cup scars that squids left on whales, some scientists decided that some squids may be as large as 200 feet! The squid is the largest of all invertebrates. One other difference between the octopus and the squid is their behavior and habits. The octopus often crawls on its tentacles. The squid only swims. Since the octopus has no bones, it can crawl through small holes. On the other hand, the squid has a shell called a “pen” under its mantle, so it cannot squeeze through small spaces like the octopus. The octopus also likes to stay in its territory. In contrast, the squid swims all over the place and migrates. The octopus and the squid may be different in many ways, but one thing is common-- they are eaten as food by many people, particularly those from
218
Mediterranean Countries and Asian countries around the Pacific ocean. Scientists also like to study them because they are smart creatures and useful for research. Part A: Questions Select the correct answer for each question. 1. The article is mainly about _______________________. A. the habits and behaviors of the octopus and the squid B. the many differences between the octopus and the squid C. the similarities and differences between the octopus and the squid D. the many invertebrates related to the octopus and the squid 2. According to the article, what is the first thing you can do to tell the difference between an octopus and a squid? A. Look at their body shapes. B. Watch how they behave. C. See if the creature can crawl through a small hole. D. Count their arms. 3. Why is it that an octopus can squeeze through a small hole? A. The squid has a “pen” in the mantle. B. The octopus has a “pen” in the mantle. C. The octopus has no bones or shell in its body. D. Compared to the squid, the octopus is more skilled and clever. 4. Which of the following tells how the behavior of the octopus is different than that of the squid? A. The octopus may walk or crawl on the bottom of the sea. B. The octopus can squirt out ink to confuse its enemy. C. The octopus may be small and only grow to be 2 inches. D. Many people eat the octopus. 5. Predict what may happen if a squid encounters a large enemy such as the sperm whale. A. The squid may shoot poison into the whale and then immobilize it. B. The squid may wrap its tentacles around the whale and eat it by pulling it into its mouth. C. The squid may squirt out ink, but if it can't get away then it will wrap its tentacles around the whale and fight. D. The squid may be frightened and becomes still, then sperm whale swallows it. 6. In the article, the word “invertebrates” means ___________________. A. covered by skin B. covered with a mantle
219
C. no backbone D. sea creature 7. According to the passage, who eats squids and octopus? A. people in some African countries B. people from Mediterranean countries and East Europe C. people who go to special fancy restaurants D. people from Mediterranean Countries and some Asian countries 8. The information in the article suggests that ____________________. A. the octopus and the squid are an important food resource B. the octopus and the squid are endangered species C. the octopus and the squid are dangerous creatures D. the octopus and the squid are friendly to humans 9. Which of the following is an opinion? A. Some species of the octopus can squirt out ink to confuse its enemies. B. The octopus is more interesting than the squid because it can swim, crawl, and squeeze through small holes. C. The giant squid is the largest invertebrate in the world. D. The giant squid has a “pen” under its mantle and therefore cannot squeeze through small holes. 10. The author mainly wrote this article to ______________________. A. explain how the octopus and the squid belong to the same scientific family, yet they have their differences B. entertain readers with interesting facts about the octopus and the squid C. explain why the octopus and the squid have ways to escape from their natural enemies. For example, they may squirt ink D. convince readers to try and eat some octopus and squid Part B: BCR. Answer by writing a paragraph with supports from the text. In your own words, explain how the octopus is different than the squid. Use information from the text to support your answer.
220
_________________________________________________________________
Information Sources
Giant Pacific octopus. (n. d.). Cephalopod: Invertebrates. (Smithsonian National
Zoological Park). Retrieved November 17, 2007, from Smithsonian Institution
Web site: http://nationalzoo.si.edu/default.cfm
Humboldt or jumbo squid (n. d.). Cephalopod: Invertebrates. (Smithsonian National
Zoological Park). Retrieved November 17, 2007, from Smithsonian Institution
Web site: http://nationalzoo.si.edu/default.cfm
Octopus. (2005). In Encyclopedia Americana (International Edition, Volume O).
Danbury, CT: Scholastic Library Publishing, Inc.
Squid. (2005). In Encyclopedia Americana (International Edition, Volume S).
Danbury, CT: Scholastic Library Publishing, Inc.
221
Posttest 2
Name_______________________
Date________________________
Butterflies and Moths You may have seen colorful butterflies fluttering in the breeze before, or seen pictures of butterflies. Some poets describe them as flowers that fly. Sometimes what people think is a butterfly may be a moth. Although many people think that butterflies are colorful and moths are dull, that is not always true. Some butterflies can be plain and some moths colorful. Butterflies and moths look similar and belong to the same winged insect family called Lepidoptera. The word "Lepidoptera" is derived from a Greek word meaning "scale wing." There are 165,000 species of Lepidoptera worldwide, of which 24,000 are butterflies and the others are moths. Butterflies and moths range in size from a tiny 1/8 inch to a huge almost 12 inches. They both go through a life cycle that takes them through different stages called metamorphosis. They hatch from eggs and live as larvae known as caterpillars. Then the caterpillars change into pupae, and finally emerge as full grown adults. The adults lay eggs and die soon after. Then the life cycle starts over for a new generation. So how can you tell the difference between a butterfly and a moth? Although the butterfly and moth look similar, there are ways to tell them apart. First, look at their feelers or antennae on top of their heads. The butterflies have thin antennae. At the end of each antenna is a little knob. The moths, on the other hand, have feathery looking antennae and they appear thicker. Second, look at their bodies. The butterflies have thin bodies while the moths have thicker, plump bodies. Another way you can tell butterflies apart from moths is by observing how they fold their wings when they rest. Butterflies fold their wings up or they spread them out at an angle. Moths fold their wings flat over their bodies. Many moths end up looking like a triangular shape when they are at rest. One last way to tell butterflies apart from moths is by their habits. Butterflies usually fly in the day while moths tend to fly out at night. Some butterflies even use poison as a defense system. For example, the monarch butterfly feeds on poisonous plants such as the milkweed so that few birds would want to eat them. Moths are not known to use poison as a defense system. Both butterflies and moths help plants grow. They bring pollen from flower to flower, pollinating them so that new fruits can be formed. They are also beautiful to look at. Some people even collect them as specimens! Questions
222
Part A: Questions Select the correct answer for each question. 1. The article is mainly about _______________________. A. the habits and behaviors of butterflies and moths B. the importance of butterflies and moths in the plant world C. the similarities and differences between butterflies and moths D. how butterflies and moths are related and belong to the same family 2. According to the article, what is the first thing you can do to tell the difference between butterflies and moths? A. Observe how they fold their wings. B. Watch how they behave. C. Look at their antennae. D. Check to see whether they feed on milkweed. 3. The stages that butterflies and moths go through can be explained as _________. A. eggs, pupae, larvae, adult B. eggs, larvae, pupae, adult C. eggs, caterpillars, larvae, adult D. adult, eggs, pupae, larvae 4. Which of the following tells how the behavior of butterflies is different than that of moths? A. Butterflies fly in the day while moths fly at night. B. Butterflies are colorful while moths are dull-colored. C. Moths may have poisons. D. Butterflies have thin antennae while moths have thick feathery antennae. 5. Predict what may happen if a bird eats the monarch butterfly. A. The bird will enjoy a good meal. B. The bird may not care that the monarch butterfly looks beautiful. C. The bird may get sick or it may die. D. The bird will try to eat more monarch butterflies after it tried one. 6. In the article, the word “metamorphosis” means ___________________. A. growing up B. a type of butterflies C. a type of winged insect D. a cycle of changes 7. Which of the following sentences states a fact? A. Butterflies are more colorful and moths are always dull. B. Butterflies and moths range in sizes, from a tiny 1/16 inch to 12 inches. C. Butterflies belong to a group called Lepidoptera while moths belong to a
223
different family. D. Both butterflies and moths go through metamorphosis to become adults. 8. The information in the article suggests that ____________________. A. butterflies and moths are important because they help plants B. butterflies and moths are endangered species C. butterflies and moths should be collected as specimens D. butterflies and moths use poison as a defense against their enemies 9. Which of the following is an opinion? A. Many butterflies fold their wings up when they are at rest. B. Butterflies are more interesting and colorful than moths. C. Butterflies and moths belong to the Lepidoptera family. D. Moths usually fly out at night. 10. The author mainly wrote this article to ______________________. A. explain how butterflies and moths belong to the same scientific family, yet they have their differences B. entertain readers with interesting facts about butterflies and moths C. explain why butterflies and moths go through metamorphosis D. convince readers to save butterflies and moths from extinction Part B: BCR. Answer by writing a paragraph with supports from the text. In your own words, explain how to tell butterflies apart from moths. Use information from the text to support your answer.
224
_________________________________________________________________
Information Sources
Bartlette, T. (2007, October 7). Moths. In BugGuide. Retrieved December 26, 2007,
from website http://bugguide.net/node/view/82
Butterfly life cycle and biology. (2007). The Butterfly Site. Retrieved December 26,
2007, from website http://www.thebutterflysite.com/biology.shtml
Klots, A. B. (2005). Butterflies and moths. In Encyclopedia Americana (Vol. 5, pp.
69-76). Danbury, CT: Scholastic Library Publishing, Inc.
Moth. (2005). In Encyclopedia Americana (Vol. 19, p. 501). Danbury, CT:
Scholastic Library Publishing, Inc.
225
Posttest 1B (Alternative)
Poisonous and Nonpoisonous Snakes of America
Many people are afraid of snakes. Most snakes are more afraid of people. One thing that makes people especially cautious about snakes is that some of them are poisonous. There are about 2,700 species of snakes. Only about 250 species are poisonous. How are poisonous snakes different from nonpoisonous snakes? Poisonous snakes have fangs with hollow grooves. The snakes inject venom through their fangs when they bite. Nonpoisonous snakes have no fangs or venom. However, there is no easy way to distinguish all poisonous snakes from nonpoisonous ones. A person must either recognize the special features of specific species, or see whether the snake has fangs. In America, there are only two main types of poisonous snakes-- the coral snake and the group known as pit vipers. The coral snake is brightly colored. It has orange, white, and black sections. The coral snake has short front fangs that are fixed in place. The other group of poisonous snakes is the pit viper. It has its name because these snakes have pits or depressions around the eyes and nostrils. These pits are infrared-ray detectors that help them find prey in the dark. These snakes have venom that is produced in a large gland behind the eye. When the snake bites its prey, venom is forced down from the venom glands into ducts. The ducts lead to the teeth, which is like a hallow needle. Then the snake venom is shot into the prey. Most of the pit vipers in the United States are rattlesnakes. The largest rattler is the diamondback, which grows up to more than 7 feet (2 meters). These snakes are called rattlers because they have a “rattle” at the end of their tails made of hard skin. They rattle when they are disturbed. Other types of pit vipers include the copperhead and the water moccasin. The copperhead also accounts for most cases of venomous snake bites in the country. However, its venom is rather mild. Unlike copperheads that live on land, the water moccasin lives in shallow waters. It is also a type of viper, but its fangs are short. Its venom is stronger than the copperhead. Pit vipers mainly eat rodents and smaller creatures. There are many species of nonpoisonous snakes in America. The nonpoisonous snakes include blind snakes, water snakes, bull snakes, rat snakes, black snakes, garter snakes, brown snakes, water snakes, and corn snakes. Scientists classify 75% of all snakes as common harmless snakes. The blind snake looks like a worm and burrows in the ground. They are often small, less than a foot. The water snakes live in edges of lakes and streams. Most of these common harmless snakes eat mice and other small creatures. Of all the nonpoisonous snakes mentioned, the king snake is quite unusual. It will also eat other snakes. It would wrap itself around a snake of a different species and crush it by constricting.
226
Poisonous or not, most snakes are really not interested in harming humans unless they felt threatened. In fact, snakes help people in many ways. They eat up rodents, insects, and pests that eat up our crops or infest the area. Scientists claim that they form part of the environment and help preserve the balance of nature. Certain species of snakes also make good pets. Some people even make snake products for money. Oddly enough, the most valuable product of a snake is its venom. The price ranges from $40 a gram to $200 a gram! Part A: Questions Select the correct answer for each question. 1. How is a poisonous snake different from a nonpoisonous snake? A. A poisonous snake is colorful, but a nonpoisonous snake is plain. B. A poisonous snake has venom, but a nonpoisonous snake has a rattler on its tail. C. A poisonous snake lives in the water, but a nonpoisonous snake lives on land. D. A poisonous snake has fangs with hollow grooves, but a nonpoisonous snake does not. 2. The word “depression” in paragraph 3 means __________________. A. a sad mood or feeling of dejection B. a sunken place that is deeper than the surrounding C. a time when people have little money and few jobs D. low atmospheric pressure 3. Which of the following expresses an opinion? A. Snakes can be dangerous because some are poisonous. B. Snakes can be helpful to humans. C. It is very easy to identify poisonous snakes from nonpoisonous ones. D. The largest rattler is the diamondback. 4. Predict what may happen if there are no snakes (poisonous or nonpoisonous). A. There will be more rodents, insects, and pests. B. People will lead happier, safer lives. C. There will be more fish like eels that look like snakes but are not really snakes. D. People will manufacture lots of venom from chemicals instead. 5. The passage does not say, but we can decide that ___________________. A. people bitten by the copperhead will all die B. people bitten by the copperhead usually will survive C. the water moccasin is less dangerous than the bull snake D. the king snake is very dangerous to humans because it can constrict 6. According to the passage, ______________________________. A. it is easy to distinguish poisonous snakes from the nonpoisonous ones
227
B. all snakes have fangs C. snakes are helpful to humans because they eat mice and other pests D. snakes are dangerous and should be killed 7. The most valuable part of a snake is ___________________. A. the rattle B. the leather or skin C. the fangs D. the venom 8.How does a poisonous snake put its venom in the prey? A. Venom is produced in venom glands located under the eyes or pits of the poisonous snake. B. Venom from the glands goes into ducts that lead to the hollow, needle-like teeth. The venom is then shot into the prey when the snake bites. C. Venom is spat out by the snake's forked tongue, which paralyzes its prey. D. Venom is produced by bacterium located under the skin and teeth. When the snake bites its prey, the prey will be infected. 9.One point the author wants the readers to know is that __________________. A. it is easy to tell a poisonous snake apart from a nonpoisonous snake B. snakes form part of the environment and help preserve the balance of nature C. snakes make good pets once their venom glands are removed D. copperheads account for the most frequent venomous snake bites, and many people died as a result 10. The passage is mainly about ________________________. A. how to tell poisonous and nonpoisonous snakes of America apart, and how snakes are actually good for the environment B. why we need to get rid of the two kinds of snakes-- the poisonous and nonpoisonous snakes of America C. how people can make money off poisonous snakes D. the poisonous and nonpoisonous snakes of America are alike in many ways, and the king snake is best of all Part B: BCR. Answer by writing a paragraph with supports from the text. Explain how to tell poisonous snakes apart from nonpoisonous snakes. Use information from the passage to support your answer.
228
_________________________________________________________________
Information Sources
Dowling, H. G. (2005). Snake. In Encyclopedia Americana (Vol. 25, pp. 85-101).
Danbury, CT: Scholastic Library Publishing, Inc.
Fact sheets. (2005). Reptiles and amphibians. Retrieved March 7, 2005, from
Smithsonian Institution National Zoological Park Web site:
http://nationalzoo.si.edu/Animals/ReptilesAmphibians/default.cfm
Mauldin, D., & Wellman, C. (2005). Snakes and us. In Trail quest. Retrieved April
10, 2005, from Appalachian Trail Conservancy Web site:
http://www.trailquest.net/SNsnakes_us.html
229
Appendix D
LESSON PLANS
EXPERIMENTAL GROUP INSTRUCTION
Set 1: Representational Instruction Using Visual Aids
Time Allotted:
Two class periods (45 minutes each). For day 2, continue where the class left
off after repeating “What is Mental Imagery.”
Materials:
The passage “Marianna Trench,” paper, pencils, picture of the Mariana Trench,
pictures of undersea animals such as tube worms, angler fish, under water hydro-
thermal vents, submersible, Map of the World
Objective: Students will be able to use visual aids to help create mental imageries
connected with the Mariana Trench
Introduction: (5 minutes)
Ask students if they know how deep is the deepest part of the ocean. Show a
picture of what it may look like. (Pictures of the ocean trench and various sea
creatures can be easily obtained on the Internet.) Generate some discussion.
Warm-up: (7 minutes)
Ask students to locate the Marianna Trench using the Map of the World.
Teacher Directed Instruction:
What is Mental Imagery?
Explain to the students that they will be learning a strategy that will help them
understand what they read better and make what they read more interesting, building
230
on the knowledge and experience that they have. The strategy is called mental
imagery. Much of the strategy involves making pictures in their minds. It also
includes recalling images, sensations, and feelings experienced that relate to what
they read-- including smells, feelings, sensations, sounds, and tastes.
Directed Practice:
Read the first paragraph to the students and give examples of images that form
in your head as you read (during reading images). Then sum up as a complete
package what the text about the “Marianna Trench” makes you see, sense, or feel
(after reading image).
Encourage students to share some of their mental images.
Paired Practice:
With a partner, students will read the rest of the passage and discuss with a
partner what other mental images they could bring up. (If the class dynamics is one
that is uncooperative, have students read independently. At regular interval such as 10
minutes, ask students to share what they have thought about, and share some
examples.) When the students have completed their discussion, show them pictures of
undersea creatures, etc. Ask students if they noticed a match in their mental imagery
and what it really looked like. Discuss how words may not fully describe everything,
but they should find that the basic information for forming mental images is there.
Independent Practice:
Students will review the passage on their own and answer comprehension
questions independently. Check answers. Discuss how seeing the pictures helped
them understand the passage better.

231
Conclusion:
Tell the students they did a good job, and that next time, they will be drawing
their own pictures to help them understand the passage better.
232
Appendix D
LESSON PLANS
EXPERIMENTAL GROUP INSTRUCTION
Set 2: Representational Instruction Using Mental Pictures and Self-Generated
Drawings
Time Allotted:
Two class periods. For Day 2, continue where the class left off after reminding
them that their task is to draw diagrams and pictures that come to their minds and that
will help them understand the passage better.
Materials: The passage “Volcanic Eruptions,” paper, pencils
Objective:
Students will be able to create mental images, pictures and diagrams to
help them understand and interpret the passage.
Warm-up: (5 minutes)
Ask students if they know something about volcanoes. Generate some
discussion.
Teacher Directed Instruction:
Tell students that when they form mental images in their heads, one way to
record it is to draw diagrams and pictures. These pictures and diagrams do not have to
be beautiful art pieces. Stick figures will do. The purpose is to draw quick pictures
and diagrams that will help them with understanding the passage-- not any random
beautiful picture. They need to know that since this is a strategy for comprehension,
233
they cannot take too long, because this is not for art. Usually when they do any
reading task like this, such as benchmark tests, they have limited time.
Directed Practice:
Read the first paragraph to the students and give examples of images that form
in your head as you read (during reading images). Draw some quick diagrams or
pictures on the board to demonstrate this. Then sum up as a complete package what
the first paragraph makes you feel or see by drawing another quick drawing (after
reading images).
Paired Practice:
With a partner, students will read the rest of the passage. They will draw
pictures and diagrams, and discuss with a partner what other mental images they
could bring up. (If the class dynamics is one that is uncooperative, have students read
independently. At regular interval such as 10 minutes, ask students to share what they
have drawn, and share some samples.) Ask if they noticed a match or some
differences on their pictures and what someone else had. Tell them how it is all fine
as long as the picture relates to the passage and helps them understand the text better.
Encourage students to share some of their mental images.
Independent Practice:
Students will review the passage on their own and answer comprehension
questions independently. Check answers. Discuss how drawing the pictures helped
them understand the passage better.
Conclusion:

234
Tell the students they did a good job, and that next time they will be using
mental pictures and think-along ideas.
235
Appendix D
LESSON PLANS
EXPERIMENTAL GROUP INSTRUCTION
Set 3: Representational Instruction Using Mental Pictures and Think-along
Ideas
Time Allotted:
Two class periods. For Day 1, students will use the passage “Earthquake
Resistant Buildings.” For Day 2, continue the same directions except use the passage
“Is There Life on Mars?”
Materials:
The passages mentioned above, paper, pencils (overhead projector and
transparency is a good option instead of writing on the board), Images Chart (See
Appendix E.)
Objective:
Students will be able to create mental images and write think-along ideas that
help them understand and interpret the passage.
Warm-up: (5 minutes)
Ask students if they know something about the topic of the day (Day 1,
Earthquakes; Day 2, Mars). Generate some discussion.
Teacher Directed Instruction:
Tell students that when they form mental images in their heads, one way to
record it is to write down think-along ideas. These ideas may be a description of a
picture or sensation, a quick summary, a question, a clarification, a prediction, a
236
personal response, or something recorded on an Images Chart. The purpose is to
respond to the text and write down something that will help them understanding and
relate to the passage.
Directed Practice:
Read the first paragraph to the students and give examples of images that form
in your head as you read (during reading images). Demonstrate what you would write
as think-along ideas by either writing on the board or writing on a sheet of
transparency using the overhead projector. You may demonstrate how to use the
Images Chart. Demonstrate a couple of “during reading” think-along ideas and one
conclusive “after reading” think-along idea for the first paragraph.
Paired Practice:
With a partner, students will read the rest of the passage. They will write think-
along ideas either using regular writing paper or the Images Chart, and discuss with a
partner what other mental images they could bring up. Tell them to generate two
think-along ideas per paragraph. (If the class dynamics is one that is uncooperative,
have students read independently and write think-along ideas on their own. At regular
interval such as 10 minutes, ask students to share what they have written as think-
along ideas.) Ask if they noticed a match or have some differences on their think-
along ideas compared to other ideas shared. Tell them how it is all fine as long as they
think about the passage and that their ideas help them understand and connect with
the passage.
237
Independent Practice:
Students will review the passage on their own and answer comprehension
questions independently. Check answers. Discuss how writing the think-along ideas
or using the Images Chart helped them understand the passage better.
Conclusion:
Tell the students they did a good job and what to expect next time. After Set 3,
Day 1, students will be using the passage for Set 3, Day 2. After Set 3, Day 2, they
will be using mental images with vocabulary or using mental imagery to learn
unfamiliar words in passages.
238
Appendix D
LESSON PLANS
EXPERIMENTAL GROUP INSTRUCTION
Set 4: Representational Instruction Targeting Unfamiliar Vocabulary
Time Allotted:
Two class periods. For Day 1, students will use the passage “What It Is Like on
the Moon.” For Day 2, continue the same directions except use the passage “Mt.
Everest.”
Materials:
The passages mentioned above, paper, pencils (overhead projector and
transparency is a good option instead of writing on the board)
Objective:
Students will be able to use mental imagery strategy to target some unfamiliar
vocabulary they may encounter in passages (LINCS strategy).
Warm-up: (5 minutes)
Ask students if they know something about the topic of the day (Day 1, the
moon; Day 2, Mt. Everest). Generate some discussion.
Teacher Directed Instruction:
Tell students that when they encounter unfamiliar words, they can form mental
images using the clues in the passage to figure out the meaning as well as learn the
words and remember them better by using mental images. They will be using the
LINCS strategy for vocabulary words. There will be five parts or steps to this process.
239
They may use a sheet of paper and divide it into four parts or use a chart (illustrated
below) for this practice. (Other options include index cards-- two parts per side.)
Directed Practice:
Ask the students to skim the passage and find a couple of unfamiliar or difficult
words. Write them on the board or use an overhead projector. Then select one as a
sample to do with the class. The LINCS strategy procedures are as follows:
1. Find an unfamiliar or difficult word and write it down.
2. Define the word. This may be done either using context clues or a dictionary. Read
the sentence that contains the targeted vocabulary word. (If you need more context
clues, read a few more sentences near the targeted vocabulary word.) Figure out what
it means. Write the definition. If there are no context clues, use a dictionary for the
definition.
3. Write a “reminder” word that may help you think of this vocabulary word
(mnemonic device). This word may rhyme or be a word part or somehow cause
someone to think about the targeted vocabulary word. (A different person may have a
different reminding word since people do not think all alike.)
4. Write a sentence using the reminder word and the targeted vocabulary word.
5. Draw an illustration of this word being used.
The following chart (Figure 7) demonstrates two vocabulary words from “Mt.
Everest.”
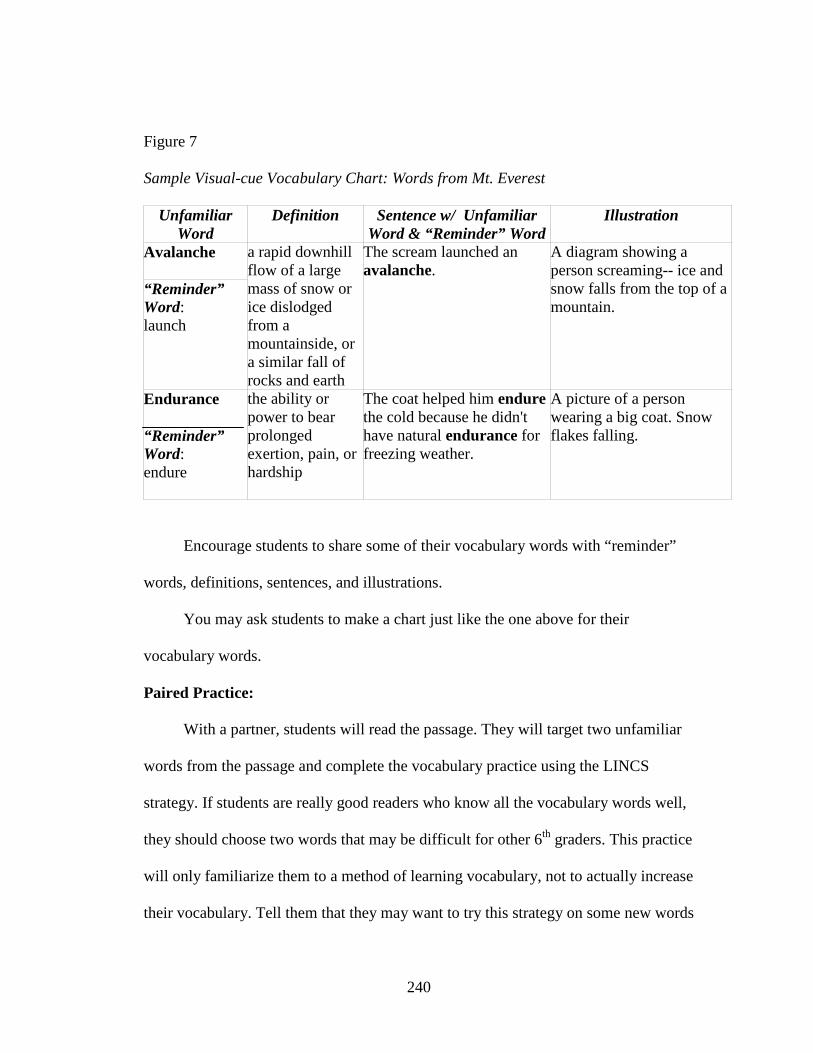
240
Figure 7
Sample Visual-cue Vocabulary Chart: Words from Mt. Everest
Unfamiliar Word
Definition Sentence w/ Unfamiliar Word & “Reminder” Word
Illustration
Avalanche
a rapid downhill flow of a large mass of snow or ice dislodged from a mountainside, or a similar fall of rocks and earth
The scream launched an avalanche.
A diagram showing a person screaming-- ice and snow falls from the top of a mountain.
“Reminder” Word: launch
Endurance
the ability or power to bear prolonged exertion, pain, or hardship
The coat helped him endure the cold because he didn't have natural endurance for freezing weather.
A picture of a person wearing a big coat. Snow flakes falling. “Reminder”
Word: endure
Encourage students to share some of their vocabulary words with “reminder”
words, definitions, sentences, and illustrations.
You may ask students to make a chart just like the one above for their
vocabulary words.
Paired Practice:
With a partner, students will read the passage. They will target two unfamiliar
words from the passage and complete the vocabulary practice using the LINCS
strategy. If students are really good readers who know all the vocabulary words well,
they should choose two words that may be difficult for other 6th graders. This practice
will only familiarize them to a method of learning vocabulary, not to actually increase
their vocabulary. Tell them that they may want to try this strategy on some new words
241
they may encounter in the future. For students who really have difficulty with some
of the words, this method will help them link related experience with the unfamiliar
words and help them learn. (If the class dynamics is one that is uncooperative, have
students work independently. At regular interval such as 10 minutes, ask students to
share what they have written and illustrated, and share some examples.)
Independent Practice:
Students will review the passage on their own and answer comprehensive
questions independently. Check answers. Discuss how using mental links and images
with vocabulary may have helped students understand the words and passage better.
Conclusion:
Tell the students they did a good job and what to expect next time. After Set 4,
Day 1, students will read and do activities for the Set 4, Day 2 passage. After Set 4,
Day 2, students will be using their own choices of mental imaging devices to help
them understand and relate to the passage better.
242
Appendix D
LESSON PLANS
EXPERIMENTAL GROUP INSTRUCTION
Set 5: Representational Instruction Using Devices of Students' Choice
Time Allotted:
Two class periods. For Day 1, use passage “Puffer Fish;” for Day 2, use
passage “Piranhas.”
Materials:
The passages listed above, paper, pencils, Images Chart
Objective:
Students will be able to select mental imagery techniques that are most
effective for them, such as creating mental images, drawing pictures and diagrams,
using think-along ideas, using Images Chart, and linking imagery with vocabulary to
help them understand and interpret the passage.
Warm-up: (5 minutes)
Ask students if they know something about the topics of the day (Day 1, puffer
fish; Day 2, piranhas.) Generate some discussion.
Teacher Directed Instruction:
Tell students that they have learned a variety of ways to make mental imagery
work for them. Now they will choose the ones most useful to them when they read.
Directed Practice:
Read the first paragraph to the students and give examples of different imagery
techniques that worked for you.
243
Paired Practice:
Ask students to pair up and read the passage together. Each student will use
some imagery strategy (about two per paragraph). They may use and share ideas
within their groups. (For classes that are not cooperative, ask students to read by
themselves, and at certain time intervals-- about 10 minutes, do a quick “check” and
ask students to share with the class some examples of imagery strategy that worked
for them.
Independent Practice:
Ask students to do the comprehension questions on their own. Check answers.
Discuss why the answers given are correct.
Conclusion:
Tell students they did a good job and to expect a posttest after the Day 2
passage.
244
Appendix D
LESSON PLANS
COMPARISON GROUP INSTRUCTION
Materials:
The reading passages, paper, pencils (similar to the experimental group, except
that there will be no extra pictures or other aids)
Objective:
Students will be able to read passages carefully and answer comprehensive
questions.
Introduction: (3 minutes)
Tell the students that they will have a two-week unit on science-type reading
passages and that it will help them understand similar passages in science books,
county tests, and state tests. (After Day 1, skip the Introduction part.)
Warm-up: (7 minutes)
For each lesson, the passages are the same as the experimental group. Always
ask for some background knowledge about the topic of the day, and generate some
discussion.
Teacher Directed Instruction:
Ask students to read carefully. Read the first paragraph out-loud to the students
and point out some important facts.
Paired Practice:
Ask students to pair up and read the passage together. (For classes that are
not cooperative, ask students to read by themselves, and at certain time intervals
245
(about 10 minutes), do a quick “facts check” and ask students to share with the class
some important information that they read.
Independent Practice:
Ask students to do the comprehension questions on their own. Check answers.
Discuss why the answers given are correct.
Conclusion: Tell students they did a good job, and what passage to expect the next
day.
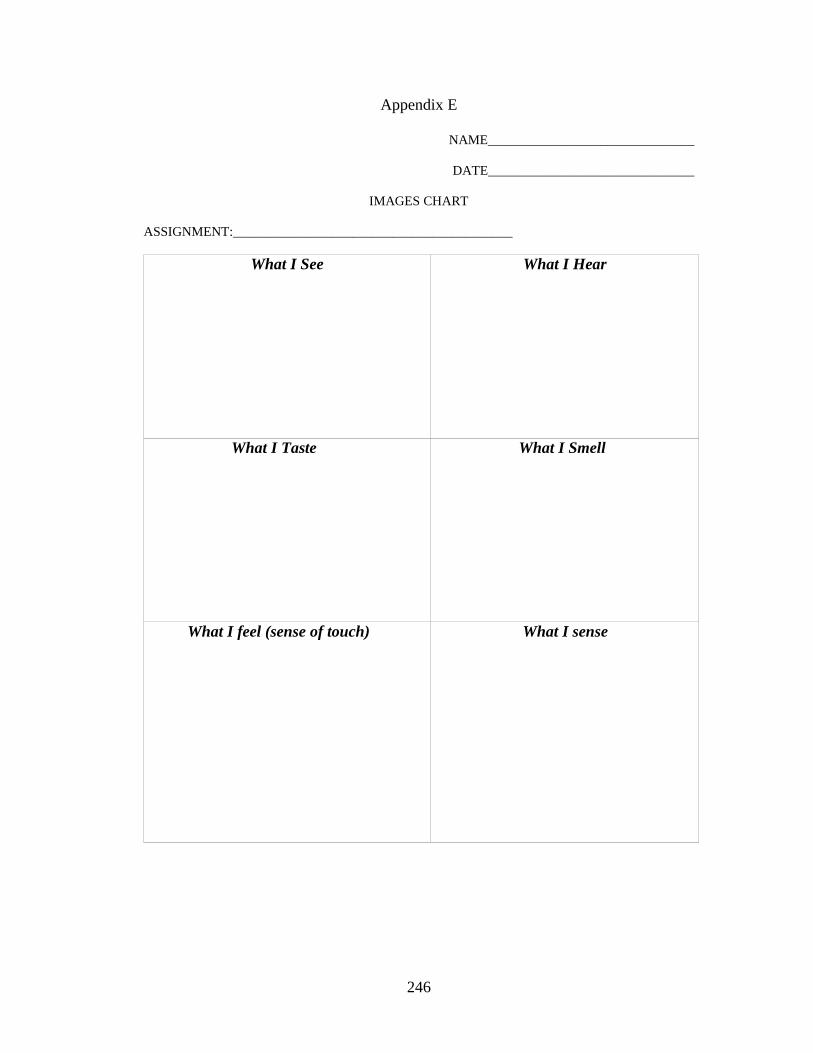
246
Appendix E
NAME_______________________________
DATE_______________________________
IMAGES CHART
ASSIGNMENT:__________________________________________
What I See
What I Hear
What I Taste
What I Smell
What I feel (sense of touch)
What I sense
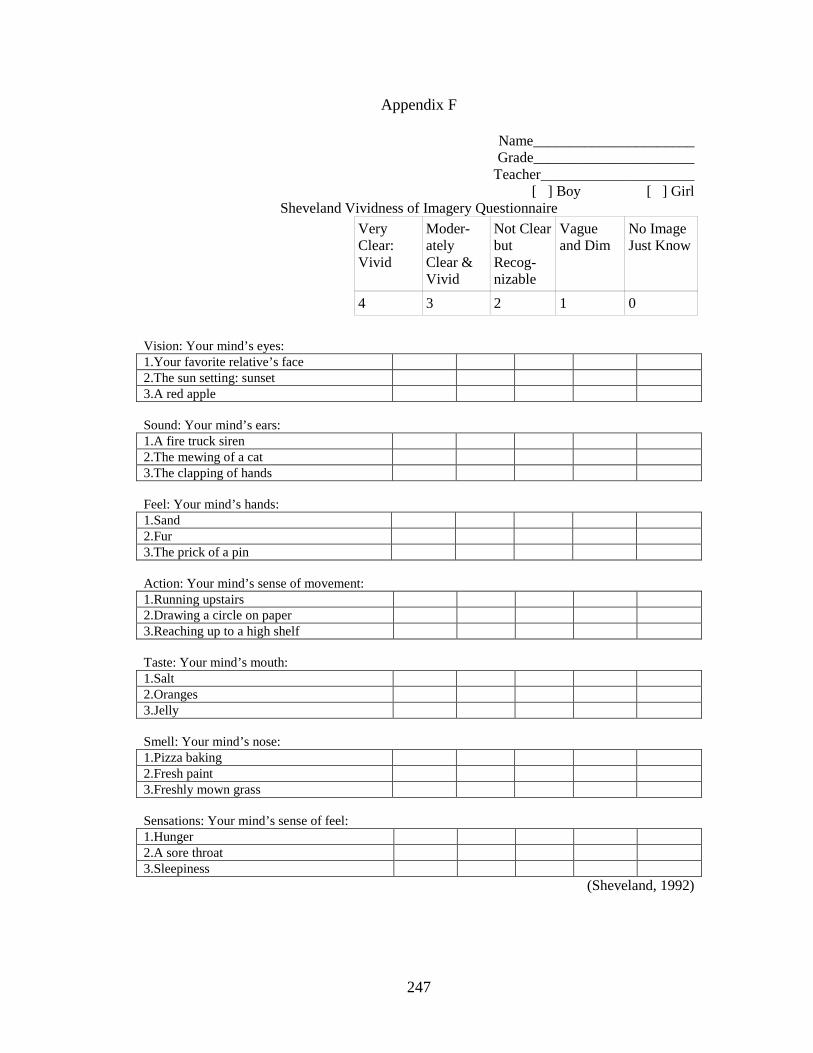
247
Appendix F
Name______________________ Grade______________________
Teacher_____________________ [ ] Boy [ ] Girl
Sheveland Vividness of Imagery Questionnaire
Very Clear: Vivid
Moder-ately Clear & Vivid
Not Clear but Recog-nizable
Vague and Dim
No Image Just Know
4 3 2 1 0
Vision: Your mind’s eyes: 1.Your favorite relative’s face 2.The sun setting: sunset 3.A red apple Sound: Your mind’s ears: 1.A fire truck siren 2.The mewing of a cat 3.The clapping of hands Feel: Your mind’s hands: 1.Sand 2.Fur 3.The prick of a pin Action: Your mind’s sense of movement: 1.Running upstairs 2.Drawing a circle on paper 3.Reaching up to a high shelf Taste: Your mind’s mouth: 1.Salt 2.Oranges 3.Jelly Smell: Your mind’s nose: 1.Pizza baking 2.Fresh paint 3.Freshly mown grass Sensations: Your mind’s sense of feel: 1.Hunger 2.A sore throat 3.Sleepiness
(Sheveland, 1992)
248
Appendix G
MENTAL IMAGERY LESSON PLAN FRAMEWORK
AUXILIARY INSTRUCTION
(FOR COMPARISON GROUP AFTER EXPERIMENTAL PROJECT)
BACKGROUND
This lesson plan framework is designed to teach students how to use mental
imagery that activates all their senses while reading. The framework can be adjusted
to teach any reading text for any class. It is suggested to take two weeks to teach the
students using teacher choice of materials. The instructional reading materials may be
selections from a basal reader, student magazines such as Current Science (Weekly
Reader, Delran, NJ), TIME for Kids (TIME, New York, NY), Scholastic SCOPE
(Scholastic, Jefferson City, MO), or any other choice. While this method can be used
to teach narrative text, the thrust of this study is to teach students how to use mental
imagery with expository text, so selecting expository reading materials and providing
students with more opportunity with expository text is important. The key points of
the Instruction are similar to the main experimental study and contain the following
steps.
1. Representational Instruction Using Visual Aids
2. Representational Instruction Using Mental Pictures and Self-Generated
Drawings
3. Representational Instruction Using Mental Pictures and Think-along Ideas
4. Representational Instruction Targeting Unfamiliar Vocabulary
5. Representational Instruction Using Devices of Students' Choice
249
Set 1: Representational Instruction Using Visual Aids
Time Allotted:
Two class periods (45 minutes each). For day 2, continue where the class left
off after repeating “What is Mental Imagery.”
Materials:
Select reading material that has some visual aids.
Objective: Students will be able to use visual aids to help create mental imageries
while reading.
Introduction: (5 minutes)
Ask students if they know anything about the topic. Generate some discussion.
Warm-up: (7 minutes)
Write down three facts you already know about the topic.
Teacher Directed Instruction:
What is Mental Imagery?
Explain to the students that they will be learning a strategy that will help them
understand what they read better and make what they read more interesting, building
on the knowledge and experience that they have. The strategy is called mental
imagery. Much of the strategy involves making pictures in their minds. It also
includes recalling images, sensations, and feelings experienced that relate to what
they read-- including smells, feelings, sensations, sounds, and tastes.
Directed Practice:
Read the first paragraph to the students and give examples of images that form
in your head as you read (during reading images). Then sum up as a complete
250
package what the text about the selected paragraph makes you see, sense, or feel
(after reading image).
Encourage students to share some of their mental images.
Paired Practice:
With a partner, students will read the rest of the passage and discuss with a
partner what other mental images they could bring up. (If the class dynamics is one
that is uncooperative, have students read independently. At regular interval such as 10
minutes, ask students to share what they have thought about, and share some
examples.) When the students have completed their discussion, show them more
pictures or draw diagrams on the board for other aspects for which the article did not
provide visual aid. Ask students if they noticed a match in their mental imagery and
what it really looked like. Discuss how words may not fully describe everything, but
they should find that the basic information for forming mental images is there.
Independent Practice:
Students will review the passage on their own and answer comprehension
questions independently (if provided by the article, otherwise, do summarizing or
create some questions). Check answers. Discuss how seeing the pictures helped them
understand the passage better.
Conclusion:
Tell the students they did a good job, and that next time, they will be drawing
their own pictures to help them understand the passage better.
251
Appendix G
MENTAL IMAGERY LESSON PLAN FRAMEWORK
AUXILIARY INSTRUCTION
(FOR COMPARISON GROUP AFTER EXPERIMENTAL PROJECT)
Set 2: Representational Instruction Using Mental Pictures and Self-Generated
Drawings
Time Allotted:
Two class periods. For Day 2, continue where the class left off after reminding
them that their task is to draw diagrams and pictures that come to their minds and that
will help them understand the passage better.
Materials: A suitable passage, paper, pencils
Objective:
Students will be able to create mental images, pictures and diagrams to
help them understand and interpret the passage.
Warm-up: (5 minutes)
Ask students if they know something about the topic. Generate some
discussion.
Teacher Directed Instruction:
Tell students that when they form mental images in their heads, one way to
record it is to draw diagrams and pictures. These pictures and diagrams do not have to
be beautiful art pieces. Stick figures will do. The purpose is to draw quick pictures
and diagrams that will help them with understanding the passage-- not any random
beautiful picture. They need to know that since this is a strategy for comprehension,

252
they cannot take too long, because this is not for art. Usually when they do any
reading task like this, such as benchmark tests, they have limited time.
Directed Practice:
Read the first paragraph to the students and give examples of images that form
in your head as you read (during reading images). Draw some quick diagrams or
pictures on the board to demonstrate this. Then sum up as a complete package what
the first paragraph makes you feel or see by drawing another quick drawing (after
reading images).
Paired Practice:
With a partner, students will read the rest of the passage. They will draw
pictures and diagrams, and discuss with a partner what other mental images they
could bring up. (If the class dynamics is one that is uncooperative, have students read
independently. At regular interval such as 10 minutes, ask students to share what they
have drawn, and share some samples.) Ask if they noticed a match or some
differences on their pictures and what someone else had. Tell them how it is all fine
as long as the picture relates to the passage and helps them understand the text better.
Encourage students to share some of their mental images.
Independent Practice:
Students will review the passage on their own and answer comprehension
questions independently. Check answers. Discuss how drawing the pictures helped
them understand the passage better.
Conclusion:

253
Tell the students they did a good job, and that next time they will be using
mental pictures and think-along ideas.
254
Appendix G
MENTAL IMAGERY LESSON PLAN FRAMEWORK
AUXILIARY INSTRUCTION
(FOR COMPARISON GROUP AFTER EXPERIMENTAL PROJECT)
Set 3: Representational Instruction Using Mental Pictures and Think-along
Ideas
Time Allotted:
Two class periods. (Students can proceed at a faster rate now, and may read
passages and form imagery quicker.)
Materials:
Two selected articles or a longer passage, paper, pencils (overhead projector
and transparency is a good option instead of writing on the board), Images Chart (See
Appendix E.)
Objective:
Students will be able to create mental images and write think-along ideas that
help them understand and interpret the passage.
Warm-up: (5 minutes)
Ask students if they know something about the topic of the day. Generate some
discussion.
Teacher Directed Instruction:
Tell students that when they form mental images in their heads, one way to
record it is to write down think-along ideas. These ideas may be a description of a
picture or sensation, a quick summary, a question, a clarification, a prediction, a
255
personal response, or something recorded on an Images Chart. The purpose is to
respond to the text and write down something that will help them understanding and
relate to the passage.
Directed Practice:
Read the first paragraph to the students and give examples of images that form
in your head as you read (during reading images). Demonstrate what you would write
as think-along ideas by either writing on the board or writing on a sheet of
transparency using the overhead projector. You may demonstrate how to use the
Images Chart. Demonstrate a couple of “during reading” think-along ideas and one
conclusive “after reading” think-along idea for the first paragraph.
Paired Practice:
With a partner, students will read the rest of the passage. They will write think-
along ideas either using regular writing paper or the Images Chart, and discuss with a
partner what other mental images they could bring up. Tell them to generate two
think-along ideas per paragraph. (If the class dynamics is one that is uncooperative,
have students read independently and write think-along ideas on their own. At regular
interval such as 10 minutes, ask students to share what they have written as think-
along ideas.) Ask if they noticed a match or have some differences on their think-
along ideas compared to other ideas shared. Tell them how it is all fine as long as they
think about the passage and that their ideas help them understand and connect with
the passage.
Independent Practice:
256
Students will review the passage on their own and answer comprehension
questions independently. Check answers. Discuss how writing the think-along ideas
or using the Images Chart helped them understand the passage better.
Conclusion:
Tell the students they did a good job and what to expect next time. After Set 3,
Day 2, they will be using mental images with vocabulary or using mental imagery to
learn unfamiliar words in passages.
257
Appendix G
MENTAL IMAGERY LESSON PLAN FRAMEWORK
AUXILIARY INSTRUCTION
(FOR COMPARISON GROUP AFTER EXPERIMENTAL PROJECT)
Set 4: Representational Instruction Targeting Unfamiliar Vocabulary
Time Allotted:
Two class periods.
Materials:
Two short articles or a longer passage, paper, pencils (overhead projector and
transparency is a good option instead of writing on the board)
Objective:
Students will be able to use mental imagery strategy to target some unfamiliar
vocabulary they may encounter in passages (LINCS strategy).
Warm-up: (5 minutes)
Ask students to write down three things they know about the topic of the day.
Generate some discussion.
Teacher Directed Instruction:
Tell students that when they encounter unfamiliar words, they can form mental
images using the clues in the passage to figure out the meaning as well as learn the
words and remember them better by using mental images. They will be using the
LINCS strategy for vocabulary words. There will be five parts or steps to this process.
They may use a sheet of paper and divide it into four parts or use a chart (illustrated
below) for this practice. (Other options include index cards-- two parts per side.)
258
Directed Practice:
Ask the students to skim the passage and find a couple of unfamiliar or difficult
words. Write them on the board or use an overhead projector. Then select one as a
sample to do with the class. The LINCS strategy procedures are as follows:
1. Find an unfamiliar or difficult word and write it down.
2. Define the word. This may be done either using context clues or a dictionary. Read
the sentence that contains the targeted vocabulary word. (If you need more context
clues, read a few more sentences near the targeted vocabulary word.) Figure out what
it means. Write the definition. If there are no context clues, use a dictionary for the
definition.
3. Write a “reminder” word that may help you think of this vocabulary word
(mnemonic device). This word may rhyme or be a word part or somehow cause
someone to think about the targeted vocabulary word. (A different person may have a
different reminding word since people do not think all alike.)
4. Write a sentence using the reminder word and the targeted vocabulary word.
5. Draw an illustration of this word being used.
Figure 7 demonstrates two vocabulary words from “Mt. Everest.”
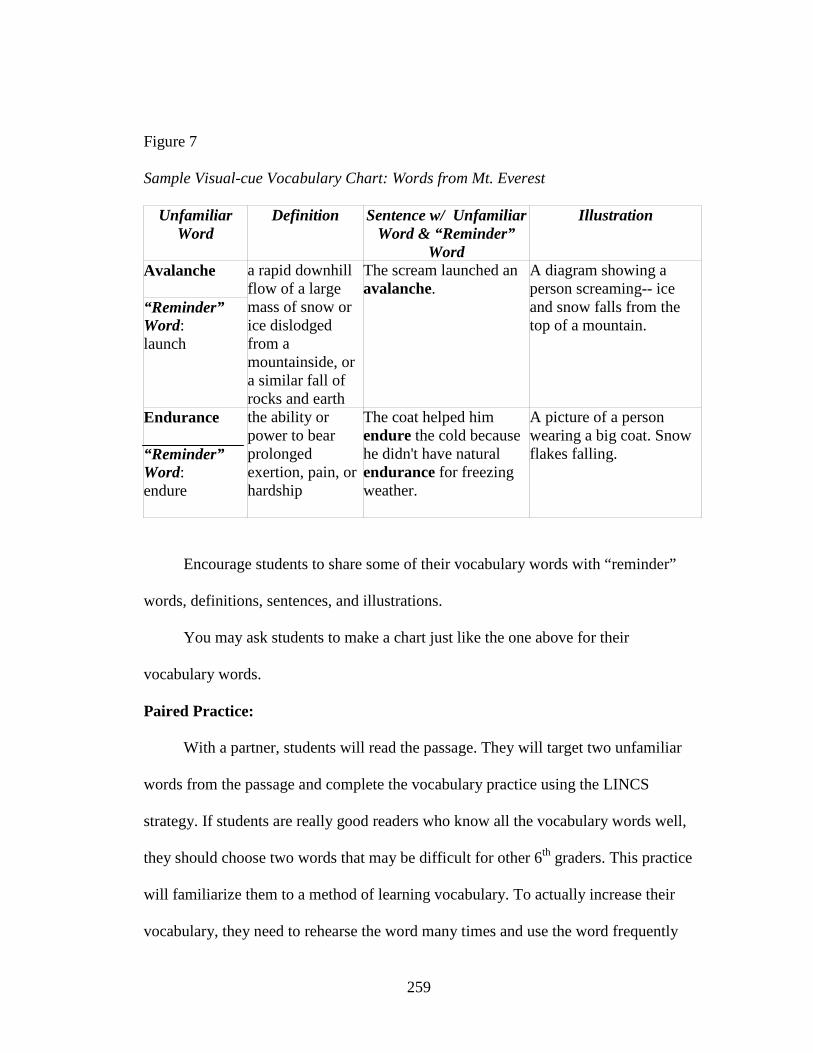
259
Figure 7
Sample Visual-cue Vocabulary Chart: Words from Mt. Everest
Unfamiliar Word
Definition Sentence w/ Unfamiliar Word & “Reminder”
Word
Illustration
Avalanche
a rapid downhill flow of a large mass of snow or ice dislodged from a mountainside, or a similar fall of rocks and earth
The scream launched an avalanche.
A diagram showing a person screaming-- ice and snow falls from the top of a mountain.
“Reminder” Word: launch
Endurance
the ability or power to bear prolonged exertion, pain, or hardship
The coat helped him endure the cold because he didn't have natural endurance for freezing weather.
A picture of a person wearing a big coat. Snow flakes falling. “Reminder”
Word: endure
Encourage students to share some of their vocabulary words with “reminder”
words, definitions, sentences, and illustrations.
You may ask students to make a chart just like the one above for their
vocabulary words.
Paired Practice:
With a partner, students will read the passage. They will target two unfamiliar
words from the passage and complete the vocabulary practice using the LINCS
strategy. If students are really good readers who know all the vocabulary words well,
they should choose two words that may be difficult for other 6th graders. This practice
will familiarize them to a method of learning vocabulary. To actually increase their
vocabulary, they need to rehearse the word many times and use the word frequently
260
as part of their vocabulary. Tell them that they may want to try this strategy on some
new words they may encounter in the future. For students who really have difficulty
with some of the words, this method will help them link related experience with the
unfamiliar words and help them learn. (If the class dynamics is one that is
uncooperative, have students work independently. At regular interval such as 10
minutes, ask students to share what they have written and illustrated, and share some
examples.)
Independent Practice:
Students will review the passage on their own and answer comprehensive
questions independently. Check answers. Discuss how using mental links and images
with vocabulary may have helped students understand the words and passage better.
Conclusion:
Tell the students they did a good job and what to expect next time. After Set 4,
Day 2, students will be using their own choices of mental imaging devices to help
them understand and relate to the passage better.
261
Appendix G
MENTAL IMAGERY LESSON PLAN FRAMEWORK
AUXILIARY INSTRUCTION
(FOR COMPARISON GROUP AFTER EXPERIMENTAL PROJECT)
Set 5: Representational Instruction Using Devices of Students' Choice
Time Allotted:
Two class periods.
Materials:
The “Bees and Wasps” article and another passage, paper, pencils, Images
Chart
Objective:
Students will be able to select mental imagery techniques that are most
effective for them, such as creating mental images, drawing pictures and diagrams,
using think-along ideas, using Images Chart, and linking imagery with vocabulary to
help them understand and interpret the passage.
Warm-up: (5 minutes)
Ask students to write down three things they know about the topic (bees and
wasps). Generate some discussion.
Teacher Directed Instruction:
Tell students that they have learned a variety of ways to make mental imagery
work for them. Now they will choose the ones most useful to them when they read.
Directed Practice:
262
Read the first paragraph to the students and give examples of different imagery
techniques that worked for you.
Paired Practice:
Ask students to pair up and read the passage together. Each student will use
some imagery strategy (about two per paragraph). They may use and share ideas
within their groups. (For classes that are not cooperative, ask students to read by
themselves, and at certain time intervals-- about 10 minutes, do a quick “check” and
ask students to share with the class some examples of imagery strategy that worked
for them.
Independent Practice:
Ask students to do the comprehension questions on their own. Check answers.
Discuss why the answers given are correct.
Conclusion:
Tell students they did a good job and to expect a posttest after the Day 2
passage.
263
APPENDIX H
Informal Study: The Use of Mental Imagery as a Comprehension
Strategy for Middle School Students Reading Science Expository Texts
Introduction
In the school year 2005-06, I conducted an informal study to investigate the
effects of mental imagery instruction on sixth-grade students reading expository texts.
Part of this project arose from the desire to help out my colleagues who were science
teachers. They claimed that the students had a difficult time understanding science
texts. Another reason for this informal study was to investigate effective strategies
that would make reading expository texts interesting and meaningful, and hopefully,
identify strategies that would help create better readers. After some research into the
studies of mental imagery, I thought that pursuing mental imagery would be
worthwhile.
Summary of Informal Study
At the time, I taught three sixth-grade reading classes: a Basic class, an On-
grade-level class, and an Honors class. In the beginning of the school year, all the
students took the Gates-MacGinitie Reading Test (2000) to identify their reading
achievement level. Using a quasi-experimental pretest-posttest comparison group
design, I assigned intact classes to experimental or comparison groups-- an Honors
class (average reading level 9.0) and a Basic class (average reading level 4.1) were
assigned to the experimental group, and the On-grade-level class (average reading
level 5.7) was assigned to be the comparison group.
264
All students took the following pretests: (a) the Pretest for Expository Text:
“Crocodiles and Alligators,” (b) the Vividness of Imagery Questionnaire, and (c)
Motivation to Read Profile. Then I used a two-week time frame similar to a thematic
unit to teach the students an “Informational Text Unit.” In middle school, students are
familiar with such units. For example, in science class, students may have a two-
week unit on volcanoes. In reading class, students may have a two-week unit on folk
tales. For this “Informational Text Unit,” the experimental group received mental
imagery instruction as a reading strategy for the expository texts. The comparison
group did not receive any strategies; they were told to read the informational texts
carefully and answer questions. After the two-week period, all students took the
following posttests: (a) the Posttest for Expository Text: “Poisonous and
Nonpoisonous Snakes of America,” (b) the Vividness of Imagery Questionnaire, and
(c) Motivation to Read Profile.
The results were promising even though the sample size was small. Table 19
summarizes the data for the informal study.
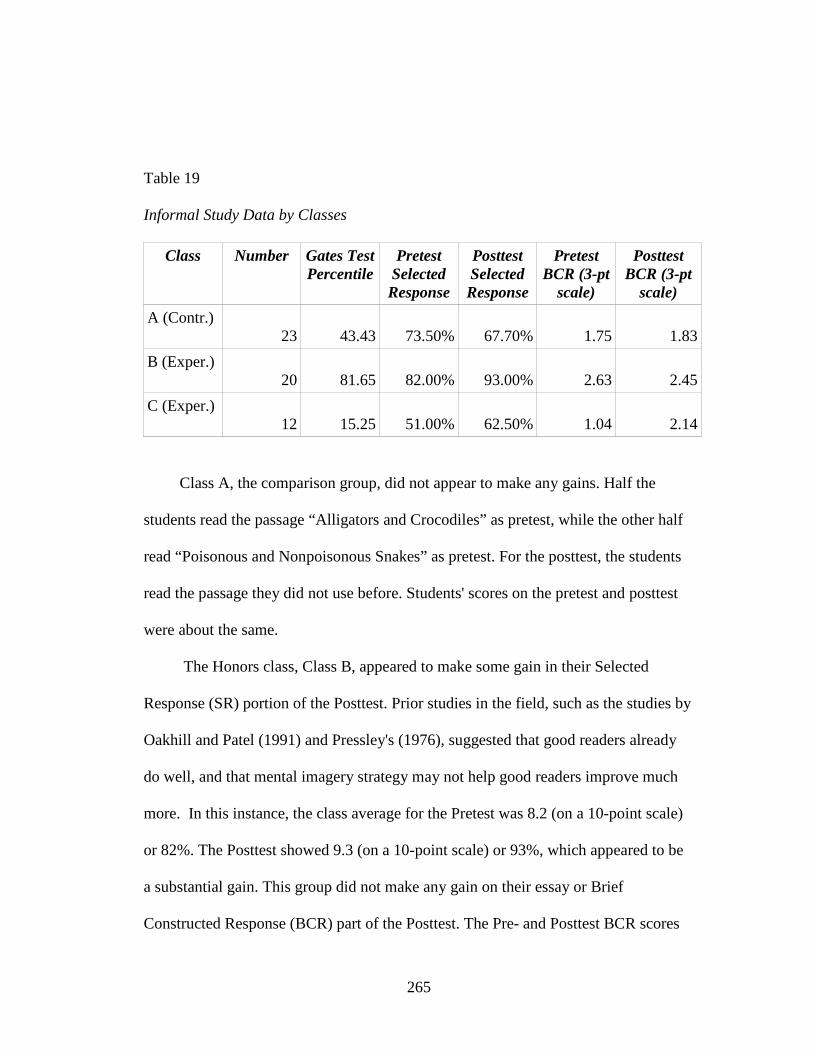
265
Table 19
Informal Study Data by Classes
Class Number Gates Test Percentile
Pretest Selected Response
Posttest Selected Response
Pretest BCR (3-pt
scale)
Posttest BCR (3-pt
scale)
A (Contr.) 23 43.43 73.50% 67.70% 1.75 1.83
B (Exper.) 20 81.65 82.00%
93.00% 2.63 2.45
C (Exper.) 12 15.25 51.00%
62.50% 1.04
2.14
Class A, the comparison group, did not appear to make any gains. Half the
students read the passage “Alligators and Crocodiles” as pretest, while the other half
read “Poisonous and Nonpoisonous Snakes” as pretest. For the posttest, the students
read the passage they did not use before. Students' scores on the pretest and posttest
were about the same.
The Honors class, Class B, appeared to make some gain in their Selected
Response (SR) portion of the Posttest. Prior studies in the field, such as the studies by
Oakhill and Patel (1991) and Pressley's (1976), suggested that good readers already
do well, and that mental imagery strategy may not help good readers improve much
more. In this instance, the class average for the Pretest was 8.2 (on a 10-point scale)
or 82%. The Posttest showed 9.3 (on a 10-point scale) or 93%, which appeared to be
a substantial gain. This group did not make any gain on their essay or Brief
Constructed Response (BCR) part of the Posttest. The Pre- and Posttest BCR scores
266
looked very similar, being 2.6 and 2.5 (on a 3-point rubric) respectively. Since the
highest possible score was 3.0, students in this group were already performing above
the mid-range score (2.0) on the Pretest, and it may have been difficult for them to
show more gain in this skill area.
For Class C, the Basic class, students appeared to show gains in both the SR
and the BCR portions of the test. For the SR portion of the comprehension task, the
class average was 51% for the pretest and 62.5% for the posttest. For the BCR
portion, the class average on the pretest was 1.04 on a 3-point scale, indicating that
the rating was Basic. After instruction, the class average for the posttest BCR score
was 2.3 on a 3-point scale, indicating that the rating was Proficient.
Discussion
One major limitation of this informal study was the small sample size. The
Honors class had 20 students, the On-grade-level class had 23, and the Basic class
had only 12. However, the informal study not only suggested that mental imagery
instruction helped the students improve their comprehension when they read
expository texts, it also provided information to help refine the formal study. For
example, I improved the pretest, posttest, and instructional passages by making sure
that all questions covered comprehension skills such as main idea, vocabulary,
inference, and drawing conclusion. I also realized that I could involve my co-worker
so that more student data could be gathered for this study. In addition, I realized that
an additional follow-up assessment at the end of the school year could show sustained
effects for the experimental group and possible gains for the comparison group once
the comparison group received instruction on the mental imagery strategies.
267
This informal study provided some basic foundations for the formal study. For
example, the pretest, posttest, and science expository instructional materials
developed for use in the informal study were also used in the formal study. The only
additional materials used in the formal study were two updated posttests and an
additional instructional passage. The instructional procedures for using mental
imagery with expository text and lesson plans developed for use in the informal study
were replicated for the formal study since students appeared to be receptive to those
methods and the results were promising.
268
REFERENCES
Allington, R. L., & Cunningham, P. M. (2002). Schools that work: Where all
children read and write (2nd ed.). Boston: Allyn and Bacon.
Alverman, D. E., Dillion, D. R., & O'Brien, D. G. (1987). Using discussion to
promote reading comprehension. Newark, DE: International Reading
Association.
Alverman, D. E., & Moore, D. W. (1991). Secondary school reading. In R. Barr, M.
L. Kamil, P. Mosenthal, & P. D. Pearson (Eds.), Handbook of reading
research, Volume II (pp. 951-983). New York: Longman.
American alligator. (2005). Marine wildlife. Retrieved May 8, 2005, from National
Parks Conservation Association Web site: http://www.npca.org/
marine_and_coastal/marine_wildlife/alligator.html
American crocodile. (2005). Marine wildlife. Retrieved May 8, 2005, from National
Parks Conservation Association Web site: http://www.npca.org/
marine_and_coastal/marine_wildlife/crocodile.html
Anderson, K. M. (2007). Differentiating instruction to include all students.
Preventing School Failure, 51(3), 49-54.
Anderson, R. C., & Hidde, J. L. (1971). Imagery and sentence learning. Journal of
Educational Psychology, 62(6), 526-530.
Anderson, R. C., & Kulhavy, R. W. (1972). Imagery and prose learning. Journal of
Educational Psychology, 63(3), 242-243.
Anderson, R. C., & Pearson, P. D. (1984). A schema-theoretic view of basic
269
processes in reading comprehension. In P. D. Pearson (Ed.), Handbook of
reading research (pp. 255-291). NY: Longman.
Armbruster, B. B., Anderson, T. H., Armstrong, J. O., Wise, M. A., Janisch, C., &
Meyer, L. A. (1991). Reading and questioning in content area lessons. Journal
of Reading Behavior, 23, 35-59.
Barr, R., Blanchowicz, C. L. Z., Katz, C., & Kaufman, B. (2002). Reading diagnosis
for teachers: An instructional approach (4th ed., pp. 172-173). Boston: Allyn
& Bacon.
Barry, A. L. (2002). Reading strategies teachers say they use. Journal of Adolescent
and Adult Literacy, 46 (2), 132-141.
Bartlette, T. (2007, October 7). Moths. In BugGuide. Retrieved December 26, 2007,
from website http://bugguide.net/node/view/82
Baumann, J. F., Jones, L. A., & Seifert-Kessell, N. (1993). Using think alouds to
enhance children's comprehension monitoring abilities. The Reading Teacher,
47, 184-193.
Bean, T. W., Valerio, P. C., & Stevens, L. (1999). Content area literacy instruction.
In L. B. Gambrell, L. M. Morrow, S. B. Neuman, and M. Pressley (Eds.) Best
practices in literacy instruction (pp. 175-192). New York: The Guilford Press.
Bee, H. (1989). The developing child (5th ed.). New York: Harper & Row Publishers,
Inc.
Berghoff, B., & Egawa, K. (1991). No more “rocks”: Grouping to give students
control of their learning. The Reading Teacher, 44(8), 536-541.
Berman, N., Hornbaker, G., & Ulm, A. (2000). A study of students' disruptive
270
behaviors and a lack of respect for authority and peers with middle school
students. St. Xavier University and skylight Professional development Field
Based Masters Program. (ERIC Document Reproduction Service No.
ED444734)
Betts, G. H. (1909). The mind and its education. New York: Doubleday and
Company.
Boehm, R. G., Hoone, C., McGowan, T. M., McKinney-Browning, M. C.,
Miramontes, O. B., & Porter, P. H. (2000). The world: Harcourt Brace social
studies. Orlando: Harcourt Brace & Company.
Bourduin, B. J., Bourduin C. M., & Manley, C. M. (1993). The use of imagery
training to improve reading comprehension of second graders. The Journal of
Genetic Psychology, 155(1), 115-118.
Bovee, C. L, Thill, J. V, & Schatzman, B. E. (2003). Business communication today
(7th ed.). Upper Saddle River: Prentice Hall.
Burchers, S., Burchers, B., & Burchers, S., III. (1998). Vocabulary cartoons:
Building an educated vocabulary with mnemonics. Punta Gorda, FL: New
Monic Books.
Burke, J. D. (2005). Moon. In Encyclopedia Americana (Vol. 19, pp. 429-437).
Danbury, CT: Scholastic Library Publishing, Inc.
Butterfly life cycle and biology. (2007). The Butterfly Site. Retrieved December 26,
2007, from website http://www.thebutterflysite.com/biology.shtml
271
California Department of Education. (2007). California Standardized Testing and
Reporting (STAR). Retrieved July 24, 2007, from Web site
http://www.cde.ca.gov/ta/
Campbell, J. R., Kapinus, B. A., & Beatty, A. S. (1995). Interviewing children about
their literacy experiences: Data from NAEP’s Integrated Reading
Performance Record (IRPR) at grade 4. Washington, DC: US Department of
Education, National Center for Educational Statistics.
Carr, M. H. (2005). Mars. In Encyclopedia Americana (Vol. 18, pp. 355-360).
Danbury, CT: Scholastic Library Publishing, Inc.
Center, Y., Freeman, L., Robertson, G., & Outhred, L. (1999). The effect of visual
imagery training on the reading and listening comprehension of low listening
comprehenders in Year 2. Journal of Research in Reading, 22(3), 241-256.
Chall, J. S., Jacobs, V. A., & Baldwin, E. (1990). The reading crisis: Why poor
children fall behind. Cambridge, MA: Harvard University Press.
Chambliss, M. J., & Calfee, R. C. (1998). Textbooks for learning. Malden, MS:
Blackwell Publishing Company.
Choi, S.-M. (2006). Two types of text-based situational interest evoking strategies:
Seductive details and concrete elaboration and their effects on the 1st year
EFL high school students' written text comprehension and interest. Doctoral
dissertation, State University of New York at Buffalo. ( AAT 3226670)
Clark, F. L., Deshler, D. D., Schumaker, J. B., Alley, G. R., & Warner, M. M. (1984).
Visual imagery and self-questioning: Strategies to improve comprehension of
written material. Journal of Learning Disabilities, 17(3), 145-149.
272
Cohen, J. (1988). Statistical power analysis for the behavioral sciences. Hillsdale, NJ:
Erlbaum.
Cramer, E. H. (1980). Mental imagery, reading attitude and comprehension. Reading
Improvement, 17(2), 135-139.
Cramer, E. H. (1981). Reading comprehension and attitude of high and low imagers:
A comparison. Paper presented at the Annual Meeting of the National Reading
Conference (31st, Dallas, TX, December 2-5, 1981). (ERIC Document
Reproduction Service No. ED212993)
D'angelantonio, S., & Denler, S. (2007). A The College Writer: A Guide to Thinking,
Writing, and Researching (2nd ed.). Boston: Houghton Mifflin Company.
Davey, B. (1983). Think-aloud-- modeling the cognitive process of reading
comprehension. Journal of Reading, 27, 44-47.
Dilley, M. G., & Paivio, A. (1968). Pictures and words as stimulus and response
items in paired-associate learning of young children. Journal of Experimental
Child Psychology, 6, 231-240.
Douville, P. (1998). Bringing text to life: The effects of a multi-sensory imagery
strategy on fifth-graders' prose processing. Research report presented at the
43rd Annual Meeting of the International Reading Association, Orlando, FL.
Douville, P., & Algozzine, B. (2004). Use mental imagery across the curriculum.
Preventing School Failure, 49(1). Retrieved June 21, 2006, from Academic
Search Alumni Edition Database, No. 1045988X, Web site: http://EBSCO
Dowling, H. G. (2005). Snake. In Encyclopedia Americana (Vol. 25, pp. 85-101).
Danbury, CT: Scholastic Library Publishing, Inc.
273
Dreher, M. J. (2000). Fostering reading for learning. In L. Baker, M. J. Dreher, & J.
T. Guthrie (Eds.), Engaging young readers: Promoting achievement and
motivation (pp. 68 – 93). New York: Guilford Press.
Dreher, M. J. (2003). Motivating struggling readers by tapping the potential of
information books. Reading & Writing Quarterly, 19, 25-38.
Dreher, M. J., & Singer, H. (2001). Friendly texts and text-friendly teachers. Theory
into Practice, 28(2), 98-104.
Downing, J., Bakken, J. P., & Whedon, C. K. ( 2002). Teaching text structure to
improve reading comprehension, Intervention in School & Clinic, 37(4), 229-
233.
Duffy, G. G., & Roehler, L. R. (1987). Improving reading instruction through
elaboration. The Reading Teacher, 40, 514-515.
Duncan, C. D. (1964). Wasp. In The world book: Vols. 20. W. X. Y. Z. Chicago: Field
Enterprises Educational Corporation.
Earthquakes. (2003). The World book encyclopedia: Vols. E . Chicago: World Book,
Inc.
Ellis, E. S. (2004). The Vocabulary LINCing Routine. Lawrence, Kansas: Edge
Enterprises, Inc.
Encyclopedia Americana. (2005). Danbury, CT: Scholastic Library
Publishing, Inc.
Everest cents. (2005). National Geographic Adventure. Retrieved May 7, 2005, from
National Geographic Society Web site: http://www.nationalgeographic.com/
adventure/0305/expert_everest.html
274
Fact sheets. (2005). Reptiles and amphibians. Retrieved March 7, 2005, from
Smithsonian Institution National Zoological Park Web site:
http://nationalzoo.si.edu/Animals/ReptilesAmphibians/default.cfm
Farr, R. (1997). Strengthening reading comprehension: Developing critical thinking
and problem-solving skills. Torrence, CA: Staff Development Resources.
Finch, C. M. (1982). Fifth-grade below average and above average readers' use of
mental imagery in reading familiar and unfamiliar text. Paper presented at the
32nd National Reading Conference, Clearwater Beach, FL. (ERIC Document
Reproduction Service No. ED228634)
Flood, J., & Lapp, D. (1986). Types of texts. Reading Research Quarterly, 21(3),
284-297.
Franco-Watkins, A. M., & Dougherty, M. R. (2006). Word concreteness and
encoding effects on context-dependent discrimination. Memory & Cognition,
34(5), 973-986.
Gambrell, L. B. (1982). Induced mental imagery and the text prediction performance
of first and third graders. In J. A. Niles & L. A. Harris (Eds.), New inquiries in
reading research and instruction. Thirty-first yearbook of the National
Reading Conference (pp. 131-135). Rochester, NY: National Reading
Conference.
Gambrell, L. B., & Bales, R. J. (1986). Mental imagery and the comprehension-
monitoring performance of fourth- and fifth-grade poor readers. Reading
Research Quarterly, 21, 454-464.
Gambrell, L. B., & Jawitz, P. B. (1993). Mental imagery, text illustrations, and
275
children's story comprehension and recall. Reading Research Quarterly, 28,
264-276.
Gambrell, L. B., Kapinus, B. A., & Wilson, R. M. (1987). Using mental imagery and
summarization to achieve independence in comprehension. Journal of
Reading, 30, 638-642.
Gambrell, L. B., Koskinen, P. S., & Cole, J. N. (1980). The effects of induced mental
imagery upon comprehension: A comparison of written versus oral
presentation. Paper presented at the 30th Annual Meeting of the National
Reading Conference, San Diego, CA. (ERIC Document Reproduction
Service No. ED198503)
Gambrell, L. B.; Palmer, B.M.; Codling, R. M.; & Mazzoni, S. A. (1996). Assessing
motivation to read. The Reading Teacher, 49(7), 518-533.
Gates-MacGinitie Reading Tests, Form S (4th ed.). (2000). Itasca, IL: Riverside
Publishing Company.
Geer, P., & Geer, S. (2004). Picture these SAT words. Chicopee, MA: Barrons.
Giant Pacific octopus. (n. d.). Cephalopod: Invertebrates. (Smithsonian National
Zoological Park). Retrieved November 17, 2007, from Smithsonian Institution
Web site: http://nationalzoo.si.edu/default.cfm
Goetz, E. T., Sadoski, M., Olivarez, Jr., A., Calero-Breckheimer, A., Garner, P.,
Fatemi, Z. (1992). The structure of emotional response in reading a literary
text: Quantitative and qualitative analyses. Reading Research Quarterly,
27(4), 360- 372.
276
Goodlad, J. I. (1984). A place called school: Prospects for the future. New York:
McGraw Hill.
Griswold, W. (2001). The ideas of the reading class. Contemporary Sociology, 30(1),
4- 6.
Gunston-Parks, C. A. (1985). Effects of imagery ability and text bound guided
imagery on comprehension by low readers (Spatial forms perception).
Dissertation, Arizona State University.
Harp, S. F., & Maslich, A. A. (2005). The consequences of adding seductive details
during lecture. Teaching of Psychology, 32(2), 100-103.
Hibbing, A. N., & Rankin-Erickson, J. L. (2003). A picture is worth a thousand
words: Using visual images to improve comprehension for middle school
struggling readers. The Reading Teacher, 56(8), 758-771.
Hillary, E. P. (2005). Mount Everest. Retrieved March 25, 2005, from World Book
Student database: http://worldbookonline.com
Hoffman, J., Roser, N. L., & Battle, J. (1993). Read aloud in classrooms: From the
modal to the model. The Reading Teacher, 46, 496-505. (ERIC Document
Reproduction Service No. ED459291)
Holt, R. R. (1964). Imagery: The return of the ostracized. American Psychologist,
19(4), 254-264.
Holt, Rinehart, and Winston. (2001). Earthquakes and society. In R. W. Todd, D. F.
Bowman, & R. V. Tucek (Eds.), Holt science and technology: Earth science
(pp. 205-210). Austin, TX: Holt, Rinehart and Winston.
Holt, Rinehart, and Winston. (2001). Mars—The red planet. In R. W. Todd, D. F.
277
Bowman, & R. V. Tucek (Eds.), Holt science and technology: Earth science
(pp. 542-543). Austin, TX: Holt, Rinehart and Winston.
Holt, Rinehart, and Winston. (2001). Moons. In R. W. Todd, D. F. Bowman, & R. V.
Tucek (Eds.), Holt science and technology: Earth science (pp. 549-550).
Austin, TX: Holt, Rinehart and Winston.
Holt, Rinehart, and Winston. (2001). Plate tectonics. In R. W. Todd, D. F. Bowman,
& R. V. Tucek (Eds.), Holt science and technology: Earth science (pp. 164-
165). Austin, TX: Holt, Rinehart and Winston.
Holt, Rinehart, and Winston. (2001). Revealing the ocean floor. In R. W. Todd,
D. F. Bowman, & R. V. Tucek (Eds.), Holt science and technology: Earth
science (pp. 338-339). Austin, TX: Holt, Rinehart and Winston.
Holt, Rinehart, and Winston. (2001). Volcanoes. In R. W. Todd,
D. F. Bowman, & R. V. Tucek (Eds.), Holt science and technology: Earth
science (pp. 220-228). Austin, TX: Holt, Rinehart and Winston.
Houghton-Mifflin Company. (2007). Reader's handbook: A student guide for reading
and learning. Boston, MS: Great Source, A Division of Houghton-Mifflin.
Houghton-Mifflin Company. (2005). Soar to success: The intervention program.
Retrieved Oct. 15, 2005, from the Houghton Mifflin Company Web site:
http://www.eduplace.com/intervention/soar/prod_overview/index.html
Howell, D., & Howell, D. K. (2004). Vocabbusters SAT: Make vocabulary fun,
meaningful and memorable. Kewaskum, WI: SolidA, Incorporated.
Huck, S. W., Cormier, W. H., & Bounds, W. G. (1974). Reading statistics and
research. New York: Harper Collins Publishers.
278
Humboldt or jumbo squid (n. d.). Cephalopod: Invertebrates. (Smithsonian National
Zoological Park). Retrieved November 17, 2007, from Smithsonian Institution
Web site: http://nationalzoo.si.edu/default.cfm
Iowa insect information notes. (2005). Bees and wasps. Retrieved March 23, 2008,
from Iowa State University of Science and Technology, Department of
Entomology Web site:
http://www.ipm.iastate.edu/ipm/iiin/taxonomy_menu/2/97
Irwin, J. W. (1979). College readers' mental imagery, reading ability and attitude
toward reading. Reading Improvement, 16(2), 124-129.
Johnson, D. W., Johnson, R. T., Holubec, E. J., & Roy, P. (1984). Circles of learning.
Washington, D.C.: Association for Supervision and Curriculum Development.
Kelch, A. (2005). Conversation: The comprehension connection. The Reading
Teacher, 59(1), 8-15.
Klots, A. B. (2005). Butterflies and moths. In Encyclopedia Americana (Vol. 5, pp.
69-76). Danbury, CT: Scholastic Library Publishing, Inc.
Krathwohl, D. R. (2004). Methods of educational and social science research: An
integrated approach (2nd ed.). Long Grove, IL: Waveland Press, Inc.
Kucan, L., & Beck, I. L. (1997). Thinking aloud and reading comprehension research:
Inquiry, instruction, and social interaction. Review of Educational Research,
67, 271-299.
Langan, J. (1992). College writing skills (3rd ed.). New York: McGraw-Hill, Inc.
Lee, J. (2006). Tracking achievement gaps and assessing the impact of NCLB on the
gaps: An in-depth look into national and state reading and math outcome
279
trends. The Civil Rights Project at Harvard University, sponsored by the Gates
Foundation. Cambridge: Harvard University.
Leet, L. D. (2005). Volcano. In Encyclopedia Americana (Vol. 28, pp. 216-221).
Danbury, CT: Scholastic Library Publishing, Inc.
Lehman, S., Schraw, G., McCrudden, M. T., & Hartley, K. (2007). Processing and
recall of seductive details in scientific text. Contemporary Educational
Psychology, 32(4), 569.
Levin, J. R. (1981). On functions of picture in prose. In F. Pirozzolo & M. Wittrock
(Eds.), Neuropsychological and cognitive processes in reading (pp. 203-288).
New York: Academic Press.
Long, S. A., Winograd, P. N., & Bridge, C. A. (1989). The effects of reader and text
characteristics on imagery reported during and after reading. Reading
Research Quarterly, 24(3), 353-372.
Macomber, C. (2001). The use of mental imagery and its relation to reading attitudes
among fourth grade students. Doctoral dissertation, New York University,
New York. (UMI No. 3004915)
The Mariana Trench. (2003). Last modified April 04, 2003. Retrieved July 11, 2005,
from Web site: www.marianatrench.com
Marianas Trench. (2005). In Encyclopedia Americana (Vol. 18, p. 314). Danbury,
CT: Scholastic Library Publishing, Inc.
Mars. (2003). The World book encyclopedia: Vols. M . Chicago: World Book, Inc.
Marschark, M., Surian, L. (1992). Concreteness effects in free recall: The roles of
imaginal and relational processing. Memory & Cognition, 20(6), 612.
280
Maryland Department of Education. (2006). Analyzing your MSA data. Retrieved
January 6, 2007, from the School Improvement in Maryland Web site:
http://mdk12.org/index.html
Maryland Department of Education. (2007). Maryland school improvement program.
Retrieved July 24, 2007, from http://mdk12.org
Mason, L. H. (2004). Explicit self-regulated strategy development versus
reciprocal questioning: Effects on expository reading comprehension
among struggling readers. Retrieved July 14, 2006, from PsycARTICLES
database (Edu 962283): http://web9.epnet.com
Mauldin, D., & Wellman, C. (2005). Snakes and us. In Trailquest. Retrieved April
10, 2005, from Appalachian Trail Conservancy Web site:
http://www.trailquest.net/SNsnakes_us.html
McCallum, R. D., & Moore, S. (1999). Not all imagery is created equal: The role of
imagery in the comprehension of main ideas in exposition. Journal of
Reading Psychology, 20, 21-60.
McDowell, S. (2005). Alligator. In Encyclopedia Americana (Vol. 1, p. 600).
Danbury, CT: Scholastic Library Publishing, Inc.
McGill-Frazen, A., & Allington, R. (2006). Contamination of current accountability
systems. Phi Delta Kappan, June, 762-766.
McNally, K. C. (2003). Damage by earthquakes. In World book student. Retrieved
June 3, 2005, from World Book Student database:
http://www.worldbookonline.com
281
McShaffrey, D. (1996). Bees, wasps, and hornets. In Marietta Natural Historical
Society. Retrieved March 23, 2008, from Marietta College, Biology
Department Web site: http://www.marietta.edu/~biol/mnhs/mnhsbees.html
Moth. (2005). In Encyclopedia Americana (Vol. 19, p. 501). Danbury, CT:
Scholastic Library Publishing, Inc.
Mowey, S., & Conahan, P. (1995). Reading/Writing comprehension strategies. (ERIC
Document Reproduction Service No. ED409531)
National Center for Educational Statistics. (2007). National Assessment of Education
Program. (2007). Reading 2007 major results. The nation's report card.
Retrieved November 13, 2008, from National Center for Education Statistics
Web site: http://nces.ed.gov/nationsreportcard/reading/results
National Center for Educational Statistics. (2007). National Assessment of Education
Program. (2006). NAEP inclusion policy. The nation's report card. (2006).
Retrieved July 23, 2007, from the National Center for Education Statistics
Web site:
http://nces.ed.gov/nationsreportcard/about/inclusion.asp#accom_table
National Reading Panel. (2000). Report of the National Reading Panel. Washington,
D. C.: National Institute of Child Health and Development.
Nell, V. (1988). The psychology of reading for pleasure: Needs and gratifications.
Reading Research Quarterly, 23, (1), 6-50.
No Child Left Behind Act of 2001 (2001). Retrieved November 20, 2002, from U. S.
Department of Education Web site: http://www.ed.gov/legislation/ESEA02
Oakhill, J., & Patel, S. (1991). Can imagery training help children who have
282
comprehension problems? Journal of Research in Reading, 14(2), 106-115.
Octopus. (2005). In Encyclopedia Americana (International Edition, Volume O).
Danbury, CT: Scholastic Library Publishing, Inc.
Oertel, E. (1964). Bee. In The World book: Vols. 2. B. Chicago: Field enterprises
Educational Corporation.
Olsen, M. W., & Gee, T. C. (1991). Content reading in the primary grades:
Perceptions and strategies. The Reading Teacher, 45(4), 298-307.
Olshavsky, J. (1976-77) Reading as problem-solving: An investigation of strategies.
Reading Research Quarterly, 12, 654-674.
Paivio, A. (1983). The mind's eye in arts and science. Poetics, 12, 1-18.
Paivio, A. (1986). Mental representations: A dual-coding approach. New York:
Oxford University Press.
Paivio, A., Clark, J. M., & Lambert, W. E. (1988). Bilingual dual-coding theory and
semantic repetition effects on recall. Journal of Experimental Psychology:
Learning, Memory, and Cognition, 14, 163-172.
Paivio, A., & Csapo, K. (1969). Concrete images and verbal memory codes. Journal
of Experimental Psychology, 80, 279-285.
Paivio, A., & Yarmey, A. D. (1966). Pictures versus words as stimuli and responses
in paired-associate learning. Psychonomic Science, 5, 235-236.
Palincsar, A. S., & Brown, A. L. (1984). Reciprocal teaching of comprehension-
fostering and comprehension-monitoring activities. Cognition and instruction.
1(2) 117-175.
Pallant, J. (2005). SPSS survival guide (2nd ed.). New York: Open University Press.
283
Pearson, P. D., & Fielding, L. (1991). Comprehension instruction. In R. Barr, M. L.
Kamil, P. B. Mosenthal, and P. D. Pearson (Eds.), Handbook of reading
research: Volume II. New York: Longman.
Peters, E. E., & Levin J. R. (1986). Effects of a mnemonic imagery strategy on good
and poor readers' prose recall. Reading Research Quarterly, 21(2), 179-192.
Piranha. (2005). In Encyclopedia Americana (Vol. 22, p. 132). Danbury, CT:
Scholastic Library Publishing, Inc.
Piranhas. (2003). Retrieved June 21, 2005, from Web site:
www.junglephotos.com/animals/fishes/piranhas.htm
Pope, C. H. (2005). Crocodile. In Encyclopedia Americana (Vol. 8, pp. 231-233).
Danbury, CT: Scholastic Library Publishing, Inc.
Pressley, M. (1976). Mental imagery helps eight-year-olds remember what they
read. Journal of Educational Psychology, 68(3), 355-359.
Pressley, M. (1999). Self-regulated comprehension processing and its development
through instruction. In L. B. Gambrell, l. M. Morrow, S. B. Neuman, and M.
Pressley (Eds.) Best practices in literacy instruction (pp. 90-97). New York:
The Guilford Press.
Puffer. In Encyclopedia Americana (Vol. 22, p. 791). Danbury, CT: Scholastic
Library Publishing, Inc.
Puffer fish. (2005). June 2005. Retrieved July 15, 2005, from Web site:
www.whozoo.org/Anlife99/casskeck/puffer.html
Quasha, W. H., & Likert, R. (1937). The revised Minnesota paper form board test.
Journal of Educational Psychology, 28(3), 197-204.
284
Raphael, T. E., Kirshner, B. W., & Englert, C. S. (1989). Acquisition of expository
writing skills. In J. Mason (Ed.), Reading and writing connections (pp. 262-
266). Boston: Allyn & Bacon.
Rasco, R. W., Tennyson, R. D., & Boutwell, R. C. (1975). Imagery instructions and
drawings in learning prose. Journal of Educational Psychology, 67(2), 188-
192.
Rasinski, T., & Padak, N. (2004). Beyond consensus-- beyond balance: Toward a
comprehensive literacy curriculum. Reading & Writing Quarterly, 20, 91-102.
Rincon, P. (2003). Piranha increase “due to dams.” BBC News. Sunday, 28,
December 2003. Retrieved June 21, 2005, from Web site:
http://news.bbc.co.uk/1/hi/sci/tech/3346301.stm
Rive, M. E., Faibisch, F., Hunt, B., & Mitchell, A. (1996). Growth of literary
engagement: Changes in motivations and strategies during concept-oriented
reading instruction. Reading Research Quarterly, 31, 306-333.
Robertson, D. (2005). Everest, Mount. In Encyclopedia Americana (Vol. 10, p. 722).
Danbury, CT: Scholastic Library Publishing, Inc.
Rose, D. S., Parks, M., Androes, K., & McMahon, S. D. (2000). Imagery-based
learning: Improving elementary students' reading comprehension with
drama techniques. Journal of Educational Research, 94(1), 55-64.
Rose, M. C., Cundick, B. P., & Higbee, K. L. (1983). Verbal rehearsal and visual
imagery: Mnemonic aids for learning-disabled children. Journal of Learning
Disabilities, 16(6), 352-354.
Rowland, S. K. (2005). Volcano. In World book student. Retrieved July 7, 2005, from
285
World Book Student database: http://www.worldbookonline.com/student/
article?id=ar587920
Rumelhart, D. E. (1975). Notes on a schema for stories. In D. G. Bobrow & A.
Collins (Eds.), Representation and understanding: Studies in cognitive
science (pp. 211-236). New York: Academic Press.
Rumelhart, D. E. (1981). Understanding understanding (Tech. Rep. CHIP 100). La
Jolla, CA: University of California, San Diego, Center for Human Information
Processing, December 1978- December 1980. (ERIC Document Reproduction
Service No. ED198497)
Rumelhart, D. E., & Norman, D. A. (1978). Accretion, tuning and restructuring:
Three modes of learning. In J. W. Cotton & R. Klatzky (Eds.) Semantic
factors in cognition. Hillsdale, New Jersey: Lawrence Erlbaum Associates.
Rumelhart, D. E., & Norman, D. A. (1980). Analogical processes in learning. (Tech.
Rep. CHIP-TR-8005). La Jolla, CA: University of California, San Diego,
Center for Human Information Processing, April 1979- August 1980. (ERIC
Document Reproduction Service No. ED198809)
Rumelhart, D. E., & Norman, D. A. (1983). Representation in memory. (Tech. Rep.
UCSD-CHIP-116). La Jolla, CA: University of California, San Diego, Center
for Human Information Processing, June, 1983. (ERIC Document
Reproduction Service No. ED235770)
Rumelhart, D. E., Widrow, B., & Lehr, M. (1994). The basic ideas in neural
networks. Communications of the ACM, 37(3), 86-92.
Sackett, J., & Chun, H. (1998). How are the classroom behaviors of students with
286
chronic behavior problems related to their perceptions of teacher
“coolness”? (ERIC Document Reproduction Service No. ED419627)
Sadoski, M. (1983). An exploratory study of the relationships between reported
imagery and the comprehension and recall of a story. Reading Research
Quarterly, 19(1), 110-123.
Sadoski, M. (1984). Text structure, imagery, and affect in the recall of a story by
children. In J. A. Niles & L. A. Harris (Eds.), Changing perspectives in
research in reading/ language processing and instruction. Thirty-third
yearbook of the National Reading Conference (pp. 48-53). Washington, D. C.:
National Reading Conference.
Sadoski, M. (2001). Resolving the effects of concreteness on interest, comprehension,
and learning important ideas from text. Educational Psychology Review,
13(3), 263-281.
Sadoski, M. (2005). A dual coding view of vocabulary learning. Reading & Writing
Quarterly, 21, 221-238.
Sadoski, M., Goetz, E. T., & Fritz, J. B. (1993). Impact of concreteness on
comprehensibility, interest, and memory for text: Implications for dual coding
theory and text design. Journal of Educational Psychology, 85(2) 291.
Sadoski, M., Goetz, E. T., & Rodriguez, M. (2000). Engaging texts: Effects of
concreteness on comprehensibility, interest, and recall in four text types.
Journal of Educational Psychology, 92(1), 85-95.
Sadoski, M., Kealy, W. A., Goetz, E. T., & Paivio, A. (1997). Concreteness and
287
imagery effects in the written composition of definitions. Journal of
Educational Psychology, 89(3), pp. 518-526.
Sadoski, M., & Paivio, A. (2001). Imagery and text: A Dual Coding Theory of
reading and writing. Mahwah, NJ: Lawrence Erlbaum Associates, Inc.
Sadoski, M., & Quast, Z. (1990). Reader response and long-term recall for
journalistic text: The roles of imagery, affect, and importance. Reading
Research Quarterly, 25(4), 256-272.
Saenz, L. M., & Fuchs, L. S. (2002). Examining the reading difficulty of secondary
students with learning disabilities: Expository versus narrative text. Remedial
and Special Education, 23(1), 31-42.
Scholastic. (2005). Guided Reading in your classroom. Retrieved October 15, 2006,
from Scholastic Web site:
Teacher.scholastic.com/products/guidedreading/overview.htm
Scholastic. (2008). READ 180 classroom. Retrieved October 15, 2008, from
Scholastic Web site:
http://teacher.scholastic.com/products/read180/overviews/faq.htm
The science of earthquakes. (2005). Earthquake hazards program. Retrieved April 5,
2005, from US Department of Interior: United States Geological Survey
Web site: http://earthquake.usgs.gov/learning/kids/eqscience.php
Secretary's Commission on Achieving Necessary Skills (SCANS). (1992). What work
requires of schools: A SCANS report for America 2000. Washington D.C.:
U. S. Department of Labor.
Seidenstricker, L. S. (1999). The comparative effects of small group peer-led
288
discussion and large group teacher-led discussion on the strategic reading
comprehension, literary interpretation, and engagement of seventh grade
readers. Doctoral dissertation, University of Maryland, College Park.
(Publication No. AAT 9957146)
Sheveland, D. E. (1992). Development of Sheveland Vividness of Imagery
Questionnaire in Grades 3-6. Paper presented at the 42nd Annual Meeting of
the National Reading Conference (San Antonio, TX, December 2-5). (ERIC
Document Reproduction Service No. ED352634)
Shriberg, L. K., Levin, J. R. , McCormick, C. B. , & Pressley, M. P. (1982). Learning
about "famous" people via the Keyword Method. Journal of Educational
Psychology, 74(2), 238-247.
Slavin, R. E. (1983). Cooperative learning. New York: Longman, Inc.
Smith, C. B., Ellis, D. M., & Reed, E. (Eds.). (2003). The importance of
expository text: Reading and writing. (ERIC Document Reproduction Service
No. ED480886)
Smith, F. R., & Feathers, K. M. (1983). Teacher and student perceptions of content
area reading. Journal of Reading, 26, 348-354.
Spudis, P. D. (2005). Surface features of the moon. In World book student.
Retrieved June 3, 2005, from World Book Student database:
http://www.worldbookonline.com/student/article?id=ar370060&st=moon
Squid. (2005). In Encyclopedia Americana (International Edition, Volume S).
Danbury, CT: Scholastic Library Publishing, Inc.
289
Squyres, S. W. (2005). Mars. Retrieved April 1, 2005, from World Book Student
database: http://www.worldbookonline.com/student/article?id=ar346000
Stahl, K. A. D. (2004). Proof, practice, and promise: Comprehension strategy
instruction in the primary grades. The Reading Teacher, 57(7), 598-609.
Stieglitz, E. L. (2002). The Stieglitz informal reading inventory: Assessing reading
behaviors from emergent to advanced levels (3rd ed.). Needham Heights, MA:
Allyn & Bacon.
Taylor, L. R. (2005). Puffer. Retrieved August 15, 2005, from World Book Student
database: http://worldbookonline.com
Toglia, M., & Battig, W. F. (1978). Handbook of semantic word norms. Hillsdale, NJ:
Lawrence Erlbaum Associates.
Tomlinson, C. A. (2001). How to differentiate instruction in mixed-ability classrooms
(2nd ed.). Alexandria, VA: ASCD.
Tierney, R. J., & Readence, J. E. (2000). Induced imagery. Reading strategies and
practices: A compendium (pp. 362-365). Boston: Allyn & Bacon.
VanderMey, R., Meyer, V., Van Rys, J., Kemper, D., & Sebranek, P. (2007). The
college writer: A guide to thinking, writing, and researching (2nd ed.). Boston:
Houghton Mifflin Company.
Vygotsky, L. S. (1962). Thought and language. Oxford, England: Wiley.
Wade, N. (2002, July 26). Fish genes aid human discoveries. The New York Times, p.
A19. Retrieved from http://www.nytimes.com/2002/07/26/us/
fish-genes-aid-human-discoveries.html
290
Yellow jackets and other wasps. (2008, March 3). Retrieved March 23, 2008, from
http://www.ebeehoney.com/beeid.html
Walbert, H. J., & Tsai, S. L. (1984). Correlates of reading achievement and attitude:
A national assessment study. Journal of Educational Research, 78(3), 159-
167.
Wade, S. E., Burton, W. M., & Kelly, M. (1999). Using think-alouds to examine
reader- text interest. Reading Research Quarterly, 34(2), 194-216.
Walker, B. J., Truscott, D. M., Gambrell, L. B., & Almasi, J. (1994). Mental imagery,
text illustrations, and reading comprehension of adult readers. In E. G.
Sturtevant, W. M. Linek, K. A. J. Mohr, E. W., & E. W. Murphy (Eds.) ,
Pathways for literacy: Learners teach and teachers learn: The sixteenth
yearbook of the College Reading Association (pp. 99-108). Pittsburg, KS:
College Reading Association.
Warner, M. M. (1977). Teaching learning-disabled junior high students to use visual
imagery as a strategy for facilitating recall of reading passages. Doctoral
dissertation, University of Kansas, Kansas. (No. AAT 7809415)
Warner, M. M., & Alley, G. R. (1981). Teaching disabled junior high students to use
visual imagery as a strategy for facilitating recall of reading passages.
Kansas University, Lawrence, Institute for Research in Learning Disabilities.
(ERIC Document Reproduction Service No. ED217654)
Weaver, C. A., & Kintsch, W. (1984). Expository text. In R. Barr, M. L. Kamil, P. B.
Mosenthal, & P. D. Pearson (Eds.), Handbook of reading research, Volume
III (pp. 815-860). White Plains, NY: Longmans Publishing Group.
291
Weinstein, C. E. (1982). Training students to use elaboration learning strategies.
Contemporary Educational Psychology, 7(4), 301-311.
Wigfield, A. (1997). Children's motivations for reading and reading engagement. In J.
T. Guthrie & A. Wigfield (Eds.), Reading engagement: Motivating readers
through integrated instruction (pp. 14-33). Newark, DE: International Reading
Association.
Williams, J. P., Hall, K. M., Lauer, K. D., Stafford, K. B., DeSisto, L. A., & de Cani,
J. S. (2005). Expository text comprehension in the primary grade classroom.
Journal of Educational Psychology, 97(4), 538-550.
Winans, D. (2005). It's hard to stick around. NEA Today. May 2005:41.
Winograd, P., & Greenlee, M. (1986). Students need a balanced reading program.
Educational Leadership, April, 16-21.
Wood, K. D., Watson, P., & Soares, L. (2006). Instructional strategies for
vocabulary and comprehension in the middle school: Research into practice.
Presentation for the International Reading Association Pre-conference
Institute, Chicago, Illinois, Spring 2006.
The World book encyclopedia. (2003). Chicago: World Book, Inc.
Yopp, R. H., & Yopp, H. K. (2000). Sharing informational text with young children.
The Reading Teacher, 53(5), 410-423.
Zhang, Z., & Schumm, J. S. (2000). Exploring effects of the keyword method on
limited proficient students' vocabulary recall and comprehension. Reading
Research and Instruction, 39(3), 202-221.

292
Zaner-Bloser, Educational Publisher. (2007). 9 Good habits for all readers.
Columbus, OH: Zaner-Bloser, Educational Publisher.
Ziegler, M. (2001). Improving practice through action research. Adult Learning,
12(1), 3-4. Retrieved February 21, 2005, from ERIC database:
http://search.epnet.com. (ERIC Number EJ 656874)