Embed Size (px)
Citation preview
AN ABSTRACT OF THE THESIS OF
Edward A Perkins for the Ed. D. in Education
(Name) (Degree) (Major)
Date thesis is presented
Title THE EFFECTIVENESS OF CONTROLLED READING-RATS PRACTICE
TECHNIQUES IN THE DEVELOPMENT OF SPEED AND ACCURACY IN
SECOND-QUARTER COLLEGE TYPEWRITING
Abstract approved(Major professor)
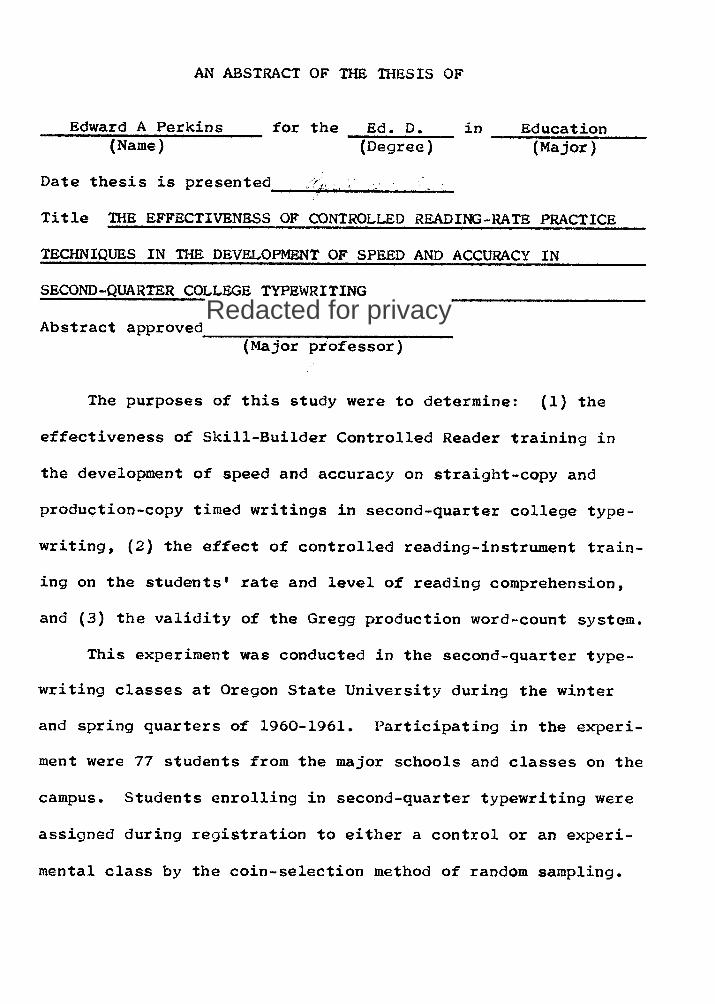
The purposes of this study were to determine: (1) the
effectiveness of Skill-Builder Controlled Reader training in
the development of speed and accuracy on straight-copy and
production-copy timed writings in second-quarter college type
writing, (2) the effect of controlled reading-instrument train
ing on the students' rate and level of reading comprehension,
and (3) the validity of the Gregg production word-count system.
This experiment was conducted in the second-quarter type
writing classes at Oregon State University during the winter
and spring quarters of 1960-1961. Participating in the experi
ment were 77 students from the major schools and classes on the
campus. Students enrolling in second-quarter typewriting were
assigned during registration to either a control or an experi
mental class by the coin-selection method of random sampling.
Redacted for privacy

Both the control and the experimental classes used the
same textbooks, materials, electric typewriters, and classroom
facilities. The only difference between the teaching proce
dures used in the control and experimental classes was the
presentation of approximately ten minutes of Skill-Builder
Controlled Reader materials in the experimental classes three
days a week for seven weeks. On instrument-training days, the
control classes typed for ten minutes from duplicated sheets
containing the identical filmstrip copy used in the experi
mental classes. The experimental classes were divided into
three ability groups and instrument-training drills were pro
jected for each ability group at gradually increasing speeds
commensurate with the group's key-stroking ability. Ability
grouping was not used in the control classes.
Periodic measurements were made of the students' ability
to reproduce straight-copy and production-copy material under
timing. Thirteen different measurements, including a reading
test, were used to evaluate the students' performance.
On the final letter, enumeration, and five-minute
straight-copy tests, F-test calculations showed that there were
no statistically significant differences between the means of
the control and experimental classes in speed and/or accuracy
performance. On the final five-minute tabulation test, there
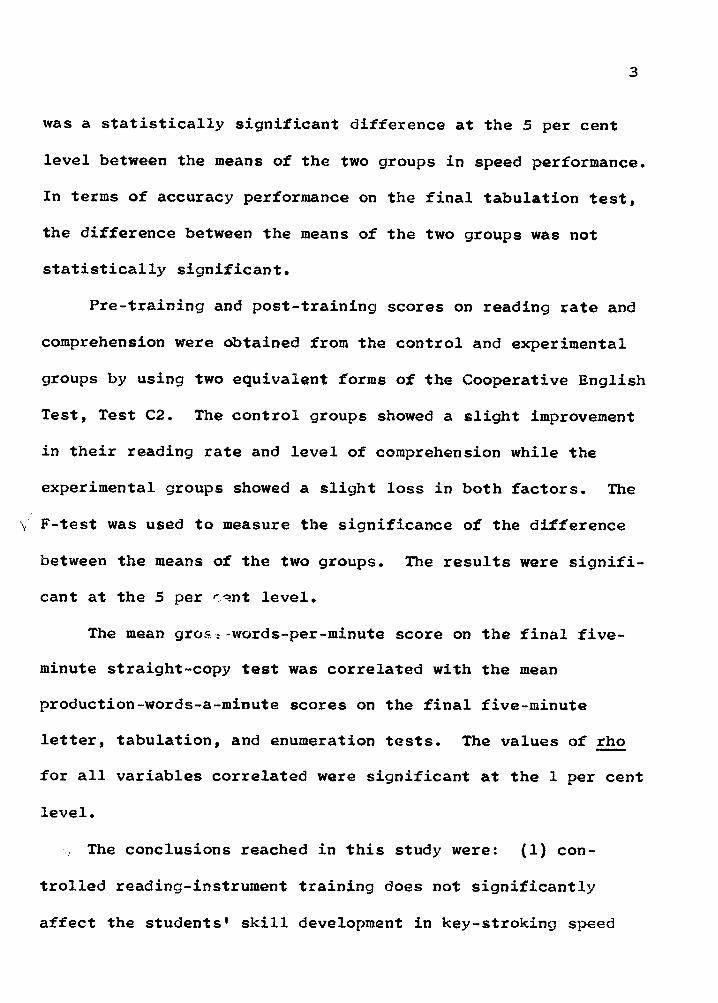
was a statistically significant difference at the 5 per cent
level between the means of the two groups in speed performance.
In terms of accuracy performance on the final tabulation test,
the difference between the means of the two groups was not
statistically significant.
Pre-training and post-training scores on reading rate and
comprehension were obtained from the control and experimental
groups by using two equivalent forms of the Cooperative English
Test, Test C2. The control groups showed a slight improvement
in their reading rate and level of comprehension while the
experimental groups showed a slight loss in both factors. The
\ F-test was used to measure the significance of the difference
between the means of the two groups. The results were signifi
cant at the 5 per c^nt level.
The mean gro&?-words-per-minute score on the final five-
minute straight-copy test was correlated with the mean
production-words-a-minute scores on the final five-minute
letter, tabulation, and enumeration tests. The values of rho
for all variables correlated were significant at the 1 per cent
level.
The conclusions reached in this study were: (1) con
trolled reading-instrument training does not significantly
affect the students' skill development in key-stroking speed

and/or accuracy performance on straight-copy and production-
copy timed writings in second-quarter college typewriting,
(2) controlled reading-instrument training tends to impede, at
least temporarily, the students' rate and level of reading com
prehension, and (3) production words a minute is a valid word-
count system for equating straight-copy and production-copy
timed writings.

THE EFFECTIVENESS OF CONTROLLED READING-RATE PRACTICE
TECHNIQUES IN THE DEVELOPMENT OF SPEED AND ACCURACY
IN SECOND-QUARTER COLLEGE TYPEWRITING
by
EDWARD A PERKINS
A THESIS
submitted to
OREGON STATE UNIVERSITY
in partial fulfillment ofthe requirements for the
degree of
DOCTOR OF EDUCATION
June 1963
APPROVED:
Head of Departments of Business Education andSecretarial Science
In Charge of Major
Chairman of School Graduate Committee
Dean of Graduate School
Date thesis is presented_
Typed by Edward Perkins
fa*- V-<,.?. L.
Redacted for privacy
Redacted for privacy
Redacted for privacy

ACKNOWLEDGMENTS
The writer most earnestly expresses a deep sense of
indebtedness and appreciation to Dr. C. T. Yerian for his
interest and friendly guidance throughout the graduate pro
gram and for his wholehearted cooperation in the facilita
tion of this experimental study.
Sincere gratitude goes in fullest measure to
Dr. R. B. D. Baron, Dr. Robert R. Reichart, and Dr. Fred E.
Winger for their innumerable and invaluable suggestions
throughout the development and completion of this experi
ment. An expression of appreciation is also extended to
Mr. Robert J. Ruegg, director of the Business Education
Division, Educational Developmental Laboratories, for his
helpful advice in the initial stages of this research study
and to Dr. Jerome Li for his verification of the statistical
aspects of this study.
Special thanks are also due Dr. Robert E. Hoskinson for
his critical reading of the final manuscript.
E. A. P.
TABLE OF CONTENTS
CHAPTER PAGE
I INTRODUCTION 1
Need for the Study 3
Statement of the Problem 5
Hypotheses 6Limitations of the Study 7
Definition of Terms 8
Summary 13
II REVIEW OF RELATED RESEARCH IN CONTROLLED
READING-INSTRUMENT TRAINING IN THE FIELD
OF EDUCATION 15
Introduction 15
The Development of Controlled Reading Devices 16Experimentation with Controlled Reading
Devices in the Field of Reading Improvement 23Experimentation with Controlled Reading
Devices in the Field of Business Education 36
Reading for Typewriting 43Summc 47
III PERSONNEL, MATERIALS, AND PROCEDURES 50
Introduction 50
Formation of the Classes 50
Materials and Equipment 56Controlled Reading-Rate Practice Techniques . 58Evaluation Procedures 65
Summary 70
IV FINDINGS AND INTERPRETATIONS 72
Introduction 72
Speed and Accuracy Performance on Straight-Copy Tests 73
Speed and Accuracy Performance on Production-Copy Tests 110

TABLE OF CONTENTS (Continued)
CHAPTER PAGE
Reading Rate and Comprehension Development. . 122Validity of the Gregg Production Word-Count
System 126
Summary 128
V SUMMARY, CONCLUSIONS, AND RECOMMENDATIONS ... 131
Summary 131
Conclusions 139
Recommendations 142
BIBLIOGRAPHY 148
APPENDIX
A SKILL-BUILDER CONTROLLED READER FILMSTRIP
MATERIALS 154
B FILMSTRIP EXERCISES AND PROJECTION SPEEDS USED
IN INSTSTIMENT-TRAINING SESSIONS 160
LIST OF FIGURES
FIGURE PAGE
1 Mean Gross Words Per Minute on the Five-Minute
Straight-Copy Tests (Experiment I) 80
2 Mean Total Errors on the Five-Minute Straight-Copy Tests (Experiment I) 81
3 Mean Net Words Per Minute on the Five-Minute
Straight-Copy Tests (Experiment I) 82
4 Mean Gross Words Per Minute on the Five-Minute
Straight-Copy Tests (Experiment II) 84
5 Mean Total Errors on the Five-Minute Straight-Copy Tests (Experiment II) 85
6 Mean Net Words Per Minute on the Five-Minute
Straight-Copy Tests (Experiment II) 86
7 Mean Gross Words Per Minute on the Five-Minute
Straight-Copy Tests (Combined Experiments) ... 88
8 Mean Total Errors on the Five-Minute Straight-
Copy Tests (Combined Experiments) 89
9 Mean Net Words Per Minute on the Five-Minute
Straight-Copy Tests (Combined Experiments) ... 90
LIST OF TABLES
TABLE PAGE
I Distribution by Schools of Students Participating in Controlled Reading TypewritingExperiment 52
II Distribution by Classes of Students Participating in Controlled Reading TypewritingExperiment. 54
III t-Test for Differences Between the Mean Gross
Words Per Minute of Control and ExperimentalGroups on Initial and Final Five-MinuteStraight-Copy Tests 74
IV t-Test for Differences Between the Mean Errors
of Control and Experimental Groups on Initialand Final Five-Minute Straight-Copy Tests ... 76
V Mean Scores on Gross Words Per Minute, NetWords Per Minute, and Total Errors on the Five-Minute Straight-Copy Writings (Experiment I). . 79
VI Mean Scores on Gross Words Per Minute, NetWords Per Minute, and Total Errors on the Five-Minute Straight-Copy Writings (Experiment II) . 83
VII Mean Scores on Gross Words Per Minute, NetWords Per Minute, and Total Errors on the Five-Minute Straight-Copy Writings (Combined Experiments) 87
VIII Table of Means of Gross Words Per Minute forLast Five-Minute Straight-Copy Test 98
IX Analysis of Variance for Gross Words Per Minuteon Last Five-Minute Straight-Copy Test 98
X Table of Means of Total Errors for Last Five-Minute Straight-Copy Test 100
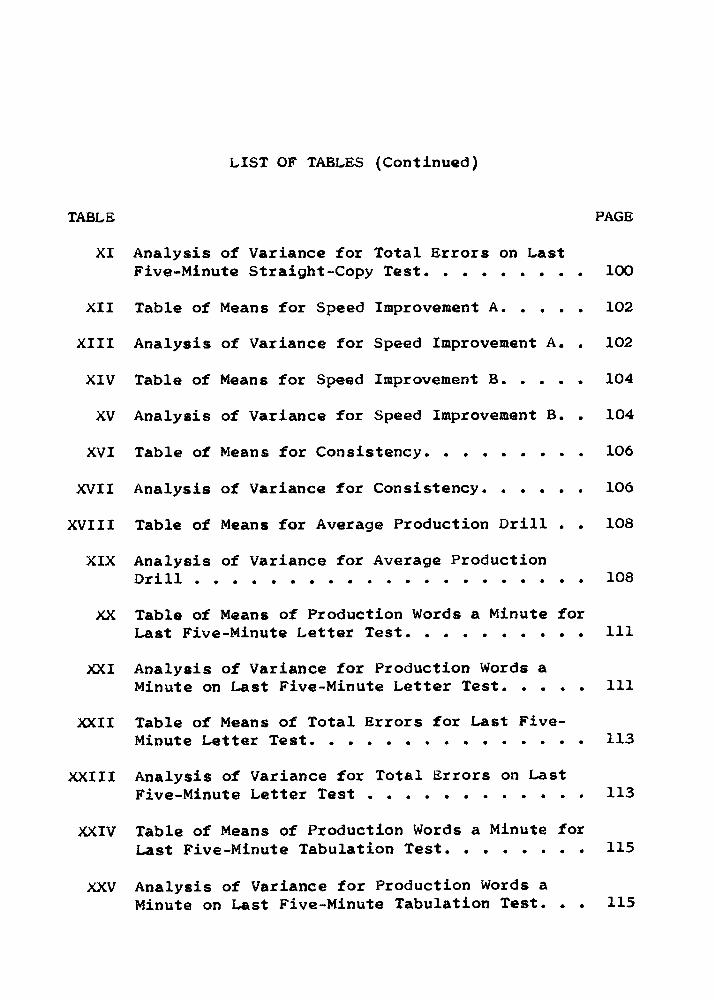
LIST OF TABLES (Continued)
TABLE PAGE
XI Analysis of Variance for Total Errors on LastFive-Minute Straight-Copy Test 100
XII Table of Means for Speed Improvement A 102
XIII Analysis of Variance for Speed Improvement A. . 102
XIV Table of Means for Speed Improvement B 104
XV Analysis of Variance for Speed Improvement B. . 104
XVI Table of Means for Consistency 106
XVII Analysis of Variance for Consistency 106
XVIII Table of Means for Average Production Drill . . 108
XIX Analysis of Variance for Average ProductionDrill 108
XX Table of Means of Production Words a Minute for
Last Five-Minute Letter Test Ill
XXI Analysis of Variance for Production Words aMinute on Last Five-Minute Letter Test Ill
XXII Table of Means of Total Errors for Last Five-
Minute Letter Test 113
XXIII Analysis of Variance for Total Errors on LastFive-Minute Letter Test 113
XXIV Table of Means of Production Words a Minute for
Last Five-Minute Tabulation Test 115
XXV Analysis of Variance for Production Words aMinute on Last Five-Minute Tabulation Test. . . 115

LIST OF TABLES (Continued)
TABLE PAGE
XXVI Table of Means of Total Errors for Last Five-
Minute Tabulation Test 117
XXVII Analysis of Variance for Total Errors on LastFive-Minute Tabulation Test 117
XXVIII Table of Means of Production Words a Minute
for Last Five-Minute Enumeration Test 118
XXIX Analysis of Variance for Production Words aMinute for Last Five-Minute Enumeration Test . 118
XXX Table of Means of Total Errors for Last Five-
Minute Enumeration Test 120
XXXI Analysis of Variance for Total Errors on LastFive-Minute Enumeration Test 120
XXXII Mean Gains for Control and Experimental Groupsfor Vocabulary, Rate and Level of Reading Comprehension on Cooperative English Test,Test C2 123
XXXIII Table of Means for Total Reading ComprehensionImprovement 125
XXXIV Analysis of Variance for Total Reading Comprehension Improvement 125
XXXV Coefficients of Correlation Between Gross
Words Per Minute on Last Five-Minute Straight-Copy Test and Production Words a Minute onFinal Five-Minute Letter, Tabulation, andEnumeration Tests (Combined Experiments) . . . 127
XXXVI Summary of Means, F-Values, and Degrees ofFreedom for the Control and ExperimentalGroups on Thirteen Different Variations. . . . 130

THE EFFECTIVENESS OF CONTROLLED READING-RATE PRACTICE
TECHNIQUES IN THE DEVELOPMENT OF SPEED AND ACCURACY
IN SECOND-QUARTER COLLEGE TYPEWRITING
CHAPTER I
INTRODUCTION
An exploding population leading to mounting school
enrollments, as well as an advancing technology in the aero
space age, has placed considerable stress on today's
American educational system. As a result of these acceler
ating forces, a number of colleges, universities, and public
school systems have begun to examine critically some of
their long-held assumptions as to the nature and organiza
tion of the teaching-learning process. Inquiries ranging
from one-shot doctoral research studies to research con
ducted at the local level with small staffs and limited
budgets to massive long-range programs supported jointly by
the Cooperative Research Program of the U. S. Office of
Education and colleges, universities, and state educational
agencies are mushrooming as never before in all our previous
history.
The curriculum, naturally enough, was the first target
of widespread concern for the excellence of education. For

a decade or more, the spotlight of criticism has been fo
cused on the life-adjustment activities of the curriculum,
a system which, in the main, attempted to meet the current
needs and interests of children. A number of vocal and
articulate critics—newspaper and magazine editors, politi
cians, industrialists, military men, and others—argued that
the curriculum was outdated and failed to meet the needs of
a technological civilization. Silverman provides a good
summary of this point of view in his statement:
For fifty years this system helped the U. S, tomake more smoothly than $my other nation the difficult transition from a farming to an industrialsociety, at the same time absorbing and American-*izing the children of millions of immigrants."Adjustment" was what the American school childneeded--and the schools of yesterday supplied it.(33, p. 126)
Against this background of restless discontent with the
educational ideas <ni the recent past, a new curriculum aimed
at quality education is being forged in several thousand
schools throughout the country, Stimulated by the recommen
dations of the Conant Report (9, p. 41-76), by the findings
of experimental studies conducted by the Commission on the
Experimental Study of the Utilisation of the Staff in the
Secondary School (41, p. 4-14), and by other studies, the
most dramatic changes are taking place in the American
secondary education program. One discernible trend is an
increased.emphasis in the intellectual disciplines, particu
larly in science, mathematics, and modern foreign language.
Another important trend is that,toward shorter programs in
vocational education, which includes bookkeeping, shorthand,
and typewriting.
y' Business educators, then, are faced with the challenge
of searching for answers to problems brought about by sweep
ing changes in the curriculum. Can the teaching-learning
process of business subject® be accelerated? .Can the length
of business skill-subject programs be shortened without re
sulting in a loss of vocational competency? Will Skill-
Builder Controlled Reader training accelerate the learning
process and result it* greater speed and accuracy gains is
typewriting?
Need for the Study
In considering the need for the study, the following
reasons were apparentt
1. A need exists to modernize the business education
curriculum. Cook expressed this need when he saids
Unfortunately, we are not experiencing the revi-talization that is so evident in most of theother high school subjects. This, at a time when
courses are being eliminated from the business
curriculum, when enrollments are dropping in thevocational courses, when we have a country ofeconomic illiterates, and when there is a greaterdemand than ever before for skilled office work
ers. (10, p. 22)
2. Statements of accomplishment in the area of type
writing have disclosed that vocational skill is reached in
a majority of schools by the average high school student
after four semesters of instruction. (26, p. 17) In view
of an indicated trend toward two- and three-semester pro-
grass in high school typewriting, there seems'to be a need
to improve teaching practices in order to reach vocational
objectives in a shorter period of time.
3. A need also seems to exist for further, more scien
tific and mmm extensive research to determine the place of
audio-visual aids in the teaching of skills in business sub
jects. Audio-visual aids, appropriately selected and prop
erly utilized, can contribute to teaching and can improve
learning, the goal of teaching. Today many American schools
own or have easy access to such audio-visual equipment as
the motion-picture projector, the filmstrip projector, the
overhead transparency projector, the opaque projector, the
tape recorder, and various othera. Despite such a variety
of audio-visual materials that are available, there remains

one simple fact: Most teachers already have access to more
technological aids to instruction than they are using. In
writing about the use of audio-visual aids by business edu
cation teachers of skill subjects, Winger stated:
There are those who are skeptical of the entireaudio-visual program and reluctant to attempt toadapt any phase of the program to their teachingprocedures. Others have adopted certain preferred aids to learning and use them almost ex
clusively without attempting to try out any ofthe new devices. (43, p. 1)
4. Studies in controlled reader training for develop
mental reading instruction on all levels have been con
ducted. (38, p. 1-5) In the field of business education,
a number of training programs in beginning typewriting,
shorthand, and other business education subjects have been
conducted with the assistance of the reading instrument.
(31, p. 17-20) A need exists, then, to determine the effec
tiveness of this type of training in beginning, intermedi
ate, and advanced typewriting at both the secondary and
college levels.
Statement of the Problem
The primary purpose of this study was to determine by
experimental means the effectiveness of the Skill-Builder
Controlled Reader as a learning aid in the teaching of
6
second-quarter college typewriting. The study was performed
to determine whether students receiving Skill-Builder
Controlled Reader training in intermediate college type
writing would attain higher rates of speed and/or better
accuracy on straight-copy timings and production-type prob
lems than students not receiving reading-instrument train
ing. A secondary purpose of this study was to determine the
effect of Skill-Builder Controlled Reader training on the
students' speed and level of reading comprehension based on
a standardized reading test. Another purpose of this study
was to determine the significance of the relationship
between the following word-count scoring systems: gross-
words-per-minute scores obtained on the final five-minute
straight-copy writing and production-words-a-minute scores
obtained on the final five-minute letter test, the final
five-minute tabulation test, and the final five-minute enu
meration test.
Hypotheses
The following hypotheses were proposed:
Hypothesis I: That practice on typewritten copy auto
matically projected at a continuous, left-to-right motion
and preset pace will be conducive to the development of
rapid stroking on straight-copy material and production-type
activities in second-quarter college typewriting.
Hypothesis II: That practice on typewritten copy auto
matically projected at a continuous, left-to-right motion
and preset pace will be conducive to the development of
accuracy on straight-copy material and production-type
activities in second-quarter college typewriting.
Hypothesis III: That practice on typewritten copy
automatically projected at a continuous, left-to-right
motion and preset pace will improve the students' rate and
level of reading comprehension on ordinary reading copy.
Limitations of the Study
The limitations of this study were as follows:
1. The filmstrip copy used in this study was not cor
related with the typewriting textbooks and supplementary
materials used for daily practice and skill-building pur
poses.
2. It was not possible to conduct a follow-up study to
determine if the reading-instrument training had any long-
term effect. Approximately four out of every five students
in this study were nonbusiness education majors who did not

continue their typewriting instruction into the third-
quarter course.
3. There was no way of controlling individual deter
mination and other motivating factors.
4. There was no way of controlling the amount of prac
tice time the students spent outside the classroom.
Definition of Terms
Throughout this study certain technical and mechanical
terms are used. Stated below are definitions of these
terms.
Basic rate: Refers to a scoring method devised by
Dr. Fred Winger, of Oregon State University, and used in all
second-quarter typewriting classes at that school for the
purpose of determining a student's beginning~of-the-quarter
achievement rate on straight-copy material. The net-words-
per-rainute score for each student, based upon the average of
three or more straight-copy five-minute writings adminis
tered within the first ten days of the course, was computed
and then adjusted around an arbitrary limit of three errors.
This adjustment computation was designed to equate the error
factor, which tends to be unusually high for many students
at the beginning of the course.
Srrorsi defers to the total number of errors made on
the entire timed writing rather than the number of errors
per. utiaut© of writing. The determination as to what con
stituted an error was based upon the International Type
writing Contest Rules that are available in most, typewriting
textbooks.
Flipstrip: The filmstrip is a continuous length of
35mm film upon which words, phrases, sentences, and other
typewriting exercises to be projected axe imprinted. .All
filastrip exercises used in this study were selected fro®
the Educational Developmental Laboratories* Typing-Skill
Development Course, a twenty-five filastrip, seventy-five
lesson course designed to be us®d from the day students
complete their keyboard introduction to the termination of
tfptmt11ino: instruction.
Fixations; The length of time required for the eyes to
fix on a given part of a line in reading.
Gross words per minute (GWPM^i Refers to a method of
determining the rate of speed in typewriting without talcing
accuracy into consideration. The gross-words-per-minute
figure was obtained by dividing the total number of strokes
typed by five ami then by the number of minutes in the

10
timing. In typewriting five strokes, letters, and spaces
are considered a word in all computations.
Net words per minute (NWPM): Refers to a method of
determining the rate of speed in typewriting taking accuracy
into consideration. The net-words-per-minute scores were
obtained by dividing the total number of strokes typed by
five and from this number ten words were deducted for each
error in the timed writing, then this figure was divided by
the number of minutes in the timing. The ten-word penalty
was designed to represent the length of time it would take
to make an acceptable correction of the mistake.
Perception: In typewriting perception refers to copy
ing from printed material without regard to meaning or com
prehension.
Production-type exercises: Refers to one-page personal
and business letters arranged in block or semiblock style;
one-column to four-column tabulation problems, with or with
out column headings; and various manuscript exercises,
including the enumeration, outline, and bibliography. These
textbook exercises were designed to build basic typewriting
skill in problem-solving situations.
Production words a minute (FWAM): Refers to a new
production word-count system that attempts to equate the
11
complexity of production typing with the simplicity of
straight-copy typing, thus facilitating the establishment of
a single set of standards for all kinds of typewritten copy.
In addition to the usual one-word credit for each five
strokes, letters, and spaces, the counting system allows the
following credits for all necessary machine operations:
1. Underscored words: Triple count is given for each
underscored stroke.
2. Centered words: Triple count is given for each
centered stroke.
3. Extra carriage returns: Five strokes are given for
each extra carriage return.
4. Tabulation: Five strokes are given for each use of
the tabulator.
5. Changing paper: Forty strokes are given for change
of paper.
6. Special operations: Five strokes are given for
each special machine operation, like using the margin re
lease, the variable spacer, the carriage release, and the
ratchet release. (27, p. 31)
All these credits are based on having the margins, tab
stops, and spacing mechanism of the typewriter set in
advance and paper inserted, so that the student is ready to
begin typing—just as he is for a straight-copy timing. In
computing speed, the student uses the same method that he
does in determining gross words per minute: total words
typed, or the total number of strokes typed divided by five,
divided by the number of minutes in the timing.
Recognition span: The number of letters, parts of
words, or words that can be identified at one fixation
pause.
Regressions: The number of times the eyes tend to
retrace or review portions of the line being read.
Skill-Builder Controlled Reader: The Ski11-Builder
Controlled Reader, developed by the Educational Develop
mental Laboratories, Huntington, New York, is a 35mm film-
strip projector with an automatic speed variation from two
to eighteen lines a minute, or about twelve to one hundred
eight words a minute, with a speed increase of six words a
minute with each turn of the speed control dial. It is a
mechanical device which presents reading material in a con
tinuous, smooth, left-to-right motion; it has a moving slot
which covers and uncovers print as it moves across each
line. Projection may also be set in an open slot motion
which exposes an entire line of print at one time.

13
Straight-copy timings: Refers to sentence or paragraph
timed writings, some with equal-length lines and others with
varied-length lines. In this study, straight-copy timings
were used in conjunction with a skill-building program that
emphasized either the speed or the accuracy factor on spe
cific days of the week.
Tachistoscope: The tachistoscope is a mechanical
device which projects images of objects or reading material
on a screen for a brief measured period, a full second or
some fraction of a second. It is an effective instrument
for improving the seeing process of the learner.
Summary
As schools are currently under pressure to compress
nonacademic programs, the time required to develop basic
typewriting skill needs to be reduced; and the instructional
practices and procedures need to be improved. It is felt
that audio-visual aids, appropriately selected and properly
utilized, can help accelerate the learning process. A need
exists for further, more scientific and more extensive
research to determine the place of audio-visual aids in the
teaching of skill subjects in business education. Specifi
cally, research data are needed to determine the value of

Skill-Builder Controlled Reader training in all phases and
levels of typewriting instruction.
The primary purpose of this study, then, Ml to deter
mine by experimental means whether students receiving Skill-
Builder Controlled Reader training in second-quarter college
typewriting would attain higher rates of speed and/or better
accuracy on straight-copy timings and production-type prob
lems than students not receiving reading-instrument train
ing.
Chapter II will review the related research in con
trolled reading-instrument training in the field of educa
tion.
15
CHAPTER II
REVIEW OF RELATED RESEARCH IN CONTROLLED READING-
INSTRUMENT TRAINING IN THE FIELD OF EDUCATION
Introduction
Inventive Americans have long turned their attention to
the production of special tools, instruments, and devices
for aiding various instructional programs. The list of
machines and gadgets which have been sold to schools during
the last thirty years in reading instructional programs, for
example, constitutes a formidable exercise in spelling and
pronunciation: tachistoscope, metronoscope, ophthalmograph,
reading rate accelerator. In the field of business educa
tion, however, the use of reading instruments is still in
its infancy.
This investigation has been restricted to the early
background and development of controlled reading-instrument
training in education. An examination of some of the sig
nificant studies in the fields of reading improvement and
business education provides a vivid picture of the develop
ment of controlled reading instrumentation in this country.

16
Pertinent research studies of the reading factors in type
writing will also be examined.
The Development of Controlled Reading Devices
Early Concept of Reading
The early concept of reading, from the middle of the
nineteenth century until 1910 or thereabouts, emphasized a
mechanistic interpretation of reading. Reading was con
sidered basically a perceptual act--a matter of quick rec
ognition of words. Diagnoses of reading difficulties took
the form of examination of the physical and particularly
the eye-movement characteristics of the problem reader.
Success in reading was considered largely a reflection of
physical traits which could best be modified by physical or
medical means. Some of the basic psychological facts
derived from the studies of this period have been summarized
by Spache. They are:
1. Reading is performed in a series of short,quick movements and fixation pauses ratherthan one continuous sweep across the page.
2. The number of words, phrases, or lettersrecognized during the fixation pausereflects the reader's familiarity with thereading matter, the difficulties which heencounters in word recognition or assimilation of ideas, as well as the physicalcharacteristics of the material read.

17
3. These eye-movements do not occur line
after line in a fixed pattern becauseof the influence of the factors men
tioned above. There is, however, atendency for the individual to formocular-motor habits which tend to persist in many reading situations. (34,p. 10)
Remedial training intended to increase both the speed
and span of word recognition, then, consisted largely of
rote memorization supplemented by flash cards and laboratory
quick-exposure devices.
The Tachistoscope
The tachistoscope, which flashes or projects objects,
words, and numbers at fast speeds, was developed to work
directly on span and time of fixation. Early tachistoscopic
experiments designed to measure the span of apprehension
were conducted in the laboratory by Sir William Hamilton in
1859; by Jevons in 1871; by Cattell in 1895; and by Dodge,
Kutzner, Fernberger, Freeman, Glanville, Dallenbach, and
others in the period up to 1914. (19, p. 314-315)
Prominent among contemporary psychologists interested
in the field of recognition training is Dr. Samuel Renshaw
of Ohio State University. A program of tachistoscopic
training in aircraft and ship recognition was established by
Renshaw during World War II for the Navy Department. This

18
training proved to be successful and was continued by the
Navy throughout the war.
Since 1938 the Keystone View Company has spearheaded
the development of equipment, materials, and methods for use
on the tachistoscope in education. Keystone's progress in
the field of tachistoscopic techniques is summarized by
Hamilton as follows:
The first great advance in this project camewith the development of the Keystone OverheadProjector. This made possible the use of multiple exposure slides instead of using anentire slide for one word, phrase, or numberas was necessary in the conventional type ofslide projector, whether for standard or fortwo-inch lantern slides. It now became possible to print from sixteen to eighteen andlater forty exposures on one slide, each exposure appearing on the screen at exactly thesame spot when flashed. Up to the time ofthis development, the use of the tachistoscopedragged. The expense of hand-making and buying 1,000 or more slides, which seemed to bea minimum necessity, seemed prohibitive tobuyers; and where such a collection of slidesmight be secured, its filing and use were cumbersome and forbidding. (19, p. 315-316)
A comprehensive report of tachistoscopic principles,
techniques, and application to school problems is contained
in Gaspar C. Barnette's Learning Through Seeing. (4,
p. iii-145)

19
Importance of Eye Movements in Reading
Beginning approximately in the second decade of this
century, the concept of reading gradually shifted to one
emphasizing comprehension. This change in the concept of
the act of reading was largely responsible for much vigorous
debate among reading authorities regarding the importance
and value of training in the mechanics of eye movements and
its relationship to reading skill. Traxler summarized the
nature of this controversy as follows:
Some authorities regard the complex of psychological factors involved in reading comprehension as the all-important thing and hold thateye-movements are only symptoms of the effectiveness of comprehension. They insist thatif pupils are instructed in such a way thatthey learn to understand what they read, theireye-movements will as a rule be satisfactorilymature. Others believe that faulty eye-movements are frequently a cause of readinginefficiency and that noteworthy improvementin reading skill may be brought about by directtraining of eye-movements. (40, p. 280)
Whatever the nature of eye-movement behavior in read
ing, photographic records of eye movements reveal that good
readers at any age or grade level make fewer fixations per
line, fewer regressions, and take less time per fixation
than poor readers. The fact that there are these differ
ences between the eye movements of good and poor readers
suggests the possibility of improving reading by training

20
the poor reader to emulate the eye movements of the good
reader. A number of controlled reading devices, including
the Metronoscope, the Harvard Reading Films, and the Con
trolled Reader, have been developed to that end. These
instruments have been used extensively in schools and clin
ics throughout the country to develop a rhythmic, left-to-
right movement of the eyes, broaden the span of recognition,
and decrease the number of fixations and regressions.
Controlled Reading Devices
In 1922 Guy T. Buswell began experiments with a device
to aid in the presentation of specific remedial exercises in
a reading program. His apparatus consisted of a simple
stereoptican device which used a kinetoscope film. By
moving the film upward through the stereoptican apparatus,
Buswell was able to project single units on a screen with
one following another in regular position across the line.
Buswell stated:
In reading the words, the pupil would not onlybe securing exercise in grasping a short wordat a single eye-fixation, but he would also begetting the habit of moving his eyes regularlyacross the line as in ordinary reading. (6,p. 141)
Buswell was acutely aware of the limitations of his device,
and he cautioned it should be used for a specific type of

21
remedial exercise for a specific reading deficiency. (6,
p. 138-147)
One of the first practical devices for reading instruc
tion was the Metronoscope which was developed by James Y.
Taylor, Earl A. Taylor, and Carl C. Taylor and released by
the American Optical Company in 1931. The Metronoscope was
a triple-door device for exposing segments of lines of print
in a left-to-right fashion. In essence it was a tachisto
scopic device for the controlled time exposure of words and
phrases for continuous reading. An adaptation of the
Metronoscope principle, 16ram silent motion-picture films for
the college level known as the Harvard Reading Films, was
released by Harvard University in 1938. Films of a similar
nature were released by the State University of Iowa in 1951
for high school readers. (38, p. 1)
A number of individual acceleration devices, though not
left-to-right control devices, were released after 1950.
Among these were the Reading-Rate Controller, Stero Optical
Company; the Reading Accelerator, Science Research Associ
ates; the Reading Pacer, Keystone View Company; the Rateo-
meter, Audio-Visual Research; the Shadowscope, Lafayette
Instrument Company. These devices are used to develop rapid

reading and skimming skills after a sound fundamental read
ing skill has been established. (38, p. 1)
The Controlled Reader, the latest development in the
reading-instrument field, was designed by Stanford E. Taylor
beginning in 1947. The first pre-release models of the
device were tested for effectiveness at the Washington
Square Reading Center in New York City and in its public and
private school branches during 1952 and 1953. This device,
a 35mm filmstrip projector equipped with a left-to-right
scanning mechanism, has a speed range from 60 to 1,000 words
per minute allowing speeds appropriate to any level of
instruction, from pre-reading through the adult level. At
present the Controlled Reader is being used in thousands of
classrooms as well as in hundreds of reading clinics. (38,
p. 1-5)
A slow-speed Controlled Reader, known as the Skill-
Builder Controlled Reader, was recently developed by the
Educational Developmental Laboratories, Inc., Huntington,
New York, especially for use in business education class
rooms. The Skill-Builder Controlled Reader operates auto
matically at speeds from 12 to 108 words per minute, which
gives the business teacher an opportunity to pace ski11-
building materials at speeds which allow time for student
23
reaction to the reading stimulus. Filmstrip programs have
been developed and released for instruction in the areas of
typewriting, shorthand, and business mathematics as well as
for instruction in the use of the ten-key adding machine.
The Controlled Reader seems to satisfy the pedagogical
requirements for an effective reading instrument and skill-
building device and fulfill the physical requirements for
use in the classroom. While a great deal of experimentation
should and will be undertaken before the total scope can be
appreciated and applied to classroom procedures, a number of
significant studies with controlled reading devices have
already been conducted in the fields of reading improvement
and business education.
Experimentation with Controlled Reading Devicesin the Field of Reading Improvement
The Metronoscope
One of the first experiments with the Metronoscope was
reported by Taylor (37, p. 214-233), the inventor of the
machine. In a study designed to determine whether con
trolled reading with the Metronoscope is more effective in
establishing efficient reading habits than a corrective
method which depends principally on verbal instruction and
24
whether the improvement brought about by training is perma
nent, Taylor set up experimental and control groups, each
group consisting of twenty-five high school students
selected from the tenth and eleventh grades. Bach group was
given practice in rapid reading during thirty-minute prac
tice periods on ten consecutive school days. The control
group read short stories from mimeographed sheets while the
experimental group read the same material from the Metrono
scope. Bye-movement photographs of 148 words administered
before and after training showed that the reduction in num
ber of fixations and in regressive movements was greater for
the experimental group than for the control group, that
these improvements were relatively permanent, and that both
groups showed a slight loss in comprehension. In Taylor's
own wordsj
The experimental group averaged fewer fixationsand regressions per 148 words than the controlgroup, presumably as a result of controlled
reading. The increase of speed in silent reading is also greater for the experimental group,and the loss in comprehension--shown for bothgroups and apparently due to reading toorapidly—is smaller. (37, p. 219)
Taylor also observed:
The findings in this study also indicate thatthe willingness of the pupil to follow verbalinstructions is not effective in breaking downold habits and establishing new ones. The
25
response of the subjects in the experimentalgroup, however, to a reading situation inwhich they were compelled to practice newhabits of attack on print is evidence thatcorrective training of this type tends tocondition rapid, effective reading. (37,p. 233)
Witty and Kopel (45, p. 138-139) took exception to the
implications and conclusions contained in Taylor's study.
In a critical analysis of the findings of the study, they
pointed out:
Changes in eye movements, as in all othermechanics of reading, are significant to theextent that they modify comprehension andspeed. At this point the study must haveproved a tremendous disappointment to theinvestigator, for the experimental group didnot show significant gains in these respects.The average of the comprehension scores ofthe experimental group was 83.33 beforetraining; after training, it was 82. Forthe control group the initial and final comprehension scores averaged 86.33 and 84.66.Thus the losses for the two groups were 1.33and 1.67 points. The difference in theselosses is clearly not great or significant.At the end of the experiment the differencesin scores for time in reading are similarlyinsignificant. On the initial test theexperimental groups required an average timeof 31.65 seconds for reading 148 words, while22.16 seconds were used in the final test.
The control group averaged 33.84 and 24.24seconds in the initial and final tests. The
gains computed from these averages are 9.49and 9.6 seconds, respectively. Significancecould scarcely be attributed to this smalldifference. One must conclude that con
trolled (metronoscope) reading may effect

26
changes in the mechanical process which are notco-ordinated with and apparently do not influence the process of meaningful reading. (45,p. 139)
Center and Persons (8, p. 118-123) also began experi
menting with the Metronoscope soon after this instrument
became available. Eight pupils having the lowest comprehen
sion scores and approximately the same speed of reading were
selected from a group of the very poorest readers in the
Reading School of the Theodore Roosevelt High School in
New York City to test the effectiveness of the diagnosis
with the Ophthalmograph and corrective work with the Metron
oscope. These pupils were given eight metronoscopic train
ing periods of twenty-five minutes duration each, or two
sessions per week for a month. The aim of the remedial work
was to increase the pupils' comprehension, develop rhythmi
cal reading, reduce the number of regressions, and increase
speed by reducing the number as well as the duration of fix
ations. The rate of reading was gradually increased from
180 words per minute during the first period to 280 words
per minute during the final periods. Comprehension tests
were given after each period of silent reading, and the
pupils were informed of their progress. Eye-movement photo
graphs taken with the Ophthalmograph before and after

27
training showed a reduction in the number of regressions and
fixations and a consequent increase in the span of recogni
tion. Comprehension test scores showed definite gains at
the end of the training period. There was no control group
in this study.
In their Dartmouth College Study of visual factors in
reading, Imus, Rothney, and Bear (20, p. 1-144) reported the
use of the Metronoscope in an attempt to correct the reading
habits of selected numbers of the class of 1940 who re
gressed frequently and to help some types of plodding read
ers. They stated that the Metronoscope proved to be an
interesting and stimulating variation in procedure, but they
reported no specific results based on this kind of training
alone.
Reading Films
In an experiment designed to determine the relative
effect of three methods of training upon eye movements and
reading rate, Glock (18, p. 93-106) selected at random six
groups of remedial readers from the State University of Iowa
during the first semester of 1947-1948. One group of sub
jects utilized controlled reading practice techniques that
employed the Harvard Films for Reading Improvement; another

group used a reading film developed by the experimenter; the
third group relied on mechanically uncontrolled reading from
the printed page under a verbal set to strive always to read
as fast as was consistent with comprehension. Glock found
that all groups improved eye movements substantially, in
cluding a reduction in the number of fixations and regres
sions and an increase in the span of recognition. There was
also a significant over-all reduction in the average dura
tion of fixations. Rate of comprehension, as measured by
various reading tests, showed significant over-all improve
ment for all three methods of training. Glock contends:
Large gains in rate have usually resulted whenever subjects have been given an instructionalset to improve their speed. Motivation appearsto have been a prime factor. Perhaps the various mechanical devices have proved to be effective, in part, because of their novelty and because of the subject's confidence in their use.The controlling aids tend to point up the problem for the subject and to set up specificgoals. (18, p. 93)
Dearborn and Wilking (11, p. 668-678) also experimented
with the Harvard Reading Films, one of several techniques
used to improve the reading of college freshmen. Gains were
measured by means of a number of reading tests. The results
indicated that the remedial groups profited significantly
from the remedial sessions.

29
The Reading-Rate Controller
In a study conducted in 1953 to determine the effects
of the Reading-Rate Controller on the students' reading
ability, Wedeen (42, p. 121-123) separated ISO Brooklyn
College freshmen into three equivalent groups. Group A was
given training in reading by means of the Reading-Rate Con
troller. Group B was given training without any mechanical
device. Motivation was induced by means of a stop watch.
Group C was the control group and received no training.
Groups A and B used the same reading materials and trained
in the same room for two 50-minute periods a week for five
weeks. The results showed that both the mechanistic group
and the non-mechanistic group produced genuine gains in
reading rate and comprehension and general reading ability;
both groups were superior to the control group. The
Reading-Rate Controller group, however, produced greater
improvement only in rate.
Wooster (46, p. 421-426) reported in 19S4 an investi
gation designed to determine the possible value of supple
mentary training on the Reading-Rate Controller in conjunc
tion with a college course in effective study. Two groups
of six students each were selected from an upper-division
psychology course; the remaining 48 students in the course
30
comprised the control group. Experimental Group A received
345 minutes of training on the Reading-Rate Controller in
11 one-half hour sessions and one 15-minute session. Exper
imental Group B received 315 minutes of training in 10 one-
half hour sessions and one 15-minute session. The control
group took the effective study course, but it had no supple
mentary training on the Reading-Rate Controller. Comparable
pre-training and post-training scores on rate and comprehen
sion were obtained by using two parallel reading tests. The
results showed no statistical significance among the three
groups with regard to rate and comprehension. Wooster con
cluded:
In this case, no extra benefits seemed to accruefrom additional training on the reading-rate controller, as used. The study sheds some light onthe possible value of using such a device in connection with a course where reading is treated asonly one of several topics. Further investigation is needed, however, concerning the practicalusefulness of these machines and the comparativeeffectiveness of different approaches to the problem of improving reading skills. (46, p. 425-426)
The Controlled Reader
Several public schools have used the Controlled Reader
as part of the regular reading program and have tried to
evaluate the results in a somewhat informal way using tech
niques that are not highly statistical. For example,
31
in 1954, Kilthau (22, p. 60-62) described a fourth-grade
reading program at the Powell Avenue School, Bethpage,
New York. In that program, forty-five minutes a day were
allotted to controlled reading; the time was divided equally
among three reading groups. Kilthau reported that, at the
end of the training period, the children were reading more
rapidly and that, by their general understanding of stories
and their answers to questions, they showed they had better
comprehension of what they were reading. In 1957, Anderson
(2, p. 172-177) reported the use of the Controlled Reader in
a reading program initiated at the seventh-grade level at
the Lufkin Junior High School, Lufkin, Texas, designed to be
helpful to the poor reader, the average reader, and the
accelerated reader. All students received Controlled Reader
training three times weekly for a period of forty minutes
for the entire school year. The results of the study showed
that, at the end of the program, most of the students had
increased their reading speed and rate of comprehension.
Anderson summarized the findings of the study as follows:
Because of the unparalleled motivation of thistype of instrument instruction, the studentsdevelop: (a) confidence in their ability tosucceed; (b) longer span of attention; (c) ability to concentrate for longer periods of time;
32
(d) capacity for working under pressure; and(e) more positive attitude toward reading.(2, p. 176)
The Centinela Valley (California) Union High School District
reported the use of a Controlled Reader, one of several
devices used in the school system's reading improvement pro
gram initiated in 1959. The Controlled Reader was used
daily as a way of increasing rate and comprehension as well
as improving concentration and attention. Pre-training and
post-training scores obtained from a standardized reading
test showed an appreciable improvement in rate, comprehen
sion, and other reading factors. (14, p. 1-3)
In 1959, Kemp (21, p. 474-475) reported a private
school experiment the purpose of which was to determine the
effects of Controlled Reader training when used as an inte
gral part of a remedial and a speed improvement program.
Twenty-four teen-age students were placed in two groups.
Group A was made up of students deficient in both rate and
comprehension. Group B was comprised of students who defi
nitely needed to increase their reading speed and who showed
little or no deficiency in comprehension. Each group re
ceived thirty-two hours of Controlled Reader training over a
period of six weeks. In Group A, the remedial group, the
rate of presentation was strictly adjusted to the average

comprehension of the group, and small increases in rate were
made only when comprehension was considerably above average.
In Group B, the speed-reading group, the rate of presenta
tion of the Controlled Reader was increased as rapidly as
the level of comprehension permitted; and, during the last
few sessions, the rate was adjusted to exceed the capabili
ties of the group. Data were obtained on standardized read
ing tests before and after training. Kemp found that marked
increases in both rate and comprehension were achieved in
both groups and that, proportionately, the remedial group
made a greater increase in comprehension than in rate.
There was no control group in this study.
Opinions of Reading Specialists
Against this background of experimentation with con
trolled reading devices in the field of reading improvement,
a number of reading specialists voice a cautious estimate
concerning the usefulness of mechanical devices in increas
ing the rate of reading comprehension. In a summarization
of opinion and research regarding the value of controlled
reading techniques, Traxler stated:
The results of the research studies that have
been conducted thus far do not provide clear-cut evidence either favorable or unfavorable
to controlled reading. The experimental

34
procedure and the conclusions of a considerable
proportion of the limited number of availablestudies would not meet the criteria of an acceptable statistical study. Notwithstanding thelimitations in the data as a whole, however, itappears that the findings are somewhat morefavorable to the value of controlled readingtechniques than is the sum total of the opinionof experts in the field of reading. Most of thestudies do suggest that considerable improvementis made under teaching procedures employing controlled reading. There are, however, two limitations which greatly interfere with definite conclusions in this regard. One limitation is thatinformation concerning the permanence of thegains in test scores brought about by the controlled reading is almost non-existent. Theother limitation is that . . . controlled read
ing has usually been only one of a number oftechniques employed and it is almost impossibleto say just what procedures have been responsible for the improvement shown by the subject.(40, p. 288-289)
The situation with respect to the evaluation of the
relative effectiveness of different methods and mechanical
devices in teaching reading has been characterized by Strang
in the following words:
In most of the experiments a combination ofmethods has been used so that the improvementresulting cannot be attributed to any onemechanical device. When mechanical devices
are used with high-school and college studentsthere may be some danger of disorganization of
the effective habits which they already havebuilt. There is also the tendency to directattention from the thought to the mechanicsand to decrease rather than increase those
most important characteristics of goodreaders—flexibility and adaptability. The
35
conceptual as well as the perceptual factorsinvolved in increasing one's span of recognition must be recognized. (36, p. 184-185)
Anderson and Dearborn point out that the evidence that
eye-movement training devices accomplish their purpose is
far from reassuring. They stated:
These and similar devices have been used exten
sively in schools and clinics throughout thecountry. According to one report, over threehundred colleges and universities employ thesemethods in remedial work with their own stu
dents. Unfortunately, research has not conclusively demonstrated that any lasting benefitis derived from eye-movement training as such.The whole approach requires re-examination.(1, p. 131)
Sheldon maintains that the value of mechanical devices
in a reading improvement program appears to reside in the
novel effects they present. He explained his stand as
follows:
Teachers have been concerned about the useful
ness of mechanical devices in increasing therate of reading comprehension. The researchnow available indicates that only slight ifany improvement is brought about by use ofvarious instruments .... The question ofwhy mechanical devices do not facilitatereading comprehension is related to thereader's thought processes and purpose forreading. The most elementary of readingtexts emphasizes the need to develop conceptsand background in order for students to understand fully what they read. It is not yetwithin the scope of various mechanical deviceswe have examined to meet these needs. At

36
present the reading rate controller, tachisto-scopes, metronoscopes, and similar instrumentsare unable to achieve this end. (32, p„ 52-53)
During the last two decades, then, many experiments
have been carried out to determine the relative efficiency
of different techniques of teaching reading with a variety
of controlled reading devices. Unfortunately, the evidence
available does not show conclusively which of the controlled
reading techniques in current use is the best* The data in
the foregoing studies, as well as the opinions of various
reading specialists, suggest that controlled reading tech
niques designed to improve reading rate and comprehension
should have the benefit of a more extensive, detailed, and
rigidly controlled experimental study than has been made in
this area.
Experimentation with Controlled Reading Devicesin the Field of Business Education
Although controlled reading-instrument training of one
type or another has been used for a number of years, the
average business educator has little or no idea of its
adaptability to specific teaching situations. This situa
tion is due primarily to the fact that, until recently, the
use of such mechanical devices was confined largely to the

37
area of reading improvement. After World War II, controlled
reading techniques expanded rapidly into other educational
areas. It was not until 1949, however, that the first
experimental study with a reading instrument was conducted
in the field of business education.
Tachistoscopic Studies in Typewriting
In 1949, Winger (43, p. 1-166) set up an experiment for
beginning typewriting students at Oregon State College.
Forty students comprised the experimental group and a like
number, the control group. Each group used the same mate
rial in the textbook each day during the experiment. The
only difference in procedure between the two groups was the
presentation of tachistoscopic drill materials in the exper
imental group for about ten minutes a day, five days a week,
for ten weeks. The results of the experiment as determined
by the last five-minute writing showed a statistically sig
nificant difference of the experimental group over the con
trol group in stroking rate and accuracy. Winger also
observed that tachistoscopic training was conducive to
relaxed stroking, developed pronounced pattern stroking,
increased student motivation, and developed certain desir
able techniques of operation.

38
Two years after Winger's study was conducted on the
college level, Palmer (30, p» 1-94) undertook a similar
experiment on the secondary level utilizing the beginning
typewriting classes of Klamath Union High School,
Klamath Falls, Oregon. From a population of 280 students5
61 students were selected at random for the experimental
group, and 63 students were selected for the control group.
Tachistoscopic training was started one month after the
beginning of school and was used for ten minutes each day in
the experimental group. At the end of the experiment, the
tachistoscopically trained students showed a superiority in
rapid and accurate stroking on straight-copy timings, let
ters, and number exercises. Follow-up measurements on
straight-copy and letter timings two months after tachisto
scopic training was concluded indicated that the gains in
speed and accuracy of the experimental group were of a per
manent nature.
Tachistoscopic Study in Shorthand
In a study to determine the effectiveness of tachisto
scopic training in elementary shorthand, Barber (3,
p. 1-103) set up experimental and control groups selected
from the classes at Oregon State College during the fall,

39
winter, and spring quarters of 1957-1958, 1958-1959, and
1959-1960. The only difference in the teaching procedures
between the experimental and control classes was that the
experimental groups received tachistoscopic training each
day while the control groups were given chalkboard drills
on the same material. The results of the study showed that,
on all measures involving reading and transcription rates of
shorthand outlines, the experimental groups far surpassed
the control groups. On all measures involving accuracy of
transcription, however, the control groups were far more
accurate than the experimental groups.
The Skill-Builder Controlled Reader in the Classroom
Several efforts have been made to determine the value
of reading-instrument training in typewriting and shorthand
in a somewhat informal way using techniques that were not
highly statistical. For example, Bell and Batchelor (5,
p. 3) reported the use of the Timex tachistoscope and the
Skill-Builder Controlled Reader in five classes in elemen
tary shorthand and typewriting in the School of Commerce at
New York University. Special drills correlated with the
shorthand and typewriting textbooks were prepared for use
with the Timex and the Skill-Builder Controlled Reader and

40
were used each day to supplement the usual class instruc
tion. The instructors found that their students profited
greatly from the use of these mechanical devices. Fedorczyk
(15, p. 82-85) reported the use of the Skill-Builder
Controlled Reader in a beginning typewriting class at the
Edwin 0. Smith School, teacher-training secondary school of
the University of Connecticut, during the summer of 1960.
Thirty-two students, ranging from thirteen to fifty-six
years of age, were grouped in the classroom according to
their skill levels as determined by teacher observation of
student techniques, the results of one-minute timed writ
ings, and the results of graded instrument runs. Because of
the heterogeneity of the class, it was necessary to have
four groups. All groups had daily practice with the Skill-
Builder Controlled Reader which was paced at speeds equal
to and slightly above their level of ability. At the end of
six weeks of instruction, the pupils' speeds ranged from
17 to 63 gross words per minute, with three or fewer stroke
errors on one-minute timed writings. Fedorczyk observed
that instrument training in beginning typewriting helps the
student develop speed, as well as correct eye movements, and
allows the teacher to observe techniques and analyze student
difficulties. Denny (12, p. 1-3) described an intensive

41
program of shorthand instruction using the Skill-Builder
Controlled Reader at Chico State College, Chico, California,
during the 1961 spring semester. Much of the success of
this program was attributed to increased motivation devel
oped by regular instrument-training sessions. The Skill-
Builder Controlled Reader has also received enthusiastic
support from the typewriting and shorthand instructors at
Newton High School, Newtonville, Massachusetts (35, p. 1-7);
it is also being successfully employed in a business educa
tion team-teaching program at Cupertino High School in
Sunnyville, California (39, p. 1-6).
Kline's Study
The only controlled statistical study thus far made in
determining the effectiveness of the Ski11-Builder Con
trolled Reader as an instructional device in a business
education subject was conducted by Kline (23, p. 1-193)
during 1960-1961 in beginning typewriting. The experi
mental group consisted of 35 students selected from two
classes taught by the same teacher. The control group con
sisted of an equal number of students chosen from eleven
classes in five different schools taught by six different
teachers. All subjects in the experiment were selected from
42
secondary schools located in Springfield City (Ohio) and
Clark County (Ohio). Beginning with the twenty-first regu
lar class session, the experimental classes worked with the
Skill-Builder Controlled Reader for about ten minutes each
class period. At the end of the first semester, one experi
mental class discontinued training with the Skill-Builder
Controlled Reader, and the other experimental class con
tinued training to the end of the second semester. The
results showed that at the end of the first and second
semesters, the differences in speed and accuracy between the
experimental and the control groups, as measured by a three-
minute straight-copy test at the end of the first semester
and a five-minute straight-copy test at the end of the sec
ond semester, were found to be significant at the 1 per cent
level. The differences between the experimental class which
continued with the instrument training and the one which
dropped it were found to be insignificant. On the basis of
the data in this study, Kline concluded that the Skill-
Builder Controlled Reader is an effective speed-forcing and
control-building device and that it can be used effectively
in conjunction with regular textbook materials and classroom
procedures in the teaching of elementary typewriting.

43
The data in the foregoing studies suggest that con
trolled reading devices can be used most effectively in
developing and solidifying basic skills in the field of
business education. The evidence seems to justify further
investigation and experimentation with controlled reading
devices in typewriting and other skill-building areas.
Reading for Typewriting
Very little research has been conducted in the area of
reading and its significance as a factor in one*s ability to
reproduce copy on the typewriter. However, it has been dis
covered that different types of eye movements may be re
quired in typewriting from those used in reading history or
literature.
In 1932, Butsch (7, p. 104-121) conducted an experiment
in the educational laboratory at the University of Chicago
the purpose of which was to determine the way in which the
eye follows the copy while one is typewriting and, espe
cially, to measure the distance which the eye keeps ahead of
the hands in writing at various speeds. Butsch referred to
this interval as the "eye-hand span." Use was made of an
apparatus for photographing eye movements with an attachment
for synchronizing the action of the typewriter with the film

44
record. His procedure was the same as in the experiments in
which eye movements in reading were photographed, except
that, instead of merely reading silently or orally, the
19 subjects reproduced the material in the copy on the type
writer.
From the film-record plottings made for each subject,
Butsch noted that, in general, rapid writers require fewer
fixations per line than do slower writers and that the eye-
hand span for rapid writers was longer. He reported that,
when reading copy for typewriting, the subjects made many
more fixations per line, and longer fixations, than they did
in ordinary reading. Moreover, the average length of eye-
hand span varies for individual writers from 3.24 spaces to
7.60 spaces. On the average the eye keeps about one second
ahead of the hand regardless of the speed of writing. In
general, among all but the most rapid writers, the tendency
is to keep one word ahead of the hand; when the eye was
found to be more than one word ahead of the hand, it was
usually on words making a phrase conveying a unit of thought.
The results indicated that, while most typists are capable
of a longer eye-hand span, the tendency was for the eye to
keep just far enough ahead to provide copy for the hand as
it is needed.

45
Dvorak, Merrick, Dealey, and Ford (13, p. 181-182) re
ported in 1936, after several years of extensive research of
typewriting behavior, that certain determining letters con
tribute essential signals, especially the first letter of a
word and any consonants rising above the main line of print,
such as 1, t, f, and d, and the ones extending below the
line, such as £, j/, and 3. They pointed out that a few such
signs from the first half of the word and the upper halves
of the letters should be sufficient signals to enable the
typist to type the word. A word is apparently caught from
such cues in its familiar outline, and the typist fills in
from his own personal visual or speech patterns. The in
vestigators also reported that the hard spot is at the cen
ter of a word or immediately at the right of the center.
They attributed practically all reading errors in type
writing—such as omissions, additions, and substitutions of
words--to lack of proper attention to copy.
In 1943, Fuller (16, p. 19-21) conducted one of the
most complete studies yet made of the general nature of the
reading process as applied to typewriting. In this study,
100 subjects were photographed with an eye-movement camera
while typewriting ten lines of copy and while reading seven
lines of ordinary reading material. In addition to
46
photographing the subjects' eye movements, they were given a
fifteen-minute typewriting test and the Traxler Reading
Test, Fuller found that the rate for ordinary reading was
about 5.7 times the reading rate for typewriting, that an
average of 1.1 words are absorbed in a glance in ordinary
reading but only .32 words in reading for typewriting, and
that the mean time spent on each pause in typewriting was
.47 of a second as compared to .30 of a second for ordinary
reading. Since the data indicate that reading for type
writing requires only a very small span of recognition and
slow rate of reading, Fuller suggested that even the poorest
reader has a sufficiently large span of recognition to meet
the demands of reading for typewriting.
Fuller stated that the term "perception" seems to be a
more inclusive word than "reading" to describe the process
of absorbing characters in print or writing for the purpose
of reproducing these characters on the typewriter. Repro
duction of symbols, rather than the comprehension required
in ordinary reading, relegates the comprehension factor to
a minor role in reading for typewriting. While ordinary
silent reading seems to take place by word-wholes and frag
mentary signals at a comparatively fast rate of speed, it
47
would appear that detailed word-recognition patterns are the
basic reading patterns for typewriting.
As a result of his study, Fuller was able to make the
following recommendation relative to effective reading for
typewriting:
The pupil must be able to move his eyes effectively across the copy. Close attention shouldbe given to the details of the copy. Sufficient attention should be given to meanings orword-wholes so that the proper word is typed,and the words that belong together are in correct order. Slow and careful reading is possible because of the generous time element inreading for typewriting, and should be required.Mind wandering is the worst enemy of properreading for typewriting. Careful and systematic observation and study of words in a consistent left-to-right direction will defeat anytendency to reading errors in typewriting.(17, p. 11)
Summary
Eye-camera records have revealed that good readers on
normal reading copy, at any age or grade level, make fewer
fixations and regressions per line and take less time per
fixation than poor readers. These differences between the
eye movements of good and poor readers suggest the possibil
ity of improving the functional efficiency of the individual
in reaction to print by training the poor reader to emulate
the eye movements of the good reader. To this end, a number

48
of mechanically controlled devices have been developed,
including the Metronoscope, the Harvard Reading Films, and
the Controlled Reader.
Many experiments have been carried out to determine the
relative efficiency of different techniques of teaching
reading with a variety of controlled reading devices. The
results of these experiments have indicated, in general,
that mechanically controlled forms of training are effective
in increasing speed of reading without decreasing comprehen
sion if training is undertaken with determination and per
sistence. A number of reading specialists, however, have
questioned the usefulness of mechanical devices in increas
ing the rate of reading comprehension.
Although controlled reading-instrument training is
still in its infancy in the field of business education,
there is some evidence available that suggests that mechani
cally controlled forms of training will improve basic skills
in the initial stages of typewriting.
Studies of the reading factors in typewriting have in
dicated that the signals or stimuli in the copy are per
ceived but possibly not comprehended. It has been suggested
that reading errors in typewriting can be attributed to mind
wandering and lack of proper attention to copy.

49
Chapter III will deal with the procedures used in con
ducting this study.

50
CHAPTER III
PERSONNEL, MATERIALS, AND PROCEDURES
Introduction
The personnel, materials, and procedures of the study
will be described in the following sections of this chapter:
(1) formation of the classes, (2) materials and equipment,
(3) controlled reading-rate practice techniques, and
(4) evaluation procedures.
Formation of the Classes
Setting
This experiment was conducted in the writer's second-
quarter typewriting classes in the Secretarial Science
Department of Oregon State University during the winter
quarter and repeated during the spring quarter of the school
year 1960-1961. These classes met five times each week for
a fifty-minute period each day and represented a training
period of approximately ten weeks. The writer was in charge
of all the classes used in this experiment.

51
Personnel
Any student on the Oregon State University campus who
had completed the first-quarter typewriting course, or who
had a working knowledge of the typewriter with skill devel
opment to approximate one semester of typewriting or more,
was eligible to enroll for one of these second-quarter type
writing classes. The students who usually enroll in these
classes during the winter and spring quarters are majors in
departments other than Secretarial Science. Students major
ing in this department are usually incoming freshmen with
prior typewriting instruction at the secondary level who
enroll in the second-quarter typewriting course during the
fall quarter of each school year. The majority of persons
enrolled in the second-quarter courses during the winter and
spring quarters, then, are there to secure additional type
writing instruction to enable them to use the typewriter in
the preparation of materials for other classes or for future
personal-use values.
Table I on page 52 illustrates the wide distribution by
schools of the students participating in the experiment.
These enrollment totals make evident the fact that the
second-quarter typewriting course during the winter and
spring quarters should attempt to develop the student's

TABLE I
DISTRIBUTION BY SCHOOLS OF STUDENTS PARTICIPATING
IN CONTROLLED READING TYPEWRITING EXPERIMENT
52
Exp. I Exp. II
(Winter Q. 60-61) (Spring Q. 60-61)
COMB.
SCHOOL CON. EXP. TOT. CON. EXP. TOT. TOT.
Agriculture 2 0 2 0 0 0 2
Business and
Technology
Non S.S.* 3 4 7 0 1 1 8
O • O • 4 3 7 2 2 4 11
Education 3 6 9 5 2 7 16
Graduate 2 0 2 0 0 0 2
Home Economics 1 2 3 2 4 6 9
Lower Division 9 7 16 2 6 8 24
Science 2 2 4 1 0 1 5
TOTALS 26 24 50 12 15 27 77
*S.S. represents Secretarial Science majors.

53
maximum potential in speed and accuracy on straight-copy and
production-copy material in order to fulfill the objectives
of the majority of the students.
Table II on page 54 shows the breakdown by classes of
the students participating in the experiment. Seventy-one
of the seventy-seven students participating in the experi
ment, or 92.2 per cent of the total enrollment during the
winter and spring quarters of the school year 1960-1961,
were either freshmen or sophomore students. These totals
seem to indicate that the majority of students enrolled in
second-quarter typewriting during the winter and spring
quarters are there to secure a higher degree of operating
skill which can be transferred to immediate or future
personal-use tasks.
Random Sample Procedure
All students participating in the experiment were
selected at random. For each quarter, students enrolling in
second-quarter typewriting were assigned during registration
to one of two classes by the coin-selection method; viz., a
coin was flipped for each case upon a predetermined code,
such as all "heads" being placed in an experimental class,
and all "tails" being placed in a control class. Thus, each
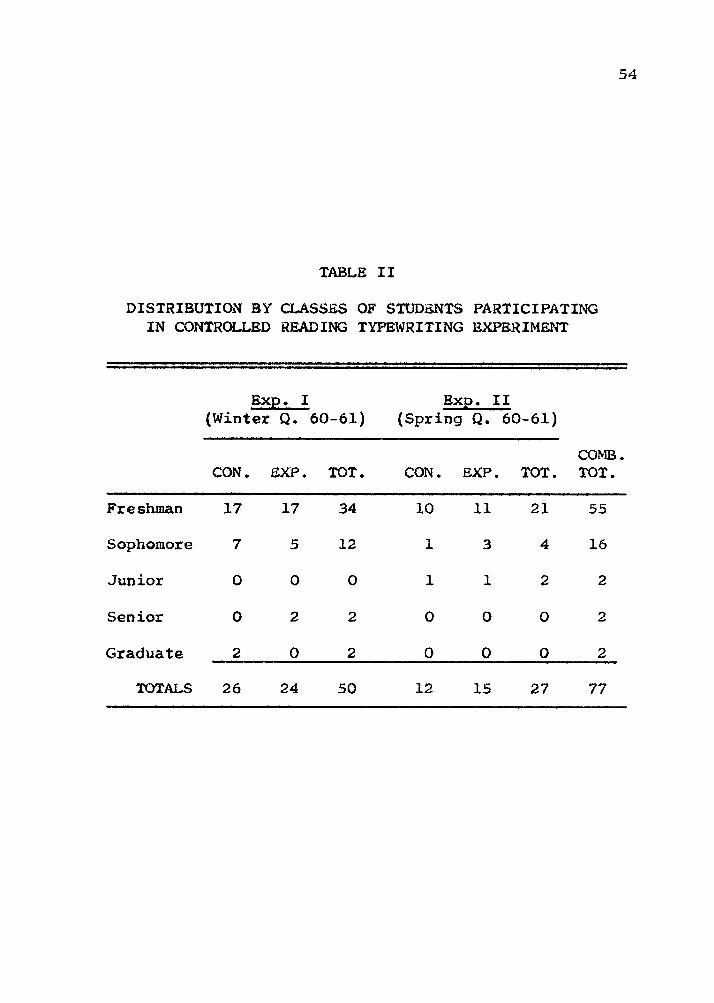
TABLE II
DISTRIBUTION BY CLASSES OF STUDENTS PARTICIPATING
IN CONTROLLED READING TYPEWRITING EXPERIMENT
54
Exp. I
(Winter Q. 60-61)Exp. II
(Spring Q. 60-61)
CON. EXP. TOT. CON. EXP. TOT.
COMB.
TOT.
Freshman 17 17 34 10 11 21 55
Sophomore 7 5 12 1 3 4 16
Junior 0 0 0 1 1 2 2
Senior 0 0
Graduate 0 0
TOTALS 26 24 50 12 15 27 77
55
student registering for second-quarter typewriting during
the winter and spring quarters of the school year 1960-1961
had an equal chance with every other student of being in
cluded in an experimental or a control class. Students reg
istering in an experimental or a control class did so with
out any previous knowledge as to which section would be the
experimental class or which would be the control class. In
the event a student was unable to arrange his schedule to
fit this pattern, he was placed in the class he desired and
was not counted as part of the experiment.
Assignment of Experimental and Control Classes
For the winter-quarter experiment, a flip of a coin
determined which class was to be the experimental class and
which was to be the control class. The nine o*cloek class
was declared the control group and the two o'clock class,
the experimental group. This assignment of classes was just
reversed during the second experiment, spring quarter, in
order to avoid any advantage that one group might have over
the other group due to the hour of the day. Hence, during
the spring-quarter experiment, the ten o'clock class was
declared the experimental group and the three o'clock class,
the control group.
56
Materials and Equipment
Textbooks
The basic textbook used in both the control and experi
mental classes was Gregg Typewriting for Colleges by Lloyd,
Rowe, and Winger (28, p. i-218). Supplementary texts used
by each group during the experiment were Workbook I for
Gregg Typewriting for Colleges by Lloyd, Rowe, and Winger
(29, p. 1-96), and Tailored Timings by Winger (44, p. 1-48).
Each group used the same textbook and supplementary material
from day to day.
Skill-Builder Controlled Reader
The Skill-Builder Controlled Reader is a 35mm filmstrip
projector with an automatic speed variation from 2 to 18
lines per minute, or 12 to 108 typewriting words per minute,
with a speed increase of 6 words per minute with each turn
of the speed control dial. The Skill-Builder Controlled
Reader presents typewriting copy in a continuous, smooth,
left-to-right motion; it has a moving slot which covers and
uncovers print as it moves across each line. Projection may
also be set in an open slot motion which exposes an entire
line of print at one time. This instrument was developed by
the Educational Developmental Laboratories.

57
Filmstrip Set
All filmstrip copy used in the experiment was selected
from Educational Developmental Laboratories' Typing-Ski11
Development Course, a 25-filmstrip, 75-lesson course. Every
line of copy on a filmstrip has an equal number of letters
and spaces--30 strokes per frame—to allow for accurate
speed control. The filmstrips of the set were packaged in
transparent plastic containers for accurate selection and
were organized in an album for convenient use and storage.
Filmstrip selections used in the experiment are shown in
Appendix A.
The Screen
A matte-white or flat, smooth-surfaced screen ten feet
square was used as a projection surface. This type of
screen makes it possible to have nearly equal light distri
bution and no distortion regardless of the angle or section
of the room from which viewed.
The Classroom
The same classroom was used by both the control and the
experimental classes during the experiment. This room con
tained sufficient desks and typewriters to accommodate

58
36 students. Due to a small amount of glare on the projec
tion surface under normal classroom lighting conditions,
window shades near the screen were pulled during instrument-
training sessions and classroom lights near the projection
surface were turned off. These precautionary steps insured
enough darkness to make the print clearly visible at all
points in the classroom; at no time, however, was the class
room completely darkened. The Skill-Builder Controlled
Reader was placed in the middle of the room approximately
15 to 20 feet from the projection surface--this positioning
of the instrument provided for easy readability of projected
material.
Typewriters
All students participating in the experiment used elec
tric typewriters of the following makes: IBM, Underwood,
Remington Rand, Royal, and Smith-Corona.
Controlled Reading-Rate Practice Techniques
Experimental Factor
Both the control and the experimental classes used the
same textbooks and supplementary materials as well as the
same typewriters and classroom facilities from day to day.
59
The writer administered identical assignments in all classes
in the same way. The onl^ difference in the conventional
teaching procedure was the presentation of approximately ten
minutes of controlled reader materials to the experimental
group on Mondays, Wednesdays, and Fridays from the third
week through the ninth week of each quarter. On instrument-
training days, the control group was provided with dupli
cated sheets containing the same filmstrip copy used by the
experimental group. The control group typed from this copy
for ten minutes under a verbal set to strive always to type
as fast as was consistent with accuracy. A conscious effort
was made to avoid any show of bias in the method of handling
the control and experimental classes. At no time during the
experiment was any reference made to the superiority of one
group over the other on any phase of skill development being
measured.
Grouping
Since individual abilities in second-quarter type
writing may range from 30 gross words per minute, or lower,
to 70 gross words per minute, or higher, it was not con
sidered feasible to provide all experimental students with
a single instrument presentation during any given training
60
session. Therefore, three groups were established in each
experimental class based upon the results of five-minute
timed writings obtained and evaluated during the second week
of each quarter.
Group I, the fast group, included students with a
beginning straight-copy stroking rate of 50 gross words per
minute or higher. Eight students in the experimental group
were placed in Group I during the winter-quarter experiment
and seven students during the spring-quarter experiment, for
a combined total of fifteen students. Group II, the middle
group, included students with a beginning straight-copy
stroking rate ranging from 35 gross words per minute to
49 gross words per minute. Ten students in the experimental
group were placed in Group II during the winter-quarter
experiment and six students during the spring-quarter
experiment, for a combined total of sixteen students.
Group III, the slow group, included students with a begin
ning straight-copy stroking rate of below 35 gross words per
minute. Six students in the experimental group were placed
in Group III during the winter-quarter experiment and two
students during the spring-quarter experiment, for a com
bined total of eight students.

61
Because this original grouping arrangement was based
upon arbitrary criteria, it was found necessary to change a
few students from one group to another during the experi
ment. All such changes were based upon these individuals'
weekly progress in instrument-training lessons and in con
ventional classroom activities.
On days when instrument training was conducted, two
groups worked from textbook material in the ueual manner
while a third group responded to controlled reader training.
During a thirty-minute session, therefore, each group
received about ten minutes of instrument training on the
same filmstrip material at projection speeds commensurate
with the group's ability. Thus, each student in the experi
mental classes received about one-half hour of instrument
training per week and about three and one-half hours of
instrument training for the entire quarter.
Due to visual, auditory, and other physical considera
tions, it was decided not to place student groups in a sepa
rate section of the classroom for instrument-training
sessions. Each student in the experimental group, then,
remained at his original typing station throughout the
experiment and was kept informed of his group assignment.
62
Projection Speeds
Selected filmstrip exercises from the Typing-Skill
Development Course were projected for each group in the
experimental classes at speeds as shown in Appendix B. A
projection-speed cycle similar to the speed-forcing plan
employed in shorthand dictation was used throughout the
experiment. (24, p. 174-177) The cycle for each group
began at a speed just below or comparable to the students'
skill level} the second and third steps of the cycle repre
sented jumps in speed of six words per minute and twelve
words per minute, respectively; the last projection of the
cycle was returned to a slower speed, six words per minute
above the starting rate of the cycle, to achieve accuracy.
During any given instrument-training session, the same film-
strip exercise was projected as many times as possible
during a ten-minute period for each of the three groups; a
difference of twelve words per minute separated the three
groups on all filmstrip exercises.
The markings on the speed control dial on the Skill-
Builder Controlled Reader indicate lines per minute. Since
all filmstrip exercises contained six typing words per
frame, the exact speed control dial setting was determined
by dividing the proposed projection speed by six. For

63
example, the speed control dial would be set at four for
twenty-four words per minute (twenty-four words per minute
divided by six typing words per frame equals four).
Instrument-Training Procedures
On instrument-training days—every Monday, Wednesday,
and Friday beginning with the third week of the quarter and
extending through the ninth week of the quarter—the first
twenty minutes of the period was generally devoted to
keyboard-review drills, checking workbook assignments,
introducing new units of production work, and conducting
various types of skill-building drills. During the remain
ing thirty minutes of the period, each group used the Skill-
Builder Controlled Reader for ten minutes.
While Group I typed from drill copy projected by the
Skill-Builder Controlled Reader, Group II and Group III
worked on the same textbook assignment. At the end of a
ten-minute period, Group II became the instrument-training
group, Group I began its textbook assignment, and Group III
continued its textbook assignment. Ten minutes later,
Group III used the instrument. Group II returned to its
textbook assignment, and Group I continued its textbook
assignment.
64
This same order of presentation of instrument exercises
to each group was continued for three training sessions. At
the end of one week, or three training sessions, the order
of presentation was changed as follows: Group III received
instrument training first; Group I, second; and Group II,
last. At the end of two weeks, or six training sessions,
the order of presentation was changed once again: Group II
received instrument training first; Group III, second; and
Group I, last. At the beginning of the seventh training
session, all groups were returned to their original order of
presentation. Hence, it was assumed that by periodically
rotating the order of presentation of instrument exercises
to each group, any favoritism that may have been associated
with the time of instrument presentation during training-
session periods would thereby be avoided.
The students set their typewriter margins for a
60-space line during each Skill-Builder Controlled Reader
training session. All filmstrips had been written so that
the students would type two projected frames of copy for
each line of copy on the typing paper. In order to insure
a carriage return at the end of each line of copy on the
typing paper, all filmstrips contained a triangle signal at
the end of every other line of filmstrip copy.

65
As previously stated, the same filmstrip exercises were
projected as many times as possible to each group during a
ten-minute training session. It was necessary, therefore,
for the operator to turn the filmstrip in reverse quickly at
the end of a given exercise by pressing the advancing-
reversing knob on the Skill-Builder Controlled Reader and
rotating it in a clockwise motion to the beginning of the
exercise.
Student instrument-training papers were collected at
the end of each training session. These papers were checked
by the writer in order to keep an accurate record of student
progress. While these papers were not used for the purpose
of determining a course grade, they were nevertheless care
fully evaluated for possible grouping adjustments. It
seemed advisable not to evaluate instrument-training papers
for grading purposes as such but rather to have any skill
which might be developed by the training demonstrate itself
indirectly in the output of the students on the typewriter.
Evaluation Procedures1—mm 1 - i i i i ] m
The measurement of the results of Skill-Builder Con
trolled Reader training in intermediate typewriting instruc
tion as applied to this experiment was pointed toward an

66
emphasis upon the skill development of each individual stu
dent. Periodic measurements were made of the students'
ability to reproduce straight-copy and production-copy mate
rial under timing. As pointed out earlier, the majority of
students enrolled in these classes were interested primarily
in the development of a high degree of operating skill which
could be transferred to immediate or future personal-use
Each student participating in the experiment was evalu
ated by means of thirteen different variations: six
straight-copy variations, six production-copy variations,
and one rate of reading comprehension improvement variation.
For each variation the analysis of variance was used to test
the significance of the difference between the means of the
control and experimental groups. The requirement that the
groups used be random samples is basic to the method of
analysis of variance. (25, p. 54) The condition of ran
domization was met in this experimental study.
Straight-Copy Variations
Commencing with the third week of instruction and
extending through the tenth or last week of instruction,
fifteen five-minute straight-copy writings were scored on
67
the basis of gross words per minute, net words per minute,
and total errors for each student participating in the
experiment. The materials used for the five-minute timings
were taken from selected copies of the Gregg Publishing
Division's Competent Typing Test series and F. E. Winger's
Tailored Timings (44, p. 33-44). No opportunity was pro
vided for practice on these timed writings in advance. The
last five-minute writing of the quarter was the only one of
the fifteen writings used for the purpose of statistical
analysis. This final timed writing was scored for gross
words per minute and total errors--these results constituted
the first two straight-copy variations used in this study.
The third straight-copy variation consisted of the dif
ference between the students' basic rate as determined at
the beginning of the quarter and the average net-words-per-
minute score on the best three five-minute writings during
the quarter. This variation is referred to as "Speed
Improvement A.M
The fourth straight-copy measurement used in this study
consisted of the difference between the students' gross-
words-per-minute score on the first five-minute writing
administered at the beginning of the experiment and the
gross-words-per-minute score obtained from the last
68
five-minute writing at the end of the experiment. This par
ticular variation is referred to as "Speed Improvement B."
The fifth straight-copy variation consisted of the stu
dents' total number of five-minute writings administered
throughout the entire quarter that contained two or fewer
typewriting errors. This measurement is referred to as
"Consistency."
The final straight-copy measurement used in this study
consisted of the average point total obtained from the stu
dents' four seven-minute writings administered during the
last five weeks of the quarter. Each of these timed writ
ings was scored as follows: (1) three points for each line
of copy completed, (2) two additional points for each error
less line of copy completed, (3) two additional points per
line for ten or more consecutive errorless lines of copy,
(4) one additional point per line for five to nine consecu
tive errorless lines of copy, and (5) five points deducted
for each typing error. This unique scoring formula, as well
as the materials used for the timed writings, was developed
by Fred E. Winger, of Oregon State University. This meas
urement is referred to as the "Average Production Drill."
69
Production-Copy Variations
End-of-the-quarter measurements were made on three dif
ferent types of production copy: business letter, tabula
tion problem, and a one-page enumeration. These production-
copy tests were timed for five minutes and were scored on
the basis of production words per minute and total number of
errors. Materials used for these measurements were taken
from the textbook and supplementary drill sources.
Reading Comprehension Variation
Pre-training and post-training reading comprehension
scores were obtained from all students participating in this
experiment to determine the effect of Skill-Builder Con
trolled Reader training on the students' ordinary rate of
reading comprehension. Equivalent forms of the Cooperative
English Test C2: Reading Comprehension (Higher Level),
published by the Educational Testing Service, Los Angeles,
California, were used for this measurement. Form T was
administered to both the control and experimental groups
during the second week of each quarter; Form R, during the
last week of each quarter. The difference between the total
scaled scores on the two forms was used for the purpose of
statistical analysis.

70
Summary
This experiment was conducted in the writer's second-
quarter typewriting classes at Oregon State University dur
ing the winter quarter and repeated during the spring quar
ter of the 1960-1961 school year. Participating in the
experiment were 77 students representing all the major
schools and classes on the campus. The students were
selected at random.
From day to day, both the control and experimental
classes used the same textbooks and supplementary materials
as well as the same electric typewriters and classroom
facilities. The writer administered identical assignments
in all classes in the same way. The only difference in the
conventional teaching procedure was the presentation of
approximately ten minutes of Skill-Builder Controlled Reader
materials to each student in the experimental classes three
days a week for seven weeks. On instrument-training days,
the control classes typed for a period of ten minutes from
duplicated sheets containing the same filmstrip copy used in
the experimental classes. The experimental classes were
divided into three ability groups in order to provide for
the range of individual abilities that existed in the

71
second-quarter typewriting classes, and instrument-training
drills were projected at gradually increasing speeds commen
surate with each group's ability.
Periodic measurements were made of the students' abil
ity to reproduce straight-copy and production-copy material
under timing. Each student participating in the experiment
was evaluated by thirteen different variations. For each
variation the analysis of variance was used to test the sig
nificance of the difference between the means of the control
and experimental groups.
Chapter IV presents the findings of this experimental
study.

72
CHAPTER IV
FINDINGS AND INTERPRETATIONS
Introduction
The statistical treatment of the students' scores on
typewriting tests under timing was handled in two different
ways. The F-test, or variance ratio, was used to measure
the significance of the difference between the means of the
control and experimental groups on thirteen different meas
urements, including a reading comprehension test. To meas
ure the significance of the difference between the speed and
accuracy means of the two groups on initial and final five-
minute straight-copy writings, the t-test was employed.
Tables were constructed to present statistical evidence of
group performance, and figures were prepared to portray the
performance of these groups on five-minute straight-copy
writings.
In addition to the basic statistical methods of analy
sis described above, correlation coefficients were computed
in order to determine the significance of the relationship
between selected word-count systems used in this study.

73
The findings of the study are described in the follow
ing sections of this chapter: (1) speed and accuracy per
formance on straight-copy tests, (2) speed and accuracy per
formance on production-copy tests, (3) reading rate and
comprehension development, and (4) validity of the Gregg
production word-count system.
Speed and Accuracy Performance on Straight-Copy Tests
Initial and Final Status
Gross Stroking Rate. Table III, page 74, shows the
difference between the mean gross words per minute of the
control and experimental groups on initial and final five-
minute straight-copy tests.
On initial test performance, the experimental groups
had higher stroking-rate means than the control groups. In
Experiment I, the control group had a mean stroking rate of
45.65 gross words per minute and the experimental group,
51.13 gross words per minute; in Experiment II, the control
group had a mean stroking rate of 51.83 gross words per min
ute and the experimental group, 53.20 gross words per min
ute. The differences for the two experiments—5.48 and
1.37, respectively—were not statistically significant.

TABLE III
t-TEST FOR DIFFERENCES BETWEEN THE MEAN GROSS WORDS PER MINUTE
OF CONTROL AND EXPERIMENTAL GROUPS ON INITIAL
AND FINAL FIVE-MINUTE STRAIGHT-COPY TESTS
GROUP N
INITIAL TEST FINAL TEST
EXP. MEAN t MEAN t
GWPM S. D. TEST* GWPM S. D. TEST*
I Control 26 45..65 12 .211 .54
55. 46 13 .491.30
Exper. 24 51 .13 12 .44 60..25 11..91
II Control 12 51..83 12..120 .32
57,.50 11 .501.23
Exper. 15 53..20 9 .22 62..80 10 .09
*For Experiment I a t-value of 2.01 is required for significance at the.05 level of confidence and 2.68 for the .01 level. For Experiment IIa t-value of 2.06 is required for significance at the .05 level ofconfidence and 2.79 for the .01 level.

75
At the end of Experiments I and II, experimental-group
testees demonstrated greater terminal stroking-rate ability
than control-group testees. In Experiment I, the control
group had a mean stroking rate of 55.46 gross words per min
ute and the experimental group, 60.25 gross words per min
ute; in Experiment II, the control group had a mean stroking
rate of 57.50 gross words per minute and the experimental
group, 62.80 gross words per minute. Once again the differ
ences for the two experiments—4.79 and 5.30, respectively--
were not statistically significant.
Accuracy. Table IV, page 76, shows the differences
between the mean errors of the control and experimental
groups on initial and final five-minute straight-copy tests.
At the outset of the study in Experiment I, the
experimental-group testees demonstrated an ability to type
more accurately than the control-group testees. While the
control group had 11.46 mean total errors on initial test
performance, the experimental group had 8.29 mean total
errors. The difference of 3.17 favoring the experimental
group, however, was not statistically significant. In
Experiment II, the opposite condition existed. The control-
group testees had 9.25 mean total errors as compared to
9.53 mean total errors for the experimental-group testees.
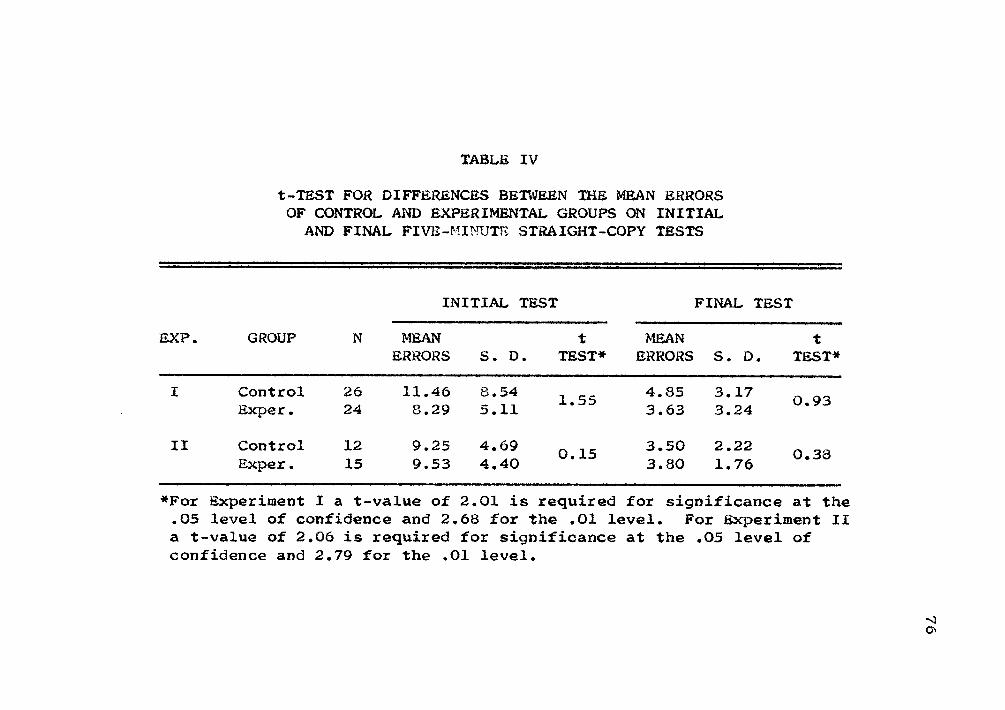
TABLE IV
t-TEST FOR DIFFERENCES BETWEEN THE MEAN ERRORS
OF CONTROL AND EXPERIMENTAL GROUPS ON INITIAL
AND FINAL FIVE-MINUTE STRAIGHT-COPY TESTS
GROUP N
INITIAL TEST FINAL TEST
EXP. MEAN t MEAN t
ERRORS S . D. TEST* ERRORS S . D. TEST*
I Control 26 11 .46 8..541..55
4.85 3. 170 .93
Sxper. 24 8 .29 5..11 3.63 3. 24
II Control 12 9 .25 4..690 .15
3.50 2.»dZ&r0 .38
Exper. 15 9 .53 4.,40 3.80 1. 76
*For Experiment I a t-value of 2.01 is required for significance at the.05 level of confidence and 2.68 for the .01 level. For Experiment IIa t-value of 2.06 is required for significance at the .05 level ofconfidence and 2.79 for the .01 level.
77
The mere difference of 0.28 errors favoring the control
group was not statistically significant.
The initial accuracy advantage held by the groups at
the beginning of Experiments I and II was retained at the
end of the investigation. In Experiment I, the control
group had 4.85 mean total errors on the final test; and the
experimental group had 3.63 mean total errors. The differ
ence of 1.22 errors favoring the experimental group was not
statistically significant. In Experiment II, the control-
group testees had 3.50 mean total errors on the final test
as compared with 3.80 mean total errors for the experimental
group. The difference of 0.30 errors favoring the control
group was not statistically significant.
Interpretation. The initial and final performance
results on five-minute straight-copy tests did not show a
statistically significant superiority of one group over the
other on either stroking-rate ability or accuracy ability.
It would appear, then, from the data presented in Tables III
and IV, that typists receiving reading-instrument training
in second-quarter college typewriting do not develop signif
icantly greater stroking-rate abilities and/or accuracy
abilities on straight-copy timings than typist® not receiv
ing such training.

78
Growth Patterns
Introduction. Tables V, VI, and VII, and Figures 1
through 9, pages 79 through 90, show the growth patterns of
the control and experimental groups on five-minute straight-
copy writings as expressed in terms of group means. This
developmental period covered approximately the last eight
weeks of each ten-week quarter. Measurements of gross
stroking rate, accuracy of copy reproduction, and net words
per minute were obtained on fifteen different five-minute
straight-copy writings or about two writings per week com
mencing with the third week of instruction.
Gross Stroking Rate. The growth pattern of the control
and experimental groups in Experiment I was characterized by
gradual increases with marked fluctuations in progress.
Worthy of note is the fact that both groups showed only mod
erate stroking-rate gains from the third week through the
seventh week of the quarter. During this period the experi
mental group increased its stroking rate 3.5 gross words per
minute while the control group gained 3.6 gross words per
minute. During the last three weeks of the quarter, both
groups demonstrated sharp increases in their gross stroking
rate. During this period the experimental group gained
5.3 gross words per minute while the control group gained

79
TABLE V
MEAN SCORES ON GROSS WORDS PER MINUTE, NET WORDS PER MINUTE,AND TOTAL ERRORS ON THE FIVE-MINUTE STRAIGHT-COPY WRITINGS
(Experiment I)
GWPM ERRORS NWPM
TEST NO. CON. EXP. CON. EXP. CON. EXP.
1 45.7 51.5 14.6 7.9 4&w) • X 35.9
2 46.8 49.9 10.3 7.4 27.5 35.5
3 46.2 51.2 8.8 6.6 30.1 38.8
4 48.9 51.7 10.1 8.2 31.4 36.6
5 47.7 54.7 6.3 7.6 35.9 40.2
6 49.0 53.8 4.6 **» • y 39.8 44.0
7 48.1 56.3 8.4 7.1 31.4 42.0
8 47.0 52.6 6.0 5.0 35.6 42.6
9 50.9 _3*3 • 3 5.9 6.0 39.2 43.6
10 49.3 55.0 5.6 4.8 38.2 45.3
11 54.0 59.4 5.0 4.8 44.0 49.8
12 55.2 59.6 7.3 5.6 40.7 48.4
13 57.2 58.7 5.8 5.2 45.7 48.3
14 56.5 59.7 5.3 4.9 45.9 49.9
15 55.5 60.3 4.8 3.6 45.8 53.0
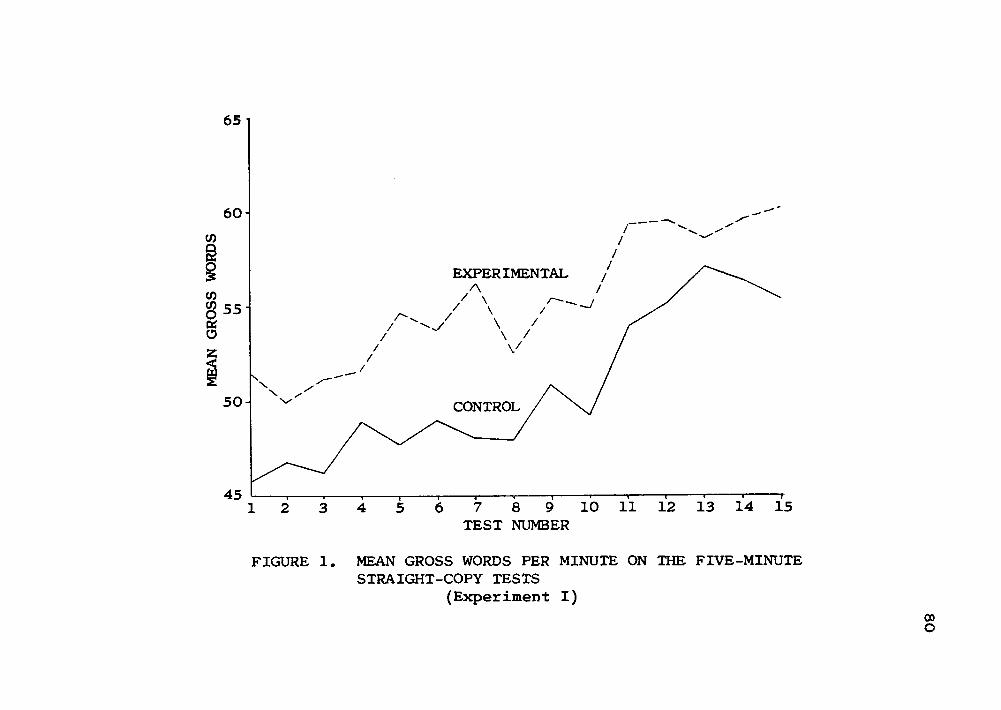
65 1
60-
1CO
8 55oso
EXPERIMENTAL /
/ ^ \ //
r~
/
s
\
X^"'50
45
CONTROL
1 . 1 1 1 1 < i • 1 1 < < r
12 3 4 5 6 7 8 9 10 11 12 13 14 15
TEST NUMBER
FIGURE 1. MEAN GROSS WORDS PER MINUTE ON THE FIVE-MINUTE
STRAIGHT-COPY TESTS
(Experiment I)oo
O

TEST NUMBER
FIGURE 2. MEAN TOTAL ERRORS ON THE FIVE-MINUTE STRAIGHT-
COPY TESTS
(Experiment I)
CO
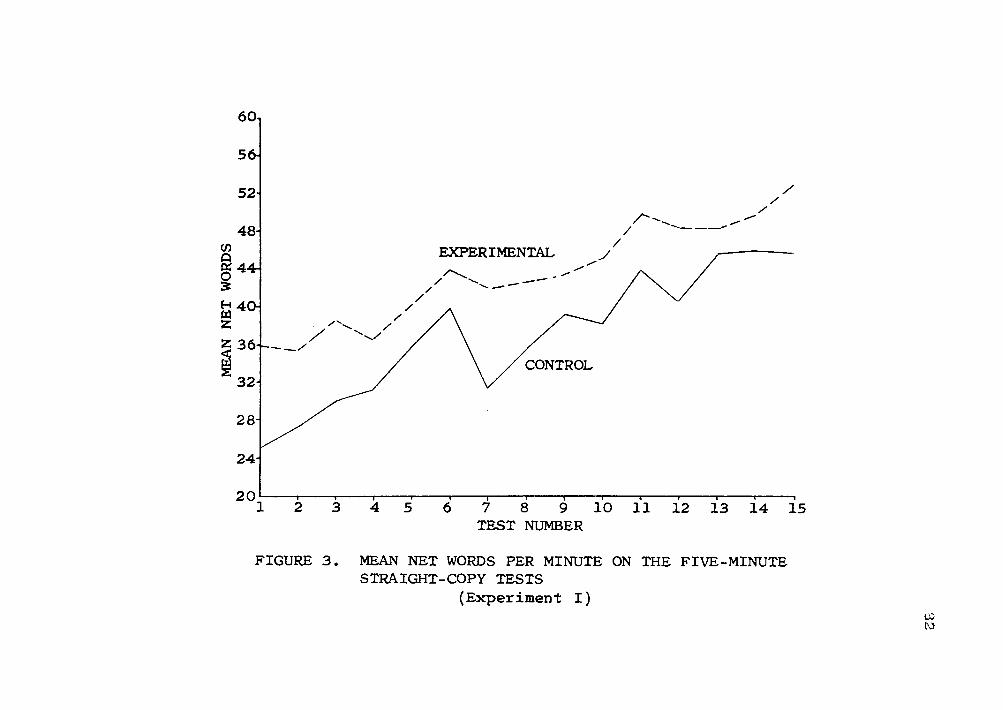
60,
56-
52
48-1coQg44H
H 40-
z:
§36
32
28-
24-
20 • 1 > t 1 1 1 1 1 1 1 1 1 1 11 2 3 4 5 6 7 8 9 10 11 12 13 14 15
TEST NUMBER
//--
EXPERIMENTAL y/
CONTROL
//
/
FIGURE 3. MEAN NET WORDS PER MINUTE ON THE FIVE-MINUTE
STRAIGHT-COPY TESTS
(Experiment I)03to

83
TABLE VI
MEAN SCORES ON GROSS WORDS PER MINUTE, NET WORDS PER MINUTE,AND TOTAL ERRORS ON THE FIVE-MINUTE STRAIGHT-COPY WRITINGS
(Experiment II)
GWPM ERRORS NWPM
TEST NO. CON. EXP. CON. EXP. CON. EXP.
1 51.8 52.2 9.3 9.7 33.3 33.5
2 49.2 52.3 9.6 7.8 30,1 36.8
3 50.2 54.3 10.1 10.3 31.2 35.9
4 54.2 55.9 10.3 9.3 32.9 37.9
5 51.8 55.0 6.3 5.9 39.1 43.1
6 51.0 54.6 5.8 4.1 39.4 46.5
7 53.0 54.5 8.4 6.9 36.1 41.3
8 52.7 55.4 6.9 6.5 38.3 45.5
9 54.8 56.0 5.7 4.4 43.5 47.2
10 55.4 57.5 6.7 5.3 42.1 46.8
11 57.9 61.4 6.1 4.6 45.8 51.6
12 58.5 63.6 4.8 4.6 48.9 54.4
13 56.6 61.6 4.2 4.6 48.3 52.4
14 58.4 63.7 5.5 4.5 47.4 54.7
15 57.5 62.1 3.5 3.9 50.5 54.4

TEST NUMBER
FIGURE 4. MEAN GROSS WORDS PER MINUTE ON THE FIVE-MINUTE
STRAIGHT-COPY TESTS
(Experiment II)03
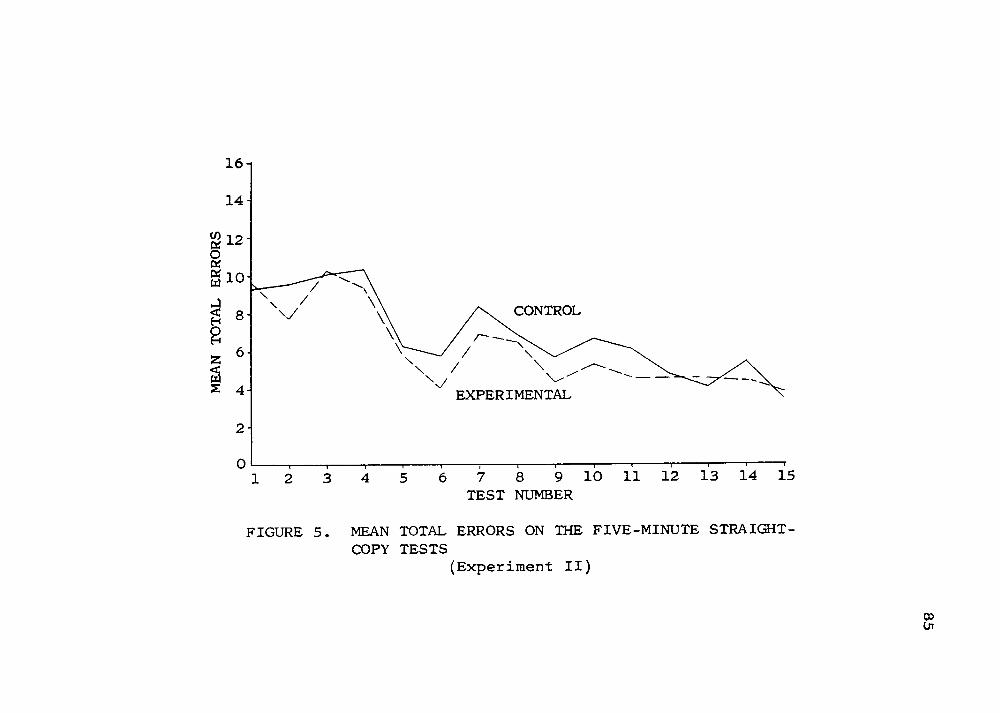
16
14-
j§12iOK
gioi
S 4
8-
2-
CONTROL
EXPERIMENTAL
0 -I T -i 1 t 1 -~r-
12 3 4 5 6 7 8 9 10 11 12 13 14 15
TEST NUMBER
FIGURE 5. MEAN TOTAL ERRORS ON THE FIVE-MINUTE STRAIGHT-
COPY TESTS
(Experiment II)
COVJ
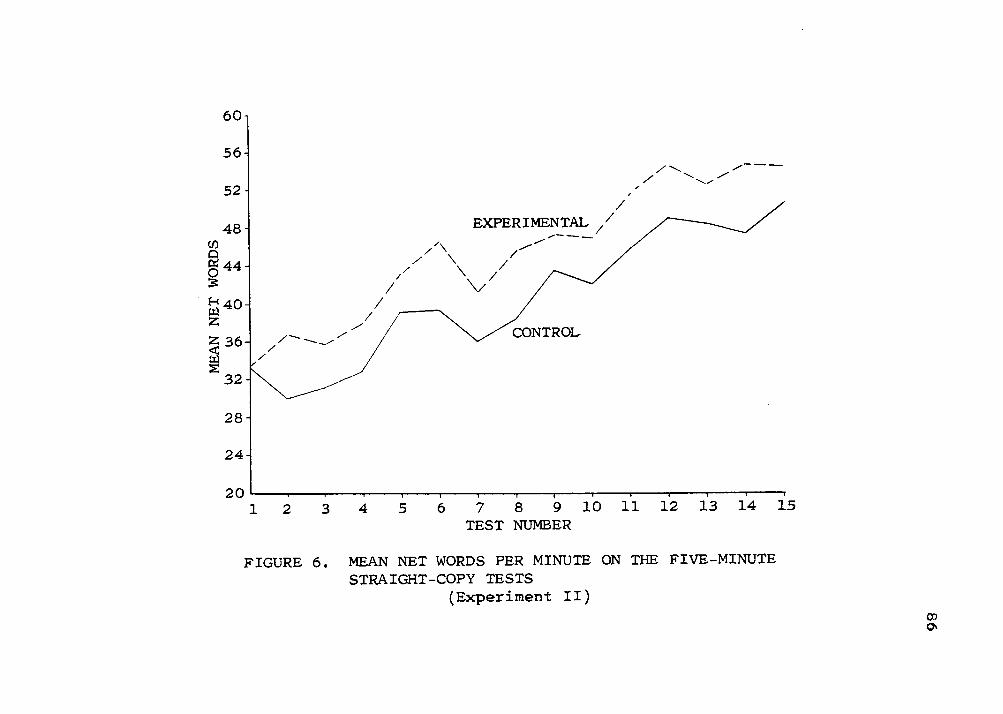
FIGURE 6. MEAN NET WORDS PER MINUTE ON THE FIVE-MINUTESTRAIGHT-COPY TESTS
(Experiment II)COo
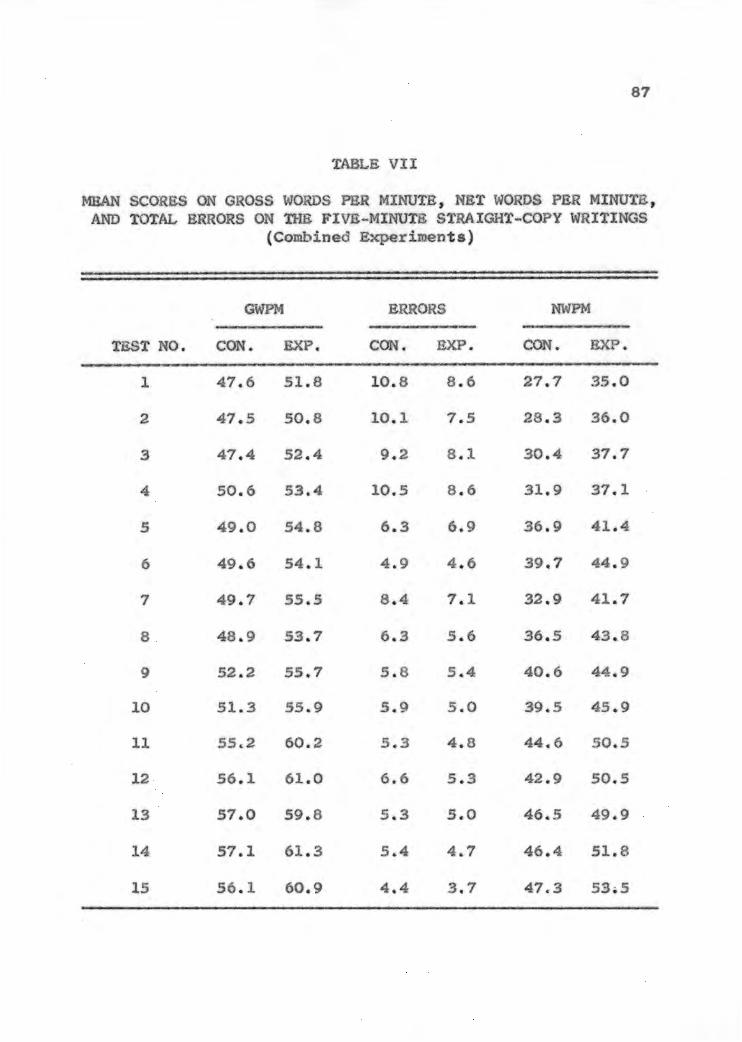
87
TABLE VII
MEAN SCORES ON GROSS WORDS PER MINUTE, NET WORDS PER MINUTE,AND TOTAL ERRORS ON THE FIVE-MINUTE STRAIGHT-COPY WRITINGS
(Combined Experiments)
GWPM ERRORS NWPM
TEST NO. CON. EXP, CON. EXP. CON. EXP.
1 47.6 51.8 10.8 8.6 27.7 35.0
2 47.5 50.8 10.1 7.5 28.3 36.0
3 47.4 52.4 9.2 8.1 30.4 37.7
4 50.6 53.4 10.5 8.6 31.9 37.1
5 49.0 54.8 6.3 6.9 36.9 41.4
6 49.6 54.1 4.9 4.6 39.7 44.9
7 49.7 55.5 8.4 7.1 32.9 41.7
8 48.9 53.7 6.3 5.6 36.5 43.8
9 52.2 55.7 5.8 5.4 40.6 44.9
10 51.3 55.9 5.9 5.0 39.5 45.9
11 Z3 w5 *• i& 60.2 5.3 4.8 44.6 50.5
12 56.1 61.0 6.6 5.3 42.9 50.5
13 57.0 59.8 3P • 9 5.0 46.5 49.9
14 57.1 61.3 5.4 4.7 46.4 51.8
15 56.1 60.9 4.4 3.7 47.3 53i5

65 -,
60 -
CODKO
COCO 55
KO
<
50 -
45
/EXPERIMENTAL /
CONTROL
1 1 i 1 1 1 1 1 1 1 i i i i
12 3 4 5 6 7 8 9 10 11 12 13 14 15
TEST NUMBER
FIGURE 7. MEAN GROSS WORDS PER MINUTE ON THE FIVE-MINUTE
STRAIGHT-COPY TESTS
(Combined Experiments)COCo

16i
14'
g 12"OK
glO
2 8-
2 6
2 4
2-1
i i i i
EXPERIMENTAL
-i r —i 1 i 1 1——i
1 2 3 4 5 6 7 8 9 10 11 12 13 14 15
TEST NUMBER
FIGURE 8. MEAN TOTAL ERRORS ON THE FIVE-MINUTE STRAIGHT-
COPY TESTS
(Combined Experiments)
vo

FIGURE 9. MEAN NET WORDS PER MINUTE ON THE FIVE-MINUTE
STRAIGHT-COPY TESTS
(Combined Experiments)vo
O

91
6.2 gross words per minute. In terms of over-all improve
ment during the quarter, then, the experimental group
increased its stroking rate 8.8 gross words per minute and
the control group gained 9.8 gross words per minute.
In Experiment II, the growth pattern of the control and
experimental groups showed more uniform development than was
the case in Experiment I. The total increase for the
experimental group was 9.9 gross words per minute, and the
total gain for the control group was 5.7 gross words per
minute.
An inspection of the comparative performances of the
control and experimental groups, when both experiments were
combined, disclosed a marked similarity of improvement on
gross stroking rate. The experimental group showed a slight
superiority over the control group of 4.2 gross words per
minute at the beginning of the training period and 4.8 gross
words per minute at the end of the training period. In gen
eral, the learning curves for the two groups showed a highly
consistent pattern of variations or changes in the same
direction.
Interpretation. The group learning curves fluctuated
to a rather large extent; however, they do have a clear up
ward trend that shows the influence of preceding practice.
92
When one considers the initial and terminal stages of the
gross stroking-rate abilities of the control and experi
mental groups, as well as the generally similar pattern of
growth throughout the training period, one does not find any
evidence which would suggest that reading-instrument train
ing results in superior stroking-rate performance.
Accuracy of Copy Reproduction. The accuracy patterns
of the experimental and control groups in Experiment I were
both characterized by a steady improvement, or reduction in
total errors, although the control group showed more erratic
performance at various points in the measurement series.
The mean error scores for the control group for the first,
second, fourteenth, and fifteenth tests were 14.6, 10.3,
5.3, and 4.8, respectively. For these same tests, the
experimental group had mean error scores of 7.9, 7.4, 4.9,
and 3.6. Thus, while the experimental group showed a slight
superiority in accuracy of copy reproduction on all measure
ments except three (Tests 5, 6, and 9), the control group
showed the greatest amount of improvement. The control
group had an error reduction of 9.8 total errors during the
training period while the experimental group reduced its
errors by 4.3 total errors.

93
In Experiment II, the control group held a slight
advantage on the first, third, thirteenth, and fifteenth
tests. In terms of consistent performance, however, the
experimental group again demonstrated an ability to type
more accurately than the control group. Both groups reduced
their errors during the training period by 5.8 total errors.
For the combined experiments, a pronounced pattern of
parallelism of improvement was noted. The mean error scores
for the control group for the first, second, fourteenth, and
fifteenth tests were 10.8, 10.1, 5.4, and 4.4, respectively.
For these same tests, the experimental group had mean error
scores of 8.6, 7.5, 4.7, and 3.7. Hence, the control group
had an error reduction of 6.4 total errors during the train
ing period while the experimental group decreased its total
errors by 4.9.
Interpretation. From about the middle of the training
period on, the accuracy pattern for each group became less
erratic than the performance in the early stages of each
experiment; and a general trend of gradual error reduction
was established. The generally similar growth patterns of
the control and experimental groups seem to indicate that
reading-instrument training does not contribute to superior
accuracy performance.
94
Net Words Per Minute. The results on this particular
factor in the measurement process represented a combination
of the gross stroking rates and the accuracy patterns of
each group. Based on the International Typewriting Rules*
ten-word penalty for each typewriting error, one error
decreases the gross stroking rate by two words per minute on
a five-minute writing.
In Experiment I, the growth pattern of the control
group was characterized by more and sharper fluctuations on
the various measurements than was true for the experimental
group. The superiority of the experimental group ranged
from 2.6 to 10.8 net words per minute. The total increase
in net words per minute for the experimental group, based on
the difference between the first and fifteenth tests, was
17.1 net words per minute while the control group gained
20.7 net words per minute.
In Experiment II, the growth patterns of the control
and experimental groups were generally similar with both
groups showing a steady increase in the net stroking rate.
The superiority of the experimental group ranged from 0.2 to
7.3 net words per minute. The total increase in net words
per minute for the experimental group, based on the differ
ence between the first and fifteenth tests, was 20.9 net

95
words per minute while the control group gained 17.2 net
words per minute.
Generally similar patterns of development for the two
groups were portrayed when the results of Experiment I and
II were combined. On the first test, the superiority of the
experimental group was 7.3 net words per minute; and, on the
fifteenth test, the experimental group showed a superiority
of 6.2 net words per minute. The total increase in net
words per minute for the experimental group, based on the
difference between the first and last tests, was 19.6 net
words per minute while the control group gained 18.5 net
words per minute—a difference of only 1.1 net words per
minute favoring the experimental group.
Interpretation. The growth patterns on net stroking
rates for the control and experimental groups showed a
steady increase with almost parallel variations from one
measurement to the next. In general, the experimental group
started with a slight superiority in net stroking-rate
ability and retained a similar advantage throughout the
training period. The data do not seem to reveal, however,
a superior pattern of development favoring the group receiv
ing reading-instrument training.
96
Significance of Selected Straight-Copy Measurements
Analysis of Variance. The analysis of variance was
applied to the results on each of the selected straight-copy
measurements in order to test the significance of the dif
ference between the means of the experimental and the con
trol groups. To increase the value of the findings, the
data of the two experiments were combined to make a total of
38 students in the control group and 39 students in the
experimental group.
The 5 per cent and 1 per cent points of the
F-distribution with 1 and 73 degrees of freedom were 3.98
and 7.01, respectively. An F-value which exceeds these
values indicates that the difference between the means of
the control and experimental groups was statistically sig
nificant.
Method. This first item on the analysis of variance
tables is actually the most important one so far as this
experiment was concerned. It represents the results of the
tests of significance of the difference between the means of
the control and means of the experimental groups for each
measurement used in the study.
97
Term. This item represents a comparison of the means
of Experiment I with those of Experiment II and has no
actual bearing on the main objective of this study.
Interaction. This item represents those variations
attributable not to either the method variance or to the
term variance acting alone but to joint effects of the two
variations acting together. A lack of statistical signifi
cance in interaction means that consistent results were
obtained in Experiments I and II. None of the interactions
of the variations measured in this study were statistically
significant.
Error. The error mean square represents the pooled
variations of all four groups of students who participated
in the experiment. It measures the variation among the stu
dents within the groups.
Total. This last item on each table is merely a check
ing device used for computation and has no actual bearing on
the findings.
Gross Words Per Minute. Tables VIII and IX, page 98,
show the mean scores and analysis of variance calculations,
respectively, for gross words per minute for the last five-
minute straight-copy test of the quarter for the control and
experimental groups.

TABLE VIII
TABLE OF MEANS OF GROSS WORDS PER MINUTE
FOR LAST FIVE-MINUTE STRAIGHT-COPY TEST
EXPERIMENT CONTROL EXP. MEAN OF
NO. CLASS CLASS MEANS
I 55.46 60.25 57.85
II 57.50 62.80 60.15
Combined 56.11 61.23 58.67
TABLE IX
ANALYSIS OF VARIANCE FOR GROSS WORDS PER MINUTE
ON LAST FIVE-MINUTE STRAIGHT-COPY TEST
98
SOURCE OF SUM OF MEAN
'•i1::: vi1. r\; i'jjl.
VARIATION SQUARES DF SQUARE F* CONCLUSION
Method 442.27 1 442.27 2.87 Not Sig.
Term 91.49 1 91.49 0.59 Not Sig.
Interaction 1.14 1 1.14 0.01 Not Sig.
Error 11244.36 73 154.03
Total 11779.26 76
♦For 1 and 73 degrees of freedom an F-value of 3.98 isrequired for significance at the .05 level of confidence and 7.01 for the .01 level.

99
Table VIII shows that, in both Experiments I and II,
the experimental groups had higher stroking-rate means than
the control groups; the differences between the two groups
were 4.79 gross words per minute in Experiment I and
5.30 gross words per minute in Experiment II. The combined
experiments favored the experimental groups by 5.12 gross
words per minute.
Table IX shows that the F-value of 2.87 representing
the difference between the means of the experimental and
control groups was not statistically significant. The
F-values of 0.59 and 0.01 representing the difference
between the means of Experiments I and II and the inter
action variance, respectively, were not statistically sig
nificant .
Errors. Tables X and XI, page 100, show the mean
scores and analysis of variance calculations, respectively,
for total errors for the last five-minute straight-copy test
of the quarter for the control and experimental groups.
Table X shows that, in Experiment I, the experimental
group demonstrated an ability to type more accurately than
the control group by a difference of 1.22 total errors. In
Experiment II, the control group held a slight advantage
over the experimental group by 0.30 total errors.

TABLE X
TABLE OF MEANS OF TOTAL ERRORS
FOR LAST FIVE-MINUTE STRAIGHT-COPY TEST
EXPERIMENT CONTROL EXP. MEAN OF
NO. CLASS CLASS MEANS
:c 4.85 3.63 4.24
II 3.50 3.80 3.65
Combined 4.42 3.69 4.05
TABLE XI
ANALYSIS OF VARIANCE FOR TOTAL ERRORS
ON LAST FIVE-MINUTE STRAIGHT-COPY TEST
100
SOURCE OF
VARIATION
SUM OF MEAN
SQUARES DF SQUARE F* CONCLUSION
Method
Term
Interaction
Error
Total
3.69
5.96
10.06
618.41
638.12
73
76
3.69 0.44 Not Sig.
5.96 0.70 Not Sig.
10.06 1.19 Not Sig.
8.47
*For 1 and 73 degrees of freedom an F-value of 3.98 isrequired for significance at the .05 level of confidence and 7.01 for the .01 level.

101
Table XI shows that the F-value of 0.44 representing
the difference between the means of the experimental and
control groups was not statistically significant. The
F-values of 0.70 and 1.19 representing the difference
between the means of Experiments I and II and the inter
action variance, respectively, were not statistically sig
nificant.
Speed Improvement A. Tables XII and XIII, page 102,
show the mean scores and analysis of variance calculations,
respectively, for speed improvement A, a course grading plan
based on the difference between the adjusted basic rate as
determined at the beginning of the quarter and the average
net score on the best three five-minute straight-copy tests
at the end of the quarter.
Table XII shows that, in both Experiments I and II, the
experimental groups maintained a speed-improvement superior
ity over the control groups; the differences between the two
groups were 1.81 net words per minute in Experiment I and
2.50 net words per minute in Experiment II. The combined
experiments favored the experimental groups by 1.96 net
words per minute.
Table XIII shows that the F-value of 3.12 representing
the difference between the means of the experimental and

TABLE XII
TABLE OF MEANS FOR SPEED IMPROVEMENT A
EXPERIMENT CONTROL EXP. MEAN OF
NO. CLASS CLASS MEANS
I 10.15 11.96 11.05
II 8.50 11.00 9.75
Combined 9.63 11.59 10.61
TABLE XIII
ANALYSIS OF VARIANCE FOR SPEED IMPROVEMENT A
102
SOURCE OF SUM OF MEAN
VARIATION SQUARES DF SQUARE F* CONCLUSION
Method 80.51 1 80.51 3.12 Not Sig.
Term 29.65 1 29.65 1.15 Not Sig.
Interaction 2.10 1 2.10 0.08 Not Sig.
Error 1885.34 73 25.83
Total 1997.60 76
♦For 1 and 73 degrees of freedom an F-value of 3.98 isrequired for significance at the .05 level of confidence and 7.01 for the .01 level.
103
control groups was not statistically significant. The
F-values of 1.15 and 0.08 representing the difference
between the means of Experiments I and II and the inter
action variance, respectively, were not statistically sig
nificant.
Speed Improvement B. Tables XIV and XV, page 104, show
the mean scores and analysis of variance calculations,
respectively, for speed improvement B. This measurement was
based on the difference between the average gross stroking
rates at the beginning and at the end of the quarter; it
represents the difference between the actual initial and
terminal gross stroking-rate performances on five-minute
straight-copy tests. In other words, no mathematical
adjustment was made to the initial performance scores to
account for individual differences in accuracy, as was the
case in the preceding measurement.
Table XIV shows that, in Experiment I, the control
group showed an improvement of 12.23 gross words per minute
as compared with 11.83 gross words per minute for the
experimental group. In Experiment II, the experimental
group gained 11.33 gross words per minute while the control
group gained 9.67 gross words per minute. The combined

104
TABLE XIV
TABLE OF MEANS FOR SPEED IMPROVEMENT 8
EXPERIMENT
NO.
II
Combined
CONTROL
CLASS
12.23
9.67
11.42
TABLE XV
EXP.
CLASS
11,83
11.33
11.64
MEAN OF
MEANS
12.03
10.50
11.53
ANALYSIS OF VARIANCE FOR SPEED IMPROVEMENT B
SOURCE OF
VARIATION
Method
Term
Interaction
Error
Total
SUM OF MEAN
SQUARES DF SQUARE p*
7.00 7.00 0.39
40.80 40.80 2.30
18.51 18.51 1.04
1293.95 73 17.73
1360.26 76
CONCLUSION
Not Sig.
Not Sig,
Not Sig.
♦For 1 and 73 degrees of freedom an F-value of 3.98 isrequired for significance at the .05 level of confidence and 7.01 for the .01 level.

105
experiments favored the experimental groups by a mere
0.22 gross words per minute.
Table XV shows that the F-value of 0.39 representing
the difference between the means of the experimental and
control groups was not statistically significant. The
F-values of 2.30 and 1.04 representing the difference
between the means of Experiments I and II and the inter
action variance, respectively, were not statistically sig
nificant.
Consistency. Tables XVI and XVII, page 106, show the
mean scores and analysis of variance calculations, respec
tively, for consistency. This measurement provides addi
tional data on the accuracy performances of the control and
experimental groups during the training period and is based
on the total number of five-minute straight-copy writings
containing two or fewer typewriting errors.
Table XVI shows that, in both Experiments I and II, the
experimental groups demonstrated an ability to consistently
type more accurately than the control groups; the differ
ences between the two groups were 1.73 in Experiment I and
0.66 in Experiment II. The combined experiments favored the
experimental groups by 1.38.

TABLE XVI
TABLE OF MEANS FOR CONSISTENCY
EXPERIMENT CONTROL EXP. MEAN OF
NO. CLASS CLASS MEANS
I 1.85 3.58 2.71
II 2.67 3.33 3.00
Combined 2.11 3.49 2.80
TABLE XVII
ANALYSIS OF VARIANCE FOR CONSISTENCY
106
SOURCE OF
VARIATION
SUM OF MEAN
SQUARES DF SQUARE jr# CONCLUSION
Method 25.11
Term 1.41
Interaction 4.98
Error 581.22
Total 612.72
73
76
25.11
1.41
4.98
7.96
3.15 Not Sig.
0.18 Not Sig.
0.63 Not Sig.
♦For 1 and 73 degrees of freedom an F-value of 3.98 is
required for significance at the .05 level of confidence and 7.01 for the .01 level.
107
Table XVII shows that the F-value of 3.15 representing
the difference between the means of the experimental and
control groups was not statistically significant. The
F-values of 0.18 and 0.63 representing the difference
between the means of Experiments I and II and the inter
action variance, respectively, were not statistically sig
nificant.
Production Drills. Tables XVIII and XIX, page 108,
show the mean scores and analysis of variance calculations,
respectively, for the average production drill performances
for the control and experimental groups. This measurement
combines stroking-rate ability and consistent accuracy per
formance and is based on the average score on four seven-
minute straight-copy tests given throughout the quarter.
The scoring procedure is outlined on page 68 of this thesis.
Table XVIII shows that, in both Experiments I and II,
the experimental groups had higher mean scores than the con
trol groups on these performance tests. The differences
between the two groups were 23.68 mean points in Experi
ment I and 25.37 mean points in Experiment II. The combined
experiments favored the experimental groups by 25.13 mean
points.

TABLE XVIII
TABLE OF MEANS FOR AVERAGE PRODUCTION DRILL
EXPERIMENT CONTROL EXP. MEAN OF
NO. CLASS CLASS MEANS
I 81.87 105.55 93.71
II 93.52 118.89 106.20
Combined 85.55 110.68 98.11
TABLE XIX
ANALYSIS OF VARIANCE FOR AVERAGE PRODUCTION DRILL
108
SOURCE OF SUM OF MEAN
VARIATION SQUARES DF SQUARE F* CONCLUSION
Method 10454.88 1 10454.88 3.66 Not Sig.
Term 2712.42 1 2712.42 0.95 Not Sig.
Interaction 12.40 1 12.40 0.00 Not Sig.
Error 208423.59 73 2855.12
Total 211603.29 76
♦For 1 and 73 degrees of freedom an F-value of 3.98 isrequired for significance at the .05 level of confidence and 7.01 for the .01 level.
109
Table XIX shows that the F-value of 3.66 representing
the difference between the means of the experimental and
control groups was not statistically significant. The
F-values of 0.95 and 0.00 representing the difference
between the means of Experiments I and II and the inter
action variance, respectively, were not statistically sig
nificant.
Interpretation. An attempt was made to provide a vari
ety of data on quantity (speed) and quality (accuracy) of
performance on straight-copy material for the control and
experimental groups. In general, the mean performance
scores on six different straight-copy measurements favored
the experimental groups over the control groups in both
Experiments I and II. The differences between the mean
scores on all straight-copy measurements for the two groups,
however, were not statistically significant.
From all the evidence available, therefore, it may be
asserted that typists receiving controlled reading-
instrument training do not seem to develop significantly
greater key-stroking and accuracy skills on straight-copy
timings than typists not receiving such training.
110
Speed and Accuracy Performance on Production-Copy Tests
To determine the students' speed and accuracy perform
ance on production-type activities, six different
production-copy measurements were employed. Measurements of
production words a minute and total errors were obtained on
the last five-minute business letter, tabulation, and enu
meration tests for the control and experimental groups.
Letter Writing
Production Words a Minute. Tables XX and XXI,
page 111, show the mean scores and analysis of variance cal
culations, respectively, for production words a minute on
the last five-minute letter test for the control and experi
mental groups.
Table XX shows that the experimental group, in Experi
ment I, had a mean score of 54.21 production words a minute
compared with a mean score of 50.00 production words a min
ute for the control group. In Experiment II, the
experimental-group mean was 56*27 production words a minute
and the mean for the control group, 54.58 production words a
minute. The mean scores for the combined experiments showed
a difference of 3.55 production words a minute favoring the
experimental groups over the control groups.

TABLE XX
TABLE OF MEANS OF PRODUCTION WORDS A MINUTE
FOR LAST FIVE-MINUTE LETTER TEST
EXPERIMENT CONTROL EXP. MEAN OF
NO. CLASS CLASS MEANS
I 50.00 54.21 52.10
II 54.58 56.27 55.42
Combined 51.45 55.00 53.22
TABLE XXI
ANALYSIS OF VARIANCE FOR PRODUCTION WORDS A MINUTE
ON LAST FIVE-MINUTE LETTER TEST
Ill
SOURCE OF SUM OF MEAN
VARIATION SQUARES DF SQUARE F* CONCLUSION
Method 150.85 1 150.85 1.20 Not Sig.
Term 191.70 1 191.70 1.52 Not Sig.
Interaction 27.70 1 27.70 0.22 Not Sig.
Error 9197.81 73 126.00
Total 9568.06 76
♦For 1 and 73 degrees of freedom an F-value of 3.98 isrequired for significance at the .05 level of confidence and 7.01 for the .01 level.

112
Table XXI shows that the F-value of 1.20 representing
the difference between the means of the experimental and
control groups was not statistically significant. The
F-values of 1.52 and 0.22 representing the difference
between the means of Experiments I and II and the inter
action variance, respectively, were not statistically sig
nificant.
Total Errors. Tables XXII and XXIII, page 113, show
the mean scores and analysis of variance calculations,
respectively, for the total errors on the last five-minute
letter test for the control and experimental groups.
Table XXII shows that, in both Experiments I and II,
the experimental groups demonstrated an ability to type let
ter copy more accurately than the control groups. The dif
ferences between the two groups were 0.06 total mean errors
in Experiment I and 0.97 total mean errors in Experiment II.
For the combined experiments, the experimental groups had
0.47 fewer mean errors than the control groups.
Table XXIII shows that the F-value of 0.73 representing
the difference between the means of the experimental and
control groups was not statistically significant. The
F-value of 4.12 representing the difference between the
means of Experiments I and II was statistically significant
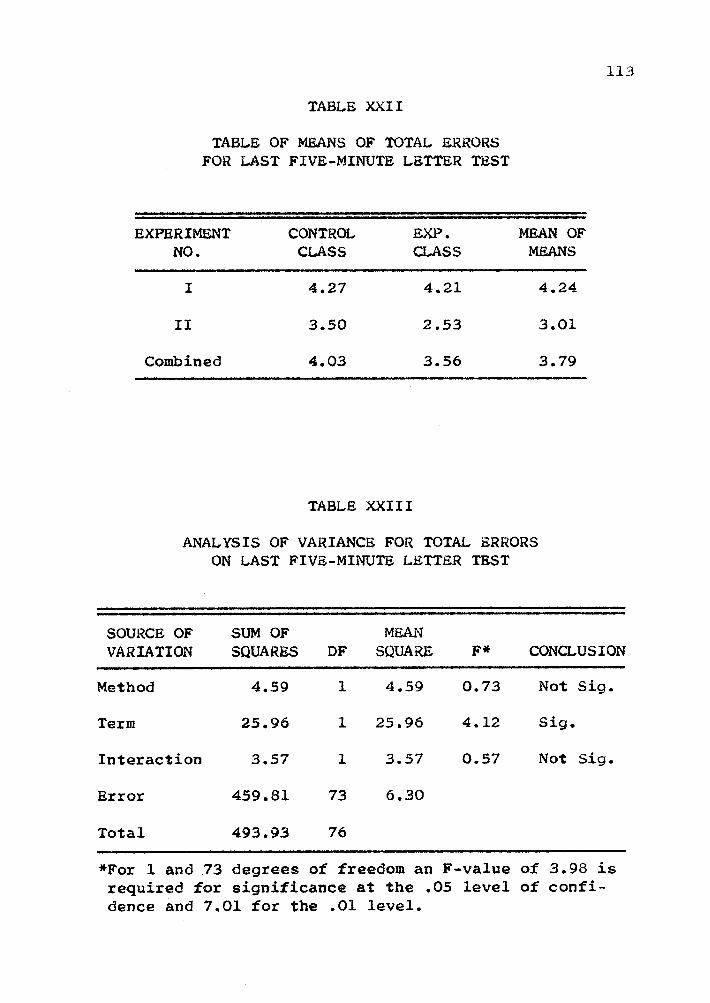
TABLE XXII
TABLE OF MEANS OF TOTAL ERRORS
FOR LAST FIVE-MINUTE LETTER TEST
EXPERIMENT CONTROL EXP. MEAN OF
NO. CLASS CLASS MEANS
I 4.27 4.21 4.24
II 3.50 2.53 3.01
Combined 4.03 3.56 3.79
TABLE XXIII
ANALYSIS OF VARIANCE FOR TOTAL ERRORS
ON LAST FIVE-MINUTE LETTER TEST
113
SOURCE OF SUM OF MEAN
VARIATION SQUARES DF SQUARE p# CONCLUSION
Method 4.59 1 4.59 0.73 Not Sig.
Term 25.96 1 25.96 4.12 Sig.
Interaction 3.57 1 3.57 0.57 Not Sig.
Error 459.81 73 6.30
Total 493.93 76
♦For 1 and 73 degrees of freedom an F-value of 3.98 isrequired for significance at the .05 level of confidence and 7.01 for the .01 level.
114
at the 5 per cent level of confidence. The F-value of 0.57
representing the interaction variance was not statistically
significant.
Tabulation Writing
Production Words a Minute. Tables XXIV and XXV,
page 115, show the mean scores and analysis of variance cal
culations, respectively, for production words a minute on
the last five-minute tabulation test for the control and
experimental groups.
Table XXIV shows that, in both Experiments I and II,
the experimental groups had higher mean scores than the con
trol groups on this performance test. The differences
between the two groups were 7.62 mean production words a
minute in Experiment I and 3.50 mean production words a min
ute in Experiment II. The combined experiments favored the
experimental groups by 6.42 mean production words a minute.
Table XXV shows that the F-value of 4.07 representing
the difference between the means of the experimental and
control groups was statistically significant at the 5 per
cent level of confidence. The F-values of 1.63 and 0.56
representing the difference between the means of Experi
ments I and II and the interaction variance, respectively,

TABLE XXIV
TABLE OF MEANS OF PRODUCTION WORDS A MINUTE
FOR LAST FIVE-MINUTE TABULATION TEST
EXPERIMENT CONTROL EXP. MEAN OF
NO. CLASS CLASS MEANS
I 48.92 56.54 52.73
II 54.50 58.00 56.25
Combined 50.68 57.10 53.89
115
TABLE XXV
ANALYSIS OF VARIANCE FOR PRODUCTION WORDS A MINUTE
ON LAST FIVE-MINUTE TABULATION TEST
SOURCE OF SUM OF MEAN
VARIATION SQUARES DF SQUARE p# CONCLUSION
Method 537.24 1 537.24 4.07 Sig.
Term 215.09 1 215.09 1.63 Not Sig.
Interaction 73.72 1 73.72 0.56 Not Sig.
Error 9634.80 73 131.98
Total 10460.85 76
♦For 1 and 73 degrees of freedom an F-value of 3,98 isrequired for significance at the .05 level of confidence and 7,01 for the .01 level.

116
were not statistically significant.
Total Errors. Tables XXVI and XXVII, page 117, show
the mean scores and analysis of variance calculations,
respectively, for the total errors on the last five-minute
tabulation test for the control and experimental groups.
Table XXVI shows that, in both Experiments I and II,
the experimental groups demonstrated an ability to type
tabulation copy more accurately than the control groups.
The differences between the two groups were 0.10 total mean
errors in Experiment I and 0.86 total mean errors in Experi
ment II. For the combined experiments, the experimental
groups had 0,46 fewer mean errors than the control groups.
Table XXVII shows that the F-value of 0.45 representing
the difference between the means of the experimental and
control groups was not statistically significant. The
F-values of 3.34 and 0.28 representing the difference
between the means of Experiments I and II and the inter
action variance, respectively, were not statistically sig
nificant.
Enumeration Writing
Production Words a Minute. Tables XXVIII and XXIX,
page 118, show the mean scores and analysis of variance

TABLE XXVI
TABLE OF MEANS OF TOTAL ERRORS
FOR LAST FIVE-MINUTE TABULATION TEST
EXPERIMENT CONTROL EXP. MEAN OF
NO. CLASS CLASS MEANS
I 5.27 5.17 5.22
II 4.33 3.47 3.90
Combined 4.97 4.51 4.74
TABLE XXVII
ANALYSIS OF VARIANCE FOR TOTAL ERRORS
ON LAST FIVE-MINUTE TABULATION TEST
117
SOURCE OF SUM OF MEAN
VARIATION SQUARES DF SQUARE F* CONCLUSION
Method 4.08 1 4.08 0.45 Not Sig.
Term 30.19 1 30.19 3.34 Not Sig.
Interaction 2.54 1 2.54 0.28 Not Sig.
Error 660.85 73 9.05
Total 697.66 76
♦For 1 and 73 degrees of freedom an F-value of 3.98 isrequired for significance at the .05 level of confidence and 7.01 for the .01 level.

TABLE XXVIII
TABLE OF MEANS OF PRODUCTION WORDS A MINUTE
FOR LAST FIVE-MINUTE ENUMERATION TEST
EXPERIMENT CONTROL EXP. MEAN OF
NO. CLASS CLASS MEANS
I 49.81 53.04 51.42
II 54.58 57.93 56.25
Combined 51.32 54.92 53.12
TABLE XXIX
ANALYSIS OF VARIANCE FOR PRODUCTION WORDS A MINUTE
FOR LAST FIVE-MINUTE ENUMERATION TEST
118
SOURCE OF
VARIATION
SUM OF
SQUARES DF
MEAN
SQUARE F* CONCLUSION
Method 188.38 1 188.38 1.37 Not Sig.
Term 406.13 1 406.13 2.95 Not Sig.
Interaction 0.06 1 0.06 0.00 Not Sig.
Error 10056.85 73 137.77
Total 10651.42 76
♦For 1 and 73 degrees of freedom an F-value of 3.98 isrequired for significance at the .05 level of confidence and 7.01 for the .01 level.

119
calculations, respectively, for production words a minute on
the last five-minute enumeration test for the control and
experimental groups.
Table XXVIII shows that, in both Experiments I and II,
the experimental groups had higher stroking-rate mean scores
on enumeration copy than the control groups. The differ
ences between the two groups were 3.23 mean production words
a minute in Experiment I and 3.35 mean production words a
minute in Experiment II. The combined experiments favored
the experimental groups by 3.60 mean production words a min
ute.
Table XXIX shows that the F-value of 1.37 representing
the difference between the means of the experimental and
control groups was not statistically significant. The
F-values of 2.95 and 0.00 representing the difference
between the means of Experiments I and II and the inter
action variance, respectively, were not statistically sig
nificant .
Total Errors. Tables XXX and XXXI, page 120, show the
mean scores and analysis of variance calculations, respec
tively, for the total errors on the last five-minute enu
meration test for the control and experimental groups.
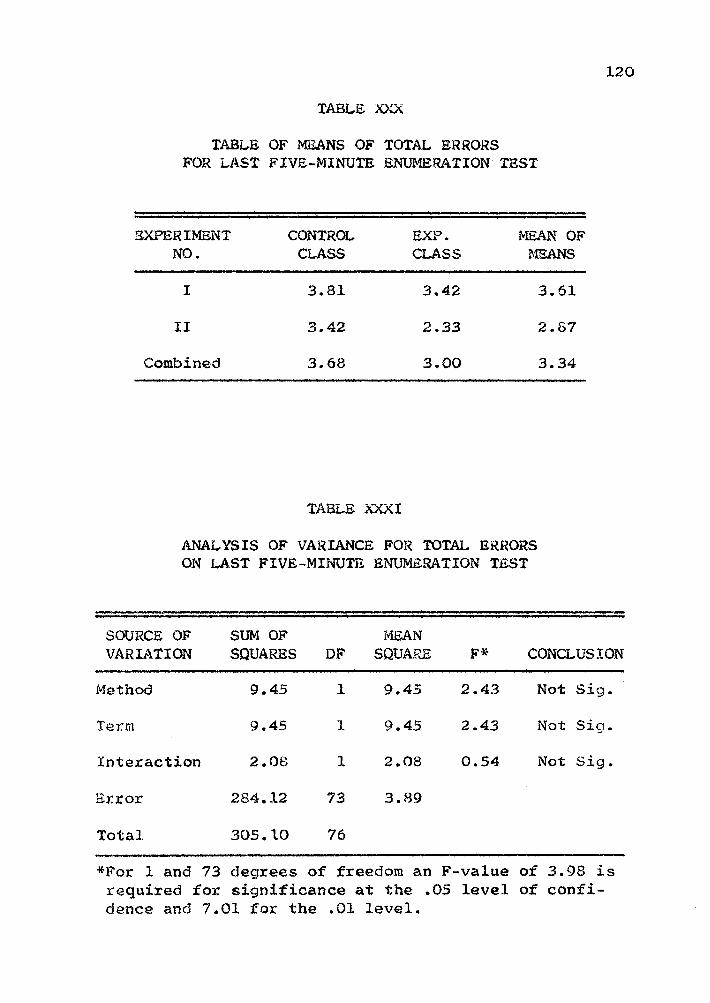
TABLE XXX
TABLE OF MEANS OF TOTAL ERRORS
FOR LAST FIVE-MINUTE ENUMERATION TEST
EXPERIMENT CONTROL EXP. MEAN OF
NO. CLASS CLASS MEANS
I 3.81 3.42 3.61
II 3.42 2.33 2.87
Combined 3.68 3.00 3.34
TABLE XXXI
ANALYSIS OF VARIANCE FOR TOTAL ERRORS
ON LAST FIVE-MINUTE ENUMERATION TEST
120
SOURCE OF SUM OF MEAN
VARIATION SQUARES DF SQUARE F* CONCLUSION
Method 9.45 9.45 2.43 Not Sia.
Term 9.45 9.45 2.43 Not Sia,
Interaction 2.08 1 2.08 0.54 Not Sig.
Error 284.12 73 3.89
Total 305.10 76
♦For 1 and 73 degrees of freedom an F-value of 3.98 isrequired for significance at the .05 level of confidence and 7.01 for the .01 level.
121
Table XXX shows that, in both Experiments I and II, the
experimental groups had fewer mean total errors than the
control groups on the last five-minute enumeration test.
The differences between the two groups were 0.39 mean total
errors in Experiment I and 1.09 mean total errors in Experi
ment II. For the combined experiments, the experimental
groups had 0.68 fewer mean errors than the control groups.
Table XXXI shows that the F-value of 2.43 representing
the difference between the means of the experimental and
control groups was not statistically significant. The
F-values of 2.43 and 0.54 representing the difference
between the means of Experiments I and II and the inter
action variance, respectively, were not statistically sig
nificant.
Interpretation. The mean scores on six different
production-copy measurements favored the experimental groups
over the control groups. When these scores were subjected
to statistical analysis, however, only one measurement
showed a statistically significant difference between the
means of the control and experimental groups on production-
copy performance.
From all the data presented, therefore, it may be
asserted that typists receiving reading-instrument training

122
do not seem to develop significantly superior speed and/or
accuracy performance on production-copy tests when compared
with typists not receiving such training.
Reading Rate and Comprehension Development
To determine the effect of controlled reading-
instrument training on the students' reading rate and com
prehension, pre-training and post-training scores were
obtained from the experimental-group testees and from the
control-group testees by using two equivalent forms of the
Cooperative English Test, Test C2: Reading Comprehension
(Higher Level), published by the Cooperative Test Division
of the Educational Testing Service, Los Angeles, California.
Form T was administered to both groups during the second
week of each quarter, and Form R was given to both groups
during the last week of each quarter. Scaled scores were
obtained on each of three parts of the test: vocabulary,
speed of comprehension, and level of comprehension.
Reading Growth. Table XXXII, page 123, shows the mean
gains for the control and experimental groups for vocabu
lary, speed of comprehension, and level of comprehension.
In Experiment I, the control group had slight but positive
gains on all factors measured while the experimental group
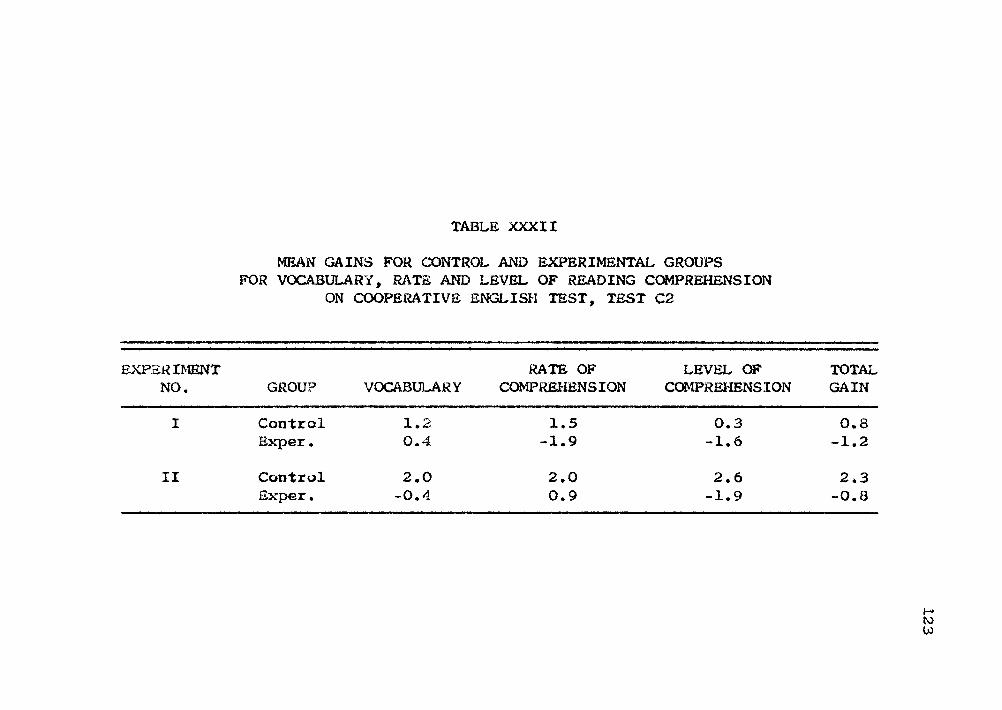
TABLE XXXII
MEAN GAINS FOR CONTROL AND EXPERIMENTAL GROUPS
FOR VOCABULARY, RATE AND LEVEL OF READING COMPREHENSIONON COOPERATIVE ENGLISH TEST, TEST C2
EXPERIMENT RATE OF LEVEL OF TOTAL
NO. GROUP VOCABULARY COMPREHENSION COMPREHENSION GAIN
I Control 1.2 1.5 0.3 0.8
Exper. 0.4 -1.9 -1.6 -1.2
II Control 2.0 2.0 2.6 2,3
Exper. -0.4 0.9 -1.9 -0.8
00
124
had decreases on all factors but vocabulary; in Experi
ment II, the control group gained on all factors measured
while the experimental group had slight losses on vocabulary
and level of reading comprehension.
Tables XXXIII and XXXIV, page 125, show the mean scores
and analysis of variance calculations, respectively, for
total reading comprehension development for the control and
experimental groups. This measurement was based upon the
mean total scaled scores of the various parts of the reading
test.
Table XXXIII shows the mean total improvement in read
ing comprehension for the control and experimental groups.
In both Experiments I and II, the control groups improved
their total reading comprehension while the experimental
groups had a slight loss in total reading comprehension.
For the combined experiments, the control groups gained
1.32 mean points while the experimental groups had a loss of
1.03 mean points.
Table XXXIV shows that the F-value of 5.54 representing
the difference between the means of the experimental and
control groups was statistically significant at the 5 per
cent level of confidence. The F-values of 0.72 and 0.26
representing the difference between the means of

125
TABLE XXXIII
TABLE OF MEANS
FOR TOTAL READING COMPREHENSION IMPROVEMENT
EXPERIMENT CONTROL EXP. MEAN OF
NO. CLASS CLASS MEANS
I 0.85 -1*11t -0.32
II 4* • +J*3 -0.80 1.53
Combined 1.32 -1.021 0.29
TABLE XXXIV
ANALYSIS Olf VARIANCE
FOR TOTAL READING COMPREHENSION IMPROVEMENT
SOURCE OF SUM OF MEAN
VARIATION SQUARES DF SQUARE p* CONCLUSION
Method 114.51 1 114.51 5.54 Sig.
Term 14.93 1 14.93 0.72 Not Sig.
Interaction 5.34 1 5.34 0.26 Not Sig.
Error 1569.76 72 20.65
Total 1704.54 75
*For 1 and 72 degrees of freedom an F-•value of 3.98 is
required for significance at the .05 level of confi-
dence and 7.01 for the .01 level.

126
Experiments I and II and the interaction variance, respec
tively, were not statistically significant.
Interpretation. In terms of reading improvement during
the training period, the control groups had significantly
greater gains in total reading comprehension than the
experimental groups. In fact, the terminal reading scores
for the experimental groups were actually lower than those
obtained at the beginning of the study. Careful study of
the data provides no defensible explanations for the gains
made by the control groups. The data suggest, however, that
controlled reading-instrument training in second-quarter
college typewriting may be a slight handicap to efficient
reading rate and comprehension as measured by a standardized
reading test. No evidence was obtained to determine if the
decreases noted for the experimental groups were of a tempo
rary or of a permanent nature.
Validity of the Gregg Production Word-Count System
Correlation coefficients were calculated in order to
determine the significance of the relationship between the
Gregg production word-count system and the gross-words-per-
minute word-count system. Table XXXV, page 127, shows the
correlation coefficient values between production~words-a-

TABLE XXXV
COEFFICIENTS OF CORRELATION BETWEEN GROSS WORDS PER MINUTE
ON LAST FIVE-MINUTE STRAIGHT-COPY TEST AND PRODUCTION WORDS A MINUTE
ON FINAL FIVE-MINUTE LETTER, TABULATION, AND ENUMERATION TESTS(Combined Experiments)
LAST 5-MINUTE STRAIGHT-COPY TEST, GWPMCORRELATED WITH:
Final 5-Minute Letter Test, PWAM
Final 5-Minute Tabulation Test, PWAM
Final 5-Minute Enumeration Test, PWAM
♦Significant at the .01 level of confidence
CONTROL EXP.
0.94^ 0.92^
0.81* 0.92*
0.92^ 0.92^

128
minute scores obtained on the final five-minute production-
copy tests of each quarter and gross-words-per-minute scores
obtained on the last five-minute straight-copy test of each
quarter. For both the control and the experimental groups,
all variables correlated were highly significant as the
r-values were beyond the 1 per cent level of confidence.
Interpretation. The data tend to suggest that produc
tion words a minute is a valid word-count system for equat
ing straight-copy timed writings and production-copy tests.
It would appear that the Gregg production word-count system
can be used most effectively in establishing identical
achievement goals, or grading standards, for all kinds of
typewritten copy.
Summary
The t-test was used to measure the significance of the
difference between the means of the control and experimental
groups on initial and final speed and accuracy performance
on five-minute straight-copy tests. The t-test calculations
do not show a statistically significant pre-training or
post-training superiority of one group over the other on
either stroking-rate ability or accuracy ability.
129
The F-test, or variance ratio, was used to measure the
significance of the difference between the means of the con
trol and experimental groups on thirteen different measure
ments. Table XXXVI, page 130, contains a summary of the
means, F-values, and degrees of freedom for the control and
experimental groups for these various measurements. Among
the thirteen variables, only two show a statistically sig
nificant difference between the means of the two groups.
Correlation coefficients were computed in order to
determine the significance of the relationship between the
Gregg production word-count system and the gross-words-per-
minute word-count system. Since all relationships corre
lated were significant at the 1 per cent level of confi
dence, it was suggested that production words a minute is a
valid word-count system for equating straight-copy timed
writings and production-copy tests.
Chapter V presents a general summary of the study, the
conclusions, and the recommendations for further research.

130
TABLE XXXVI
SUMMARY OF MEANS, F-VALUSS, AND DEGREES OF FREEDOMFOR THE CONTROL AND EXPERIMENTAL GROUPS
ON THIRTEEN DIFFERENT VARIATIONS
VARIABLE
Last 5-Min. Timing--GWPM
Last 5-Min. Timing--Errors
Speed Improvement A
Speed Improvement B
Consistency
Avg. Production Drill
Final Letter—PWAM
Final Letter--Errors
Final Tabulation--PWAM
Final Tabulation—Errors
Final Enumeration—PWAM
Final Enumeration--Errors
CON. EXP. DF
56.11 61.23 2.8713 1 & 73
4.42 3.69 0.4353 1 & 73
9.63 11.59 3.1175 1 & 73
11.42 11.64 0.3948 1 & 73
2.11 3.49 3.1536 1 & 73
85.55 110.68 3.6618 1 & 73
51.45 55.00 1.1972 1 & 73
4.03 3.56 0.7285 1 & 73
50.68 57.10 4.0704^ 1 & 73
4.97 4.51 0.4508 1 & 73
51.32 54.92 1.3674 1 & 73
3.68 3.00 2.4272 1 & 73
Total Reading ComprehensionImprovement 1.32 •1.03 5.5439 1 & 72
♦Significant at the .05 level of confidence

131
CHAPTER V
SUMMARY, CONCLUSIONS, AND RECOMMENDATIONS
Summary
As schools are under pressure to compress nonacademic
programs, the time required to learn basic typewriting skill
needs to be reduced; and the instructional practices and
procedures need to be improved. Studies in reading improve
ment have indicated that techniques designed to train eye
movements are effective, by certain criteria, in accelerat
ing the learning process. A need exists, then, to determine
the effectiveness of controlled reading-rate practice tech
niques in the learning of typewriting and related skill sub
jects.
The Problem
The primary purpose of this study was to determine the
effectiveness of the Skill-Builder Controlled Reader as a
learning aid in the teaching of second-quarter college type
writing. The study was performed to determine whether stu
dents receiving Skill-Builder Controlled Reader training in
intermediate college typewriting would attain higher rates
132
of speed and/or better accuracy on straight-copy timings and
production-type problems than students not receiving con
trolled reading-instrument training. A secondary purpose of
this study was to determine the effect of Skill-Builder
Controlled Reader training on the students' rate and level
of reading comprehension based on a standardized reading
test. Another purpose of this study was to determine the
significance of the relationship between the Gregg produc
tion word-count system and the gross-words-per-minute word-
count system.
Review of Related Research
Many experiments have been carried out in the field of
reading improvement to determine the relative efficiency of
different techniques of teaching reading with a variety of
controlled reading devices. In general, the results of
these experiments have indicated that mechanically con
trolled forms of training are effective in increasing speed
of reading without decreasing comprehension if training is
undertaken with determination and persistence. A number of
reading specialists, however, have questioned the usefulness
of mechanical devices in increasing rate of reading compre
hension.
133
Although controlled reading-instrument training is
still in its infancy in the field of business education,
there is some evidence available that suggests that mechani
cally controlled forms of training will improve basic skills
in the initial stages of learning to typewrite.
Procedures
This experiment was conducted in the second-quarter
typewriting classes at Oregon State University during the
winter quarter and repeated during the spring quarter of the
1960-1961 school year. Participating in the experiment were
77 students from the major schools and classes on the cam
pus. For each quarter, students enrolling in second-quarter
typewriting were assigned during registration to either a
control or an experimental class by the coin-selection
method of random sampling.
From day to day, both the control and experimental
classes used the same textbooks and supplementary materials
and the same electric typewriters and classroom facilities.
The writer administered identical assignments in all
classes. The only difference between the teaching proce
dures used in the control and experimental classes was the
presentation of approximately ten minutes of Skill-Builder
134
Controlled Reader materials to the students in the experi
mental classes three days a week for seven weeks. On
instrument-training days, the control classes typed for a
period of ten minutes from duplicated sheets containing the
same filmstrip copy used in the experimental classes. The
experimental classes were divided into three ability groups
and instrument-training drills were projected for each
ability group at gradually increasing speeds commensurate
with the group's key-stroking ability. Ability grouping was
not used in the control classes.
Periodic measurements were made of the students'
ability to reproduce straight-copy and production-copy mate
rial under timing. Thirteen different measurements, includ
ing a reading test, were used to evaluate the students'
performance.
Findings
Initial and Final Speed Status. In both Experiments I
and II, the experimental groups had higher initial stroking-
rate means on five-minute straight-copy material than the
control groups. The differences between the means of the
two groups for Experiments I and II were 5.48 and 1.37 gross
words per minute, respectively. The t-test values showed

135
that these differences were not statistically significant.
At the end of the experiment, in both quarters, the
experimental groups retained their stroking-rate superiority
on five-minute straight-copy material. The differences
between the means of the control and experimental groups for
Experiments I and II were 4.79 and 5.30 gross words per min
ute, respectively. The t-test values showed that these dif
ferences were not statistically significant.
Initial and Final Accuracy Status. In Experiment I,
the experimental group demonstrated an ability to type more
accurately than the control group on initial and final five-
minute straight-copy writings. The difference between the
means of the two groups on the initial test was 3.17 total
errors; on the final test, 1.22 total errors. The t-test
values showed that these differences were not statistically
significant.
In Experiment II, the control group held an initial and
final accuracy advantage of 0.28 and 0.30 total errors,
respectively. These differences favoring the control group
were not statistically significant.
Speed and Accuracy Performance on Straight Copy. Six
different measurements were employed to determine the speed
and accuracy performances of the control and experimental
136
groups on straight-copy material. These measurements were:
1. Gross words per minute on the last five-minute
straight-copy test.
2. Total errors on the last five-minute straight-copy
test.
3. Speed Improvement A — This measurement represented
the difference between a student's adjusted basic rate,
based upon five-minute straight-copy writings given at the
beginning of the quarter, and his average net score on the
three best five-minute straight-copy writings administered
throughout the quarter.
4. Speed Improvement B — This measurement represented
the difference between a student's average initial and aver
age terminal gross stroking-rate performance on five-minute
straight-copy writings.
5. Consistency -- This measurement was based upon the
total number of five-minute straight-copy writings given
throughout the quarter that contained two or fewer type
writing errors.
6. Production Drills — This measurement combined
stroking-rate ability and consistent accuracy performance
and was based upon the average score on four seven-minute
straight-copy writings given throughout the quarter.

137
The F-test, or variance ratio, was used to measure the
significance of the difference between the means of the con
trol and experimental groups on each of the six straight-
copy measurements. In general, the mean performance scores
on the straight-copy measurements favored the experimental
groups over the control groups. The analysis of variance
calculations, however, showed that the differences between
the mean scores for the two groups on all straight-copy
measurements were not statistically significant.
Speed and Accuracy Performance on Production Copy. Six
different measurements were employed to determine the speed
and accuracy performances of the control and experimental
groups on production-type activities. These measurements
were:
1. Production words a minute on the last five-minute
letter test.
2. Total errors on the last five-minute letter test.
3. Production words a minute on the last five-minute
tabulation test.
4. Total errors on the last five-minute tabulation
test.

133
5. Production words a minute on the last five-minute
enumeration test.
6. Total errors on the last five-minute enumeration
test.
The mean scores on all production-copy measurements
favored the experimental groups over the control groups.
The F-test value for the difference between the means of the
two groups on the final tabulation test was significant at
the 5 per cent level of confidence. The analysis of vari
ance calculations for the other production-copy variations,
however, showed no significant difference between the mean
scores of the control and experimental groups.
Reading Rate and Comprehension Development. To deter
mine the effect of controlled reading-instrument training on
the students' rate and level of reading comprehension, pre-
training and post-training scores were obtained from the
control and experimental groups by using two equivalent
forms of the Cooperative English Test, Test C2: Reading
Comprehension (Higher Level). In both Experiments I and II,
the control groups improved their rate and level of reading
comprehension while the experimental groups showed a slight
loss in both reading factors. For the combined experiments,
the control groups gained 1.32 mean points while the

139
experimental groups had a loss of 1.03 mean points. The
F-test was used to measure the significance of the differ
ence between the means of the two groups. The results were
significant at the 5 per cent level of confidence.
Validity of the Gregg Production Word-Count System. To
determine the significance of the relationship between gross
words per minute and production words a minute, the mean
gross-words-per-minute scores on the final five-minute
straight-copy test were compared with the mean production-
words-a-minute scores on the final five-minute letter test,
the final five-minute tabulation test, and the final five-
minute enumeration test for both the control and experi
mental groups. The values of rho for all variables corre
lated were statistically significant at the 1 per cent level
of confidence.
Conclusions
The prime purpose of this study was to determine the
effectiveness of controlled reading-instrument training in
the development of speed and accuracy skills in second-
quarter college typewriting. The curiosity underlying this
concern about the relative efficiency of reading-instrument
training in intermediate typewriting resulted from a careful

140
study of earlier investigations in the field of business
education which indicated that significant speed and accu
racy skills were obtained in beginning typewriting classes
through the use of controlled reading devices. As a result
of this study, therefore, new evidence has been assembled
for use in pointing the way to a better understanding and
appreciation of the application of controlled reading-rate
practice techniques to the total scope of typewriting
instruction.
A secondary purpose of this study was to measure the
effect of controlled reading-instrument training on the
typists' rate and level of reading comprehension. A third
purpose was to measure the relationship between selected
word-count scoring systems used in this study.
This study, then, has resulted in the compilation of
data dealing with many facets of second-quarter college
typewriting. The conclusions that seem probable in the
light of the evidence gathered are as follows:
1. Controlled reading-instrument training does not
significantly affect the students' skill development in key
stroking speed on straight-copy writings and on production-
copy problems in second-quarter college typewriting. It was
hypothesized that Skill-Builder Controlled Reader training

141
would result in significantly greater gross speed gains when
compared with training procedures not utilizing the reading
instrument as a supplement to the teacher's instruction.
Since only one of six different straight-copy and
production-copy measurements showed a statistically signifi-•
cant difference between the mean stroking-rate scores of the
control and experimental groups, Hypothesis I was rejected.
2. Controlled reading-instrument training does not
significantly affect the students' skill development in
accuracy of copy reproduction on straight-copy writings and
production-copy problems in second-quarter college type
writing. It was hypothesized that Skill-Builder Controlled
Reader training would result in significant accuracy
improvement when compared with training procedures not uti
lizing the reading instrument as a supplement to the
teacher's instruction. Since none of the six different
straight-copy and production-copy measurements showed a sta
tistically significant difference between the mean accuracy
scores of the control and experimental groups, Hypothesis II
was rejected.
3. Controlled reading-instrument training tends to
impede, at least temporarily, the typists' rate and level of
reading comprehension. It was hypothesized that

142
Skill-Builder Controlled Reader training would improve the
students' rate and level of reading comprehension. Since
the control groups had a slight gain in rate and level of
reading comprehension and the experimental groups, a slight
decrease, Hypothesis III was rejected.
4. Production words a minute appears to be a valid
word-count method for equating straight-copy writings and
production-copy writings. Gross-words-a-minute scores were
computed for three different types of end-of-quarter, five-
minute production-copy tests, using the Gregg production
word-count system; the production-test scores were then cor
related with the gross-words-per-minute scores obtained on
end-of-quarter, five-minute straight-copy writings. All
correlation coefficients were significant at the 1 per cent
level of confidence. These statistical results tend to sug
gest that production words a minute can be used effectively
in establishing a single set of achievement goals, or stand
ards, for all kinds of typewritten copy.
Recommendations
While this study revealed that controlled reading-rate
practice techniques are no more effective in the development
of speed and accuracy on straight-copy writings and
143
production-copy problems in second-quarter college type
writing than training procedures not utilizing the reading
instrument as a supplement to the teacher's instruction, the
reader must be ever mindful of the limitations under which
the study was conducted. The value of the findings is
limited to some extent by the fact that the filmstrip copy
used in this study was not correlated with the typewriting
textbooks and supplementary materials used for daily prac
tice and ski11-building purposes. A further limitation of
this study resulted from a lack of follow-up data to deter
mine if reading-instrument training had any long-term
effect. Furthermore, this study was confined to a specific
phase and level of skill development; namely, second-
quarter, or intermediate, college typewriting.
The results of this study, therefore, must be con
sidered as applicable only to the population with which the
writer worked, and any generalizations made for other groups
must be changed to the extent that the other populations
vary from the characteristics of the writer's groups. The
reader is not likely to be seriously in error, however, if
he interprets the results of this study as being generally
applicable to intermediate typewriting at both the secondary
and college levels of instruction.
144
The writer was aware that the procedures used in the
solution of the specific problems investigated did not cover
all aspects of instrument training and that further research
was needed to fill the gaps. The following recommendations
for the kinds of needed research on the use of controlled
reading-rate practice techniques in typewriting and related
skill subjects, then, have grown out of this experiment:
1. The reading-instrument training program should be
extended from the keyboard-introduction phase of learning
typewriting through the intermediate and more advanced
stages of skill development. Such an investigation should
attempt to determine the relative effectiveness of con
trolled reading-instrument training at all levels and stages
of typewriting instruction.
2. There seems to be a need for additional experiments
to determine the most effective procedures and techniques of
reading-instrument training in the typewriting instructional
program. Some of the considerations that seem to merit
investigation at this time are: types of filmstrip mate
rials best adapted to typewriting skill development, number
and length of training sessions to be employed, most effec
tive projection speeds for the different stages of skill
development, and most effective room arrangement.
145
3. A study should be conducted to determine the opti
mum number of ability groups that can be effectively
employed in all phases of a reading-instrument training pro
gram. Such an investigation should also attempt to deter
mine the effect of mechanical forms of training on the
various ability groups. It was observed in the present
study, for example, that the speed and accuracy gains for
the three ability groups showed a highly similar pattern of
growth development throughout the training period. Further
information along these lines should help place the concept
of ability grouping in its proper perspective as related to
controlled reading-rate practice techniques in typewriting.
4. In view of the negative evidence presented in this
study regarding the effect of reading-instrument training on
the students' reading rate and comprehension scores, there
is a definite need for further research data in this area at
all levels of typewriting instruction. Pre-training and
post-training reading test scores would provide reliable
data on the immediate effects of such training procedures;
follow-up measurements, after cessation of training, would
provide much needed evidence regarding the permanency of the
reading rate and comprehension changes found in this study.
Such an investigation might also be expanded to include
146
photographic records of eye movements, assuming that the
eye-movement camera actually produces a true picture of the
reading habits of the subject. This instrument provides a
record of the number of fixations and the number of regres
sions for the subject as well as a record of his speed of
reading. These eye-movement-camera scores should then be
compared statistically with the reading comprehension test
scores and the typewriting performance scores in order to
evaluate objectively reading-instrument training as related
to significant factors in reading improvement.
5. There seems to be a need for additional experiments
to determine the relative combined effectiveness of con
trolled reading-instrument training and tachistoscopic
training at all levels and stages of typewriting instruc
tion. As pointed out in Chapter II of this study, investi
gations by Winger and Palmer have indicated that the use of
tachistoscopic training in beginning typewriting resulted in
significantly superior speed and accuracy performance when
compared with training procedures not using the tachisto
scope; and Kline found that the Skill-Builder Controlled
Reader was an effective speed-forcing and control-building
device in beginning typewriting. What would be the results,
then, if combined tachistoscopic and reading-instrument

147
procedures were employed throughout the typewriting instruc
tional program? Investigators might consider setting up one
group of subjects using both types of reading devices, a
second group using only the tachistoscope, a third group
using only the Skill-Builder Controlled Reader, and a fourth
group that would receive typewriting instruction without any
mechanical device. A statistical comparison of the differ
ences between the means of the groups on various types of
straight-copy and production-copy measurements would provide
much needed information regarding the value of mechanical
forms of training in typewriting.
6. It is also recommended that controlled reading-
instrument training be adapted to formal experimentation in
shorthand, transcription, business machines, bookkeeping,
and other areas in the business education program at both
the secondary and college levels of instruction. Some
informal research studies by classroom business teachers
have been made in these areas, but nothing basic has
resulted from these beginnings at the present time.
148
BIBLIOGRAPHY
1. Anderson, Irving H. and Walter F. Dearborn. The psychology of teaching reading. New York, Ronald Press,1952. 382 p.
2. Anderson, J. A. Seventh-grade reading program. Bulletin of the National Association of Secondary-School
Principals 41:172-177. Feb. 1957.
3. Barber, Shirley. An experimental study in teachingshorthand using the tachistoscope. Ed. D. thesis.Greeley, Colorado State College, 1961. 103 numb,
leaves.
4. Barnette, Gaspar Cisneros. Learning through seeing withtachistoscopic teaching techniques. Dubuque, Wm. C.Brown, 1951. 145 p.
5. Bell, Kathryn and Ruth Batchelor. Two successful newvisual aids. Business Teacher 32:3. March 1955.
6. Buswell, Guy Thomas, Fundamental reading habits: astudy of their development. Chicago, University ofChicago, 1922. 150 p.
7. Butsch, R. L. C. Eye movements and the eye-hand span intypewriting. Journal of Educational Psychology 23:104-121. Feb. 1932.
8. Center, Stella S. and Gladys L. Persons. Teaching high-school students to read. New York, D. Appleton-Century,1937. 167 p.
9. Conant, James B. The American high school today.New York, McGraw-Hill, 1959. 140 p.
10. Cook, Fred S. Wanted! A modern business education curriculum. Business Education Forum 14:21-22. Jan. 1960.

149
11. Dearborn, Walter F. and S. Vincent Wilking. Improvingthe reading of college freshmen. School Review 49:668-678. Nov. 1941.
12. Denny, Paul. Instrument training at Chico StateCollege. Huntington, New York, Educational Developmental Laboratories, n.d. 4 p. (Business EducationNewsletter no. 3)
13. Dvorak, August et. al. Typewriting behavior. NewYork, American Book, 1936. 521 p.
14. Educational Developmental Laboratories. Successfulreading and study skills program. Huntington, NewYork, n.d. 4 p. (Business Education Newsletterno. 17)
15. Fedorczyk, Viola S. Providing for individual differences in typewriting through instrument training.American Business Education 17:82-85, Dec. 1960.
16. Fuller, Donald C. Reading for typewriting. Pt. 1.Journal of Business Education 19:19-21. Sept. 1943.
17. Fuller, Donald C. Reading for typewriting. Pt. 3.Journal of Business Education 19:11-12. Nov. 1943.
18. Glock, M. D. The effect upon eye-movements and readingrate at the college level of three methods of training.Journal of Educational Psychology 40:93-106. Feb.1949.
19. Hamilton, George E. Tachistoscopes and their use. In:Oscar S. Causey's The reading teacher's reader. NewYork, Ronald Press, 1958. p. 314-320.
20. Imus, Henry A. et. al. An evaluation of visual factorsin reading. Hanover, Dartmouth College Publications,1938. 144 p.
21. Kemp, J. Ralph. One remedy for reading problems.Educational Screen and Audiovisual Guide 38:474-475.
Sept. 1959.

150
22. Kilthau, Margaret D. Reading tools that "flash" and"speed." Teaching Tools 2:60-62. Winter 1954-55.
23. Kline, Randall Miller. A study to determine the effectiveness of the use of the skill-builder controlledreader as an instructional device in developing speedand accuracy in beginning typewriting at the secondarylevel. Ph. D. thesis. Columbus, The Ohio StateUniversity, 1961. 193 numb, leaves. (Microfilm)
24. Leslie, Louis A. Methods of teaching Gregg shorthand.New York, Gregg, 1953. 497 p.
25. Li, Jerome C. R. Introduction to statistical inference. Ann Arbor, Edward Brothers, 1957. 553 p.
26. Lloyd, Alan C. The changing pattern of typewritingcourses. Business Education Forum 16:16-18. Nov.1961.
27. Lloyd, Alan C. Now, production words a minute.Business Teacher 39:31. Nov. 1961.
28. Lloyd, Alan C., John L. Rowe and Fred E. Winger. Greggtypewriting for colleges. Intensive course. New York,Gregg, 1957. 218 p.
29. Lloyd, Alan C, John L. Rowe and Fred E. Winger. Workbook I for Gregg typing for colleges. New York, Gregg,1957. 96 p.
30. Palmer, Harold Oscar. Tachistoscopic training forbeginning typing students in a secondary school.Ed. D. thesis. Corvallis, Oregon State College, 1955.94 numb, leaves.
31. Ruegg, Robert J. Skill building through readinginstruments. Business Education Forum 14:17-20. Jan.1960.
32. Sheldon, William D. Influences upon reading instruction in the United States. Syracuse, SyracuseUniversity Press, 1961. 67 p.

151
33. Silberman, Charles E. The remaking of American education. Fortune 63:125-131. April 1961.
34. Spache, George D. Psychological explanations of reading. In: Oscar S. Causey's The reading teacher'sreader. New York, Ronald Press, 1958. p. 9-14.
35. Steinhope, Andrew W. Times have changed. Huntington,New York, Educational Developmental Laboratories, n.d.7 p. (Business Education Report no. 6)
36. Strang, Ruth. Problems in the improvement of readingin high school and college. Rev. ed. Lancaster,Science Press, 1940. 423 p.
37. Taylor, Earl A. Controlled reading: A correlation ofdiagnostic, teaching, and corrective techniques.Chicago, University of Chicago Press, 1937. 367 p.
38. Taylor, Stanford E. and Helen Frackenpohl. Controlledreader techniques. 3d ed. Huntington, New York,Educational Developmental Laboratories, 1958. 94 p.
39. Tedesco, Pauline. Team teaching in typing. Journal ofBusiness Education 38:10-11. Oct. 1962.
40. Traxler, Arthur E. Value of controlled reading: Summary of opinion and research. Journal of ExperimentalEducation 11:280-292. June 1943.
41. Trump, J. Lloyd. New directions to quality education.Washington, National Association of Secondary-SchoolPrincipals, n.d. 14 p.
42. Wedeen, Shirley Ullman. Mechanical versus non-mechanical reading techniques for college freshmen.School and Society 79:121-123. April 1954.
43. Winger, Fred E. The determination of the significanceof tachistoscopic training in xvord perception asapplied to beginning typewriting instruction. Ed. D.thesis. Eugene, University of Oregon, 1951. 166 numb,leaves.

152
44. Winger, F. E. Tailored timings. Portland, Allied,1955. 48 p.
45. Witty, Paul and David Kopel. Reading and the educativeprocess. Boston, Ginn, 1939. 374 p.
46. Wooster, George F. An experimental study of thereading-rate controller. Journal of EducationalPsychology 45:421-426. Nov. 1954.

APPENDICES
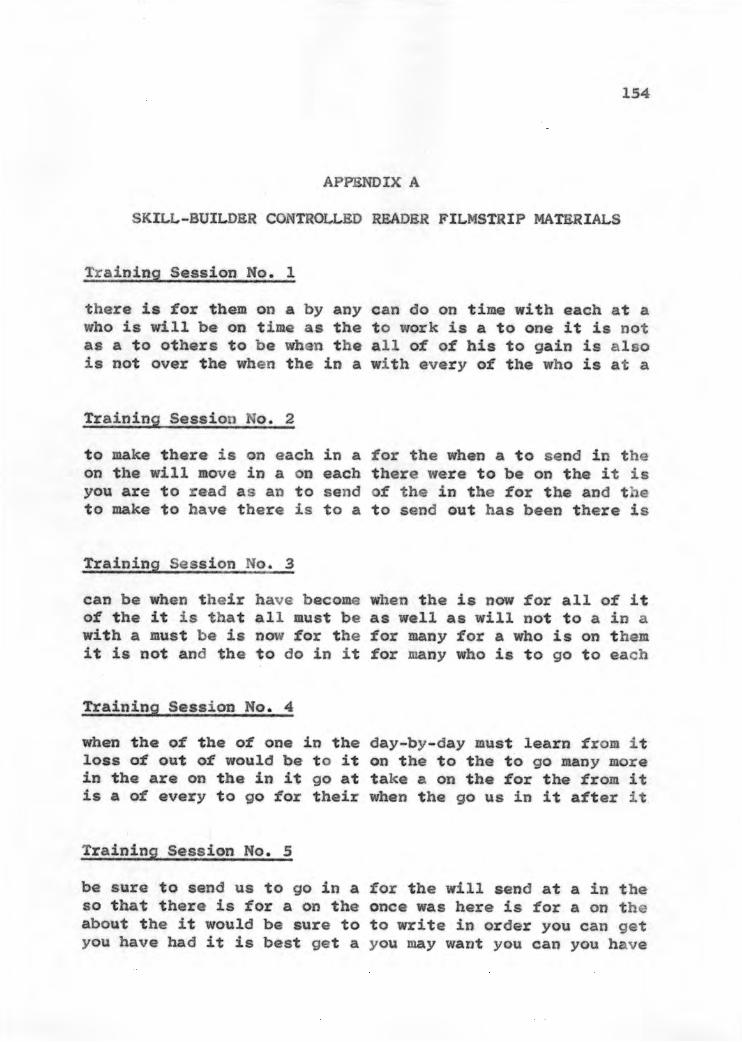
154
APPENDIX A
SKILL-BUILDER CONTROLLED READER FILMSTRIP MATERIALS
Training Session No. 1
there is for them on a by any can do on time with each at awho is will be on time as the to work is a to one it is not
as a to others to be whan the all of of his to gain is alsois not over the when the in a with every of the who is at a
Training Session No. 2
to make there is on each in a for the when a to send in the
on the will move in a on each there were to be on the it is
you are to read as an to send of the in the for the and the
to make to have there is to a to send out has been there is
Training Session No. 3
can be when their have become when the is now for all of it
of the it is that all must be as well as will not to a in a
with a must be is now for the for many for a who is on themit is not and the to do in it for many who is to go to each
Training Session No. 4
when the of the of one in the day-by-day must learn from itloss of out of would be to it on the to the to go many morein the are on the in it go at take a on the for the from itis a of every to go for their when the go us in it after it
Training Session No. 5
be sure to send us to go in a for the will send at a in theso that there is for a on the once was here is for a on the
about the it would be sure to to write in order you can getyou have had it is best get a you may want you can you have
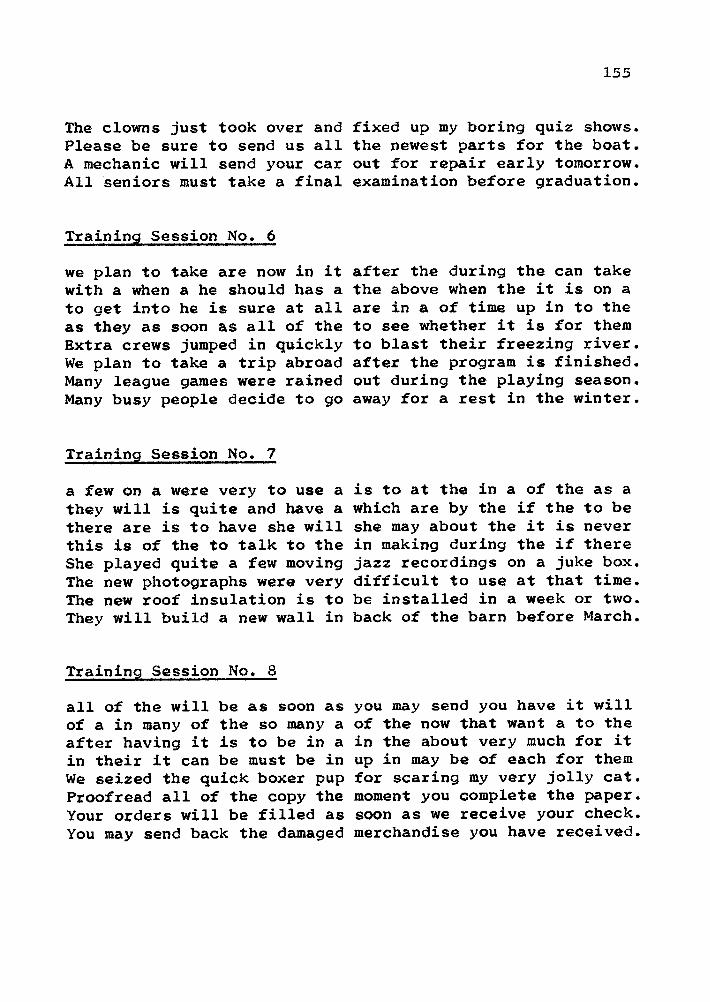
155
The clowns just took over and fixed up my boring quiz shows,Please be sure to send us all the newest parts for the boat,A mechanic will send your car out for repair early tomorrow.All seniors must take a final examination before graduation.
Training Session No. 6
we plan to take are now in itwith a when a he should has a
to get into he is sure at allas they as soon as all of theExtra crews jumped in quicklyWe plan to take a trip abroadMany league games were rainedMany busy people decide to go
Training Session No. 7
a few on a were very to use a
they will is quite and have athere are is to have she will
this is of the to talk to the
She played quite a few movingThe new photographs were veryThe new roof insulation is to
They will build a new wall in
Training Session No. 8
all of the will be as soon as
of a in many of the so many aafter having it is to be in ain their it can be must be in
We seized the quick boxer pupProofread all of the copy theYour orders will be filled as
You may send back the damaged
after the during the can takethe above when the it is on a
are in a of time up in to theto see whether it is for them
to blast their freezing river,after the program is finished,out during the playing season.away for a rest in the winter.
is to at the in a of the as a
which are by the if the to be
she may about the it is neverin making during the if therejazz recordings on a juke box.difficult to use at that time,
be installed in a week or two.
back of the barn before March,
you may send you have it willof the now that want a to the
in the about very much for itup in may be of each for themfor scaring my very jolly cat.
moment you complete the paper.soon as we receive your check,
merchandise you have received.
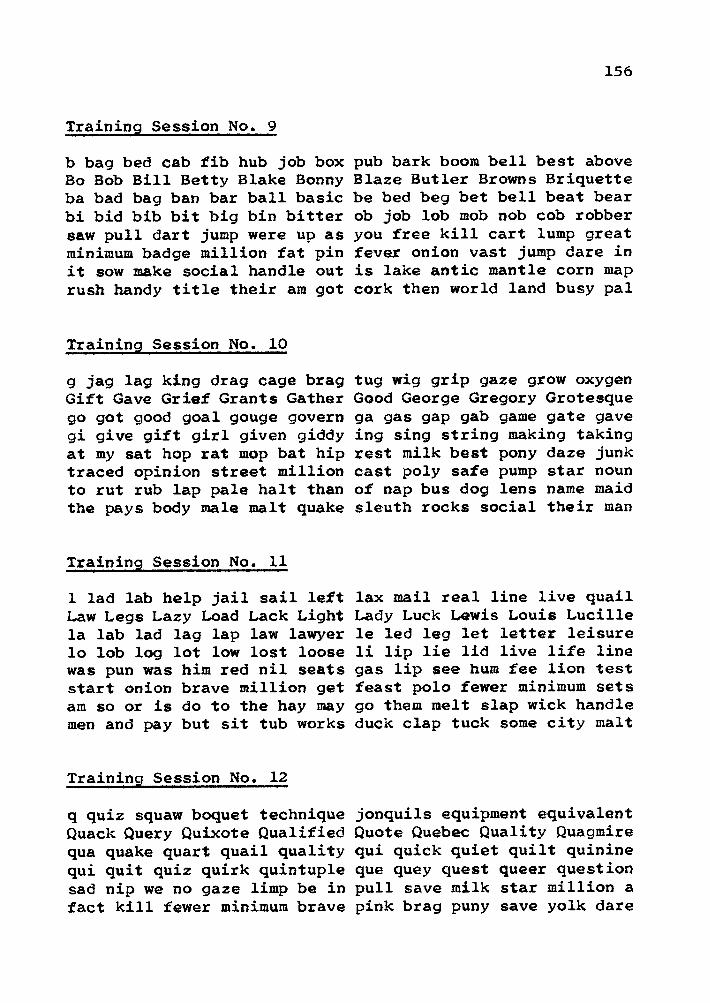
156
Training Session No. 9
b bag bed cab fib hub job box pub bark boom bell best aboveBo Bob Bill Betty Blake Bonny Blaze Butler Browns Briquetteba bad bag ban bar ball basic be bed beg bet bell beat bearbi bid bib bit big bin bitter ob job lob mob nob cob robbersaw pull dart jump were up as you free kill cart lump greatminimum badge million fat pin fever onion vast jump dare init sow make social handle out is lake antic mantle corn map
rush handy title their am got cork then world land busy pal
Training Session No. 10
g jag lag king drag cage brag tug wig grip gaze grow oxygenGift Gave Grief Grants Gather Good George Gregory Grotesque
go got good goal gouge govern ga gas gap gab game gate gavegi give gift girl given giddy ing sing string making takingat my sat hop rat mop bat hip rest milk best pony daze junktraced opinion street million cast poly safe pump star nounto rut rub lap pale halt than of nap bus dog lens name maidthe pays body male malt quake sleuth rocks social their man
Training Session No. 11
1 lad lab help jail sail left lax mail real line live quailLaw Legs Lazy Load Lack Light Lady Luck Lewis Louis Lucillela lab lad lag lap law lawyer le led leg let letter leisurelo lob log lot low lost loose li lip lie lid live life linewas pun was him red nil seats gas lip see hum fee lion teststart onion brave million get feast polo fewer minimum setsam so or is do to the hay may go them melt slap wick handlemen and pay but sit tub works duck clap tuck some city malt
Training Session No. 12
q quiz squaw boquet technique jonquils equipment equivalentQuack Query Quixote Qualified Quote Quebec Quality Quagmirequa quake quart quail quality qui quick quiet quilt quininequi quit quiz quirk quintuple que quey quest queer questionsad nip we no gaze limp be in pull save milk star million afact kill fewer minimum brave pink brag puny save yolk dare

157
it is to for the men bit with melt down with pale male handtitle handy quake social work height handle antic mantle do
Training Session No. 13
c cab cave excel quick advice cow cast came buck arch ejectCap Czar Cafe Cage City Cathy Can Carl Could Course Capitolca can cat cad care call came cu cub cup cut cube cuff cureco cog cot cod core come coal ack tack back lack pack trackabbey accept agreed apple all annual applaud assort appliedbook brood banner battle bill baffle business button buzzer
cook carry cheer collect call careen carriage carry cartoonaffix attract call bell afoot address alley butter admitted
Training Session No. 14
h him how josh hangar exhibit hay habit authorize techniqueHot Half Have Holland Houston Hog Hock Howard Hopper Heaven
ha had ham has hat have halve hi him hid his hit high hingeho hob hod hog hop hole horse he hen hep her hex heed hedgedroll depress dazzle darkness error essay express effectivefall free ferret fluffy flood good glass gross greed gigglehill hood happy hurrah huddle huffy discuss encompass doorsdeep glossy flitter difficult gloom engross feeble embossed
Training Session No. 15
m mob mow come modern muffler mix moth jump some move amazeMight Monkey Montana Mosquito Mast Mary Mildred Mississippima mad map mat may made marsh me men meet mean mess measuremi mit milk mile minor middle mo mob mom mop mow most motorinn illegal imminent immature jeep juggle justness jettisonkill keep knee knotty kittens lettuce lessee lesson lookingmanner message mellow merrily misspell loopholes irregularsmoon less infallible keenness indeed lattice morass muffler
Training Session No. 16
r rag rib wire crux from rich run rid rip real query rejectRose Rack Ride River Richards Reed Rhode Randolph Rochester

ra race rack rail rate ratify
ri ride ring riot right rigidneed noon nutty napper narrow
proceed paddle puzzle patternroof ruddy referred repossessquill pass root need occupied
Training Session No. 17
d sad bad had dog made duplexDan Day Dark Daze Date Donald
ad cad had mad made bade fade
di die dig did dial diet dirtit at on of go by is no to bewere with this them your theyThey were for it all the way.They have had the best times.
Training Session No. 18
i in oil him fig bid aim fireIvy Ike Irvin Italy Inductionin into inch incline increase
im impart immediate importantby to be of in as on go or itwith take fine many will they
Take the girl with you today.By now, they will be at home.
Training Session No. 19
n gun sun need junk lone mineNow Nab Nap New Nan Next Norana nab nag nap nail name navyni nip nine nice nick nightlyto it do is we us of on if so
show when will have take your
It is the way to do the show.Take us to your best leaders.
158
re red read rest real retreat
ru rug run rut rush rust rung
occur office occupant opposedqueer queen quarrel quizzicalrubber nozzle necessity offerrattle pull press motto poppy
fade jade quad void card dawnDennis Daniel Dorothy Doloresde deal deaf deed deep decented bed led red seed discarded
for the not all day had theirhave time also what will veryOn this day, she will not go.It is their way to the party.
pie via quiz jive wise exciteI Iowa Idaho Indiana Illinois
id idea idle idol ideal idiom
it fit pit sit bit hit permitthe you are now can for thereis got girl home today should
There are many fine counties.You and I should be in on it.
run vine zany funny techniqueNorth Nevada Nucleus Nebraska
ne new net need never neither
no not noon nose notch notary
the for the his the our their
help been best with help haveWhen will we have the winner?
Have they been of help to us?

159
Training Session No. 20
s saw sob sad safe sack quest sap rest vest just slim existSag Son She Sit Sun Say Seize Sam Suzy Smith Sunday Satisfysa say sad sap sat saw safety se sea see set sell seat sendsh she shop shall sheet shelf si sip sit side sixth sincerewe is in to on of no or if it can way not are the say where
will very good goal mail find take post they from date doneWe cannot find a better goal. Our new picture is very good.The women are not in the way. Take the mail to the postman.
Training Session No. 21
y bay may stay lazy very play yes jelly funny query anxietyYawn Yoke Yield Yacht Yardage You York Yank Young Yesterdayya yaw yap yam yard yawn yarn ye yes yelp year yeast yellowyo you your yours youth young ye yew yearn yeoman yesterdaybe by if it in is to of on we are the not see her you latershow them will know fine same going after former onto threeIt is in a chapter by itself. We are not going to the show.You and I will see her later. If you know, it will be fine.
Note: The preceding filmstrip selections came from theTyping-Skill Development Course, a 25-filmstrip, 75-lessoncourse developed by the Educational Developmental Laboratories, Inc., Huntington, New York.
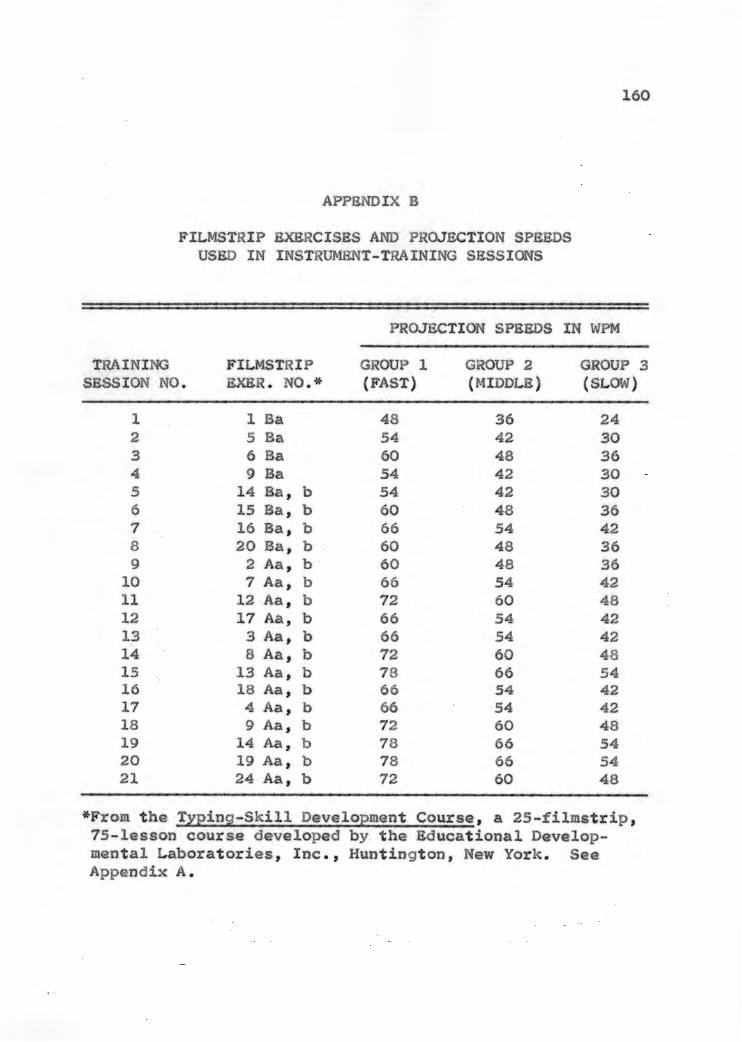
APPENDIX B
FILMSTRIP EXERCISES AND PROJECTION SPEEDS
USED IN INSTRUMENT-TRAINING SESSIONS
160
FILMSTRIP
PROJECTION SPEEDS IN WPM
TRAINING GROUP 1 GROUP 2 GROUP 3
SESSION NO. EXER. NO.* (FAST) (MIDDLE) (SLOW)
1 1 Ba 48 36 24
2 5 Ba 54 42 30
3 6 Ba 60 48 36
4 9 Ba 54 42 30
5 14 Ba, b 54 42 30
6 15 Ba, D 60 48 36
7 16 Ba, b 66 54 42
8 20 Ba, b 60 48 36
9 2 Aa, b 60 48 36
10 7 Aa, b 66 54 42
11 12 Aa, b 72 60 48
12 17 Aa, b 66 54 42
13 3 Aa, b 66 54 42
14 8 Aa, b 72 60 48
15 13 Aa, b 78 66 54
16 18 Aa, b 66 54 42
17 4 Aa, b 66 54 42
18 9 Aa, b 72 60 48
19 14 Aa, b 78 66 54
20 19 Aa, b 78 66 54
21 24 Aa, b 72 60 48
*From the Typing-Skill Development Course, a 25-filmstrip,75-lesson course developed by the Educational Developmental Laboratories, Inc., Huntington, New York. SeeAppendix A.