Embed Size (px)
Citation preview
FACTORS INFLUENCING MATERIAL REMOVAL AND SIJRFACE FINISH OFTIIE POLISHING OF SILICA GLASSES
by
Alan Claude Landis
A thesis submitted to the faculty ofThe University of North Carolina at Charlotte
in partial fulfillment of the requirementsfor the degree of Master of Science in theDepartment of Mechanical Engineering
Charlotte
2006
Approved by:
Report Documentation Page Form ApprovedOMB No. 0704-0188
Public reporting burden for the collection of information is estimated to average 1 hour per response, including the time for reviewing instructions, searching existing data sources, gathering andmaintaining the data needed, and completing and reviewing the collection of information. Send comments regarding this burden estimate or any other aspect of this collection of information,including suggestions for reducing this burden, to Washington Headquarters Services, Directorate for Information Operations and Reports, 1215 Jefferson Davis Highway, Suite 1204, ArlingtonVA 22202-4302. Respondents should be aware that notwithstanding any other provision of law, no person shall be subject to a penalty for failing to comply with a collection of information if itdoes not display a currently valid OMB control number.
1. REPORT DATE 28 FEB 2007
2. REPORT TYPE N/A
3. DATES COVERED
4. TITLE AND SUBTITLE Factors Influencing Material Removal And Surface Finish Of ThePolishing Of Silica Glasses
5a. CONTRACT NUMBER
5b. GRANT NUMBER
5c. PROGRAM ELEMENT NUMBER
6. AUTHOR(S) 5d. PROJECT NUMBER
5e. TASK NUMBER
5f. WORK UNIT NUMBER
7. PERFORMING ORGANIZATION NAME(S) AND ADDRESS(ES) University of North Carolina at Charlotte
8. PERFORMING ORGANIZATIONREPORT NUMBER
9. SPONSORING/MONITORING AGENCY NAME(S) AND ADDRESS(ES) 10. SPONSOR/MONITOR’S ACRONYM(S)
11. SPONSOR/MONITOR’S REPORT NUMBER(S)
12. DISTRIBUTION/AVAILABILITY STATEMENT Approved for public release, distribution unlimited.
13. SUPPLEMENTARY NOTES
14. ABSTRACT
15. SUBJECT TERMS
16. SECURITY CLASSIFICATION OF: 17. LIMITATION OF ABSTRACT
UU
18. NUMBEROF PAGES
106
19a. NAME OFRESPONSIBLE PERSON
a. REPORT unclassified
b. ABSTRACT unclassified
c. THIS PAGE unclassified
Standard Form 298 (Rev. 8-98) Prescribed by ANSI Std Z39-18
ii
The views expressed in this article are those of the author and do not reflect the official
policy or position of the United States Air Force, Department of Defense, or the U.S.
Government.
Alan Claude Landis
iii
ABSTRACT
ALAN CLAUDE LANDIS. Factors influencing material removal and surface finish of
the polishing of silica glasses. (Under the direction of DR. BRIGID MULLANY)
The polishing process is ancient form of material processing that has changed
little in form over thousands of years. Even with all of the experience that the human
race has gained on the subject, the underlying mechanism that promotes polishing still
lies in the realm of theory. Of the existing theories available, each falls into one of two
broad categories, chemical or mechanical removal mechanisms, or a combination of both.
Effects of polishing pressure and velocity on material removal rate were analyzed. A
novel method of controlling the polishing load will also be provided. Additionally, this
work quantifies some of the factors that influence polishing, and then correlate the results
to polishing theory. Specifically, abrasive polishing particle size and concentration, and
abrasive polishing slurry pH were variables in a broad range of experiments, with other
influencing factors kept as consistent as possible. The effects of pH were analyzed for
interaction with the entire polishing system, as well as for effects on the polishing
workpiece only. Silica materials were used as a baseline, and are polished on a synthetic
optical polishing pitch with ceria (cerium oxide) abrasive particles. Finally, the
experimental results will provide justification for a combined chemical-mechanical
material removal model and form the basis of future work on more advanced materials
like glass-ceramics and ultra low expansion glasses.
iv
ACKNOWLEDGMENTS
Many people have provided support and guidance during the completion of this work.
First, I would like to acknowledge the United States Air Force and the United States Air
Force Academy for providing me the opportunity to extend my professional education.
Dr. Brigid Mullany has provided exceptional guidance and stellar insight into this work,
and has been the hand that shaped the final product and my growth as a student and
researcher. I would like to thank the entire Mechanical Engineering Department at UNC-
Charlotte for their support over my educational career, especially the support provided by
Dr. Harish Cherukuri and Dr. Jerre Hill. Many thanks go to the dedicated professionals
in the Center for Precision Metrology, most notably Roland Hege, for the willingness to
share his vast knowledge in manufacturing. I would also like to thank Mr. Richard
Speelman from Saint-Gobain Quartz for providing the raw fused silica materials free of
charge, in the interest of supporting education and research. Lastly, I would like to thank
Dr. Scott Smith and Dr. Greg Gbur for their participation by serving on the academic
advisory board and for providing insightful directions to take the future work.
v
TABLE OF CONTENTS
LIST OF TABLES ....................................................................................................... vii
LIST OF FIGURES ..................................................................................................... viii
LIST OF ABBREVIATIONS ..................................................................................... xi
CHAPTER 1: INTRODUCTION ............................................................................... 1
CHAPTER 2: BACKGROUND ................................................................................. 2
2.1 The Polishing Process ................................................................................. 3
2.1.1 Polishing Pitch ...................................................................................... 4
2.1.2 Abrasive Slurry ..................................................................................... 6
2.1.3 Workpiece Material .............................................................................. 8
2.2 Polishing Theories ...................................................................................... 11
2.2.1 Mechanical Removal Theories ............................................................. 12
2.2.2 Chemical Removal Theory ................................................................... 15
CHAPTER 3: THE CHEMICAL-MECHANICAL NATURE OF POLISHING ...... 17
3.1 The Chemical Tooth Model ........................................................................ 17
3.1.1 Effects of Water on Silica Materials and Polishing Agents ................. 18
3.1.2 Steps in the Chemical Tooth Model ..................................................... 20
3.2 pH Effect on Colloidal Systems ................................................................. 22
3.2.1 Influence of pH on Polishing Rates ...................................................... 23
3.2.2 Surface Charge and Zeta Potential ....................................................... 25
3.2.3 An Aside on Abrasive Slurry Dispersions ............................................ 26
3.3 Important Research Dealing with the Chemistry of Polishing ................... 28
3.4 Motivation for Current Work ..................................................................... 32
CHAPTER 4: EXPERIMENTAL PROCEDURES ................................................... 34
4.1 Material Preparation ................................................................................... 34
4.1.1 Pitch Tooling ........................................................................................ 35
4.1.2 Abrasive Slurry ..................................................................................... 38
4.1.3 Workpiece Material .............................................................................. 39
4.2 Material Removal Rate Qualification Method ........................................... 40
4.2.1 Step Height Material Removal Rate Considerations ............................ 40
4.2.2 Step Height Creation ............................................................................ 42
vi
4.2.3 Step Height Measurement Method ....................................................... 44
4.2.4 MRR Measurement Method Verification ............................................. 46
4.3 Loading Conditions During Polishing ........................................................ 47
4.3.1 Pressure and Relative Velocity Experiments ........................................ 48
4.3.2 Control Measures .................................................................................. 50
4.3.3 Constant Load Device .......................................................................... 54
4.4 Experimental Process ................................................................................. 55
4.5 Measurement Methodology ........................................................................ 56
4.6 Experimental Sets ....................................................................................... 59
4.6.1 Particle Size Effect Predictions ............................................................ 59
4.6.2 pH Effect Predictions ............................................................................ 60
4.6.3 Slurry Density Effects .......................................................................... 61
CHAPTER 5: EXPERIMENTAL RESULTS ............................................................ 62
5.1 Particle Size Effect on MRR and Surface Finish ....................................... 62
5.1.1 Material Removal Rate Results ............................................................ 63
5.1.2 Surface Finish Results .......................................................................... 65
5.2 pH Effect on MRR and Surface Finish ........................................................ 68
5.2.1 Material Removal Rate Results with Anionic Dispersion .................... 68
5.2.2 Surface Finish Results with Anionic Dispersion .................................. 70
5.2.3 Material Removal Rate Results with Non-Ionic Dispersion ................ 72
5.2.4 Surface Finish Results with Non-Ionic Dispersions ............................. 73
5.3 Slurry Density Effect .................................................................................. 74
5.4 Additional Comments on Experimental Results ........................................ 77
CHAPTER 6: DISCUSSION ..................................................................................... 80
6.1 Material Removal Theory ........................................................................... 80
6.1.1 Mechanical Removal Theory 80
6.1.2 Chemical Removal Theory 82
6.1.3 Realities of Polishing 84
6.2 Slurry Dispersion Effects ............................................................................ 85
CHAPTER 7: CONCLUSIONS AND FUTURE WORK ......................................... 87
REFERENCES ............................................................................................................ 91
vii
LIST OF TABLES
TABLE 2.1: Parameters of the Nanophase Polishing Solutions ...………………..... 8
TABLE 2.2: Comparison of Crystalline Quartz and Fused Silica ...……………...... 11
TABLE 3.1: Comparison of experimental parameters, from [47] and [48] ............... 32
TABLE 4.1: Mechanical Properties of Quartz and Zerodur®
..................................... 48
TABLE 4.2: Results from variable load and lap velocity experiments ...................... 49
TABLE 4.3: Surface roughness measurement type characteristics ............................ 58
TABLE 5.1: Material removal rate effects of variable particle size .......................... 63
TABLE 5.2: Surface finish effects of variable particle size ....................................... 66
TABLE 5.3: Material Removal Rate Effects of Variable pH (anionic dispersion) .... 68
TABLE 5.4: Surface Finish Effects of Variable pH (anionic dispersion) .................. 70
TABLE 5.5: Material Removal Rate Effects of Variable pH (non-ionic dispersion) 72
TABLE 5.6: Surface finish effects of variable pH (non-ionic dispersion) ................. 73
TABLE 5.7: Material Removal Rate Effects of Variable Slurry Density .................. 75
TABLE 5.8: Theoretical calculations of variable density slurries ............................. 77
viii
LIST OF FIGURES
FIGURE 2.1: Typical traditional polishing setup with a close-up of the polisher:
(a) pitch type polisher and (b) pad type polisher ……………….….... 4
FIGURE 2.2: Abrasive particles conforming to pitch under pressure ……….…...... 5
FIGURE 2.3: TEM Micrograph of Nanophase Cerium Oxide Particles [9] ….…..... 7
FIGURE 2.4: 2-D representation of silica materials demonstrating (a) hexagonal
crystalline structure and (b) amorphous structure …….………...…... 9
FIGURE 2.5: Brown/Cook model of mechanical polishing: (a) plan view and
(b) 3-d view ......................................................................................... 14
FIGURE 2.6: Relationships between (a) polishing rate and glass acid resistance,
(b) polishing rate and glass water resistance, and (c) polishing rate
and micro-Vickers hardness of the glass surface [after 27] ……….....
16
FIGURE 3.1: SiO2 and metal oxide surfaces exposed to H20 …………………....... 18
FIGURE 3.2: Percent of silica surface Bronsted bases ………………………....….. 19
FIGURE 3.3: The chemical tooth model: (a) step 1 and (b) step 2 …………....…... 20
FIGURE 3.4: Possible fracture mechanisms for the chemical tooth model (Step 3) 21
FIGURE 3.5: Steps 4 and 5 from the Chemical Tooth Model …………………....... 22
FIGURE 3.6: Theoretical surface charge dependence on pH for a metal oxide
[after 37] …………………………………………………….……..... 23
FIGURE 3.7: MRR vs. pzc for various abrasive particles ([37], Fig. 1, p. G652,
after [35]) ……………………………………………………..…...… 24
FIGURE 3.8: Theoretical surface charge curves for various abrasive particles with
differing pzc (system pH = 7) ………………………………….....…. 24
FIGURE 3.9: Solution particle acquired charges (after [42]) .................................... 26
FIGURE 4.1: Major components of the Strasbaugh nFocus polishing apparatus ..... 34
FIGURE 4.2: Pitch tool pattern with cross-sectional cutaway ...…………….…….. 36
FIGURE 4.3: Typical channeled pitch tool (12 inch diameter) ...…………….……. 37
FIGURE 4.4: Density and pH adjustment area .....…………………………….…… 39
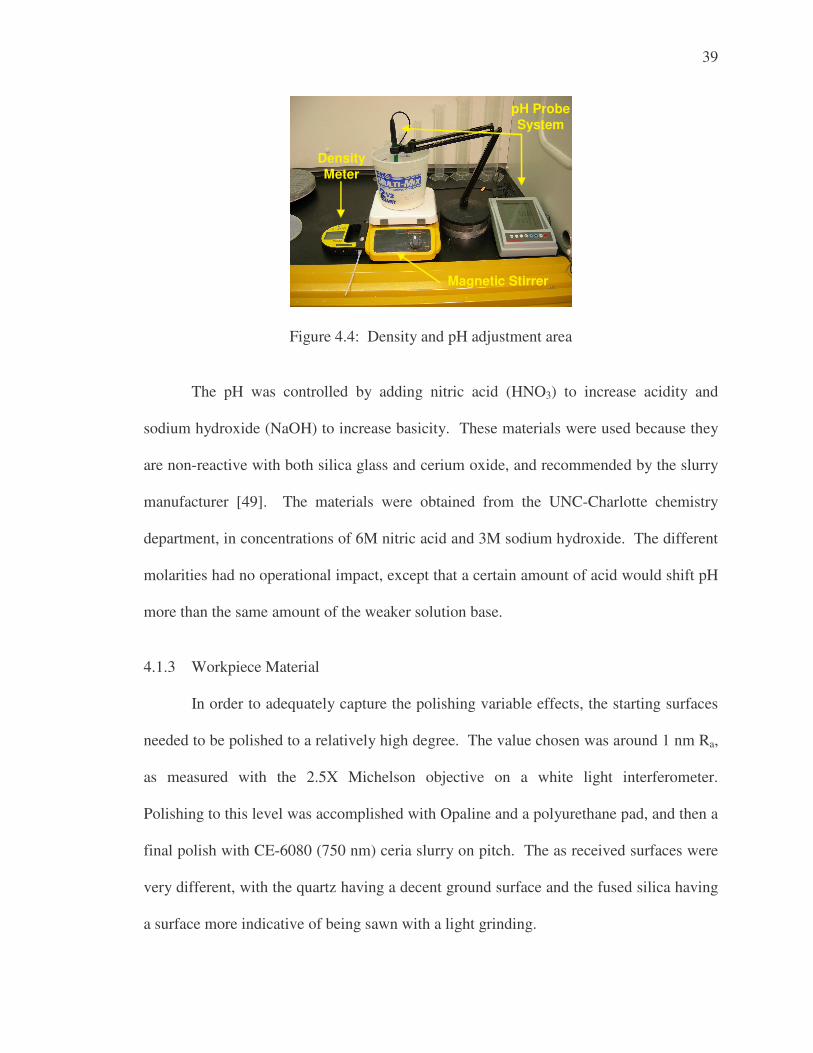
FIGURE 4.5: Polisher interaction with recess: (a) pitch and (b) polishing pad ....… 41
ix
FIGURE 4.6: Photomicrographs of Recess Surface: (a) Initial and (b) after 2.554
µm removed ...……………………………………………………..… 41
FIGURE 4.7: Recess surface lapped with (a) steel/opaline and (b) copper/diamond 43
FIGURE 4.8: Lapping tool mounted in zero-force chuck ...………………….…….. 44
FIGURE 4.9: Mask alignment to recess for step height measurement ...…….…….. 45
FIGURE 4.10: Sequential Polishing Experiment Output (∆ = 188 nm) ...……...…… 45
FIGURE 4.11: Step height and mass removal rate method comparison ..………...… 47
FIGURE 4.12: Polishing apparatus loading curve ...……………………………...…. 51
FIGURE 4.13: Schematic of the load sensing device ...…………………………...… 51
FIGURE 4.14: Loading curves with (a) dead load on pad and (b) 10 psi overarm
pressure on pad ...……………………………………………...…….. 53
FIGURE 4.15: Constant load application device ...…………………………...……... 55
FIGURE 4.16: Polishing setup with recirculation system ...…………………...……. 56
FIGURE 5.1: MRR versus particle size for quartz and fused silica ...…….……….. 64
FIGURE 5.2: Log-Log plot of MRR versus particle size ...………………….…….. 65
FIGURE 5.3: Comparison of surface finish measurements with (a) quartz and (b)
fused silica, as a function of particle size. Polishing order
(750 nm � 40 nm � 20 nm) ...……………………………………....
67
FIGURE 5.4: MRR versus pH for quartz and fused silica for anionic dispersion ..... 69
FIGURE 5.5: Comparison of surface finish measurements with (a) quartz and (b)
fused silica, as a function of pH (anionic dispersion). Polishing
Order (pH 7 � pH 10 � pH 4) .………………………………..……
71
FIGURE 5.6: MRR versus pH for fused silica with non-ionic dispersion ……....… 72
FIGURE 5.7: Comparison of surface finish measurements with fused silica as a
function of pH with a non-ionic dispersion. Polishing Order
(pH 7 � pH 10 � pH 4) ..………………………………...............….
73
FIGURE 5.8: Comparison of fused silica surface from (a) anionic dispersion set
(Ra = 0.955 nm) and (b) non-ionic dispersion set (Ra = 1.726), both
conducted at pH = 7 ...…………......……………………………..…..
74
FIGURE 5.9: Graphical representation of the variable density experiments ...….…. 75
x
FIGURE 5.10: Representative 50X interferometer pictures of (a) fused silica
(Ra = 0.600 nm) and (b) quartz (Ra = 0.296 nm). Both polished
with 40 nm anionic dispersion at pH = 7 ..……………………...……
78
FIGURE 6.1: Indentation of a sphere on a flat plate with (a) particle with a
nominal load P and contact radius a and (b) particle with higher load
P’ and larger contact radius a’ ..……………………...........................
83
FIGURE 6.2: Abrasive particle with polymeric coating interaction with silica ........ 85
FIGURE 6.3: Comparison of pH experiments with anionic and non-ionic
dispersion slurries ................................................................................ 86
xi
LIST OF ABBREVIATIONS
A — Area
a — Spherical Contact Radius (See Figure 2.5 and Figure 6.1)
AFM — Atomic Force Microscope
As — Mechanical Trough Area (See Figure 2.5)
Ce — Cerium
CeO2 — Ceria (Cerium Dioxide)
Cp — Preston’s Coefficient (cm2/dyn)
CMM — Coordinate Measuring Machine
CMP — Chemical Mechanical Planarization
∆H/∆t — Material Removal Rate (Change in thickness over time)
∆s/∆t — Relative Velocity of Workpiece and Polisher
DI Water — De-Ionized Water
Do — Mean Abrasive Particle Diameter (See Equation 2.3)
E — Modulus of Elasticity
FOV — Field of View
gmf — grams force
GPa — gigapascals
h — Particle Penetration Depth (See Figure 2.5)
H+ — Hydrogen Ion
H2O — Water
H3O+ — Hydronium
HDPE — High Density Polyethylene
HNO3 — Nitric Acid
iep — Isoelectric Point (pH level where zeta potential is zero)
k — Abrasive Particle Concentration (See Equation 2.3)
kg — kilogram
kPa — kilopascals
L — Load
lbf — pounds force
mL — milliliters
mm — millimeter
MRR — Material Removal Rate
nb — Percentage of Bronsted Bases on a Silica Surface
NaOH — Sodium Hydroxide
NIST — National Institute of Standards and Technology
nm — nanometer
O — Oxygen
OH- — Hydroxide Ion
ρ — density
P — Pressure
pH — Potential of Hydrogen
psi — pounds force per square inch
xii
pzc — Point of Zero Charge (pH level where particle surface charge = 0)
R — Radius of a Sphere (See Figure 2.5)
Ra — Arithmetic Average Surface Roughness
Rq — Root-Mean-Square Surface Roughness
Rsk — Statistical Skewness Value of a Line Profile
s — second
Si — Silicon
SiO2 — Silica (Silicon Dioxide)
SiOH — Silanol Group
Si(OH)4 — Silicic Acid
µm — micrometer
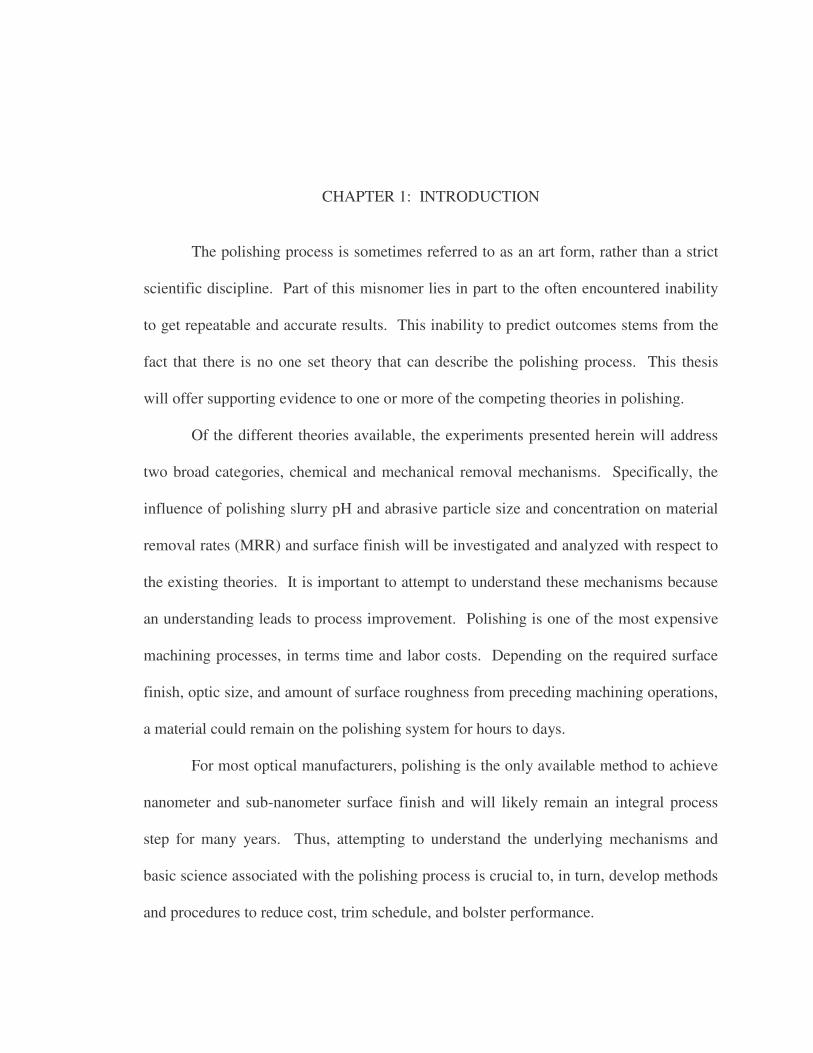
CHAPTER 1: INTRODUCTION
The polishing process is sometimes referred to as an art form, rather than a strict
scientific discipline. Part of this misnomer lies in part to the often encountered inability
to get repeatable and accurate results. This inability to predict outcomes stems from the
fact that there is no one set theory that can describe the polishing process. This thesis
will offer supporting evidence to one or more of the competing theories in polishing.
Of the different theories available, the experiments presented herein will address
two broad categories, chemical and mechanical removal mechanisms. Specifically, the
influence of polishing slurry pH and abrasive particle size and concentration on material
removal rates (MRR) and surface finish will be investigated and analyzed with respect to
the existing theories. It is important to attempt to understand these mechanisms because
an understanding leads to process improvement. Polishing is one of the most expensive
machining processes, in terms time and labor costs. Depending on the required surface
finish, optic size, and amount of surface roughness from preceding machining operations,
a material could remain on the polishing system for hours to days.
For most optical manufacturers, polishing is the only available method to achieve
nanometer and sub-nanometer surface finish and will likely remain an integral process
step for many years. Thus, attempting to understand the underlying mechanisms and
basic science associated with the polishing process is crucial to, in turn, develop methods
and procedures to reduce cost, trim schedule, and bolster performance.
CHAPTER 2: BACKGROUND
For many years, researchers have attempted to predict the underlying mechanism
responsible for the polishing of glass, metals, and composites. Before any attempt to
understand the polishing process, a brief introduction to the history is essential. The
ability to polish objects, regardless of intended purpose, has existed for thousands of
years. In ancient times, the ‘shiny’ surfaces generated from polishing were most
assuredly more decorative than functional for these early civilizations. Lu, et al [1],
examined highly polished corundum axe fragments found at an ancient Chinese
settlement at Zhejiang Yuhang Wujiabu, circa 2500 BC. They found through Atomic
Force Microscopy (AFM) that the surface roughness was on the order of a few
nanometers. This is a humbling fact, considering that over the past 4500 years,
humankind has only increased in polishing ability on the order of several nanometers.
As the human race developed, surface quality transformed from decorative to an
essential function for certain applications, namely the telescope. In the 17th century,
scientists like Galileo began to contribute to the body of astronomical discoveries.
Researches like Miniati, et al [2], have used modern measurement techniques to study
lenses of this era and found that they were of superb quality for the time, having only
minor features present on the polished surfaces.
3
2.1 The Polishing Process
Many different types of polishing exist, including chemical mechanical
planarization (CMP) used in integrated circuit chip manufacturing, float polishing,
magneto-rheological finishing (MRF), and traditional polishing. Traditional polishing
can be further sub-divided into sub-aperture polishing where the workpiece is larger than
the polisher, and full aperture polishing where the workpiece is smaller than the polisher.
The current work utilizes full aperture traditional polishing.
The polishing process can be thought of as a wear mechanism between the
workpiece being polished and the abrasive particles held by a medium. The abrasive
particles are usually in a liquid mixture, known as slurry. Material removal occurs from
the workpiece-particle interaction through a mechanical or chemical mechanism, or a
combination of both. The polishing medium is typically a material such as pitch (a
highly viscous fluid) or a polishing pad. The system made from the combination of the
polishing medium and abrasive particles is often referred to as a polisher.
Traditional polishing is performed by placing the workpiece in contact with the
polisher, under pressure, and developing a relative velocity by rotating the polisher and
translating the workpiece. With pitch, slurry application allows the abrasive particles to
become embedded under the applied pressure and protrude out to promote wear on the
workpiece surface. With a pad type material, the fibrous structure (asperities) holds the
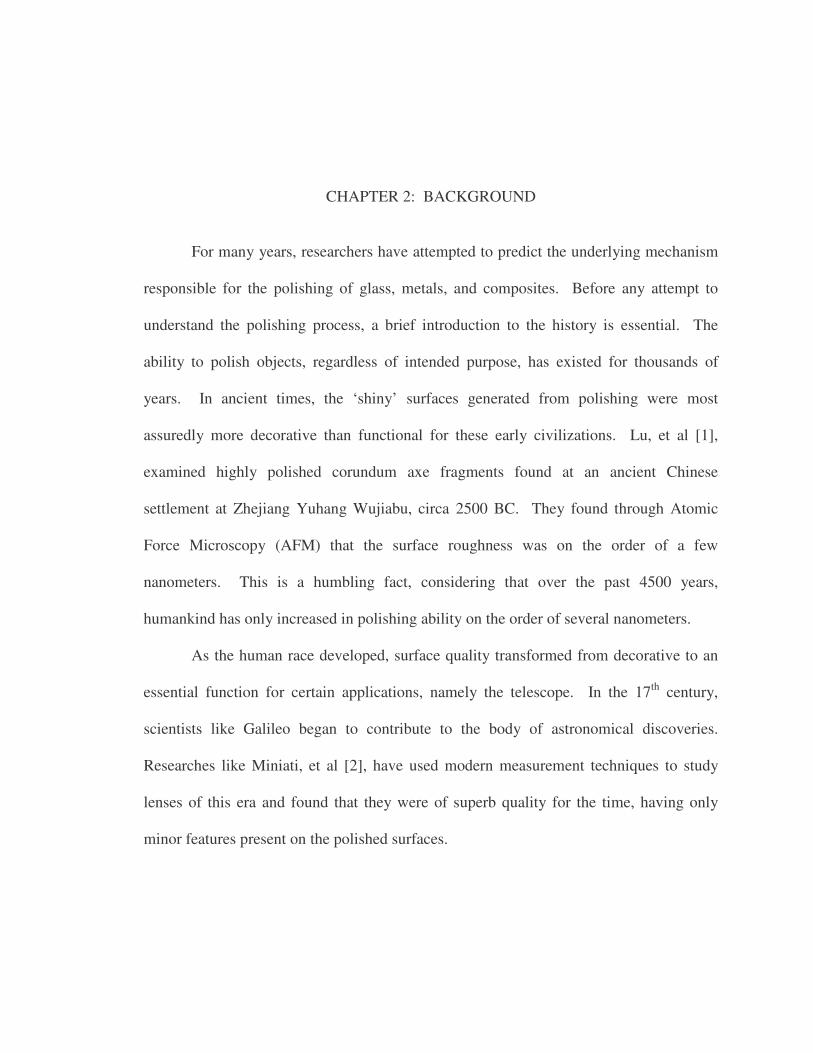
abrasive particles against the workpiece surface, again promoting wear. Figure 2.1
shows the process with both pitch and pad type polishing.
4
Figure 2.1: Typical traditional polishing setup with a close-up of the polisher: (a) pitch type polisher and (b) pad type polisher
2.1.1 Polishing Pitch
Optical polishing pitch was the chosen material for the majority of the
experiments contained in this thesis. Pitch is a highly viscous material that can be
manufactured from man-made or natural materials. The bulk majority of available pitch
is manufactured from natural sources. Organic materials, such as coal, wood, rosin, and
petroleum, when refined, produces the characteristic pitch used by opticians [3, 4]. Pitch
has been in used for hundreds of years, with the recommendation of using wood based
pitch dating back to Sir Isaac Newton [5].
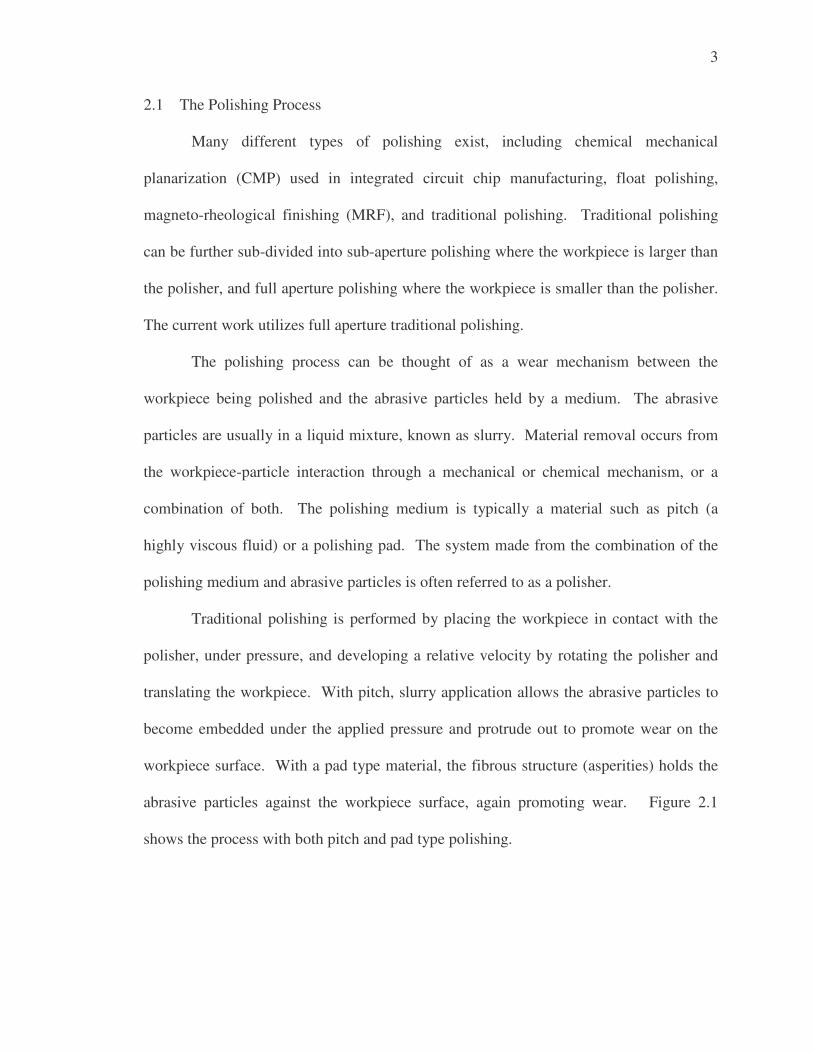
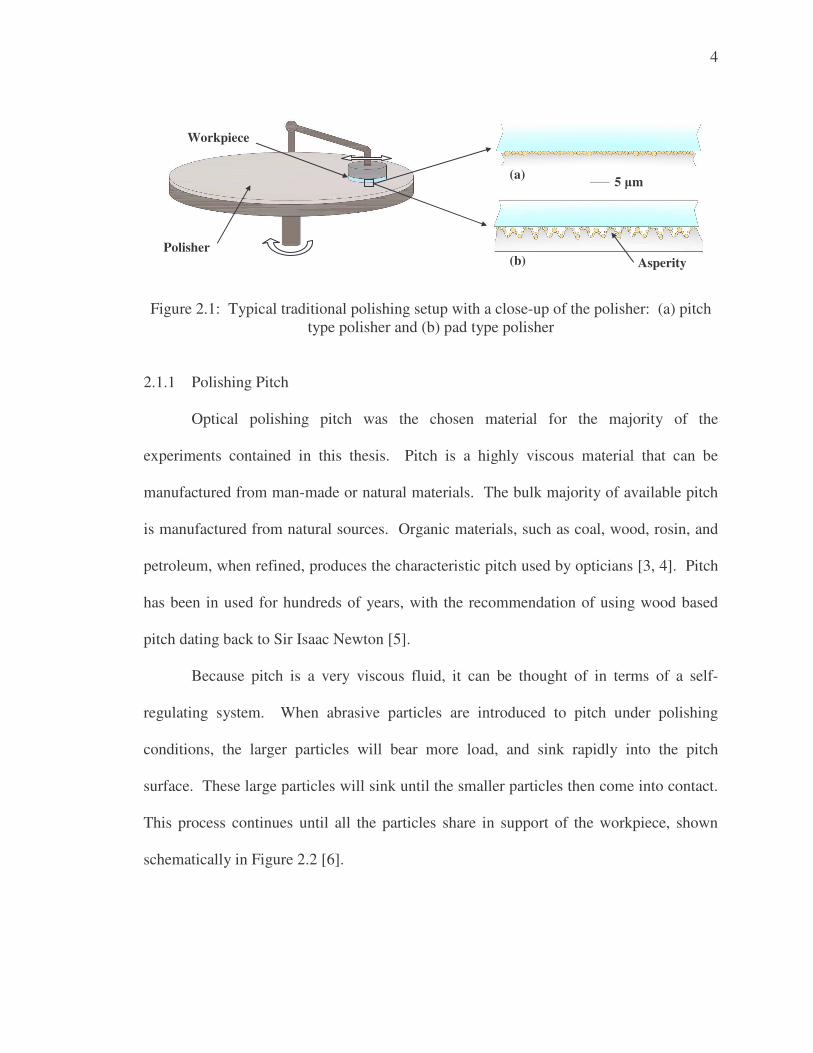
Because pitch is a very viscous fluid, it can be thought of in terms of a self-
regulating system. When abrasive particles are introduced to pitch under polishing
conditions, the larger particles will bear more load, and sink rapidly into the pitch
surface. These large particles will sink until the smaller particles then come into contact.
This process continues until all the particles share in support of the workpiece, shown
schematically in Figure 2.2 [6].
5 �m
(b)
(a)
Asperity Polisher
Workpiece
5
Figure 2.2: Abrasive particles conforming to pitch under pressure For the current work, Acculap polishing pitch was obtained from Sutton
Technologies, which is a synthetic polymer based material. Natural pitches can be
subject to variations from batch to batch due to differences in the materials used in the
manufacturing process and, since it is organic, can break down over time. Using a
synthetic pitch, the properties should remain consistent between different laps. Acculap
has a proprietary recipe, but the basic components are a poly(alphmethyl)styrene polymer
base, with hydrogenated oil added to promote flow [7]. Variable amounts of these
products, along with other additives, create grades of pitch with differing hardness and
viscosity. Those familiar with polishing would benefit from knowing that the synthetic
pitches have been shown to perform similar to traditional pitches of the same viscosity.
The ‘Standard’ grade Accuplap, with a shear viscosity of 0.467 GPa-s, was used for the
production of the pitch tools in this thesis, and comparable to the commonly used
traditional pitch, Gugolz 64, which has a measured shear viscosity of 0.393 GPa-s [7].
Pitch is typically applied to polishing platens by pouring hot pitch onto the platen
surface and allowed to cool. After the cool-down period, grooves are cut into the pitch
surface to promote slurry flow to the workpiece. This allows the introduction of new
polishing particles and also carries away any material that has been removed from the
workpiece surface. Various properties of laps (channel configuration, lap depth, channel
Pressure
Glass
Pitch
6
depth, hardness, etc.) have been studied and shown to influence the overall form and
surface finish of the workpiece [3, 4, 5, 8]. However, the configuration of the lap is not
considered a variable in the current work, so baseline materials and patterns were chosen
and kept constant throughout.
2.1.2 Abrasive Slurry
Polishing slurries are mixtures of abrasive particles and a suspension medium
which, in polishing, is almost exclusively water. The liquid phase of the mixture allows
the particles to flow under the workpiece for interaction. There are many different types
of abrasive particles available, but the most common ones used are diamond, silica
(SiO2), and several metal oxides, namely, ceria (CeO2) and alumina (Al2O3).
Abrasive particles for slurries can be obtained in several forms. One of the most
common is raw abrasive in powder form. These powders are typically high purity
abrasives. The slurries are prepared by simply mixing the powder in water, controlled by
adding a certain mass of abrasive to a measured volume of water to obtain the desired
density for the polishing application.
The other supplied form is in colloidal solution. A colloidal solution is one that
consists of one material phase (i.e. solid, liquid, gas) existing in another. In the case of
polishing slurry, the system is a solid (abrasive particle) dispersed in a liquid (polishing
dispersion). These solutions are supplied with a known weight percent of abrasive,
which can be diluted with water to obtain the desired density. An important note on
colloidal polishing solutions is that the dispersion may contain other additives, which are
brand specific to the manufacturer, and may or may not be known.
7
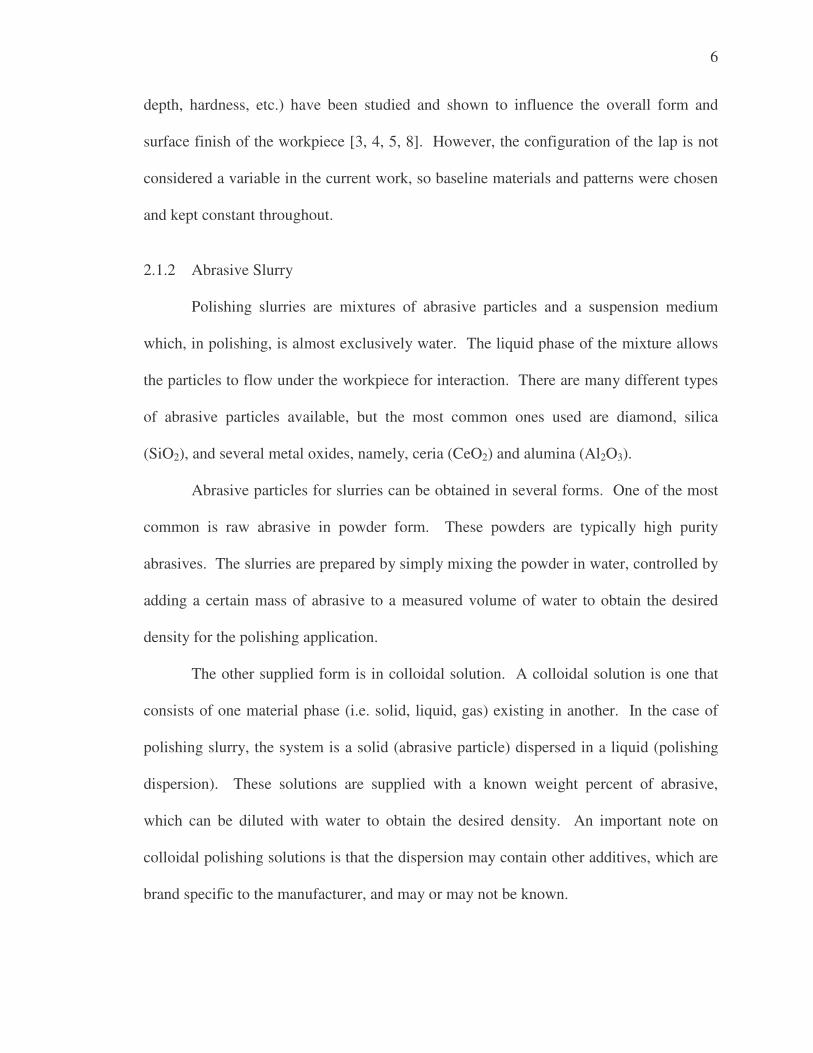
The abrasive particles used for this thesis were colloidal ceria solutions obtained
from Nanophase Technologies. The cerium oxide particles contained in these solutions
are nanocrystalline and of high purity, created using a patented plasma arc process that
ensures uniform particle size [9]. A TEM micrograph of typical Nanophase produced
ceria particles are shown in Figure 2.3. The ceria dispersion recipe is proprietary, but is
known to be water based.
�
�
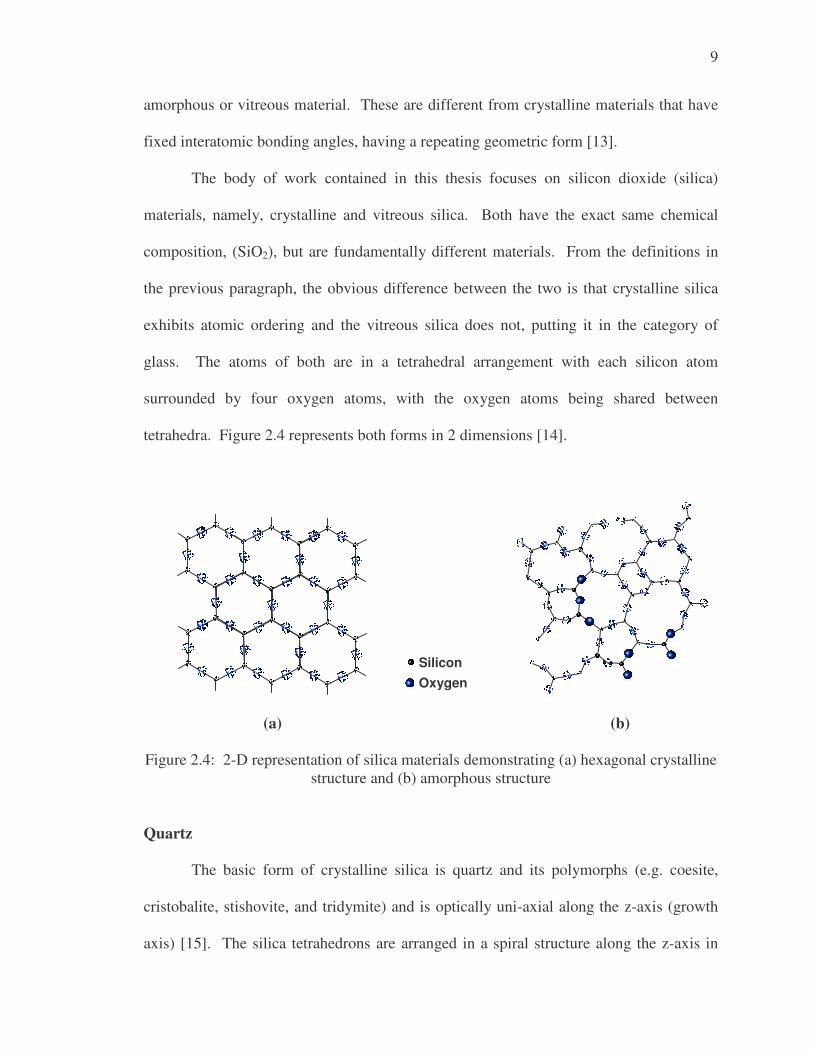
Figure 2.3: TEM Micrograph of Nanophase Cerium Oxide Particles [9] Four different particle dispersions were used in the main polishing experiments.
These are summarized in Table 2.1. As seen, the first three differ only in particle size,
with the exception of the composition of the CE-6080 dispersion, which contains a small
amount of glycerin to prevent sticking when polishing glass on pitch. Each of these
slurries also contains an amount of added polymers to aid in stabilization of the solutions.
The added polymers have an associated negative charge, thus their distinction in the table
as anionic. The fourth type, CE-6086, contains particles that also have a polymeric
coating, but these polymers have no associated charge. The distinction between the two
dispersions is the method to prevent agglomeration of the particles [10, 11, 12]. This will
be discussed in further detail, but some background is needed first. For now, it is only
8
important to remember that the fourth particle dispersion (CE-6086) is fundamentally
different than the first three.
Table 2.1: Parameters of the Nanophase Polishing Solutions
CE-6080 750 anionic ~ 8 7-12CE-6082 40 anionic ~ 8 7-12GP-18HD 20 anionic ~ 8 7-12CE-6086 40 non-ionic ~ 8 4-11
Recommended pH Usage Range
Out of Box pHProduct Name
Mean Particle Diameter (nm)
Dispersion
2.1.3 Workpiece Material
Many different types of materials may be polished including metals, ceramics,
glass-ceramics, and glass. Copper and silicon polishing has been of key interest over the
last twenty years due to the necessity of the polishing process in the manufacture of
integrated circuit chips. The majority of polishing, however, still lies in the realm of
glass and glass-ceramic substrates which are used in a vast amount of applications, from
optics for lithographic machines to mirrors and lenses for laser systems.
Before discussing the baseline materials used in the research, it is important to
provide a distinction between glasses and crystalline materials. When the term glass is
used, solid objects such as window panes and car windshields come to mind. However,
glass is not technically a solid. Glasses exhibits properties of supercooled liquids, that is,
when cooled past the melting point, they continue to be cooled in the liquid state. Thus,
it does not crystallize, and forms a material with no long range crystalline order. Glasses
are generally considered supercooled, highly viscous liquids, better known as an
9
amorphous or vitreous material. These are different from crystalline materials that have
fixed interatomic bonding angles, having a repeating geometric form [13].
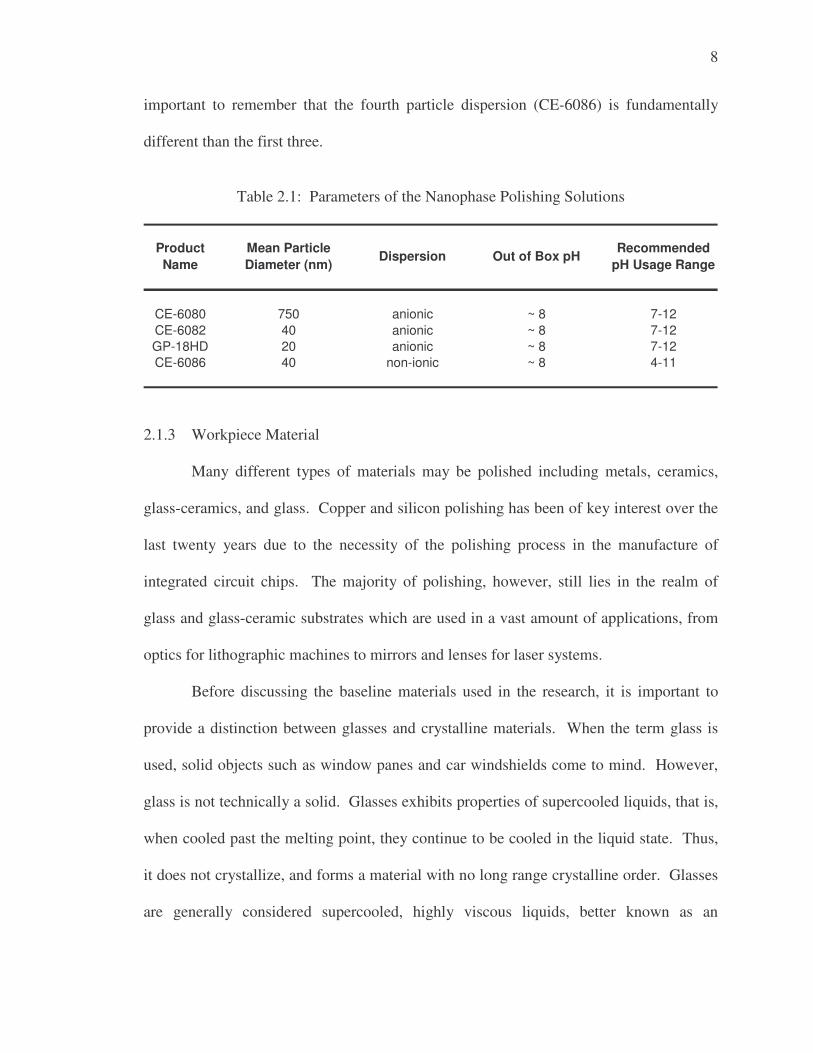
The body of work contained in this thesis focuses on silicon dioxide (silica)
materials, namely, crystalline and vitreous silica. Both have the exact same chemical
composition, (SiO2), but are fundamentally different materials. From the definitions in
the previous paragraph, the obvious difference between the two is that crystalline silica
exhibits atomic ordering and the vitreous silica does not, putting it in the category of
glass. The atoms of both are in a tetrahedral arrangement with each silicon atom
surrounded by four oxygen atoms, with the oxygen atoms being shared between
tetrahedra. Figure 2.4 represents both forms in 2 dimensions [14].
(a) (b)
Figure 2.4: 2-D representation of silica materials demonstrating (a) hexagonal crystalline
structure and (b) amorphous structure
Quartz
The basic form of crystalline silica is quartz and its polymorphs (e.g. coesite,
cristobalite, stishovite, and tridymite) and is optically uni-axial along the z-axis (growth
axis) [15]. The silica tetrahedrons are arranged in a spiral structure along the z-axis in
Oxygen Silicon
10
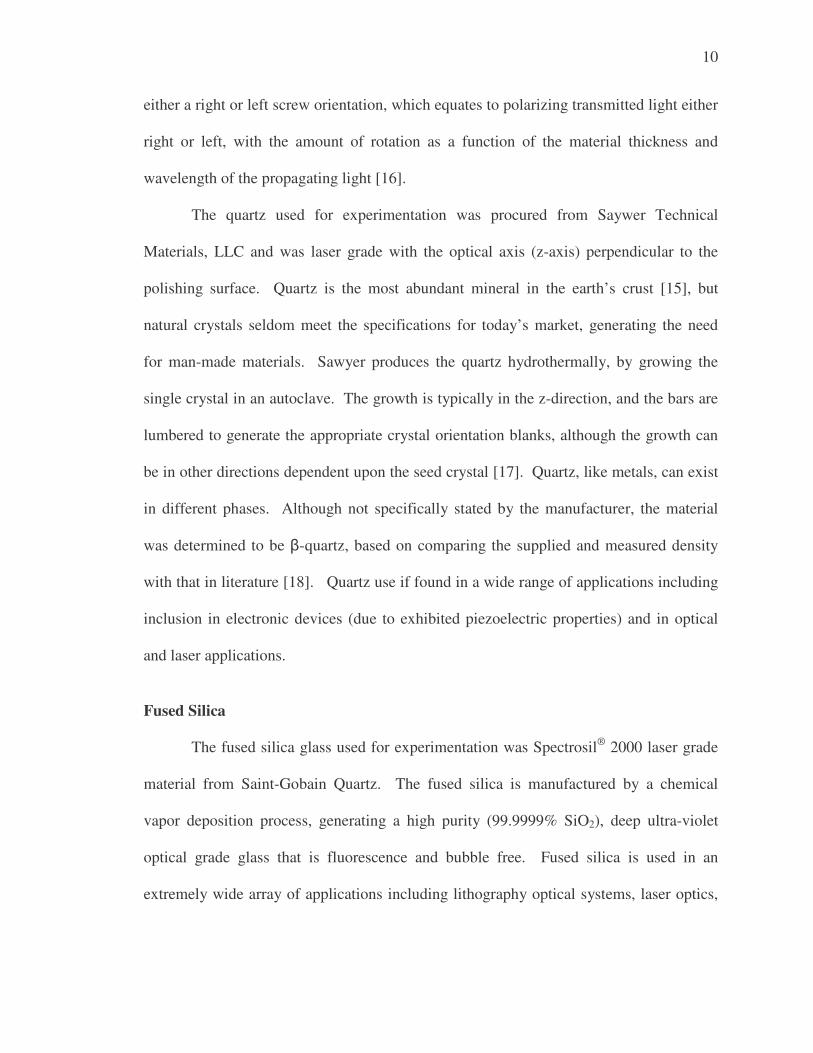
either a right or left screw orientation, which equates to polarizing transmitted light either
right or left, with the amount of rotation as a function of the material thickness and
wavelength of the propagating light [16].
The quartz used for experimentation was procured from Saywer Technical
Materials, LLC and was laser grade with the optical axis (z-axis) perpendicular to the
polishing surface. Quartz is the most abundant mineral in the earth’s crust [15], but
natural crystals seldom meet the specifications for today’s market, generating the need
for man-made materials. Sawyer produces the quartz hydrothermally, by growing the
single crystal in an autoclave. The growth is typically in the z-direction, and the bars are
lumbered to generate the appropriate crystal orientation blanks, although the growth can
be in other directions dependent upon the seed crystal [17]. Quartz, like metals, can exist
in different phases. Although not specifically stated by the manufacturer, the material
was determined to be �-quartz, based on comparing the supplied and measured density
with that in literature [18]. Quartz use if found in a wide range of applications including
inclusion in electronic devices (due to exhibited piezoelectric properties) and in optical
and laser applications.
Fused Silica
The fused silica glass used for experimentation was Spectrosil® 2000 laser grade
material from Saint-Gobain Quartz. The fused silica is manufactured by a chemical
vapor deposition process, generating a high purity (99.9999% SiO2), deep ultra-violet
optical grade glass that is fluorescence and bubble free. Fused silica is used in an
extremely wide array of applications including lithography optical systems, laser optics,
11
and optical components in deep ultra-violet, visible, and near infra-red systems [19, 20].
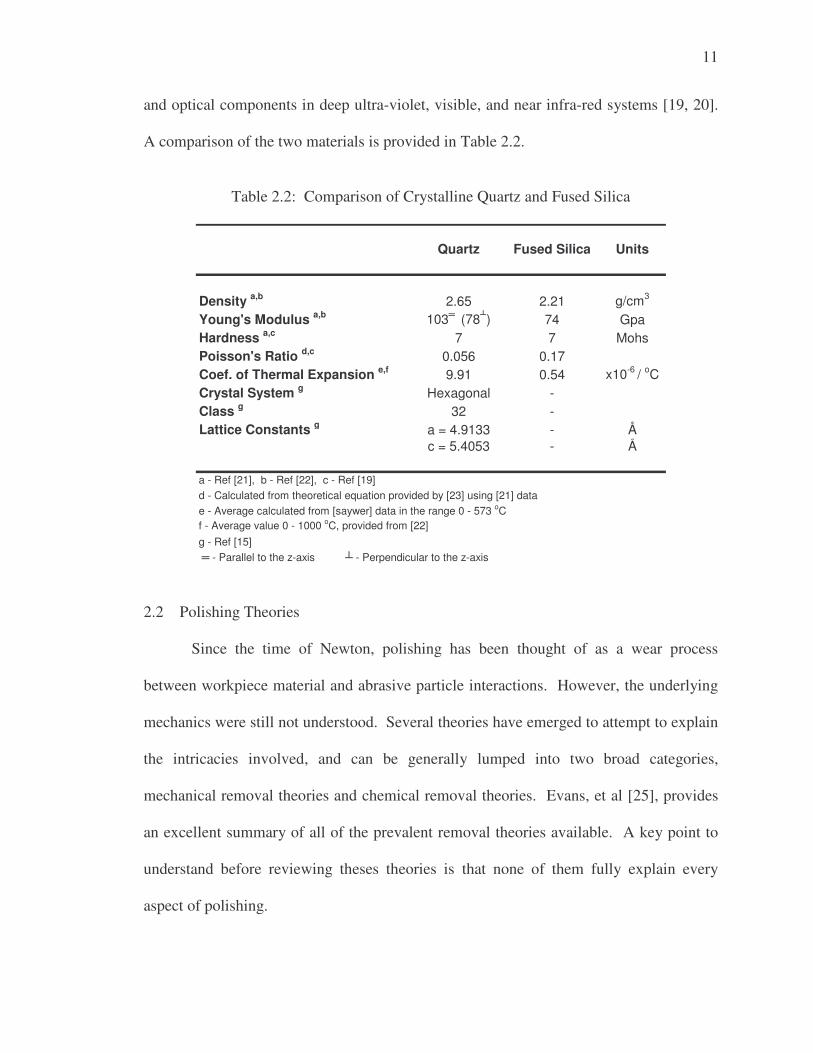
A comparison of the two materials is provided in Table 2.2.
Table 2.2: Comparison of Crystalline Quartz and Fused Silica
Quartz Fused Silica Units
Density a,b 2.65 2.21 g/cm3
Young's Modulus a,b 103� (78�) 74 GpaHardness a,c 7 7 MohsPoisson's Ratio d,c 0.056 0.17Coef. of Thermal Expansion e,f 9.91 0.54 x10⁻⁶ / oCCrystal System g Hexagonal -Class g 32 -Lattice Constants g a = 4.9133 - Å
c = 5.4053 - Å
f - Average value 0 - 1000 oC, provided from [22]g - Ref [15] � - Parallel to the z-axis � - Perpendicular to the z-axis
e - Average calculated from [saywer] data in the range 0 - 573 oC
a - Ref [21], b - Ref [22], c - Ref [19]d - Calculated from theoretical equation provided by [23] using [21] data
2.2 Polishing Theories
Since the time of Newton, polishing has been thought of as a wear process
between workpiece material and abrasive particle interactions. However, the underlying
mechanics were still not understood. Several theories have emerged to attempt to explain
the intricacies involved, and can be generally lumped into two broad categories,
mechanical removal theories and chemical removal theories. Evans, et al [25], provides
an excellent summary of all of the prevalent removal theories available. A key point to
understand before reviewing theses theories is that none of them fully explain every
aspect of polishing.
12
2.2.1 Mechanical Removal Theories
Several different models will be discussed under this category. They are all based
on the mechanical removal of material through interaction of the abrasive particles with
the workpiece, and the subsequent scratching/fracturing of the polishing surface.
Rayleigh and Beilby
Two of the major theories in polishing in the early 20th century were proposed by
Lord Rayleigh and Sir Beilby. Rayleigh’s theory suspected that abrasive particles
pressed against the glass surface and created mechanically fractured sites. The material
at these sites was then removed on a very small scale (molecular level) [26, 27]. Beilby,
conversely, proposed a theory that the material ‘flowed’ under interaction with the
abrasive particles. It was thought that the glass was locally heated by frictional
interaction with the abrasive particle, creating a less viscous material at the surface. This
‘flowed’ layer could then either be removed by the traversing particles, or allowed to
flow over the surface. This notion of ‘flow’ was reasoned to be the process of obtaining a
vary smooth finish on glass. [27, 28].
Preston
The work of Preston in 1927 [29, 30] led to the development of a model to predict
removal rates by controlling several factors, including an empirically derived coefficient
based on particular polishing materials and conditions. Equation 2.1 shows the formula,
with ∆H/∆t the change in material thickness over time, L is the load, A is the effective
polishing area of the workpiece, ∆s/∆t is the relative velocity between the workpiece and
13
lap, and Cp is a material/lap specific coefficient. The later value would eventually bear
his name, the Preston’s coefficient, which is a parameter still in use today.
ts
AL
Ct
Hp ∆
∆⋅⋅=∆
∆ (2.1)
Brown and Cook The Preston model existed unchallenged for many years until the work of Brown,
et al [31, 32], which focused on the optical polishing of metals. It was surmised, through
mathematical modeling and experimentation, that the removal rate equation varied with
the inverse of Young’s Modulus of the material being polished. The model was based
on spherical particles elastically indenting the metal surface, governed by Hertzian
indentation, and then gouging a path through the material. The model developed is given
in Equation 2.2, with L/A being replaced by pressure (P) and Cp replaced by the inverse
of twice Young’s Modulus. Brown and Cook [33] later suggested that the model could
also describe glass polishing, under certain conditions.
ts
EP
tH
∆∆⋅=
∆∆
2 (2.2)
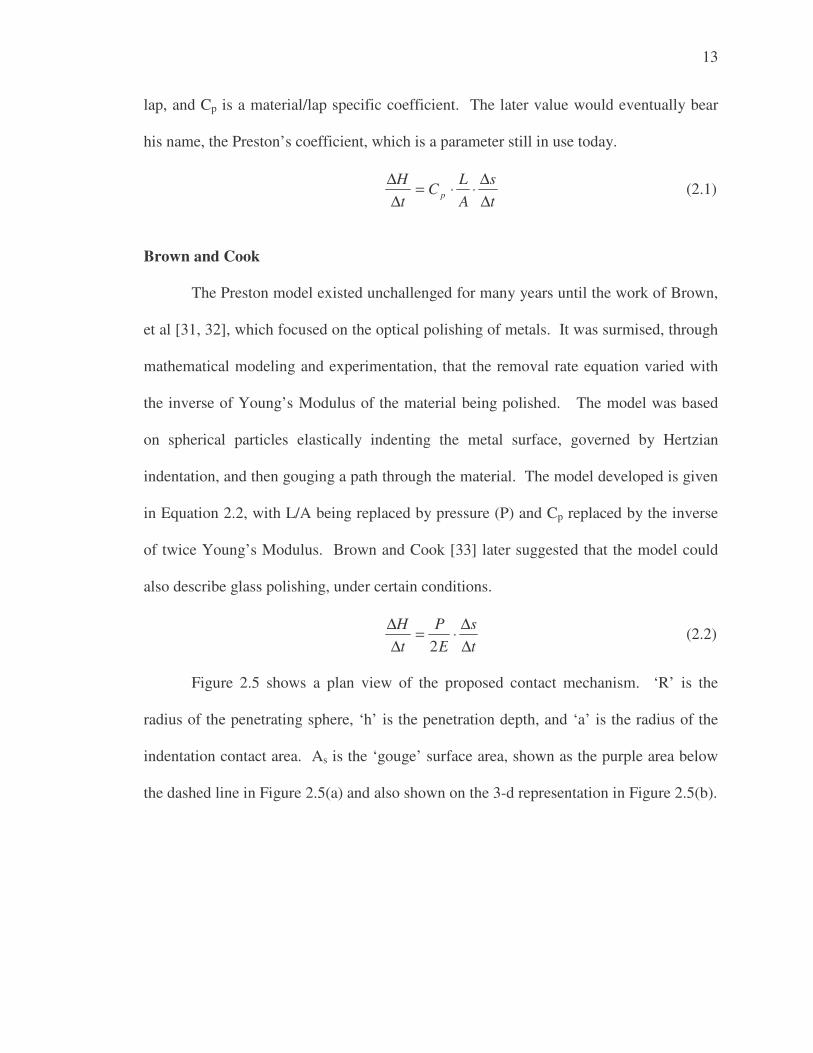
Figure 2.5 shows a plan view of the proposed contact mechanism. ‘R’ is the
radius of the penetrating sphere, ‘h’ is the penetration depth, and ‘a’ is the radius of the
indentation contact area. As is the ‘gouge’ surface area, shown as the purple area below
the dashed line in Figure 2.5(a) and also shown on the 3-d representation in Figure 2.5(b).
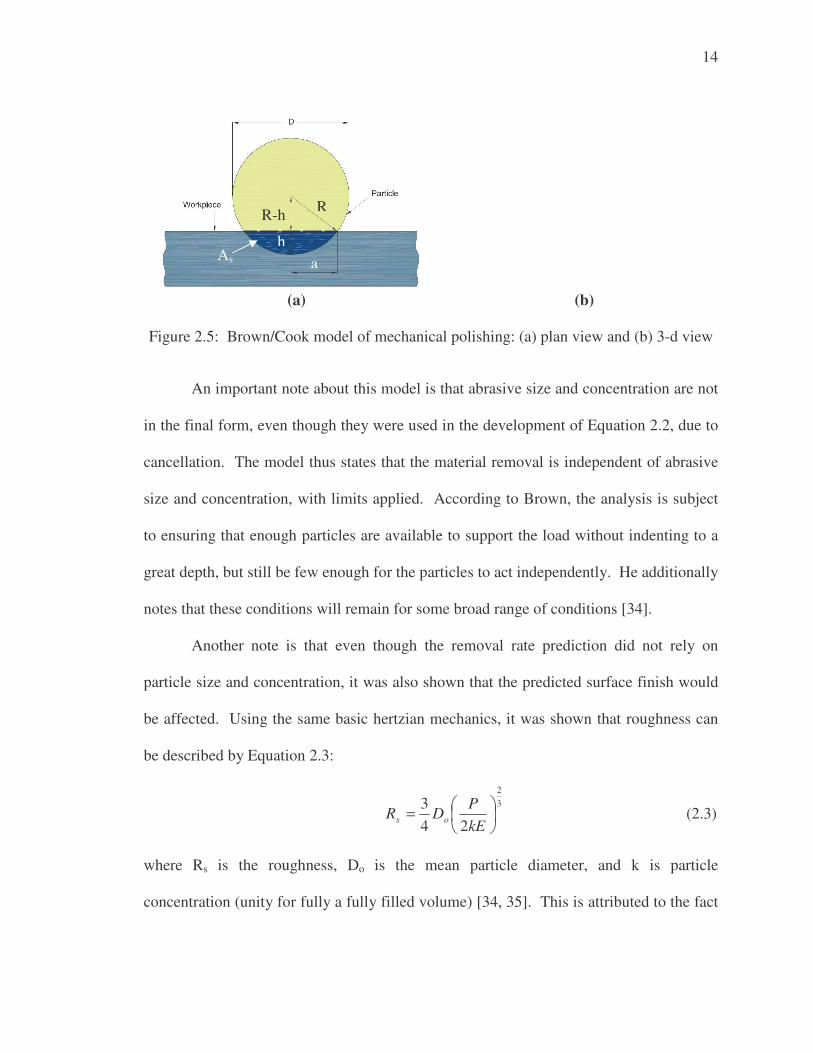
14
(a) (b) Figure 2.5: Brown/Cook model of mechanical polishing: (a) plan view and (b) 3-d view
An important note about this model is that abrasive size and concentration are not
in the final form, even though they were used in the development of Equation 2.2, due to
cancellation. The model thus states that the material removal is independent of abrasive
size and concentration, with limits applied. According to Brown, the analysis is subject
to ensuring that enough particles are available to support the load without indenting to a
great depth, but still be few enough for the particles to act independently. He additionally
notes that these conditions will remain for some broad range of conditions [34].
Another note is that even though the removal rate prediction did not rely on
particle size and concentration, it was also shown that the predicted surface finish would
be affected. Using the same basic hertzian mechanics, it was shown that roughness can
be described by Equation 2.3:
32
243
��
���
�=kEP
DR os (2.3)
where Rs is the roughness, Do is the mean particle diameter, and k is particle
concentration (unity for fully a fully filled volume) [34, 35]. This is attributed to the fact
h
R R-h
a As
As
15
that with smaller particles carrying the load (versus large particles), the resulting
indentation depths will be less and reduce the surface roughness.
2.2.2 Chemical Removal Theory
The chemical theory, as described by Izumitani [27], is attributed to Preston and
Grebenshchikov, and was a departure from the common thought on polishing. The
chemical theory involves creation of a gel layer formed by silica glass in the presence of
water. This layer could then be removed by interaction of the glass surface with the
abrasive particles.
In this work, Izumitani tested the theories of mechanical and chemical removal by
subjecting eighteen different optical glasses to conditions that were underlying in each
theory. If the abrasive theory is correct, then the material removal rate should rely on
strength of the glass. If flow theory is at play, then the rate should depend on the
softening point of glass. The experiments found no correlation of the above, reasoning
that neither of these hypotheses was correct [27].
It was also surmised that if there was a chemical aspect to polishing, then the
polishing rate should be proportional to the chemical durability of the glass. Additional
experiments were performed, measuring the polishing rate versus chemical durability
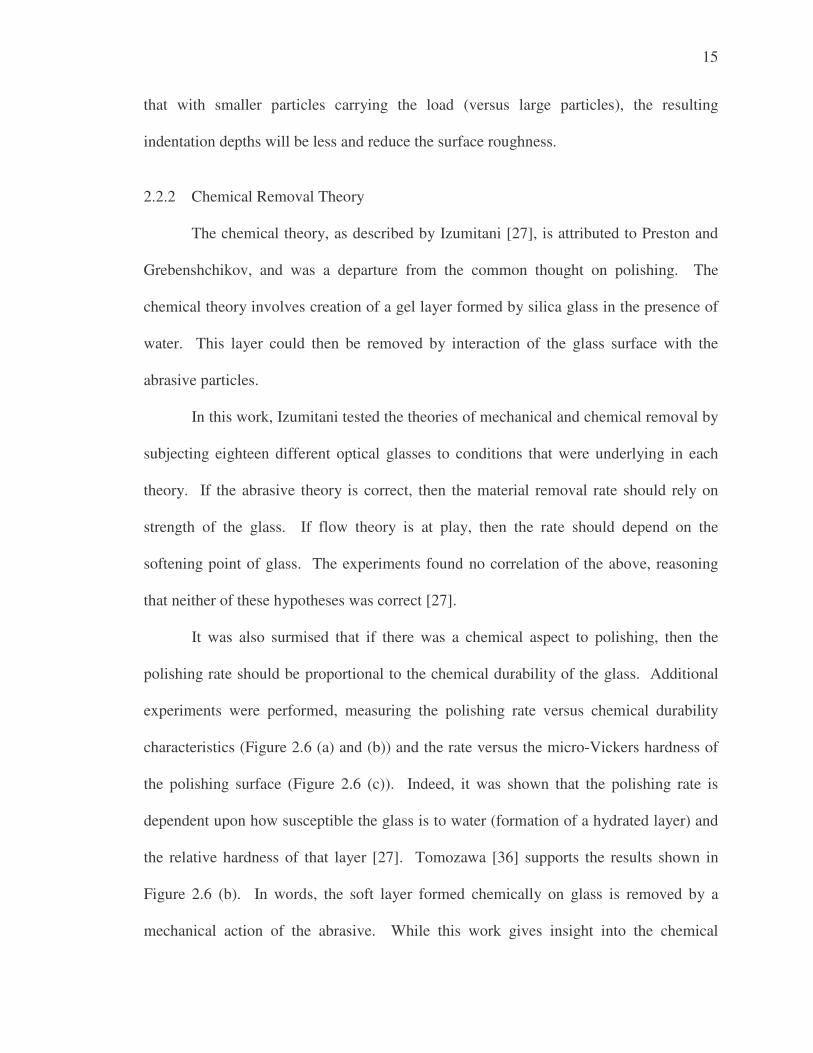
characteristics (Figure 2.6 (a) and (b)) and the rate versus the micro-Vickers hardness of
the polishing surface (Figure 2.6 (c)). Indeed, it was shown that the polishing rate is
dependent upon how susceptible the glass is to water (formation of a hydrated layer) and
the relative hardness of that layer [27]. Tomozawa [36] supports the results shown in
Figure 2.6 (b). In words, the soft layer formed chemically on glass is removed by a
mechanical action of the abrasive. While this work gives insight into the chemical
16
aspects, there was still a need to understand the conditions that controlled the chemical
reactions, and will be the subject of Chapter 3.
Figure 2.6: Relationships between (a) polishing rate and glass acid resistance, (b) polishing rate and glass water resistance, and (c) polishing rate and micro-Vickers
hardness of the glass surface [after 27].
(a) (b)
(c)
CHAPTER 3: THE CHEMICAL-MECHANICAL NATURE OF POLISHING
Of the theories described previously, it was noted that none of them fully explain
every aspect of polishing. This, in turn, leads to an assumption that one or more of the
theories are actually working together in a combined hypothesis. A major push utilizing
this idea was by Cook [35] in the early 1990’s, in which he studied the combined
chemical-mechanical nature of polishing. This seminal paper on the subject provided a
great deal of inspiration for research and discussion.
In the work, a material removal process is described that is governed by both
mechanical and chemical interaction of the abrasive particles with the glass workpiece.
This type of removal mechanism was termed the ‘chemical tooth,’ versus the ‘mechanical
tooth’ indicative of an abrasive process. The bulk of the information in this chapter
comes from Cook [35], Osseo-Asare [37], and Paul [38], but care has been taken to
annotate the resource when specific information is supplied.
3.1 The Chemical Tooth Model
To explain the chemical tooth model, a particular interaction scheme will be used,
namely, silica (SiO2) glass polishing with metal oxide abrasive particles. This scheme
will mirror the experimentation in this thesis, and hopefully provide a better
understanding into goals of the research. A brief introduction to the importance that
water plays in the chemical model will be given, followed by the main steps in the theory.
18
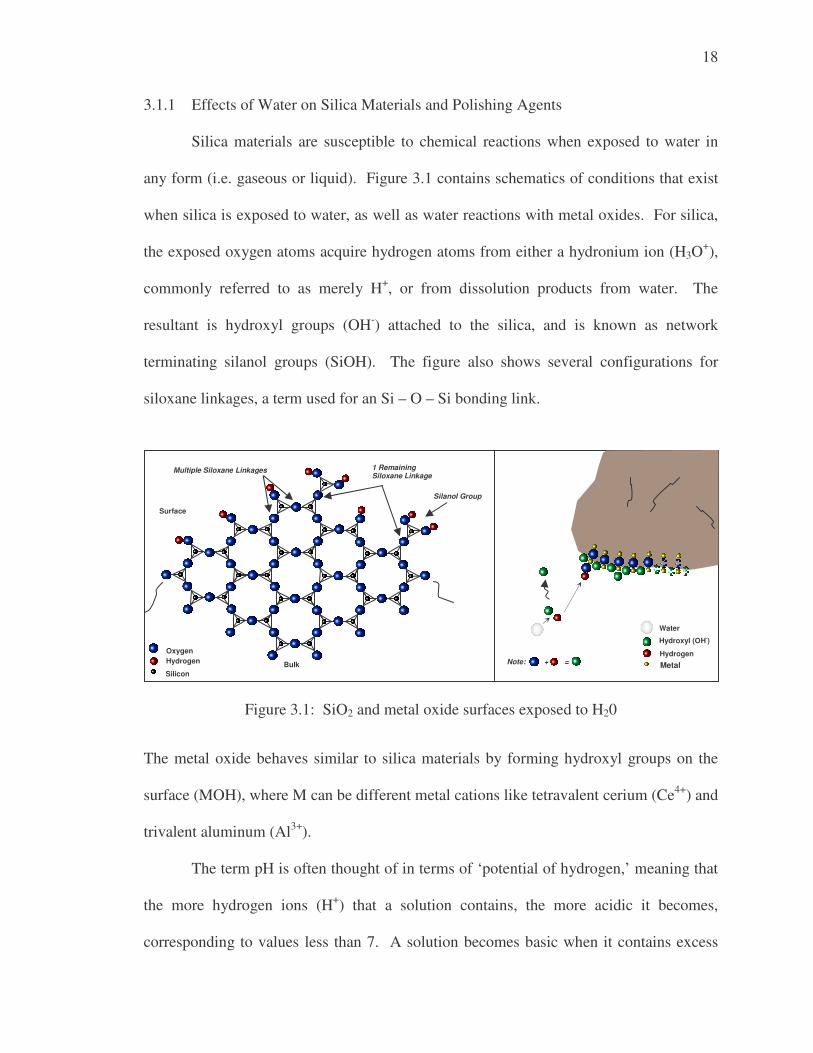
3.1.1 Effects of Water on Silica Materials and Polishing Agents
Silica materials are susceptible to chemical reactions when exposed to water in
any form (i.e. gaseous or liquid). Figure 3.1 contains schematics of conditions that exist
when silica is exposed to water, as well as water reactions with metal oxides. For silica,
the exposed oxygen atoms acquire hydrogen atoms from either a hydronium ion (H3O+),
commonly referred to as merely H+, or from dissolution products from water. The
resultant is hydroxyl groups (OH-) attached to the silica, and is known as network
terminating silanol groups (SiOH). The figure also shows several configurations for
siloxane linkages, a term used for an Si – O – Si bonding link.
Figure 3.1: SiO2 and metal oxide surfaces exposed to H20 The metal oxide behaves similar to silica materials by forming hydroxyl groups on the
surface (MOH), where M can be different metal cations like tetravalent cerium (Ce4+) and
trivalent aluminum (Al3+).
The term pH is often thought of in terms of ‘potential of hydrogen,’ meaning that
the more hydrogen ions (H+) that a solution contains, the more acidic it becomes,
corresponding to values less than 7. A solution becomes basic when it contains excess
Bulk
Surface
1 Remaining Siloxane Linkage
Multiple Siloxane Linkages
Oxygen Hydrogen
Silicon
Note: + =
Silanol Group
Water
Hydroxyl (OH-)
Hydrogen
Metal
19
hydroxyl ions (OH-), corresponding to values greater than 7. A solution pH of 7
corresponds to a neutral solution, or one that contains a relatively equal amount of
hydrogen and hydroxyl ions [39].
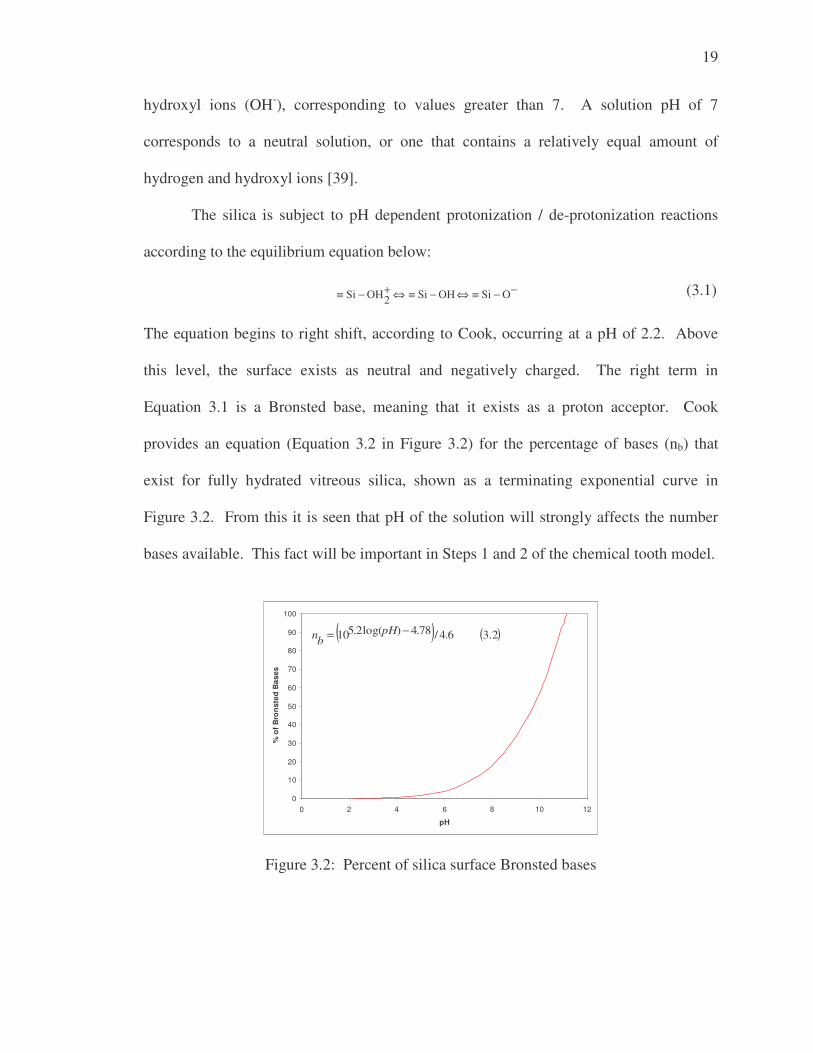
The silica is subject to pH dependent protonization / de-protonization reactions
according to the equilibrium equation below:
−−≡⇔−≡⇔+−≡ OSiOHSi2OHSi (3.1)
The equation begins to right shift, according to Cook, occurring at a pH of 2.2. Above
this level, the surface exists as neutral and negatively charged. The right term in
Equation 3.1 is a Bronsted base, meaning that it exists as a proton acceptor. Cook
provides an equation (Equation 3.2 in Figure 3.2) for the percentage of bases (nb) that
exist for fully hydrated vitreous silica, shown as a terminating exponential curve in
Figure 3.2. From this it is seen that pH of the solution will strongly affects the number
bases available. This fact will be important in Steps 1 and 2 of the chemical tooth model.
0
10
20
30
40
50
60
70
80
90
100
0 2 4 6 8 10 12
pH
% o
f B
ron
sted
Bas
es
( ) ( )3.2 6.4/78.4)log(2.510 −= pHbn
Figure 3.2: Percent of silica surface Bronsted bases
20
3.1.2 Steps in the Chemical Tooth Model
Steps One and Two
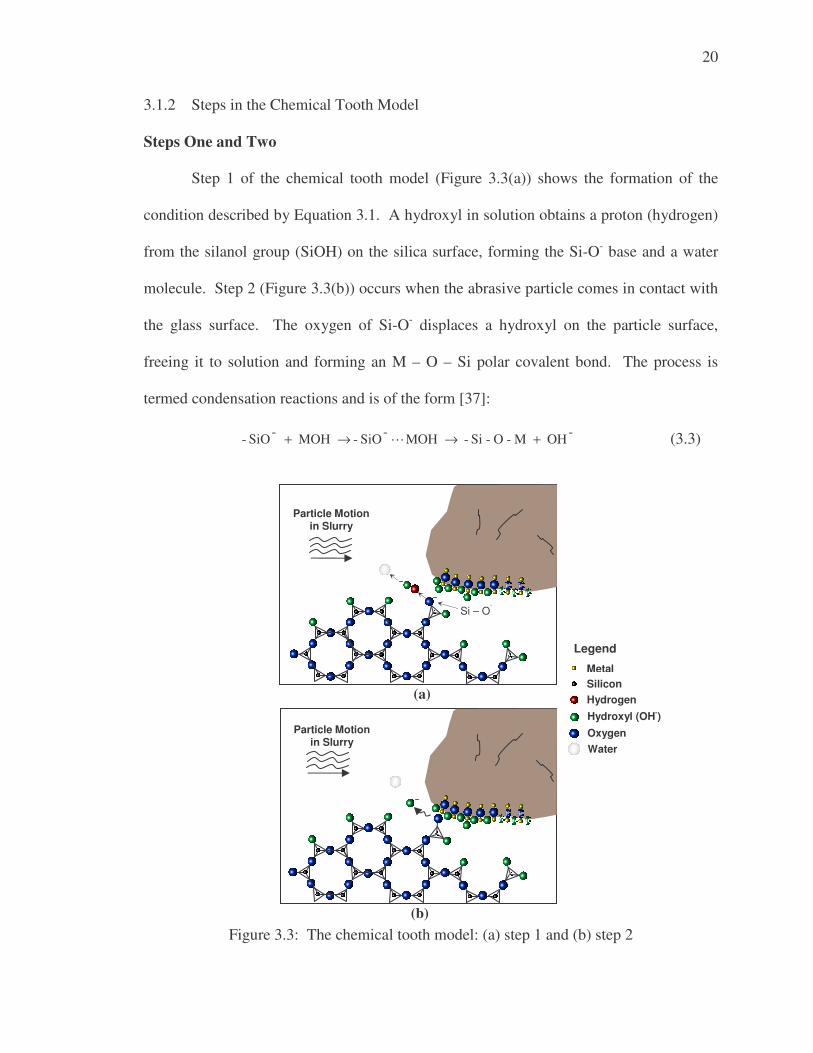
Step 1 of the chemical tooth model (Figure 3.3(a)) shows the formation of the
condition described by Equation 3.1. A hydroxyl in solution obtains a proton (hydrogen)
from the silanol group (SiOH) on the silica surface, forming the Si-O- base and a water
molecule. Step 2 (Figure 3.3(b)) occurs when the abrasive particle comes in contact with
the glass surface. The oxygen of Si-O- displaces a hydroxyl on the particle surface,
freeing it to solution and forming an M – O – Si polar covalent bond. The process is
termed condensation reactions and is of the form [37]:
-OH M-O-Si- MOH-SiO- MOH -SiO- +→→+ � (3.3)
Figure 3.3: The chemical tooth model: (a) step 1 and (b) step 2
Si – O�
Particle Motion in Slurry
Particle Motion in Slurry
(a)
(b)
Metal
Hydroxyl (OH-)
Water
Hydrogen
Oxygen
Silicon
Legend
21
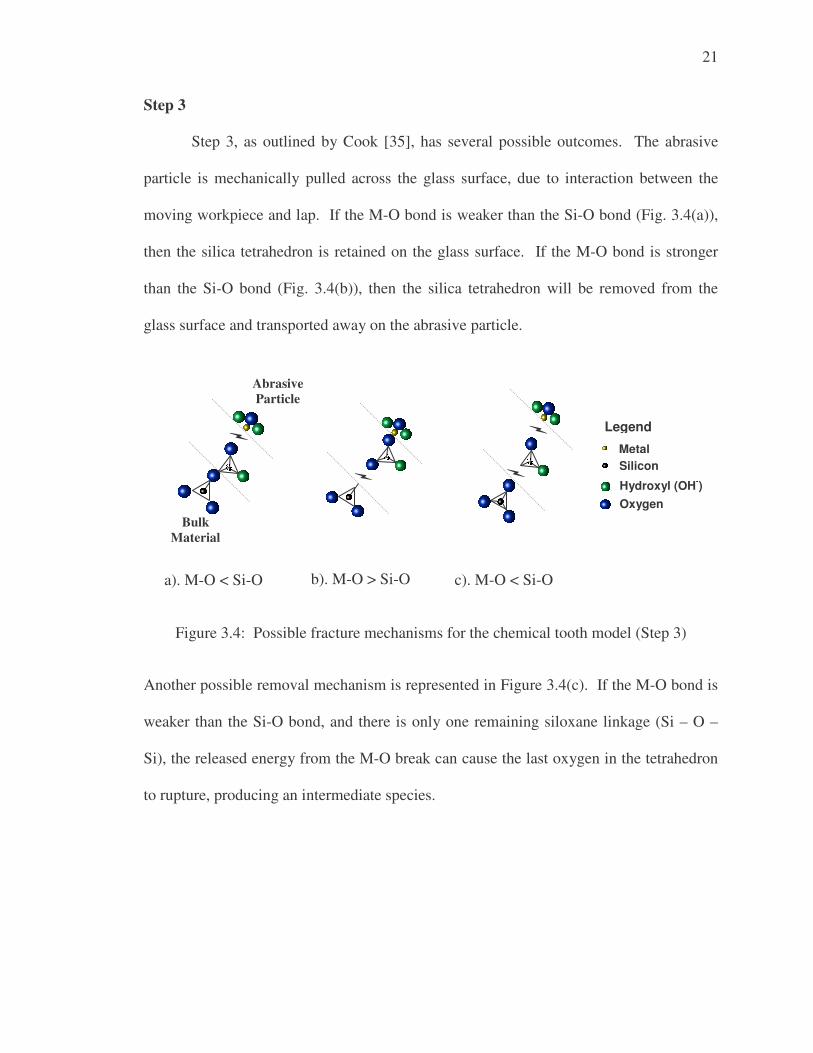
Step 3
Step 3, as outlined by Cook [35], has several possible outcomes. The abrasive
particle is mechanically pulled across the glass surface, due to interaction between the
moving workpiece and lap. If the M-O bond is weaker than the Si-O bond (Fig. 3.4(a)),
then the silica tetrahedron is retained on the glass surface. If the M-O bond is stronger
than the Si-O bond (Fig. 3.4(b)), then the silica tetrahedron will be removed from the
glass surface and transported away on the abrasive particle.
Figure 3.4: Possible fracture mechanisms for the chemical tooth model (Step 3)
Another possible removal mechanism is represented in Figure 3.4(c). If the M-O bond is
weaker than the Si-O bond, and there is only one remaining siloxane linkage (Si – O –
Si), the released energy from the M-O break can cause the last oxygen in the tetrahedron
to rupture, producing an intermediate species.
Abrasive Particle
Bulk Material
Metal
Hydroxyl (OH-) Oxygen
Silicon
Legend
a). M-O < Si-O b). M-O > Si-O c). M-O < Si-O
22
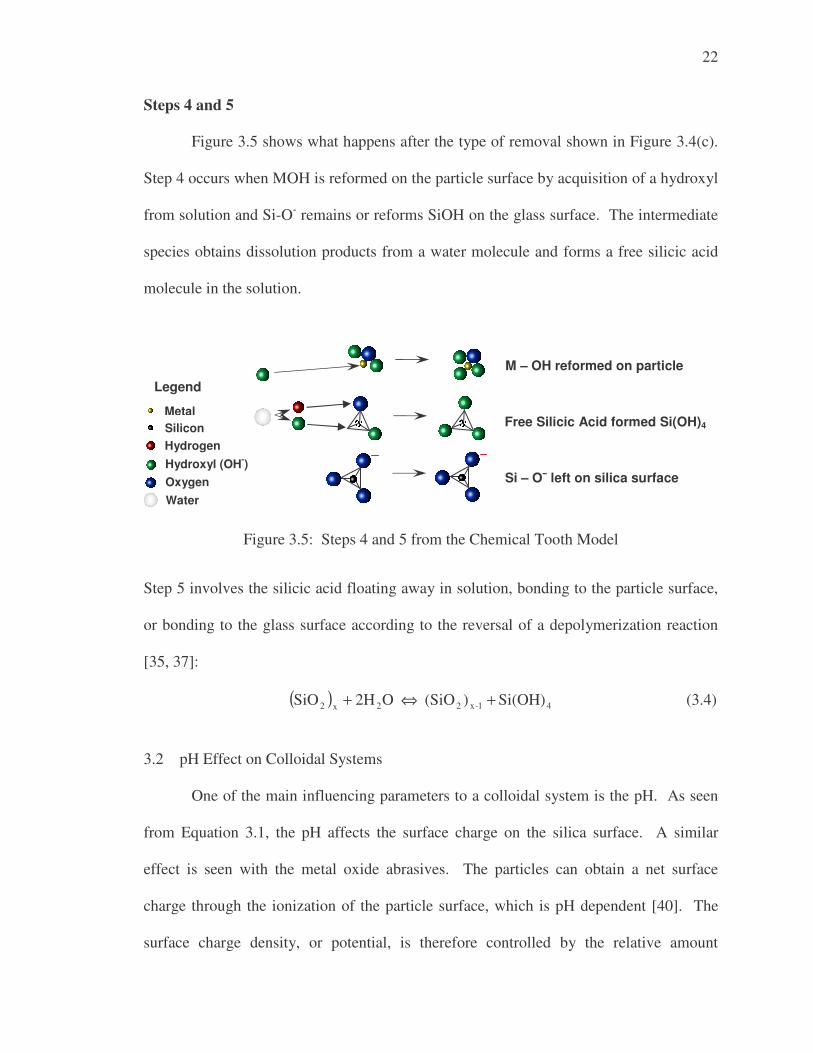
Steps 4 and 5
Figure 3.5 shows what happens after the type of removal shown in Figure 3.4(c).
Step 4 occurs when MOH is reformed on the particle surface by acquisition of a hydroxyl
from solution and Si-O- remains or reforms SiOH on the glass surface. The intermediate
species obtains dissolution products from a water molecule and forms a free silicic acid
molecule in the solution.
Figure 3.5: Steps 4 and 5 from the Chemical Tooth Model Step 5 involves the silicic acid floating away in solution, bonding to the particle surface,
or bonding to the glass surface according to the reversal of a depolymerization reaction
[35, 37]:
( ) 41-x22x2 Si(OH) )(SiO O2H SiO +⇔+ (3.4)
3.2 pH Effect on Colloidal Systems
One of the main influencing parameters to a colloidal system is the pH. As seen
from Equation 3.1, the pH affects the surface charge on the silica surface. A similar
effect is seen with the metal oxide abrasives. The particles can obtain a net surface
charge through the ionization of the particle surface, which is pH dependent [40]. The
surface charge density, or potential, is therefore controlled by the relative amount
M – OH reformed on particle
Free Silicic Acid formed Si(OH)4
Si – O� left on silica surface
Metal
Hydroxyl (OH-)
Water
Hydrogen
Oxygen
Silicon
Legend
23
potential determining ions, which is directly controlled by the pH in the case of metal
oxides. Equation 3.5 shows the metal oxide protonization / de-protonization reactions
[37, 41].
++
+−
=+
+=
)(2)()(
)()()(
Surfaqsurf
aqsurfsurf
MOHHMOH
HMOMOH (3.5)
In words, acidic solutions with excess H+ ions cause the particle to become more
positive by protonizing the surface ( +→++ 2MOH H MOH ). Basic solutions with excess OH-
cause the particle to become more negative by de-protonizing the surface to form water
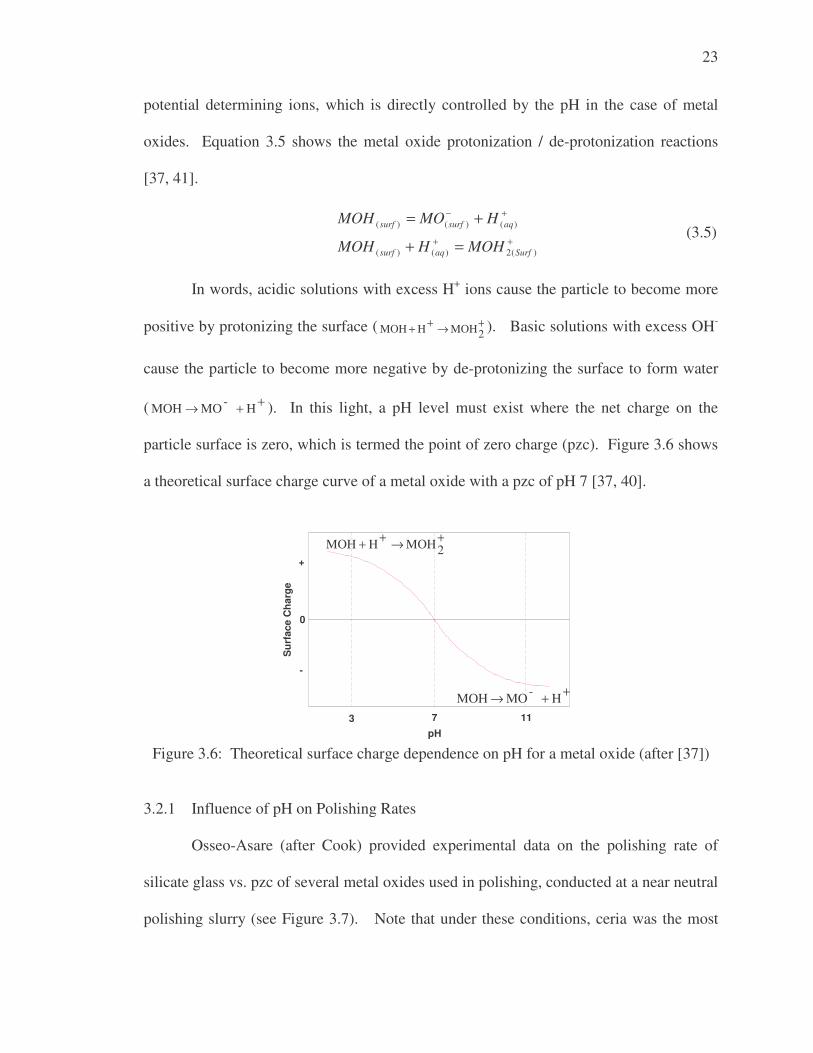
( ++→ H -MO MOH ). In this light, a pH level must exist where the net charge on the
particle surface is zero, which is termed the point of zero charge (pzc). Figure 3.6 shows
a theoretical surface charge curve of a metal oxide with a pzc of pH 7 [37, 40].
pH
-
+
0
Sur
face
Cha
rge
3 117
Figure 3.6: Theoretical surface charge dependence on pH for a metal oxide (after [37])
3.2.1 Influence of pH on Polishing Rates
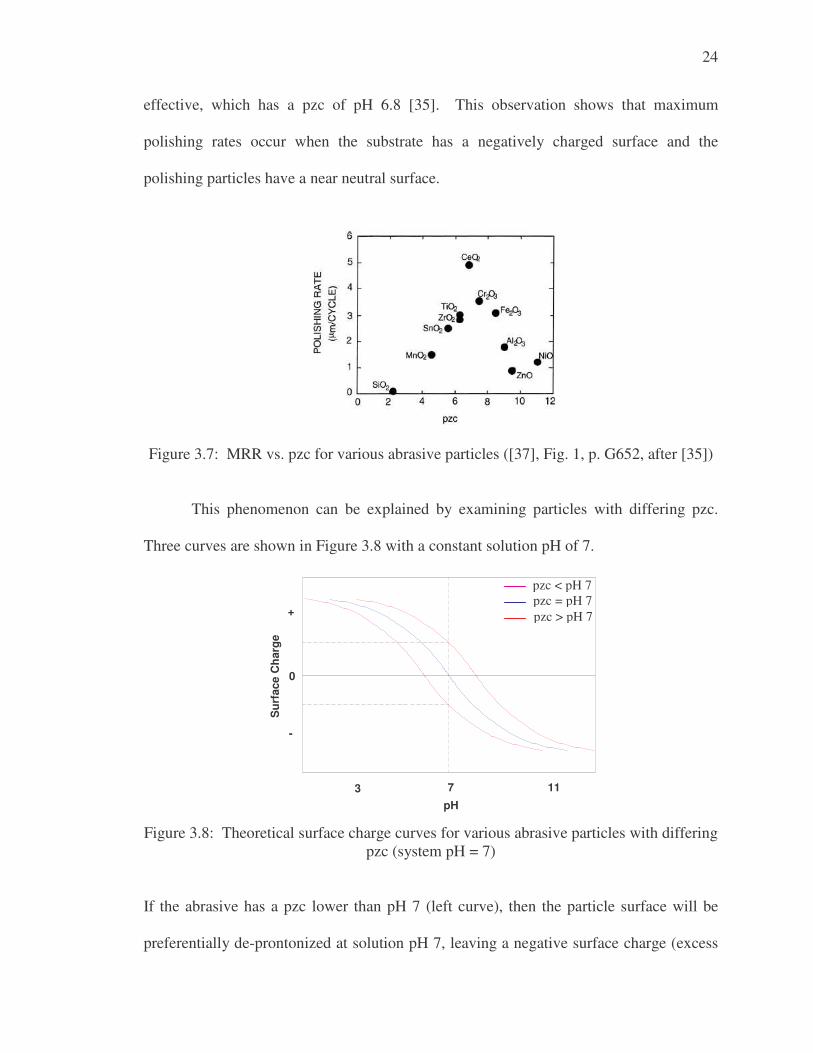
Osseo-Asare (after Cook) provided experimental data on the polishing rate of
silicate glass vs. pzc of several metal oxides used in polishing, conducted at a near neutral
polishing slurry (see Figure 3.7). Note that under these conditions, ceria was the most
+→++ 2MOH H MOH
++→ H -MO MOH
24
effective, which has a pzc of pH 6.8 [35]. This observation shows that maximum
polishing rates occur when the substrate has a negatively charged surface and the
polishing particles have a near neutral surface.
Figure 3.7: MRR vs. pzc for various abrasive particles ([37], Fig. 1, p. G652, after [35])
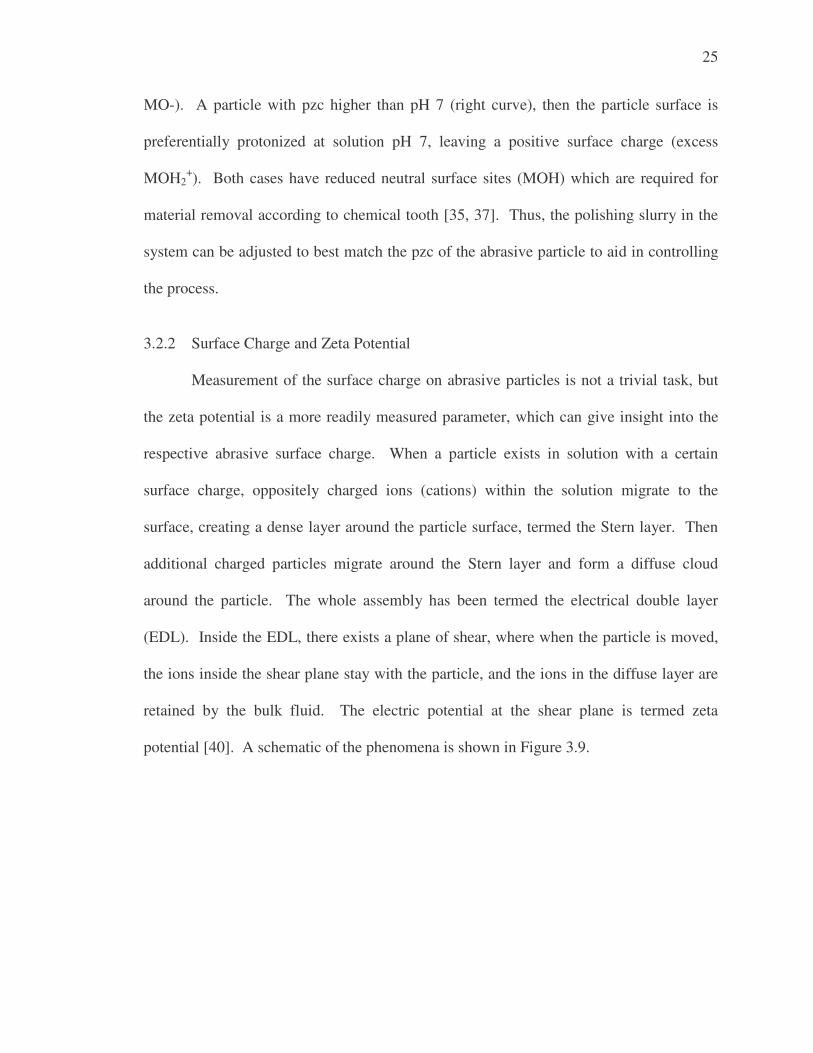
This phenomenon can be explained by examining particles with differing pzc.
Three curves are shown in Figure 3.8 with a constant solution pH of 7.
-
+
0
Sur
face
Cha
rge
pH3 117
Figure 3.8: Theoretical surface charge curves for various abrasive particles with differing
pzc (system pH = 7) If the abrasive has a pzc lower than pH 7 (left curve), then the particle surface will be
preferentially de-prontonized at solution pH 7, leaving a negative surface charge (excess
pzc < pH 7 pzc = pH 7 pzc > pH 7
25
MO-). A particle with pzc higher than pH 7 (right curve), then the particle surface is
preferentially protonized at solution pH 7, leaving a positive surface charge (excess
MOH2+). Both cases have reduced neutral surface sites (MOH) which are required for
material removal according to chemical tooth [35, 37]. Thus, the polishing slurry in the
system can be adjusted to best match the pzc of the abrasive particle to aid in controlling
the process.
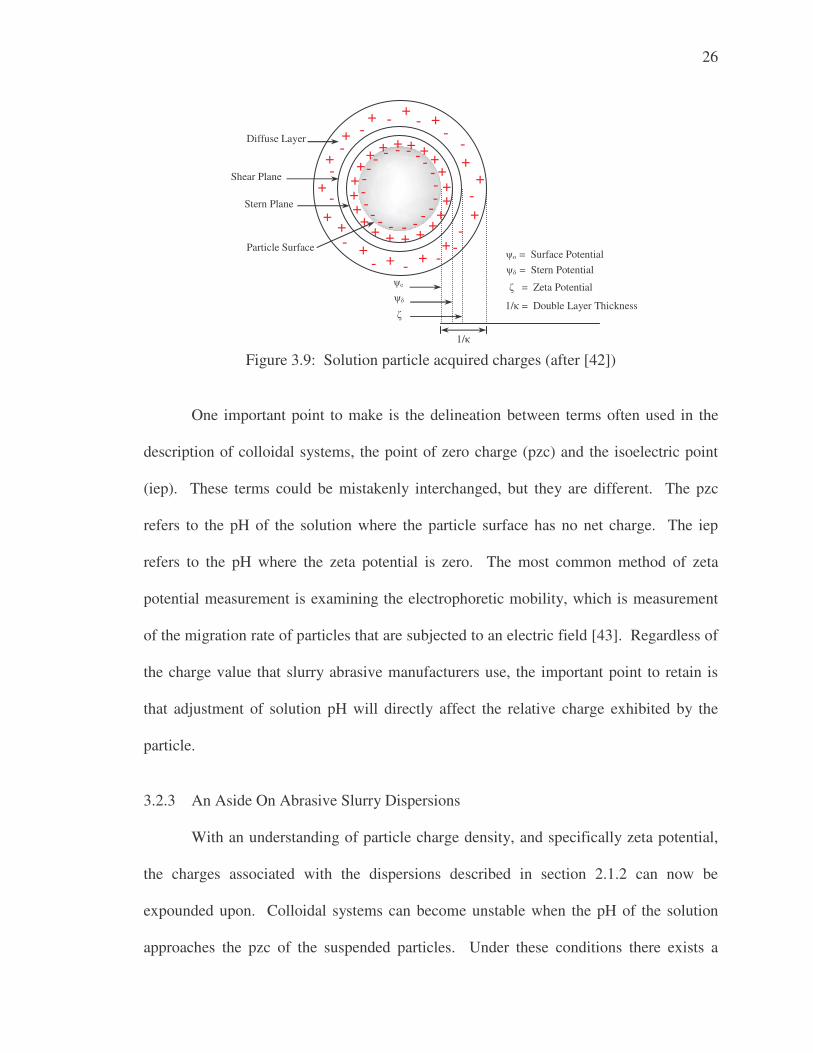
3.2.2 Surface Charge and Zeta Potential
Measurement of the surface charge on abrasive particles is not a trivial task, but
the zeta potential is a more readily measured parameter, which can give insight into the
respective abrasive surface charge. When a particle exists in solution with a certain
surface charge, oppositely charged ions (cations) within the solution migrate to the
surface, creating a dense layer around the particle surface, termed the Stern layer. Then
additional charged particles migrate around the Stern layer and form a diffuse cloud
around the particle. The whole assembly has been termed the electrical double layer
(EDL). Inside the EDL, there exists a plane of shear, where when the particle is moved,
the ions inside the shear plane stay with the particle, and the ions in the diffuse layer are
retained by the bulk fluid. The electric potential at the shear plane is termed zeta
potential [40]. A schematic of the phenomena is shown in Figure 3.9.
26
Figure 3.9: Solution particle acquired charges (after [42])
One important point to make is the delineation between terms often used in the
description of colloidal systems, the point of zero charge (pzc) and the isoelectric point
(iep). These terms could be mistakenly interchanged, but they are different. The pzc
refers to the pH of the solution where the particle surface has no net charge. The iep
refers to the pH where the zeta potential is zero. The most common method of zeta
potential measurement is examining the electrophoretic mobility, which is measurement
of the migration rate of particles that are subjected to an electric field [43]. Regardless of
the charge value that slurry abrasive manufacturers use, the important point to retain is
that adjustment of solution pH will directly affect the relative charge exhibited by the
particle.
3.2.3 An Aside On Abrasive Slurry Dispersions
With an understanding of particle charge density, and specifically zeta potential,
the charges associated with the dispersions described in section 2.1.2 can now be
expounded upon. Colloidal systems can become unstable when the pH of the solution
approaches the pzc of the suspended particles. Under these conditions there exists a
+
-
- +
+ + + +
+ + + +
+
+ + -
- - - - - - -
- - -
- -
+ +
+
+ +
+
-
-
-
- + +
+
+ +
+ +
- -
-
- - -
+ + - - -
+ +
+ + + +
+
-
-
- - -
-
-
�o
��
�
�o = Surface Potential �� = Stern Potential
� = Zeta Potential
1/�
1/� = Double Layer Thickness
Diffuse Layer
Shear Plane
Stern Plane
Particle Surface
27
potential for the particles to agglomerate into larger clumps, known as flocculation,
which occurs when the surface potentials are low enough for the moving particles to
overcome the repulsive forces and bond together. A general rule of thumb for solution
stability is a zeta potential of ± 30 mV. Methods to prevent flocculation include charge
stabilization by adding potential determining ions or charged polymeric chains to make
the particles preferentially positive or negative. Another method is the addition of
polymers to the solution, which attach to the particle surface and physically prevent
agglomeration by steric repulsion [40].
In reference to the Nanophase products used in this work, three of the ceria
slurries (CE-6080, CE-6082, GP-18HD) can be considered charge stabilized, in that they
contain negatively charged polymers that act to electrostatically repel individual particles.
As developed, these particles are considered anionic (e.g. left curve in Figure 3.8) in
recommended polishing pH values of 7-12 [10]. Thus, flocculation is prevented by
keeping a sufficiently large negative zeta potential. As a result, the pzc of the system
should be below pH 7, although the actual value is not known. Future measurements by
Nanophase of zeta potential will be supplied when it becomes available in early 2007.
The fourth polishing dispersion (CE-6086) can be considered non-ionic because
of the zero charged polymeric coating applied to the particles, which prevents
flocculation by steric repulsion in the range of recommended polishing conditions (pH 4-
11) [11]. It is important to note that these polymer additives are thought not to directly
interfere with the particles ability to polish, as they only serve to prevent flocculation in
the colloidal system. However, the effects will nonetheless be investigated.
28
3.3 Important Research Dealing with the Chemistry of Polishing
After publication of the method of chemical-mechanical removal by Cook,
research began to understand the implications. This research is continuing today and is
the underlying basis for the current work. However, it is important to understand the
work that others have done. An extensive literature review was accomplished for this
thesis and some of the more important papers findings are summarized here.
Hoshino
The chemical effects on polishing, and a proposed twist to the Cook model, was
offered by Hoshino, et al [44], who performed ceria polishing of SiO2 films. Through IR
spectroscopy, it was determined that polishing changed the surface structure of the thin
films, but the surface returned to a similar pre-polished condition when cleaned with an
HNO3/H2O2 bath. The noticed IR peak shift was attributed to Ce-O-Si bonding on the
surface because the acid bath would dissolve the cerium oxide, but would not break down
the silica bonds. The liquid phase of the polishing waste (after centrifugation) was
examined and the ratio of silica to ceria was similar to the measured concentration of
cerium and silicon. If material had been removed primarily by silicic acid formation, as
Cook postulated, then there should have been a much higher concentration of silicon
versus cerium in the polishing byproducts. Thus, it was speculated that SiO2 must have
existed as a lump on the polishing particles instead of silicic acid in solution. The
proposed model has the basic features of chemical tooth, only differing in speculation
that silica accretion on the particle surface is the dominant removal mechanism, versus
the formation of silicic acid being dominant.
29
There are some points to note about this model. It assumes that the silicic acid
would stay in solution, but according to chemical tooth, it can also rebond to either the
polishing particle or to the glass surface. Also, Cook stated that silicic acid formation
and subsequent removal was likely the primary mechanism. However, he also describes
a mode that will allow for direct abstraction of the silica tetrahedron from the glass
surface. Hoshino describes a similar process, only he shows multiple tetrahedra removal
through different bonding sites on the particle surface. Cook does not refute this; he only
states that a single Si-O-M bond would not be capable of removing multiple tetrahedra.
Although there are some disagreements, the paper still highlights the importance of the
chemical aspect of polishing.
Abiade and Choi Abiade and Choi [45] studied pH effects on the polishing of silica thin films
deposited on a silicon substrate. In this work, zeta potential of the ceria based slurries
were measured along with the respective polishing rates. It was found that maximum
material removal occurred at pH ~ 6, which was also the measured iep of the ceria slurry.
Low removal rates were generated in acidic conditions and intermediate removal rates
were obtained at basic conditions. The higher removal rates at the elevated pH levels
were attributed to the enhanced dissolution of the silica in the corrosive environment.
Suphantharida and Osseo-Asare
Suphantharida and Osseo-Asare [46] studied zeta potential effects and silica
adsorption on ceria solutions. The experiments did not use polishing slurries, rather
solutions of ceria particles with varying amount of silicate ions added to determine end
30
effects. However, the experiments are directly comparable to the conditions found in
polishing. Several interesting observations were made in this paper. First, it was shown
that the zeta potential curves shift left with increasing concentrations of silicate ions in
the pH range of 2-12. This shift showed that the pzc of the ceria particles, with increased
addition of silicate ions, approached that of silica. For this to occur there would have to
be substantial accretion of silicate ions on the ceria surfaces.
Another important observation was that maximum adsorption was found to take
place near pH 9. At this level, both the silicate ions and ceria particles would be
negatively charged and would be expected to repel one another. Thus, it is rationalized
that the two species must be chemically bonding, versus bonding through charge forces.
This observation tends to suspect that maximum removal rates would occur at pH 9
versus the chemical tooth prediction of pH 6.8.
Cumbo
Cumbo, et al [47], studied pH effects on the polishing of fused silica, BK7
borosilicate glass, and SF6 dense flint glass. Particle size and zeta potential
measurements were made of three different commercial slurries (CeO2, m-ZrO2, and n-
Al2O3) used in a slurry recirculation polishing system. It was shown that, with the
exception of the CeO2/SF6 combination, the maximum removal rate occurred at the
conditions where the particle pzc was closest to the slurry pH (i.e. pH 7 for CeO2, pH 4
for ZrO2, and pH 10 for Al2O3). This seems to support the Cook model, but it was shown
that removal rate predictions with the chemical tooth model did not always correlate with
experimental results when the glasses were subject to solutions that were corrosive to the
glasses (i.e. acidic to neutral for SF6 and neutral to basic for BK7).
31
Of greatest interest to the scope of this thesis is the fact that average ceria particle
size increased for neutral and acidic solutions, and decreased for basic solutions during
polishing. This could be an important factor in surface finish results, since the current
work will utilize a slurry recirculation system. For all combinations of particle-glass
interaction, it was found that fluid pH and particle pzc is the adjustable parameter which
can influence the polishing process. Additionally, they noted the chemical component
could be comparable, or even dominate, the mechanical forces [47].
Tesar
Tesar [48], et al, also studied the effects of pH on the resulting surface finish. The
trends on MRR are also highlighted, via the calculated Preston Coefficient, which has
mass loss as the only variable. The study found that silica polishing with Hastilite PO
brand ceria slurry produced higher MRR and better surface finishes at a pH of 4 versus a
pH of 7. When silica was polished with Opaline (a higher purity ceria slurry) at pH 4, the
removal rate was much lower, but the surface finish was nearly exactly that achieved
with Hastilite at pH 4. Regardless of the removal rates, the work showed that higher
quality silica surface finishes could be achieved with low pH ceria slurry.
This observation disagrees with Cumbo’s findings. However, the Cumbo paper
offers an explanation that the probable difference is that Tesar dispensed the slurry at low
rates (1.2 mL/min) in a non-recirculating system versus their flow rates of 3 mL/s in a
recirculating system. This potentially negated the buildup of silica chemical species
within the solution and prevented agglomeration of the particles [47]. Relevant findings
of both papers are provided in Table 3.1.
32
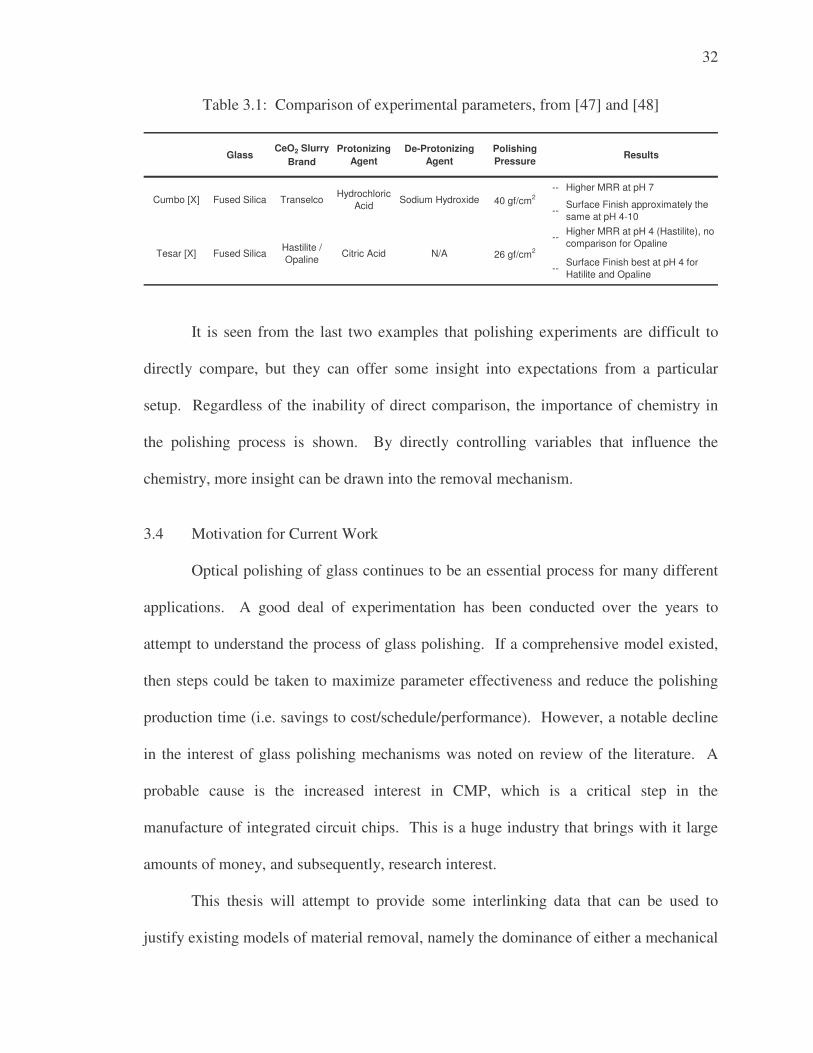
Table 3.1: Comparison of experimental parameters, from [47] and [48]
GlassCeO2 Slurry
BrandProtonizing
AgentDe-Protonizing
AgentPolishing Pressure
Results
-- Higher MRR at pH 7
--Surface Finish approximately the same at pH 4-10
-- Higher MRR at pH 4 (Hastilite), no comparison for Opaline
--Surface Finish best at pH 4 for Hatilite and Opaline
Cumbo [X] Fused Silica TranselcoHydrochloric
AcidSodium Hydroxide 40 gf/cm2
26 gf/cm2N/ACitric AcidHastilite / Opaline
Fused SilicaTesar [X]
It is seen from the last two examples that polishing experiments are difficult to
directly compare, but they can offer some insight into expectations from a particular
setup. Regardless of the inability of direct comparison, the importance of chemistry in
the polishing process is shown. By directly controlling variables that influence the
chemistry, more insight can be drawn into the removal mechanism.
3.4 Motivation for Current Work
Optical polishing of glass continues to be an essential process for many different
applications. A good deal of experimentation has been conducted over the years to
attempt to understand the process of glass polishing. If a comprehensive model existed,
then steps could be taken to maximize parameter effectiveness and reduce the polishing
production time (i.e. savings to cost/schedule/performance). However, a notable decline
in the interest of glass polishing mechanisms was noted on review of the literature. A
probable cause is the increased interest in CMP, which is a critical step in the
manufacture of integrated circuit chips. This is a huge industry that brings with it large
amounts of money, and subsequently, research interest.
This thesis will attempt to provide some interlinking data that can be used to
justify existing models of material removal, namely the dominance of either a mechanical
33
or chemical material removal model. A new hypothesis will not be proposed, but some
amount of justification will be provided. Previous experiments that look at the role of
chemistry in glass polishing [27, 35, 36, 37, 44, 46, 47, 48] offer some amount of
disagreement as to the optimum slurry conditions with regards to material removal and
surface finish. Through variation of several easily controlled parameters (particle size,
density and pH), attempts will be made to understand these optima, and help to delineate
factors influencing the chemical and mechanical models.
The effects on surface finish will also be heavily addressed. With an increased
need for low surface roughness optics, as in x-ray and enhanced ultra-violet applications,
it is imperative to understand the impacts of changing system variables. The results will
also be used as baselines for ongoing theoretical modeling being conducted by Dr. Ed
Paul from Stockton College, NJ.
CHAPTER 4: EXPERIMENTAL PROCEDURES
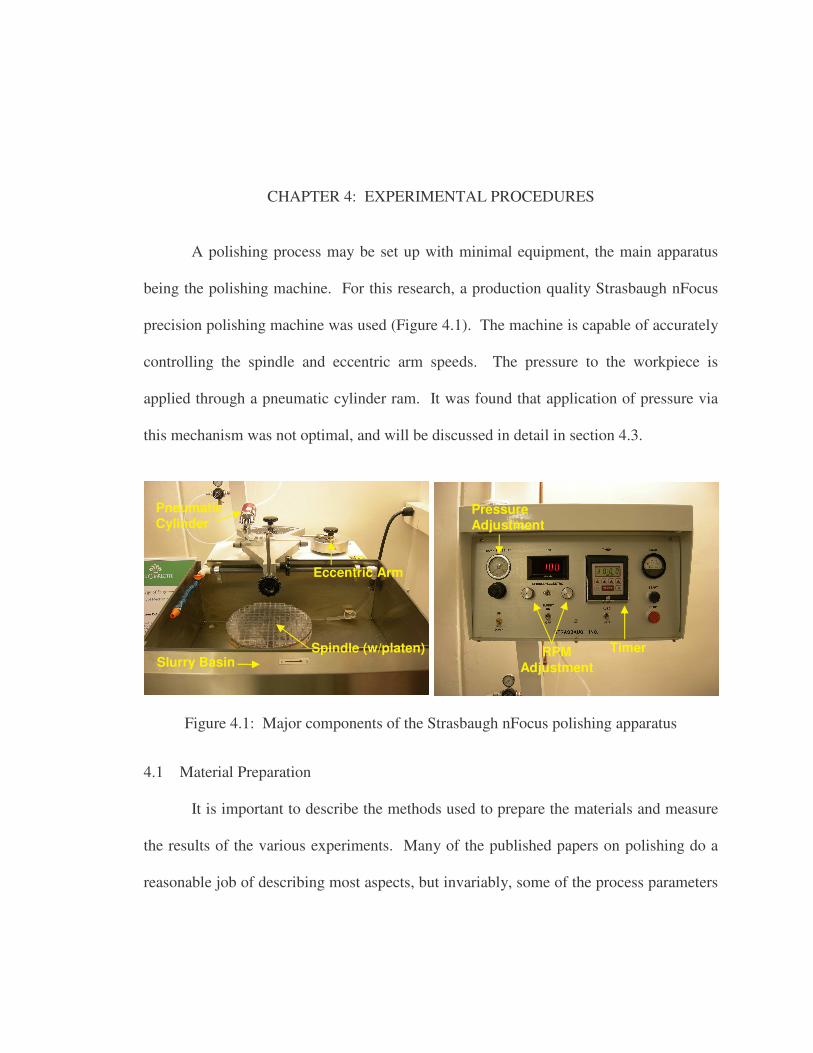
A polishing process may be set up with minimal equipment, the main apparatus
being the polishing machine. For this research, a production quality Strasbaugh nFocus
precision polishing machine was used (Figure 4.1). The machine is capable of accurately
controlling the spindle and eccentric arm speeds. The pressure to the workpiece is
applied through a pneumatic cylinder ram. It was found that application of pressure via
this mechanism was not optimal, and will be discussed in detail in section 4.3.
Figure 4.1: Major components of the Strasbaugh nFocus polishing apparatus 4.1 Material Preparation
It is important to describe the methods used to prepare the materials and measure
the results of the various experiments. Many of the published papers on polishing do a
reasonable job of describing most aspects, but invariably, some of the process parameters
Eccentric Arm
Pneumatic Cylinder
Slurry Basin Timer
Pressure Adjustment
RPM Adjustment
Spindle (w/platen)
35
needed to reproduce the experiments are omitted. In an effort to avoid this, complete
details will be provided for the experimental process.
4.1.1 Pitch Tooling
As described in section 2.1.1, Acculap synthetic pitch was used for the majority of
the experimentation. Two pitch tools were manufactured to match the abrasive slurries,
one for the larger abrasive slurry (750 nm) and one for the small abrasive slurries (40 and
20 nm). Several iterations of tools were made to ensure uniformity. Manufacture of the
pitch tooling consists of three basic steps: pouring, channeling, and run-in.
Pouring the Pitch Tool
To create a pitch tool, the viscosity of the pitch is lessened through heat addition
and then poured onto a cast iron or aluminum platen. The heat can be introduced by
immersion of a pitch container in a water bath, or through a convection oven. For the
water bath technique, the pitch was broken up and placed in a glass container, which was
immersed in another water filled container resting on a laboratory hot plate. Using this
method required constant stirring of the pitch to heat thoroughly, due to the open air heat
sink of the glass container, which led to the development of bubbles. As the tool cooled,
the bubbles would create blow-outs on the tool surface. Several tools were made in this
manner, each having the same basic surface. The voids are undesirable because it
effectively reduces the amount of surface area available for polishing. It is important to
note that the voids would likely have little effect on the resulting surface finish of a
workpiece, but could influence removal rates. The convection oven technique was used
because it reduced the amount of stirring necessary, since it was heated in all directions,
and resulted in almost no bubble formation.
36
The platens were prepared by thoroughly cleaning the surface with acetone and
constructing a dam wall out of duct tape to provide the desired tool thickness of 0.5 in
(1.27 cm). The only purpose of the dam was to prevent the pitch from flowing off of the
tool, since the viscosity at pouring temperature was comparable to thick syrup. Once
poured, the tool was left on a flat surface and allowed to cool overnight.
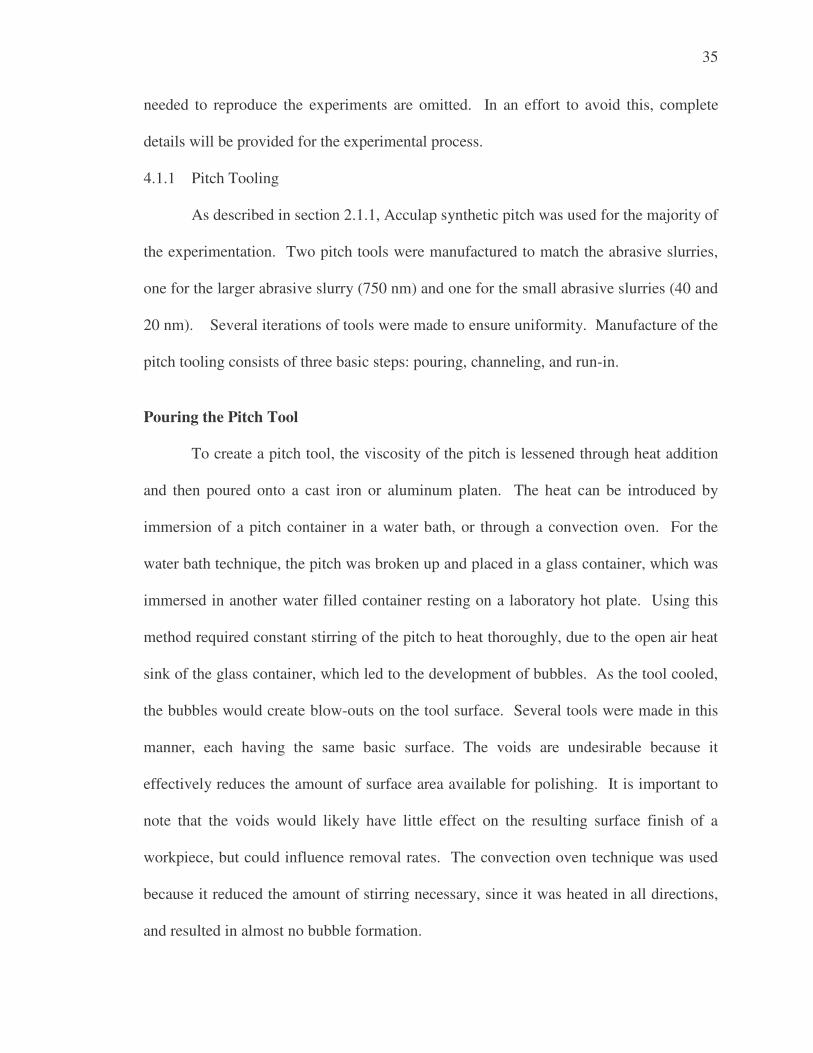
Channeling the Pitch Tool
It is critical to have channels in any type of polishing lap to promote the flow of
slurry to and transport material away from the workpiece. The shape of the channels, as
mentioned previously, can have an effect on polishing conditions. Opticians will likely
develop a feel for what patterns should be used based upon application, but the concept is
still very subjective. For this work, a simple square grid pattern was employed, with a
square channel cross section (see Figure 4.2).
All dimensions in inches Figure 4.2: Pitch tool pattern with cross-sectional cutaway
The channels were formed by ‘cutting’ the pitch through successive passes of a
coarse tooth saw blade typically found on horizontal band saws. Both fine and course
teeth blades were tried, but it was found that the fine tooth blade tended to clog up with
material rapidly, reducing the amount of material removed. This not only increased
37
production time, but increased the risk of the blade catching an adjacent facet, causing
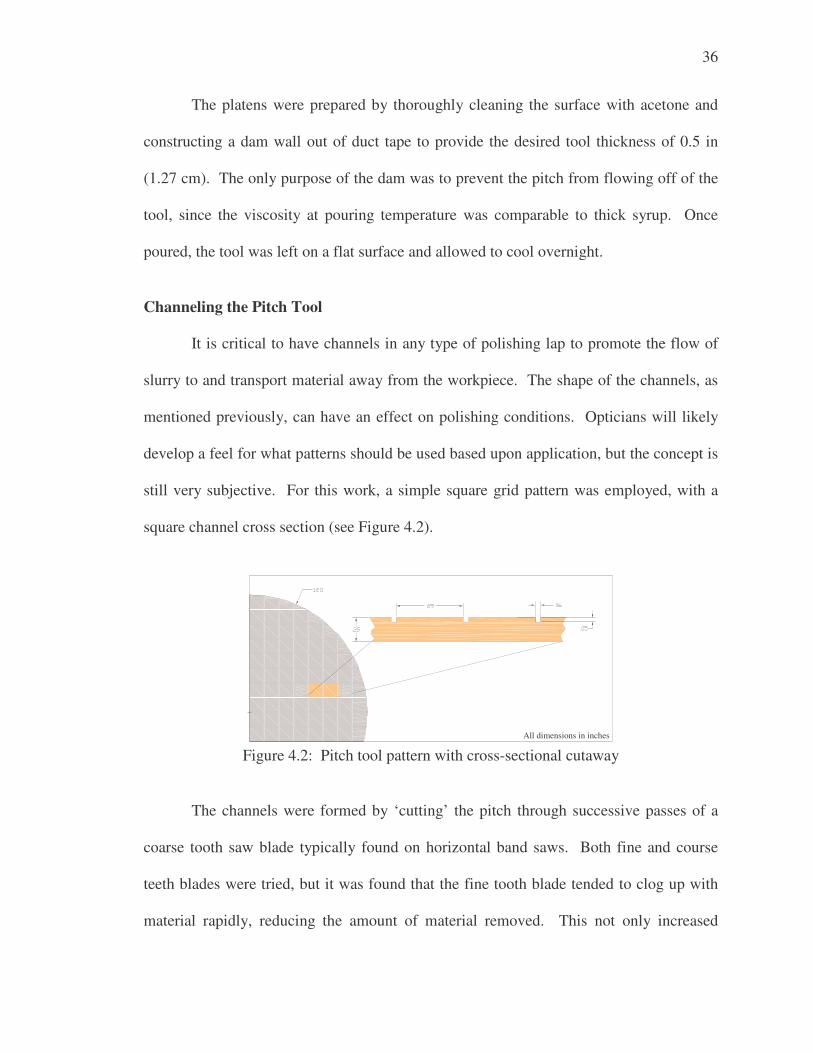
excessive chip out of the polisher. A typical tool took 3-4 hours to channel, with time
increasing depending on the channel depth. Figure 4.3 shows a completed pitch tool.
Figure 4.3: Typical channeled pitch tool (12 inch diameter)
Run-In of the Pitch Tool
After the tool is built, it is necessary to break it in to a level suitable for polishing.
A piece of glass is first heated under hot water and then pressed against the surface,
moving in circular patterns. This step helps to remove any protruding chips and flattens
down any high spots.
The next step is to build up a layer of abrasive particles on the tool surface,
accomplished by simply polishing a representative piece of glass with the desired slurry.
A pitch tool is considered ready for use when a visible crust develops on the polishing
surface, which is indicative of abrasive particles embedding in the surface. The 750 nm
tool developed a defined crust at 4 hours polishing time. The small abrasive tool (40 and
20 nm abrasive) also developed a crust, but it was much finer and difficult to see due to
the relative size of the abrasives embedded in the tool. To ensure an effective run-in
cycle, the tool was conditioned with a 40 nm abrasive slurry for 12 hours, 3 times that of
38
the 750 nm tool. During this period, the crust was not visibly changing and thus
considered to be at a point to begin experimentation.
4.1.2 Abrasive Slurry
The slurries were prepared as close as possible to the Nanophase provided
guidelines. Before diluting the solution, the container was shaken by hand until there was
no visible sedimentation on the interior surface (~5-10 minutes). To facilitate good
particle distribution, the container was mounted on a sufficiently violent vibration table
for an additional 20 minutes [49]. The contents were then diluted with 18 M� filtered
de-ionized (DI) water at the ratio of 10:1 water to slurry. The DI water was obtained
from the UNCC clean room system located in the Cameron Applied Research Center.
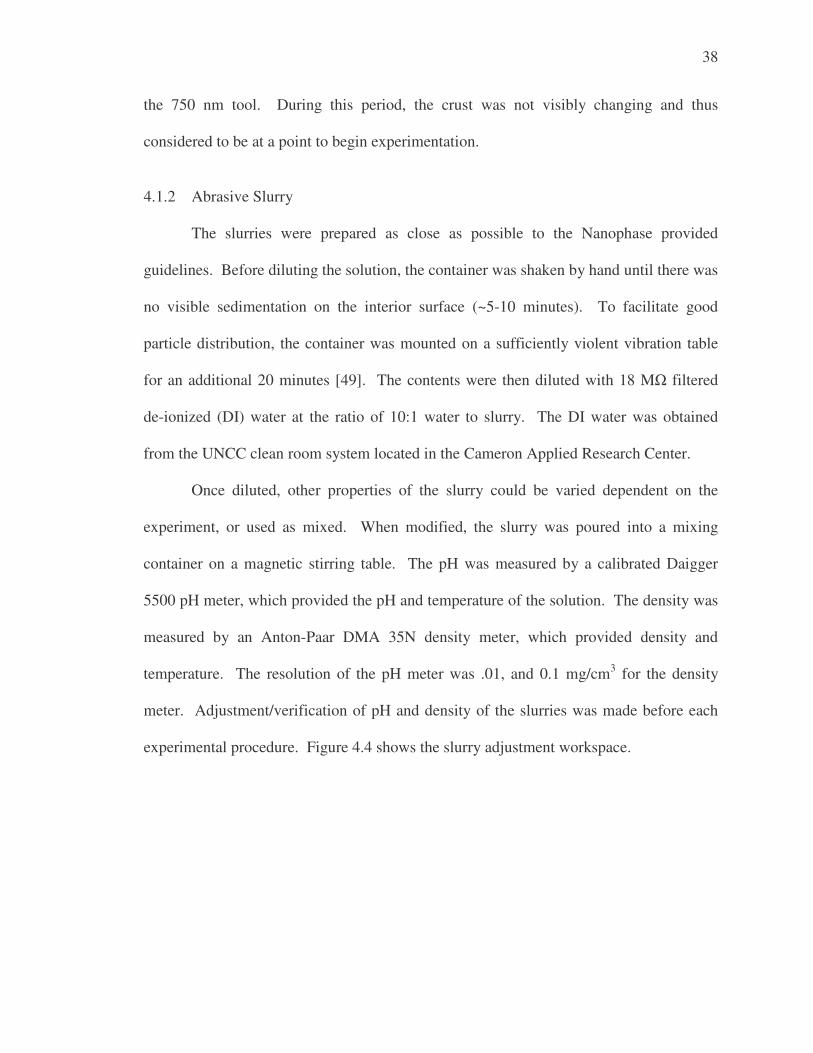
Once diluted, other properties of the slurry could be varied dependent on the
experiment, or used as mixed. When modified, the slurry was poured into a mixing
container on a magnetic stirring table. The pH was measured by a calibrated Daigger
5500 pH meter, which provided the pH and temperature of the solution. The density was
measured by an Anton-Paar DMA 35N density meter, which provided density and
temperature. The resolution of the pH meter was .01, and 0.1 mg/cm3 for the density
meter. Adjustment/verification of pH and density of the slurries was made before each
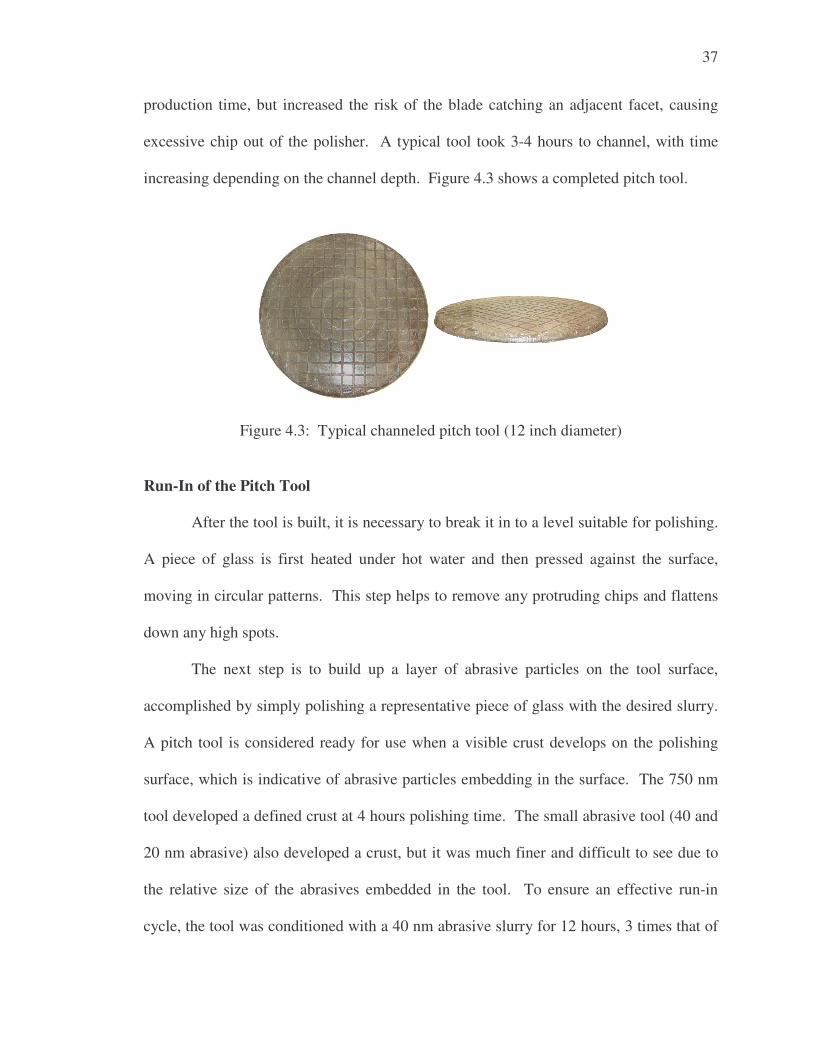
experimental procedure. Figure 4.4 shows the slurry adjustment workspace.
39
Density Meter
pH Probe System
Magnetic Stirrer
Density Meter
pH Probe System
Magnetic Stirrer
Figure 4.4: Density and pH adjustment area
The pH was controlled by adding nitric acid (HNO3) to increase acidity and
sodium hydroxide (NaOH) to increase basicity. These materials were used because they
are non-reactive with both silica glass and cerium oxide, and recommended by the slurry
manufacturer [49]. The materials were obtained from the UNC-Charlotte chemistry
department, in concentrations of 6M nitric acid and 3M sodium hydroxide. The different
molarities had no operational impact, except that a certain amount of acid would shift pH
more than the same amount of the weaker solution base.
4.1.3 Workpiece Material
In order to adequately capture the polishing variable effects, the starting surfaces
needed to be polished to a relatively high degree. The value chosen was around 1 nm Ra,
as measured with the 2.5X Michelson objective on a white light interferometer.
Polishing to this level was accomplished with Opaline and a polyurethane pad, and then a
final polish with CE-6080 (750 nm) ceria slurry on pitch. The as received surfaces were
very different, with the quartz having a decent ground surface and the fused silica having
a surface more indicative of being sawn with a light grinding.
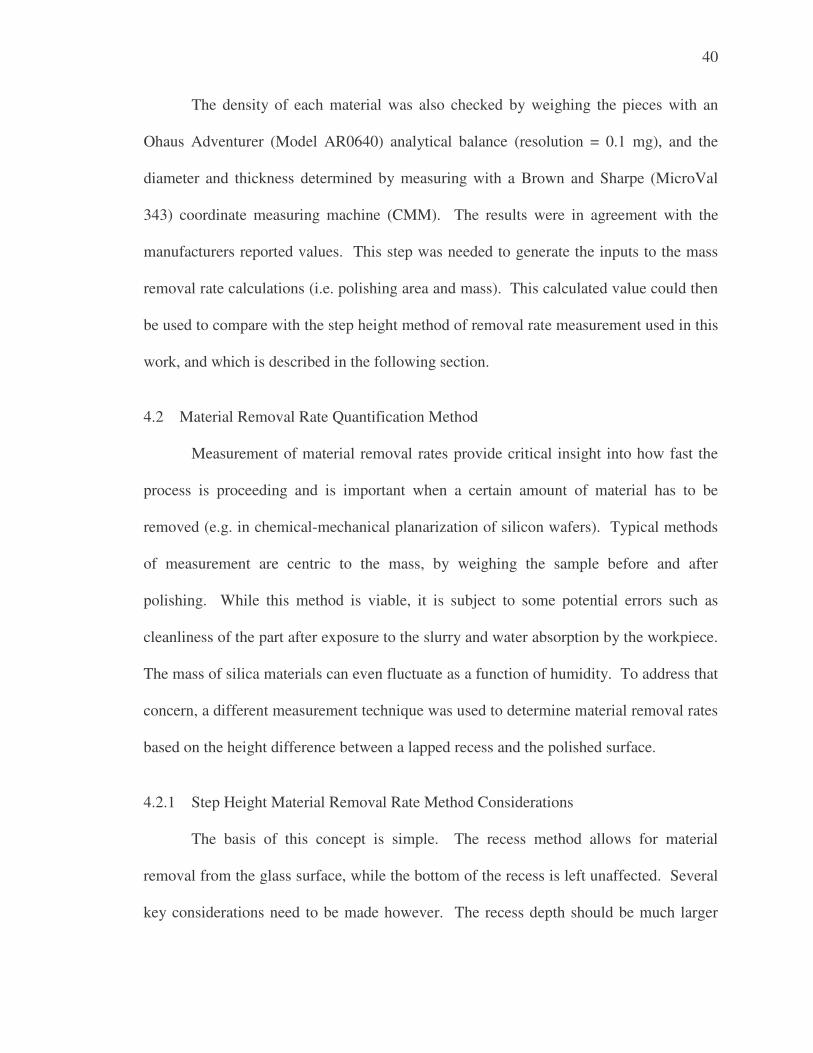
40
The density of each material was also checked by weighing the pieces with an
Ohaus Adventurer (Model AR0640) analytical balance (resolution = 0.1 mg), and the
diameter and thickness determined by measuring with a Brown and Sharpe (MicroVal
343) coordinate measuring machine (CMM). The results were in agreement with the
manufacturers reported values. This step was needed to generate the inputs to the mass
removal rate calculations (i.e. polishing area and mass). This calculated value could then
be used to compare with the step height method of removal rate measurement used in this
work, and which is described in the following section.
4.2 Material Removal Rate Quantification Method
Measurement of material removal rates provide critical insight into how fast the
process is proceeding and is important when a certain amount of material has to be
removed (e.g. in chemical-mechanical planarization of silicon wafers). Typical methods
of measurement are centric to the mass, by weighing the sample before and after
polishing. While this method is viable, it is subject to some potential errors such as
cleanliness of the part after exposure to the slurry and water absorption by the workpiece.
The mass of silica materials can even fluctuate as a function of humidity. To address that
concern, a different measurement technique was used to determine material removal rates
based on the height difference between a lapped recess and the polished surface.
4.2.1 Step Height Material Removal Rate Method Considerations
The basis of this concept is simple. The recess method allows for material
removal from the glass surface, while the bottom of the recess is left unaffected. Several
key considerations need to be made however. The recess depth should be much larger
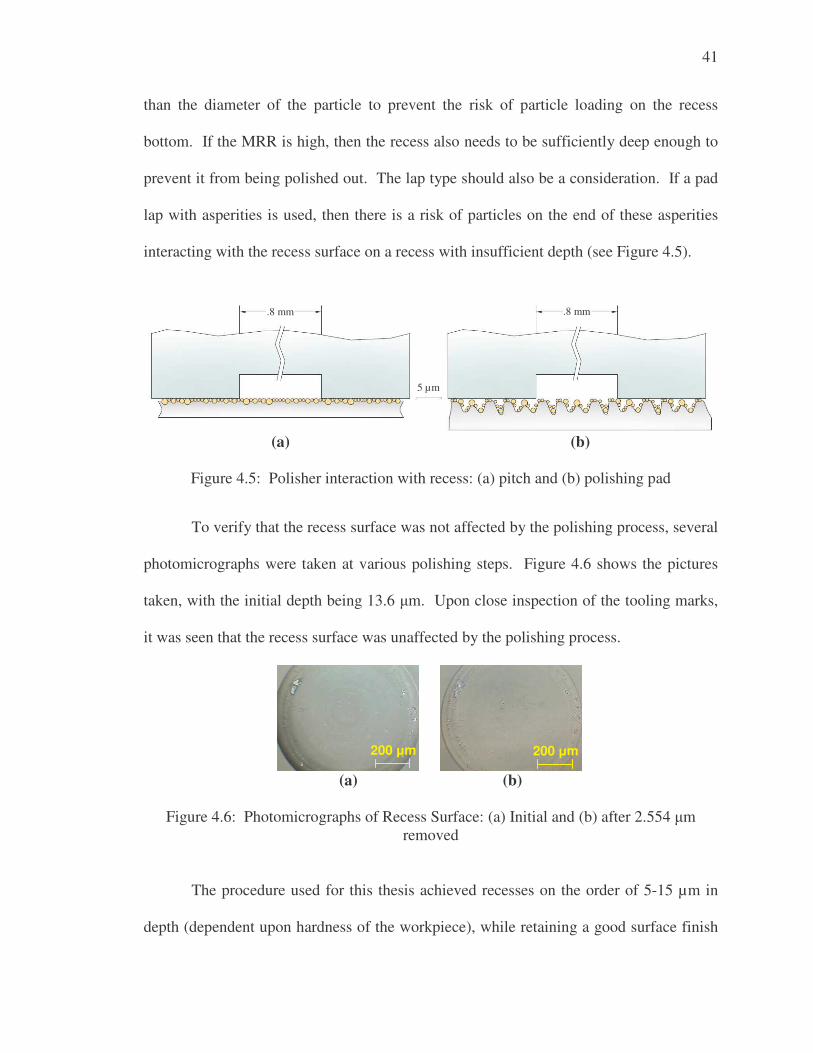
41
than the diameter of the particle to prevent the risk of particle loading on the recess
bottom. If the MRR is high, then the recess also needs to be sufficiently deep enough to
prevent it from being polished out. The lap type should also be a consideration. If a pad
lap with asperities is used, then there is a risk of particles on the end of these asperities
interacting with the recess surface on a recess with insufficient depth (see Figure 4.5).
(a) (b)
Figure 4.5: Polisher interaction with recess: (a) pitch and (b) polishing pad To verify that the recess surface was not affected by the polishing process, several
photomicrographs were taken at various polishing steps. Figure 4.6 shows the pictures
taken, with the initial depth being 13.6 �m. Upon close inspection of the tooling marks,
it was seen that the recess surface was unaffected by the polishing process.
(a) (b)
Figure 4.6: Photomicrographs of Recess Surface: (a) Initial and (b) after 2.554 �m removed
The procedure used for this thesis achieved recesses on the order of 5-15 µm in
depth (dependent upon hardness of the workpiece), while retaining a good surface finish
200 �m 200 �m
5 µm
.8 mm .8 mm
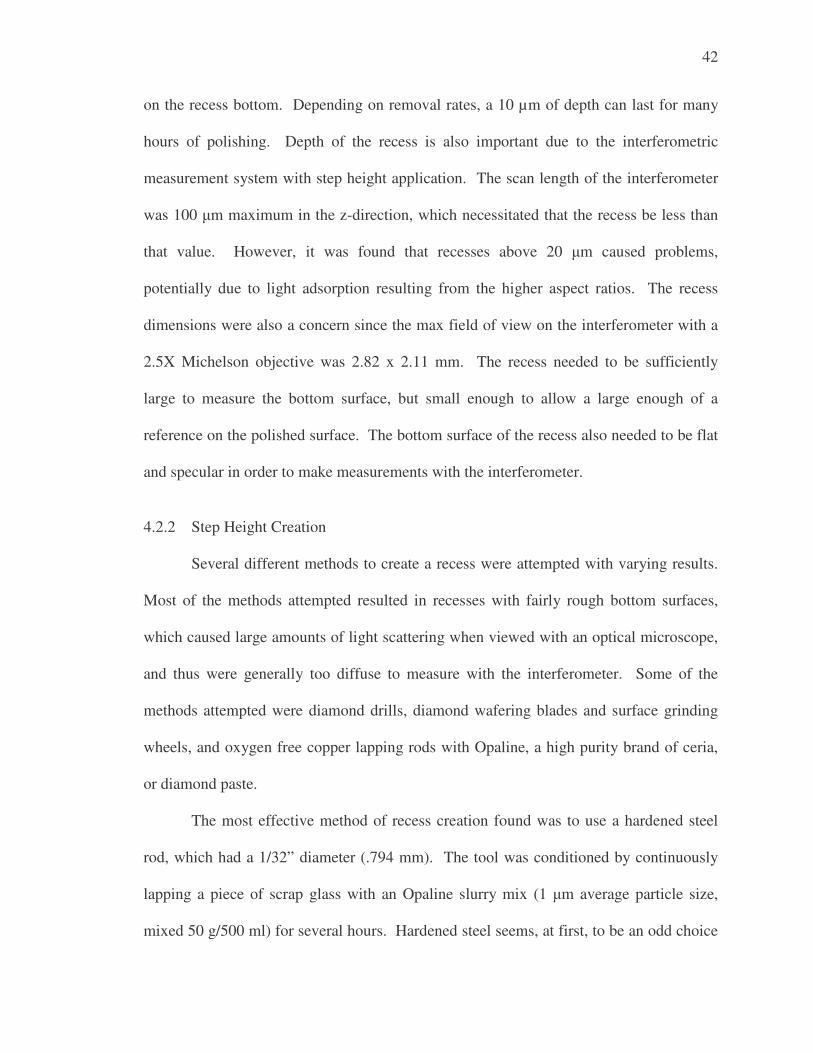
42
on the recess bottom. Depending on removal rates, a 10 µm of depth can last for many
hours of polishing. Depth of the recess is also important due to the interferometric
measurement system with step height application. The scan length of the interferometer
was 100 �m maximum in the z-direction, which necessitated that the recess be less than
that value. However, it was found that recesses above 20 �m caused problems,
potentially due to light adsorption resulting from the higher aspect ratios. The recess
dimensions were also a concern since the max field of view on the interferometer with a
2.5X Michelson objective was 2.82 x 2.11 mm. The recess needed to be sufficiently
large to measure the bottom surface, but small enough to allow a large enough of a
reference on the polished surface. The bottom surface of the recess also needed to be flat
and specular in order to make measurements with the interferometer.
4.2.2 Step Height Creation
Several different methods to create a recess were attempted with varying results.
Most of the methods attempted resulted in recesses with fairly rough bottom surfaces,
which caused large amounts of light scattering when viewed with an optical microscope,
and thus were generally too diffuse to measure with the interferometer. Some of the
methods attempted were diamond drills, diamond wafering blades and surface grinding
wheels, and oxygen free copper lapping rods with Opaline, a high purity brand of ceria,
or diamond paste.
The most effective method of recess creation found was to use a hardened steel
rod, which had a 1/32” diameter (.794 mm). The tool was conditioned by continuously
lapping a piece of scrap glass with an Opaline slurry mix (1 �m average particle size,
mixed 50 g/500 ml) for several hours. Hardened steel seems, at first, to be an odd choice
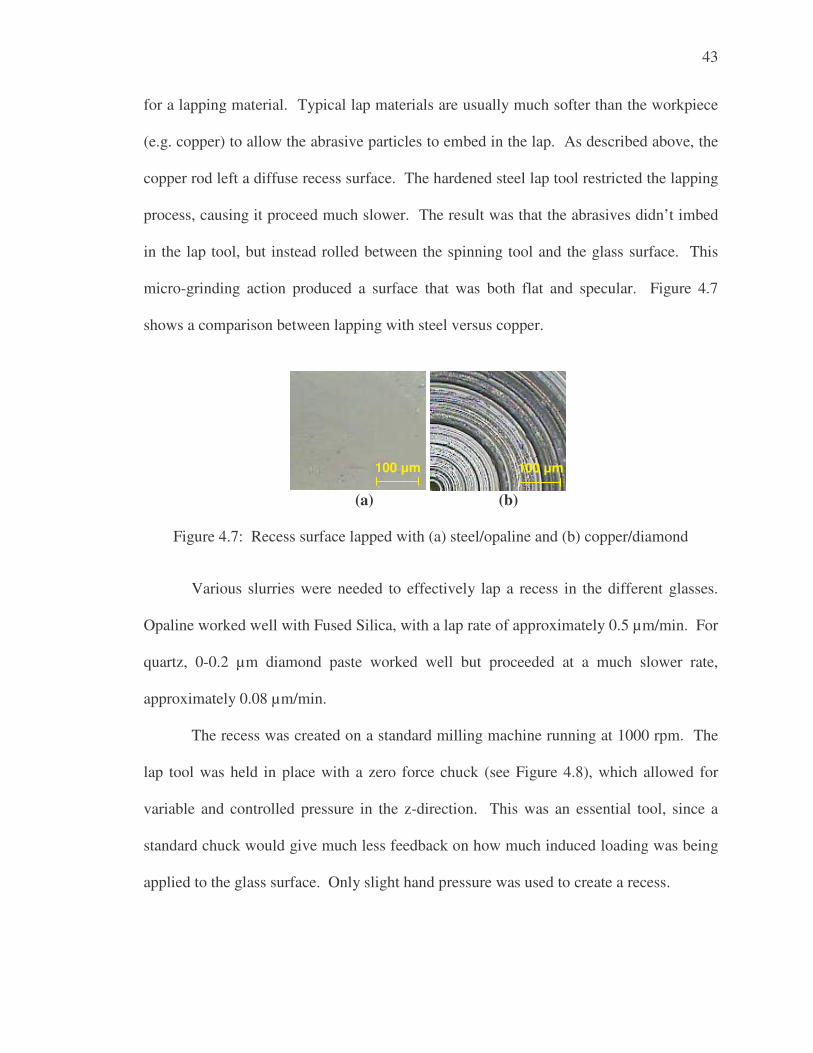
43
for a lapping material. Typical lap materials are usually much softer than the workpiece
(e.g. copper) to allow the abrasive particles to embed in the lap. As described above, the
copper rod left a diffuse recess surface. The hardened steel lap tool restricted the lapping
process, causing it proceed much slower. The result was that the abrasives didn’t imbed
in the lap tool, but instead rolled between the spinning tool and the glass surface. This
micro-grinding action produced a surface that was both flat and specular. Figure 4.7
shows a comparison between lapping with steel versus copper.
(a) (b)
Figure 4.7: Recess surface lapped with (a) steel/opaline and (b) copper/diamond Various slurries were needed to effectively lap a recess in the different glasses.
Opaline worked well with Fused Silica, with a lap rate of approximately 0.5 µm/min. For
quartz, 0-0.2 µm diamond paste worked well but proceeded at a much slower rate,
approximately 0.08 µm/min.
The recess was created on a standard milling machine running at 1000 rpm. The
lap tool was held in place with a zero force chuck (see Figure 4.8), which allowed for
variable and controlled pressure in the z-direction. This was an essential tool, since a
standard chuck would give much less feedback on how much induced loading was being
applied to the glass surface. Only slight hand pressure was used to create a recess.
100 �m 100 �m
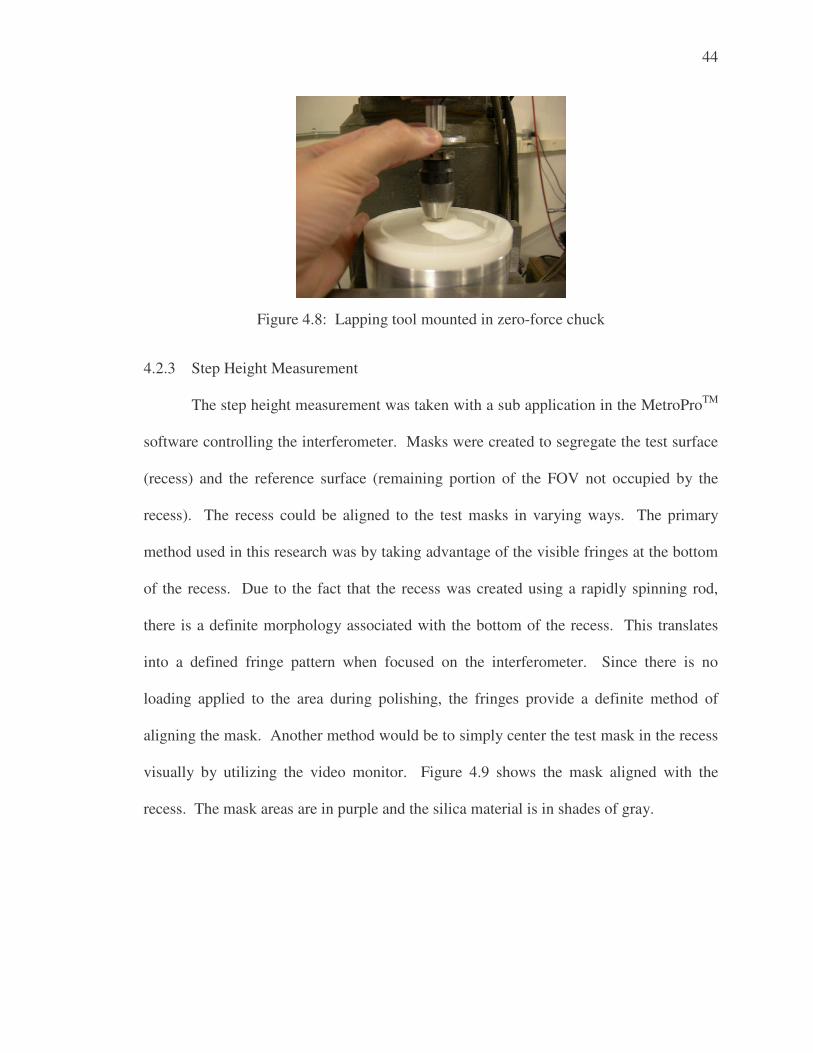
44
Figure 4.8: Lapping tool mounted in zero-force chuck 4.2.3 Step Height Measurement
The step height measurement was taken with a sub application in the MetroProTM
software controlling the interferometer. Masks were created to segregate the test surface
(recess) and the reference surface (remaining portion of the FOV not occupied by the
recess). The recess could be aligned to the test masks in varying ways. The primary
method used in this research was by taking advantage of the visible fringes at the bottom
of the recess. Due to the fact that the recess was created using a rapidly spinning rod,
there is a definite morphology associated with the bottom of the recess. This translates
into a defined fringe pattern when focused on the interferometer. Since there is no
loading applied to the area during polishing, the fringes provide a definite method of
aligning the mask. Another method would be to simply center the test mask in the recess
visually by utilizing the video monitor. Figure 4.9 shows the mask aligned with the
recess. The mask areas are in purple and the silica material is in shades of gray.
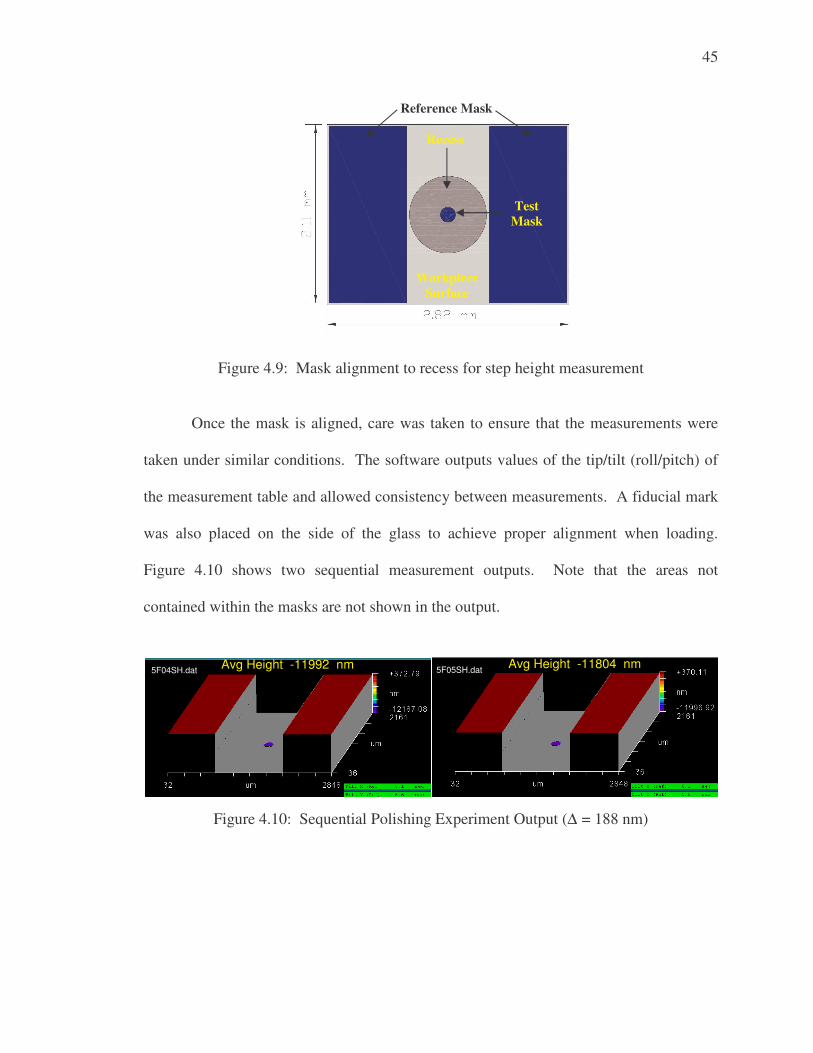
45
Figure 4.9: Mask alignment to recess for step height measurement
Once the mask is aligned, care was taken to ensure that the measurements were
taken under similar conditions. The software outputs values of the tip/tilt (roll/pitch) of
the measurement table and allowed consistency between measurements. A fiducial mark
was also placed on the side of the glass to achieve proper alignment when loading.
Figure 4.10 shows two sequential measurement outputs. Note that the areas not
contained within the masks are not shown in the output.
Figure 4.10: Sequential Polishing Experiment Output (∆ = 188 nm)
5F04SH.dat 5F05SH.dat Avg Height -11992 nm Avg Height -11804 nm
Recess
Reference Mask
Test Mask
Workpiece Surface
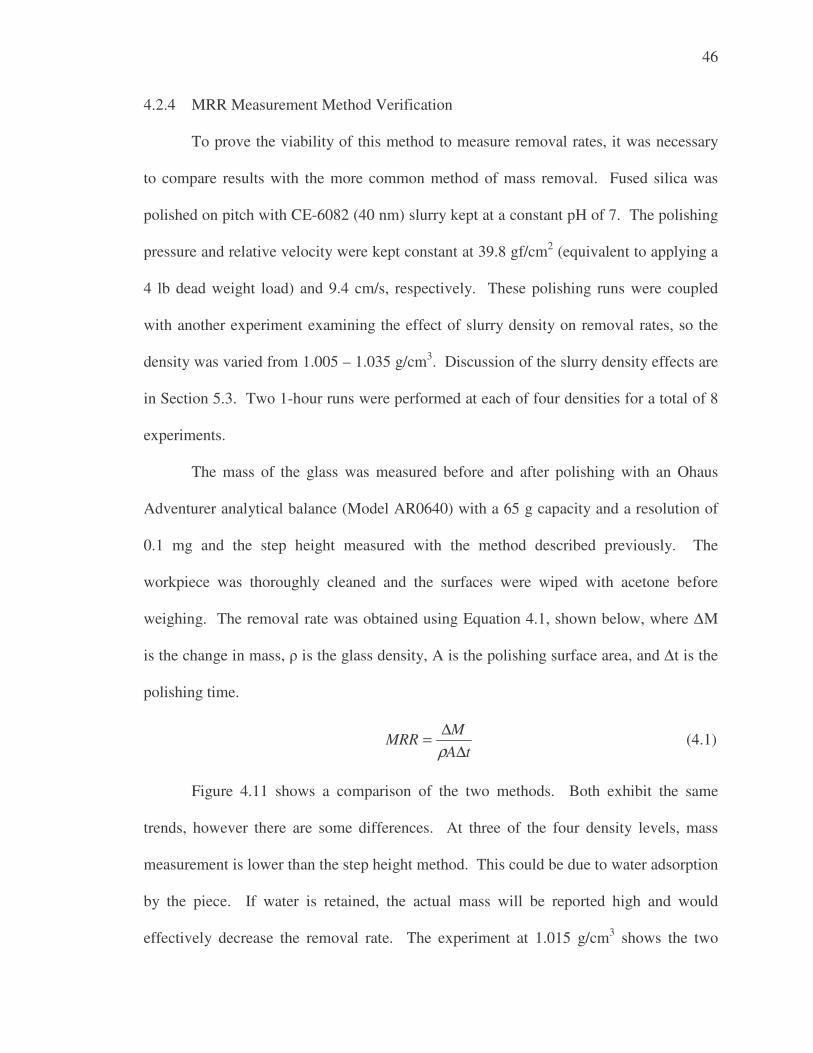
46
4.2.4 MRR Measurement Method Verification
To prove the viability of this method to measure removal rates, it was necessary
to compare results with the more common method of mass removal. Fused silica was
polished on pitch with CE-6082 (40 nm) slurry kept at a constant pH of 7. The polishing
pressure and relative velocity were kept constant at 39.8 gf/cm2 (equivalent to applying a
4 lb dead weight load) and 9.4 cm/s, respectively. These polishing runs were coupled
with another experiment examining the effect of slurry density on removal rates, so the
density was varied from 1.005 – 1.035 g/cm3. Discussion of the slurry density effects are
in Section 5.3. Two 1-hour runs were performed at each of four densities for a total of 8
experiments.
The mass of the glass was measured before and after polishing with an Ohaus
Adventurer analytical balance (Model AR0640) with a 65 g capacity and a resolution of
0.1 mg and the step height measured with the method described previously. The
workpiece was thoroughly cleaned and the surfaces were wiped with acetone before
weighing. The removal rate was obtained using Equation 4.1, shown below, where ∆M
is the change in mass, � is the glass density, A is the polishing surface area, and ∆t is the
polishing time.
tA
MMRR
∆∆=ρ
(4.1)
Figure 4.11 shows a comparison of the two methods. Both exhibit the same
trends, however there are some differences. At three of the four density levels, mass
measurement is lower than the step height method. This could be due to water adsorption
by the piece. If water is retained, the actual mass will be reported high and would
effectively decrease the removal rate. The experiment at 1.015 g/cm3 shows the two
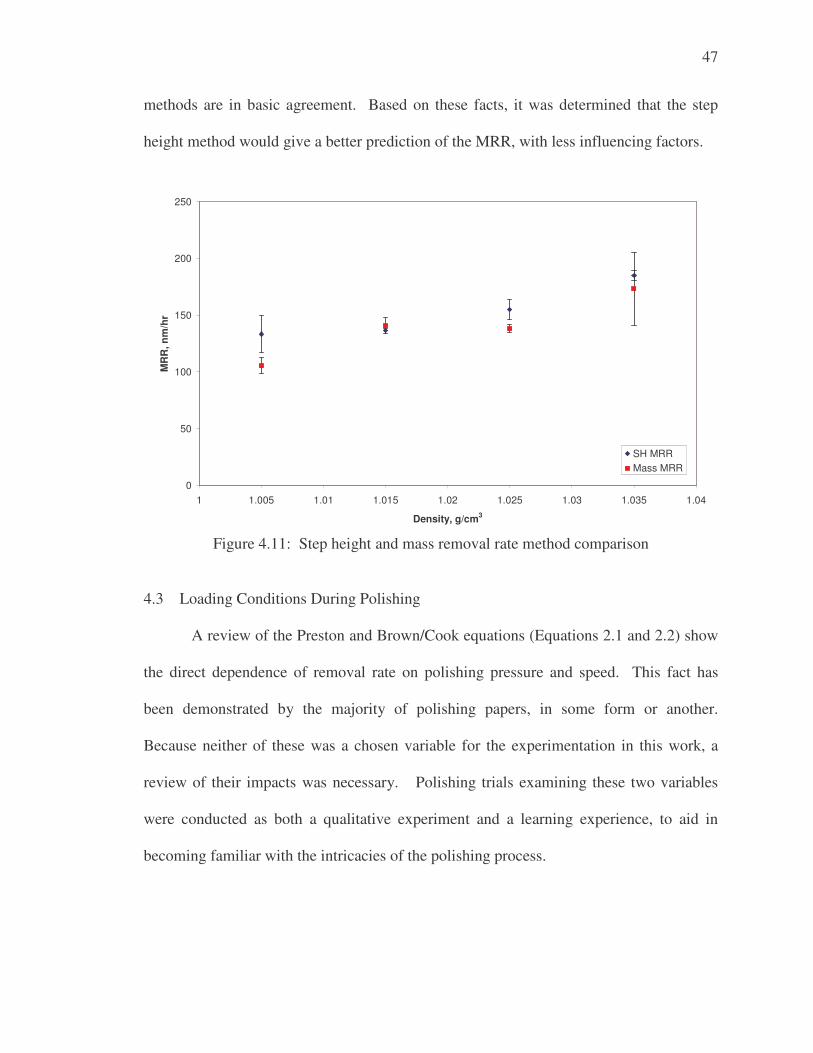
47
methods are in basic agreement. Based on these facts, it was determined that the step
height method would give a better prediction of the MRR, with less influencing factors.
0
50
100
150
200
250
1 1.005 1.01 1.015 1.02 1.025 1.03 1.035 1.04
Density, g/cm3
MR
R, n
m/h
r
SH MRRMass MRR
Figure 4.11: Step height and mass removal rate method comparison
4.3 Loading Conditions During Polishing
A review of the Preston and Brown/Cook equations (Equations 2.1 and 2.2) show
the direct dependence of removal rate on polishing pressure and speed. This fact has
been demonstrated by the majority of polishing papers, in some form or another.
Because neither of these was a chosen variable for the experimentation in this work, a
review of their impacts was necessary. Polishing trials examining these two variables
were conducted as both a qualitative experiment and a learning experience, to aid in
becoming familiar with the intricacies of the polishing process.
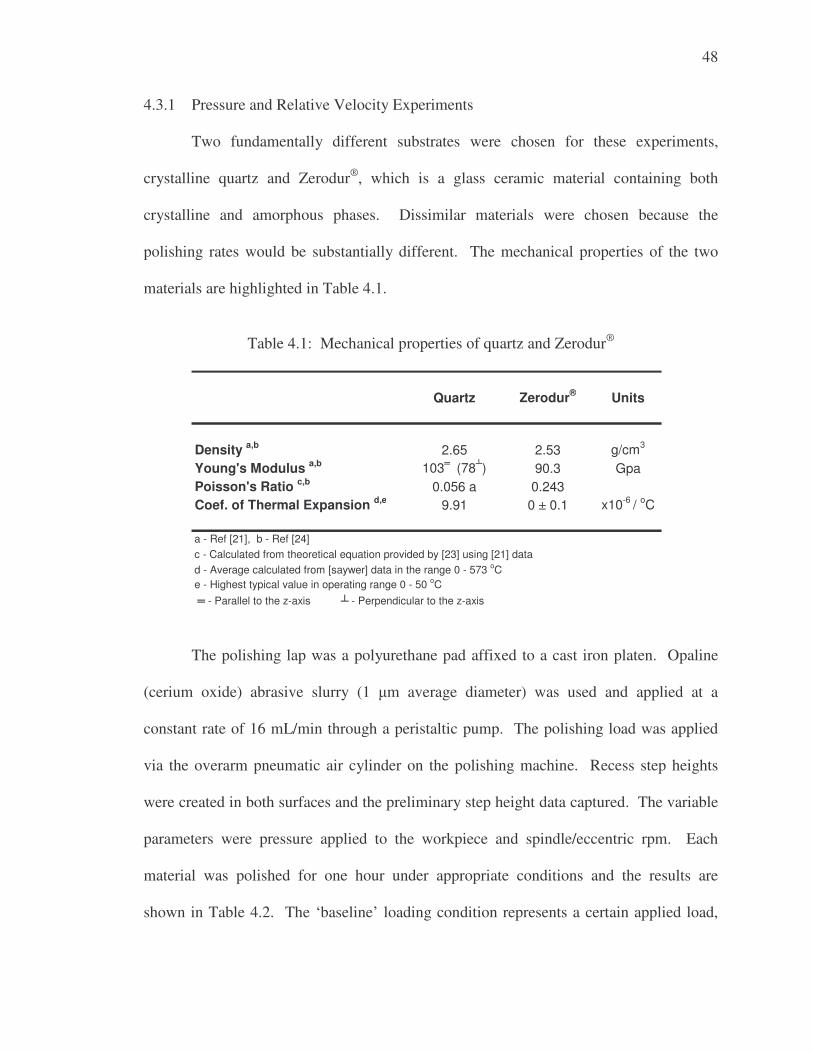
48
4.3.1 Pressure and Relative Velocity Experiments
Two fundamentally different substrates were chosen for these experiments,
crystalline quartz and Zerodur®, which is a glass ceramic material containing both
crystalline and amorphous phases. Dissimilar materials were chosen because the
polishing rates would be substantially different. The mechanical properties of the two
materials are highlighted in Table 4.1.
Table 4.1: Mechanical properties of quartz and Zerodur®
Quartz Zerodur® Units
Density a,b 2.65 2.53 g/cm3
Young's Modulus a,b 103� (78�) 90.3 GpaPoisson's Ratio c,b 0.056 a 0.243Coef. of Thermal Expansion d,e 9.91 0 ± 0.1 x10⁻⁶ / oC
e - Highest typical value in operating range 0 - 50 oC � - Parallel to the z-axis � - Perpendicular to the z-axis
d - Average calculated from [saywer] data in the range 0 - 573 oC
a - Ref [21], b - Ref [24]c - Calculated from theoretical equation provided by [23] using [21] data
The polishing lap was a polyurethane pad affixed to a cast iron platen. Opaline
(cerium oxide) abrasive slurry (1 �m average diameter) was used and applied at a
constant rate of 16 mL/min through a peristaltic pump. The polishing load was applied
via the overarm pneumatic air cylinder on the polishing machine. Recess step heights
were created in both surfaces and the preliminary step height data captured. The variable
parameters were pressure applied to the workpiece and spindle/eccentric rpm. Each
material was polished for one hour under appropriate conditions and the results are
shown in Table 4.2. The ‘baseline’ loading condition represents a certain applied load,
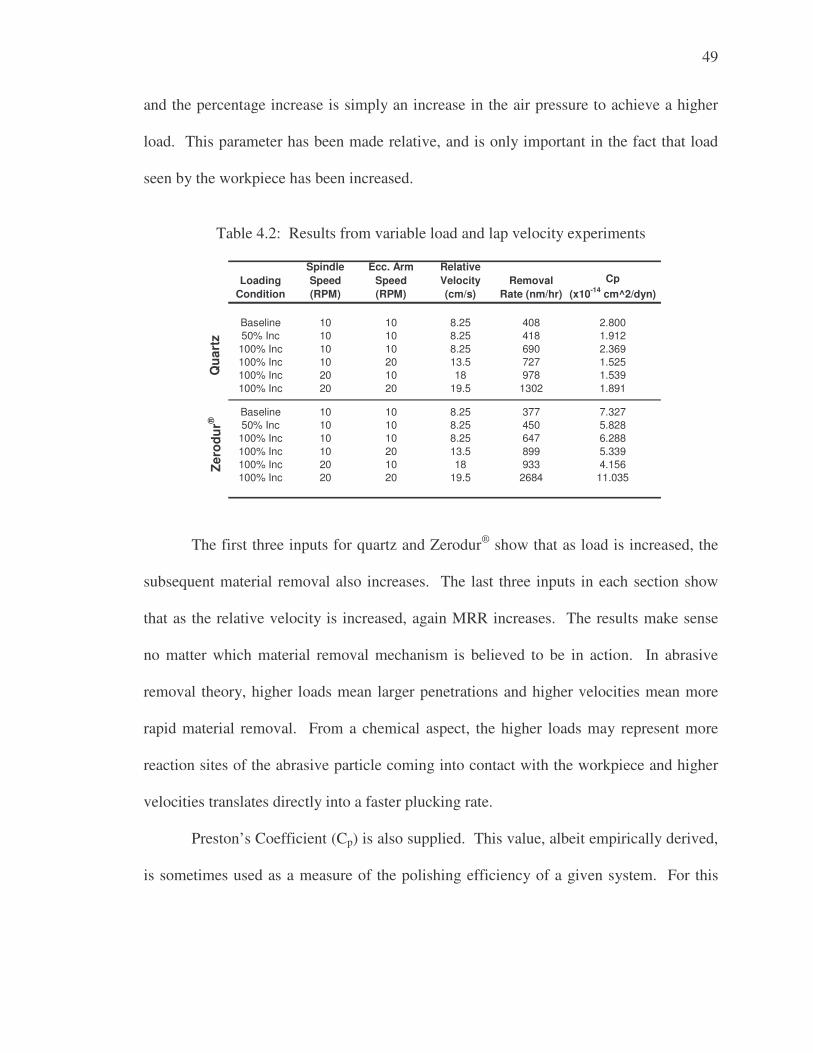
49
and the percentage increase is simply an increase in the air pressure to achieve a higher
load. This parameter has been made relative, and is only important in the fact that load
seen by the workpiece has been increased.
Table 4.2: Results from variable load and lap velocity experiments
Loading Condition
Spindle Speed (RPM)
Ecc. Arm Speed (RPM)
Relative Velocity (cm/s)
Removal Rate (nm/hr)
Cp (x10-14 cm^2/dyn)
Baseline 10 10 8.25 408 2.80050% Inc 10 10 8.25 418 1.912100% Inc 10 10 8.25 690 2.369100% Inc 10 20 13.5 727 1.525100% Inc 20 10 18 978 1.539100% Inc 20 20 19.5 1302 1.891
Baseline 10 10 8.25 377 7.32750% Inc 10 10 8.25 450 5.828100% Inc 10 10 8.25 647 6.288100% Inc 10 20 13.5 899 5.339100% Inc 20 10 18 933 4.156100% Inc 20 20 19.5 2684 11.035
Zero
dur®
Q
uart
z
The first three inputs for quartz and Zerodur® show that as load is increased, the
subsequent material removal also increases. The last three inputs in each section show
that as the relative velocity is increased, again MRR increases. The results make sense
no matter which material removal mechanism is believed to be in action. In abrasive
removal theory, higher loads mean larger penetrations and higher velocities mean more
rapid material removal. From a chemical aspect, the higher loads may represent more
reaction sites of the abrasive particle coming into contact with the workpiece and higher
velocities translates directly into a faster plucking rate.
Preston’s Coefficient (Cp) is also supplied. This value, albeit empirically derived,
is sometimes used as a measure of the polishing efficiency of a given system. For this
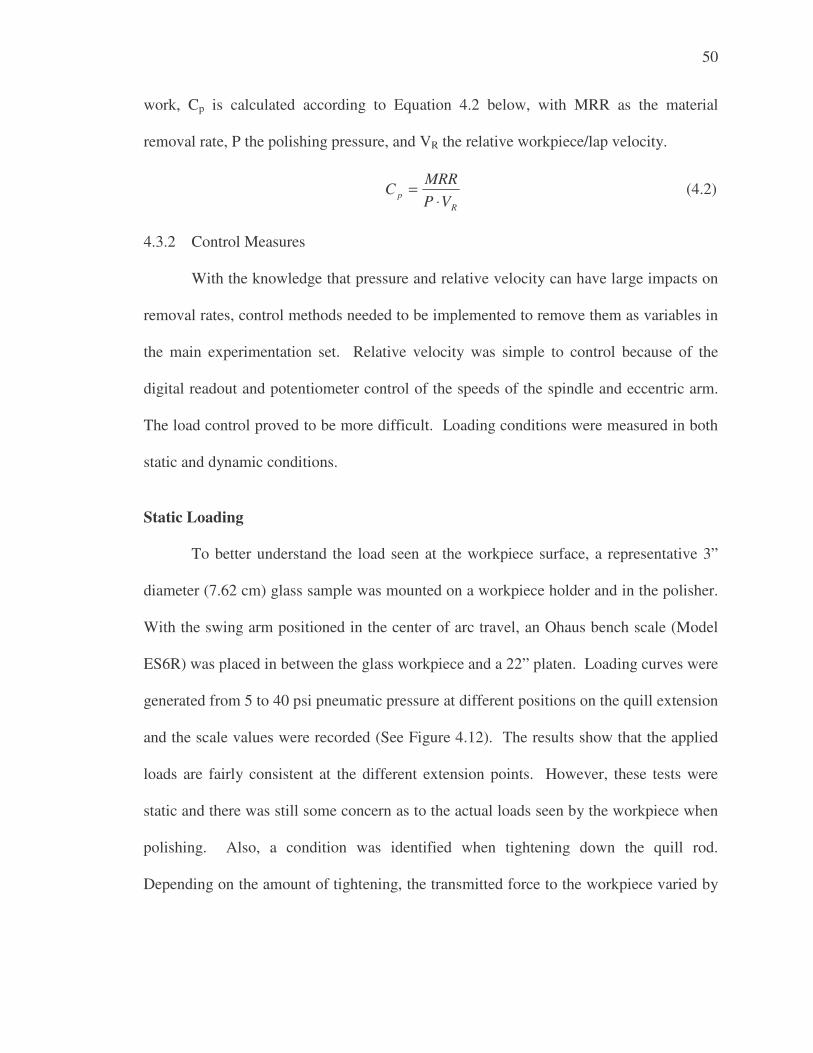
50
work, Cp is calculated according to Equation 4.2 below, with MRR as the material
removal rate, P the polishing pressure, and VR the relative workpiece/lap velocity.
R
p VPMRR
C⋅
= (4.2)
4.3.2 Control Measures
With the knowledge that pressure and relative velocity can have large impacts on
removal rates, control methods needed to be implemented to remove them as variables in
the main experimentation set. Relative velocity was simple to control because of the
digital readout and potentiometer control of the speeds of the spindle and eccentric arm.
The load control proved to be more difficult. Loading conditions were measured in both
static and dynamic conditions.
Static Loading
To better understand the load seen at the workpiece surface, a representative 3”
diameter (7.62 cm) glass sample was mounted on a workpiece holder and in the polisher.
With the swing arm positioned in the center of arc travel, an Ohaus bench scale (Model
ES6R) was placed in between the glass workpiece and a 22” platen. Loading curves were
generated from 5 to 40 psi pneumatic pressure at different positions on the quill extension
and the scale values were recorded (See Figure 4.12). The results show that the applied
loads are fairly consistent at the different extension points. However, these tests were
static and there was still some concern as to the actual loads seen by the workpiece when
polishing. Also, a condition was identified when tightening down the quill rod.
Depending on the amount of tightening, the transmitted force to the workpiece varied by
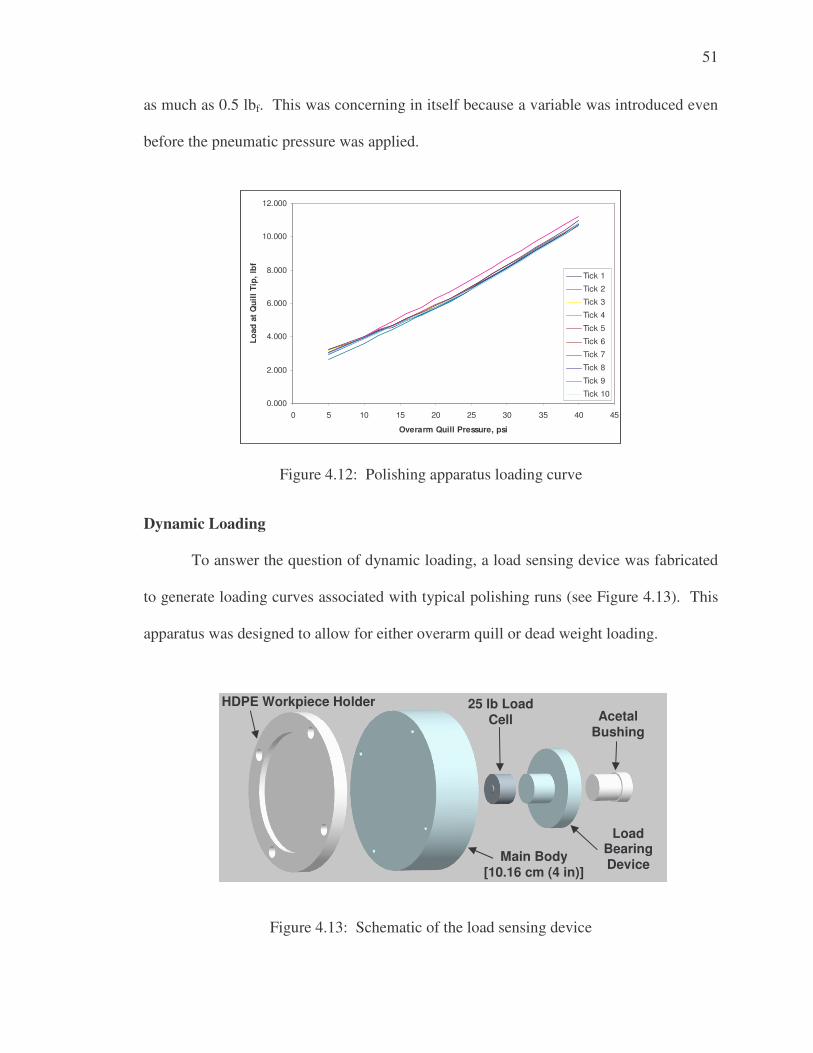
51
as much as 0.5 lbf. This was concerning in itself because a variable was introduced even
before the pneumatic pressure was applied.
0.000
2.000
4.000
6.000
8.000
10.000
12.000
0 5 10 15 20 25 30 35 40 45
Overarm Quill Pressure, psi
Load
at
Qui
ll Ti
p, lb
f
Tick 1
Tick 2
Tick 3
Tick 4
Tick 5
Tick 6
Tick 7
Tick 8
Tick 9
Tick 10
Figure 4.12: Polishing apparatus loading curve Dynamic Loading
To answer the question of dynamic loading, a load sensing device was fabricated
to generate loading curves associated with typical polishing runs (see Figure 4.13). This
apparatus was designed to allow for either overarm quill or dead weight loading.
Figure 4.13: Schematic of the load sensing device
Acetal Bushing
25 lb Load Cell
Load Bearing Device
HDPE Workpiece Holder
Main Body [10.16 cm (4 in)]
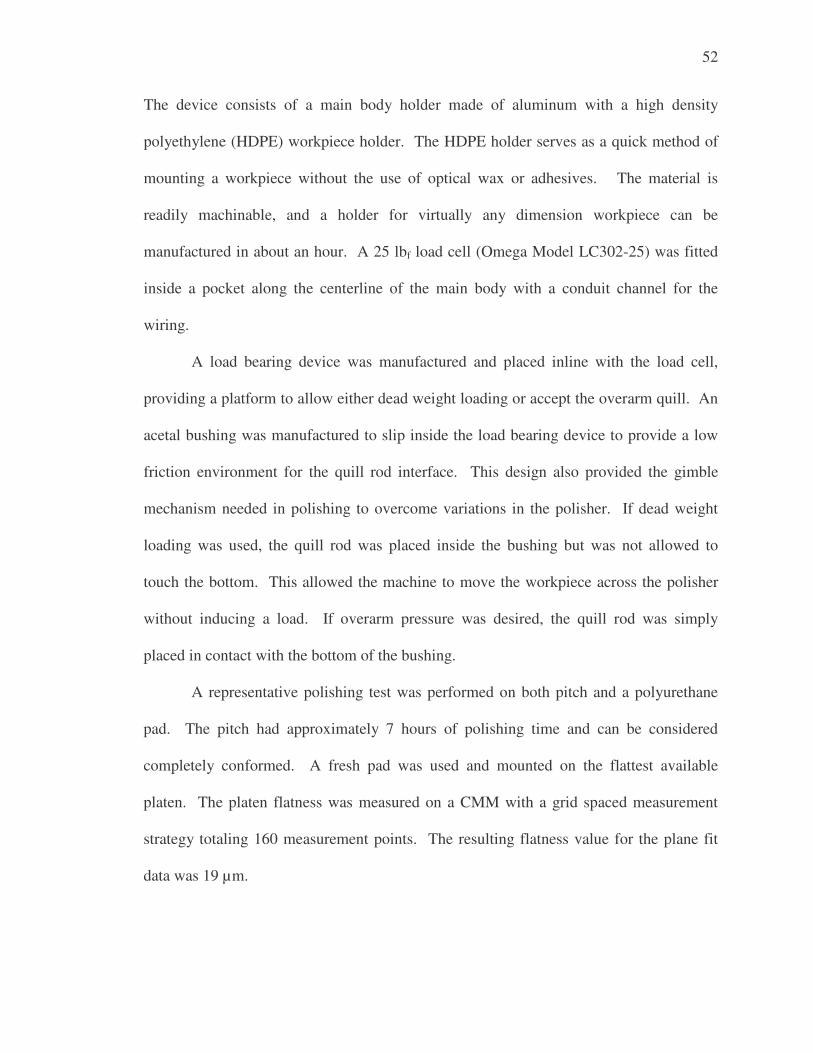
52
The device consists of a main body holder made of aluminum with a high density
polyethylene (HDPE) workpiece holder. The HDPE holder serves as a quick method of
mounting a workpiece without the use of optical wax or adhesives. The material is
readily machinable, and a holder for virtually any dimension workpiece can be
manufactured in about an hour. A 25 lbf load cell (Omega Model LC302-25) was fitted
inside a pocket along the centerline of the main body with a conduit channel for the
wiring.
A load bearing device was manufactured and placed inline with the load cell,
providing a platform to allow either dead weight loading or accept the overarm quill. An
acetal bushing was manufactured to slip inside the load bearing device to provide a low
friction environment for the quill rod interface. This design also provided the gimble
mechanism needed in polishing to overcome variations in the polisher. If dead weight
loading was used, the quill rod was placed inside the bushing but was not allowed to
touch the bottom. This allowed the machine to move the workpiece across the polisher
without inducing a load. If overarm pressure was desired, the quill rod was simply
placed in contact with the bottom of the bushing.
A representative polishing test was performed on both pitch and a polyurethane
pad. The pitch had approximately 7 hours of polishing time and can be considered
completely conformed. A fresh pad was used and mounted on the flattest available
platen. The platen flatness was measured on a CMM with a grid spaced measurement
strategy totaling 160 measurement points. The resulting flatness value for the plane fit
data was 19 µm.
53
CE-6080 (750 nm) slurry was used, mixed 10:1 and applied by an applicator
bottle. The relative velocity was 8.25 cm/s, dead weight load was 4 lb (1.81 kg), and
overarm pressure was adjusted from 5 to 20 psi (34.5 – 137.9 kPa). The workpiece was
allowed to polish for 10 minutes before any data was captured. The load cell data was
acquired using a National Instruments dedicated data acquisition card and processed with
a Labview program. An example set of generated curves are shown in Figure 4.14.
0
2
4
6
8
10
12
14
0 10 20 30 40 50 60
Time, s
Load
, lbf
0
2
4
6
8
10
12
14
0 10 20 30 40 50 60
Time, s
Load
, lbf
(a) (b)
Figure 4.14: Loading curves with (a) dead load on pad and (b) 10 psi overarm pressure on pad
As the data show, using dead weight loading provides a more consistent load
application during a polishing cycle. When the loading is applied via the overarm quill
rod, there are significant loading fluctuations, varying by over 10 lbf. The curves
generated for pitch exhibited the same behavior. It is suspected that the pressure
gradients seen are caused by misalignment of the overarm and the machine spindle. By
adjusting the spindle motor mount, the misalignment could be reduced, but using the
dead weights was just as effective and much simpler. The realization of the pressure
gradient existence is important because typical dead load weighting is usually performed
by adding weight directly to the overarm. This scheme is undesirable because the
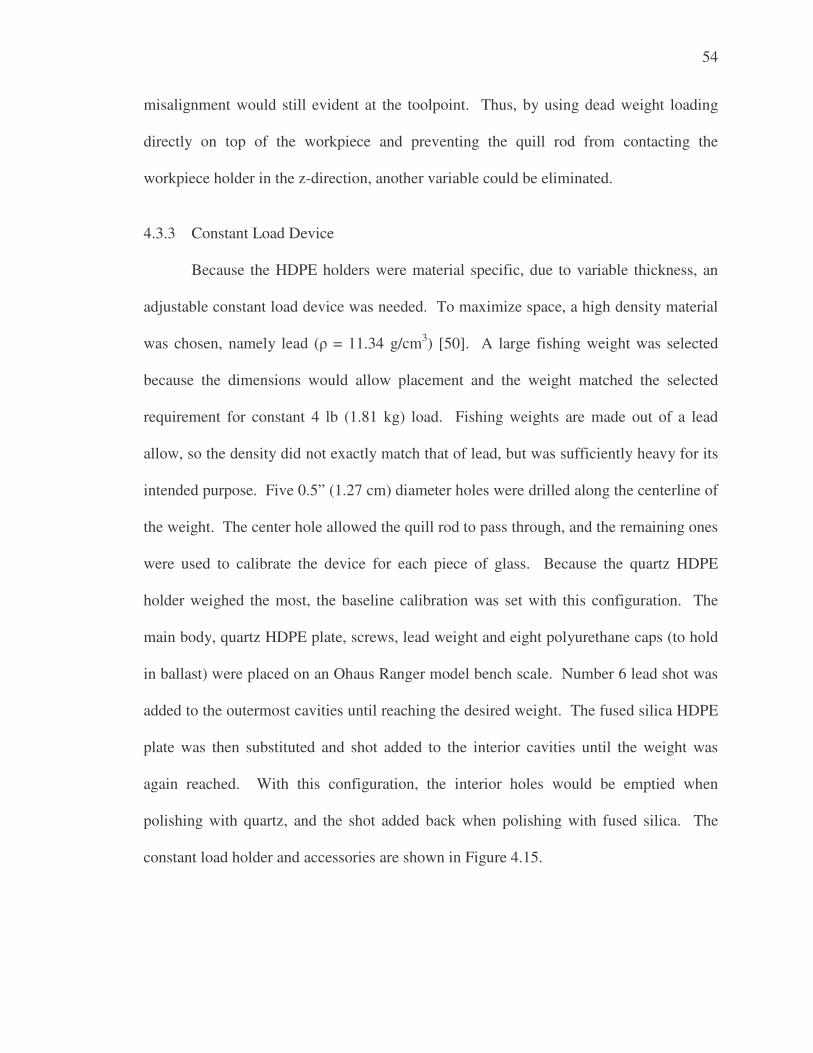
54
misalignment would still evident at the toolpoint. Thus, by using dead weight loading
directly on top of the workpiece and preventing the quill rod from contacting the
workpiece holder in the z-direction, another variable could be eliminated.
4.3.3 Constant Load Device
Because the HDPE holders were material specific, due to variable thickness, an
adjustable constant load device was needed. To maximize space, a high density material
was chosen, namely lead (� = 11.34 g/cm3) [50]. A large fishing weight was selected
because the dimensions would allow placement and the weight matched the selected
requirement for constant 4 lb (1.81 kg) load. Fishing weights are made out of a lead
allow, so the density did not exactly match that of lead, but was sufficiently heavy for its
intended purpose. Five 0.5” (1.27 cm) diameter holes were drilled along the centerline of
the weight. The center hole allowed the quill rod to pass through, and the remaining ones
were used to calibrate the device for each piece of glass. Because the quartz HDPE
holder weighed the most, the baseline calibration was set with this configuration. The
main body, quartz HDPE plate, screws, lead weight and eight polyurethane caps (to hold
in ballast) were placed on an Ohaus Ranger model bench scale. Number 6 lead shot was
added to the outermost cavities until reaching the desired weight. The fused silica HDPE
plate was then substituted and shot added to the interior cavities until the weight was
again reached. With this configuration, the interior holes would be emptied when
polishing with quartz, and the shot added back when polishing with fused silica. The
constant load holder and accessories are shown in Figure 4.15.
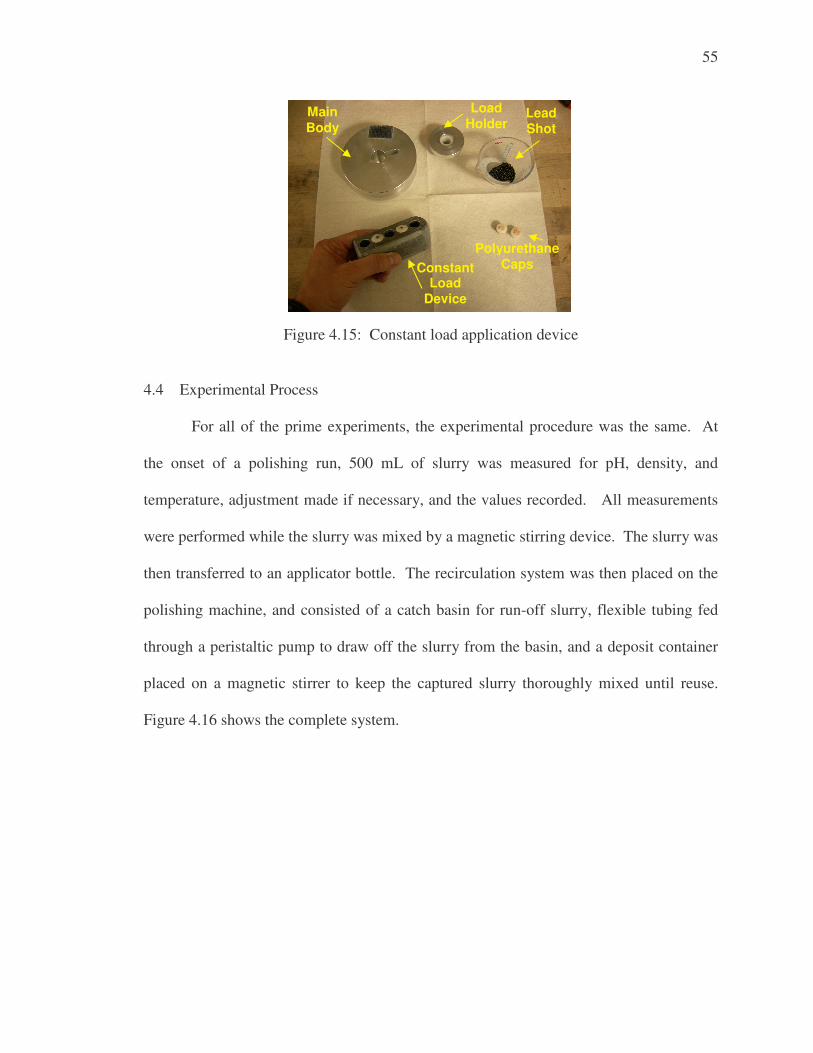
55
Figure 4.15: Constant load application device
4.4 Experimental Process
For all of the prime experiments, the experimental procedure was the same. At
the onset of a polishing run, 500 mL of slurry was measured for pH, density, and
temperature, adjustment made if necessary, and the values recorded. All measurements
were performed while the slurry was mixed by a magnetic stirring device. The slurry was
then transferred to an applicator bottle. The recirculation system was then placed on the
polishing machine, and consisted of a catch basin for run-off slurry, flexible tubing fed
through a peristaltic pump to draw off the slurry from the basin, and a deposit container
placed on a magnetic stirrer to keep the captured slurry thoroughly mixed until reuse.
Figure 4.16 shows the complete system.
Constant Load
Device
Load Holder
Lead Shot
Polyurethane Caps
Main Body
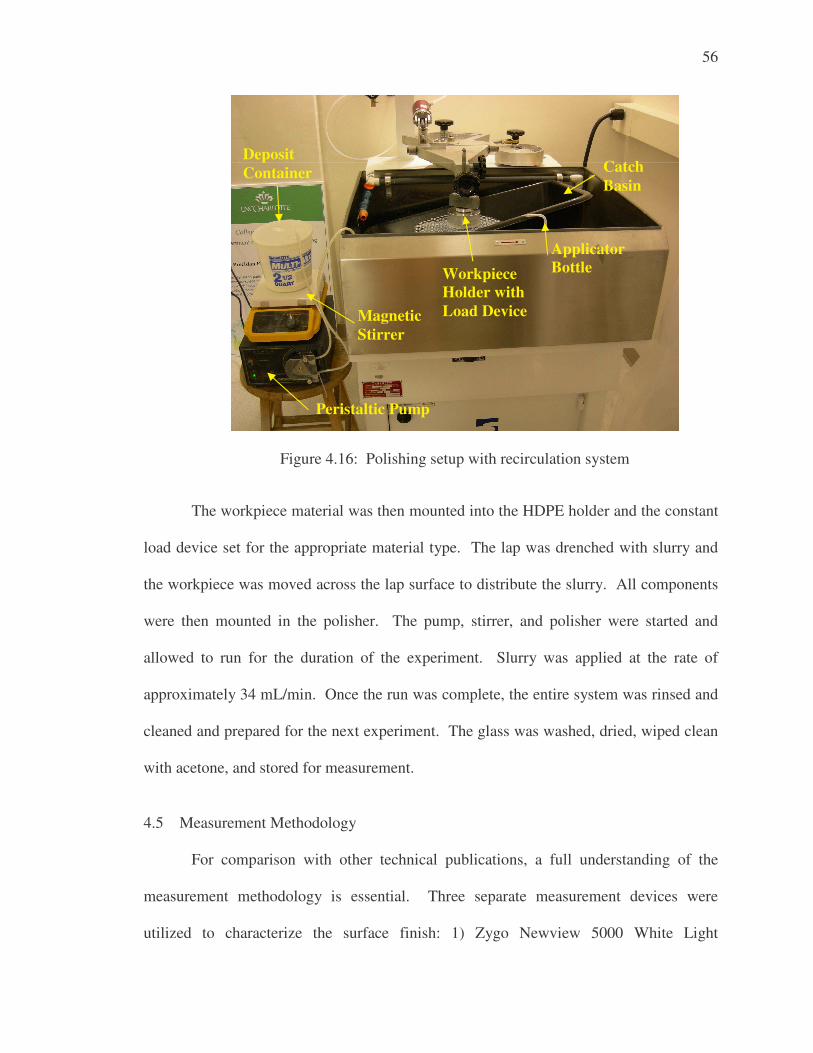
56
Figure 4.16: Polishing setup with recirculation system
The workpiece material was then mounted into the HDPE holder and the constant
load device set for the appropriate material type. The lap was drenched with slurry and
the workpiece was moved across the lap surface to distribute the slurry. All components
were then mounted in the polisher. The pump, stirrer, and polisher were started and
allowed to run for the duration of the experiment. Slurry was applied at the rate of
approximately 34 mL/min. Once the run was complete, the entire system was rinsed and
cleaned and prepared for the next experiment. The glass was washed, dried, wiped clean
with acetone, and stored for measurement.
4.5 Measurement Methodology
For comparison with other technical publications, a full understanding of the
measurement methodology is essential. Three separate measurement devices were
utilized to characterize the surface finish: 1) Zygo Newview 5000 White Light
Catch Basin
Peristaltic Pump
Deposit Container
Applicator Bottle
Magnetic Stirrer
Workpiece Holder with Load Device
57
Interferometer, 2) Digital Instruments Atomic Force Microscope (AFM), and 3) a Taylor-
Hobson Talystep Profilometer. With the interferometer and AFM, two separate scan
sizes were utilized and carried through the duration of the experiments.
Two scan lengths were also used for the profilometry, but this was due to a
change in measurement strategy after the first experiment set. Initially, it was thought
that using a 1 mm scan length would be a useful one because the lateral resolution
(approximately 300 nm) was roughly in between that of interferometry and AFM. This
method was used for the particle size experiments. However, for the other experiments,
it was decided to adopt a measurement strategy used by Leistner [51, 52] in his
experiments on Teflon polishing. The scan length was reduced to 200 nm and coupled
with the maximum data acquisition rate capable, reduced the lateral resolution to
approximately 61 nm, closer to that of the AFM.
The main reason for the switch was because it was found that the generated
surfaces were smooth enough to manifest significant problems when measuring with the
AFM. It is relatively simple to capture a surface on the AFM when the trace is
appreciable. The surfaces presented in this thesis were down in the lower band of the
measurement capacity, effectively buried in the noise of the machine for the 1 �m2 scan
length. As a check, a 750 nm surface from the first experiment set was measured on the
higher accuracy AFM located in the Optoelectronics Center at UNC-Charlotte. This
AFM was again unable to generate a decent representation of the surface. Thus, the
Talystep scan length was adjusted to give information regarding measurements in the
higher spatial frequencies. Data was still captured from the AFM, but only the 10 �m2
scans were able to show some type of surface.
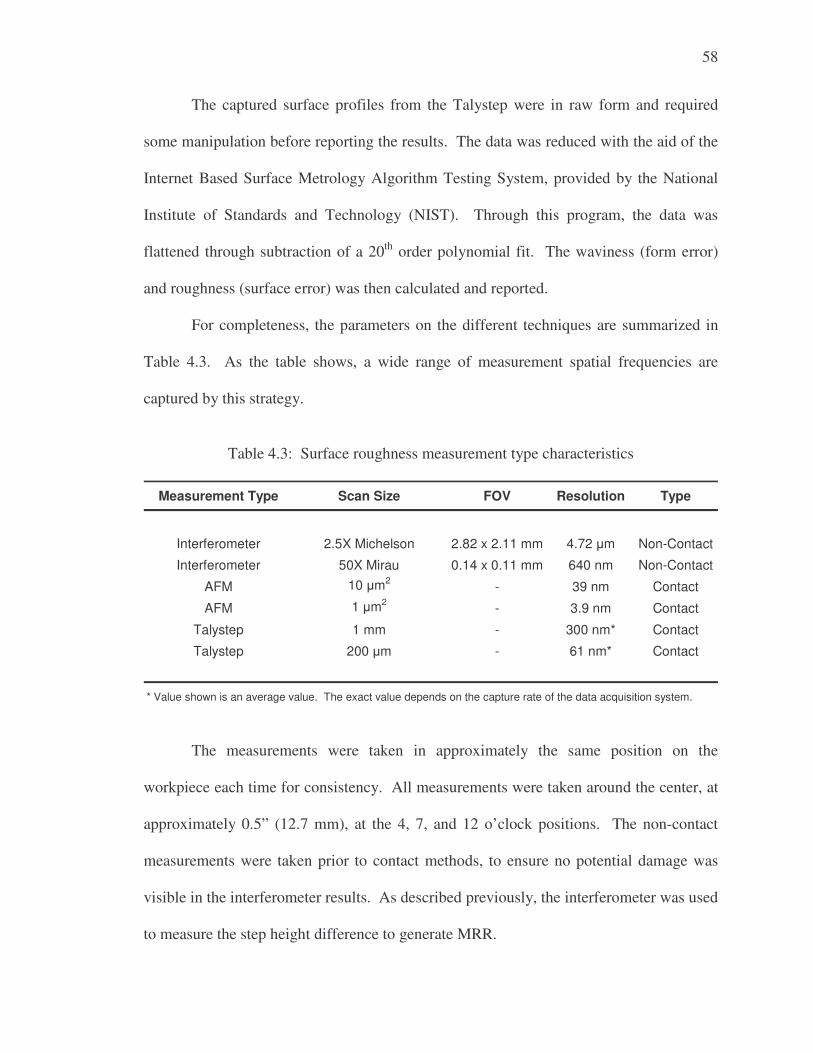
58
The captured surface profiles from the Talystep were in raw form and required
some manipulation before reporting the results. The data was reduced with the aid of the
Internet Based Surface Metrology Algorithm Testing System, provided by the National
Institute of Standards and Technology (NIST). Through this program, the data was
flattened through subtraction of a 20th order polynomial fit. The waviness (form error)
and roughness (surface error) was then calculated and reported.
For completeness, the parameters on the different techniques are summarized in
Table 4.3. As the table shows, a wide range of measurement spatial frequencies are
captured by this strategy.
Table 4.3: Surface roughness measurement type characteristics
Measurement Type Scan Size FOV Resolution Type
Interferometer 2.5X Michelson 2.82 x 2.11 mm 4.72 �m Non-Contact
Interferometer 50X Mirau 0.14 x 0.11 mm 640 nm Non-Contact
AFM 10 �m2 - 39 nm Contact
AFM 1 �m2 - 3.9 nm Contact
Talystep 1 mm - 300 nm* Contact
Talystep 200 �m - 61 nm* Contact
* Value shown is an average value. The exact value depends on the capture rate of the data acquisition system.
The measurements were taken in approximately the same position on the
workpiece each time for consistency. All measurements were taken around the center, at
approximately 0.5” (12.7 mm), at the 4, 7, and 12 o’clock positions. The non-contact
measurements were taken prior to contact methods, to ensure no potential damage was
visible in the interferometer results. As described previously, the interferometer was used
to measure the step height difference to generate MRR.
59
Two different surface characterizations are reported, Average Roughness (Ra) and
Root Mean Square Roughness (Rq). Both are integrals of a roughness profile, but are
generally approximated by the digital forms, shown below [53].
�=
=N
jja z
NR
1
1 (4.3) �
==
N
jjq z
LR
1
21 (4.4)
Average roughness, as Equation 4.3 shows, is simply the average of all data points from a
line or area. This parameter is the most common measurement parameter to describe
surface finish [54]. The form for Rq is often referred to as standard deviation. This
parameter still finds wide application in the optical community, so the values are
reported.
4.6 Experimental Sets
The experiment sets were designed to provide a wide range of information with a
limited amount of polishing time. As with all experiments, the more experimental runs,
the better. However, since the polishing process is slow and the measurement process
even slower, the experiments had to maximize the useful data obtained. The main
experiment sets are broken up into three basic categories.
1) Particle Size Effect on MRR and Surface Finish
2) pH Effect on MRR and Surface Finish
3) Slurry Density Effect on Material Removal Rates
4.6.1 Particle Size Effect Predictions
The first category will highlight the dominance either mechanical or chemical
theories of material removal. As described in section 2.2.1, the Brown/Cook mechanical
60
model states that MRR should be independent of particle size, but surface roughness
should decrease with decreasing particle size. To better understand, imagine a large
particle, supporting a certain pressure, indenting into the glass surface. If this large
particle were replaced by several smaller ones occupying the same area under the same
pressure, the load per particle will decrease. This would mean smaller indentation
depths, but there would be more fracture sites. Thus, the model predicts independence of
material removal from particle size and concentration.
The chemical model doesn’t predict the effects of variable particle size. Since
chemical tooth suggests that material is removed in single molecular layers, particle size
may play a role simply in the amount of surface area available for bonding. The results
of this experiment set should provide some insight.
4.6.2 pH Effect Predictions
The second category focuses on the effect of variable slurry pH, and the
subsequent surface charge change, on MRR and surface finish. The mechanical model
doesn’t predict a change with variable pH and since the particles sizes for these
experiments are constant (40 nm), no change should be present within this framework.
However, according to the chemical model, a spike in MRR should be seen at pH ~ 7,
and falling off on either side of neutral. Changing the pH will adjust the surface charge
density on the particle surface and the glass surface. For the abrasive particles, as more
positive or negative charges are acquired, the number of available removal sites is
decreased. This should trend toward lower MRR. The resulting surface finish is not
directly predicted by the chemical model. As seen in section 3.3, researchers have found
61
varying results on workpiece roughness at all pH levels. The experiments will provide
additional data to aid in understanding the chemical model.
Additionally, two types of particle dispersions will be tested (anionic and non-
ionic) to see if there is any effect on MRR and surface finish. The polymeric additives
themselves are thought not interfere with the particles ability to contact the silica surface,
so the removal rates should be consistent between the two. Additionally, there is no
direct assumption that surface finish should vary greatly between the two dispersions.
Another point to note is the effect of pH on the silica materials. As pH increases,
the workpiece will become more soluble, or softer ([35] after [55]). So, it could be
surmised that polishing at higher pH levels could effect higher material removal than at
lower pH levels.
4.6.3 Slurry Density Effects
Another important side experiment to determine material removal mechanism is
the effects of slurry density on MRR. This experiment set was not exactly an
afterthought, rather an ancillary experiment set that could add an additional data point to
the determination on which material removal mechanism was dominant. By increasing
the slurry density, the particle concentration would also be increased. A mechanical
model predicts no effect on material removal with increased particle concentration, while
the chemical model suggests increasing MRR with increasing density. This is due to the
fact that more abrasive particles mean more surface sites that are available for bonding.
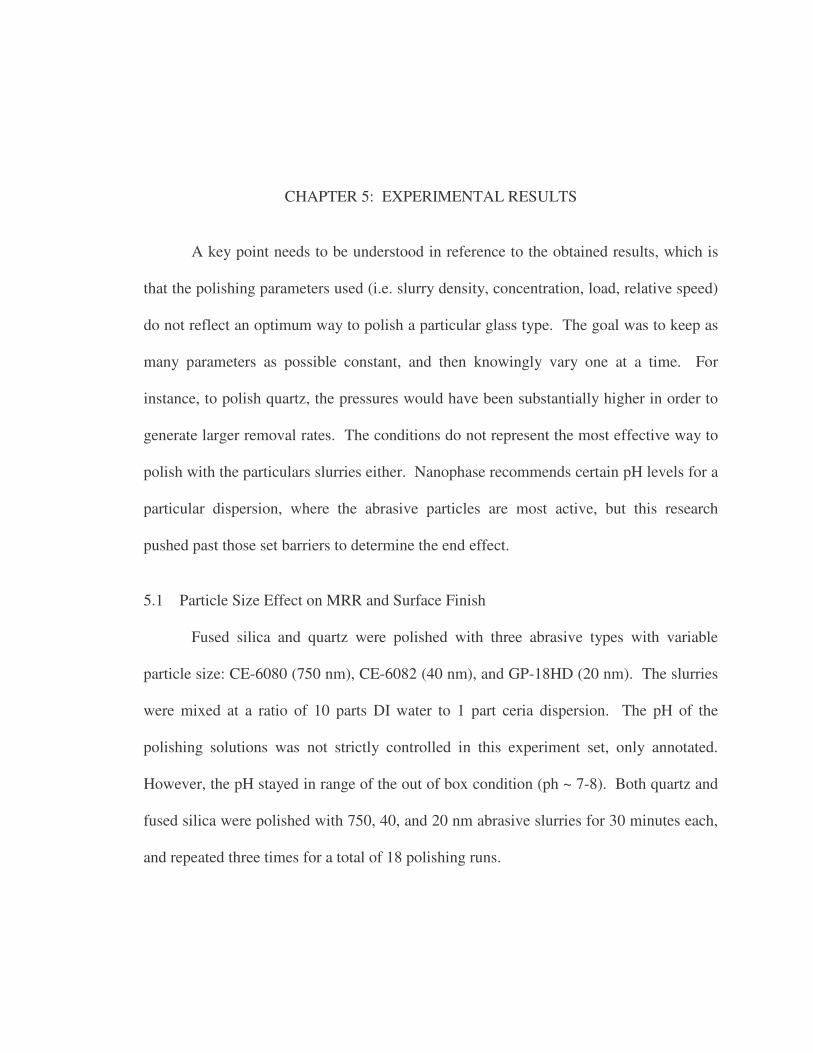
CHAPTER 5: EXPERIMENTAL RESULTS
A key point needs to be understood in reference to the obtained results, which is
that the polishing parameters used (i.e. slurry density, concentration, load, relative speed)
do not reflect an optimum way to polish a particular glass type. The goal was to keep as
many parameters as possible constant, and then knowingly vary one at a time. For
instance, to polish quartz, the pressures would have been substantially higher in order to
generate larger removal rates. The conditions do not represent the most effective way to
polish with the particulars slurries either. Nanophase recommends certain pH levels for a
particular dispersion, where the abrasive particles are most active, but this research
pushed past those set barriers to determine the end effect.
5.1 Particle Size Effect on MRR and Surface Finish
Fused silica and quartz were polished with three abrasive types with variable
particle size: CE-6080 (750 nm), CE-6082 (40 nm), and GP-18HD (20 nm). The slurries
were mixed at a ratio of 10 parts DI water to 1 part ceria dispersion. The pH of the
polishing solutions was not strictly controlled in this experiment set, only annotated.
However, the pH stayed in range of the out of box condition (ph ~ 7-8). Both quartz and
fused silica were polished with 750, 40, and 20 nm abrasive slurries for 30 minutes each,
and repeated three times for a total of 18 polishing runs.
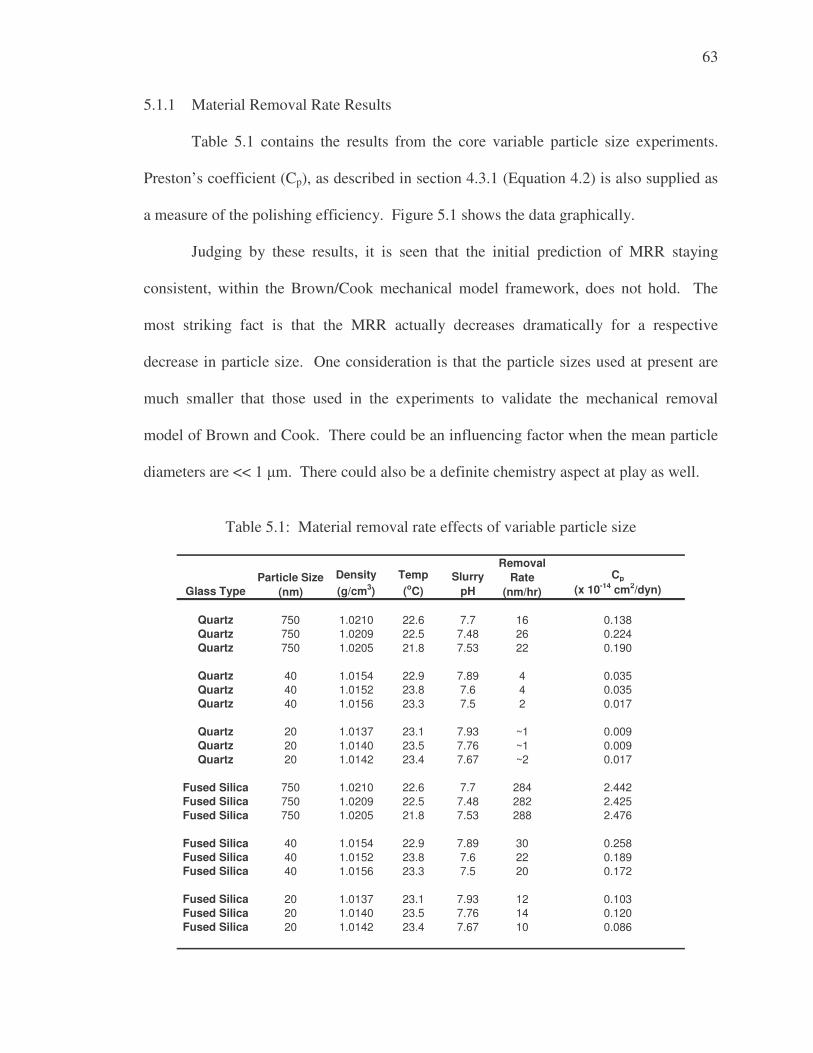
63
5.1.1 Material Removal Rate Results
Table 5.1 contains the results from the core variable particle size experiments.
Preston’s coefficient (Cp), as described in section 4.3.1 (Equation 4.2) is also supplied as
a measure of the polishing efficiency. Figure 5.1 shows the data graphically.
Judging by these results, it is seen that the initial prediction of MRR staying
consistent, within the Brown/Cook mechanical model framework, does not hold. The
most striking fact is that the MRR actually decreases dramatically for a respective
decrease in particle size. One consideration is that the particle sizes used at present are
much smaller that those used in the experiments to validate the mechanical removal
model of Brown and Cook. There could be an influencing factor when the mean particle
diameters are << 1 �m. There could also be a definite chemistry aspect at play as well.
Table 5.1: Material removal rate effects of variable particle size
Cp
(x 10-14 cm2/dyn)
Quartz 750 1.0210 22.6 7.7 16 0.138Quartz 750 1.0209 22.5 7.48 26 0.224Quartz 750 1.0205 21.8 7.53 22 0.190
Quartz 40 1.0154 22.9 7.89 4 0.035Quartz 40 1.0152 23.8 7.6 4 0.035Quartz 40 1.0156 23.3 7.5 2 0.017
Quartz 20 1.0137 23.1 7.93 ~1 0.009Quartz 20 1.0140 23.5 7.76 ~1 0.009Quartz 20 1.0142 23.4 7.67 ~2 0.017
Fused Silica 750 1.0210 22.6 7.7 284 2.442Fused Silica 750 1.0209 22.5 7.48 282 2.425Fused Silica 750 1.0205 21.8 7.53 288 2.476
Fused Silica 40 1.0154 22.9 7.89 30 0.258Fused Silica 40 1.0152 23.8 7.6 22 0.189Fused Silica 40 1.0156 23.3 7.5 20 0.172
Fused Silica 20 1.0137 23.1 7.93 12 0.103Fused Silica 20 1.0140 23.5 7.76 14 0.120Fused Silica 20 1.0142 23.4 7.67 10 0.086
Removal Rate
(nm/hr)Slurry
pHGlass TypeDensity (g/cm3)
Temp (oC)
Particle Size (nm)
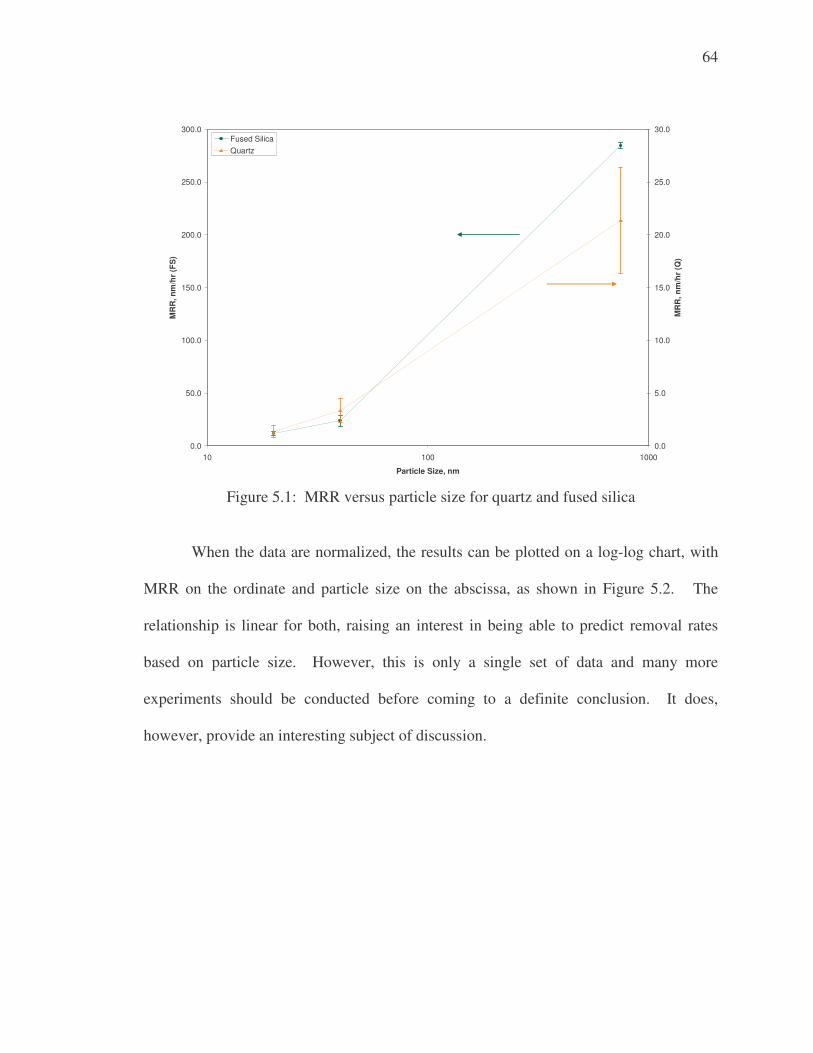
64
0.0
50.0
100.0
150.0
200.0
250.0
300.0
10 100 1000
Particle Size, nm
MR
R, n
m/h
r (F
S)
0.0
5.0
10.0
15.0
20.0
25.0
30.0
MR
R, n
m/h
r (Q
)
Fused SilicaQuartz
Figure 5.1: MRR versus particle size for quartz and fused silica
When the data are normalized, the results can be plotted on a log-log chart, with
MRR on the ordinate and particle size on the abscissa, as shown in Figure 5.2. The
relationship is linear for both, raising an interest in being able to predict removal rates
based on particle size. However, this is only a single set of data and many more
experiments should be conducted before coming to a definite conclusion. It does,
however, provide an interesting subject of discussion.
65
y = 0.8648x - 0.0278R2 = 0.9992
y = 0.7261x - 0.7395R2 = 0.9779
0
0.5
1
1.5
2
2.5
3
0 0.5 1 1.5 2 2.5 3 3.5
Log Particle Size
Log
MR
R
Figure 5.2: Log-Log plot of MRR versus particle size 5.1.2 Surface Finish Results
The next review of the data must look at the resulting surface finish. Table 5.2
and Figure 5.3 show the surface finish results for the variable particle size experiments.
It is readily evident that the surface finish did not change drastically with particle size.
An important point to note is the questionability of the 1 �m2 AFM scans. As discussed
in section 4.5, the surfaces were smooth enough to become buried in the noise of the
machine. The results are presented here for completeness, but the reader is encouraged to
take caution when interpreting these results. Also, the 1 �m2 AFM scan of fused silica
polished with 20 nm particles is suspect for another reason. The slightly higher Ra are
thought to have resulted measurement probe shear. Initially, the values were taken as
accepted, but after comparison of all the results, it appeared to be out of range.
A point should be noted on the contact measurements, namely the AFM and
Talystep measurements. As described above, the surface roughness did not drastically
change with the respective experiments. This was especially true on the higher spatial
frequency contact measurements. Thus, it was decided to only take representative
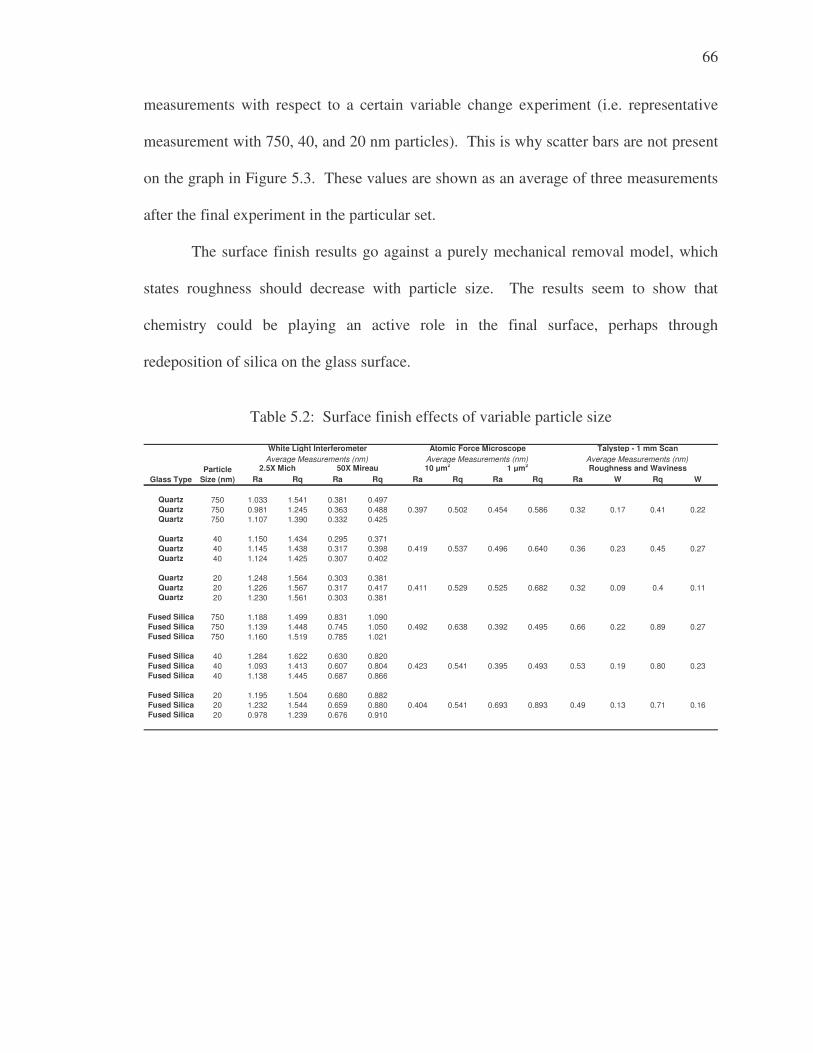
66
measurements with respect to a certain variable change experiment (i.e. representative
measurement with 750, 40, and 20 nm particles). This is why scatter bars are not present
on the graph in Figure 5.3. These values are shown as an average of three measurements
after the final experiment in the particular set.
The surface finish results go against a purely mechanical removal model, which
states roughness should decrease with particle size. The results seem to show that
chemistry could be playing an active role in the final surface, perhaps through
redeposition of silica on the glass surface.
Table 5.2: Surface finish effects of variable particle size
Ra Rq Ra Rq Ra Rq Ra Rq Ra W Rq W
Quartz 750 1.033 1.541 0.381 0.497Quartz 750 0.981 1.245 0.363 0.488 0.397 0.502 0.454 0.586 0.32 0.17 0.41 0.22Quartz 750 1.107 1.390 0.332 0.425
Quartz 40 1.150 1.434 0.295 0.371Quartz 40 1.145 1.438 0.317 0.398 0.419 0.537 0.496 0.640 0.36 0.23 0.45 0.27Quartz 40 1.124 1.425 0.307 0.402
Quartz 20 1.248 1.564 0.303 0.381Quartz 20 1.226 1.567 0.317 0.417 0.411 0.529 0.525 0.682 0.32 0.09 0.4 0.11Quartz 20 1.230 1.561 0.303 0.381
Fused Silica 750 1.188 1.499 0.831 1.090Fused Silica 750 1.139 1.448 0.745 1.050 0.492 0.638 0.392 0.495 0.66 0.22 0.89 0.27Fused Silica 750 1.160 1.519 0.785 1.021
Fused Silica 40 1.284 1.622 0.630 0.820Fused Silica 40 1.093 1.413 0.607 0.804 0.423 0.541 0.395 0.493 0.53 0.19 0.80 0.23Fused Silica 40 1.138 1.445 0.687 0.866
Fused Silica 20 1.195 1.504 0.680 0.882Fused Silica 20 1.232 1.544 0.659 0.880 0.404 0.541 0.693 0.893 0.49 0.13 0.71 0.16Fused Silica 20 0.978 1.239 0.676 0.910
White Light Interferometer Atomic Force Microscope Talystep - 1 mm ScanAverage Measurements (nm) Average Measurements (nm) Average Measurements (nm)
10 �m2 1 �m2 Roughness and WavinessGlass Type
Particle Size (nm)
2.5X Mich 50X Mireau
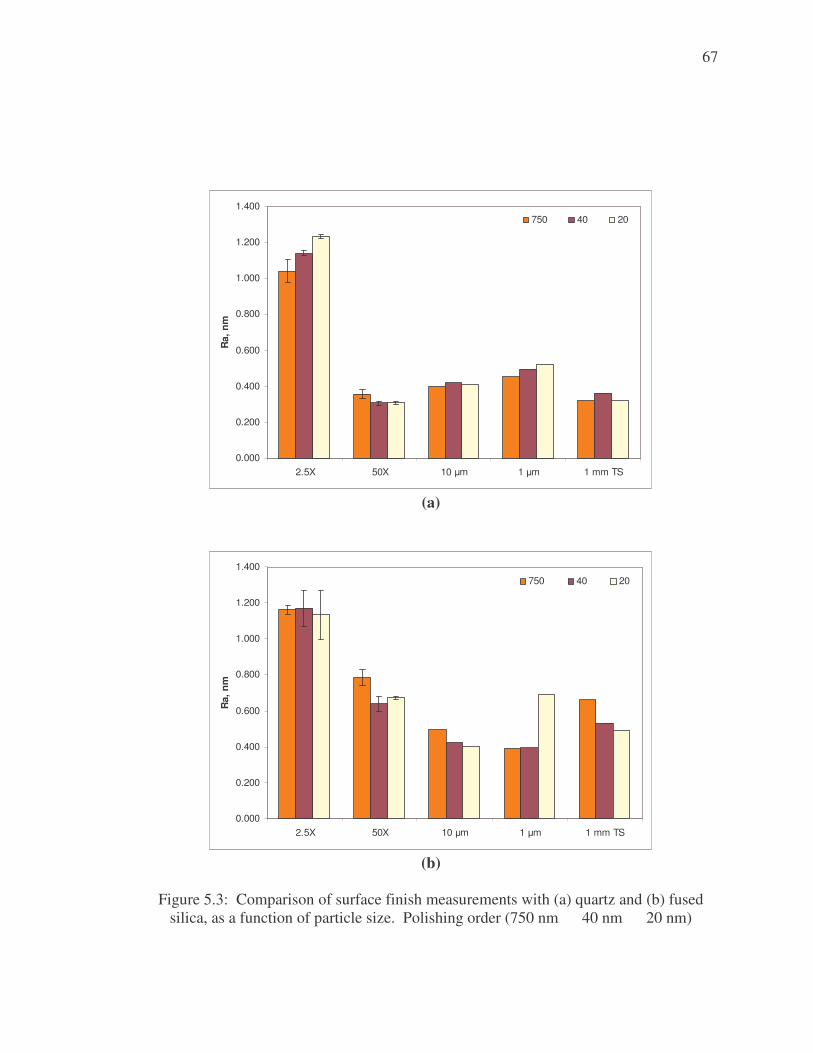
67
0.000
0.200
0.400
0.600
0.800
1.000
1.200
1.400
2.5X 50X 10 �m 1 �m 1 mm TS
Ra,
nm
750 40 20
(a)
0.000
0.200
0.400
0.600
0.800
1.000
1.200
1.400
2.5X 50X 10 �m 1 �m 1 mm TS
Ra,
nm
750 40 20
(b)
Figure 5.3: Comparison of surface finish measurements with (a) quartz and (b) fused
silica, as a function of particle size. Polishing order (750 nm à 40 nm à 20 nm)
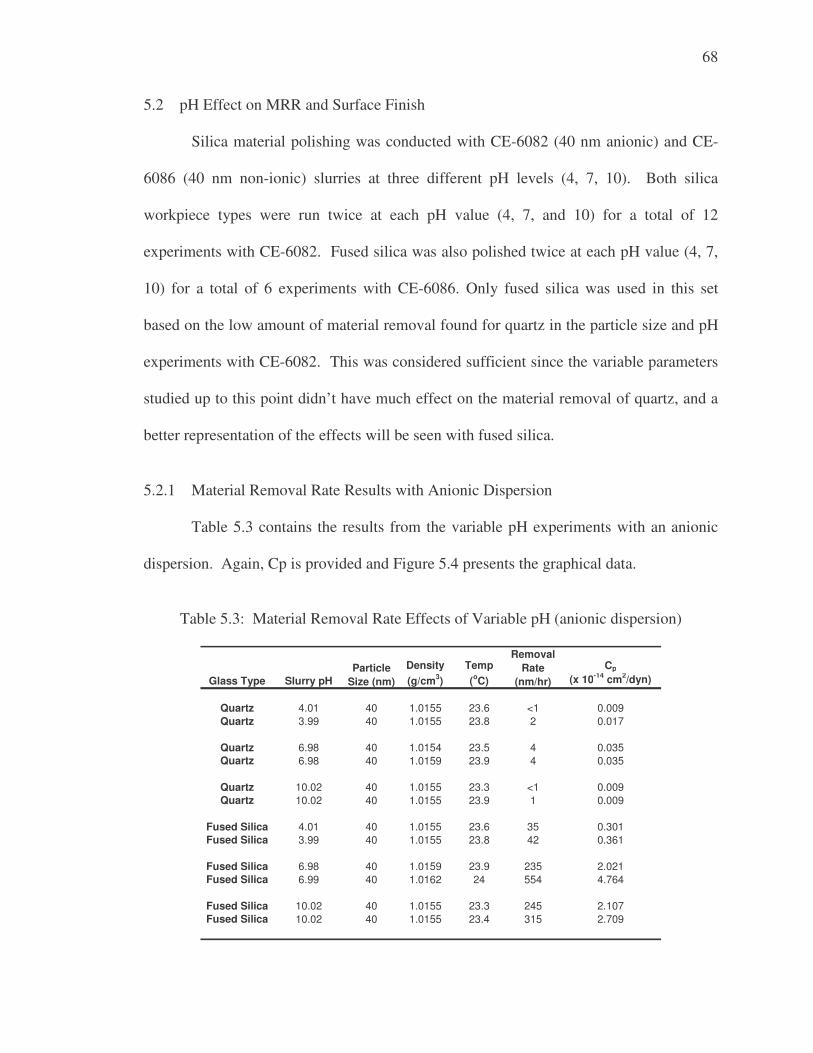
68
5.2 pH Effect on MRR and Surface Finish
Silica material polishing was conducted with CE-6082 (40 nm anionic) and CE-
6086 (40 nm non-ionic) slurries at three different pH levels (4, 7, 10). Both silica
workpiece types were run twice at each pH value (4, 7, and 10) for a total of 12
experiments with CE-6082. Fused silica was also polished twice at each pH value (4, 7,
10) for a total of 6 experiments with CE-6086. Only fused silica was used in this set
based on the low amount of material removal found for quartz in the particle size and pH
experiments with CE-6082. This was considered sufficient since the variable parameters
studied up to this point didn’t have much effect on the material removal of quartz, and a
better representation of the effects will be seen with fused silica.
5.2.1 Material Removal Rate Results with Anionic Dispersion
Table 5.3 contains the results from the variable pH experiments with an anionic
dispersion. Again, Cp is provided and Figure 5.4 presents the graphical data.
Table 5.3: Material Removal Rate Effects of Variable pH (anionic dispersion)
Cp
(x 10-14 cm2/dyn)
Quartz 4.01 40 1.0155 23.6 <1 0.009Quartz 3.99 40 1.0155 23.8 2 0.017
Quartz 6.98 40 1.0154 23.5 4 0.035Quartz 6.98 40 1.0159 23.9 4 0.035
Quartz 10.02 40 1.0155 23.3 <1 0.009Quartz 10.02 40 1.0155 23.9 1 0.009
Fused Silica 4.01 40 1.0155 23.6 35 0.301Fused Silica 3.99 40 1.0155 23.8 42 0.361
Fused Silica 6.98 40 1.0159 23.9 235 2.021Fused Silica 6.99 40 1.0162 24 554 4.764
Fused Silica 10.02 40 1.0155 23.3 245 2.107Fused Silica 10.02 40 1.0155 23.4 315 2.709
Glass TypeDensity (g/cm3)
Temp (oC)
Particle Size (nm)Slurry pH
Removal Rate
(nm/hr)
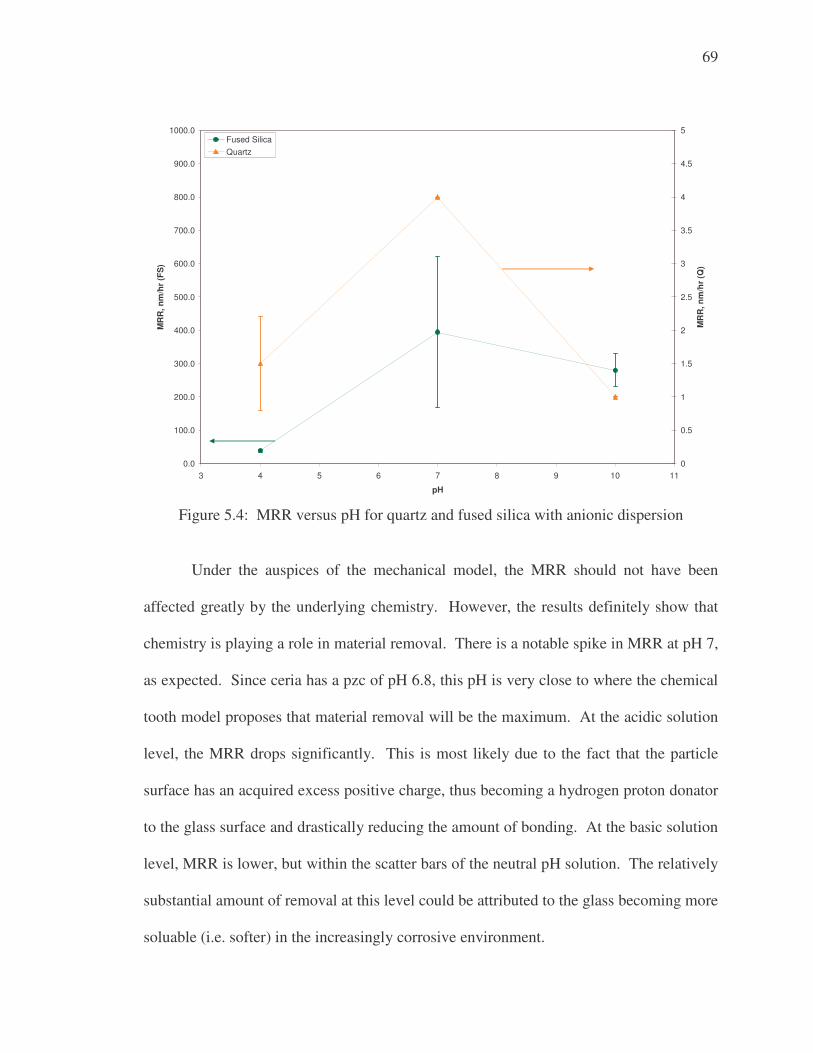
69
0.0
100.0
200.0
300.0
400.0
500.0
600.0
700.0
800.0
900.0
1000.0
3 4 5 6 7 8 9 10 11
pH
MR
R, n
m/h
r (F
S)
0
0.5
1
1.5
2
2.5
3
3.5
4
4.5
5
MR
R, n
m/h
r (Q
)
Fused SilicaQuartz
Figure 5.4: MRR versus pH for quartz and fused silica with anionic dispersion
Under the auspices of the mechanical model, the MRR should not have been
affected greatly by the underlying chemistry. However, the results definitely show that
chemistry is playing a role in material removal. There is a notable spike in MRR at pH 7,
as expected. Since ceria has a pzc of pH 6.8, this pH is very close to where the chemical
tooth model proposes that material removal will be the maximum. At the acidic solution
level, the MRR drops significantly. This is most likely due to the fact that the particle
surface has an acquired excess positive charge, thus becoming a hydrogen proton donator
to the glass surface and drastically reducing the amount of bonding. At the basic solution
level, MRR is lower, but within the scatter bars of the neutral pH solution. The relatively
substantial amount of removal at this level could be attributed to the glass becoming more
soluable (i.e. softer) in the increasingly corrosive environment.
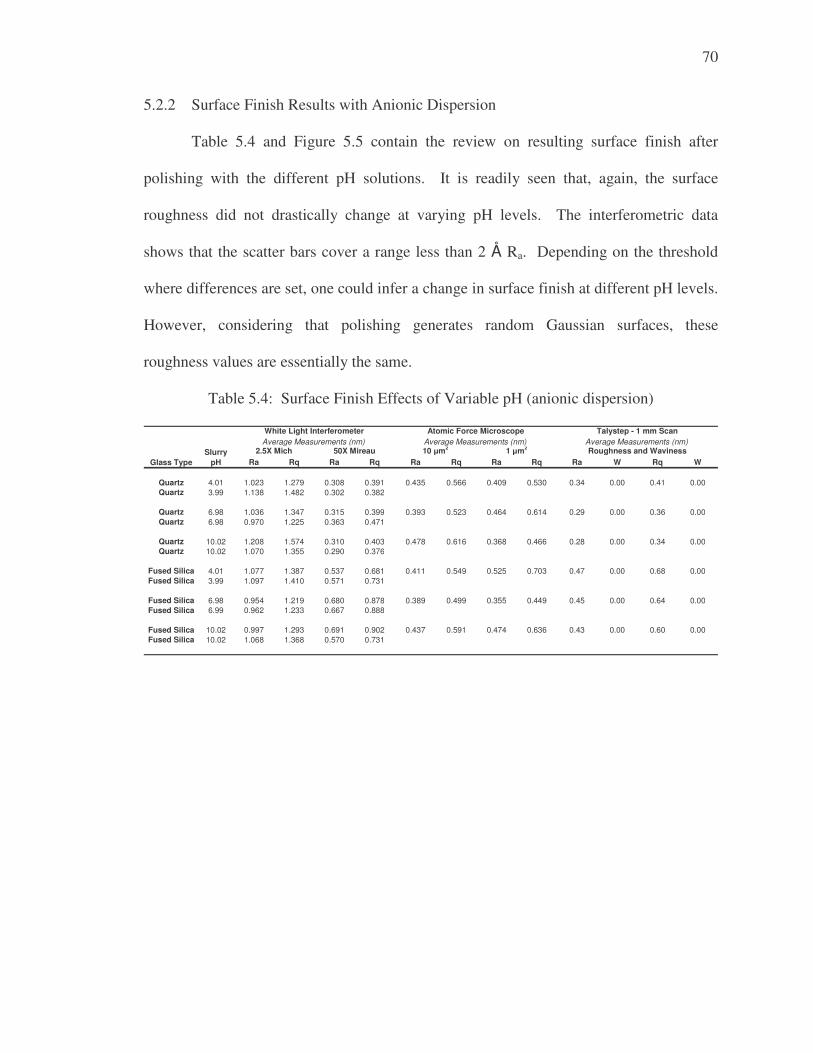
70
5.2.2 Surface Finish Results with Anionic Dispersion
Table 5.4 and Figure 5.5 contain the review on resulting surface finish after
polishing with the different pH solutions. It is readily seen that, again, the surface
roughness did not drastically change at varying pH levels. The interferometric data
shows that the scatter bars cover a range less than 2 Å Ra. Depending on the threshold
where differences are set, one could infer a change in surface finish at different pH levels.
However, considering that polishing generates random Gaussian surfaces, these
roughness values are essentially the same.
Table 5.4: Surface Finish Effects of Variable pH (anionic dispersion)
Ra Rq Ra Rq Ra Rq Ra Rq Ra W Rq W
Quartz 4.01 1.023 1.279 0.308 0.391 0.435 0.566 0.409 0.530 0.34 0.00 0.41 0.00Quartz 3.99 1.138 1.482 0.302 0.382
Quartz 6.98 1.036 1.347 0.315 0.399 0.393 0.523 0.464 0.614 0.29 0.00 0.36 0.00Quartz 6.98 0.970 1.225 0.363 0.471
Quartz 10.02 1.208 1.574 0.310 0.403 0.478 0.616 0.368 0.466 0.28 0.00 0.34 0.00Quartz 10.02 1.070 1.355 0.290 0.376
Fused Silica 4.01 1.077 1.387 0.537 0.681 0.411 0.549 0.525 0.703 0.47 0.00 0.68 0.00Fused Silica 3.99 1.097 1.410 0.571 0.731
Fused Silica 6.98 0.954 1.219 0.680 0.878 0.389 0.499 0.355 0.449 0.45 0.00 0.64 0.00Fused Silica 6.99 0.962 1.233 0.667 0.888
Fused Silica 10.02 0.997 1.293 0.691 0.902 0.437 0.591 0.474 0.636 0.43 0.00 0.60 0.00Fused Silica 10.02 1.068 1.368 0.570 0.731
50X Mireau 10 �m2
Glass TypeSlurry
pH
White Light Interferometer Atomic Force Microscope Talystep - 1 mm ScanAverage Measurements (nm) Average Measurements (nm) Average Measurements (nm)
1 �m2 Roughness and Waviness2.5X Mich
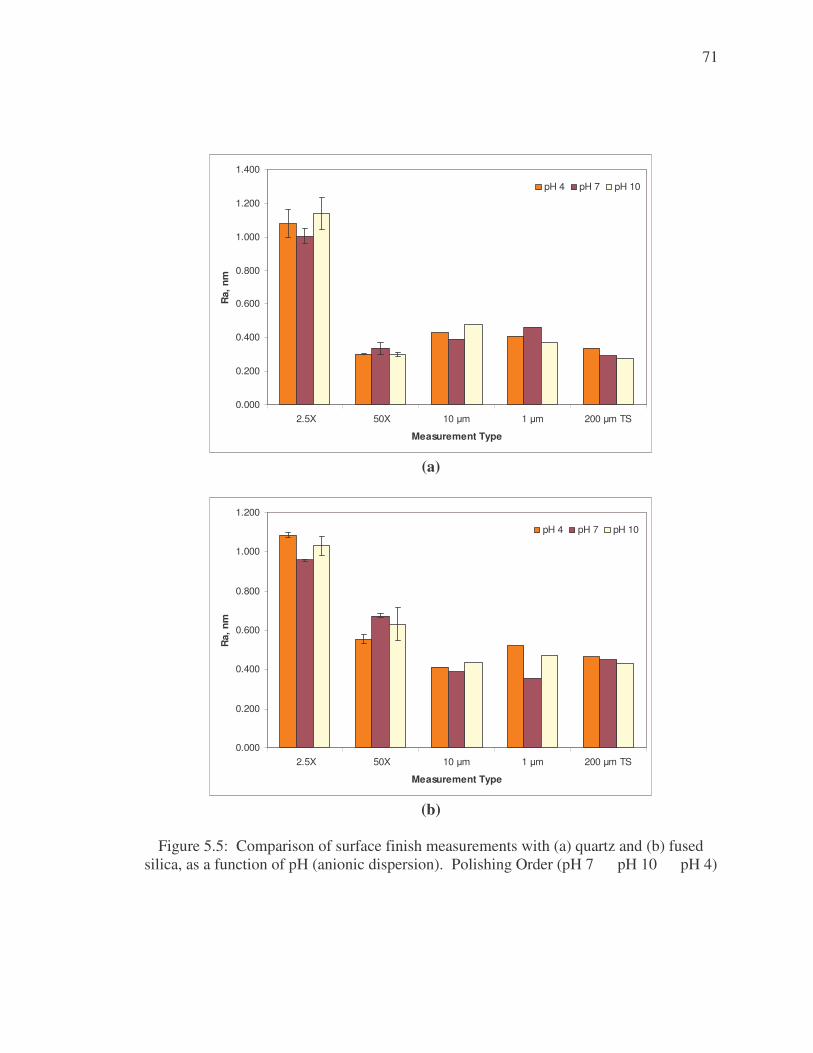
71
0.000
0.200
0.400
0.600
0.800
1.000
1.200
1.400
2.5X 50X 10 �m 1 �m 200 �m TS
Measurement Type
Ra,
nm
pH 4 pH 7 pH 10
(a)
0.000
0.200
0.400
0.600
0.800
1.000
1.200
2.5X 50X 10 �m 1 �m 200 �m TS
Measurement Type
Ra,
nm
pH 4 pH 7 pH 10
(b)
Figure 5.5: Comparison of surface finish measurements with (a) quartz and (b) fused
silica, as a function of pH (anionic dispersion). Polishing Order (pH 7 à pH 10 à pH 4)
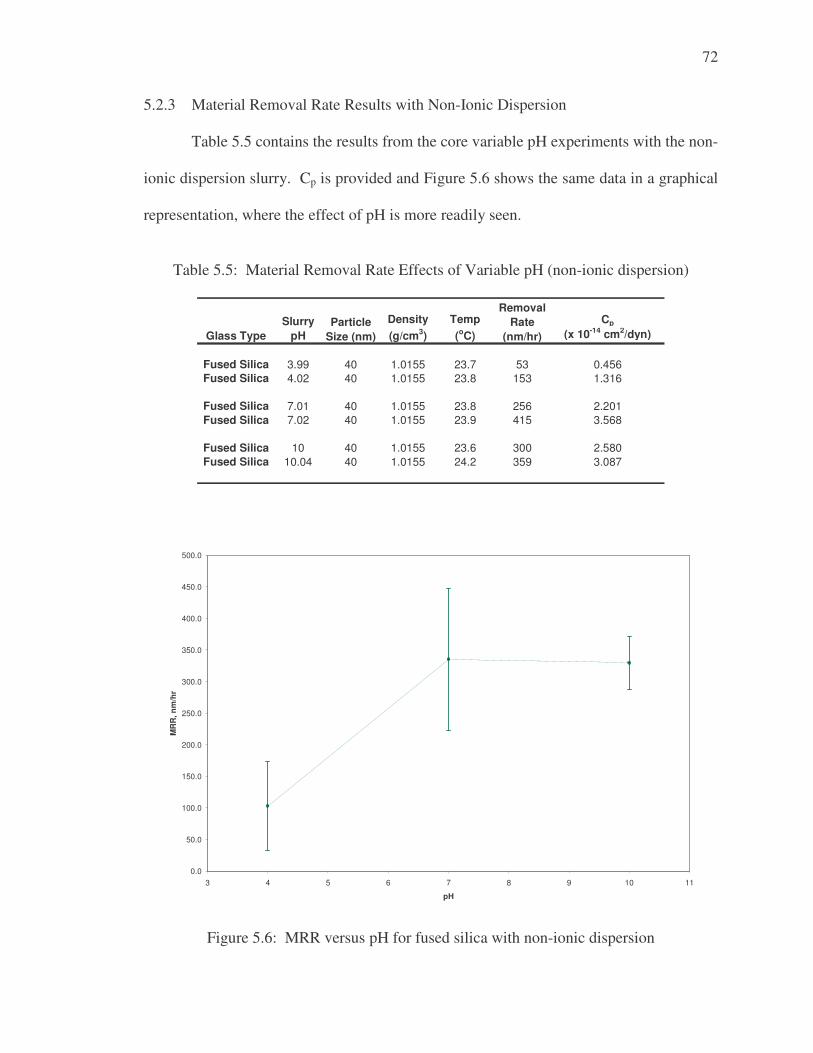
72
5.2.3 Material Removal Rate Results with Non-Ionic Dispersion
Table 5.5 contains the results from the core variable pH experiments with the non-
ionic dispersion slurry. Cp is provided and Figure 5.6 shows the same data in a graphical
representation, where the effect of pH is more readily seen.
Table 5.5: Material Removal Rate Effects of Variable pH (non-ionic dispersion)
Cp
(x 10-14 cm2/dyn)
Fused Silica 3.99 40 1.0155 23.7 53 0.456Fused Silica 4.02 40 1.0155 23.8 153 1.316
Fused Silica 7.01 40 1.0155 23.8 256 2.201Fused Silica 7.02 40 1.0155 23.9 415 3.568
Fused Silica 10 40 1.0155 23.6 300 2.580Fused Silica 10.04 40 1.0155 24.2 359 3.087
Removal Rate
(nm/hr)Glass TypeSlurry
pHDensity (g/cm3)
Particle Size (nm)
Temp (oC)
0.0
50.0
100.0
150.0
200.0
250.0
300.0
350.0
400.0
450.0
500.0
3 4 5 6 7 8 9 10 11
pH
MR
R, n
m/h
r
Figure 5.6: MRR versus pH for fused silica with non-ionic dispersion
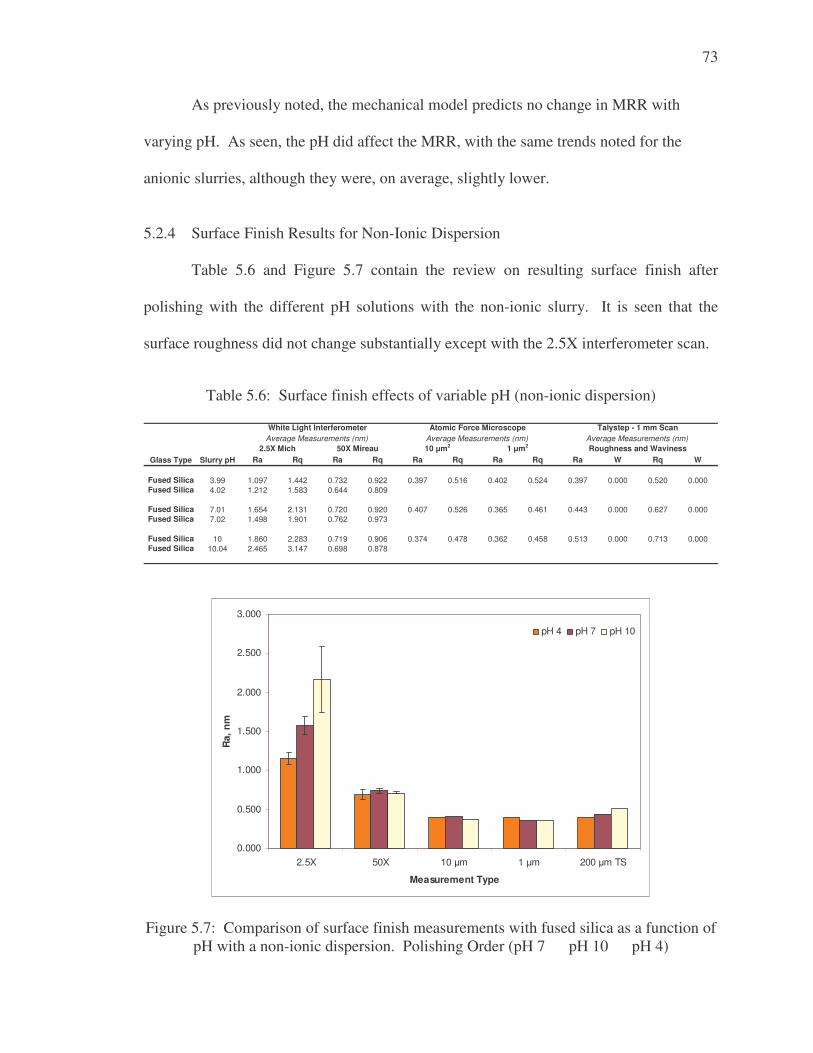
73
As previously noted, the mechanical model predicts no change in MRR with
varying pH. As seen, the pH did affect the MRR, with the same trends noted for the
anionic slurries, although they were, on average, slightly lower.
5.2.4 Surface Finish Results for Non-Ionic Dispersion
Table 5.6 and Figure 5.7 contain the review on resulting surface finish after
polishing with the different pH solutions with the non-ionic slurry. It is seen that the
surface roughness did not change substantially except with the 2.5X interferometer scan.
Table 5.6: Surface finish effects of variable pH (non-ionic dispersion)
Ra Rq Ra Rq Ra Rq Ra Rq Ra W Rq W
Fused Silica 3.99 1.097 1.442 0.732 0.922 0.397 0.516 0.402 0.524 0.397 0.000 0.520 0.000Fused Silica 4.02 1.212 1.583 0.644 0.809
Fused Silica 7.01 1.654 2.131 0.720 0.920 0.407 0.526 0.365 0.461 0.443 0.000 0.627 0.000Fused Silica 7.02 1.498 1.901 0.762 0.973
Fused Silica 10 1.860 2.283 0.719 0.906 0.374 0.478 0.362 0.458 0.513 0.000 0.713 0.000Fused Silica 10.04 2.465 3.147 0.698 0.878
2.5X Mich 50X Mireau 10 �m2
Glass Type Slurry pH
Atomic Force Microscope Talystep - 1 mm ScanAverage Measurements (nm) Average Measurements (nm) Average Measurements (nm)
1 �m2 Roughness and Waviness
White Light Interferometer
0.000
0.500
1.000
1.500
2.000
2.500
3.000
2.5X 50X 10 �m 1 �m 200 �m TS
Measurement Type
Ra,
nm
pH 4 pH 7 pH 10
Figure 5.7: Comparison of surface finish measurements with fused silica as a function of pH with a non-ionic dispersion. Polishing Order (pH 7 à pH 10 à pH 4)
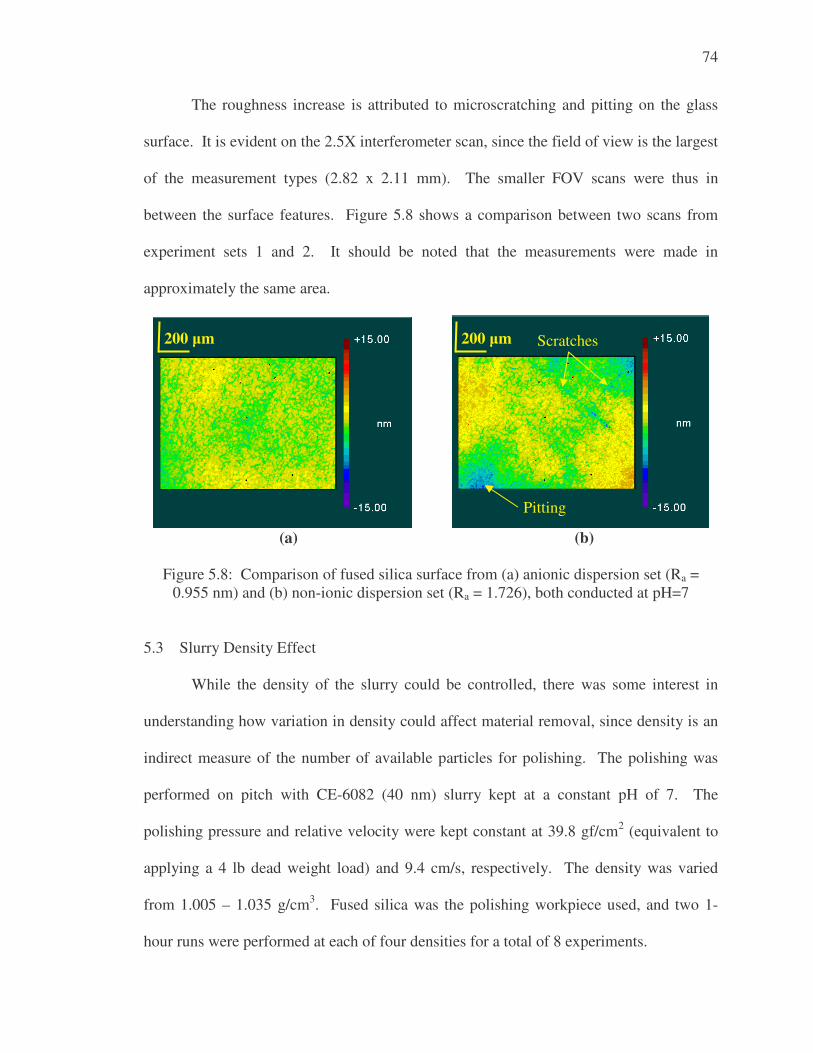
74
The roughness increase is attributed to microscratching and pitting on the glass
surface. It is evident on the 2.5X interferometer scan, since the field of view is the largest
of the measurement types (2.82 x 2.11 mm). The smaller FOV scans were thus in
between the surface features. Figure 5.8 shows a comparison between two scans from
experiment sets 1 and 2. It should be noted that the measurements were made in
approximately the same area.
(a) (b)
Figure 5.8: Comparison of fused silica surface from (a) anionic dispersion set (Ra =
0.955 nm) and (b) non-ionic dispersion set (Ra = 1.726), both conducted at pH=7 5.3 Slurry Density Effect
While the density of the slurry could be controlled, there was some interest in
understanding how variation in density could affect material removal, since density is an
indirect measure of the number of available particles for polishing. The polishing was
performed on pitch with CE-6082 (40 nm) slurry kept at a constant pH of 7. The
polishing pressure and relative velocity were kept constant at 39.8 gf/cm2 (equivalent to
applying a 4 lb dead weight load) and 9.4 cm/s, respectively. The density was varied
from 1.005 – 1.035 g/cm3. Fused silica was the polishing workpiece used, and two 1-
hour runs were performed at each of four densities for a total of 8 experiments.
200 �m Scratches
Pitting
200 �m
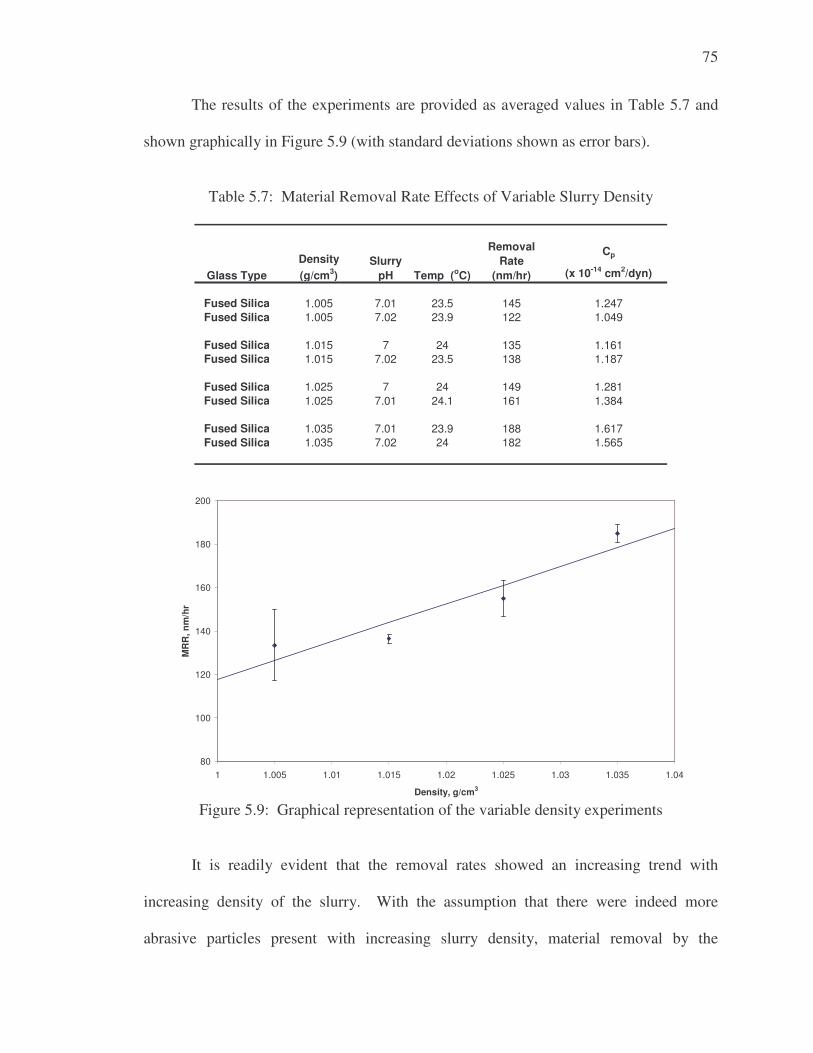
75
The results of the experiments are provided as averaged values in Table 5.7 and
shown graphically in Figure 5.9 (with standard deviations shown as error bars).
Table 5.7: Material Removal Rate Effects of Variable Slurry Density
(x 10-14 cm2/dyn)
Fused Silica 1.005 7.01 23.5 145 1.247Fused Silica 1.005 7.02 23.9 122 1.049
Fused Silica 1.015 7 24 135 1.161Fused Silica 1.015 7.02 23.5 138 1.187
Fused Silica 1.025 7 24 149 1.281Fused Silica 1.025 7.01 24.1 161 1.384
Fused Silica 1.035 7.01 23.9 188 1.617Fused Silica 1.035 7.02 24 182 1.565
Glass TypeSlurry
pHDensity (g/cm3)
Cp
Temp (oC)
Removal Rate
(nm/hr)
80
100
120
140
160
180
200
1 1.005 1.01 1.015 1.02 1.025 1.03 1.035 1.04
Density, g/cm3
MR
R, n
m/h
r
Figure 5.9: Graphical representation of the variable density experiments
It is readily evident that the removal rates showed an increasing trend with
increasing density of the slurry. With the assumption that there were indeed more
abrasive particles present with increasing slurry density, material removal by the
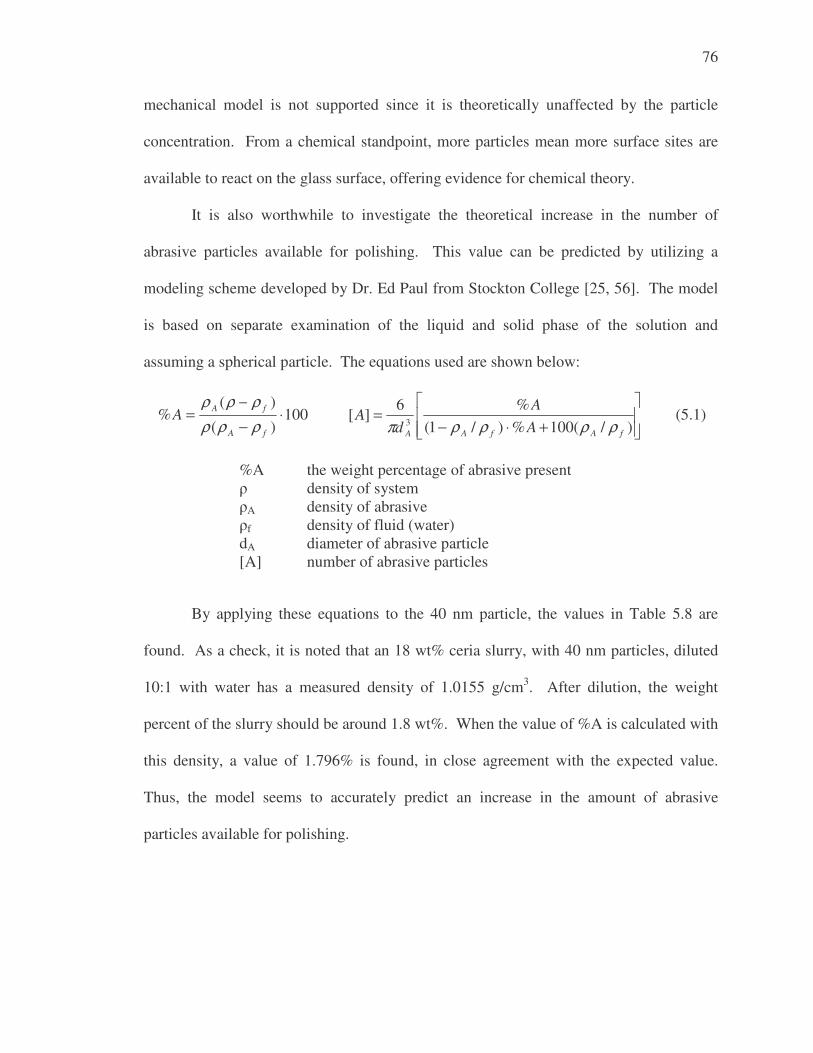
76
mechanical model is not supported since it is theoretically unaffected by the particle
concentration. From a chemical standpoint, more particles mean more surface sites are
available to react on the glass surface, offering evidence for chemical theory.
It is also worthwhile to investigate the theoretical increase in the number of
abrasive particles available for polishing. This value can be predicted by utilizing a
modeling scheme developed by Dr. Ed Paul from Stockton College [25, 56]. The model
is based on separate examination of the liquid and solid phase of the solution and
assuming a spherical particle. The equations used are shown below:
100)(
)(% ⋅
−−
=fA
fAAρρρρρρ
���
�
���
�
+⋅−=
)/(100%)/1(%6
][ 3fAfAA A
Ad
Aρρρρπ
(5.1)
%A à the weight percentage of abrasive present � à density of system �A à density of abrasive �f à density of fluid (water) dA à diameter of abrasive particle [A] à number of abrasive particles By applying these equations to the 40 nm particle, the values in Table 5.8 are
found. As a check, it is noted that an 18 wt% ceria slurry, with 40 nm particles, diluted
10:1 with water has a measured density of 1.0155 g/cm3. After dilution, the weight
percent of the slurry should be around 1.8 wt%. When the value of %A is calculated with
this density, a value of 1.796% is found, in close agreement with the expected value.
Thus, the model seems to accurately predict an increase in the amount of abrasive
particles available for polishing.
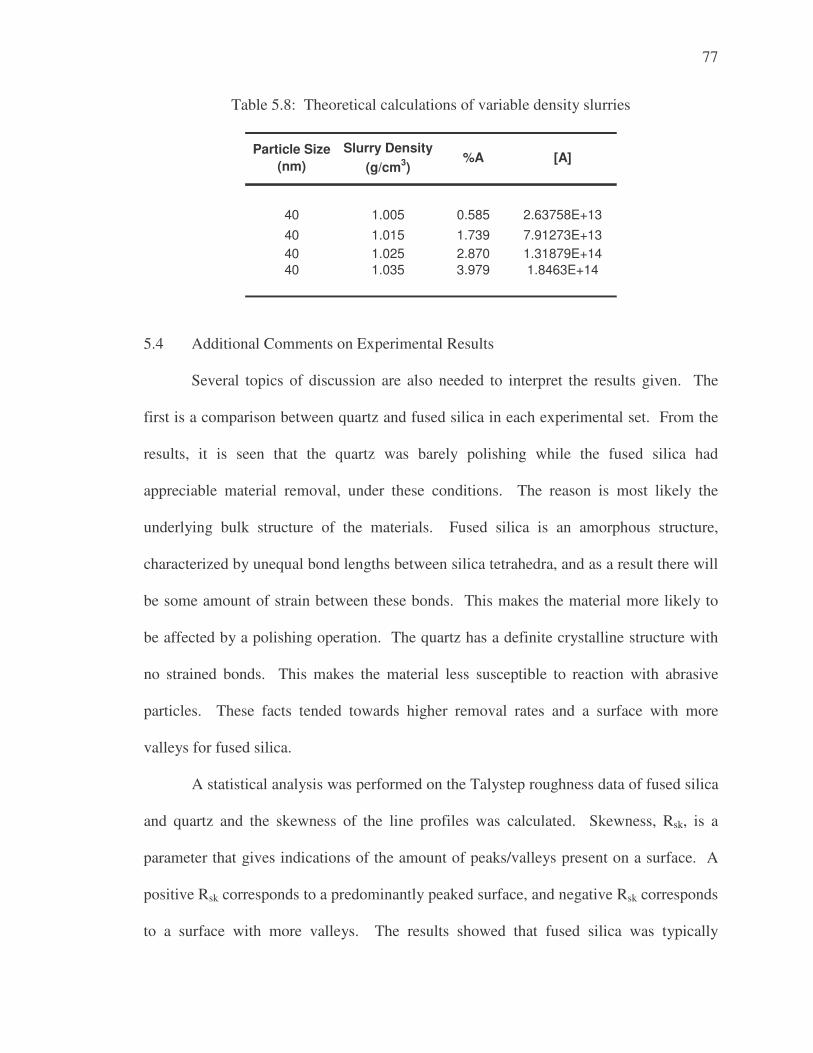
77
Table 5.8: Theoretical calculations of variable density slurries
40 1.005 0.585 2.63758E+1340 1.015 1.739 7.91273E+1340 1.025 2.870 1.31879E+1440 1.035 3.979 1.8463E+14
Particle Size (nm)
Slurry Density (g/cm3)
%A [A]
5.4 Additional Comments on Experimental Results
Several topics of discussion are also needed to interpret the results given. The
first is a comparison between quartz and fused silica in each experimental set. From the
results, it is seen that the quartz was barely polishing while the fused silica had
appreciable material removal, under these conditions. The reason is most likely the
underlying bulk structure of the materials. Fused silica is an amorphous structure,
characterized by unequal bond lengths between silica tetrahedra, and as a result there will
be some amount of strain between these bonds. This makes the material more likely to
be affected by a polishing operation. The quartz has a definite crystalline structure with
no strained bonds. This makes the material less susceptible to reaction with abrasive
particles. These facts tended towards higher removal rates and a surface with more
valleys for fused silica.
A statistical analysis was performed on the Talystep roughness data of fused silica
and quartz and the skewness of the line profiles was calculated. Skewness, Rsk, is a
parameter that gives indications of the amount of peaks/valleys present on a surface. A
positive Rsk corresponds to a predominantly peaked surface, and negative Rsk corresponds
to a surface with more valleys. The results showed that fused silica was typically
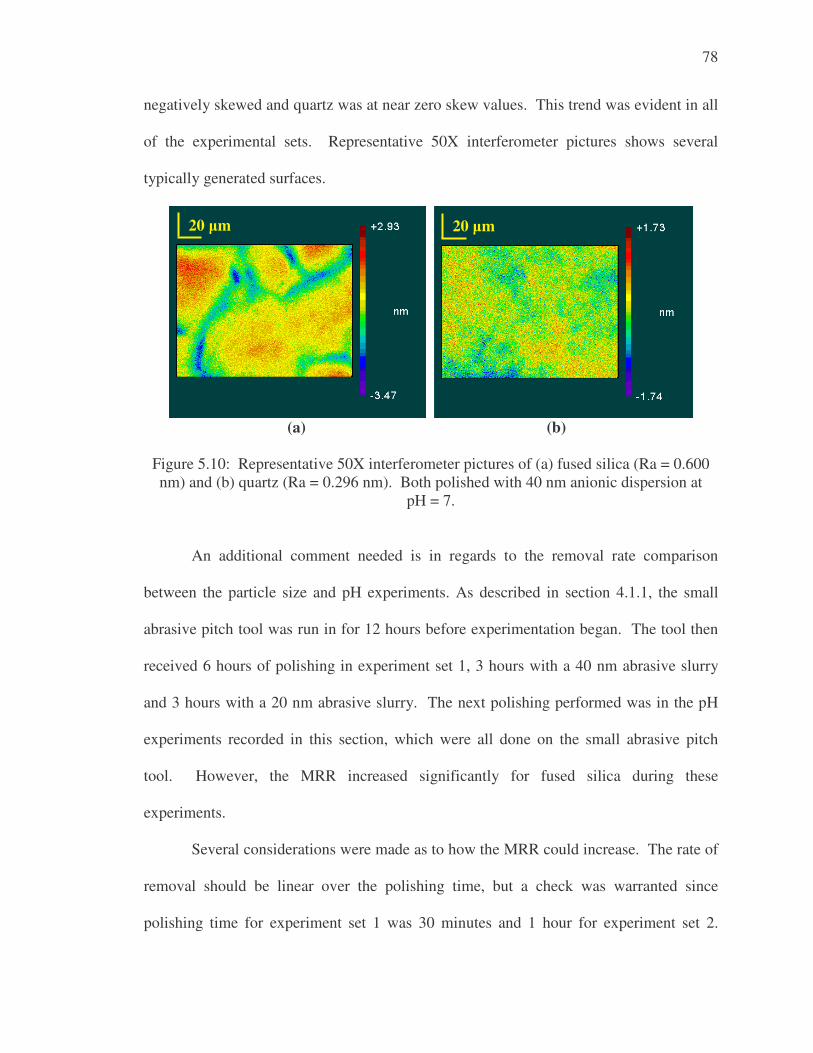
78
negatively skewed and quartz was at near zero skew values. This trend was evident in all
of the experimental sets. Representative 50X interferometer pictures shows several
typically generated surfaces.
(a) (b)
Figure 5.10: Representative 50X interferometer pictures of (a) fused silica (Ra = 0.600 nm) and (b) quartz (Ra = 0.296 nm). Both polished with 40 nm anionic dispersion at
pH = 7.
An additional comment needed is in regards to the removal rate comparison
between the particle size and pH experiments. As described in section 4.1.1, the small
abrasive pitch tool was run in for 12 hours before experimentation began. The tool then
received 6 hours of polishing in experiment set 1, 3 hours with a 40 nm abrasive slurry
and 3 hours with a 20 nm abrasive slurry. The next polishing performed was in the pH
experiments recorded in this section, which were all done on the small abrasive pitch
tool. However, the MRR increased significantly for fused silica during these
experiments.
Several considerations were made as to how the MRR could increase. The rate of
removal should be linear over the polishing time, but a check was warranted since
polishing time for experiment set 1 was 30 minutes and 1 hour for experiment set 2.
20 �m 20 �m
79
After completion of all the experiments in this thesis, several polishing runs were
performed under the same conditions as the 40 nm particle trials in experiment set 1 (i.e.
same density and out-of-box pH). The runs were for 30 minutes each and the MRR was
178 nm/hr (89 nm/30 min) and 176 nm/hr (88 nm/30 min). These results were consistent
and higher that the values found in experiment set 1, indicating a more efficient tool. An
explanation could be proposed by noting the fact that MRR didn’t increase until the pitch
tool was loaded with the 20 nm abrasive slurries. When the polishing began with 40 nm
abrasive slurries in experiment set 2, the embedded 20 nm particles must have been at
work. Regardless of the reason why, the pitch tool obviously became more efficient.
Thus, a direct comparison between particle size and pH experiments should not be made.
Rather, only the relative results should be compared within each experiment set.
CHAPTER 6: DISCUSSION
As is normally the case for polishing experimentation, the results presented in this
thesis provide a fruitful ground for discussion. The results provide some hard evidence,
as well as raise new issues with respect to the material removal theories. The evidence
will be discussed, as well as other influencing factors seen during the course of
experimentation.
6.1 Discussion on Removal Mechanism Theories
The experiments discussed in Section 4.6 and the results highlighted in Chapter 5
provide a great deal of information and justification for the chemical model of material
removal, versus the Brown/Cook model for mechanical abrasion. Each of the variables
contained in the experiment sets provide some amount of justification either for or
against these two models.
6.1.1 Mechanical Removal Theory
Particle Size
The Brown/Cook mechanical model proposes that MRR should be independent of
particle size. However, the results show that MRR decreased drastically for a respective
large decrease in mean particle diameter. For both quartz and fused silica, an order of
magnitude decrease in particle size equated to an order of magnitude lower removal rates.
Additionally, the mechanical model states that surface roughness should decrease with
81
decreasing particle size. The mechanical wear is through the process of scratching the
glass surface to effect material removal. Larger particles correlate with larger scratches,
and smaller particles with smaller scratches, with equivalent loading. Again, the model
fails to hold since the surface finish did not drastically change with particle size.
It is also worthwhile to mention that the papers proposing the Brown/Cook
mechanical model [31, 33] used particles that were larger (on the order of 1 �m) than the
nanoparticles used in this work. The nanoparticles may be small enough to negate some
of the underlying assumptions made in the development of the Brown/Cook model. In
other words, there may be a limit where mechanical models predict accurately, and below
this value the chemistry becomes a more prevalent factor. Further investigation into the
mechanical aspects of these small particles (i.e. << 1 �m) will be the subject of a future
work on theoretical modeling, highlighted in Chapter 7.
Polishing Dispersion pH
The mechanical theory does not account for chemistry changes, as in modification
of the polishing solution pH, and thus predicts no change in MRR and surface finish with
varying solution pH. However, it was seen that the maximum removal was at pH 7, with
intermediate values at basic solution levels and lowest at acidic solution levels. Again,
the mechanical model does not hold and indicates chemistry is playing a vital role.
Particle Concentration
Particle concentration is also suspected of having no effect on MRR according to
the mechanical theory. By changing the density, it was assumed that the particle
concentration increased, which is a valid assumption. As shown in section 5.3, there is
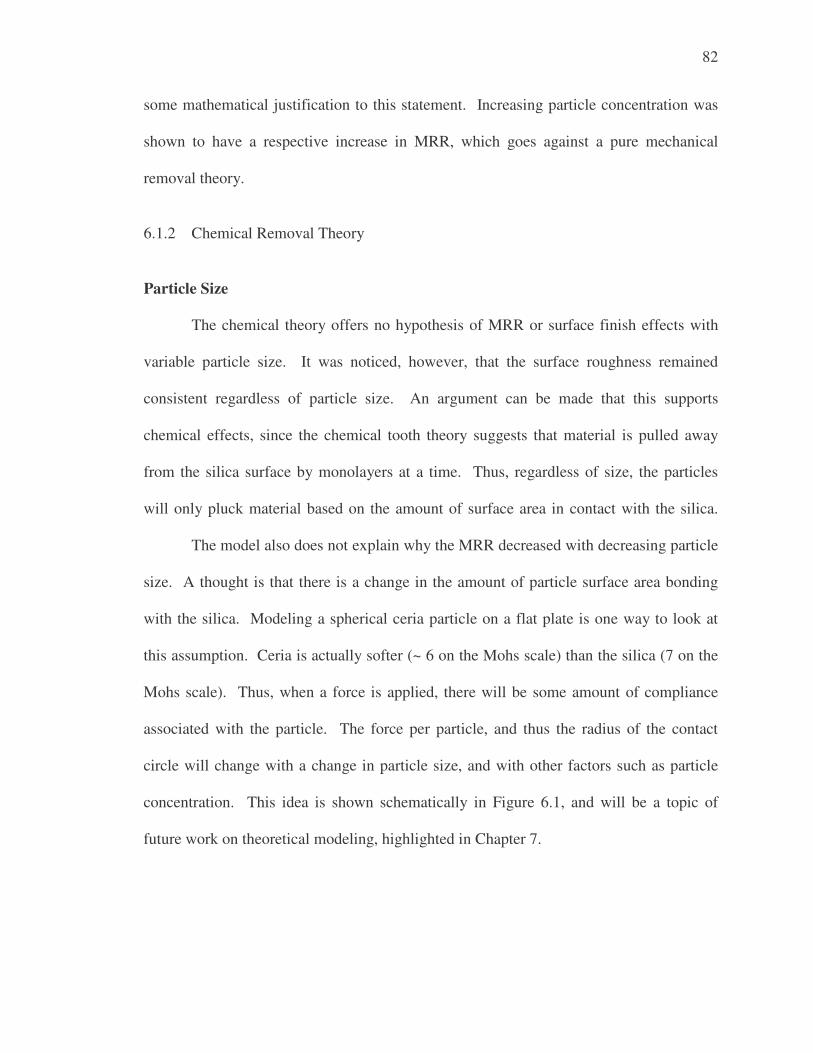
82
some mathematical justification to this statement. Increasing particle concentration was
shown to have a respective increase in MRR, which goes against a pure mechanical
removal theory.
6.1.2 Chemical Removal Theory
Particle Size
The chemical theory offers no hypothesis of MRR or surface finish effects with
variable particle size. It was noticed, however, that the surface roughness remained
consistent regardless of particle size. An argument can be made that this supports
chemical effects, since the chemical tooth theory suggests that material is pulled away
from the silica surface by monolayers at a time. Thus, regardless of size, the particles
will only pluck material based on the amount of surface area in contact with the silica.
The model also does not explain why the MRR decreased with decreasing particle
size. A thought is that there is a change in the amount of particle surface area bonding
with the silica. Modeling a spherical ceria particle on a flat plate is one way to look at
this assumption. Ceria is actually softer (~ 6 on the Mohs scale) than the silica (7 on the
Mohs scale). Thus, when a force is applied, there will be some amount of compliance
associated with the particle. The force per particle, and thus the radius of the contact
circle will change with a change in particle size, and with other factors such as particle
concentration. This idea is shown schematically in Figure 6.1, and will be a topic of
future work on theoretical modeling, highlighted in Chapter 7.
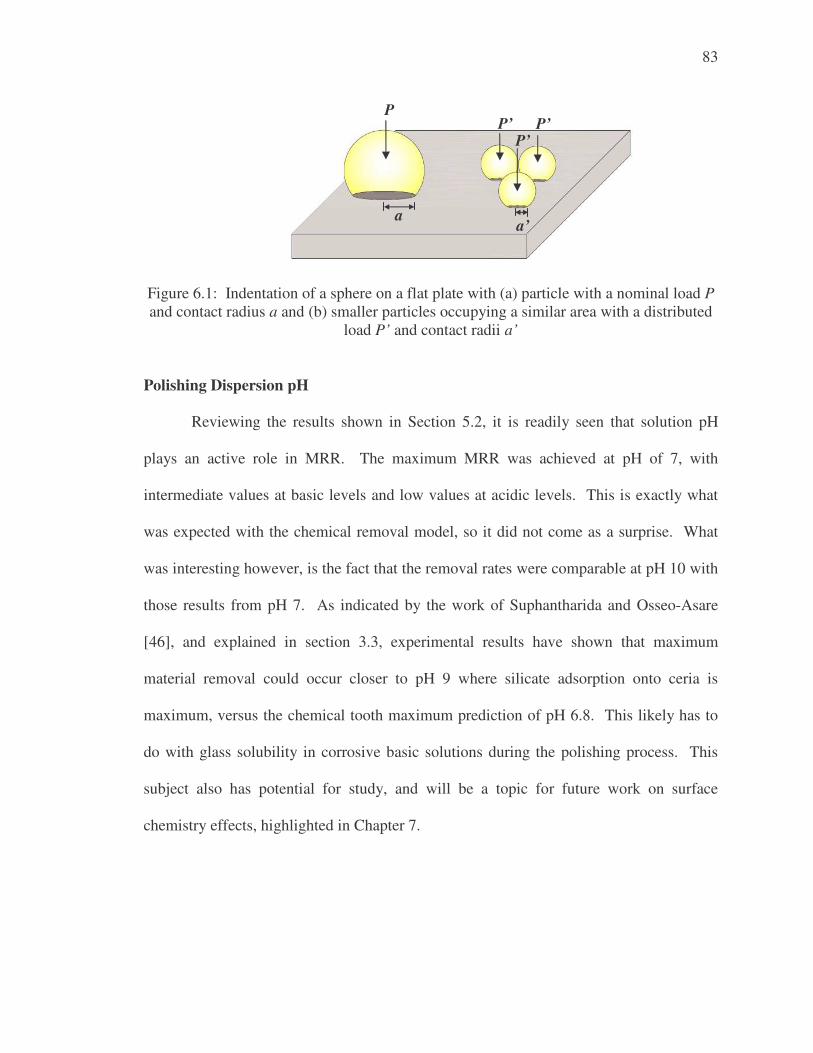
83
Figure 6.1: Indentation of a sphere on a flat plate with (a) particle with a nominal load P and contact radius a and (b) smaller particles occupying a similar area with a distributed
load P’ and contact radii a’
Polishing Dispersion pH
Reviewing the results shown in Section 5.2, it is readily seen that solution pH
plays an active role in MRR. The maximum MRR was achieved at pH of 7, with
intermediate values at basic levels and low values at acidic levels. This is exactly what
was expected with the chemical removal model, so it did not come as a surprise. What
was interesting however, is the fact that the removal rates were comparable at pH 10 with
those results from pH 7. As indicated by the work of Suphantharida and Osseo-Asare
[46], and explained in section 3.3, experimental results have shown that maximum
material removal could occur closer to pH 9 where silicate adsorption onto ceria is
maximum, versus the chemical tooth maximum prediction of pH 6.8. This likely has to
do with glass solubility in corrosive basic solutions during the polishing process. This
subject also has potential for study, and will be a topic for future work on surface
chemistry effects, highlighted in Chapter 7.
P P’
a a’
P’ P’
84
Particle Concentration
The particle concentration experiments showed that MRR increased with more
particles. This fact also supports chemical theory in that more abrasive particles mean
more bonding sites for material to be plucked from the silica surface.
6.1.3 Realities of Polishing
The results provided may appear as an attempt to completely shoot down the
Brown/Cook model, but this is definitely not the case. As discussed in the motivation
(Section 3.4), the goal was to highlight the dominance of either the Brown/Cook
mechanical or chemical removal mechanisms.
In reality, the polishing process is, as described in Chapter 3, a process of both
chemical and mechanical actions. It is impossible to physically separate the two when
discussing chemically active particles and glass. It is the dominance of either portion that
is really the question at hand. Mechanical action of physically placing particles in
contact with the silica surface and then removing them is a necessary part of polishing.
The chemical bonding between the particle and silica is also apparently necessary. The
experimental results have shown that, under the conditions presented, that the chemical
tooth seems to be the dominant removal mechanism in ceria-silica polishing. The MRR
is affected in a manner depicted by the chemical tooth theory (variable pH), and the
surface finish is also supported by the model in that it predicts generation of by products
(in the form of silicic acid) that can redeposit on the silica surface (see Equation 3.4 in
Sec. 3.1.2) and produce smooth surfaces.
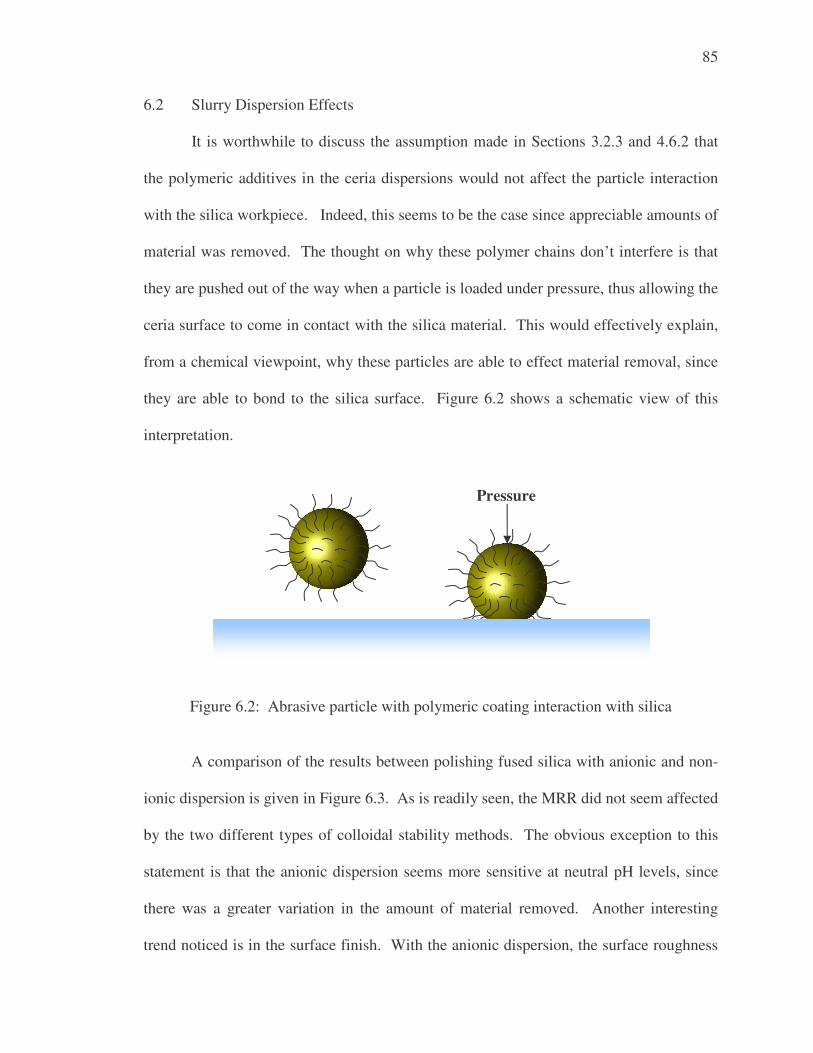
85
6.2 Slurry Dispersion Effects
It is worthwhile to discuss the assumption made in Sections 3.2.3 and 4.6.2 that
the polymeric additives in the ceria dispersions would not affect the particle interaction
with the silica workpiece. Indeed, this seems to be the case since appreciable amounts of
material was removed. The thought on why these polymer chains don’t interfere is that
they are pushed out of the way when a particle is loaded under pressure, thus allowing the
ceria surface to come in contact with the silica material. This would effectively explain,
from a chemical viewpoint, why these particles are able to effect material removal, since
they are able to bond to the silica surface. Figure 6.2 shows a schematic view of this
interpretation.
Figure 6.2: Abrasive particle with polymeric coating interaction with silica
A comparison of the results between polishing fused silica with anionic and non-
ionic dispersion is given in Figure 6.3. As is readily seen, the MRR did not seem affected
by the two different types of colloidal stability methods. The obvious exception to this
statement is that the anionic dispersion seems more sensitive at neutral pH levels, since
there was a greater variation in the amount of material removed. Another interesting
trend noticed is in the surface finish. With the anionic dispersion, the surface roughness
Pressure
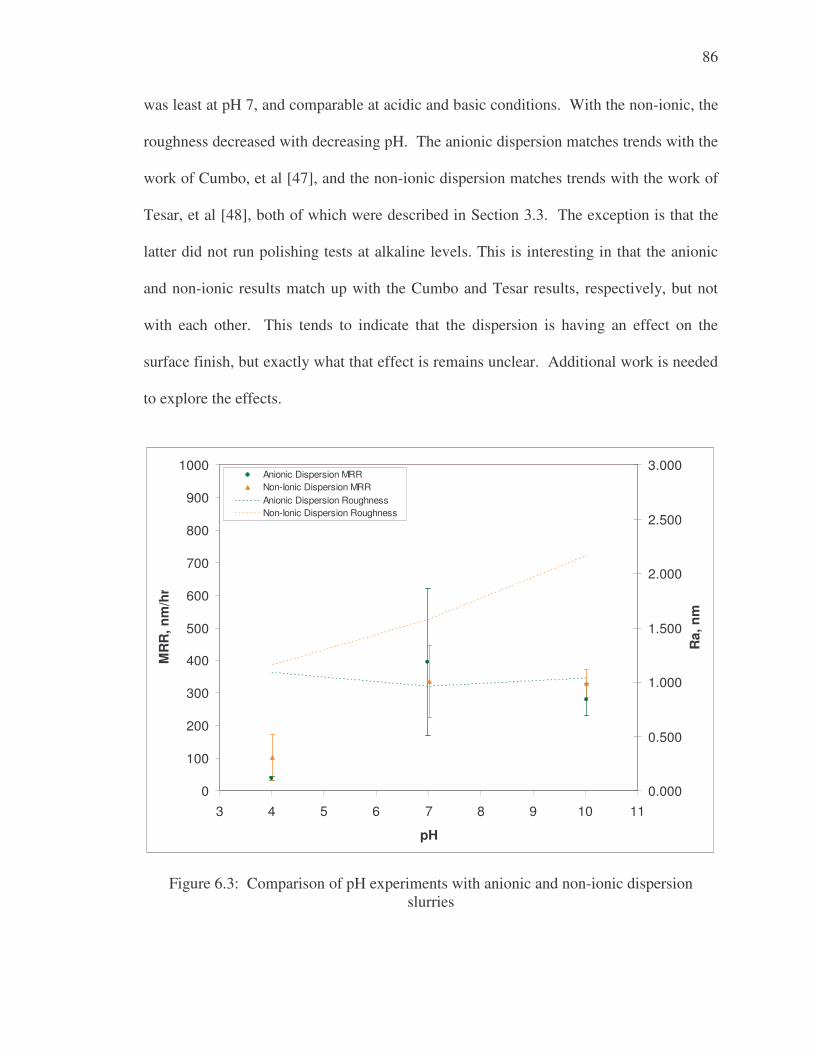
86
was least at pH 7, and comparable at acidic and basic conditions. With the non-ionic, the
roughness decreased with decreasing pH. The anionic dispersion matches trends with the
work of Cumbo, et al [47], and the non-ionic dispersion matches trends with the work of
Tesar, et al [48], both of which were described in Section 3.3. The exception is that the
latter did not run polishing tests at alkaline levels. This is interesting in that the anionic
and non-ionic results match up with the Cumbo and Tesar results, respectively, but not
with each other. This tends to indicate that the dispersion is having an effect on the
surface finish, but exactly what that effect is remains unclear. Additional work is needed
to explore the effects.
0
100
200
300
400
500
600
700
800
900
1000
3 4 5 6 7 8 9 10 11
pH
MR
R, n
m/h
r
0.000
0.500
1.000
1.500
2.000
2.500
3.000
Ra,
nm
Anionic Dispersion MRRNon-Ionic Dispersion MRRAnionic Dispersion RoughnessNon-Ionic Dispersion Roughness
Figure 6.3: Comparison of pH experiments with anionic and non-ionic dispersion slurries
CHAPTER 7: CONCLUSIONS AND FUTURE WORK
The procedures and results contained in this thesis provide strong supporting
evidence that chemistry plays a vital role in the polishing of silica materials with metal
oxide abrasives, namely ceria. Several novel methods were also presented, as highlighted
in the ancillary conclusions below that could aid future research by minimizing some
often overlooked variables.
Main Conclusions
1. The Brown/Cook mechanical model theories were found not to hold for variable
particle size with respect to MRR and resulting surface finish.
2. The chemical theory was supported by surface finish results from variable particle
size and pH experiments, and MRR results from variable pH experiments.
3. The decrease in MRR with decreasing particle size is not fully understood with
respect to the chemical model. The theoretical modeling planned for future work
should provide insight into the number of available particles, loads on those
particles and resulting contact area for chemical material removal.
4. The method of colloidal solution stability did not play a large role in MRR of
silica polishing. Some question still exists as to why the polymeric coating on the
non-ionic particle seemed to affect the overall surface finish of the workpiece.
88
Ancillary Conclusions
5. It was found that use of the overarm device on a traditional polishing system can
drastically affect the pressure visible at the workpiece. A method was provided to
overcome the condition by using constant weight load directly on the workpiece
holder and removing the down force induced by the overarm quill.
6. A novel method for capturing MRR data was developed that eliminates any
uncertainty involved with mass centric measurements (e.g. water adsorption, part
cleanliness).
Future Work
As described in Chapter 6, the research performed answered some questions, but
also raised others. Thus, there is a need for additional research to couple with the results
presented in this thesis to answer some basic questions on the polishing process. The
needed work is described below.
1. Surface Chemistry Effects: More information is needed on the effects of
workpiece chemistry changes when in contact with varying pH solutions. An initial
effort was attempted in this body of work, by measuring the Knoop hardness of silica
materials exposed to solutions with pH 4-10. Unfortunately, no clear trend was evident,
and it was assumed that the depth of the chemically affected layer must be much less than
the depth of a micro-indent. However, out of this effort came the idea of performing
scratch tests with varying pH abrasive slurries. This test would more directly describe
the mechanical aspect of the polishing process.
89
2. Hydrodynamic Conditions During Polishing: Coupled with the scratch tests,
determination of the frictional forces involved with polishing silica on pitch under
varying pH conditions will be performed. It was noted during performance of this work
that basic solutions were visibly ‘slicker’ than acidic solutions. These frictional force
measurements could provide insight into whether there are regimes of hydrodynamic
skating of the workpiece, so a test to determine the coefficient of friction at each pH level
is warranted. The work will be accomplished using the deterministic polishing head
currently under test in the Advanced Surfaces Group [57].
3. Theoretical Modeling: Applying existing theoretical models is also of interest to
this body of work. An existing model has been proposed by researchers at Motorola [58],
which describes a CMP model that accounts for roughness of the polishing pad.
Although it is centered on CMP, the theory is modeled as a pad surface with bumps,
much like the configuration of abrasive particles protruding from pitch. The modeling
equations predict removal rates based not only on applied pressure, but also the pressure
that is seen at the particle level. Application of these theories to pitch polishing could be
developed, and experiments designed to compare with the analytical results by utilizing
variables such as number of available particles, applied pressure, pressure at an individual
particle and their effects on indentation depth and contact area.
90
Final Thoughts
The results provided in this thesis will hopefully serve as a starting point for
future work on the subject with the Advanced Surfaces Group of the Center for Precision
Metrology, UNC-Charlotte. Experimental validation has been provided that shows
chemical tooth as the dominant removal mechanism in ceria-silica polishing. However,
this work is merely a launching pad for additional experimentation that will continue the
focus on basic science in polishing and the application of that science to a variety of
glass.
The nature of polishing can be unpredictable. Even with strict control of process
parameters, there is little certainty in predicting approximate removal rates and resulting
surface finish. Work of this type will continue, drilling down on the more scientific
aspects, versus just trying to reach the end goal. With better understanding of the
underlying science of a particular polishing scheme, like the one presented here,
transitions to different glass – particle – polisher configurations can be made that will
hopefully reduce the expensive and time consuming process of polishing.
91
REFERENCES
1. Lu, P.J., Yao, N., So, J.F., Harlow, G.E., Lu, J.F., Wang, G.F., 2005, "The Earliest
Use of Corundum and Diamond In Prehistoric China," Acrhaeometry, 47(1): 1-12. 2. Miniati, M., Van Helden, A., Greco, V., Molesini, G., 2002, "Seventeenth-Century
Telecsope Optics of Torricelli, Divini, and Campani," App. Opt., 41(4): 644-647. 3. Gillman, B.E., Tinker, F., 1999, "Fun Facts About Pitch and the Pitfalls of
Ignorance," Proc. of SPIE, 3782: 72-79. 4. Preston, F.W., 1923, "On the Properties of Pitch Used in Working Optical Glass,"
Trans. of Opt. Soc., 24(3): 117-142. 5. Brown, N.J., 1977, "Optical Polishing Pitch," LLNL Document UCRL-80301,
Preprint for OSA Workshop on Optical Fabrication and Testing, San Mateo, CA, November 10th - 12th.
6. Gee, A., "Modelling the Mechanics of Free Particulate Abrasive Polishing from the
Viewpoint of Single-Point Processes," Proc. Of SPIE, 2775: 611-618. 7. Sutton, S.P., 2004, "Development of New Synthetic Optical Polishing Pitches," OSA
Conference on Optical Fabrication and Testing, Paper OTuA2, Rochester, NY, October 10th.
8. Tesar, A.A., Fuchs, B.A., 1991, "Removal Rates of Fused Silica with Cerium
Oxide/Pitch Polishing," Proc. of SPIE, 1531: 80-90. 9. Murray, P.G., 2004, "Nanocrystalline Cerium Oxide Improves Glass Polishing
Operations," Photonics Spectra, August Issue. 10. Nanophase Technologies Corporation, March 2005, Product Data Sheet, NanoTek®
Cerium Oxide, CE-6082. 11. Nanophase Technologies Corporation, March 2005, Product Data Sheet, NanoTek®
Cerium Oxide, CE-6086. 12. Murray, P.G., Personal Correspondence, 5 October 2006. 13. Izumitani, T.S., 1986, Optical Glass, English Translation from American Institute of
Physics, New York, NY: 1-3. 14. Radel, S.R., Navidi, M.H., 1994, "Chemistry," West, St. Paul, MN: 562.
92
15. Roberts, W. L., Campbell, T. J., and Rapp Jr., G. R., 1990, Encyclopedia of Minerals, 2nd Ed., Van Nostrand Reinhold, New York: 709-710.
16. Hammond, C., 2001, "The Basics of Crystallography and Diffraction," 2nd Ed.,
Oxford Univ. Press, New York, NY: 89-92. 17. Sawyer Technical Materials LLC, September 1999, Hydrothermal Growth of Quartz.
[online] http://www.sawyerresearch.com/Main_library.htm. 18. Shchipalov, Y.K., 2000, "Surface Engergy of Crystalline and Vitreous Silica," Glass
and Ceramics, 57(11-12): 374-377. 19. Saint-Gobain Quartz, April 2006, Saint-Gobain Quartz Optical Products and
Materials, Technical Publication APR 06-GR-A4-EN. [online] http://www.quartz.saint-gobain.com.
20. Saint-Gobain Quartz, March 2006, Spectrosil® Optical Fused Silica, Technical
Publication MAR 06-GR-A4-EN. [online] http://www.quartz.saint-gobain.com. 21. Sawyer Technical Materials, LLC, ‘Good’ Fundamental Material Constants for
Crystalline Quartz, Technical Publication. [online] http://www.sawyerresearch.com/Main_library.htm.
22. Saint-Gobain Quartz, June 2005, Fused Quartz & Fused Silica, Material Properties
Data Sheet, Technical Publication JUN 05-GR-A4-EN. [online] http://www.quartz.saint-gobain.com.
23. Levien, L., Prewitt, C. T., Weidner, D. J., 1980, “Structure and Elastic Properties of
Quartz at Pressure,” American Mineralogist, 65: 920-930. 24. Schott North America, Inc., Product Information on Zerodur®. [online]
http://www.us.schott.com/optics_devices/english/products/zerodur/index.html. 25. Evans, C.J., Paul, E., Dornfield, D., Lucca, D.A., Byrne, G., Tricard, M., Klocke, F.,
Dambon, O., Mullany, B.A., 2003, "Material Removal Mechanisms in Lapping and Polishing," Ann. of CIRP - Manuf. Tech., 52(2): 611-633.
26. Lord Rayleigh, 1917, "Polish," Trans. Opt. Soc., 19(1): 38-47. 27. Ref. [13]: 91-148. 28. Preston, F.W., 1926, "The Nature of the Polishing Operation," Trans. Opt. Soc.,
27(3): 181-190. 29. Preston, F.W., 1927, "The Theory and Design of Plate Glass Polishing Machines,"
Soc. Glass Tech., 11: 214-256.
93
30. Komanduri, R., Lucca, D.A., Tani, Y., 1997, "Technological Advances in Fine
Abrasive Processes," Ann. of CIRP, 46(2): 545-596. 31. Brown, N., Baker, P., Maney, R., 1981, "Optical Polishing of Metals," Proc. Of SPIE,
306: 42-57. 32. Brown, N.J., Fuchs, B.A., 1989, "Shear Mode Grinding," IEEE Symp. on Freq.
Control: 606-610. 33. Brown, N.J., Cook, L.M., 1984, Paper TuB-A4, Tech. Digest, Topical Meeting on the
Science of Polishing, OSA, 17 Apr. 1984. 34. Brown, N., 1986, "Preparation of Ultrasmooth Surfaces," Ann. Rev. Mater. Sci., 16:
371-88. 35. Cook L.M., 1990, “Chemical Processes in Glass Polishing,” J. of Non-Cryst. Solids,
120: 152-171. 36. Tomozawa, M., Yang, K., Li, H., and Murarka, P., 1994, "Basic Science in Silica
Glass Polishing," Proc. Of Mat. Res. Soc. Symposia, 337: 89-98. 37. Osseo-Asare, K., 2002, “Surface Chemical Processes in Chemical Mechanical
Polishing,” J. of Elec.-Chem. Society, 149(12): G651-G655. 38. Paul, E., Personal Correspondence, 4-5 October 2006. 39. Ref. [14]: 752. 40. Malvern Instruments Ltd., Zeta Potential, An Introduction in 30 Minutes, Technical
Note MRK654-01. [online] http://www.malvern.com. 41. Fuerstenau, D.W., Pradip, 2005, "Zeta Potentials in the Flotation of Oxide and
Silicate Minerals," Adv. Colloid Interface Sci, 114-115: 9-26. 42. Birdi, K.S., Ed., 1997, Handbook of Surface and Colloid Chemistry, CRC Press,
Boca Raton, FL: 567. 43. Larson, R.G., 1999, The Structure and Rheology of Complex Fluids, Oxford
University Press, NY: 326-329. 44. Hoshino, T., Kurata, Y., Terasaki, Y., Susa, K., 2001, “Mechanism of Polishing SiO2
Films by CeO2 Particles,” J. of Non-Cryst. Solids, 283: 129-136. 45. Abiade, J. T., and Choi, W., 2005, "Effect of pH on Ceria-Silica Interactions During
Chemical Mechanical Polishing," J. Mater. Res., 20(5): 1139-1145.
94
46. Suphantharida, P., and Osseo-Asare, K., 2004, "Cerium Oxide Slurries in CMP.
Electrophoretic Mobility and Adsorption Investigations of Ceria/Silicate Interaction," J. of Elec. Soc., 151 (10): G658-G662.
47. Cumbo, M.J.,Fairhurst, S.D., Jacobs, S.D., and Puchebner, B.E., 1995, “Slurry
Particle Size Evolution During the Polishing of Optical Glass,” App. Opt., 34(19): 3743-3755.
48. Tesar, A.A., Fuchs, B.A., Hed, P.P., 1992, “Examination of the Polished Surface
Character of Fused Silica,” App. Opt., 31(34): 7164-7172. 49. Nanophase Technologies Corporation, CE-6082 Technical Bulletin, CE-6082 Ceria
Dispersion for Glass Polishing Application. 50. Matweb Material Property Data, Properties of Lead. [online]
http://www.matweb.com/search/SpecificMaterial.asp?bassnum=AMEPb00. 51. Leistner, A.J., Thwaite, E.G., Lesha, F., Bennett, J.M., 1992, "Polishing Study Using
Teflon and Pitch Laps to Produce Flat and Supersmooth Surfaces," App. Opt., 31(10): 1472-1482.
52. Leistner, A.J., 1993, "Teflon Laps: Some New Developments and Results," App.
Opt., 32(19): 3416-3424. 53. National Institute of Standards and Technology, Roughness Parameters Technical
Document, Internet Based Surface Metrology Algorithm Testing System. [online] http://ats.nist.gov/VSC/jsp/.
54. Precision Devices, Inc., 1998, Surface Profile Parameters. [online]
http://www.predev.com/smg/pdf/SurfaceRoughness.pdf. 55. Iler, R., 1979, "The Chemistry of Silica," Wiley, New York, NY. 56. Paul, E., Personal Correspondence, 19 October 2006. 57. Mullany, B., Williams, W., 2006, “Real time measurement of Friction and Vibration
during Polishing”, Proceeding of the ASPE Annual Conference, Monterey, CA, October 16th - 19th.
58. Yu, T.K., Yu, C.C., Orlowski, M., 1993, "A Statistical Polishing Pad Model for
Chemical-Mechanical Polishing," Proc. of IEEE Int. Elect. Dev. Meeting: 865-868.