Embed Size (px)
Citation preview

Above ground durability of Swedish softwood

Acta Wexionensia No 66/2005
Wood Design and Technology
Above ground durabilityof Swedish softwood
Mikael Bergström Åsa Blom
Växjö University Press
Above ground durability of Swedish softwood. Thesis for the degree of Doctor of
Technology, Växjö University, Sweden 2005
Series editors: Tommy Book and Kerstin Brodén
ISSN: 1404-4307
ISBN: 91-7636-463-1
Printed by: Intellecta Docusys, Göteborg 2005
5
Abstract
Bergström, Mikael and Blom, Åsa (2005). Above ground durability of Swedish
softwood. Acta Wexionensia No. 66/2005. ISSN: 1404-4307. ISBN: 91-7636-
463-1. Written in English.
This thesis describes aspects of durability of Swedish softwood in above ground
applications. The thesis consists of a summary of nine papers, which all aim to
explain the existing variation in above ground microbial durability and moisture
sensitivity of Norway spruce (Picea abies) and Scots pine (Pinus sylvestris). The
methods used were two field tests, one accelerated durability test, and three wa-
ter permeability tests.
The main conclusions made in the study were that Norway spruce sapwood is
more susceptible to discolouring fungi than heartwood. With respect to Scots
pine, the only important factor for its natural durability above ground was
whether the samples consisted of heartwood or of sapwood. There was also no
systematic variation between pine heartwood from different stand origins in
above ground conditions. Origin had no influence on durability in practice for
neither spruce nor pine. Furthermore, in contradiction with traditional thinking,
annual ring width and density had no influence on durability in any of the tests.
The material came from two different samplings. The ‘old’ material was sam-
pled in the beginning of the 1980s and consisted of Scots pine and Norway
spruce from three different origins: the north, the central area, and the south of
Sweden. The material was subjected to different handling conditions and surface
and end-grain treatments. The ‘old’ material was used in a large above ground
field test, carried out between 1985 and 1994. Unfortunately, the spruce sapwood
and heartwood was not separated in this field test.
In the field trial with the ‘old’ material, the most important factor for the du-
rability of Norway spruce was the samples’ surface- and end-grain treatment. It
was also observed that untreated spruce absorbed less moisture than samples
that were painted but without proper end-grain treatment. Samples originating
from one of the stands were more sensitive towards air-drying than samples from
the other two, which was reflected in a higher average moisture content and mass
loss for the untreated samples. With respect to Scots pine, the most important
factor was whether the sample consisted of heartwood or of sapwood. The
heartwood samples were durable irrespective of their previous treatment. The
Scots pine sapwood samples, on the other hand, had a very fluctuating moisture
content if they were not surface- and end-painted. This was also reflected in
6
higher mass losses in these samples. Even when properly surface- and end grain
treated, the sapwood samples did not perform as well as the heartwood samples.
The ‘new’ material consisted of Scots pine taken from six different stands,
and Norway spruce from five different stands, all from areas in southern Swe-
den. The sampling was performed in order to achieve a large variation in wood
properties. Thus, logs from areas with different climate and growth conditions
were collected. This material was used for laboratory tests, and also for the sec-
ond field test, which was evaluated after a test period of two years.
In the second field test untreated Scots pine and Norway spruce samples from
the ‘new’ material were investigated. Effects of origin and different tree diame-
ters were examined. Furthermore, Scots pine was separated to heartwood and
sapwood, and Norway spruce to mature and juvenile wood. The Norway spruce
samples were sawn with vertical or horizontal annual rings. For the Norway
spruce in the second field test, vertical annual rings were shown to be very bene-
ficial for avoiding crack formation, while samples with horizontal annual rings
displayed a large number of cracks. Despite this, the larger number of cracks did
not result in a higher moisture content or more fungal discoloration. Juvenile
wood had a slightly higher average discolouring fungal growth grading than the
other spruce samples. For Scots pine, the only factor of importance was whether
the samples consisted of heartwood or of sapwood. Annual ring width, density
and origin had no significant effect on either fungal growth or moisture uptake.
This observation held for both Norway spruce samples and Scots pine samples.
An accelerated test was run in order to investigate Norway spruce sapwood
and heartwood with respect to their differences in durability towards discolour-
ing fungi and moisture uptake. The Mycologg method was used to accelerate
fungal growth during a number of forced moisture cycles. The results showed
that sapwood was much more sensitive to discolouring fungi than heartwood.
Sapwood also recorded a higher average moisture content than heartwood. The
differences that were observed between the types of samples were not due to an-
nual ring width, density or origin.
It was observed that Norway spruce sapwood samples and heartwood sam-
ples showed differences in liquid water permeability. This observation was made
especially evident in a droplet absorption test. Water droplets were absorbed
much faster on the sapwood samples in comparison with the heartwood samples.
This higher affinity to water suggested that a sapwood surface would reach a
higher moisture content than a heartwood surface. This observation provides a
major explanation of why the sapwood samples showed poorer durability to-
wards discolouring fungi in the Mycologg trials.
Keywords: above ground, durability, field test, mass loss, Mycologg, Norway
spruce, permeability, Picea abies, Pinus sylvestris, Scots pine.
7
Preface
The work presented in this doctoral thesis was carried out at Växjö University,
the Department of Forest and Wood Technology. The project was financed by
Södra, and connected to the Wood Design and Technology (WDAT) pro-
gramme. Mikael Bergström worked as a doctoral candidate at Södra Timber. Åsa
Blom was employed as a PhD Student by Växjö University, and was financed by
the Södra Research Foundation.
We would like to thank our supervisor, Prof. Thomas Thörnqvist as well as peo-
ple in the reference group, which were connected with this project: Marie-Louise
Edlund (SP-Trätek), Hans Lundström (SLU), Lars-Olof Nilsson (Chalmers), Ulf
Jansson (Chalmers), Jöran Jermer (SP-Trätek), Carl-Johan Johansson (SP-
Trätek) and Mats Westin (SP-Trätek). Moreover, we would like to express our
appreciation to Ove Söderström (KTH), Kai Ödeen (KTH), Michael Sjöström
(Umeå University) and Mats Nylinder (SLU) for their rewarding comments on
our work. We also want to thank the people at Södra Timber that showed a great
interest in our work.
There are many people who we wish to mention: the staff at the Swedish Univer-
sity of Agriculture in Asa, where our field test is located, the people at Myco-
team in Norway, and Kjell Hildingsson in Gårdsby. Thanks also to Rolf Böhn
and the truck-drivers at Hörle Bruk. We like to thank Robert Ryan for the proof
reading, and Kerstin Brodén for the editing the thesis. And not to be forgotten:
people at our department at Växjö University.
Mikael thanks Åsa for her good companionship and good ideas. Thanks also to
my family, children, and especially my Tina. You are the one.
Åsa would specially like to thank Micke for all the times when we have laughed,
and also for being a nice friend. I also wish to thank my family, who hopefully
finally understand what I have been doing during the last four years. And to my
Jonas, who recently became my husband, thank you for taking care of me.
Växjö, April 2005
Mikael Bergström and Åsa Blom

8
9
List of papers
This thesis is based on the results that are reported in nine different papers. The
papers are attached at the end of this thesis. Åsa Blom changed her surname dur-
ing the course of this work, so some of the papers show her to be a co-author un-
der her old surname, ‘Rydell’. All of the papers are referred to by a number, e.g.
Paper I or (I). They are not presented in order of their relevance to the research,
neither do they appear in chronological order. Instead, they are ordered with the
intention to make the whole of the research more assessable to the reader.
I Elowson T, Bergström M and Hämäläinen M (2003) Moisture dynamics in
Norway spruce and Scots pine during nine years of outdoor exposure above
ground in relation to different surface treatments and handling conditions.
Holzforschung 57, 219-227.
II Bergström M, Rydell Å and Elowson T (2004) Durability of Untreated
Norway Spruce (Picea abies) Exposed Outdoors Above Ground for Nine
Years. Holzforschung 58, 167-172.
III Rydell Å, Bergström M and Elowson T (2005) Moisture Dynamics in
Coated Norway Spruce (Picea abies) During Outdoor Exposure Above
Ground in Relation to Different Origins and Handling Conditions. Proceed-
ings of the Woodframe Housing Durability and Disaster Issues Conference,
organized by the Forest Products Society, Las Vegas, Nevada, USA, Octo-
ber 4-6 2004.
IV Rydell Å, Bergström M and Elowson T (2005) Mass loss and moisture dy-
namics of Scots pine (Pinus sylvestris) exposed outdoors above ground in
Sweden. Holzforschung 59, 183-189.
V Blom Å and Bergström M (2005) Mycologg – a new accelerated test
method for wood durability above ground. Accepted for publication in
Wood Science and Technology.
VI Bergström M, Rydell Å and Thörnqvist T (2005) Durability and Moisture
Dynamics of Norway spruce (Picea abies) heartwood and sapwood. Pro-
ceedings of the Woodframe Housing Durability and Disaster Issues Confer-
ence, organized by the Forest Products Society, Las Vegas, Nevada, USA,
October 4-6 2004.

10
VII Bergström M and Blom Å (2005) Differences in properties between Nor-
way spruce (Picea abies) heartwood and sapwood. Part 1. Accelerated du-
rability testing. Submitted.
VIII Bergström M and Blom Å (2005) Differences in properties between Nor-
way spruce (Picea abies) heartwood and sapwood. Part 2. Vapour and liq-
uid permeability. Submitted.
IX Blom Å and Bergström M (2005). Untreated Scots pine (Pinus sylvestris)
and Norway spruce (Picea abies) wood-panels exposed out of ground con-
tact in Sweden for two years. Accepted for publication in Holz als Roh- und
Werkstoff.
11
Contribution to the papers included in this thesis
The work presented in this thesis constitutes the doctoral project of two authors.
All of the work was done in a collaborative effort between Åsa Blom and Mikael
Bergström, except for Paper I in which Blom was not involved. The author’s ex-
pertise, however, lies in different areas. Blom has a master’s degree in Biology
and was responsible for fungal cultivation, microscopy and fungal growth
evaluation. Bergström has a degree in chemical engineering. Furthermore, he is
experienced in multivariate statistics and the design of experiments.
I Bergström did the multivariate analysis and wrote the paper together with
Elowson and Hämäläinen.
II Bergström did the multivariate analysis and Rydell did the traditional statis-
tics. They wrote the article together. Elowson provided the material.
III Rydell and Bergström did the analysis, while Rydell wrote most of the pa-
per. Rydell presented this paper at a conference. Elowson provided the ma-
terial.
IV Rydell and Bergström performed the analysis and wrote the paper together.
Elowson provided the material.
V Blom and Bergström planned the experiment together. Blom did most of
the writing.
VI Bergström and Rydell planned and conducted the experiment together.
Bergström wrote most of the paper and presented the paper at a conference.
VII Bergström and Blom planned, conducted and evaluated the experiment to-
gether. Bergström wrote most of the paper.
VIII Bergström and Blom planned and performed the experiment together.
Bergström wrote most of the paper.
IX Blom and Bergström planned, performed and evaluated the experiment to-
gether. Blom wrote most of the paper.

12
13
Table of contents
Abstract ................................................................................................................. 5
Preface .................................................................................................................. 7
List of papers......................................................................................................... 9
Contribution to the papers included in this thesis ............................................... 11
Table of contents................................................................................................. 13
1. Introduction ............................................................................................ 15
1.1 Background ................................................................................. 15
1.2 Thesis disposition........................................................................ 16
1.3 Definitions................................................................................... 16
2. Literature survey..................................................................................... 19
2.1 Wood attacking microorganisms................................................. 19
2.1.1 Bacteria ....................................................................................... 19
2.1.2 Discolouring fungi ...................................................................... 20
2.1.3 Rot............................................................................................... 21
2.2 Water in wood ............................................................................. 22
2.3 Softwood properties .................................................................... 23
2.3.1 Structure of the softwood cell ..................................................... 23
2.3.2 Heartwood and sapwood ............................................................. 24
2.3.3 Chemical composition................................................................. 25
2.3.4 Other factors affecting durability ................................................ 26
2.4 Field test methods ....................................................................... 29
2.4.1 Lap-joint...................................................................................... 30
2.4.2 L-joint.......................................................................................... 31
2.4.3 The Johansson method ................................................................ 32
2.4.4 The Öqvist method...................................................................... 32
2.4.5 Double layer ................................................................................ 33
2.4.6 Pile bed........................................................................................ 34
2.5 Accelerated testing ...................................................................... 34
3. Hypotheses and Limitations ................................................................... 37
3.1 Hypotheses .................................................................................. 37
3.2 Outline and Limitations of the research ...................................... 37
3.3 Aims and Objectives ................................................................... 39
4. Material and Methods ............................................................................. 41
4.1 Old material................................................................................. 41
4.2 New material ............................................................................... 41
4.3 The Öqvist method...................................................................... 43
4.4 The Johansson method ................................................................ 44
14
4.5 The Mycologg method ................................................................ 46
4.6 Vapour and liquid permeability................................................... 48
4.6.1 Water vapour transmission resistance ......................................... 48
4.6.2 Permeability tests ........................................................................ 49
4.7 Multivariate analysis ................................................................... 50
4.7.1 Principal component analysis (PCA) .......................................... 50
4.7.2 Projections to Latent Structures (PLS) ........................................ 53
5. Results .................................................................................................... 55
5.1 Paper I ......................................................................................... 55
5.2 Paper II ........................................................................................ 59
5.3 Paper III....................................................................................... 63
5.4 Paper IV ...................................................................................... 65
5.5 Paper V........................................................................................ 70
5.6 Paper VI-VII................................................................................ 71
5.7 Paper VIII.................................................................................... 73
5.8 Paper IX ...................................................................................... 75
6. Discussion............................................................................................... 79
6.1 Heartwood and sapwood ............................................................. 79
6.2 Annual ring width and Density ................................................... 82
6.3 Origin and Growth conditions..................................................... 83
6.4 Handling conditions .................................................................... 84
7. Conclusions and Implications................................................................. 87
7.1 Conclusions ................................................................................. 87
7.2 Thesis contribution...................................................................... 88
7.3 Implications for practice.............................................................. 88
7.4 Implications for future research .................................................. 89
References........................................................................................................... 91
Appendix A......................................................................................................... 99
Appendix B ....................................................................................................... 101
Appendix C ....................................................................................................... 103
Appendix D....................................................................................................... 105
Papers I-IX
15
1. Introduction
1.1 Background
Norway spruce (Picea abies), and Scots pine (Pinus sylvestris) are the main
wood species used in Sweden for wood constructions. Wood is a traditional
building material and has been used for hundreds of years. It is also an organic
and environmentally friendly material. However, if it is not properly selected,
protected and handled, it will, with the passing of time, become discoloured and
be degraded by microorganisms and weather. Since wood, compared to other
building materials, has these drawbacks with respect to durability, market shares
have been lost over the years. This has occurred, for example, in the window
frame industry. In order to increase the use of wood in construction applications,
focus has to be placed on prolonging and ensuring durability. Traditionally, du-
rable wood was carefully selected directly in the forest (Sjömar 1988), but be-
cause of the industrialization of forestry, wood has become a bulk commodity.
At the sawmills, new standardized sorting rules are now applied. Furthermore,
since all types of wood are treated as homogenous, effort is put into finding pre-
servatives and paints that increased wood durability. Many of these treatments
are nowadays regarded as hazardous to the environment and restricted by the EU
authorities. Consequently, environmentally friendly and natural durable wood
products have become more sought-after.
Since wood displays a wide variation of properties with respect to durability,
even within the same species, one problem has been to come to some under-
standing of why these differences exist. Since a number of different factors are
believed to have an influence on moisture dynamics and durability, variations in
durability have been difficult to survey. In addition to these problems, since the
handling and sorting of wood has gone through several changes during the 20th
century, the question of how these changes might influence durability also arose.
The purpose of this study is to obtain further knowledge about variations in
the durability of Swedish softwood, pine and spruce in order to be able to select
wood of a better durability.
The research focused on durability only in above ground use, since pine and
spruce is known to have a low durability in ground contact and should be
avoided in such applications without chemical treatment or other wood modifica-
tion methods. Note that only pine and spruce wood samples were investigated,
since these species dominate the Swedish wood market. The main focus of the
16
study was on untreated wood, but the effect of surface and end-grain treatment
was also investigated as part of a larger study.
The relevance of this research increase as the need for environmentally
friendly durable wood increases. If the variations in durability can be mapped
out, less durable wood can be avoided.
1.2 Thesis disposition
This thesis is based on the work presented in nine scientific papers, included as
appendixes. Although all of the methods that were employed in the study, and
the most important results are presented here, further detailed information can be
obtained by reading the actual papers.
With respect to the outline of the thesis, Chapter One starts with the back-
ground, which presents the field of study. Next, the thesis disposition and defini-
tions are described.
Chapter Two contains a survey of the literature. This was done in order to es-
tablish a frame of reference for the research. The survey represents the ‘state of
the art’, and was written at the beginning of the research project (Rydell and
Bergström 2002). Whilst the thesis was being written, the survey was enlarged as
additional articles were reviewed. In this chapter, the most important and rele-
vant subjects on wood durability are presented. It should be mentioned that some
of the sub-sections in this chapter contain a presentation and description of the
area or factors that have been reviewed, in order to make these points clearer to
the reader.
In Chapter Three, the hypotheses and limitations of the research project is
discussed and presented, based on the survey of the literature.
Chapter Four describes the material and the methods that were used in the in-
vestigations.
Chapter Five presents the results of the nine Papers and also includes a num-
ber of new multivariate models.
In Chapter Six, a discussion is made based on the variables that are investi-
gated in the papers.
Chapter Seven consists of a presentation of the conclusions and the implica-
tions of the study.
In the appendixes, some Tables are presented, as well as the nine Papers.
1.3 Definitions
Because researchers often adopt different definitions for their technical terms, it
is necessary to provide a number of explanations of some of the important terms
that are employed in this study.
Durability
The term ‘durability’ is used in this thesis with reference to a wood’s resistance
to rot and discolouring fungi above ground.
Equilibrium moisture content (EMC)
The moisture content that wood reaches in a specific controlled environment is
called its ‘equilibrium moisture content’. For example, the equilibrium moisture
content for spruce and pine stored at 20ºC with 65 % relative humidity (RH) is
about 12%.
Fibre saturation point (FSP)
The fibre saturation point is the actual moisture content when a maximum
amount of water is bound in the cell walls, whereas no free water is present. In
spruce and pine, the FSP is about 25-30%. The cell walls are then fully saturated.
Fungal discolouration
‘Fungal discoloration’ is a change in the wood colour, often present at the sur-
face, caused by a fungal attack of moulds and sapstain (also called bluestain).
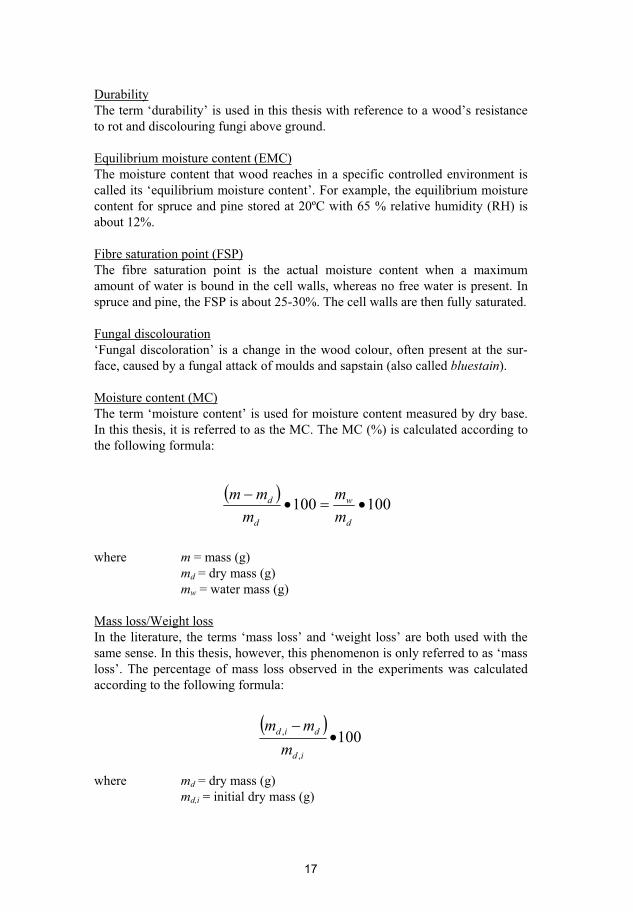
Moisture content (MC)
The term ‘moisture content’ is used for moisture content measured by dry base.
In this thesis, it is referred to as the MC. The MC (%) is calculated according to
the following formula:
100100d
w
d
d
m
m
m
mm
where m = mass (g)
md = dry mass (g)
mw = water mass (g)
Mass loss/Weight loss
In the literature, the terms ‘mass loss’ and ‘weight loss’ are both used with the
same sense. In this thesis, however, this phenomenon is only referred to as ‘mass
loss’. The percentage of mass loss observed in the experiments was calculated
according to the following formula:
100,
,
id
did
m
mm
where md = dry mass (g)
md,i = initial dry mass (g)
17
18
Scots pine/Norway spruce
The tree species that were investigated in this thesis are Scots pine (Pinus sylves-
tris), and Norway spruce (Picea abies). These wood types will be referred to as
‘pine’ and ‘spruce’.
Stand site index
The ‘stand site index’ is a measure of the productivity of a stand. It is calculated
as the actual dominant height a stand will reach at 100 years of age. For example,
a site index of 30 means that the dominant height will be 30 m at he time when
the stand is 100 years old. (The dominant height is defined as the arithmetic av-
erage height of the 100 largest trees per hectare.)
Vertical/Horizontal annual rings
The annual ring orientation is determined from the cross-section of the timber.
When the annual rings are practically perpendicular to the flat side, the timber is
considered to have vertical annual rings. The timber is then sawn radially from
the log. In contrast to vertical annual rings, wood cut in the tangential direction
have horizontal annual rings.
19
2. Literature survey
In the initial phase of this project, a literature survey was done in order to estab-
lish the ‘state of the art’ in the area of research (Rydell and Bergström 2002).
The main findings are reproduced in this chapter. Note that additional references
to literature have been added to this chapter. Based on the current ‘state of the
art’, different research methods were evaluated and a large amount of wood ma-
terial sampled.
2.1 Wood attacking microorganisms
Microorganisms have always caused problems when wooden materials have
been used, because wood is an organic material and will degrade if it is not pro-
tected. Fungi and bacteria attack both living and dead trees in several different
ways. How they come about depends on the prevailing conditions. Organisms
have different demands in terms of the conditions that sustain life. These differ-
ent conditions are specific to the different species of organism, and the substrate
they feed on. For example, organisms have their own optimal temperature for
growth, and also different temperature tolerances (Morton and Eggins 1976).
However, all living organisms need water and nutrition. At very high MC values,
degrading fungi are not able to grow, while bacteria are.
2.1.1 Bacteria There are many different types of bacteria that feed on wood. Most of them are
Actinomycetes. Bacterial attacks are slower in comparison to attacks from most
fungi. This is often due to the fact that bacteria needs free water in the wood cell
to propagate (Fengel and Wegener 1984). Bacterial degradation of the cell wall
occurs by the action of tunnelling and erosion bacteria that live in the soil that is
in contact with the wood. However, in very wet wood out of ground contact, for
example while logs are stored in water, bacteria only degrade the pit structures
(Clausen 1996). In such attacks, bacteria invades the wood through the ray pa-
renchyma cells and form colonies in the sapwood where they feed on proteins,
e.g. from the pore membranes (Fengel and Wegener 1984). When the pore mem-
branes are degraded, the permeability and the moisture uptake of the wood in-
creases (Eaton and Hale 1993). Because of this, bacterial attack can be a problem
when surface treating sawn wood, since the damaged parts absorb more of the
finishing and this results in an uneven and stained surface (Daniel et al. 1993).
20
Bacterial attack can create conditions favourable to an invasion from fungi,
since the higher permeability can increase the moisture content in the wood.
However, it has also been shown under laboratory conditions, that mould and
sapstain fungi that grow on wood can be inhibited by bacterial isolates (Payne et
al. 2000, Feio et al. 2004).
2.1.2 Discolouring fungi The term ‘discolouring fungi’ is used for moulds and sapstain fungi that feed on
wood and discolour it, without affecting the wood’s strength. Discolouring fungi
do not degrade lignin, cellulose or hemicelluloses to any large extent, but they do
feed on proteins and sugars. An attack from these fungi can cause an increase in
permeability (Fengel and Wegener 1984).
MouldsMoulds belong to a large group of microfungi that attack dead organic materials
(Carlile and Watkinson 1994). Moulds are always present in our surroundings as
airborne spores. They do not have any of their own enzymes for degrading wood,
and only live on the surface of the wood (Fengel and Wegener 1984). Moulds are
more dependent on the humidity in the air and on the surface than on the mois-
ture content in the substrate. The lowest RH that can support mould growth on
pine and spruce has been shown to be 80% (Viitanen and Ritschkoff 1991a). The
more hygroscopic a material is, the lower the relative humidity required for sup-
porting mould growth (Block 1953). Since moulds are a large group of fungi,
they demonstrate a large range of temperature tolerances. The mould fungi gen-
erally grow in temperatures around 0-50˚C, while some species even propagate
at temperatures down to -6˚C (Gravesen et al. 1994). Mould that is present on a
wooden surface can have both an antagonistic or stimulating effect on other
fungi (Fengel and Wegener 1984). Furthermore, since they have an ability to
bind water, they cause a higher moisture content near the surface, and conse-
quently they can make the wood more susceptible to other fungi. Therefore, a
mould attack can be seen as an indication of impending rot attacks.
SapstainsThe term ‘sapstain’ is not biological, but it is used as a cover term for different
microfungi that attack and discolour wood in similar ways. Sapstain fungi are of-
ten dispersed by insects. They also need free water in the wood, e.g. an MC
above 25-30%, to survive. They grow at temperatures between 0-50˚C and have
different optimal temperatures, depending on species. Some species even grow at
temperatures a few degrees below zero (Käärik 1980). Their hyphae contain a
pigment (melanin) of a blue, green or black colour, which causes a discoloration
in the wood (Fengel and Wegener 1984, Brisson et al. 1996). The pigment is not
produced at lower temperatures. Consequently, a seemingly unaffected wooden
surface can be extensively discoloured as the temperature increases. In contrast
to moulds, the sapstain hyphae grow into the wood through the rays, bordered
21
pits and cell lumen (Fengel and Wegener 1984). Although it grows in the cells, it
cannot feed on cellulose and therefore it does not affect the strength properties of
the wood (Blanchette et al. 1992). However, it can increase the permeability
properties of the wood.
2.1.3 Rot ‘Rot fungi’ is the term used to refer to wood degrading fungi. They attack and
degrade wood at temperatures between –3 and +40˚C, with an optimum growth
temperature range of 25-30˚C (Kollman and Côté 1984). The most important
feature of rot fungi is that they need free water in the wood to be able to grow.
However, in practice, the moisture content of the wood must exceed the fibre
saturation point, which occurs at 25-30 % MC (Siau 1995). It can be difficult to
determine the moisture requirements for different fungi growing in wood under
laboratory conditions, since water is produced during the deterioration of the
wood (Kollman and Côté 1984). There are three different types of rot fungi.
They are divided into groups according to the substances that they feed on, and
how they grow and propagate (Deacon 1997).
Brown rotBrown rot is caused by Basidomycota, a group of fungi with characteristic fruit
bodies and a sexual reproduction system (Deacon 1997). These fungi are the
most common rot type on wood in above ground applications (Norén 2001). The
optimal MC in wood for brown rot growth is 30-70% (Viitanen and Ritschkoff
1991b). It mainly degrades cellulose and hemicelluloses in the cell wall, leaving
the wood to turn brown, caused by the presence of oxidised lignin (Green and
Highley 1997). A typical cuboidal cracking is also observed in wood with brown
rot. The fungi’s hyphae grow in the cell lumen, in the same way as is observed in
soft rot. However, in contrast to soft rot, brown rot degrades almost the whole of
the S2-layer of the cell wall (see 2.3.1) (Deacon 1997). There is no localization
of decay around the hyphae of the brown rot fungus. Instead the fungus decays
the cell walls by means of a generalized thinning (Carlile and Watkinson 1994).
White rot The white rot fungi include both Ascomycota and Basidomycota (Deacon 1997).
Ascomycota is distinguished by a sexual reproduction in so-called ascus. In con-
trast to brown rot, white rot not only degrades cellulose and hemicelluloses, but
also lignin. It has also been shown that white rot fungi are effective in degrading
various classes of hydrophobic extractives found in Scots pine (Dorado et al.
2001). White rot do not only degrade the S2-layer (as does soft rot), but also
erodes the S1, S2 and S3-layer sequentially. In the early stages of an attack, each
hypha can be seen to be surrounded by an erosion zone or a bore hole (Carlile
and Watkinson 1994). Wood attacked by white rot looks bleached and fibrous
(Fengel and Wegener 1984).
22
Soft rot Soft rot includes several Ascomycota and Deuteromycota and is a third type of
degrading fungi. Deuteromycota, in contrast with Ascomycota, propagate
through asexual spores; conidia. It decays very wet wood and mainly occurs in
ground contact, since it needs nitrogen. The nitrogen is taken up from the sur-
rounding soil (Deacon 1997). It shows a preference to degrade cellulose, and it
causes characteristic cavities in the S2-layer of the cell wall. In the initial coloni-
zation, it grows in the cell lumen, and from this position a lateral branch pene-
trates the thin lignified S3-layer. As the hypha enters the S2-layer, it branches
into two hyphae and grows up and down the cell wall in the direction of the mi-
crofibrils (Carlile and Watkinson 1994). The degradation occurs slowly in soft-
wood when compared to white- or brown rot. The wood that has been subject to
a soft rot attack looks similar to wood that has been attacked by brown rot, but
has a somewhat softer surface (Eriksson et al. 1990).
2.2 Water in wood
Since discolouring and degrading fungi need water to grow, knowledge about the
water that can be found in wood is very important. Water in wood is present in
thee types: free liquid water, bound water within the cell wall, and water vapour
(Dinwoodie 2000). The water molecules bind to the hydroxyl groups in the cellu-
lose and hemicelluloses, since this is more advantageous in terms of energy, than
existing as free water. Because of this, the cell wall is saturated before free water
becomes present in wood. The fibre saturation point value is an MC of approxi-
mately 30% for softwood (Siau 1995).
The transport of moisture in wood is divided into hygroscopic and capillary
transport. Hygroscopic transport (which occurs at an MC of below 30%) takes
place by intergas, or bound water diffusion. The intergas diffusion occurs
through the air in the cell lumen, whereas bound water diffusion takes place in
the cell walls (Siau 1984).
Above the FSP, liquids move in softwood through capillary transport via the
pits in the cell walls. There are three types of pits: the boarded pits in the radial
walls of the tracheids; the semi-boarded pits that connect the vertical tracheids
with the horizontal ray parenchyma cells; and simple pits between parenchyma
cells. The boarded pits are the most important for both longitudinal and tangen-
tial flow. Permeability is dependent on the direction of the wood, where the lon-
gitude permeability is about 104 times the transverse. Other factors that influ-
ences permeability are, for example, the wood species, whether the sample is
composed of heartwood or sapwood (see 2.3.2), or earlywood or latewood, and
the moisture content in the wood sample (Dinwoodie 2000). Affinity to water,
‘wettability’, is an important factor for the durability of wood since it affects the
initial face of the fungal attack. It is also known that the wettability of a wood
surface decreases with time, from the time when a new surface is cut (Nussbaum
1999, Grindl et al. 2004).
23
Since wood is a hygroscopic material, the moisture content is dependent on
the relative humidity in the surrounding environment. In dry air, the equilibrium
moisture content (EMC) is zero and at 98% relative humidity, the EMC is about
25-30%. The moisture content is also dependent on other factors such as species,
density, porosity and amount of extractives found in the wood (Siau 1995).
2.3 Softwood properties
2.3.1 Structure of the softwood cell Softwood consists of three different cell types: tracheids, epitel cells, and paren-
chyma cells. The parenchyma cells are located near rays and responsible for the
storage of nutrients. The epitel cells produce resins and are important as the
heartwood forms. They also have a storage and transport function (Dinwoodie
2000). Over 90% of the cells are tracheids; the dead cells that support the struc-
ture. Tracheids in the heartwood have aspirated pits (2.3.2). In the sapwood,
where the pits are open, tracheids are responsible for transport of water and nu-
trients (Fengel and Wegener 1984).
The cell wall is constructed of several layers. In Figure 1, the cell wall is
shown: the innermost layer is called the wart layer (W) followed by the inner
layer (S3), the middle layer (S2), the outer later (S1), and the primary layer (P).
Each layer is characterized by different orientations of the microfibrils, which in
turn consist of long fibrous chains of cellulose. In the primary layer, the amount
of cellulose is rather limited and the fibrils are arranged in a crossing pattern.
The S1-layer consists of cross-running helixes of microfibrils. In the next layer,
S2, the microfibrils are placed in a steep angle (Fengel and Wegener 1984,
Kollman and Côté 1984). The microfibrillar angle can be related to the anisot-
ropic behaviour and shrinkage of wood. The S2-layer is the thickest, and consti-
tutes 90% of the total cell wall mass. It has a lower concentration of lignin than
the S1- and S3-layers (Dinwoodie 2000). In the S3-layer, the microfibrils are ar-
ranged in a gentle slope, and not in a parallel order as in the S2-layer. The warts
in the wart layer consist largely of lignin-like materials (Fengel and Wegener
1984, Dinwoodie 2000).
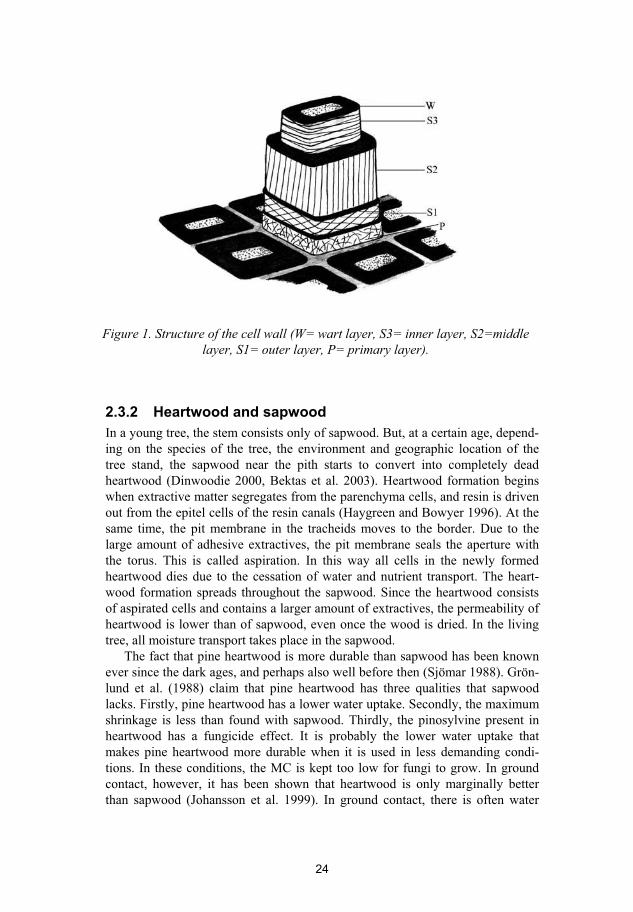
Figure 1. Structure of the cell wall (W= wart layer, S3= inner layer, S2=middle
layer, S1= outer layer, P= primary layer).
2.3.2 Heartwood and sapwoodIn a young tree, the stem consists only of sapwood. But, at a certain age, depend-
ing on the species of the tree, the environment and geographic location of the
tree stand, the sapwood near the pith starts to convert into completely dead
heartwood (Dinwoodie 2000, Bektas et al. 2003). Heartwood formation begins
when extractive matter segregates from the parenchyma cells, and resin is driven
out from the epitel cells of the resin canals (Haygreen and Bowyer 1996). At the
same time, the pit membrane in the tracheids moves to the border. Due to the
large amount of adhesive extractives, the pit membrane seals the aperture with
the torus. This is called aspiration. In this way all cells in the newly formed
heartwood dies due to the cessation of water and nutrient transport. The heart-
wood formation spreads throughout the sapwood. Since the heartwood consists
of aspirated cells and contains a larger amount of extractives, the permeability of
heartwood is lower than of sapwood, even once the wood is dried. In the living
tree, all moisture transport takes place in the sapwood.
The fact that pine heartwood is more durable than sapwood has been known
ever since the dark ages, and perhaps also well before then (Sjömar 1988). Grön-
lund et al. (1988) claim that pine heartwood has three qualities that sapwood
lacks. Firstly, pine heartwood has a lower water uptake. Secondly, the maximum
shrinkage is less than found with sapwood. Thirdly, the pinosylvine present in
heartwood has a fungicide effect. It is probably the lower water uptake that
makes pine heartwood more durable when it is used in less demanding condi-
tions. In these conditions, the MC is kept too low for fungi to grow. In ground
contact, however, it has been shown that heartwood is only marginally better
than sapwood (Johansson et al. 1999). In ground contact, there is often water
24
25
present, and the fungicidal effect of pinosylvine is not enough to prevent rot
(Celimene et al. 1999).
With respect to wettability, it has been shown for pine (Pinus sylvestris) and
larch (Larix decidua) that sapwood has a higher wettability than heartwood
(Hameed and Roffael 1999).
In spruce, the sapwood border is invisible once the wood is dried. As a con-
sequence of this, spruce has been regarded as to have no distinct differentiation
between heartwood and sapwood (CEN 1994), although it is known to display
large variations in durability. Studies on spruce heartwood have thus been very
limited. Himke et al (1998) investigated durability against rot fungi according to
the European standard EN 113 (CEN 1996a), but found no differences between
spruce heartwood and spruce sapwood. It should be mentioned, however, that the
EN 113 is a very demanding method which, in practice, only measures the
amount of the anti-fungal compounds in the wood. Only recently, new studies
have shown differences in properties between Norway spruce heartwood and
spruce sapwood. An outdoor exposure above ground for 1.5 years showed that
sapwood samples were more subject to fungal discoloration than heartwood
samples (Sandberg 2004).
Sandberg and Lindgren (2003) found that Norway spruce sapwood had a
faster and a larger liquid water uptake in the longitude direction. They used
computer tomography method to investigate water uptake in cross sections. In
another investigation, Sandberg (2002) found differences in water uptake in the
longitude direction of Norway spruce sapwood samples obtained from dominant
and suppressed trees respectively. The sapwood from the suppressed tree took up
water higher in the stem than the sapwood from the dominant tree. For heart-
wood, on the other hand, the opposite pattern of water transportation was ob-
served.
2.3.3 Chemical composition The chemical composition of the wood is important for its resistance to moisture,
and also for its susceptibility to mould and rot fungi. Differences in chemical
composition have been shown across species, within the same tree, and between
different stands of the same species. These differences have been attributed to
differences in climate, ground conditions, water and nutrition supply (Yngvesson
et al. 1993, Shupe et al. 1996, Almberg 1999, Akhter and Hale 2002b).
Softwood is mainly composed of cellulose, hemicelluloses and lignin. Apart
from these compounds, 2-15% are extractives. Cellulose is the main building
material of the cell, and is composed of glucose molecules. Together with hemi-
celluloses, consisting of polysaccharides, it forms strong molecular chains. The
lignin, consisting of phenylproprane units, binds the chains together, acting as a
glue (Sjöström 1981). The extractives are divided into hydrophobic and hydro-
philic groups. The hydrophobic extractives are mainly fatty acids in the form of
resins, while the hydrophilic extractives are minerals, proteins, and hydrocar-
bons.
26
The largest differences in chemical composition within the same tree are usu-
ally found between heartwood and sapwood. For example, there are more poly-
saccharide isolates in the heartwood of both pine and spruce (Willför and Holm-
bom 2004). Pinosylvine is the most well-known antifungal substance in pine, and
it has been shown to have a large between-tree variation (Bergström et al. 1999),
which, to some extent, can be explained in terms of genetic variation and differ-
ent stand conditions (Fries et al. 2000, Ericsson et al. 2001). In pine and larch
wood, it has been shown that the outer heartwood has more extractives and is
more durable than the inner heartwood (Rennerfeldt 1947, Windeisen et al.
2002). Pine has considerably more extractives in the heartwood than the heart-
wood of spruce. The extractives are the principal source of decay resistance. This
was demonstrated as early as 1924 (Hawley et al. 1924). Furthermore, extrac-
tives from pine have also been shown to have an antibacterial effect (Lindberg et
al. 2004). The level of durability of pine heartwood can be determined by the
concentration of phenolics, pinosylvine and its derivates, as well as the weight of
acetone-soluble extractives (Harju et al. 2003, Gierlinger et al. 2004b,
Venäläinen et al. 2004). Traditionally, dark heartwood has been thought to be an
indication of durability. In larch wood, for example, it has been shown that the
colour of the heartwood is strongly correlated with phenolics, and could there-
fore be an indication of durability (Gierlinger et al. 2004a).
With respect to spruce, chemical investigations of heartwood and sapwood
are rare. There are less hydrophobic extractives in spruce heartwood than there
are in spruce sapwood (Ekman 1979). Regarding water-soluble extractives, Philp
et al. (1995) showed that extractives from fresh Sitka spruce heartwood was in-
hibitorier to the mould Trichoderma than extractives from the sapwood. With ex-
tractives from dried Sitka spruce heartwood and sapwood, the degree of inhibi-
tory varied depending on the Trichoderma isolate. Heartwood also contains more
lignin and lignans, but less cellulose than sapwood (Ekman 1979, Bertaud and
Holmbom 2004). This can be of importance, since lignin is believed to improve
the durability of wood against microbial attack by coating and protecting the cel-
lulose microfibrils (Pew 1957, Vance et al. 1980). The transition zone between
heartwood and sapwood has a different composition. It is shown to have less lig-
nin and lipophilic extractives than both heartwood and sapwood (Bertaud and
Holmbom 2004).
2.3.4 Other factors affecting durability When a house was to be constructed in Sweden some hundred years ago, wood
was selected directly in the forest (Sjömar 1988). The choice of timber was
based on inherited knowledge about which wood was suitable for different pur-
poses. This knowledge was empirical, i.e., one had to learn through trial and er-
ror. In those days, there were no advanced methods available to enhance the du-
rability of the wood. Instead, the inherent properties of the wood were utilized.
There are many traditional theories on how to choose and handle wood in order
to get the most durable timber. The theories vary a great deal between different
27
parts of a country, even with respect to the same wood spices. However, in most
cases, it is claimed that wood should be harvested in the winter, have narrow an-
nual rings, large diameters, a high content of heartwood, and not many knots.
Annual ring width and Density Although wood with narrow annual rings is traditionally thought to be more du-
rable (Sjömar 1988), it has proven difficult to determine this in scientific investi-
gations (Rydell 1982, Grönlund and Rydell 1983). Nevertheless, the Swedish
Standard demands that an annual ring width of maximum 2.5 mm (as an average
value of a cross section) be present in timber which is used in the production of
window frames (SIS 1988). The term ‘annual ring width’ can also be misleading,
since the proportion of earlywood/latewood depends on the geographical loca-
tion of the stand. Since latewood (in sapwood) is less permeable than earlywood,
wood samples with the same annual ring width, but with different amounts of
latewood, will have different properties (Dinwoodie 2000). Since annual ring
width and density are correlated in wood grown under similar conditions, high-
density wood is also thought as being more durable (Sjömar 1988). It has been
shown that the natural durability of timber can, to some extent, be explained in
terms of density of Douglas fir (Akhter and Hale 2002a).
The density and annual ring width is, in turn, dependent on tree origin and
growth conditions (see below).
Climate, Origin and Growth conditions Origin can be of importance for durability since it can influence the availability
of nutriments, as well as fungicide and hydrophobic compounds. Studies have
shown differences in chemical composition between stands which are due to dif-
ferences in climate, ground conditions and water and nutrition supply (Yngves-
son et al. 1993, Shupe et al. 1996, Almberg 1999). However, recent studies by
Gierlinger et al. (2004b) found no systematic variation in hot water soluble ex-
tractives when different species and origins of larch wood were examined, al-
though the amounts of extractives were varying.
The climate and average temperature are also of importance for the annual
ring width and the proportion of latewood/earlywood. It has been shown that in
areas that experience a harsh climate, for example, in the Alps and in the north-
ern parts of the Nordic countries, the average temperature is the most important
factor (Mikola 1962, Grindl et al. 2000). On the contrary, the precipitation is the
most important factor further south (Henttonen 1984).
Different thinning regimes and competition between trees for light also influ-
ence the annual ring width. Large and high trees in a stand site generally have
lower density than the small trees (Lindström 1997). Furthermore, it has been
shown that, for Norway spruce, the smaller the annual ring is before the thinning
of a stand, the more the density reduces after (Pape 1999).
Viitanen et al. (1997) found that the resistance of wood from a 25 years old
Siberian larch was lower than wood from 70 and 102 years old larches. There-
fore the rotation time could also be of importance.
28
In an attempt to find factors of importance to select decay resistant pine, Vii-
tanen et al. (2002) was unsuccessful. The investigated parameters were tree
height, crown limit, wood density and heartwood percentage. Note, however,
that one reason for failure was believed to be the insufficient samples size (Harju
et al. 2001).
Felling time When it comes to the influence of the season when felling takes place on the du-
rability of pine and spruce, a variety of studies have been conducted with varying
results. For example, Wazny and Krajewski (1984) found that the durability for
pine was increased when the trees were harvested in the winter. In another inves-
tigation however, no such difference in durability was established (Boutejle and
Nilsson 1985). Also Boutelje (1990) found no differences in the nitrogenous
compounds at the surfaces on Scots pine and Norway spruce when comparing
different felling times. Himke et al. (1998) investigated the moisture distribution
in Norway spruce and found no differences between wood that was cut during
different seasons.
Drying technique Various results have also been shown with respect to air-drying and kiln-drying.
Boutelje (1990) investigated the redistribution of soluble nitrogenous compounds
which could be of importance for susceptibility against fungi, but found no dif-
ferences between samples form artificially and air-dried Scots pine or Norway
spruce. Inline with these studies, Rydell (1981) found no differences in rot dura-
bility for air-dried or kiln-dried Scots pine. In contrast, Terziev (1997) showed
that original surfaces of fast kiln-dried Scots pine sapwood were more suscepti-
ble to fungal discoloration. The different results could be due to the fact that, in
these investigations, only one parameter was investigated, and the possible influ-
ence of other factors was left unknown.
Water-storage Water-storage and water sprinkling is used to protect wood from fungal attack.
The MC is then kept at levels which are too high for fungal development. How-
ever, the wood is not protected against bacteria, since they can propagate even
during very high MC levels. The bacteria feed on proteins in the pore mem-
branes and therefore cause a higher permeability in wood. It has been shown that
water-storage and water sprinkling lead to a higher permeability in Scots pine
and Norway spruce sapwood (Dunleavy and McQuire 1970, Boutelje et al.
1979). The higher permeability is important for the wood’s susceptibility to wa-
ter, and, therefore, probably also for its durability against fungi.
Boutelje (1990) found that yellowing of pine and spruce after sawing often
was connected to water storage. The yellowing surfaces had a sugar accumula-
tion and nitrogen content 2-4.5 times higher than deeper in the wood. Further-
more it was shown that the yellowing surfaces were more susceptible to growth
of mould (Theander et al. 1993).
29
Juvenile and Mature wood Juvenile wood is formed near the pith. It has a higher permeability and a larger
fibril angle than mature wood (Thörnqvist 1993). Other characteristics that can
be observed with respect to juvenile wood are progressive increases in cell di-
mensions, and changes in cell composition. Mature wood is more uniform in cell
size and composition (Panshin and de Zeeuw 1980). A comparison between ju-
venile and mature wood, based on 10 species grown in China, showed fewer dif-
ferences between juvenile and mature wood in terms of their chemical composi-
tion than in terms of their anatomical and physico-mechanical properties (Bao et
al. 2001). This can have an influence on durability, since juvenile wood is known
to twist and crack more.
Sawing pattern When it comes to examining differences in durability between surfaces with ver-
tical and horizontal annual rings, not many investigations have been made. It has
been shown, however, that wood surfaces with vertical annual rings have many
advantages in comparison to wood surfaces with horizontal annual rings
(Sandberg 1995). For example, movement that is due to moisture is much
smaller. Surfaces with vertical rings suffer from fewer cracks, and are more
hardwearing. Nussbaum (1999) examined the wettability of Norway spruce and
Scots pine samples and found that wood with vertical annual rings had a lower
wettability than wood with horizontal annual rings. There was also a larger
spread among the latter. The disadvantage is that, in practice, sawing wood with
vertical annual rings gives up a smaller yield of timbre from each tree. Conse-
quently, this sawing pattern is not yet used commercially in Sweden.
2.4 Field test methods
The majority of all timber is used in applications that are out of immediate
ground contact. In spite of this fact, the durability of wood is usually assessed by
its performance in ground contact. It has, however, been purposed that durability
classes should be listed separately for in ground and above ground applications
(Augusta and Rapp 2003). Above ground, the key factor for durability is the
moisture dynamics of the wood (i.e., the wood’s inherent properties in terms of
moisture uptake and subsequent drying out). In ground contact, the moisture dy-
namics are not so important, since the wood will almost always have high mois-
ture content. Durability tests where the moisture content is held at a constantly
high level, such as in ground contact, should be considered as tests of the amount
and efficiency of fungicides in the wood specimens, rather than tests of above
ground durability.
The reason for remaining with test methods where the moisture content of the
wood samples is constantly high is the need of fast results. Above ground, the
decay is much slower than in ground contact. This observation is related to the
fact that, in above ground applications, the wood can dry out between wet peri-
ods. Moisture resistant wood, such as pine heartwood with high levels of hydro-
phobic extractives, will practically never take up enough water to allow decay by
rot fungi in an above ground application.
Many of the test methods for above ground durability provide for some kind
of moisture trap in the samples, so as to increase the time period over which the
sample has an MC level where rot fungi can grow. Obviously, this is done so as
to shorten the time to obtain test results. However, as is true for all field tests, it
must be noted that the prevailing weather conditions are of importance for the
test result (Sell and Zimmermann 1995, Creemers et al. 2002).
There are a number of different test methods that have been used over the
years. Below, the most important methods are summarized, and their advantages
and disadvantages are compared. The lap-joint and L-joint methods are European
standards, while the others are not.
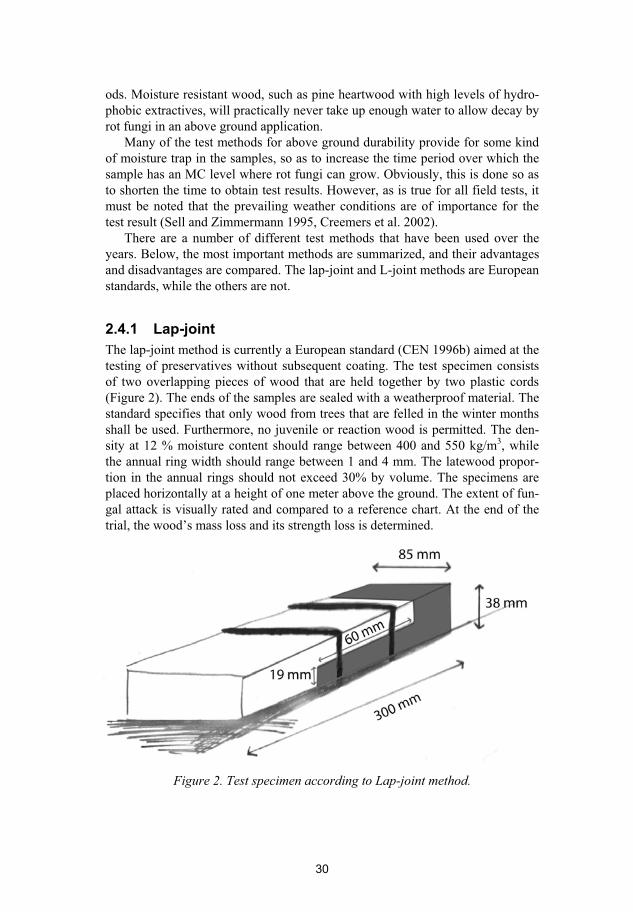
2.4.1 Lap-joint The lap-joint method is currently a European standard (CEN 1996b) aimed at the
testing of preservatives without subsequent coating. The test specimen consists
of two overlapping pieces of wood that are held together by two plastic cords
(Figure 2). The ends of the samples are sealed with a weatherproof material. The
standard specifies that only wood from trees that are felled in the winter months
shall be used. Furthermore, no juvenile or reaction wood is permitted. The den-
sity at 12 % moisture content should range between 400 and 550 kg/m3, while
the annual ring width should range between 1 and 4 mm. The latewood propor-
tion in the annual rings should not exceed 30% by volume. The specimens are
placed horizontally at a height of one meter above the ground. The extent of fun-
gal attack is visually rated and compared to a reference chart. At the end of the
trial, the wood’s mass loss and its strength loss is determined.
Figure 2. Test specimen according to Lap-joint method.
30
In Sweden, there is currently one ongoing investigation where the Lap-joint
method is used (Johansson et al. 2001). After five years exposure, only a few of
the untreated samples have suffered any damage caused by rot fungi. This im-
plies that the method may be too slow for Swedish climatic conditions.
In addition, it has been shown that it is difficult to hold the two parts of the
specimens together, since the plastic cords that are used in the test are not elastic
enough to follow the wood’s movement when it swells and shrinks. How the
wood moves during swelling and shrinking is dependent on the wood’s proper-
ties, including its density, its annual ring orientation, the content of extractives,
and the proportion of juvenile wood or latewood in the sample. Thus, the plastic
cords are stretched and do not hold the two pieces of wood together to the same
extent in all of the samples. The moisture trap will then act with different effi-
ciency across the different samples. One way to avoid this is to use another,
more elastic material for the cords which are used to hold the two parts of the
samples together. Another solution to the problem is to use joints to keep the
parts together.
The annual ring orientation, which is not defined in the standard, is of impor-
tance for the formation of cracks (Sandberg 1995), which in turn affects the
moisture uptake of the samples. Thus, the annual ring orientation should be de-
fined in the standard.
2.4.2 L-joint L-joint is another European standard method which is used to test above ground
durability (CEN 1993). This standard is aimed at testing preservative treated
wood when a subsequent coating is applied.
31
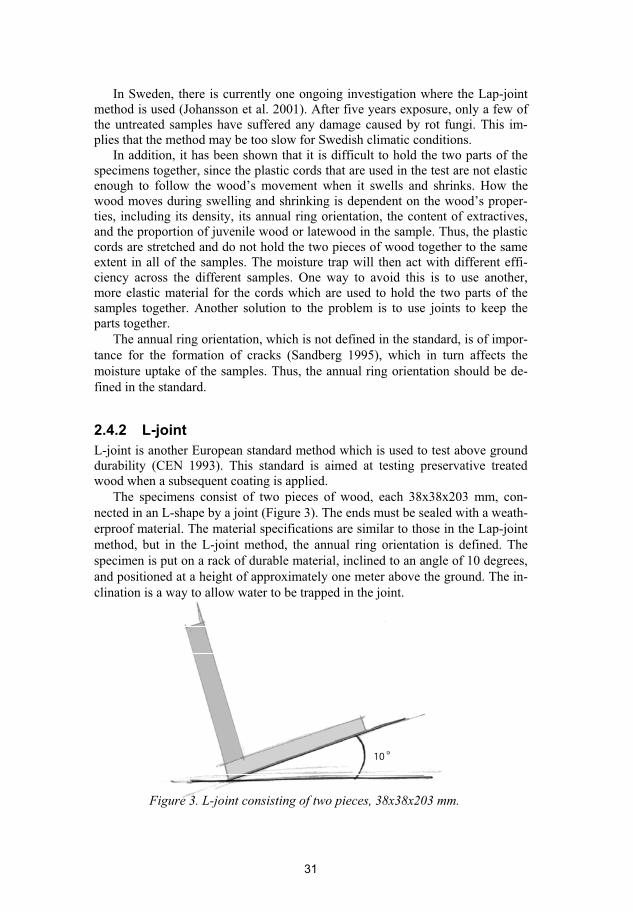
The specimens consist of two pieces of wood, each 38x38x203 mm, con-
nected in an L-shape by a joint (Figure 3). The ends must be sealed with a weath-
erproof material. The material specifications are similar to those in the Lap-joint
method, but in the L-joint method, the annual ring orientation is defined. The
specimen is put on a rack of durable material, inclined to an angle of 10 degrees,
and positioned at a height of approximately one meter above the ground. The in-
clination is a way to allow water to be trapped in the joint.
Figure 3. L-joint consisting of two pieces, 38x38x203 mm.
32
For untreated samples, the method shows large variations (Carey 2002), im-
plying that even stricter specifications of the wood material should be used. This
observation, however, is relevant to all of the test methods that are described
here. The advantages of the L-joint method are that it is standardized, and that it
is considerably faster than the alternative Lap-joint method. The disadvantage of
this method is its more complicated construction, which makes the setting up of
the test more time consuming.
2.4.3 The Johansson method This method has showed promising results in an ongoing investigation (Johans-
son et al. 1999, 2001). Each sample consists of three pieces of wood. Each piece
has the dimensions of 22x95x500 mm (Figure 8). Two pieces are joined together
lengthwise by eight wood screws with the third piece of wood overlapping the
other two. The exposure test samples are positioned with a 60 degrees inclination
to the south, with the lower part of the samples positioned 500 mm above the
ground. The design of the test samples leads to efficient moisture traps, where
the moisture load is not the same for the three different parts of each sample.
This gives the researcher the opportunity to either evaluate the test sample as a
whole, or each part of the test sample separately. After three years of exposure in
Borås, Sweden, some untreated spruce and pine sapwood samples showed signs
of the onset of rot damage (Johansson et al. 1999).
The method clearly gives faster results than the lap-joint method (Johansson
et al. 1999, 2001). The joints that are used between the different pieces of wood
in the sample gives this method a more realistic construction method when com-
pared to most other methods, where the wood pieces are more or less free to
move relative to each other during swelling and shrinking phases. In practice,
most of the timber that is used in real-life applications is jointed together.
Since the Johansson method is not standardized, the lack of specifications
with respect to the samples is a drawback, thereby making it difficult to compare
different investigations. A consequence of jointing the parts together is that the
annual ring orientation is of great importance for the formation of cracks. Apart
from the annual ring orientation, the wood’s density, annual ring width, and the
proportion of latewood should also be specified.
2.4.4 The Öqvist method Öqvist (1988) used a simple arrangement where samples of the size 30x50x450
mm were placed on a rack, which is placed at 45˚ angle to the south (Figure 7).
The rack is placed about 1 meter above the ground level.
Unlike in the other methods described above, there are no overlapping sam-
ple surfaces where moisture is trapped, which makes the method slow. For pre-
servative tests, even longer exposure times are probably needed, which, of
course, is unreasonable. The benefit of a slow method, such as this, is the im-
proved ability to resolve minor variations.
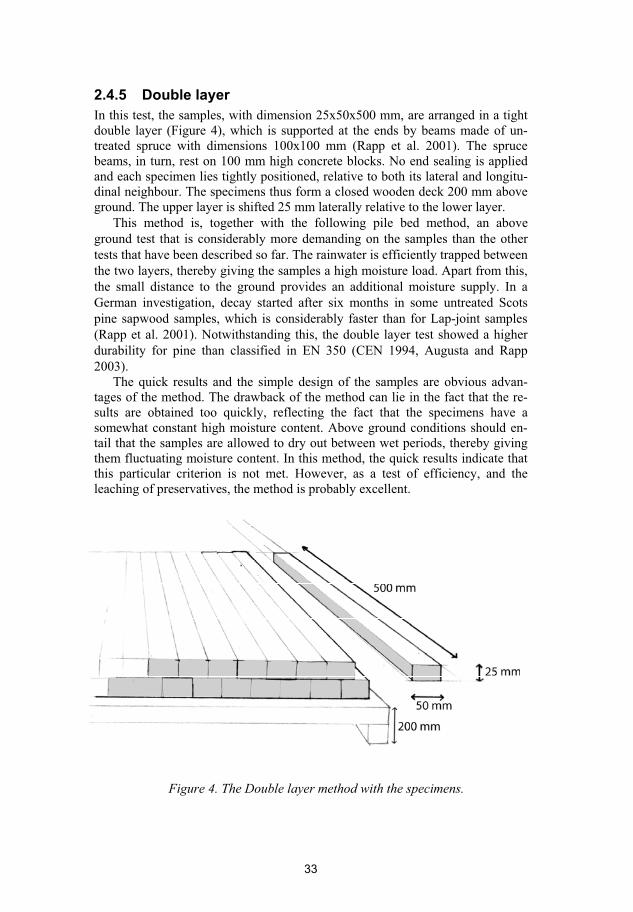
2.4.5 Double layerIn this test, the samples, with dimension 25x50x500 mm, are arranged in a tight
double layer (Figure 4), which is supported at the ends by beams made of un-
treated spruce with dimensions 100x100 mm (Rapp et al. 2001). The spruce
beams, in turn, rest on 100 mm high concrete blocks. No end sealing is applied
and each specimen lies tightly positioned, relative to both its lateral and longitu-
dinal neighbour. The specimens thus form a closed wooden deck 200 mm above
ground. The upper layer is shifted 25 mm laterally relative to the lower layer.
This method is, together with the following pile bed method, an above
ground test that is considerably more demanding on the samples than the other
tests that have been described so far. The rainwater is efficiently trapped between
the two layers, thereby giving the samples a high moisture load. Apart from this,
the small distance to the ground provides an additional moisture supply. In a
German investigation, decay started after six months in some untreated Scots
pine sapwood samples, which is considerably faster than for Lap-joint samples
(Rapp et al. 2001). Notwithstanding this, the double layer test showed a higher
durability for pine than classified in EN 350 (CEN 1994, Augusta and Rapp
2003).
The quick results and the simple design of the samples are obvious advan-
tages of the method. The drawback of the method can lie in the fact that the re-
sults are obtained too quickly, reflecting the fact that the specimens have a
somewhat constant high moisture content. Above ground conditions should en-
tail that the samples are allowed to dry out between wet periods, thereby giving
them fluctuating moisture content. In this method, the quick results indicate that
this particular criterion is not met. However, as a test of efficiency, and the
leaching of preservatives, the method is probably excellent.
Figure 4. The Double layer method with the specimens.
33
The Double layer method can be modified somewhat to reduce the moisture
load, for example, by introducing an interval between every second sample in the
lower layer and having one sample on top of each ‘pair’. Obviously, the results
would be slower but perhaps more decisive with respect to above ground dura-
bility.
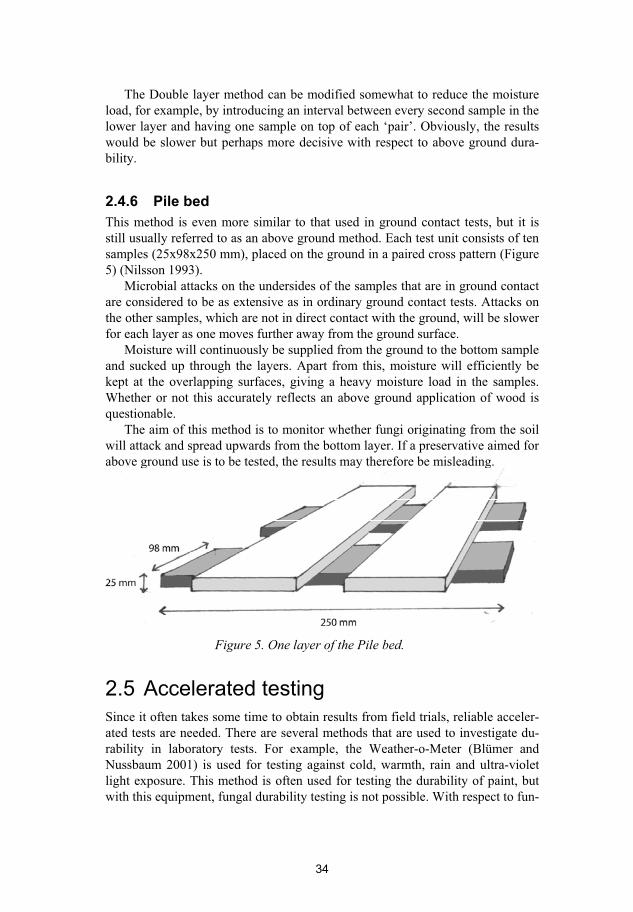
2.4.6 Pile bedThis method is even more similar to that used in ground contact tests, but it is
still usually referred to as an above ground method. Each test unit consists of ten
samples (25x98x250 mm), placed on the ground in a paired cross pattern (Figure
5) (Nilsson 1993).
Microbial attacks on the undersides of the samples that are in ground contact
are considered to be as extensive as in ordinary ground contact tests. Attacks on
the other samples, which are not in direct contact with the ground, will be slower
for each layer as one moves further away from the ground surface.
Moisture will continuously be supplied from the ground to the bottom sample
and sucked up through the layers. Apart from this, moisture will efficiently be
kept at the overlapping surfaces, giving a heavy moisture load in the samples.
Whether or not this accurately reflects an above ground application of wood is
questionable.
The aim of this method is to monitor whether fungi originating from the soil
will attack and spread upwards from the bottom layer. If a preservative aimed for
above ground use is to be tested, the results may therefore be misleading.
Figure 5. One layer of the Pile bed.
2.5 Accelerated testing
Since it often takes some time to obtain results from field trials, reliable acceler-
ated tests are needed. There are several methods that are used to investigate du-
rability in laboratory tests. For example, the Weather-o-Meter (Blümer and
Nussbaum 2001) is used for testing against cold, warmth, rain and ultra-violet
light exposure. This method is often used for testing the durability of paint, but
with this equipment, fungal durability testing is not possible. With respect to fun-
34
35
gal durability tests, many such tests are performed under sterile conditions where
a single strain of wood-destroying fungi in pure culture form is used, i.e. there is
only one type of fungus used at a time. That entails that the fungi have no com-
petition from other fungi. Furthermore, in most of these tests, the fungi are al-
lowed to grow on media in a vessel before the wood is added (CEN 1994, CEN
1996a). Because of this, the fungi also have all the benefits of an excess of nutri-
ents and moisture. These kind of tests are not very realistic, since they really
only measure the overall toxicity of the wood extractives or preservatives. The
natural influences exerted by the wood’s moisture dynamics characteristics,
which are important for above ground use, are eliminated.
The apparent natural durability has been shown to be dependent on the fungi
that is used in testing (Akhter and Hale 2002a). In response to this observation,
experiments in the laboratory have used unsterilized soil in different variations in
order to promote a more natural colonization from the fungi. Some examples of
this are the soil-bed, and the fungal cellar tests (Stephan et al. 2000, Larsson
Brelid et al. 2000, Molnar et al. 1996, Edlund 1998). The disadvantages of these
tests are that they are not very reproducible since the same soil cannot be used
twice, and the wood is often not allowed to dry out at any time during the test pe-
riod.
Fungi only degrade wood if there is enough water available. Therefore, the
moisture characteristics of the wood must be of importance. Despite this, very
few experiments have investigated the moisture dynamics in wood during ongo-
ing degradation by fungi.

36
37
3. Hypotheses and Limitations
3.1 Hypotheses
The hypotheses of this project, presented below, are based on a literature study
(Rydell and Bergström 2002), which was partly reproduced and presented in the
previous chapter. The hypotheses are:
1. The durability in above ground applications of spruce and pine is very
much dependent on the wood materials’ moisture dynamics.
2. Different handling conditions affect the durability of the wood.
3. The variations in durability among spruce specimens can partly be at-
tributed to differences in moisture uptake between heartwood and
sapwood samples, and mature wood and juvenile wood.
4. The above ground durability of pine heartwood can be influenced by the
content and composition of the extractives.
5. The most important factors for the moisture properties could be used to
select durable wood directly in the forest or at the sawmill.
3.2 Outline and Limitations of the research
The limitations of the research, revealed as the different parameters that were in-
vestigated in this thesis and the methods that were used, were carefully based on
the literature survey and conversations with the scientific supervisors, and the
reference group that was associated with the project.
With respect to pine, it is known that heartwood has a much better durability
than sapwood. In the literature it could be found that heartwood, with high con-
tent of extractives, in particular pinosylvine, has a higher durability than
heartwood with a lower extractive content. Above ground, however, this rela-
tionship has not been proven. The main aim of the study, therefore, was to col-
lect a pine heartwood material with a large variation in extractives, as well as
other properties, and investigate whether significant differences in above ground
durability could be detected. Pine sapwood was merely used as a reference mate-
rial.
38
Regarding spruce, it is known that there exists a large variation in its natural
durability. Reports on what actually causes this variation are however almost
non-existent in the literature. The approach to this problem was to collect a well-
defined material with a large variation in wood properties, and an effort was
made to identify the most important factors that are relevant to durability.
In the field test, the Johansson method was selected since it is a more realistic
way of fixing the pieces in the test sample together, and the moisture trap present
in the samples accelerated the pace of the experiment. Spruce and pine samples
from several different well-defined stands in southern Sweden were selected to
investigate the importance of origin and growth conditions. This selection proc-
ess also yielded a large variation in annual ring width and density amongst the
samples. With respect to spruce, the investigated parameters in the field test
were, in addition to the above, annual ring orientation (horizontal and vertical),
and the differences between mature wood and juvenile wood. Heartwood and
sapwood were not separated, and all of the samples were left untreated. Pine
samples, used in the field test, had horizontal annual rings, and the heartwood
and sapwood samples were separated.
Since a field test above ground in the Swedish climate takes many years until
completion, it is not possible to present a final evaluation given the time frame
provided for the writing of this thesis. Since field tests should be considered
more reliable than laboratory methods, it was decided to evaluate raw data from
an already concluded nine-year field test that was performed at the Swedish Uni-
versity of Agricultural Sciences (SLU). The material examined at SLU has not
yet been evaluated due to a lack of funding. Even if this investigation did have
its own limitations, and was partly focused on investigating other factors,
including handling factors, and the effects of surface treatment and end-grain
treatment, it was thought that evaluating this study would lead to new knowledge
and thereby strengthen the merits of the present thesis.
To obtain more of new data that was relevant to this project, some laboratory
methods were used. Since the aim of the project was to investigate durability of
wood in above ground applications, a laboratory method that simulated these
conditions was needed. The new Mycologg method has the advantage of simul-
taneously exposing the samples to both a fluctuating moisture load and fungal
spores, thus simulating above ground conditions, at least to some extent. One
major limitation with the Mycologg is that no rot has time to develop, and thus
only resistance towards discolouring fungi was tested. A commonly used labora-
tory method, where fungi is pre-cultivated in pure culture, was regarded as being
too demanding a condition with respect to our chosen parameters and thus was
not deemed to reflect above ground conditions.
To study liquid and gaseous water permeability, three different methods were
selected in order to survey the differences between spruce sapwood and spruce
heartwood. These methods were employed in an attempt to explain the differ-
ences observed in the Mycologg test. Only the relative differences between
spruce sapwood and spruce heartwood were considered.
39
In addition to the methods mentioned above, chemical analyses through NIR
(Near InfraRed) spectroscopy were performed at the Swedish National Testing
and Research Institute in Stockholm on the pine heartwood used in the Johans-
son method. Unfortunately, the models used for the evaluation were poor and the
test results can not be trusted. Therefore, the results are not presented in this the-
sis.
Since there were many factors that could be seen to influence the durability
of the wood samples, a multivariate approach was necessary. Both the sampling,
and the subsequent tests and evaluations were carried out with this intention in
mind.
3.3 Aims and Objectives
In the first part of this project, Paper I-IV, a large durability test conducted in
the 1980s at the SLU was evaluated (The investigated parameters correspond to
Hypotheses 1, 2 and 4). The aim in Paper I was to perform a smaller evaluation
of the MC dynamics of untreated and painted spruce and pine. The 170 samples
that were evaluated were selected by people at SLU. These samples were also
examined and analysed for fungal growth. The aim of the test was for the SLU to
further evaluate these results in a different paper. This paper has not been written
yet. Returning to this study, in Paper II-IV, the aim was to investigate pine and
spruce samples separately. More samples were studied and a more thorough
analysis was performed. In addition to this, density, annual ring width, mass loss,
and annual ring orientation were added as further parameters that were investi-
gated for all of the samples.
In Paper V, the aim was to describe the Mycologg method, and to compare
results from the Mycologg on pine samples with results from the Johansson field
test.
In Paper VI and VII, the aim was to investigate the durability of Norway
spruce sapwood and spruce heartwood of different origins (Hypotheses 1, 3 and
5). The method used was a new accelerated laboratory test with a Mycologg,
where fungal attack and moisture dynamics were tested simultaneously.
The aim of Paper VIII was to examine the differences in properties between
spruce heartwood and spruce sapwood with respect to permeability and wettabil-
ity (Hypotheses 1 and 3).
In Paper IX, the aim was to present an initial evaluation of a large field test.
The pine and spruce samples came from a well-defined material source. They
had been placed outdoors above ground in a long-term field test at the Asa re-
search station in southern Sweden (Hypotheses 1, 3-5).

40
41
4. Material and Methods
4.1 Old material
The material evaluated in Paper I-IV via the Öqvist method, was collected in the
1980s by the SLU in Uppsala, Sweden. The material represented the north, cen-
tral, and south of Sweden, and included both pine and spruce. This method of se-
lection was employed so as to vary the latitude of each stand. At each place, 20
trees of each species with an age ranging from 85 to 105 years were cut down.
Half of the trees at each site were felled during the winter season, and the re-
maining half were felled during the summer. A 5-meter log was taken from the
butt of each tree. Directly after felling, all logs were transported to Kvillsfors
TräIndustrier AB, where all wood was sawn and dried.
The logs that were felled during the summer were divided into two groups.
One group of logs was sawn immediately, while the rest were first stored in wa-
ter for 13 weeks. All of the logs were sawn down to 38 mm thick boards, or to 63
mm thick unedged planks. Directly after sawing, the material was dried in an in-
dustrial kiln according to a standard drying schedule. The logs that were felled in
the winter season were divided into two groups after sawing. One group was
kiln-dried, and the other group was air-dried in a lumberyard. The drying sched-
ules were the same for pine and spruce, but not equal for the winter-felled and
the summer-felled wood (see Appendix A).
Note that the authors only evaluated the material used in the Öqvist trial.
Thus, the planning and sampling of the old material was outside the scope of this
thesis.
4.2 New material
Papers V-IX are based on new material that was collected during the winter of
2001-2002. This material was used for the Johansson method, the Mycologg, as
well as the water permeability tests. Since the literature survey revealed the rele-
vance of a well-defined material with sufficient variation, pine and spruce was
collected from the west, east, and central (the Highland area) of southern Sweden
(Figure 6).
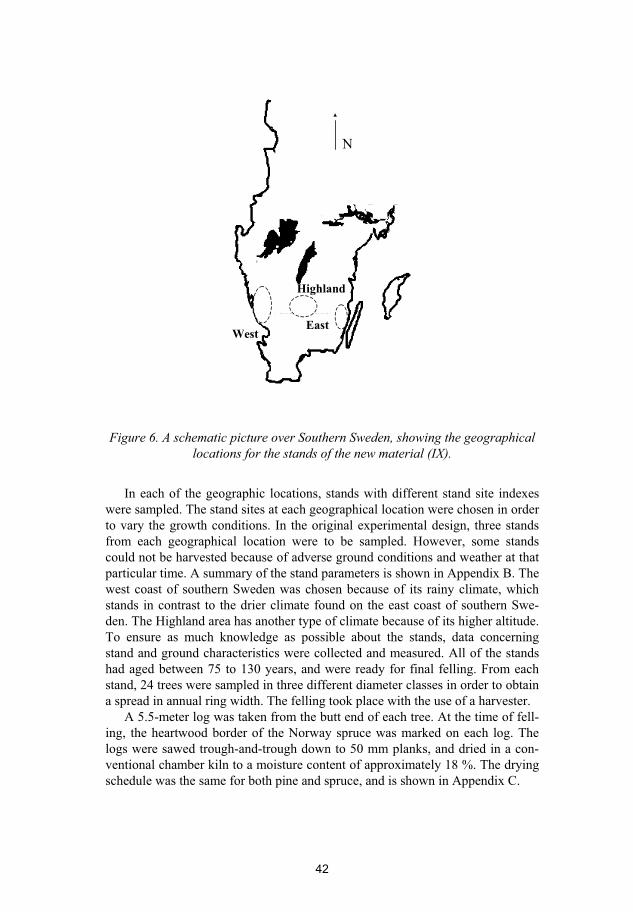
42
cccccCCC
Highland
WestEast
N
Figure 6. A schematic picture over Southern Sweden, showing the geographical
locations for the stands of the new material (IX).
In each of the geographic locations, stands with different stand site indexes
were sampled. The stand sites at each geographical location were chosen in order
to vary the growth conditions. In the original experimental design, three stands
from each geographical location were to be sampled. However, some stands
could not be harvested because of adverse ground conditions and weather at that
particular time. A summary of the stand parameters is shown in Appendix B. The
west coast of southern Sweden was chosen because of its rainy climate, which
stands in contrast to the drier climate found on the east coast of southern Swe-
den. The Highland area has another type of climate because of its higher altitude.
To ensure as much knowledge as possible about the stands, data concerning
stand and ground characteristics were collected and measured. All of the stands
had aged between 75 to 130 years, and were ready for final felling. From each
stand, 24 trees were sampled in three different diameter classes in order to obtain
a spread in annual ring width. The felling took place with the use of a harvester.
A 5.5-meter log was taken from the butt end of each tree. At the time of fell-
ing, the heartwood border of the Norway spruce was marked on each log. The
logs were sawed trough-and-trough down to 50 mm planks, and dried in a con-
ventional chamber kiln to a moisture content of approximately 18 %. The drying
schedule was the same for both pine and spruce, and is shown in Appendix C.
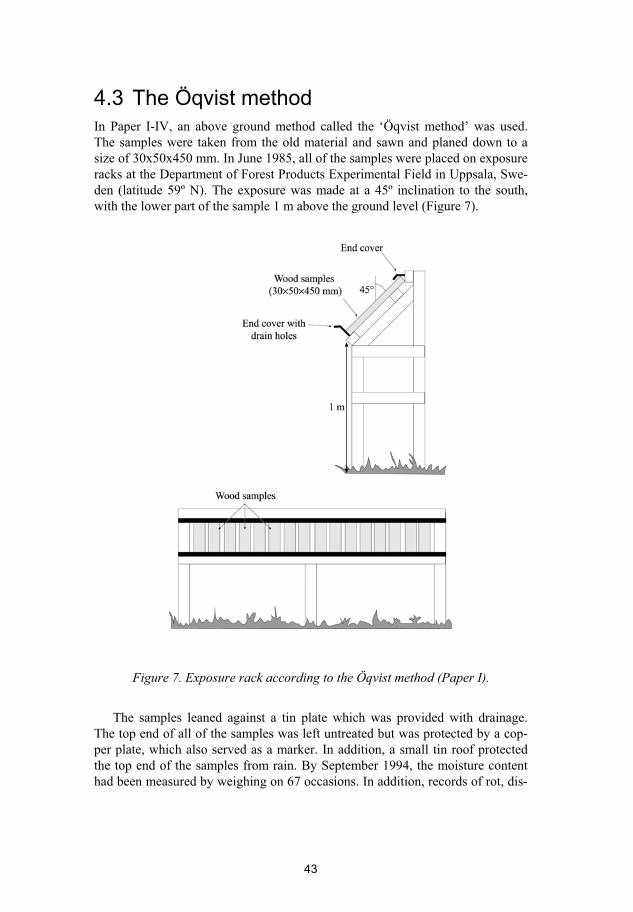
4.3 The Öqvist method
In Paper I-IV, an above ground method called the ‘Öqvist method’ was used.
The samples were taken from the old material and sawn and planed down to a
size of 30x50x450 mm. In June 1985, all of the samples were placed on exposure
racks at the Department of Forest Products Experimental Field in Uppsala, Swe-
den (latitude 59º N). The exposure was made at a 45º inclination to the south,
with the lower part of the sample 1 m above the ground level (Figure 7).
43
Figure 7. Exposure rack according to the Öqvist method (Paper I).
The samples leaned against a tin plate which was provided with drainage.
The top end of all of the samples was left untreated but was protected by a cop-
per plate, which also served as a marker. In addition, a small tin roof protected
the top end of the samples from rain. By September 1994, the moisture content
had been measured by weighing on 67 occasions. In addition, records of rot, dis-
44
coloration, cracking, as well as damage to the paint had been noted at regular in-
tervals.
The factors that were examined were origin, time of year of felling, drying
method, water-storage and the effect of surface painting and end-grain treatment
(4.1). The painting treatments were done in three different ways: surface painted
and end-painted; surface painted with the ends left untreated; and surface painted
with the ends protected by dipping in a preservative oil. The experimental design
is shown in Appendix D. The paint that was used was a low permeable PUR
(polyurethane) window paint (I).
The material is reported on in four different Papers, according to Table 1.
Table 1. Overview of Paper I-IV.
Paper Species Parameters Amount of samples
I Pine and spruce All 170
II Spruce Untreated 113
III Spruce Surface painted and end-
painted
112
IV Pine All 566
4.4 The Johansson method
The field test with the new material was done according to Johansson et al.
(1999). The study was set up at the Asa research field (lat 57º). Three pieces,
with a size of 22x95x500 mm, were screwed together with eight wood screws
(Figure 8). Two of the pieces were joined together lengthwise with the third
piece. The third piece overlapped the other two in order to achieve an efficient
moisture trap which was used to accelerate the experiment.
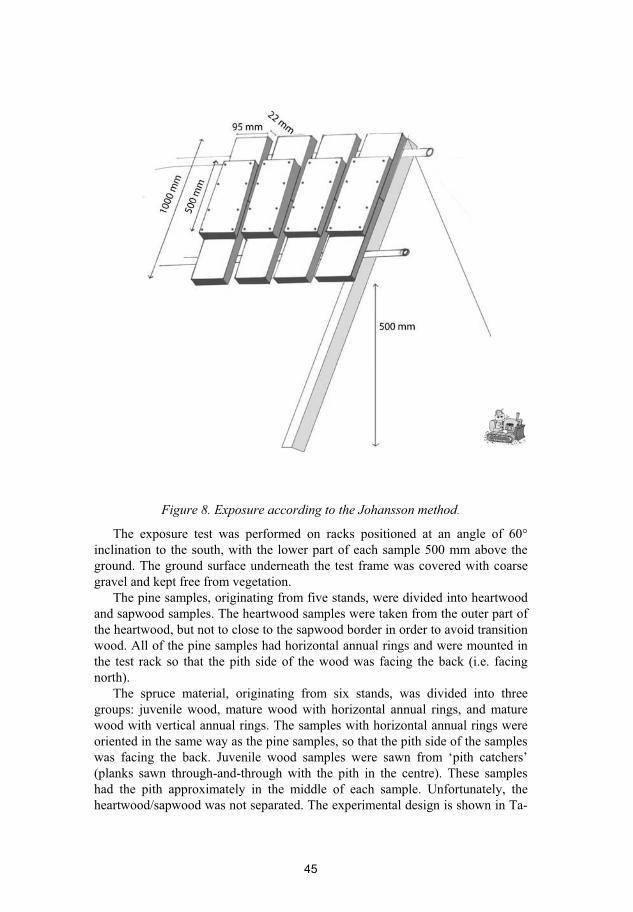
45
Figure 8. Exposure according to the Johansson method.
The exposure test was performed on racks positioned at an angle of 60°
inclination to the south, with the lower part of each sample 500 mm above the
ground. The ground surface underneath the test frame was covered with coarse
gravel and kept free from vegetation.
The pine samples, originating from five stands, were divided into heartwood
and sapwood samples. The heartwood samples were taken from the outer part of
the heartwood, but not to close to the sapwood border in order to avoid transition
wood. All of the pine samples had horizontal annual rings and were mounted in
the test rack so that the pith side of the wood was facing the back (i.e. facing
north).
The spruce material, originating from six stands, was divided into three
groups: juvenile wood, mature wood with horizontal annual rings, and mature
wood with vertical annual rings. The samples with horizontal annual rings were
oriented in the same way as the pine samples, so that the pith side of the samples
was facing the back. Juvenile wood samples were sawn from ‘pith catchers’
(planks sawn through-and-through with the pith in the centre). These samples
had the pith approximately in the middle of each sample. Unfortunately, the
heartwood/sapwood was not separated. The experimental design is shown in Ta-
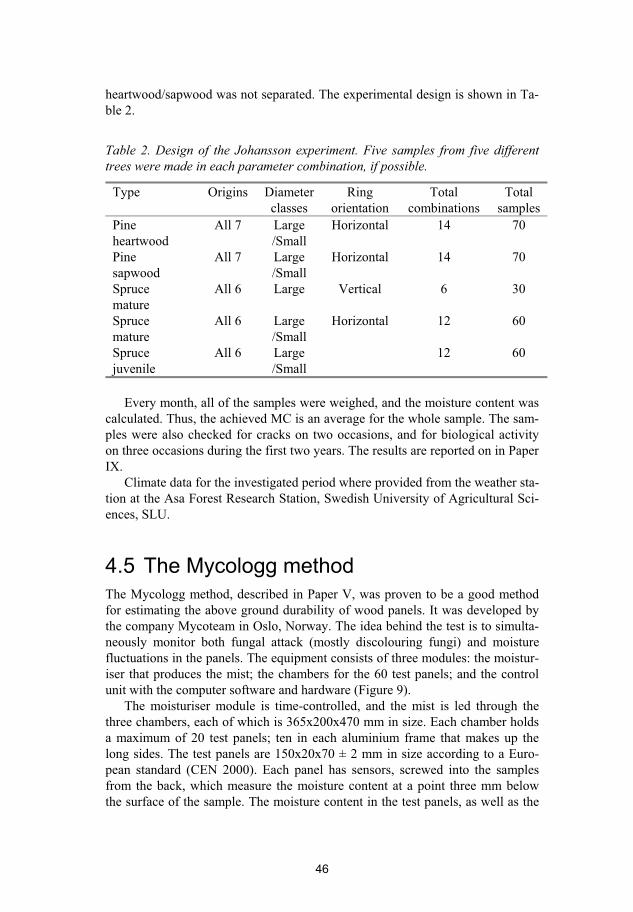
46
heartwood/sapwood was not separated. The experimental design is shown in Ta-
ble 2.
Table 2. Design of the Johansson experiment. Five samples from five different
trees were made in each parameter combination, if possible.
Type Origins Diameter
classes
Ring
orientation
Total
combinations
Total
samples
Pine
heartwood
All 7 Large
/Small
Horizontal 14 70
Pine
sapwood
All 7 Large
/Small
Horizontal 14 70
Spruce
mature
All 6 Large Vertical 6 30
Spruce
mature
All 6 Large
/Small
Horizontal 12 60
Spruce
juvenile
All 6 Large
/Small
12 60
Every month, all of the samples were weighed, and the moisture content was
calculated. Thus, the achieved MC is an average for the whole sample. The sam-
ples were also checked for cracks on two occasions, and for biological activity
on three occasions during the first two years. The results are reported on in Paper
IX.
Climate data for the investigated period where provided from the weather sta-
tion at the Asa Forest Research Station, Swedish University of Agricultural Sci-
ences, SLU.
4.5 The Mycologg method
The Mycologg method, described in Paper V, was proven to be a good method
for estimating the above ground durability of wood panels. It was developed by
the company Mycoteam in Oslo, Norway. The idea behind the test is to simulta-
neously monitor both fungal attack (mostly discolouring fungi) and moisture
fluctuations in the panels. The equipment consists of three modules: the moistur-
iser that produces the mist; the chambers for the 60 test panels; and the control
unit with the computer software and hardware (Figure 9).
The moisturiser module is time-controlled, and the mist is led through the
three chambers, each of which is 365x200x470 mm in size. Each chamber holds
a maximum of 20 test panels; ten in each aluminium frame that makes up the
long sides. The test panels are 150x20x70 ± 2 mm in size according to a Euro-
pean standard (CEN 2000). Each panel has sensors, screwed into the samples
from the back, which measure the moisture content at a point three mm below
the surface of the sample. The moisture content in the test panels, as well as the
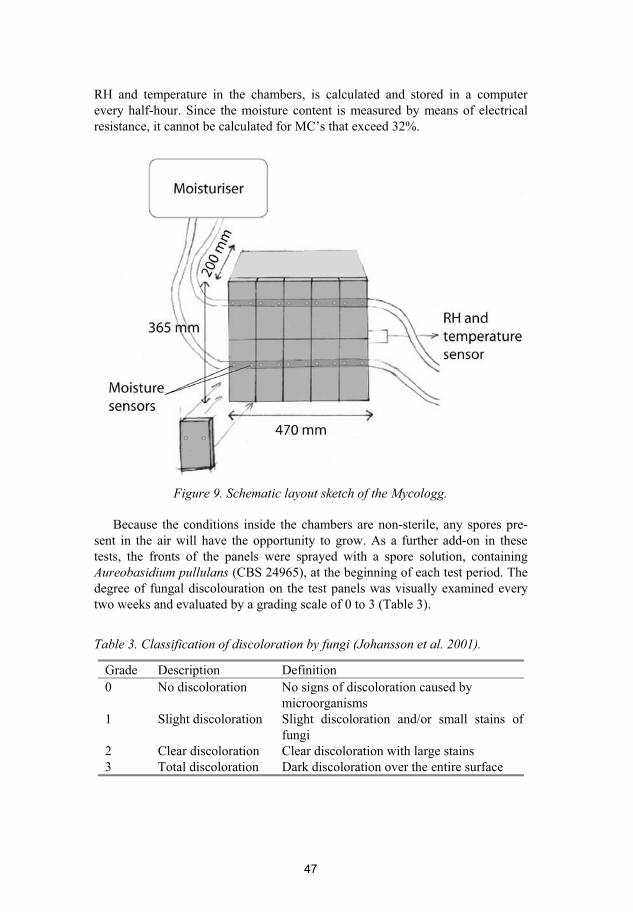
RH and temperature in the chambers, is calculated and stored in a computer
every half-hour. Since the moisture content is measured by means of electrical
resistance, it cannot be calculated for MC’s that exceed 32%.
Figure 9. Schematic layout sketch of the Mycologg.
Because the conditions inside the chambers are non-sterile, any spores pre-
sent in the air will have the opportunity to grow. As a further add-on in these
tests, the fronts of the panels were sprayed with a spore solution, containing
Aureobasidium pullulans (CBS 24965), at the beginning of each test period. The
degree of fungal discolouration on the test panels was visually examined every
two weeks and evaluated by a grading scale of 0 to 3 (Table 3).
Table 3. Classification of discoloration by fungi (Johansson et al. 2001).
Grade Description Definition
0 No discoloration No signs of discoloration caused by
microorganisms
1 Slight discoloration Slight discoloration and/or small stains of
fungi
2 Clear discoloration Clear discoloration with large stains
3 Total discoloration Dark discoloration over the entire surface
47
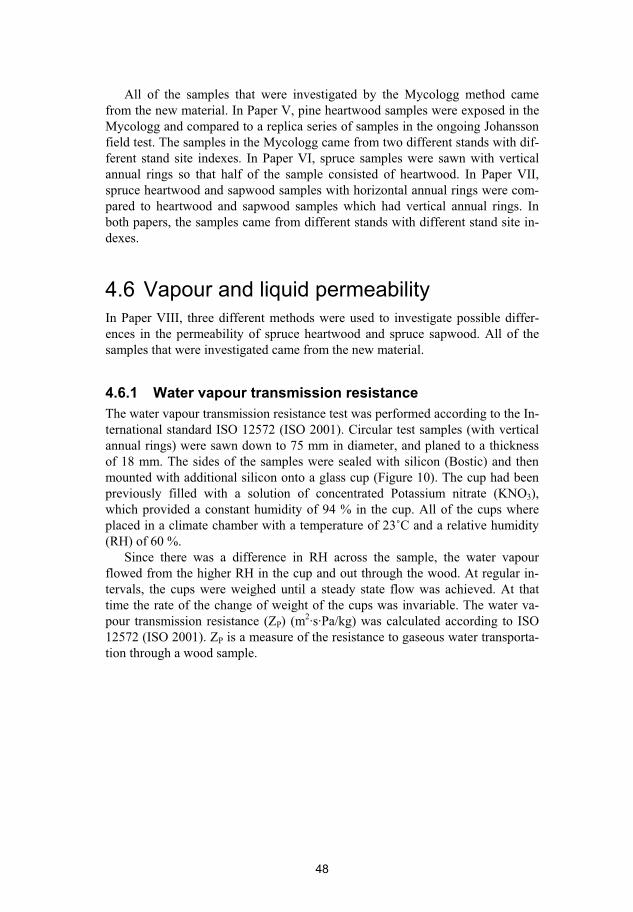
48
All of the samples that were investigated by the Mycologg method came
from the new material. In Paper V, pine heartwood samples were exposed in the
Mycologg and compared to a replica series of samples in the ongoing Johansson
field test. The samples in the Mycologg came from two different stands with dif-
ferent stand site indexes. In Paper VI, spruce samples were sawn with vertical
annual rings so that half of the sample consisted of heartwood. In Paper VII,
spruce heartwood and sapwood samples with horizontal annual rings were com-
pared to heartwood and sapwood samples which had vertical annual rings. In
both papers, the samples came from different stands with different stand site in-
dexes.
4.6 Vapour and liquid permeability
In Paper VIII, three different methods were used to investigate possible differ-
ences in the permeability of spruce heartwood and spruce sapwood. All of the
samples that were investigated came from the new material.
4.6.1 Water vapour transmission resistance The water vapour transmission resistance test was performed according to the In-
ternational standard ISO 12572 (ISO 2001). Circular test samples (with vertical
annual rings) were sawn down to 75 mm in diameter, and planed to a thickness
of 18 mm. The sides of the samples were sealed with silicon (Bostic) and then
mounted with additional silicon onto a glass cup (Figure 10). The cup had been
previously filled with a solution of concentrated Potassium nitrate (KNO3),
which provided a constant humidity of 94 % in the cup. All of the cups where
placed in a climate chamber with a temperature of 23˚C and a relative humidity
(RH) of 60 %.
Since there was a difference in RH across the sample, the water vapour
flowed from the higher RH in the cup and out through the wood. At regular in-
tervals, the cups were weighed until a steady state flow was achieved. At that
time the rate of the change of weight of the cups was invariable. The water va-
pour transmission resistance (ZP) (m2·s·Pa/kg) was calculated according to ISO
12572 (ISO 2001). ZP is a measure of the resistance to gaseous water transporta-
tion through a wood sample.
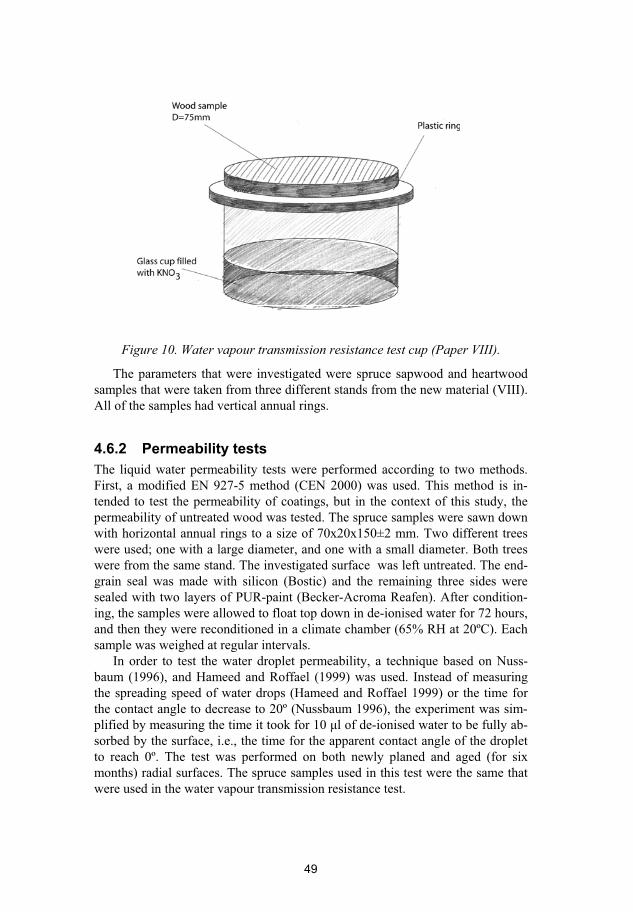
Figure 10. Water vapour transmission resistance test cup (Paper VIII).
The parameters that were investigated were spruce sapwood and heartwood
samples that were taken from three different stands from the new material (VIII).
All of the samples had vertical annual rings.
4.6.2 Permeability testsThe liquid water permeability tests were performed according to two methods.
First, a modified EN 927-5 method (CEN 2000) was used. This method is in-
tended to test the permeability of coatings, but in the context of this study, the
permeability of untreated wood was tested. The spruce samples were sawn down
with horizontal annual rings to a size of 70x20x150±2 mm. Two different trees
were used; one with a large diameter, and one with a small diameter. Both trees
were from the same stand. The investigated surface was left untreated. The end-
grain seal was made with silicon (Bostic) and the remaining three sides were
sealed with two layers of PUR-paint (Becker-Acroma Reafen). After condition-
ing, the samples were allowed to float top down in de-ionised water for 72 hours,
and then they were reconditioned in a climate chamber (65% RH at 20ºC). Each
sample was weighed at regular intervals.
In order to test the water droplet permeability, a technique based on Nuss-
baum (1996), and Hameed and Roffael (1999) was used. Instead of measuring
the spreading speed of water drops (Hameed and Roffael 1999) or the time for
the contact angle to decrease to 20º (Nussbaum 1996), the experiment was sim-
plified by measuring the time it took for 10 µl of de-ionised water to be fully ab-
sorbed by the surface, i.e., the time for the apparent contact angle of the droplet
to reach 0º. The test was performed on both newly planed and aged (for six
months) radial surfaces. The spruce samples used in this test were the same that
were used in the water vapour transmission resistance test.
49
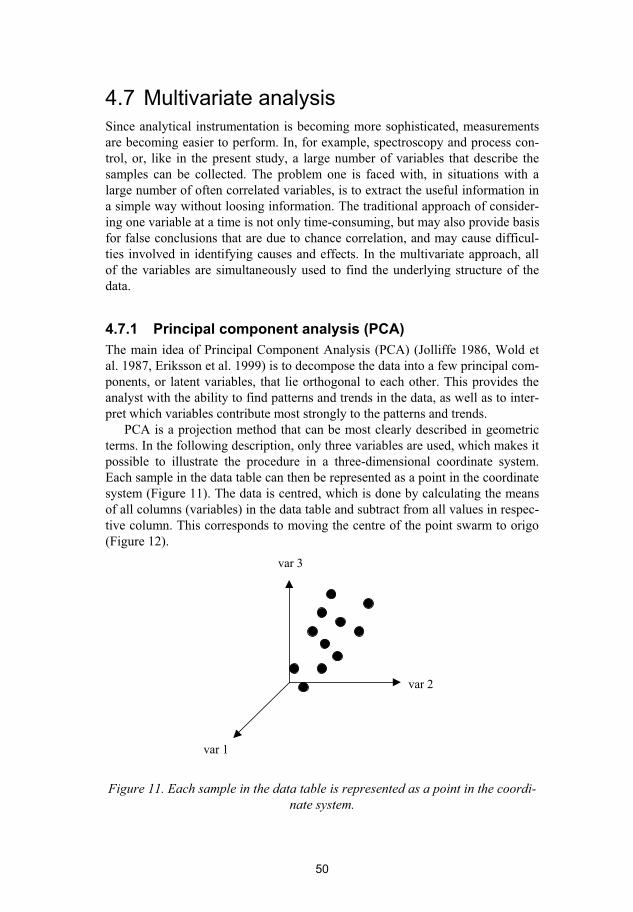
4.7 Multivariate analysis
Since analytical instrumentation is becoming more sophisticated, measurements
are becoming easier to perform. In, for example, spectroscopy and process con-
trol, or, like in the present study, a large number of variables that describe the
samples can be collected. The problem one is faced with, in situations with a
large number of often correlated variables, is to extract the useful information in
a simple way without loosing information. The traditional approach of consider-
ing one variable at a time is not only time-consuming, but may also provide basis
for false conclusions that are due to chance correlation, and may cause difficul-
ties involved in identifying causes and effects. In the multivariate approach, all
of the variables are simultaneously used to find the underlying structure of the
data.
4.7.1 Principal component analysis (PCA) The main idea of Principal Component Analysis (PCA) (Jolliffe 1986, Wold et
al. 1987, Eriksson et al. 1999) is to decompose the data into a few principal com-
ponents, or latent variables, that lie orthogonal to each other. This provides the
analyst with the ability to find patterns and trends in the data, as well as to inter-
pret which variables contribute most strongly to the patterns and trends.
PCA is a projection method that can be most clearly described in geometric
terms. In the following description, only three variables are used, which makes it
possible to illustrate the procedure in a three-dimensional coordinate system.
Each sample in the data table can then be represented as a point in the coordinate
system (Figure 11). The data is centred, which is done by calculating the means
of all columns (variables) in the data table and subtract from all values in respec-
tive column. This corresponds to moving the centre of the point swarm to origo
(Figure 12).
50
var 1
var 2
var 3
Figure 11. Each sample in the data table is represented as a point in the coordi-
nate system.
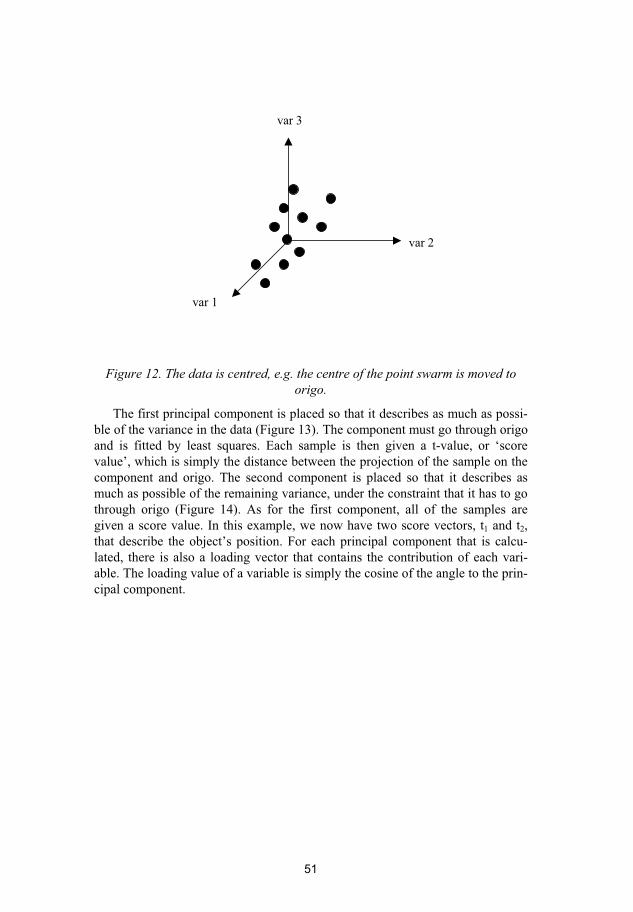
var 1
var 2
var 3
Figure 12. The data is centred, e.g. the centre of the point swarm is moved to
origo.
The first principal component is placed so that it describes as much as possi-
ble of the variance in the data (Figure 13). The component must go through origo
and is fitted by least squares. Each sample is then given a t-value, or ‘score
value’, which is simply the distance between the projection of the sample on the
component and origo. The second component is placed so that it describes as
much as possible of the remaining variance, under the constraint that it has to go
through origo (Figure 14). As for the first component, all of the samples are
given a score value. In this example, we now have two score vectors, t1 and t2,
that describe the object’s position. For each principal component that is calcu-
lated, there is also a loading vector that contains the contribution of each vari-
able. The loading value of a variable is simply the cosine of the angle to the prin-
cipal component.
51
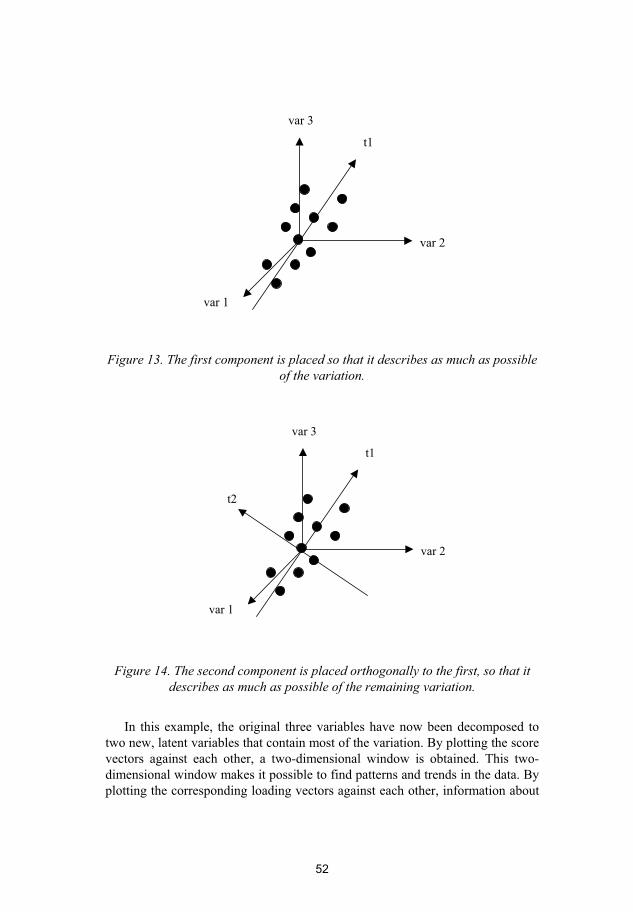
var 1
var 2
var 3
t1
Figure 13. The first component is placed so that it describes as much as possible
of the variation.
var 1
var 2
var 3
t1
t2
Figure 14. The second component is placed orthogonally to the first, so that it
describes as much as possible of the remaining variation.
In this example, the original three variables have now been decomposed to
two new, latent variables that contain most of the variation. By plotting the score
vectors against each other, a two-dimensional window is obtained. This two-
dimensional window makes it possible to find patterns and trends in the data. By
plotting the corresponding loading vectors against each other, information about
52
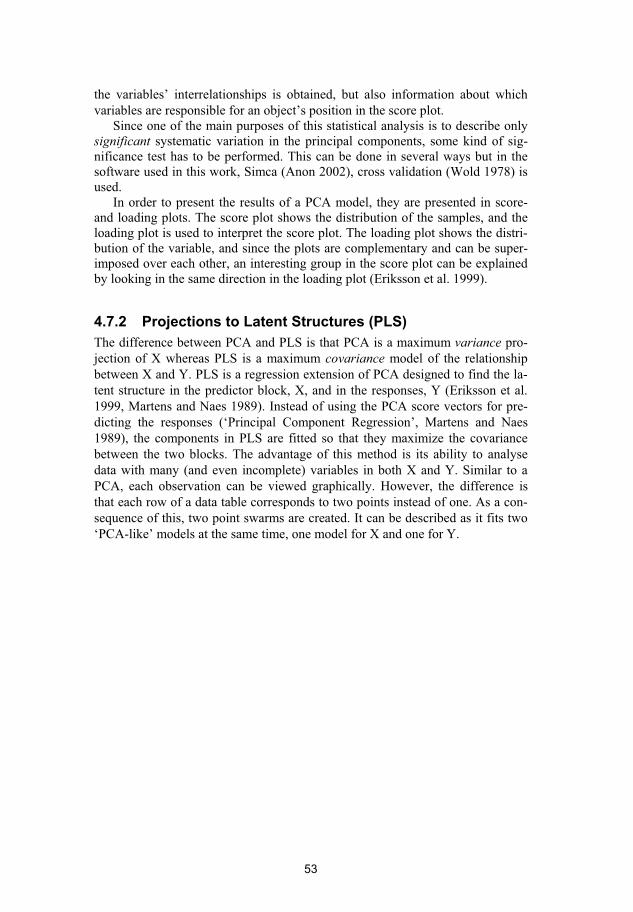
53
the variables’ interrelationships is obtained, but also information about which
variables are responsible for an object’s position in the score plot.
Since one of the main purposes of this statistical analysis is to describe only
significant systematic variation in the principal components, some kind of sig-
nificance test has to be performed. This can be done in several ways but in the
software used in this work, Simca (Anon 2002), cross validation (Wold 1978) is
used.
In order to present the results of a PCA model, they are presented in score-
and loading plots. The score plot shows the distribution of the samples, and the
loading plot is used to interpret the score plot. The loading plot shows the distri-
bution of the variable, and since the plots are complementary and can be super-
imposed over each other, an interesting group in the score plot can be explained
by looking in the same direction in the loading plot (Eriksson et al. 1999).
4.7.2 Projections to Latent Structures (PLS) The difference between PCA and PLS is that PCA is a maximum variance pro-
jection of X whereas PLS is a maximum covariance model of the relationship
between X and Y. PLS is a regression extension of PCA designed to find the la-
tent structure in the predictor block, X, and in the responses, Y (Eriksson et al.
1999, Martens and Naes 1989). Instead of using the PCA score vectors for pre-
dicting the responses (‘Principal Component Regression’, Martens and Naes
1989), the components in PLS are fitted so that they maximize the covariance
between the two blocks. The advantage of this method is its ability to analyse
data with many (and even incomplete) variables in both X and Y. Similar to a
PCA, each observation can be viewed graphically. However, the difference is
that each row of a data table corresponds to two points instead of one. As a con-
sequence of this, two point swarms are created. It can be described as it fits two
‘PCA-like’ models at the same time, one model for X and one for Y.

54
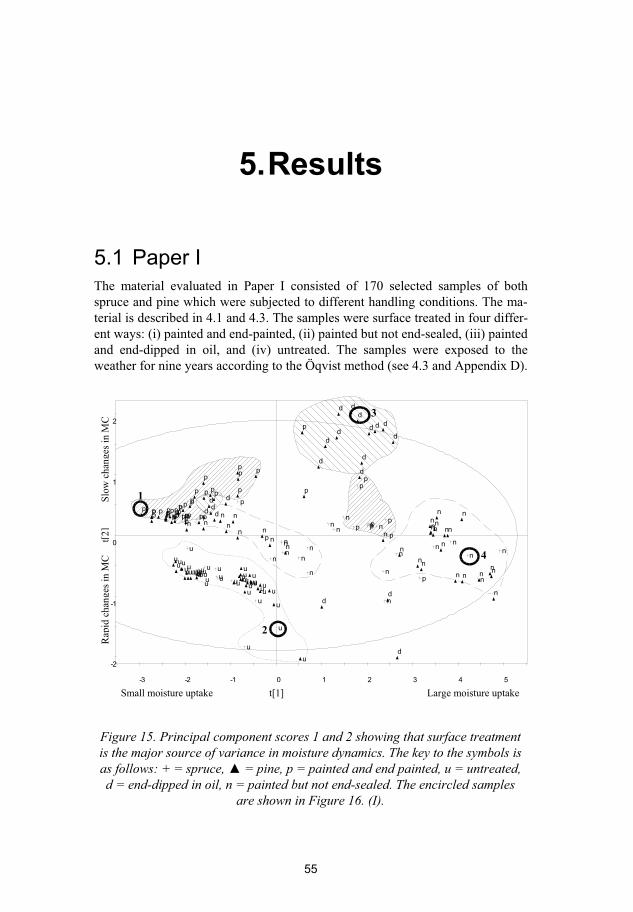
5. Results
5.1 Paper I
The material evaluated in Paper I consisted of 170 selected samples of both
spruce and pine which were subjected to different handling conditions. The ma-
terial is described in 4.1 and 4.3. The samples were surface treated in four differ-
ent ways: (i) painted and end-painted, (ii) painted but not end-sealed, (iii) painted
and end-dipped in oil, and (iv) untreated. The samples were exposed to the
weather for nine years according to the Öqvist method (see 4.3 and Appendix D).
-2
-1
0
1
2
-3 -2 -1 0 1 2 3 4 5
Rap
id c
han
ges
in M
C t
[2]
S
low
chan
ges
in
MC
Small moisture uptake t[1] Large moisture uptake
uu
u
u
u
u
uu
uu
u
u
u
u
uuuuuu
n
n
n
n
n
nn n
n
n
nn
n
n
nn
n
n
n
n
pp
p
p
p
p
p
p
p
p
p pppp
p
p
p
pp
uu
u
u
u
uu
u
uu
u uu
u
u
u
u
u
uuu
uu
u
uuu
u
uun
nnn
nn
n
n
n
n
nn
n
n
nn
n
n
n
n
n
n
n
nn
n n
n
n
n
d
d
d
d
ddd
d
d
d
d
d
d
d
d
dd
d
d
dpp
p
p
p
p
pp
p p
p
p
p
p
pp
p
ppp
pppppp ppp
p
Simca-P 8.0 by Umetrics AB 2000-10-27 11:10
Ffgdg
1
2
4
3
Small moisture uptake t[1] Large moisture uptake
Figure 15. Principal component scores 1 and 2 showing that surface treatment
is the major source of variance in moisture dynamics. The key to the symbols is
as follows: + = spruce, = pine, p = painted and end painted, u = untreated,
d = end-dipped in oil, n = painted but not end-sealed. The encircled samples
are shown in Figure 16. (I).
55
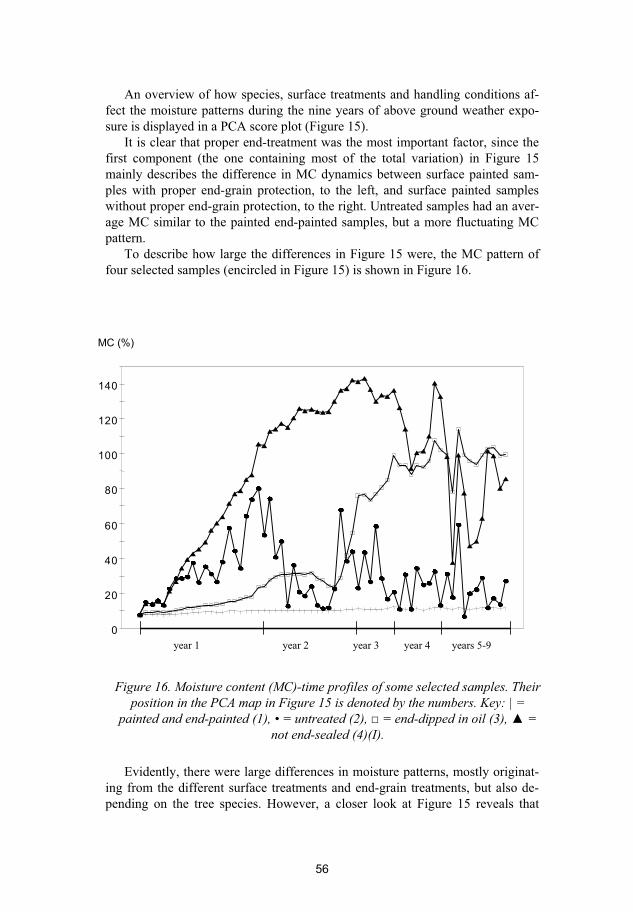
An overview of how species, surface treatments and handling conditions af-
fect the moisture patterns during the nine years of above ground weather expo-
sure is displayed in a PCA score plot (Figure 15).
It is clear that proper end-treatment was the most important factor, since the
first component (the one containing most of the total variation) in Figure 15
mainly describes the difference in MC dynamics between surface painted sam-
ples with proper end-grain protection, to the left, and surface painted samples
without proper end-grain protection, to the right. Untreated samples had an aver-
age MC similar to the painted end-painted samples, but a more fluctuating MC
pattern.
To describe how large the differences in Figure 15 were, the MC pattern of
four selected samples (encircled in Figure 15) is shown in Figure 16.
0
20
40
60
80
100
120
140
year 1 year 2 year 3 year 4 years 5-9
MC (%)
Figure 16. Moisture content (MC)-time profiles of some selected samples. Their
position in the PCA map in Figure 15 is denoted by the numbers. Key: | =
painted and end-painted (1), • = untreated (2), = end-dipped in oil (3), =
not end-sealed (4)(I).
Evidently, there were large differences in moisture patterns, mostly originat-
ing from the different surface treatments and end-grain treatments, but also de-
pending on the tree species. However, a closer look at Figure 15 reveals that
56
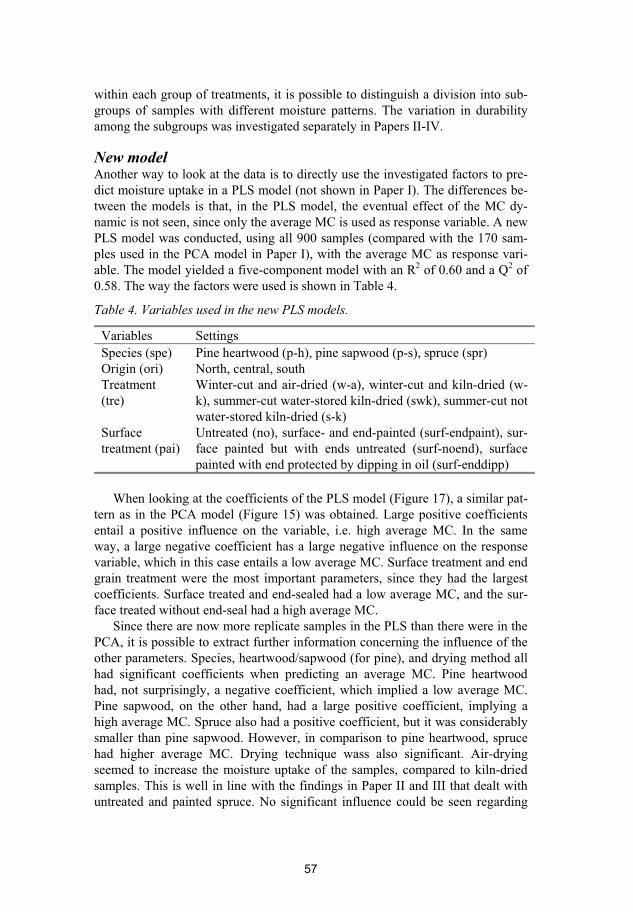
57
within each group of treatments, it is possible to distinguish a division into sub-
groups of samples with different moisture patterns. The variation in durability
among the subgroups was investigated separately in Papers II-IV.
New model Another way to look at the data is to directly use the investigated factors to pre-
dict moisture uptake in a PLS model (not shown in Paper I). The differences be-
tween the models is that, in the PLS model, the eventual effect of the MC dy-
namic is not seen, since only the average MC is used as response variable. A new
PLS model was conducted, using all 900 samples (compared with the 170 sam-
ples used in the PCA model in Paper I), with the average MC as response vari-
able. The model yielded a five-component model with an R2 of 0.60 and a Q2 of
0.58. The way the factors were used is shown in Table 4.
Table 4. Variables used in the new PLS models.
Variables Settings
Species (spe) Pine heartwood (p-h), pine sapwood (p-s), spruce (spr)
Origin (ori) North, central, south
Treatment
(tre)
Winter-cut and air-dried (w-a), winter-cut and kiln-dried (w-
k), summer-cut water-stored kiln-dried (swk), summer-cut not
water-stored kiln-dried (s-k)
Surface
treatment (pai)
Untreated (no), surface- and end-painted (surf-endpaint), sur-
face painted but with ends untreated (surf-noend), surface
painted with end protected by dipping in oil (surf-enddipp)
When looking at the coefficients of the PLS model (Figure 17), a similar pat-
tern as in the PCA model (Figure 15) was obtained. Large positive coefficients
entail a positive influence on the variable, i.e. high average MC. In the same
way, a large negative coefficient has a large negative influence on the response
variable, which in this case entails a low average MC. Surface treatment and end
grain treatment were the most important parameters, since they had the largest
coefficients. Surface treated and end-sealed had a low average MC, and the sur-
face treated without end-seal had a high average MC.
Since there are now more replicate samples in the PLS than there were in the
PCA, it is possible to extract further information concerning the influence of the
other parameters. Species, heartwood/sapwood (for pine), and drying method all
had significant coefficients when predicting an average MC. Pine heartwood
had, not surprisingly, a negative coefficient, which implied a low average MC.
Pine sapwood, on the other hand, had a large positive coefficient, implying a
high average MC. Spruce also had a positive coefficient, but it was considerably
smaller than pine sapwood. However, in comparison to pine heartwood, spruce
had higher average MC. Drying technique wass also significant. Air-drying
seemed to increase the moisture uptake of the samples, compared to kiln-dried
samples. This is well in line with the findings in Paper II and III that dealt with
untreated and painted spruce. No significant influence could be seen regarding
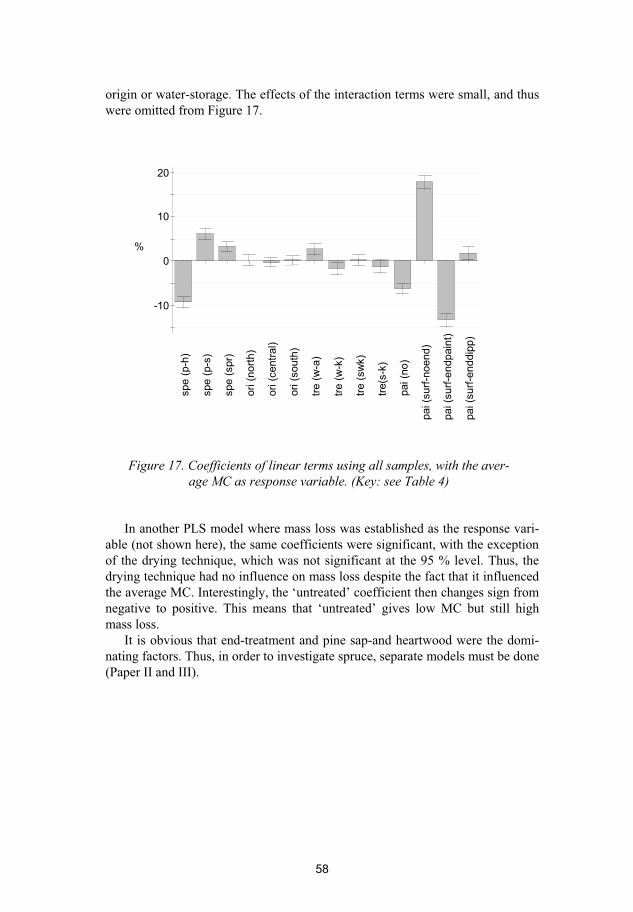
origin or water-storage. The effects of the interaction terms were small, and thus
were omitted from Figure 17.
-10
0
10
20
spe (
p-h
)
spe (
p-s
)
spe (
spr)
ori (
nort
h)
ori (
centr
al)
ori (
south
)
tre (
w-a
)
tre (
w-k
)
tre (
sw
k)
tre(s
-k)
pai (n
o)
pai (s
urf
-noend)
pai (s
urf
-endpain
t)
pai (s
urf
-enddip
p)
%
Figure 17. Coefficients of linear terms using all samples, with the aver-
age MC as response variable. (Key: see Table 4)
In another PLS model where mass loss was established as the response vari-
able (not shown here), the same coefficients were significant, with the exception
of the drying technique, which was not significant at the 95 % level. Thus, the
drying technique had no influence on mass loss despite the fact that it influenced
the average MC. Interestingly, the ‘untreated’ coefficient then changes sign from
negative to positive. This means that ‘untreated’ gives low MC but still high
mass loss.
It is obvious that end-treatment and pine sap-and heartwood were the domi-
nating factors. Thus, in order to investigate spruce, separate models must be done
(Paper II and III).
58
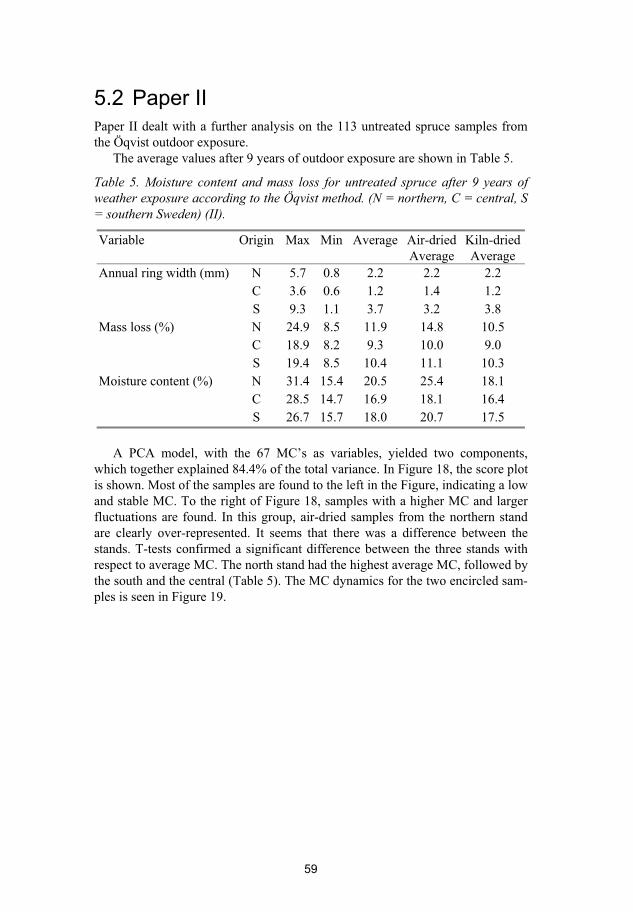
59
5.2 Paper II
Paper II dealt with a further analysis on the 113 untreated spruce samples from
the Öqvist outdoor exposure.
The average values after 9 years of outdoor exposure are shown in Table 5.
Table 5. Moisture content and mass loss for untreated spruce after 9 years of
weather exposure according to the Öqvist method. (N = northern, C = central, S
= southern Sweden) (II).
Variable Origin Max Min Average Air-dried
Average
Kiln-dried
Average
Annual ring width (mm) N 5.7 0.8 2.2 2.2 2.2
C 3.6 0.6 1.2 1.4 1.2
S 9.3 1.1 3.7 3.2 3.8
Mass loss (%) N 24.9 8.5 11.9 14.8 10.5
C 18.9 8.2 9.3 10.0 9.0
S 19.4 8.5 10.4 11.1 10.3
Moisture content (%) N 31.4 15.4 20.5 25.4 18.1
C 28.5 14.7 16.9 18.1 16.4
S 26.7 15.7 18.0 20.7 17.5
A PCA model, with the 67 MC’s as variables, yielded two components,
which together explained 84.4% of the total variance. In Figure 18, the score plot
is shown. Most of the samples are found to the left in the Figure, indicating a low
and stable MC. To the right of Figure 18, samples with a higher MC and larger
fluctuations are found. In this group, air-dried samples from the northern stand
are clearly over-represented. It seems that there was a difference between the
stands. T-tests confirmed a significant difference between the three stands with
respect to average MC. The north stand had the highest average MC, followed by
the south and the central (Table 5). The MC dynamics for the two encircled sam-
ples is seen in Figure 19.
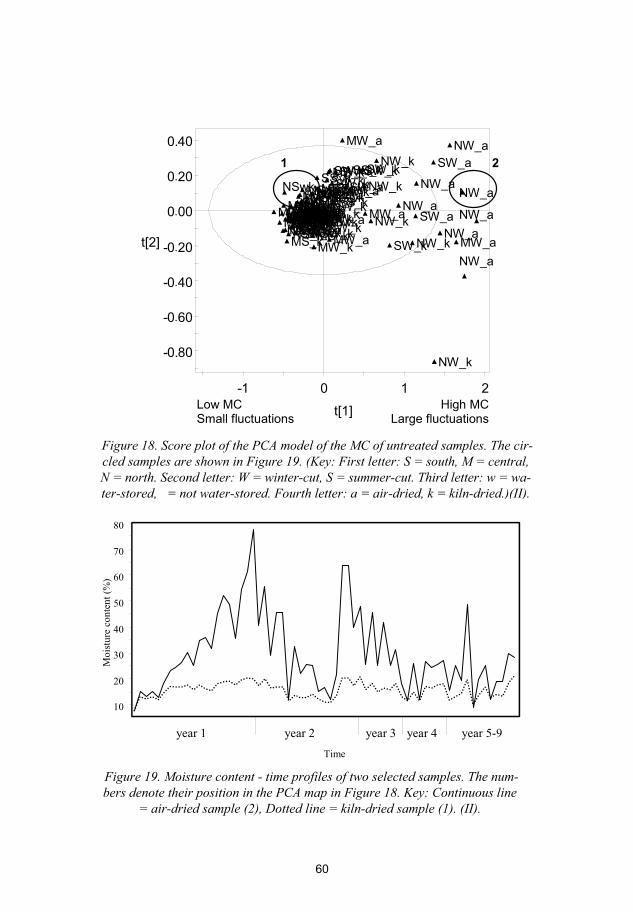
-0.80
-0.60
-0.40
-0.20
0.00
0.20
0.40
-1 0 1 2
t[2]
t[1]
MS_kMS_k
MS_k
MS_k
MS_k
MS_k
MS_kMS_k
MS_k
MS_kMS_k
MS_kMS_k
MS_k
MS_k
MS_kMS_k
MS_k
MS_kMSwk
MSwk
MSwk
MSwkMSwk
MSwk
MSwkMSwkMSwkMSwk
MW_a
MW_a
MW_a
MW_a
MW_a
MW_a
MW_a
MW_a
MW_a
MW_a
MW_aMW_a
MW_aMW_a MW_a
MW_k
MW_kMW_kMW_k
MW_k
MW_k
MW_k
NS_k
NS_k
NS_kNS_kNSwk
NSwk
NSwk
NSwkNSwk
NW_a
NW_a
NW_a
NW_a
NW_a
NW_a
NW_a
NW_aNW_a
NW_k
NW_k
NW_k
NW_k
NW_k
NW_k
NW_k NW_k
NW_k
SS_k
SS_kSS_k
SS_k
SS_kSS_k
SS_k
SSwkSSwkSSwkSSwk
SSwkSSwk
SSwkSSwk
SW_a
SW_a
SW_aSW_aSW_a SW_a
SW_k
SW_k
SW_k
SW_k
SW_kSW_k
SW_k
SW_k
SW_k
SW_k
SW_k
SW_k
SW_k
SW_k
1 2
Low MC
Small fluctuations
High MC
Large fluctuations
Figure 18. Score plot of the PCA model of the MC of untreated samples. The cir-
cled samples are shown in Figure 19. (Key: First letter: S = south, M = central,
N = north. Second letter: W = winter-cut, S = summer-cut. Third letter: w = wa-
ter-stored, = not water-stored. Fourth letter: a = air-dried, k = kiln-dried.)(II).
Mo
istu
re c
on
ten
t(%
)
10
20
30
40
50
60
70
80
year 1 year 2 year 3 year 5-9 year 4
Time
Figure 19. Moisture content - time profiles of two selected samples. The num-
bers denote their position in the PCA map in Figure 18. Key: Continuous line
= air-dried sample (2), Dotted line = kiln-dried sample (1). (II).
60
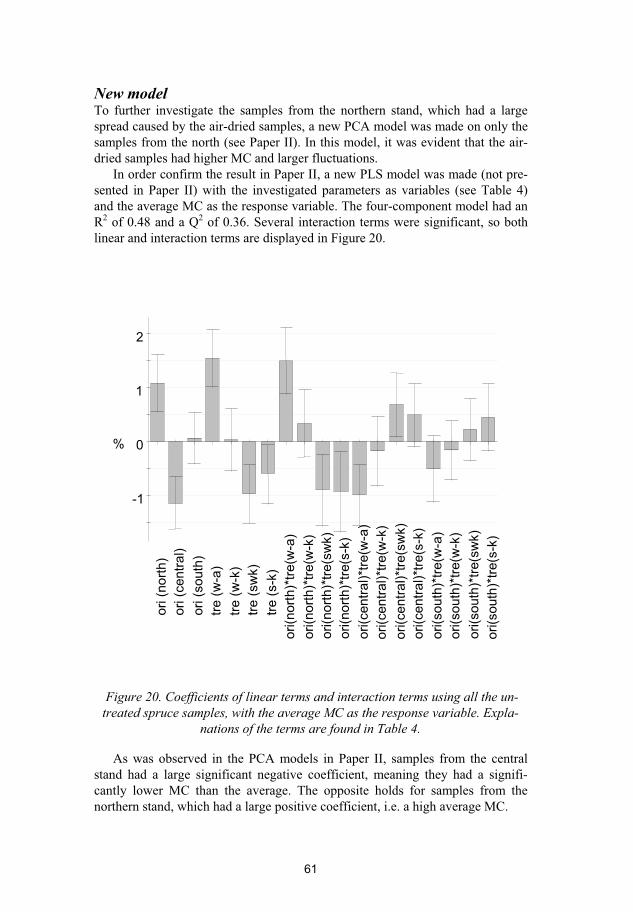
New model To further investigate the samples from the northern stand, which had a large
spread caused by the air-dried samples, a new PCA model was made on only the
samples from the north (see Paper II). In this model, it was evident that the air-
dried samples had higher MC and larger fluctuations.
In order confirm the result in Paper II, a new PLS model was made (not pre-
sented in Paper II) with the investigated parameters as variables (see Table 4)
and the average MC as the response variable. The four-component model had an
R2 of 0.48 and a Q2 of 0.36. Several interaction terms were significant, so both
linear and interaction terms are displayed in Figure 20.
-1
0
1
2
ori
(nort
h)
ori
(centr
al)
ori
(south
)
tre
(w
-a)
tre (
w-k
)
tre (
sw
k)
tre (
s-k
)
ori(n
ort
h)*
tre(w
-a)
ori(n
ort
h)*
tre(w
-k)
ori
(nort
h)*
tre(s
wk)
ori
(nort
h)*
tre(s
-k)
ori(c
entr
al)*tr
e(w
-a)
ori(c
entr
al)*tr
e(w
-k)
ori(c
entr
al)*tr
e(s
wk)
ori(c
entr
al)*tr
e(s
-k)
ori(s
outh
)*tr
e(w
-a)
ori(s
outh
)*tr
e(w
-k)
ori
(south
)*tr
e(s
wk)
ori(s
outh
)*tr
e(s
-k)
%
Figure 20. Coefficients of linear terms and interaction terms using all the un-
treated spruce samples, with the average MC as the response variable. Expla-
nations of the terms are found in Table 4.
As was observed in the PCA models in Paper II, samples from the central
stand had a large significant negative coefficient, meaning they had a signifi-
cantly lower MC than the average. The opposite holds for samples from the
northern stand, which had a large positive coefficient, i.e. a high average MC.
61
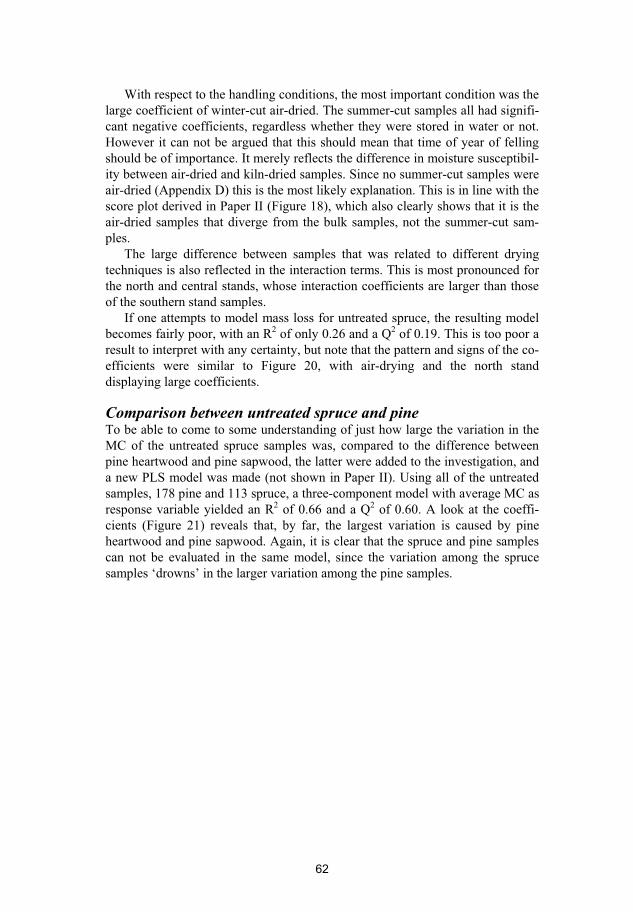
62
With respect to the handling conditions, the most important condition was the
large coefficient of winter-cut air-dried. The summer-cut samples all had signifi-
cant negative coefficients, regardless whether they were stored in water or not.
However it can not be argued that this should mean that time of year of felling
should be of importance. It merely reflects the difference in moisture susceptibil-
ity between air-dried and kiln-dried samples. Since no summer-cut samples were
air-dried (Appendix D) this is the most likely explanation. This is in line with the
score plot derived in Paper II (Figure 18), which also clearly shows that it is the
air-dried samples that diverge from the bulk samples, not the summer-cut sam-
ples.
The large difference between samples that was related to different drying
techniques is also reflected in the interaction terms. This is most pronounced for
the north and central stands, whose interaction coefficients are larger than those
of the southern stand samples.
If one attempts to model mass loss for untreated spruce, the resulting model
becomes fairly poor, with an R2 of only 0.26 and a Q2 of 0.19. This is too poor a
result to interpret with any certainty, but note that the pattern and signs of the co-
efficients were similar to Figure 20, with air-drying and the north stand
displaying large coefficients.
Comparison between untreated spruce and pine To be able to come to some understanding of just how large the variation in the
MC of the untreated spruce samples was, compared to the difference between
pine heartwood and pine sapwood, the latter were added to the investigation, and
a new PLS model was made (not shown in Paper II). Using all of the untreated
samples, 178 pine and 113 spruce, a three-component model with average MC as
response variable yielded an R2 of 0.66 and a Q2 of 0.60. A look at the coeffi-
cients (Figure 21) reveals that, by far, the largest variation is caused by pine
heartwood and pine sapwood. Again, it is clear that the spruce and pine samples
can not be evaluated in the same model, since the variation among the spruce
samples ‘drowns’ in the larger variation among the pine samples.
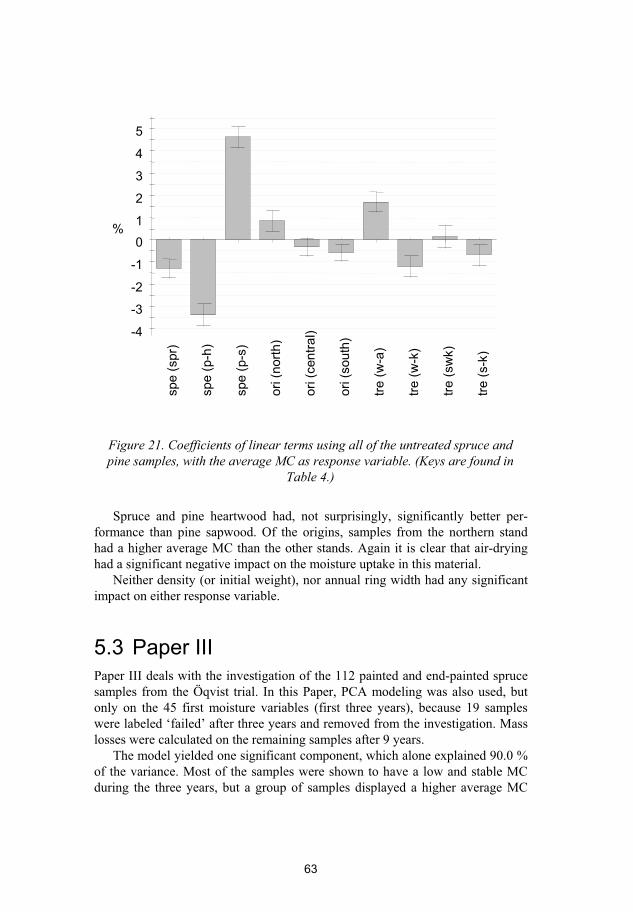
-4
-3
-2
-1
0
1
2
3
4
5
sp
e(s
pr)
sp
e(p
-h)
sp
e(p
-s)
ori
(nort
h)
ori
(cen
tra
l)
ori
(sou
th)
tre
(w-a
)
tre
(w-k
)
tre
(sw
k)
tre
(s-k
)
%
Figure 21. Coefficients of linear terms using all of the untreated spruce and
pine samples, with the average MC as response variable. (Keys are found in
Table 4.)
Spruce and pine heartwood had, not surprisingly, significantly better per-
formance than pine sapwood. Of the origins, samples from the northern stand
had a higher average MC than the other stands. Again it is clear that air-drying
had a significant negative impact on the moisture uptake in this material.
Neither density (or initial weight), nor annual ring width had any significant
impact on either response variable.
5.3 Paper III
Paper III deals with the investigation of the 112 painted and end-painted spruce
samples from the Öqvist trial. In this Paper, PCA modeling was also used, but
only on the 45 first moisture variables (first three years), because 19 samples
were labeled ‘failed’ after three years and removed from the investigation. Mass
losses were calculated on the remaining samples after 9 years.
The model yielded one significant component, which alone explained 90.0 %
of the variance. Most of the samples were shown to have a low and stable MC
during the three years, but a group of samples displayed a higher average MC
63
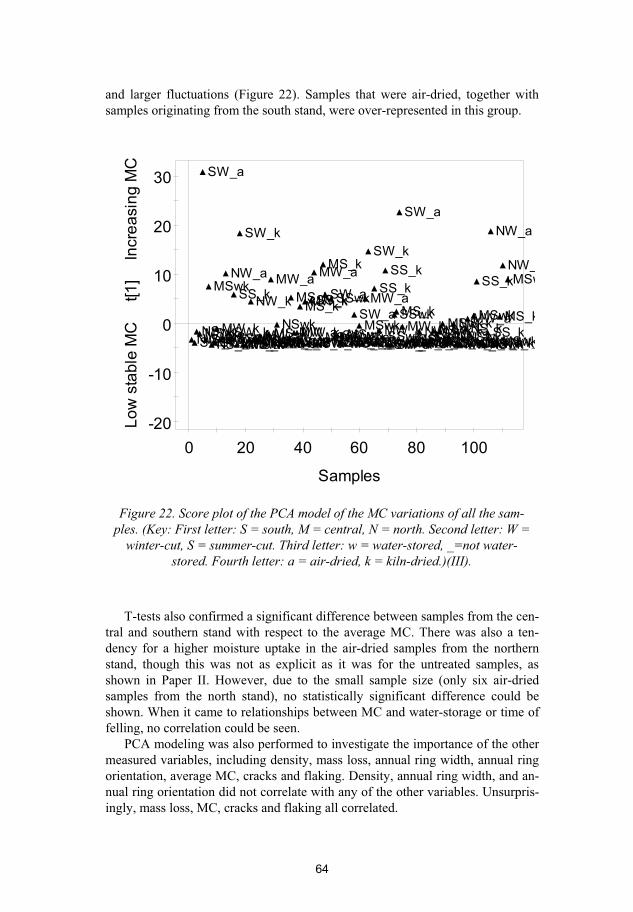
and larger fluctuations (Figure 22). Samples that were air-dried, together with
samples originating from the south stand, were over-represented in this group.
-20
-10
0
10
20
30
0 20 40 60 80 100
Lo
w s
tab
le M
C t[1
] In
cre
asin
g M
C
Samples
NW_aSW_kNSwkMS_k
SW_a
SW_k
MSwk
NS_kSW_a
MW_kMSwkNS_k
NW_a
SW_kSSwk
SS_k
MW_a
SW_k
MSwkMS_kSW_a
NW_k
MSwkMS_kMW_aNW_kNSwkMS_k
MW_a
SW_k
NSwk
MS_kMW_aNW_kMSwk
MS_k
MW_aMW_k
MS_k
SW_a
MW_k
NSwk
SS_k
MW_a
SW_kMSwk
MS_k
SW_a
MW_k
SSwk
MS_kSW_aSW_kMSwkMS_kNW_aSW_k
SW_a
SW_k
MSwk
MS_k
MW_a
SW_k
MSwk
SS_k
MW_aMW_kSSwk
SS_k
SW_aSW_k
SSwkMS_k
SW_a
MW_k
MW_aMW_kMSwkSS_kMW_a
NW_k
MSwkMS_kSW_aMW_kNSwkSS_kMW_k
MSwk
SS_kNW_aMW_k
MS_k
SW_aMW_kNSwkNS_kMW_a
NW_k
MSwk
SS_k
MW_aSW_kNSwk
SS_k
NW_a
SW_kMSwk
MS_k
NW_
NW_
MSw
Figure 22. Score plot of the PCA model of the MC variations of all the sam-
ples. (Key: First letter: S = south, M = central, N = north. Second letter: W =
winter-cut, S = summer-cut. Third letter: w = water-stored, _=not water-
stored. Fourth letter: a = air-dried, k = kiln-dried.)(III).
T-tests also confirmed a significant difference between samples from the cen-
tral and southern stand with respect to the average MC. There was also a ten-
dency for a higher moisture uptake in the air-dried samples from the northern
stand, though this was not as explicit as it was for the untreated samples, as
shown in Paper II. However, due to the small sample size (only six air-dried
samples from the north stand), no statistically significant difference could be
shown. When it came to relationships between MC and water-storage or time of
felling, no correlation could be seen.
PCA modeling was also performed to investigate the importance of the other
measured variables, including density, mass loss, annual ring width, annual ring
orientation, average MC, cracks and flaking. Density, annual ring width, and an-
nual ring orientation did not correlate with any of the other variables. Unsurpris-
ingly, mass loss, MC, cracks and flaking all correlated.
64
65
5.4 Paper IV
All of the pine samples from the Öqvist investigation were evaluated in Paper IV
(see 4.1 and 4.3). The material consisted of 566 samples, both sapwood and
heartwood samples. The samples were untreated, painted and end-painted,
painted and end-dipped in oil, or painted but not end-sealed, water stored or not
and kiln- or air-dried (Appendix D).
Several PCA models were conducted. One model contained all of the sam-
ples, and separate models contained the untreated samples, the painted end-
painted samples, and one model with only painted end-dipped, and painted not
end-sealed samples.
Here only the first PCA model, which summarizes all of the samples, is rep-
resented. This model consisted of two components, which together explained
94.6 % of the total variance. The score plot (Figure 23) can be interpreted by
looking at some selected sample’s MC (encircled in Figure 23) over time, shown
in Figure 24.
Since the sapwood samples displayed a large spread, it was evident that they
were the main contributors to the model. Regardless of treatment or origin, the
heartwood samples had low and stable MC dynamics. The painted end-painted
samples are found at the upper left of Figure 23, with the heartwood samples
more to the left than the sapwood. This means that even if the sapwood was
painted with a low permeable paint, the heartwood samples performed better.
Comparing painted heartwood to untreated heartwood, the untreated heartwood
had also a low average MC, but a slightly more fluctuating MC.
The untreated sapwood had a large spread and a high MC. Sapwood samples
that had been end-sealed by dipping in oil are found in the upper right in Figure
23. They showed a massive water uptake after some time, probably due to the
limited effect of the oil treatment (Figure 24). The painted not end-sealed sap-
wood samples displayed a MC dynamics with a high average MC and large fluc-
tuations. Even so, in terms of moisture uptake, sapwood performed better when it
was untreated compared to the painted samples without a good end-sealing (Fig-
ure 23 and 24).
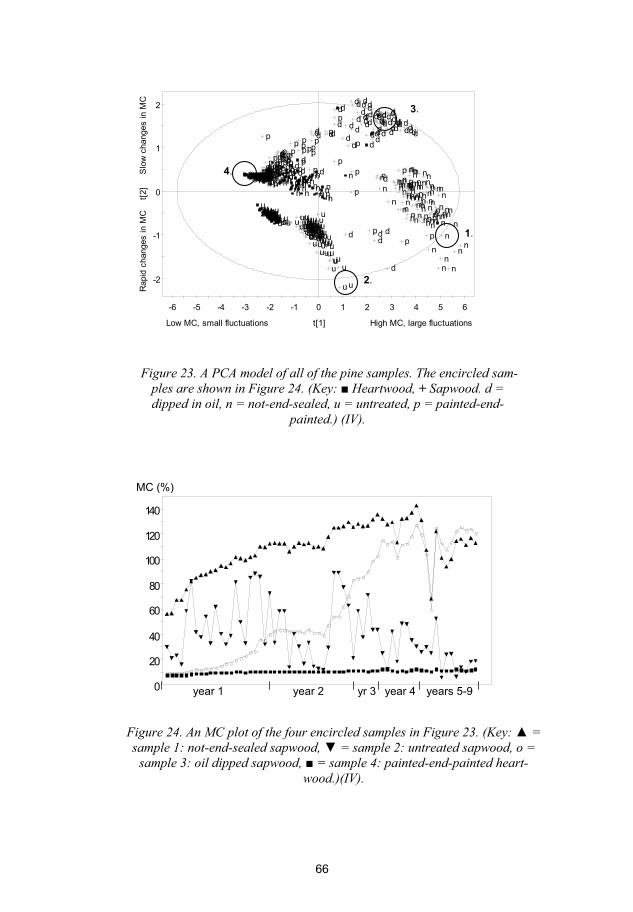
-2
-1
0
1
2
-6 -5 -4 -3 -2 -1 0 1 2 3 4 5 6
Rapid
changes in M
C
t[
2]
Slo
w c
hanges in M
C
Low MC, small fluctuations t[1] High MC, large fluctuations
p d
uu
p
n
d
n
ppn
d n
n
uu
pp dnn
uu
pp d nn
uu
pp
d
nn
p
uu
pp
u
d
n
uu
u
p
n
ppp p
d
nn
uu
pp
d
d
nn
uu
pp dn
n
uu
ppd
n
n
u
d
u
p pd
n
n
u
n
u
pp
d
n
uu
pp
d
n
uu
pp n
uu
pp
n
uu
pp
uu
pp
u
n
uu
p
u
p
n
p
uu
pppn
uu
pp n
uu
pp
u
pn
uu
p
n
u
u
p
n
d
uu
p
n
uu
pn
uuu
pp
d
d
nn
uu
pp
d n
nn
n
u
u
u
u
d
d
n
n
d
n
pp
pp
d
d
d
nnn
n
n
uu uu
n
pp
pp
dd d
n
n
n
n
n
uuu
u
n
pp
pp
d
d
u
d
n
n
n
n
uuu
u
u
pp
p
d
u
d
d
n
n
nn
uu
u
u
u
pp
p
d
d
d
n
n
n
n
u
u
u
u
d
d
n
n
d
n
p
pp
p
d
d
d
n
n
nn
u
p
u
u
u
p
p
ppp
d
d
n
n
n
p
n
u
u
u
u
p
pp
pp
d
d
d
n
d
n
n
n
u
uu
u
p
d
p
p
pp
d
d
dd
nn
n
n
u
uu
u
p
p
p
d
dd
n
n
n
n
uu
uu
dd
n
n
d
pp
n
p
p
n
n
u
uuu
np
p
p
p
n
n
n
u
u
u
u
n
p
ppp
d
nn
u
u
u
u u
p
p
p
d
p
u
nn
uuuu
u
p
p
p
d
n
nu
uu
u
u
p
p
p
p
d
n
n
uu
u
u
pp
pp
d
n
n
uu
u
u
p
ppp
d
n
n
uuuu
pp
p
p
d
n
n
p
u
u
uu
p
p
p
p
nn
u
u
u
u
p
p p
p
p
p
d
n
n
uu
u
d
u
p
pp
p
dd
n
n
u
uu
u
p
d
ppp
d
n
n
u
uu
u
p
p
p
p
d
n
n
u
uuu
pp p
n
u
uu
u
n
n
n
p
n
u
u
u
u
p
ppp
d
d
d
n
d
nn
nu
u
u
u
d
pp
p
d
d
d
n
4.
2.
1.
3.
Figure 23. A PCA model of all of the pine samples. The encircled sam-
ples are shown in Figure 24. (Key: Heartwood, + Sapwood. d =
dipped in oil, n = not-end-sealed, u = untreated, p = painted-end-
painted.) (IV).
0
20
40
60
80
100
120
140
MC (%)
year 1 year 2 yr 3 year 4 years 5-9
Figure 24. An MC plot of the four encircled samples in Figure 23. (Key: =
sample 1: not-end-sealed sapwood, = sample 2: untreated sapwood, o =
sample 3: oil dipped sapwood, = sample 4: painted-end-painted heart-
wood.)(IV).
66
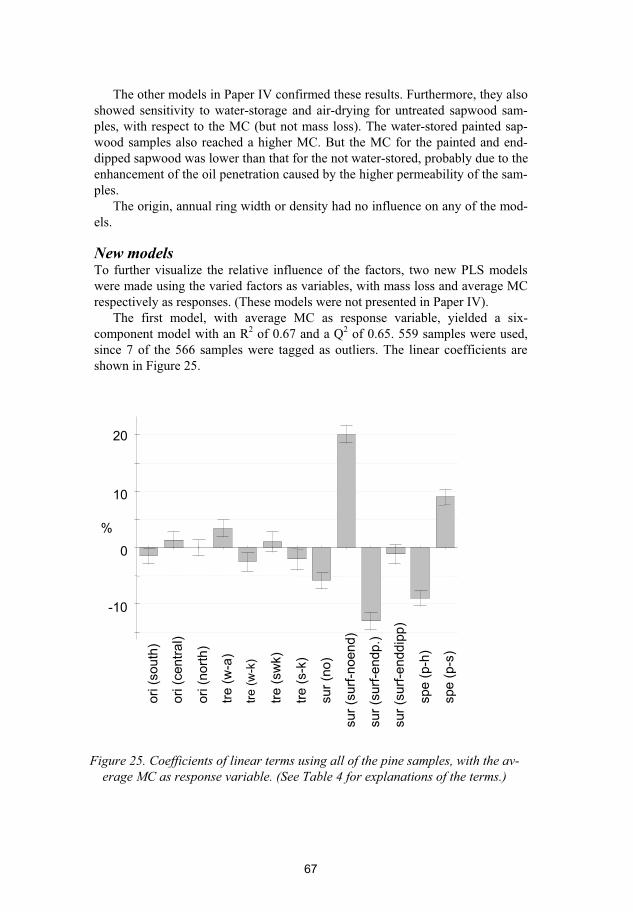
The other models in Paper IV confirmed these results. Furthermore, they also
showed sensitivity to water-storage and air-drying for untreated sapwood sam-
ples, with respect to the MC (but not mass loss). The water-stored painted sap-
wood samples also reached a higher MC. But the MC for the painted and end-
dipped sapwood was lower than that for the not water-stored, probably due to the
enhancement of the oil penetration caused by the higher permeability of the sam-
ples.
The origin, annual ring width or density had no influence on any of the mod-
els.
New models To further visualize the relative influence of the factors, two new PLS models
were made using the varied factors as variables, with mass loss and average MC
respectively as responses. (These models were not presented in Paper IV).
The first model, with average MC as response variable, yielded a six-
component model with an R2 of 0.67 and a Q2 of 0.65. 559 samples were used,
since 7 of the 566 samples were tagged as outliers. The linear coefficients are
shown in Figure 25.
-10
0
10
20
ori
(south
)
ori (
centr
al)
ori
(nort
h)
tre
(w
-a)
tre
(w
-k)
tre (
sw
k)
tre (
s-k
)
sur
(no)
sur
(surf
-noend)
sur
(surf
-endp.)
sur
(surf
-enddip
p)
spe (
p-h
)
spe (
p-s
)
%
Figure 25. Coefficients of linear terms using all of the pine samples, with the av-
erage MC as response variable. (See Table 4 for explanations of the terms.)
67
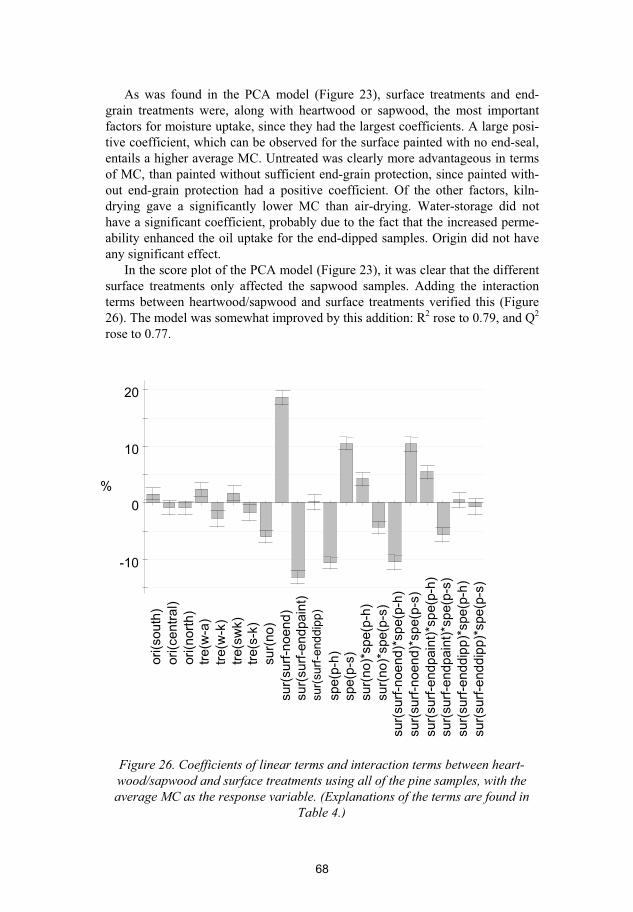
As was found in the PCA model (Figure 23), surface treatments and end-
grain treatments were, along with heartwood or sapwood, the most important
factors for moisture uptake, since they had the largest coefficients. A large posi-
tive coefficient, which can be observed for the surface painted with no end-seal,
entails a higher average MC. Untreated was clearly more advantageous in terms
of MC, than painted without sufficient end-grain protection, since painted with-
out end-grain protection had a positive coefficient. Of the other factors, kiln-
drying gave a significantly lower MC than air-drying. Water-storage did not
have a significant coefficient, probably due to the fact that the increased perme-
ability enhanced the oil uptake for the end-dipped samples. Origin did not have
any significant effect.
In the score plot of the PCA model (Figure 23), it was clear that the different
surface treatments only affected the sapwood samples. Adding the interaction
terms between heartwood/sapwood and surface treatments verified this (Figure
26). The model was somewhat improved by this addition: R2 rose to 0.79, and Q2
rose to 0.77.
-10
0
10
20
ori
(south
)
ori
(centr
al)
ori
(nort
h)
tre(w
-a)
tre
(w-k
)
tre(s
wk)
tre(s
-k)
sur(
no)
sur(
surf
-noend)
sur(
surf
-endpain
t)
su
r(su
rf-e
nd
dip
p)
spe(p
-h)
spe(p
-s)
sur(
no)*
spe(p
-h)
sur(
no)*
spe(p
-s)
sur(
surf
-noend)*
sp
e(p
-h)
sur(
surf
-noend)*
sp
e(p
-s)
sur(
surf
-endpain
t)*sp
e(p
-h)
sur(
surf
-endpain
t)*sp
e(p
-s)
sur(
surf
-enddip
p)*
spe(p
-h)
sur(
surf
-enddip
p)*
spe(p
-s)
%
Figure 26. Coefficients of linear terms and interaction terms between heart-
wood/sapwood and surface treatments using all of the pine samples, with the
average MC as the response variable. (Explanations of the terms are found in
Table 4.)
68
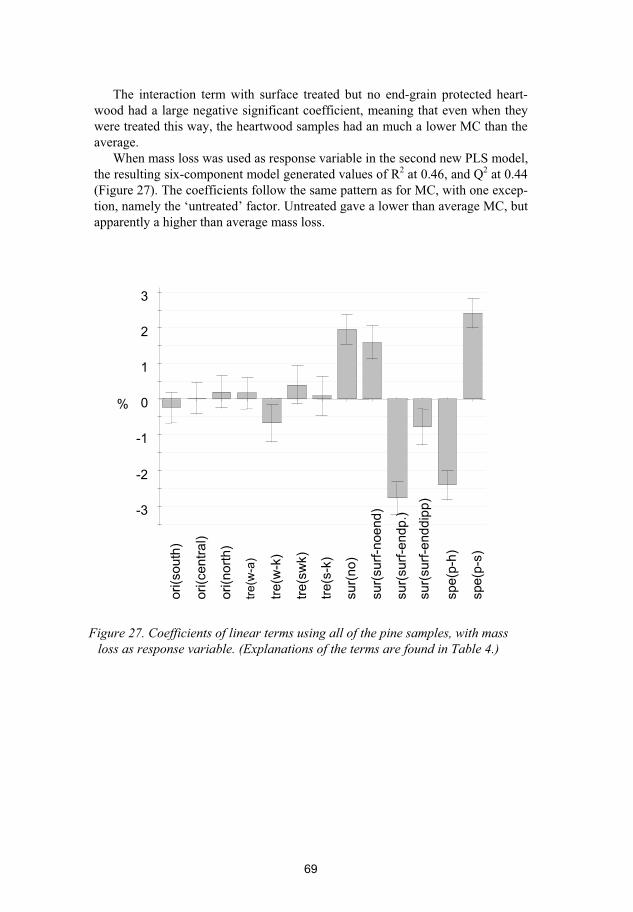
The interaction term with surface treated but no end-grain protected heart-
wood had a large negative significant coefficient, meaning that even when they
were treated this way, the heartwood samples had an much a lower MC than the
average.
When mass loss was used as response variable in the second new PLS model,
the resulting six-component model generated values of R2 at 0.46, and Q2 at 0.44
(Figure 27). The coefficients follow the same pattern as for MC, with one excep-
tion, namely the ‘untreated’ factor. Untreated gave a lower than average MC, but
apparently a higher than average mass loss.
69
-3
-2
-1
0
1
2
3
ori
(south
)
ori(c
entr
al)
ori
(nort
h)
tre
(w-a
)
tre
(w-k
)
tre(s
wk)
tre(s
-k)
sur(
no)
sur(
surf
-noend)
sur(
surf
-endp.)
sur(
surf
-enddip
p)
spe(p
-h)
spe(p
-s)
%
Figure 27. Coefficients of linear terms using all of the pine samples, with mass
loss as response variable. (Explanations of the terms are found in Table 4.)
5.5 Paper V
The aim of Paper V was to describe the new accelerated test method, Mycologg,
and to compare it to experimental results from the Johansson outdoor exposure.
Pine heartwood and sapwood samples, subjected to the Mycologg test (see 4.5),
were compared to the sample replicas that had been exposed for 26 months in the
Johansson trial. The results from the Mycologg were congruent with the Johans-
son trial, with a lower mould and sapstain growth and lower average MC for the
heartwood samples (Table 6 and 7). After 10 weeks in the Mycologg, the aver-
age fungal discoloration index were slightly higher than the average for the sap-
wood samples in the Johansson method. The Mycologg sapwood samples were
examined with a microscope, and several species of mould and sapstain were
found. In addition, early signs of soft rot were also evident. Since the Johansson
samples are in an ongoing trial, no examination of different fungi was performed
at this time. However, several species of discolouring fungi were found to be
present after an ocular inspection.
With respect to their moisture content, the heartwood samples in both trials
had a low and stable MC. Note, however, that the Johansson samples had a
‘moisture trap’ and the MC was measured as an average of the whole sample. In
the Mycologg, there were no moisture traps, and the MC is measured at one
point in each sample, three mm from the surface.
Table 6. Summary of the pine samples that were investigated in the Mycologg.
Fungal discoloration after 6, 8 and 10 weeks (V).
Mycologg N Ring
width
Density 6
weeks
8
weeks
10
weeks
MC
(%)
Heartwood 55 2.0 505.7 0.73 0.96 0.98 19.2
Sapwood 5 1.4 591.4 2.75 3.00 3.00 26.7
Table 7. Summary of the pine samples in the Johansson trial. Fungal discolora-
tion after 12, 16 and 26 months (V).
Outdoor
exposure
N Ring
width
Density 12
months
16
months
26
months
MC
(%)
Heartwood 54 2.2 513.2 1.20 1.37 1.43 25.1
Sapwood 27 1.4 535.0 2.19 2.59 2.74 46.0
70
5.6 Paper VI-VII
Paper VI and VII deals with spruce samples that were subjected to fungal spores
and moisture cycles in the Mycologg method. Samples with both vertical and
horizontal annual rings were investigated. In Tables 8 and 9, summaries of all the
samples are shown.
Table 8. Summary of vertical samples, average fungal growth after 3 months.
H=heartwood, S=sapwood)(VI).
Name N Stand Average
MC (%)
Ring width
(mm)
Density
(kg/m3)
1H 4 F 19.7 2.1 445.7
1S 4 F 20.0 1.5 438.7
9H 6 F 18.1 1.9 480.6
9S 6 F 21.5 1.8 499.3
10H 7 F 17.0 1.7 429.2
10S 7 F 18.1 1.4 438.0
30H 6 E 17.8 1.8 344.9
30S 6 E 19.8 1.9 396.5
42H 7 E 17.8 2.0 297.7
42S 7 E 20.2 2.0 366.7
Table 9. Summary of horizontal samples, average fungal growth after 3 months.
H=heartwood, S=sapwood) (VII).
Name N Stand Average
MC (%)
Ring width
(mm)Density
(kg/m3)
122H 5 Q 15.8 2.14 389.6
122S 5 Q 15.9 1.88 402.3
144S 5 Q 17.2 1.45 421.8
161H 8 K 15.5 3.40 399.9
161S 5 K 17.4 2.75 354.2
168H 7 K 15.0 4.38 335.1
168S 5 K 16.8 1.36 405.8
Pine H 5 - 15.0 0.79 405.8
Pine S 5 - 16.5 1.35 457.5
With respect to fungal growth, sapwood displayed significantly (according to
the non-parametric Mann-Whitney test), more growth of discolouring fungi than
heartwood (Table 10). There was also a tendency, however not statistically sig-
nificant, that samples with horizontal annual rings had more fungal growth than
samples with vertical annual rings. Either origin, annual ring width or density
had any significant influence on fungal growth.
71
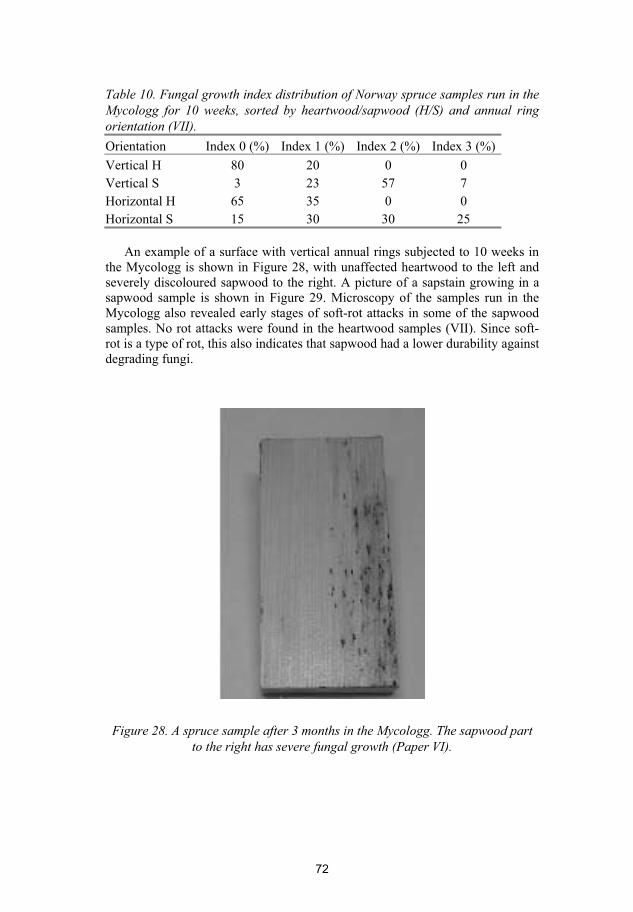
Table 10. Fungal growth index distribution of Norway spruce samples run in the
Mycologg for 10 weeks, sorted by heartwood/sapwood (H/S) and annual ring
orientation (VII).
Orientation Index 0 (%) Index 1 (%) Index 2 (%) Index 3 (%)
Vertical H 80 20 0 0
Vertical S 3 23 57 7
Horizontal H 65 35 0 0
Horizontal S 15 30 30 25
An example of a surface with vertical annual rings subjected to 10 weeks in
the Mycologg is shown in Figure 28, with unaffected heartwood to the left and
severely discoloured sapwood to the right. A picture of a sapstain growing in a
sapwood sample is shown in Figure 29. Microscopy of the samples run in the
Mycologg also revealed early stages of soft-rot attacks in some of the sapwood
samples. No rot attacks were found in the heartwood samples (VII). Since soft-
rot is a type of rot, this also indicates that sapwood had a lower durability against
degrading fungi.
Figure 28. A spruce sample after 3 months in the Mycologg. The sapwood part
to the right has severe fungal growth (Paper VI).
72
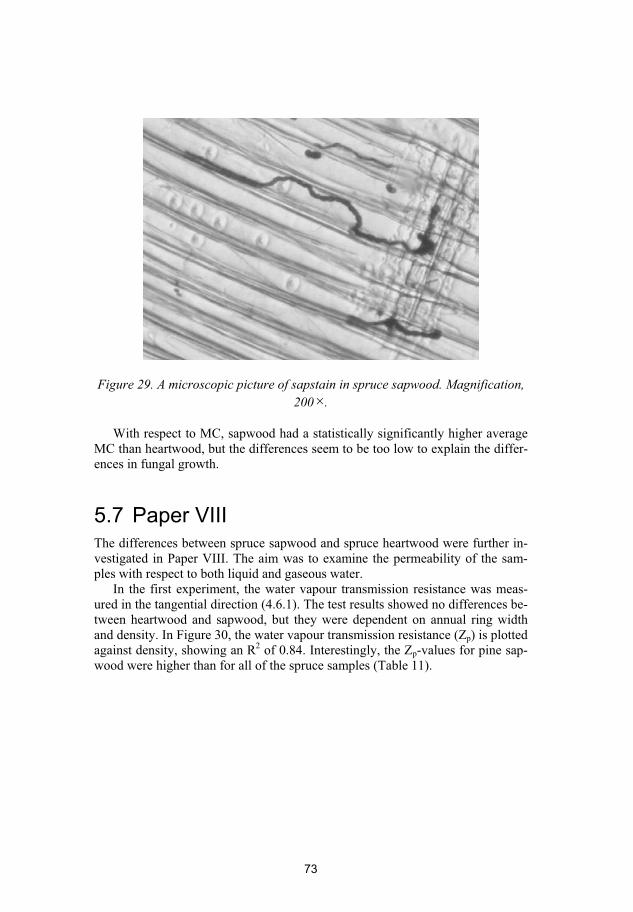
73
Figure 29. A microscopic picture of sapstain in spruce sapwood. Magnification,
200×.
With respect to MC, sapwood had a statistically significantly higher average
MC than heartwood, but the differences seem to be too low to explain the differ-
ences in fungal growth.
5.7 Paper VIII
The differences between spruce sapwood and spruce heartwood were further in-
vestigated in Paper VIII. The aim was to examine the permeability of the sam-
ples with respect to both liquid and gaseous water.
In the first experiment, the water vapour transmission resistance was meas-
ured in the tangential direction (4.6.1). The test results showed no differences be-
tween heartwood and sapwood, but they were dependent on annual ring width
and density. In Figure 30, the water vapour transmission resistance (Zp) is plotted
against density, showing an R2 of 0.84. Interestingly, the Zp-values for pine sap-
wood were higher than for all of the spruce samples (Table 11).
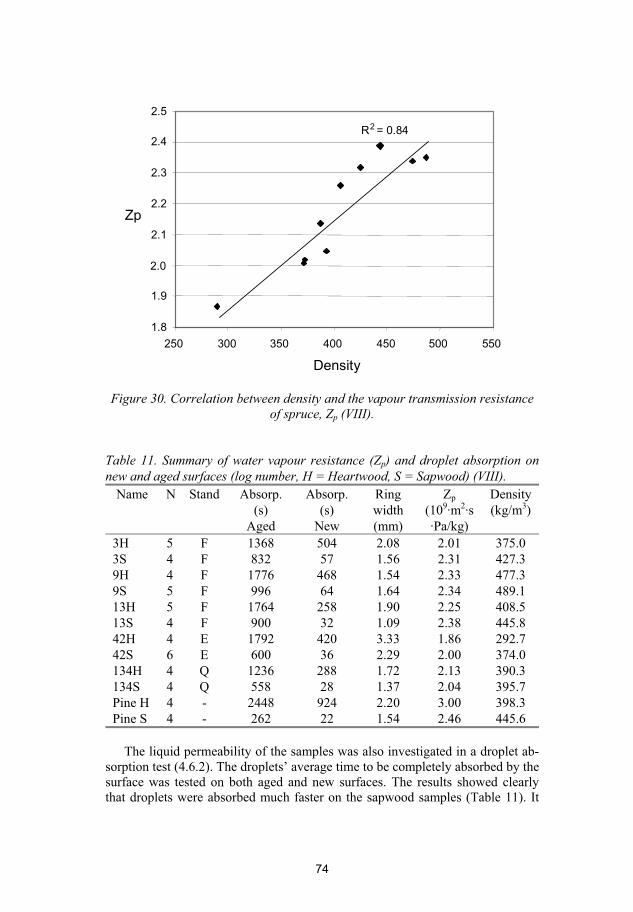
R2 = 0.84
1.8
1.9
2.0
2.1
2.2
2.3
2.4
2.5
250 300 350 400 450 500 550
Density
Zp
Figure 30. Correlation between density and the vapour transmission resistance
of spruce, Zp (VIII).
Table 11. Summary of water vapour resistance (Zp) and droplet absorption on
new and aged surfaces (log number, H = Heartwood, S = Sapwood) (VIII).
Name N Stand Absorp.
(s)
Aged
Absorp.
(s)
New
Ring
width
(mm)
Zp
(109·m2·s
·Pa/kg)
Density
(kg/m3)
3H 5 F 1368 504 2.08 2.01 375.0
3S 4 F 832 57 1.56 2.31 427.3
9H 4 F 1776 468 1.54 2.33 477.3
9S 5 F 996 64 1.64 2.34 489.1
13H 5 F 1764 258 1.90 2.25 408.5
13S 4 F 900 32 1.09 2.38 445.8
42H 4 E 1792 420 3.33 1.86 292.7
42S 6 E 600 36 2.29 2.00 374.0
134H 4 Q 1236 288 1.72 2.13 390.3
134S 4 Q 558 28 1.37 2.04 395.7
Pine H 4 - 2448 924 2.20 3.00 398.3
Pine S 4 - 262 22 1.54 2.46 445.6
The liquid permeability of the samples was also investigated in a droplet ab-
sorption test (4.6.2). The droplets’ average time to be completely absorbed by the
surface was tested on both aged and new surfaces. The results showed clearly
that droplets were absorbed much faster on the sapwood samples (Table 11). It
74
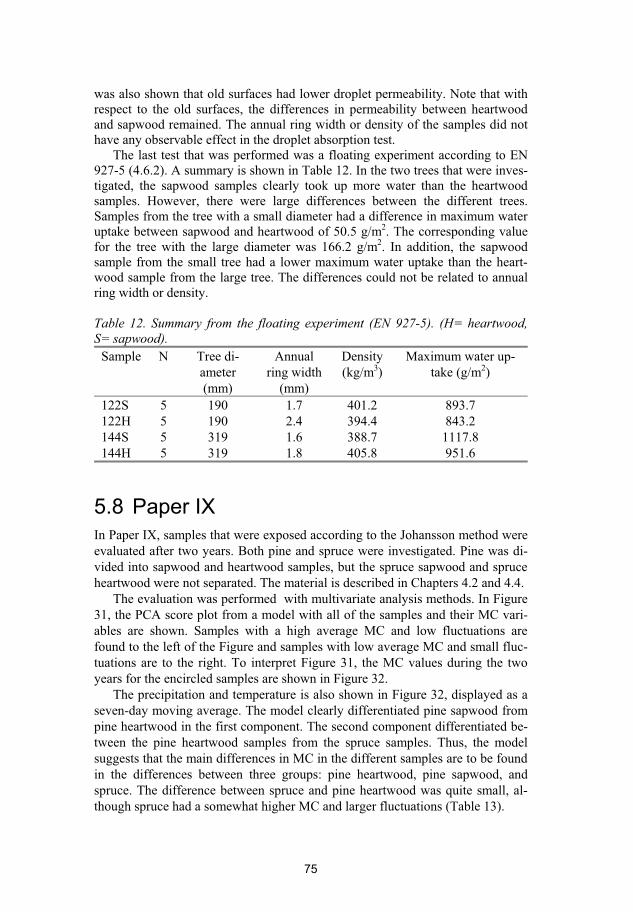
75
was also shown that old surfaces had lower droplet permeability. Note that with
respect to the old surfaces, the differences in permeability between heartwood
and sapwood remained. The annual ring width or density of the samples did not
have any observable effect in the droplet absorption test.
The last test that was performed was a floating experiment according to EN
927-5 (4.6.2). A summary is shown in Table 12. In the two trees that were inves-
tigated, the sapwood samples clearly took up more water than the heartwood
samples. However, there were large differences between the different trees.
Samples from the tree with a small diameter had a difference in maximum water
uptake between sapwood and heartwood of 50.5 g/m2. The corresponding value
for the tree with the large diameter was 166.2 g/m2. In addition, the sapwood
sample from the small tree had a lower maximum water uptake than the heart-
wood sample from the large tree. The differences could not be related to annual
ring width or density.
Table 12. Summary from the floating experiment (EN 927-5). (H= heartwood,
S= sapwood).
Sample N Tree di-
ameter
(mm)
Annual
ring width
(mm)
Density
(kg/m3)
Maximum water up-
take (g/m2)
122S 5 190 1.7 401.2 893.7
122H 5 190 2.4 394.4 843.2
144S 5 319 1.6 388.7 1117.8
144H 5 319 1.8 405.8 951.6
5.8 Paper IX
In Paper IX, samples that were exposed according to the Johansson method were
evaluated after two years. Both pine and spruce were investigated. Pine was di-
vided into sapwood and heartwood samples, but the spruce sapwood and spruce
heartwood were not separated. The material is described in Chapters 4.2 and 4.4.
The evaluation was performed with multivariate analysis methods. In Figure
31, the PCA score plot from a model with all of the samples and their MC vari-
ables are shown. Samples with a high average MC and low fluctuations are
found to the left of the Figure and samples with low average MC and small fluc-
tuations are to the right. To interpret Figure 31, the MC values during the two
years for the encircled samples are shown in Figure 32.
The precipitation and temperature is also shown in Figure 32, displayed as a
seven-day moving average. The model clearly differentiated pine sapwood from
pine heartwood in the first component. The second component differentiated be-
tween the pine heartwood samples from the spruce samples. Thus, the model
suggests that the main differences in MC in the different samples are to be found
in the differences between three groups: pine heartwood, pine sapwood, and
spruce. The difference between spruce and pine heartwood was quite small, al-
though spruce had a somewhat higher MC and larger fluctuations (Table 13).
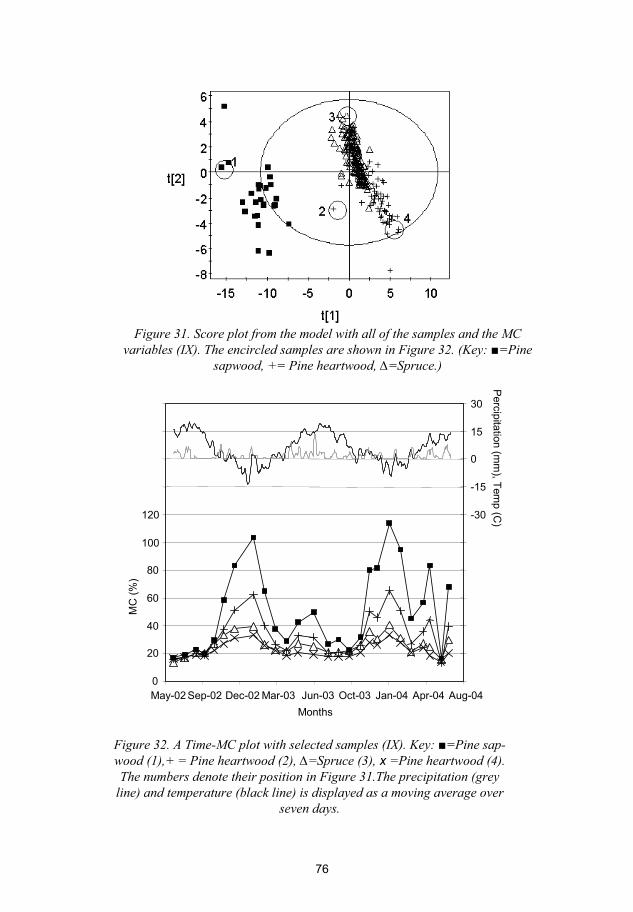
Figure 31. Score plot from the model with all of the samples and the MC
variables (IX). The encircled samples are shown in Figure 32. (Key: =Pine
sapwood, += Pine heartwood, =Spruce.)
0
20
40
60
80
100
120
May-02 Sep-02 Dec-02 Mar-03 Jun-03 Oct-03 Jan-04 Apr-04 Aug-04
Months
MC
(%
)
-30
-15
0
15
30
Perc
ipita
tion (m
m), T
em
p (C
)
Figure 32. A Time-MC plot with selected samples (IX). Key: =Pine sap-
wood (1),+ = Pine heartwood (2), =Spruce (3), x =Pine heartwood (4).
The numbers denote their position in Figure 31.The precipitation (grey
line) and temperature (black line) is displayed as a moving average over
seven days.
76
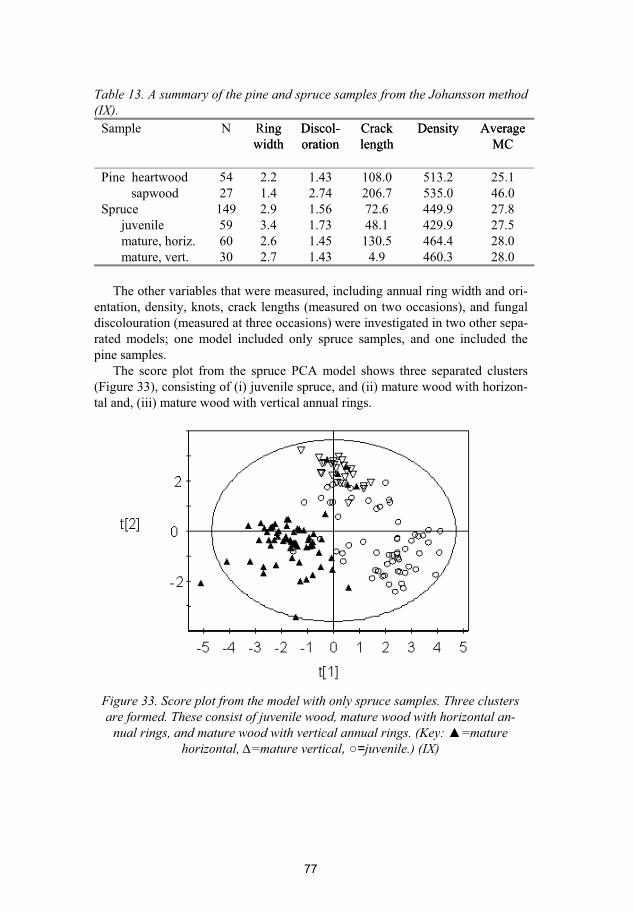
Table 13. A summary of the pine and spruce samples from the Johansson method
(IX).
Sample N Ring
width
ing
width
Discol-
oration
Discol-
oration
Crack Crack
lengthlength
DensityDensity Average
MC
Average
MC
Pine heartwood 54 2.2 1.43 108.0 513.2 25.1
sapwood 27 1.4 2.74 206.7 535.0 46.0
Spruce 149 2.9 1.56 72.6 449.9 27.8
juvenile 59 3.4 1.73 48.1 429.9 27.5
mature, horiz. 60 2.6 1.45 130.5 464.4 28.0
mature, vert. 30 2.7 1.43 4.9 460.3 28.0
The other variables that were measured, including annual ring width and ori-
entation, density, knots, crack lengths (measured on two occasions), and fungal
discolouration (measured at three occasions) were investigated in two other sepa-
rated models; one model included only spruce samples, and one included the
pine samples.
The score plot from the spruce PCA model shows three separated clusters
(Figure 33), consisting of (i) juvenile spruce, and (ii) mature wood with horizon-
tal and, (iii) mature wood with vertical annual rings.
Figure 33. Score plot from the model with only spruce samples. Three clusters
are formed. These consist of juvenile wood, mature wood with horizontal an-
nual rings, and mature wood with vertical annual rings. (Key: =mature
horizontal, =mature vertical, =juvenile.) (IX)
77
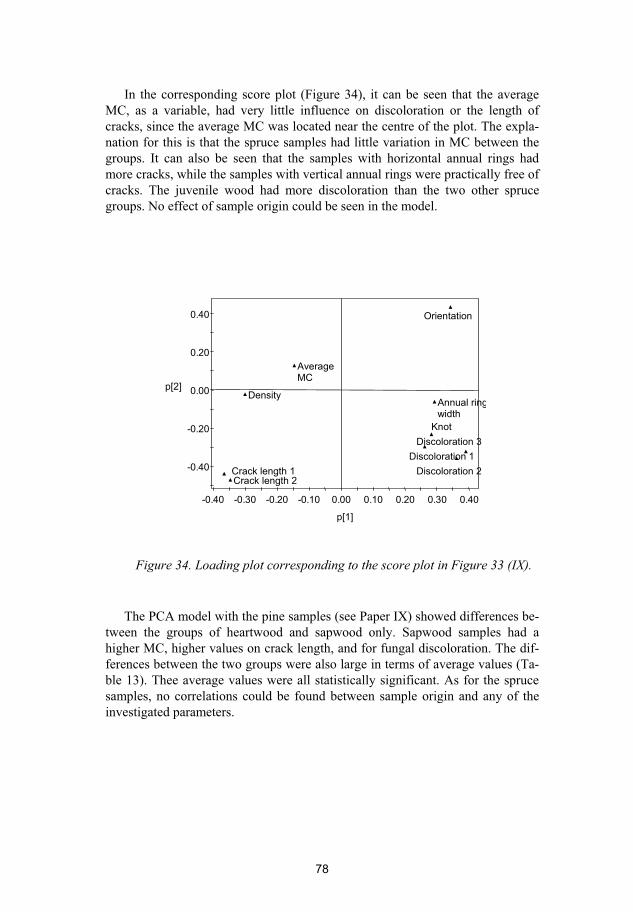
In the corresponding score plot (Figure 34), it can be seen that the average
MC, as a variable, had very little influence on discoloration or the length of
cracks, since the average MC was located near the centre of the plot. The expla-
nation for this is that the spruce samples had little variation in MC between the
groups. It can also be seen that the samples with horizontal annual rings had
more cracks, while the samples with vertical annual rings were practically free of
cracks. The juvenile wood had more discoloration than the two other spruce
groups. No effect of sample origin could be seen in the model.
78
-0.40
-0.20
0.00
0.20
0.40
-0.40 -0.30 -0.20 -0.10 0.00 0.10 0.20 0.30 0.40
p[2]
p[1]
Orientation
Annual ring
width
Density
Knot
Discoloration 1
Discoloration 2
Discoloration 3
Crack length 1
Crack length 2
Average
MC
Figure 34. Loading plot corresponding to the score plot in Figure 33 (IX).
The PCA model with the pine samples (see Paper IX) showed differences be-
tween the groups of heartwood and sapwood only. Sapwood samples had a
higher MC, higher values on crack length, and for fungal discoloration. The dif-
ferences between the two groups were also large in terms of average values (Ta-
ble 13). Thee average values were all statistically significant. As for the spruce
samples, no correlations could be found between sample origin and any of the
investigated parameters.
79
6. Discussion
The deployment of a multivariate analysis is necessary to obtain to a better un-
derstanding of how different factors interact and affect wood’s susceptibility to
moisture, rot fungi, and discolouring fungi. The different factors are, however,
discussed one at the time to allow the reader to follow the discussion. Since
many of the factors are dependent on each other, some overlapping in the discus-
sion is unavoidable.
6.1 Heartwood and sapwood
Pine
The difference in durability between pine heartwood and pine sapwood is a well-
known fact, since heartwood has a lower permeability, and contains larger
amounts of extractives (CEN 1994, Harju et al. 2003, Gierlinger et al. 2004b,
Venäläinen et al. 2004). It has also been shown that pine sapwood has a higher
wettability (Hameed and Roffael 1999), and therefore should reach higher MC at
the surface.
The aim of the studies that constitute this thesis was, however, not to prove
that there exists a difference between pine heartwood and pine sapwood. Instead,
the aim was to find out whether or not there were any differences in above
ground durability between different qualities of pine heartwood. Possible differ-
ences in durability were thought to depend on extractive content in general, and
pinosylvine and its derivatives in particular. Since origin and growth conditions
are known to affect these properties, the sampling procedure aimed at maximiz-
ing the variation between these parameters (see also 6.3). Even if no quantitative
analysis of extractive contents was performed, it was clear that there was indeed
a large variation in extractive contents between the different stand origins of the
material used in the Johansson test. Visually, it was clear that both the colour of
the sample, and how fatty the sawn surface on the sample was, differed a great
deal between heartwood samples of different origins.
However, no systematic difference in above ground durability could be found
between heartwood of different origins in the studies conducted in this thesis (I,
IV, IX). One explanation could be that in the above ground tests that were con-
ducted, the MC seldom exceeded the FSP, since all pine heartwood has a fair
amount of water repellent extractives. It is possible that differences in extractive
content can result in a difference in moisture uptake, and hence the samples’ du-
rability in more demanding conditions.
80
During the relatively mild conditions applied in the Öqvist method (I, IV) to
simulate above ground conditions, all of the pine heartwood samples, regardless
of their origin or any other factor, had a good durability towards rot fungi. Fur-
thermore, it was shown that painting the sample did not enhance the durability of
heartwood much, since it was durable even when left untreated.
Proper surface treatment and end-grain treatment enhances the performance
of sapwood substantially, making the difference in durability between heartwood
and sapwood much smaller, but still significant. Surface treatment with insuffi-
cient end-grain protection affects sapwood negatively much more than heart-
wood. Insufficient end-grain protection resulted in an even larger difference in
durability between untreated heartwood and sapwood. Therefore, it is not neces-
sary, for the sake of enhancing rot durability, to paint pine heartwood that is in-
tended for applications with a moderate moisture load. For sapwood, on the other
hand, it is a necessary and especially important to protect the end-grain.
Untreated pine sapwood was, not surprisingly, proven to be inadequate for
use outdoors, exposed to weather. This was shown in both field tests (reported on
in Papers I, IV, and IX). Sapwood was also shown to be more sensitive to water-
storage and air-drying than heartwood (shown in Paper IV) and resulted in
higher MC, but not higher mass loss. The fact that the mass loss was not influ-
enced was probably due to the overall low durability of sapwood. Correctly sur-
face treated, the durability and moisture sensitivity of the sapwood samples was
enhanced, but they were still significantly inferior to heartwood samples (dis-
cussed in Paper IV). In other words, the paint used in this particular test could
not make sapwood as durable as painted heartwood.
Despite the fact that heartwood has such good durability above ground, in the
sense that it does not need any additional preservative treatment, the timber sort-
ing procedures at saw mills usually do not take this into consideration. Note that
at present, timber with a large heartwood content is not more expensive than tim-
ber with a low heartwood content. One way to increase the heartwood content
and thereby make it possible to saw naturally durable planks, free of sapwood, is
to leave the trees in the forest for a longer period of time before they are felled.
Of course, without any major price differentiation between heartwood and sap-
wood, this will not happen.
Spruce
Spruce, in contrast to pine, has traditionally been regarded as a homogenous spe-
cies; without differences in properties between heartwood and sapwood. Investi-
gations into the properties of spruce heartwood and sapwood are rare. Conse-
quently, spruce heartwood and spruce sapwood were not separated in the field
test conducted in the 1980s (I, II, III,), and neither were they separated the Jo-
hansson trial (IX), since other factors were thought to be more important. Stand
origin was shown to affect the durability of spruce in the Öqvist trial (see Papers
II, III). One of the conceivable explanations of this result may lie in the possible
differences in the sapwood content of the samples from the different origins.
Therefore, in the accelerated tests, the heartwood and the sapwood separated.
The results from the Mycologg method were unambiguous; spruce heartwood
81
has a higher durability against discolouring fungi than spruce sapwood. This
holds both in the radial and tangential direction (see Papers VI, VII). These re-
sults were thought to depend on differences in moisture content at the surface.
When comparing the moisture sensitivity, again measured in the Mycologg,
sapwood had a slightly higher average MC than heartwood, measured three mm
from the surface (VI, VII). However, these differences were considered to be too
small to fully explain the higher amount of fungal growth on the sapwood.
Consequently, other aspects of moisture susceptibility were also investigated
in laboratory (VIII). Sandberg and Lindgren (2003) had shown differences in
liquid permeability in the longitude direction. In the results presented in this the-
sis, it was shown that the liquid water permeability, tested in a floating experi-
ment (EN 927-5 (CEN 2000)), differs between sapwood and heartwood in the
radial direction. The sapwood took up more water, but there were also large dif-
ferences between the two investigated trees. One source of explanation might be
attributed to differences in the heartwood quality between the different trees, for
example, the presence of transition wood in the younger tree. Similar results can
be found in Sandberg (2002).
Most importantly, it was shown the water droplet permeability is considera-
bly higher in sapwood. These results are in agreement with the results on wet-
tability in pine sapwood obtained by Hameed and Roffael (1999). The higher af-
finity to water for sapwood could be one explanation to the lower durability
against discolouring fungi in the Mycologg. According to Block (1953), the
more hygroscopic the material is, the lower RH is needed to support mould
growth.
Water vapour transmission was also investigated. Interestingly enough, it de-
pended on annual ring width and density, and was independent of the heart-
wood/sapwood distinction (VIII). The flow of water in its gaseous form is equal
in heartwood and sapwood if the density is kept constant.
The water vapour transmission resistance test, together with the droplet test,
can explain why the difference in MC of Norway spruce sapwood and heartwood
was small in the Mycologg trial. When the relative humidity is high, for example
when the mist is on in the Mycologg, the sapwood surface should become wetter
because of sapwood’s higher affinity to water. The moisture flow mechanism
into the samples is mainly diffusion, and is seemingly independent of whether
the sample consists of heartwood or sapwood. But as the sapwood samples had a
slightly thinner average annual ring width, the diffusion rate should theoretically
be slower than in the heartwood samples. Thus, at a position at three mm from
the surface, were the MC is measured, the difference at the surface had dimin-
ished to an MC of only a few percent.
It has been previously shown that heartwood and sapwood have different
chemical compositions (Ekman 1979, Bertaud and Holmbom 2004), which of
course can be another factor of importance for the observed differences in water
affinity. In the investigations accounted for in the present study, no chemical
analysis has yet been performed. More research is thus needed in order to explain
the different properties that spruce sapwood and heartwood manifest.
82
Whether or not the higher resistance towards discolouring fungi of heartwood
(when compared to sapwood) is also valid for rot fungi in a ‘real’ above ground
situation was not confirmed by these trials. However, recent studies by Sandberg
(2004) have shown that this holds for discolouring fungi in an outdoor exposure.
Discolouring fungi are often seen as markers of poor durability, also in terms of
rot. In addition, microscopy analysis of the Mycologg samples also revealed
early stages of soft-rot attacks in sapwood. Since soft-rot is a type of rot, this also
points to sapwood having a lower durability against degrading fungi.
Replica samples of the Norway spruce heartwood and sapwood samples used
in Paper VII are currently under investigation in an ongoing outdoor exposure
test (above ground) at Växjö University. The results from that study will be com-
pared to the results obtained from the Mycologg trials.
Ideally, sapwood should not be used outdoors. To be able to offer a more du-
rable assortment of heartwood planks, adequate sorting procedures at the saw-
mills are necessary. Obviously, for this to be realised, the demand and prices of
such assortments must rise.
6.2 Annual ring width and Density
Narrow annual ring width and high density is traditionally thought of as a meas-
ure of quality (Sjömar 1988). This is true when it comes to strength properties,
but this has not been proved with respect to durability (Rydell 1982, Grönlund
and Rydell 1983).
Similarly, although annual ring width and density were measured on all of
the samples in all of the trials in this thesis, no significant correlation could be
found with respect to durability of either pine or spruce (II-IV, VI-IX). There
was, however, a tendency for juvenile wood, which usually has wider annual
rings than mature wood, to display a poorer durability with respect to discolour-
ing fungi (see Paper IX). This tendency, regarding annual ring width, was how-
ever not statistically significant. It should be mentioned that no extreme annual
ring widths were examined. (In the Johansson trial, the range in annual ring
width was 1.0 - 6.3 mm for spruce, and 0.5 – 4.2 mm for pine.)
Theoretically, since latewood has a lower permeability then earlywood (Din-
woodie 2000), and the latewood width is limited by climate, a fast growing tree
with wide annual rings should have a larger percentage of earlywood, and there-
fore a higher permeability than a slow growing tree (from the same area). But, as
no correlations between annual ring width and MC, or between annual ring width
and durability could be seen in these investigations, the eventual differences are
of minor importance.
Actually, the only investigated parameter where annual ring width and den-
sity were of major importance was the water vapour transmission resistance of
spruce, Zp (VIII). The water vapour flow was much slower through high-density
wood, irrespective of that fact whether the wood was heartwood or sapwood.
Density was shown to correlate with annual ring width, which was not very
surprising. In the new material, the samples were all taken from stands that had
83
about the same growing season. Therefore, there were no large differences in
latewood percentage. If some of the samples had originated from northern Swe-
den, as were some of the samples in the old material, the correlation annual ring
width and density would probably not be as large. Trees grown in the northern
parts of Sweden naturally have a larger latewood proportion, since the growing
season is shorter (Sjöström 1981).
Interestingly, when looking at an individual stem, the average annual ring
width of heartwood is generally wider than sapwood. This is caused by the fact
that the annual ring width naturally diminishes from the pith to the bark as the
tree grows (Kollman and Côté 1984). Thus, narrow annual rings would in prac-
tice indicate a high proportion of sapwood, which is negative for the durability of
pine and spruce, at least with respect to its susceptibility to discolouring fungi,
(see Papers I, IV-VII, IX). Furthermore, since annual ring width and density are
highly correlated within the same stem, the above reasoning concerning annual
ring width can be transferred to the understanding of density. Thus, since density
increases from the pith towards the bark, the sapwood will have a higher average
density than that heartwood. Therefore, high density can indicate a high sapwood
content, which can have a negative impact on durability of both spruce and pine.
This claim is contrary to the traditional way of reasoning about wood quality.
6.3 Origin and Growth conditions
Origin and growth conditions have been shown to affect several factors, such as
sapwood content, annual ring width, density, and also chemical composition
(Yngvesson et al. 1993, Shupe et al. 1996, Almberg 1999). Therefore, our hy-
pothesis was that microbial durability could, to some extent, also be indirectly
affected by origin and growth conditions.
With respect to spruce, origin was of importance in the old material that was
investigated according to the Öqvist method (II). There, it was shown that un-
treated air-dried samples from northern Sweden showed a poorer performance
than samples from the other stands, both in terms of mass loss and a higher aver-
age MC. For kiln-dried samples, origin had no significant effect on mass loss, or
MC dynamics.
Recall that, in the old spruce material, the heartwood and the sapwood sam-
ples were not separated. Furthermore, since the samples were all taken from the
outer part of the log, it is possible that the effect of origin was in fact an effect of
different sapwood contents. This theory is supported to some degree by our in-
vestigations into the new spruce material, where the heartwood and the sapwood
samples were separated in the laboratory experiments (see Papers VI-VIII). In
these studies, it was shown that the effects on durability with respect to discol-
ouring fungi and moisture properties, origin and growth conditions are negligible
factors in comparison to the effect of the heartwood/sapwood distinction. It
should, however, be taken in account that the test methods applied in Papers VI-
VIII were under laboratory conditions. Since heartwood was proven to be more
84
durable than sapwood, at least when with respect to discolouring fungi, it is ob-
vious that origin and growth conditions will, in practice, have an impact since
they affect the proportion of heartwood content in the log.
With respect to pine, the two field tests showed no significant effect of origin
or growth conditions on above ground durability, or the samples’ susceptibility
to moisture (IV, IX). The material that was used in the Johansson method, which
was evaluated after the first two years, ought to show great variation in terms of
its chemical composition and wood properties, (based on findings by Yngvesson
et al. 1993, Shupe et al. 1996, Almberg 1999, Fries et al. 2000, Ericsson et al.
2001, and Akhter and Hale 2002b), since several trees were used from different
origins. Therefore, some systematic variation in durability, at least for heart-
wood, was expected (6.1). No such variation was found. It seems that either the
variation in the material was too low, or that the differences had no influence on
MC or mould growth. It is possible that possible differences in, for example, the-
extractive content between different origins could result in a difference in heart-
wood durability in more demanding applications. Even so, the hypothesis that
the above ground durability and moisture resistance of pine heartwood can be af-
fected in a major way by origin or stand characteristics is falsified.
6.4 Handling conditions
Pine
The durability of Scots pine heartwood proved to be practically unaffected by all
of the handling factors that were investigated (I, IV). The surface painted sam-
ples with the ends untreated, investigated in the Öqvist method, had a slightly
higher average MC, but the mass loss in the samples was not significantly
higher. This result shows again, that pine heartwood has an excellent durability
above ground when the conditions are not too demanding.
The durability of pine sapwood was mostly affected by the surface and end-
grain treatment. If sapwood is to be used outdoors, a correct surface treatment is
necessary. However, even if the durability of sapwood is remarkably enhanced
by surface treatment and end-grain treatment, its durability is still significantly
lower than that of pine heartwood (see Paper IV).
The untreated sapwood samples had a high and a fluctuating MC, but they
performed better than the painted and not end-sealed sapwood samples, which
practically never dried out (I, IV). It was also evident that the effect of the oil-
dipping only is seen for the first years. After this initial time has passed, the MC
patterns were similar to the not end-sealed samples.
As shown in the Öqvist trials, untreated sapwood samples had a lower than
average MC, but a higher than average mass loss, while the not end-sealed and
oil-dipped had both high MC and mass loss. One explanation could be that the,
for the fungi, available surface to attack, is much larger for untreated samples
than for surface treated.
85
Sapwood was also sensitive to water-storage (IV). This observation is in
agreement with Boutelje et al. (1979). The water-storage caused a higher perme-
ability and a subsequent higher moisture uptake, probably due to bacterial attack.
The surface treated and oil-dipped samples seemed to achieve a higher oil uptake
allowed by the increased permeability, and therefore they performed better than
the not water-stored samples. However, at the same time, the effect of the oil-
dipping still only lasted for a few years. The untreated water-stored samples
showed a higher MC, but interestingly, not a larger mass loss. This is probably
due to the overall bad durability of sapwood.
Air-drying led to a higher MC in the untreated pine sapwood samples (IV).
But since the kiln-dried samples also had a high MC, no differences could be
seen in terms of mass loss. A significant difference in MC between samples does
not necessarily mean that the sample with highest MC is more susceptible to
fungi, since the sample with a lower MC also can have an MC above FSP. The
results can be said to be in agreement with Rydell et al. (1981), who found no
differences in rot durability for air-dried and kiln-dried pine. Note however, as is
pointed out in the argument above, this state of affairs is probably due to the gen-
eral poor durability of sapwood. Note that, as air-drying is weather dependent,
the results presented here is only valid for this material. Accordingly, air-drying
could probably lead to both better or worse results, depending on the present
weather conditions.
Investigations on the influence of felling time on the durability of pine have
shown divergent results (Wazny and Krajewski 1984, Boutelje and Nilsson
1985). This can be due to the fact that wood cut at different times of the year is
subjected to different conditions in its subsequent handling. For example, storage
outdoors before drying can entail the risk of contamination of fungi during the
summer. In this investigation, the material was treated equally, and the felling
time was shown to have no influence on durability of pine (IV).
Spruce
Proper surface treatment and end-grain treatment were the most important factors
for durability (I). In average, the durability of surface treated and end-treated
samples was significantly better than the untreated samples. However, this was
not an unambiguous result, since a fair number of the surface treated and end-
treated samples had, for unknown reasons, such a poor durability that they were
tagged as ‘failed’ and they were removed from the investigation after only three
years.
The MC of the untreated spruce samples was higher for the air-dried samples
from all of the origins (II). However, untreated samples from northern Sweden
were more sensitive to air-drying than samples from the other stands. The same
tendencies could also be seen among the painted samples, although these tenden-
cies were not statistically significant (III). One explanation for this can be based
on the possibility that the samples from the northern stand had a larger sapwood
content and that this influenced the results (see 6.1 and 6.3). In other words, what
86
was observed here could be a combination of an unfavourable drying method
and a large content of sapwood.
No differences in MC or mass loss that could be attributed to water-storage
on spruce samples in the Öqvist method (I, II, III) were seen. The season of fell-
ing had also no influence on durability for spruce (I, II, III), which is in
agreement with the discussion above regarding pine.
In Paper IX, the new field test, which followed to the Johansson method,
used mature spruce wood which was sawn with both horizontal and vertical an-
nual rings. The three pieces of wood used in each of the Johansson samples are
not able to move relative to each other. As a consequence of that the shrinkage
and swelling in the tangential direction, caused by moisture fluctuations, is much
larger than in the radial direction (Dinwoodie 2000), samples with horizontal an-
nual rings suffered massive crack formations during the two years of weather
exposure. The samples with vertical annual rings were practically free of large
cracks. These results are congruent with Sandberg (1995). The larger number of
cracks seen on the samples with horizontal annual rings had no influence on ei-
ther the average MC or the fungal growth after two years. This is probably due to
the fact that untreated samples are able to dry out quickly.
However, annual ring orientation can be of more importance to painted pan-
els. It is likely that, if the swelling and shrinking movements in a painted sample
are so large that the wood and paint cracks, then this is more serious than cracks
in an untreated sample. Theoretically, moisture coming into the wood through
cracks is trapped in a painted sample and thus dries out very slowly. An un-
treated sample can dry out more easily.
In the older field test, using the Öqvist method, the annual ring orientation
was also varied, though not as much as in the trial mentioned above. In the
Öqvist method, the different sections of the samples were free to shrink and
swell, since no screws held them together. As was expected, the annual ring ori-
entation had no influence on crack formation or durability.
87
7. Conclusions and Implications
7.1 Conclusions
The main conclusions that can be drawn from this thesis are:
Spruce sapwood is more susceptible to discolouring fungi than spruce
heartwood.
Spruce sapwood has a higher affinity to water than heartwood.
Annual ring width and density have no direct influence on durability or
moisture uptake.
Origin has no direct influence on durability or moisture dynamics.
Air-drying can result in less durable timber.
The only important factor for the natural durability of pine in above
ground conditions is whether the timber consists of heartwood or of
sapwood.
There is no systematic variation in durability or moisture dynamics be-
tween different types of pine heartwood in above ground conditions.
With respect to spruce, sapwood is more susceptible to mould and sapstain fungi
than heartwood. Sapwood also shows a higher affinity to water than heartwood.
It is also shown in these investigations that annual ring width and density has
no direct influence on durability, neither for spruce nor pine. However, it should
be mentioned that the spread between the samples could have been more widely
distributed.
The hypothesis that wood origin could be of importance is not fully verified.
Some differences in the properties of the old material could be seen. The spruce
from the northern stand was more sensitive to air-drying and showed a higher
MC and larger mass loss. However, since heartwood and sapwood was not sepa-
rated, this observation could depend on different proportions of sapwood content
between the stands.
The heartwood of pine is durable irrespective of the way it is handled or
treated. Sapwood has a low durability if it is not painted and end-grain sealed
properly. Notwithstanding this, differences between pine heartwood and pine
88
sapwood can be observed even if the samples are painted with a low permeable
paint.
There is no systematic variation in the durability of different types of pine
heartwood. The inherent differences seem to have a minor importance for
durability in above ground conditions, and thus the hypothesis is falsified.
7.2 Thesis contribution
This thesis has contributed with a number of important new insights on the dura-
bility of pine and spruce. The results show that all of the pine heartwood samples
were durable, and that additional sorting procedures at the mill according to ex-
tractive content is probably not worthwhile for common above ground applica-
tions.
The same argument, concerning sapwood and heartwood, holds also for
spruce even if spruce heartwood is not quite as durable as pine heartwood. It was
also shown that spruce sapwood has larger moisture uptake than spruce heart-
wood. The results of this observation may be of importance for paint manufac-
turers, as well as for wood modification industries.
As shown in this thesis, naturally durable wood can only be sorted with re-
spect to heartwood content. Thus, no other wood property can be used in the
sorting procedure if the aim is to find durable timber.
A new test method, the Mycologg, was also used and evaluated. This method
shows many promising results, and can be used in many related areas to advan-
tage.
7.3 Implications for practice
Sapwood of both pine and spruce has a much poorer durability than heartwood
of these two species (shown in these investigations). This observation, coupled
with the fact that the sapwood content of a tree ready for felling is dependent on
its origin, growth conditions, and age, allows us to conclude that, without any
special sorting, a tree with a large sapwood content will produce timber with a
lower average durability than a tree with small sapwood content. The sapwood
content is often influenced by stand characteristics, but not to the extent that du-
rable timber can be selected in the forest on a commercial scale. In order to pro-
duce more durable wood for outdoor applications, the rotation period of timber
should be prolonged, thus yielding wood with a higher heartwood content. In or-
der to make a profit on this, this suggests that one should determine the final use
for the wood when managing the forest. Wood for end-use in other applications,
where durability is not of decisive significance, could be cut down earlier.
Emphasis can also be placed on how to utilize heartwood, and to obtain a
higher yield of this type of wood in the sawmill. In order to detect heartwood,
89
there exist methods for saw-lines that could be used commercially in the near fu-
ture.
7.4 Implications for future research
Although this thesis has provided a number of answers to the research questions
presented above, every single aspect and issue have not been covered, and thus
they remain open for further investigation. Further research is also needed in or-
der to validate some of the results that were presented in this thesis. Some impor-
tant issues are:
Chemical analysis on spruce heartwood and spruce sapwood is needed
in order to obtain further knowledge about the differences between
these wood types.
More analysis on the differences in water transportation with respect to
spruce heartwood and spruce sapwood is needed.
A follow up study on the ongoing Johansson field test should be per-
formed.
An investigation into the chemical differences in pine heartwood from
more extreme stands should be conducted.
The interaction between different paint systems and wood properties,
such as the heartwood and sapwood of spruce, should be investigated.

90
91
References
Akhter S and Hale MDC (2002a) Variation in natural durability of British grown Douglas
fir (Pseudotsuga menziesii (Mirb.) Franco). Part I. Effect of density and growth rate.
IRG/WP 02-10445, The International Research Group on Wood Preservation, IRG Se-
cretariat Stockholm, Sweden.
Akhter S and Hale MDC (2002b) Variation in natural durability of British grown Douglas
fir (Pseudotsuga menziesii (Mirb.) Franco). Part II. Effect of extractive contents and
taxifolin. IRG/WP 02-10446, The International Research Group on Wood Preserva-
tion, IRG Secretariat Stockholm, Sweden.
Almberg Å (1999) Elementhalter i gran- och tallved: variation med boniteten längs träd-
stammen (Element concentrations in stemwood on Norway spruce and Scots pine:
variation with site quality and along the stem). Report No 81, The Swedish University
of Agricultural Sciences, Department of Forest Ecology and Forest soils, Uppsala,
Sweden. (In Swedish)
Anon (2002) Simca-P and Simca-P+ User guide. Umetrics AB, Umeå, Sweden.
Augusta U and Rapp AO (2003) The natural durability of wood in different use classes.
IRG/WP 03-10457, The International Research Group on Wood Preservation, IRG Se-
cretariat Stockholm, Sweden.
Bao FC, Jiang ZH, Jiang XM, Lu XX, Luo XQ and Zhang SY (2001) Differences in wood
properties between juvenile wood and mature wood in 10 species grown in China.
Wood Science and Technology 35:363-375.
Bektas I, Alma MH, Goker Y, Yuksel A and Gundogan R (2003) Influence of site on
sapwood and heartwood ratios of Turkish calabrian pine. Forest Products Journal
53(4):48-50.
Bergström B, Gustavsson G, Gref R and Ericsson A (1999) Seasonal changes of pinosyl-
vine distribution in the sapwood/heartwood boundary of Pinus sylvestris. Trees 14:64-
71.
Bertaud F and Holmblom B (2004) Chemical composition of earlywood and latewood in
Norway spruce heartwood, sapwood and transition zone wood. Wood Science and
Technology 38:245-256.
Blanchette RA, Farrel RL, Burnes TA, Wendler PA Zimmerman W, Brush TS and Snyder
RA (1992) Biological control of pitch in pulp and paper production by Ophiostoma
piliferum. Tappi J 75:102-106.
Block SS (1953) Humidity requirements for mold growth. Applied Microbiology 6:287-
293.
Blümer H and Nussbaum R (2001) Panelbräder med olika ytstrukturer och betydelsen av
dessa för färgskiktets funktion vid utomhusexponering. Report P 0103006, Trätek,
Stockholm, Sweden. (In Swedish)
Boutelje J, Ihlstedt B and Jonsson U (1979) The effects of wet storage of roundwood. Part
1. Effect on stain-finishing and painting. STFI-meddelande, Serie A. No. 486, Swedish
Forest Products Research Laboratory, Stockholm, Sweden.
92
Boutelje J and Nilsson T (1985) The effects of felling time and felling area, wet storage,
tree species and wood density on the durability of wood. Part 1: Durability against
fungal decay. Wood Technology Report 73, Swedish Institute for Wood Technology
Research, Stockholm, Sweden.
Boutelje JB (1990) Increase in the content of nitrogenous compounds at lumber surfaces
during drying and possible biological effects. Wood Science and Technology. 24:191-
200.
Brisson A, Gharibian S, Eagen R, Leclerc DF and Breuil C (1996) Localization and char-
acterization of the melanin granules produced by the sap-staining fungus Ophiostoma
piceae. Mater Org 30:23-32.
Carey JK (2002) L-joint trials: Part 1: Observations on the process of colonisation and de-
cay. IRG/WP 02-20250, The International Research Group on Wood Preservation,
IRG Secretariat Stockholm, Sweden.
Carlile M and Watkinson SC (1994) The Fungi. Academic Press Inc, San Diego, USA.
Celimene CC, Micaels JA, Ferge L and Young RA (1999) Efficiency of pinosylvins
against white-rot and brown-rot fungi. Holzforschung 53:491-497.
CEN (1993) EN 330. Wood preservatives - Field test method for determining the relative
protective effectiveness of a wood preservative exposed out of ground contact: L-joint
method. European committee for standardization.
CEN (1994) EN 350-1 and 2. Durability of wood and wood-based products - Natural du-
rability of solid wood – Part 1: Guide to the principles of testing and classification of
the natural durability of wood – Part 2: Guide to natural durability of selected wood
species of importance in Europe. European committee for standardization.
CEN (1996a) EN 133. Wood preservatives –Test method for determining the protective
effectiveness against wood destroying basidomysetes- Determination of the toxic val-
ues. European committee for standardization.
CEN (1996b) ENV 12037. Wood preservatives - Field test method for determining the
relative protective effectiveness of a wood preservative exposed out of ground contact
- Horizontal Lap-joint method. European committee for standardization.
CEN (2000) EN 927-5. Paints and varnishes - Coating materials and coating systems for
exterior wood - Part 5: Assessment of the liquid water permeability. European Com-
mittee for Standardisation.
Clausen CA (1996) Bacterial associations with decaying wood: a review. Int Biodeterior
Biodegrad 37:101-107.
Creemers J, de Meijer M, Zimmermann T, Sell J (2002) Influence of Climatic Factors on
the Weathering of Coated Wood. Holz als Roh- und Werkstoff 60:411-420.
Daniel G, Elowson T, Nilsson T, Singh A and Liukko K (1993) Watersprinkled pine
wood: A microscopic study on boards showing streaking. IRG/WP 93-10033, The In-
ternational Research Group on Wood Preservation, IRG Secretariat Stockholm, Swe-
den.
Deacon JW (1997) Modern Mycology. 3rd Ed, Blackwell Sciences Ltd, Edinburgh, UK.
Pp 199-203.
Dinwoodie JM (2000) Timber: Its nature and behaviour. 2nd Ed. E & FN Spon, New
York, USA.
Dorado J, van Beek TA, Claassen FW and Sierra-Alvarez R (2001) Degradation of lipo-
philic wood extractive constituents in Pinus Sylvestris by the white-rot fungi Bjerkan-
dea sp. and Trametes versicolor. Wood Science and Technology 35:117-125
Dunleavy JA and McQuire AJ (1970) The effect of water storage on the cell-structure of
Sitka spruce (Picea sitchensis) with reference to its permeability and preservation.
Journal of the institute of Wood Science 26 (2):20-28
93
Eaton RA and Hale MDC (1993) Wood – Decay, pests and protection. Chapman & Hale,
London, England.
Edlund M-L (1998) Durability of wood in ground contact tested in field and laboratory.
Doctor's dissertation. Acta Universitatis Agriculturae Sueciae, Silvestria 81, Swedish
University of Agricultural Sciences, Uppsala, Sweden.
Ekman R (1979) Analysis of the Nonvolatile Extractives in Norway Spruce Sapwood and
Heartwood. Serie B 39:4, Acta Acad Abo.
Ericsson T, Fries A and Gref R (2001) Genetic correlations of heartwood extractives in
Pinus sylvestris progeny tests. Forest genetics 8 (1):73-79.
Eriksson K-EL, Blanchette RA and Ander P (1990) Microbial and enzymatic degradation
of wood and wood components. Springer-Verlag, Berlin, Germany.
Eriksson L, Johansson E, Kettaneh-Wold N and Wold S (1999) Introduction to Multi- and
Megavariate Data Analysis Using Projection Methods (PCA & PLS). Umetrics, Umeå,
Sweden. Pp 67-108.
Feio SS, Barbosa A, Cabrita M, Nunes L, Esteves A, Roseiro JC and Curto MJM (2004)
Antifungal activity of Bacillus subtilis 355 against wood-surface contaminant fungi. J
Ind Microbiol Biotechnol 31:199-203.
Fengel D and Wegener G (1984) Wood: Chemistry, ultrastructure and reactions. Walter
de Gruyter & Co, Berlin, Germany.
Fries A, Ericsson T and Gref R (2000) High heritability of wood extractives in Pinus syl-
vestris progeny tests. Canadian Journal of Forest Research 30:1707-1713.
Gierlinger N, Jacques D, Grabner M, Wimmer R, Schwanninger M, Rozenberg P and
Pâques LE (2004a) Coulor of larch heartwood and relationships to extractives and
brown-rot decay resistance. Trees 18:102-108.
Gierlinger N, Jacques D, Schwanninger M, Wimmer R and Pâques LE (2004b) Heart-
wood extractives and lignin content of different larch species (Larix sp.) and relation-
ships to brown-rot decay-resistance. Trees 18:230-236.
Gindl M, Reiterer A, Sinn G and Stanzl-Tschegg SE (2004) Effects of surface ageing on
wettability, surface chemistry, and adhesion of wood. Holz als Roh- und Werstoff 62
(4):273 – 280.
Grindl W, GrabnerM and Wimmer R (2000) The influence of temperature on latewood
lignin content in treeline Norway spruce compared with maximum density and ring
width. Trees 14:409-414.
Gravesen S, Frisvald J and Samson RA (1994) Microfungi. Munksgaard, Copenhagen.
Green F and Highley TL (1997) Mechanism of brown-rot decay: paradigm or paradox. Int
Biodeterior Biodegrad 39:113-124.
Grönlund A and Rydell R (1983) Analys av rötskadade fönster. STFI meddelande, Serie
A, No 811, Swedish Forest Products Research Laboratory, Stockholm, Sweden. (In
Swedish)
Grönlund A, Karlsson G and Karlsson L (1988) Furuvirke med hög kärnandel avsett för
fönstersnickerier. STFI meddelande, Serie A, No 553, Swedish Forest Products Re-
search Laboratory, Stockholm, Sweden. (In Swedish)
Hameed M and Roffael E (1999) Über die Benetzbarkeit von Splint- und Kernholz der
Keifer, Douglasie und Lärche. Holz als Roh- und Werstoff 57:287–293.
Harju AM, Venäläinen M, Beuker E, Velling P and Viitanen H (2001). Genetic variation
in the decay resistance of Scots pine wood against brown rot fungus. Can. J. For. Res.
31:1244-1249.
Harju AM, Venäläinen M, Anttonen S, Viitanen H, Kainulainen P, Saranpää P and Va-
paavuori E (2003) Chemical factors affecting the brown-rot decay resistance of Scots
pine heartwood. Trees 17:263-268.
94
Hawley LF, Fleck LC and Richards CA (1924) The relation between durability and
chemical composition in wood. Ind. Eng. Chem, 16:699-706.
Haygreen JG and Bowyer JL (1996) Forest Products and Wood Science, An Introduction.
3rd Ed, Iowa State University Press /AMES, USA.
Henttonen H (1984) The depencence of annual ring indices on some climatic factors. Acta
Forestalia Fennica 186.
Hirmke M, Messner K, Fellner J, Teischinger A and Wimmer R (1998) Influence of fell-
ing time on the natural durability of Norway spruce (Picea abies (L.) Karst.). IRG/WP
98-10250, The International Research Group on Wood Preservation, IRG Secretariat
Stockholm, Sweden.
ISO (2001) ISO 12572. Hygrothermal performance of building materials and products –
Determination of water vapour transmission properties. International Organization for
Standardization.
Johansson P, Jermer J and Johansson I (1999) Field trial with wood preservatives for class
AB. Progress report No. 1. Results after 3 years exposure. SP Report 1999:27. Swedish
National Testing and Research Institute. (In Swedish)
Johansson P, Jermer J and Johansson I (2001) Field trial with wood preservatives for class
AB. Progress report No. 2. Results after 5 years exposure. SP Report 2001:33. Swedish
National Testing and Research Institute. (In Swedish)
Jolliffe IT (1986) Principal Component Analysis. Springer-Verlag, New York, USA.
Käärik A (1980) Fungi causing sap stain in wood. IRG/WP 199, The International Re-
search Group on Wood Preservation, IRG Secretariat Stockholm, Sweden.
Kollman FFP and Côté Jr WA (1984) Principles of Wood Science and Technology, Vol-
ume: Solid Wood. Reprint, Springer-Verlag: Berlin, Heidelberg, New York, Tokyo.
Larsson Brelid P, Simonson R, Bergman Ö and Nilsson T (2000) Resistance of acetylated
wood to biological degradation. Holz als Roh- und Werkstoff 58:331-337.
Lindberg LE, Willför SM and Holmbom BR (2004) Antibacterial effect of knotwood ex-
tractives on paper mill bacteria. J Ind Microbiol Biotechnol 31:137-147.
Lindström H (1997) Wood variation in young Norway spruce (Picea abies (L.) Karst)
created by differences in growth conditions. Acta Universitatis Agriculturae Sueciae,
Silvestria 2, The Swedish University of Agricultural Sciences, Department of Forest
Products, Uppsala, Sweden.
Martens HA and Naes T (1989) Multivariate calibration, Wiley, Chichester, UK.
Mikola P (1962) Temperature and tree growth near the northern timber line. In:
Kozlowski TT (ed) Tree growth. The Ronald Press Co, New York, USA.
Molnar S, Dickinson DJ and Murphy RJ (1996) Accelerated testing for out of ground con-
tact using natural biological preconditioning. IRG/WP 96-20088, The International
Research Group on Wood Preservation, IRG Secretariat Stockholm, Sweden.
Morton LHG and Eggins HOW (1976) The effect of moisture content in wood on the sur-
face growth and penetration of fungi. Material und organismen 11:279-294.
Nilsson K (1993) Wood protection treatments – Comparative tests of a selection of tradi-
tional and modern treatments. Report Nr 168, Swedish Wood Preservation Institute,
Stockholm, Sweden. (In Swedish)
Norén J (2001) Assessment and mapping of environmental degradation factors in outdoor
applications. Licentiate thesis. The Royal Institute of Technology, Stockholm, Sweden.
Nussbaum RM (1996) The critical time to avoid natural inactivation of spruce surfaces
(Picea abies) intended for painting or gluing. Holz als Roh- und Werkstoff 54:26.
Nussbaum RM (1999) Natural surface inactivation of Scots pine and Norway spruce
evaluated by contact angel measurements. Holz als Roh- und Werkstoff 57:419-424.
95
Öqvist H (1988) The durability of outdoor wood. Field test: Wood-panels exposed out of
ground contact. Report No 204, The Swedish University of Agricultural Sciences, De-
partment of Forest Products, Uppsala, Sweden. (In Swedish)
Panshin AJ, de Zeeuw C (1980) Textbook of Wood Technology. Vol. 1, 4th Ed. Mc Graw-
Hill Book Company, New York, USA.
Pape R (1999) Effects of thinning on wood properties of Norway spruce on highly pro-
ductive sites. Acta Universitatis Agriculturae Sueciae, Silvestria 88, The Swedish Uni-
versity of Agricultural Sciences, Department of Forest Products, Uppsala, Sweden.
Payne C, Bruce A and Staines H (2000) Yeast and bacteria as biological control agents
against fungal discoloration of Pinus sylvestris blocks in laboratory-based tests and the
role of antifungal volatiles. Holzforschung 54:563-569.
Pew JC (1957) Properties of powdered wood and isolation of lignin by cellulytic en-
zymes. Tappi J 40:553-558.
Philp RW, Bruce A and Munro AG (1995) The Effect of Water Soluble Scots Pine (Pinus
sylveatris L.) and Sitka Spruce [Picea sitchensis (Bong.) Carr.] Heartwood and Sap-
wood Extracts on the Growth of Selected Trichoderma Species. International Biodete-
rioration and Biodegradation 1995:355-367.
Rapp OA, Augusta U and Peek RD (2001) Facts and ideas of testing wood above ground.
COST E22, Reinbek.
Rennerfelt E (1947). Några undersökningar över olika rötsvampars förmåga att angripa
splint- och kärnved hos tall. Meddelande 36:9, Swedish Forest Products Research La-
boratory, Stockholm, Sweden. (In Swedish)
Rydell Å and Bergström M (2002) Beständighet hos svenskt barrvirke vid applikationer
ovan mark. Durability of Swedish softwood in above-ground applications. Reports No
2, School of Industrial Engineering, Växjö University, Växjö, Sweden. (In Swedish)
Rydell R (1981) Influence of drying method on long time resistance of window wood.
STFI-meddelande, Serie A, No 731, Swedish Forest Products Research Laboratory,
Stockholm, Sweden. (In Swedish)
Rydell R (1982) Samband mellan densitet och årsringsbredd samt några andra egenskaper
för svensk furu. STFI meddelande, Serie A, No 763, Swedish Forest Products Re-
search Laboratory, Stockholm, Sweden. (In Swedish)
Sandberg D (1995) Stående årsringar hos furu (Pinus silverstris L) och gran (Picea abies
Karst). Trita-TRÄ 95:13, The Royal Institute of Technology, Stockholm, Sweden. (In
Swedish)
Sandberg K (2002) Influences of growth site on different wood properties in spruce sap-
/heartwood using CT-scanner measurements. In: Proceedings of the Fourth Workshop
Connection Between Forest Resources and Wood Quality: Modelling Approaches and
Simulating Software, Organized by IUFRO Working party S5.01-04 Harrison Hot
Springs Resort, Harrison Hot Springs, BC Canada, September 8-15, 2002.
Sandberg K (2004) Utomhusexponering av gran under 1,5 år. Report P 0401003, Trätek,
Stockholm, Sweden. (In Swedish)
Sandberg K and Lindgren O (2003) Measurement of spruce moisture gradients using CT
scanning during three life cycles of liquid water absorbation and desorption in end
grain. In Proceedings of the Fifth International Conference on Image Processing and
Scanning of Wood, IWSS 5, organized by Joanneum Research Graz, Bad Waltersdorf,
Austria, March 23-26, 2003.
Sell J and Zimmermann T (1995) Comparability of weathering conditions within different
European zones of climate – Literature study on the feasibility of a ‘climatic index’.
Report MAT 1 – CT 940062. EMPA Wood Department, Dübendorf, Switzerland.
96
Shupe TF, Choong ET and Yang CH (1996) The effects of silvicultural treatment on the
chemical composition of plantation-grown Loblolly pine wood. Wood Fiber Sci. 28
(3):295-300.
SIS (1988) SS 81 81 04. Windows – Wood requirements. Swedish Standard commission.
(In Swedish)
Sjömar P (1988) Building technology and the art of carpentry. Chalmers University of
Technology, School of Architecture, Gothenburg, Sweden. (In Swedish)
Sjöström E (1981) Wood chemistry – Fundamentals and Applications. Academic Press,
New York, USA.
Siau JF (1984) Transport Processes in Wood. Springer-Verlag, Berlin, Germany.
Siau JF (1995) Wood: Influence of moisture on physical properties. Department of Wood
Science and Forest Products, Virginia Polytechnic Institute and State University, USA.
Stephan I, Göller S and Rudolph D (2000) Improvements of monitoring the effects of soil
organisms on wood in ground contact. Holz als Roh- und Werkstoff 58:115-119.
Terziev N (1997) Fungal discoloration of kiln- and air-dried Scots pine lumber in above
ground testing and its assessment by digital image processing. Forest Products Journal
47(9):43-36.
Theander O, Bjurman J and Boutelje JB (1993) Increase in the content of low-molecular
carbohydrates at lumber surfaces during drying and correlations with nitrogen content,
yellowing and mould growth. Wood Sci. Technol. 27:381-389.
Thörnqvist T (1993) Juvenile Wood in Coniferous Trees. Swedish Council for Building
Research, Stockholm, Sweden.
Vance CP, Kirk TK and Sherwood RT (1980) Lignification as a mechanism of disease re-
sistance. Annu Rev Phytopathol 18:259-288.
Venäläinen M, Harju AM, Saranpää P, Kainulainen P, Tiitta M and Velling P (2004) The
concentration of phenolics in brown-rot resistant and susceptible Scots pine heart-
wood. Wood Science and Technology 38:109-118.
Viitanen H and Ritschkoff A-C (1991a) Mould growth in pine and spruce sapwood in re-
lation to air humidity and temperature. Report No. 221, Swedish University of Agri-
cultural Sciences, Department of Forest Products, Uppsala, Sweden.
Viitanen H and Ritschkoff A-C (1991b) Brown rot decay in wooden constructions. - Ef-
fect of temperature, humidity and moisture. Report No. 222, Swedish University of
Agricultural Sciences, Department of Forest Products, Uppsala, Sweden.
Viitanen H, Paajanen L, Saranpää P and Viitaniemi P (1997) Durability of larch (Larix
spp.) wood against brown-rot fungi. IRG/WP 97-10228, The International Research
Group on Wood Preservation, IRG Secretariat Stockholm, Sweden.
Viitanen H, Hajru AM, Kainulainen P and Venäläinen M (2002) Decay resistance of
Scots pine (Pinus sylvestris) heartwood against brown rot. IRG/WP 02-10443, The In-
ternational Research Group on Wood Preservation, IRG Secretariat Stockholm, Swe-
den.
Wazny J and Krajewski KJ (1984) Jahreszeitliche Änderungen der Dauerhaftigkeit von
Kiefernholz gegenüber holzerstörenden Pilzen. Holz als Roh- und Werkstoff 42:55-58.
Willför S and Holmbom B (2004) Isolation and characterisation of water soluble polysac-
charides from Norway spruce and Scots pine. Wood Science and Technology 38:173-
179.
Windeisen E, Wegener G, Lesnino G and Schumacher P (2002) Investigation of the corre-
lation between extractives content and natural durability in 20 cultivated larch trees.
Holz als Roh- und Werkstoff 60:373-374.
Wold S (1978) Cross-validatory estimation of the number of components in factor and
principal component models. Technometrics 20:239-405.
97
Wold S, Esbensen K and Geladi P (1987) Principal component analysis – A tutorial.
Chemometrics and Intelligent Laboratory Systems 2:37-52.
Yngvesson M, Jirjis R and Nylinder M (1993) Pulp and chemical properties of wood with
different growth rates, from first thinnings of spruce. Report No 238, Swedish Univer-
sity of Agricultural Sciences, Department of Forest Products, Uppsala, Sweden. (In
Swedish)

98
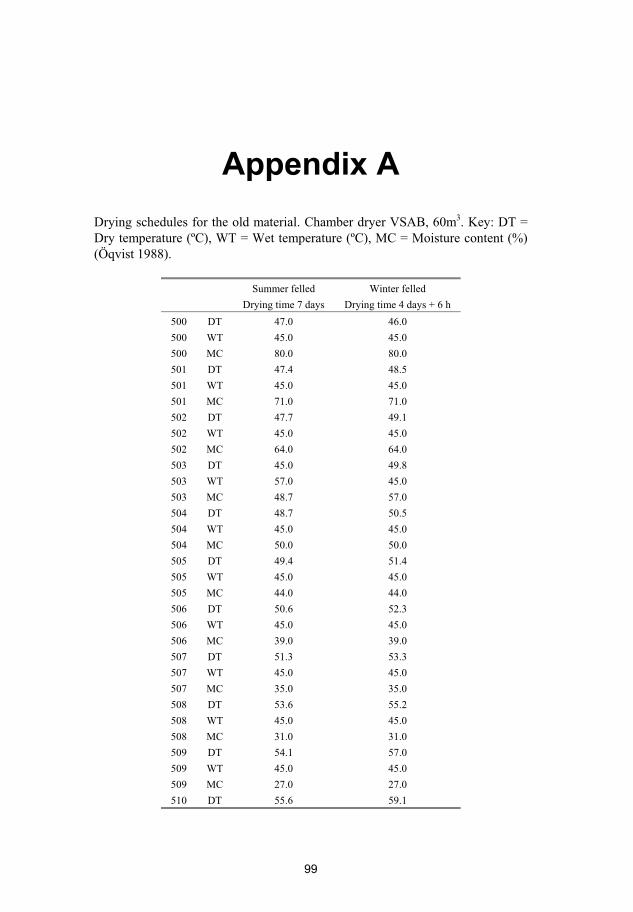
99
Appendix A
Drying schedules for the old material. Chamber dryer VSAB, 60m3. Key: DT =
Dry temperature (ºC), WT = Wet temperature (ºC), MC = Moisture content (%)
(Öqvist 1988).
Summer felled
Drying time 7 days
Winter felled
Drying time 4 days + 6 h
500 DT 47.0 46.0
500 WT 45.0 45.0
500 MC 80.0 80.0
501 DT 47.4 48.5
501 WT 45.0 45.0
501 MC 71.0 71.0
502 DT 47.7 49.1
502 WT 45.0 45.0
502 MC 64.0 64.0
503 DT 45.0 49.8
503 WT 57.0 45.0
503 MC 48.7 57.0
504 DT 48.7 50.5
504 WT 45.0 45.0
504 MC 50.0 50.0
505 DT 49.4 51.4
505 WT 45.0 45.0
505 MC 44.0 44.0
506 DT 50.6 52.3
506 WT 45.0 45.0
506 MC 39.0 39.0
507 DT 51.3 53.3
507 WT 45.0 45.0
507 MC 35.0 35.0
508 DT 53.6 55.2
508 WT 45.0 45.0
508 MC 31.0 31.0
509 DT 54.1 57.0
509 WT 45.0 45.0
509 MC 27.0 27.0
510 DT 55.6 59.1

100
510 WT 45.0 45.0
510 MC 24.0 24.0
511 DT 57.4 61.6
511 WT 45.0 45.0
511 MC 21.0 21.0
512 DT 59.0 64.1
512 WT 45.0 45.0
512 MC 19.0 19.0
513 DT 60.0 65.6
513 WT 45.0 45.0
513 MC 17.0 17.0
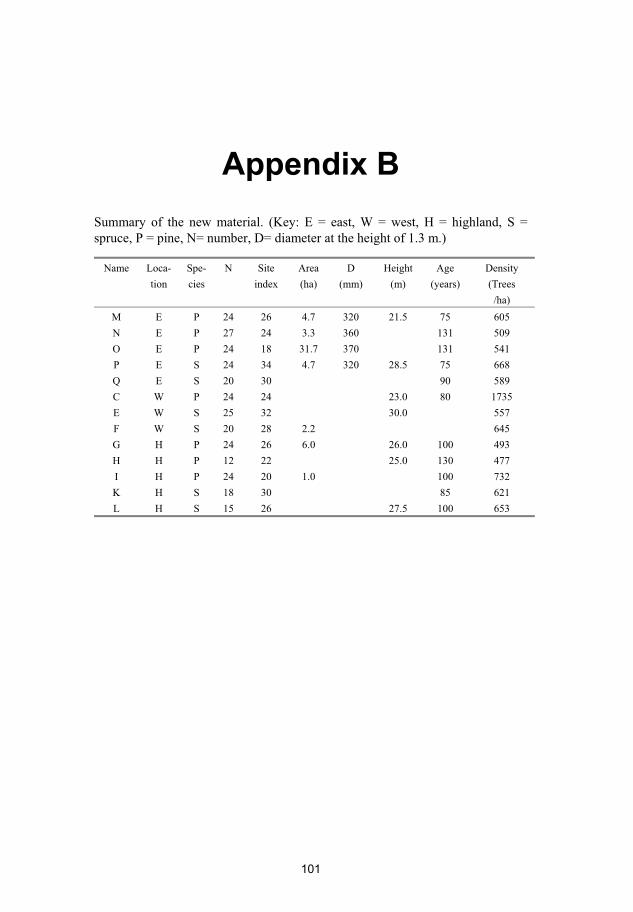
Appendix B
Summary of the new material. (Key: E = east, W = west, H = highland, S =
spruce, P = pine, N= number, D= diameter at the height of 1.3 m.)
Name Loca-
tion
Spe-
cies
N Site
index
Area
(ha)
D
(mm)
Height
(m)
Age
(years)
Density
(Trees
/ha)
M E P 24 26 4.7 320 21.5 75 605
N E P 27 24 3.3 360 131 509
O E P 24 18 31.7 370 131 541
P E S 24 34 4.7 320 28.5 75 668
Q E S 20 30 90 589
C W P 24 24 23.0 80 1735
E W S 25 32 30.0 557
F W S 20 28 2.2 645
G H P 24 26 6.0 26.0 100 493
H H P 12 22 25.0 130 477
I H P 24 20 1.0 100 732
K H S 18 30 85 621
L H S 15 26 27.5 100 653
101

102
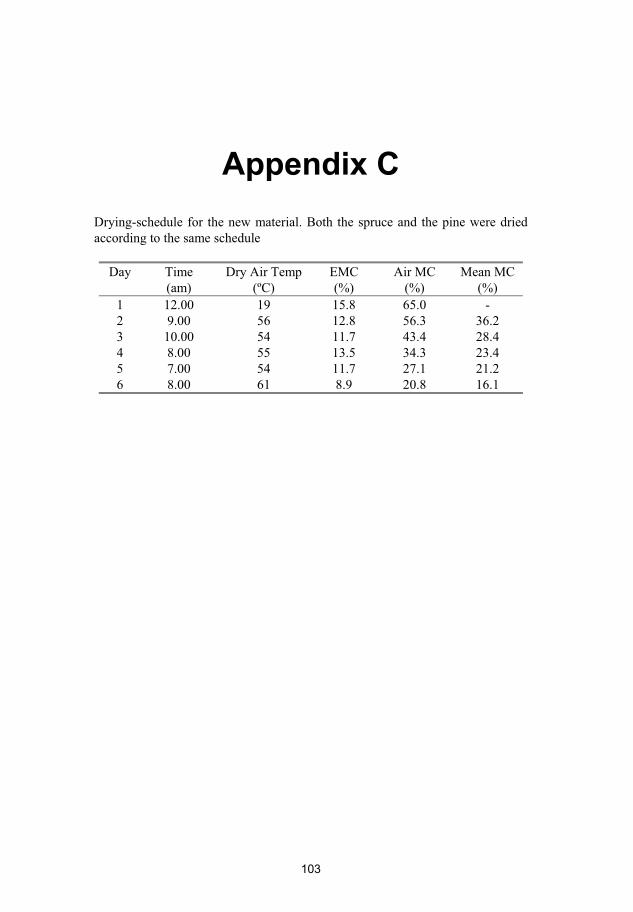
103
Appendix C
Drying-schedule for the new material. Both the spruce and the pine were dried
according to the same schedule
Day Time
(am)
Dry Air Temp
(ºC)
EMC
(%)
Air MC
(%)
Mean MC
(%)
1 12.00 19 15.8 65.0 -
2 9.00 56 12.8 56.3 36.2
3 10.00 54 11.7 43.4 28.4
4 8.00 55 13.5 34.3 23.4
5 7.00 54 11.7 27.1 21.2
6 8.00 61 8.9 20.8 16.1

104
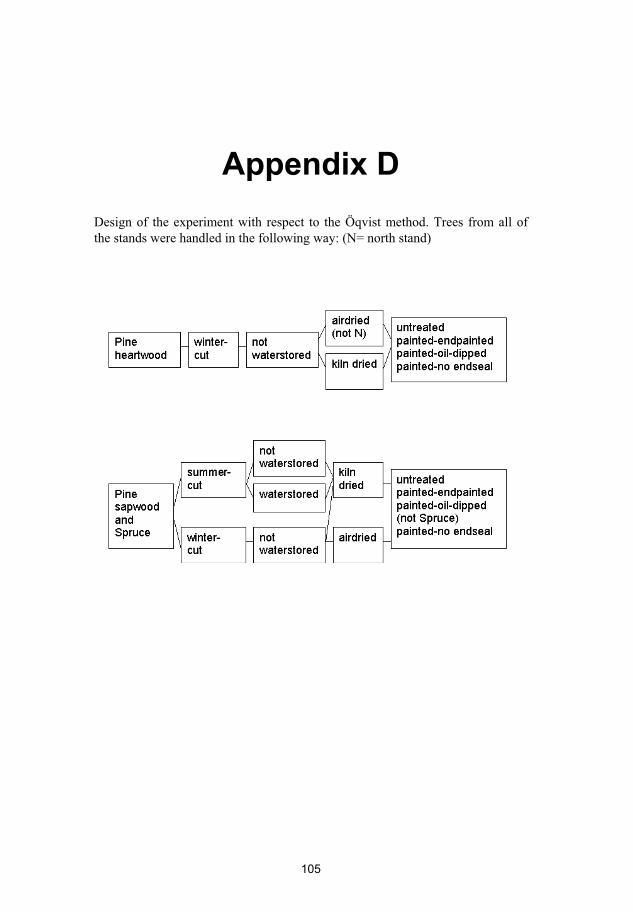
Appendix D
Design of the experiment with respect to the Öqvist method. Trees from all of
the stands were handled in the following way: (N= north stand)
105


![INDEPENDENT MARKET REPORT FOR SOFTWOOD PLANTATION … · INDEPENDENT MARKET REPORT FOR SOFTWOOD PLANTATION PRODUCTS ... ...]'/!,4./*!!!](https://img.pdfslide.us/doc/110x75/5f2e5de272f6a91abe7a3a7d/independent-market-report-for-softwood-plantation-independent-market-report-for.jpg)