Embed Size (px)
Citation preview
AWE Limited is an independent Australian energy company focused on upstream oil and gas opportunities.
Established in 1997 and listed on the Australian Securities Exchange (ASX: AWE), the company is based in Sydney with project offices in Perth and New Zealand. AWE has a substantial portfolio of production, development and exploration assets in Australia, New Zealand, and Indonesia.
ABOUT THIS REPORTThe AWE Limited 2015-16 Annual Report includes the Directors' Report, Remuneration Report and Financial Report and provides a summary of the company’s operating and financial performance for the financial year ended 30 June 2016.
When we refer to AWE in this report, we are referring to:
+ AWE Limited (ABN 70 077 897 440) which is the parent public company of the AWE Group and is listed on the Australian Securities Exchange (ASX) under the ticker code AWE; and
+ Our major operating subsidiaries and controlled entities.
Shareholders can request a printed copy of this report by writing to the Company Secretary, AWE Limited, Level 16, 40 Mount Street, North Sydney, NSW 2060, Australia. This report is also available online at www.awexplore.com
H O M E F I N A N C I A L S
1A W E L I M I T E D A N N U A L R E P O R T 2 0 1 6
02
04
06
08
10
16
17
18
29
46
52
92
93
96
98
99
100
101
FY16 Highlights
From the Chairman
Performance Summary
Operational Overview
Managing Director’s Review
Board and Management
Financial Report
Directors' Report
Remuneration Report
Financial Statements
Notes to the Consolidated Financial Statements
Additional Information
Reserves and Contingent Resources
Production and Exploration Permits
Shareholder Information
Glossary
Five Year Financial Summary
Corporate Directory
C O N T E N T S
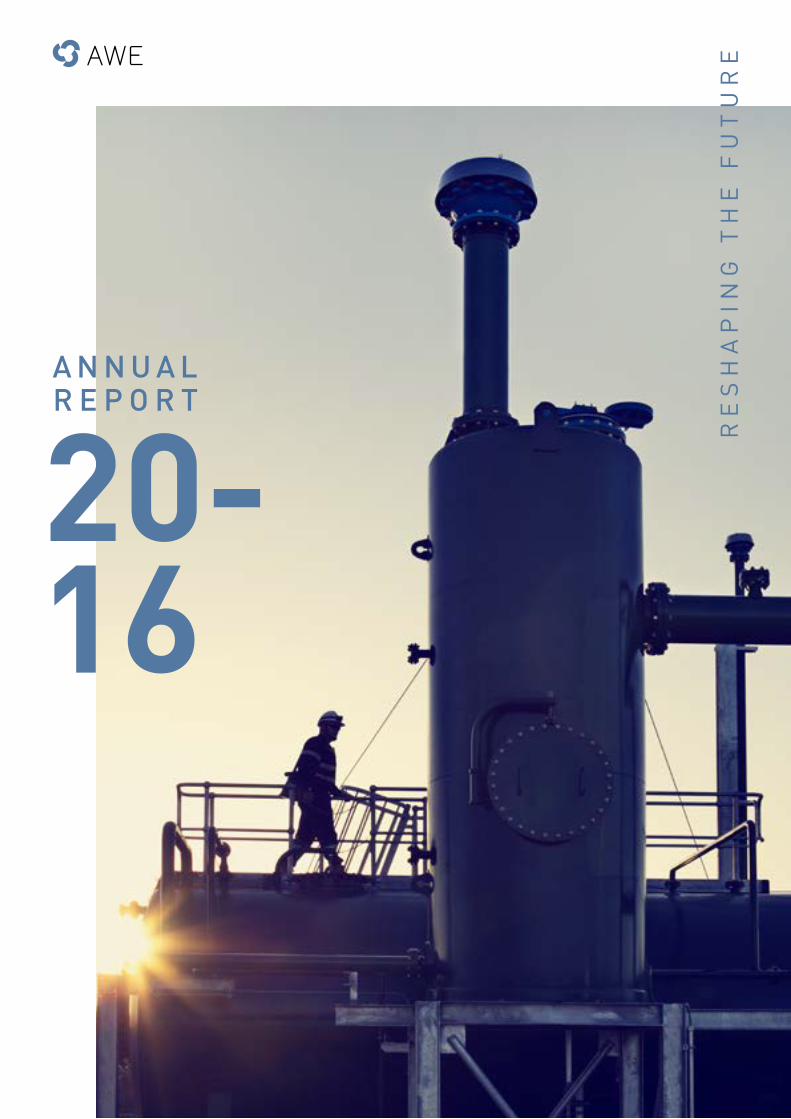
The project photography featured in this annual report reflects various stages of the Waitsia gas project, a key element of AWE’s growth strategy.
H O M E F I N A N C I A L S
F Y 1 6 H I G H L I G H T S
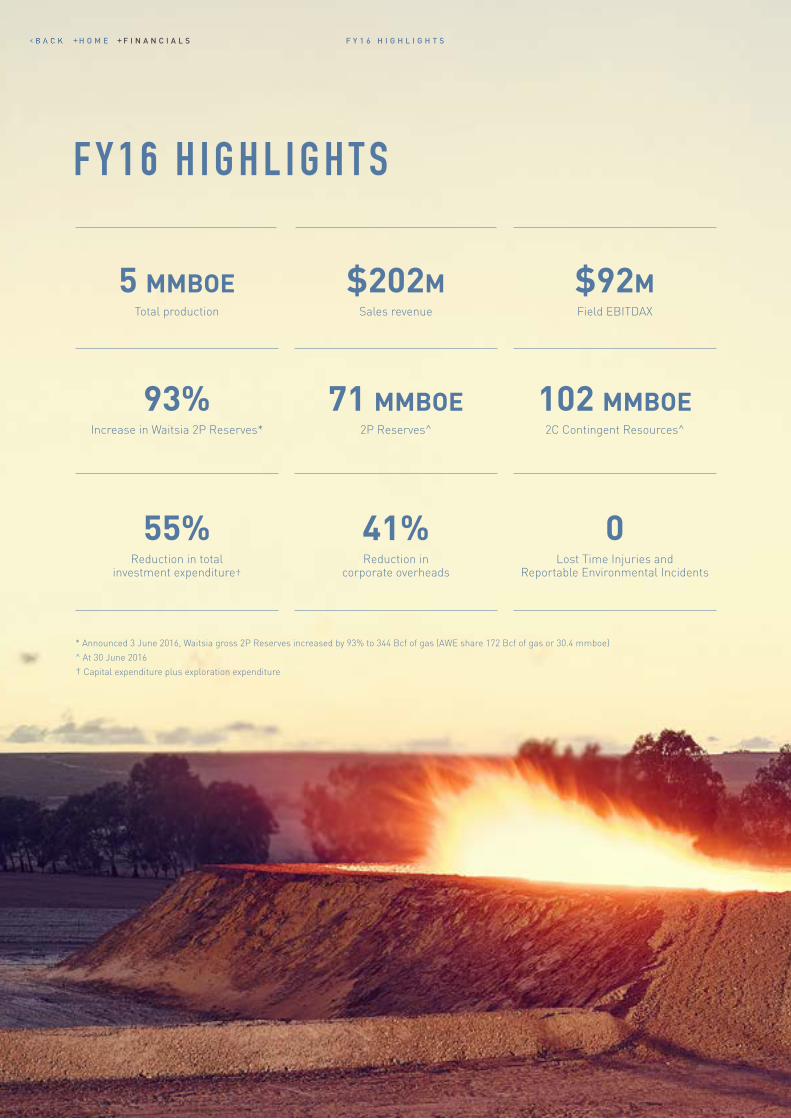
5 MMBOETotal production
71 MMBOE2P Reserves^
55%Reduction in total
investment expenditure†
102 MMBOE2C Contingent Resources^
93% Increase in Waitsia 2P Reserves*
41% Reduction in
corporate overheads
0 Lost Time Injuries and
Reportable Environmental Incidents
$92M Field EBITDAX
$202M Sales revenue
* Announced 3 June 2016, Waitsia gross 2P Reserves increased by 93% to 344 Bcf of gas (AWE share 172 Bcf of gas or 30.4 mmboe)
^ At 30 June 2016† Capital expenditure plus exploration expenditure
F Y 1 6 H I G H L I G H T S
H O M E F I N A N C I A L S

F Y 1 6 H I G H L I G H T S
R E S H A P I N G T H E F U T U R EAWE has reshaped itself to operate sustainably in a low oil price environment. This required a disciplined and focused approach to cost control, optimisation of operating structures, reduction and reprioritisation of investment spend, asset sales and debt reduction.
Production and development have been firmly weighted towards stable gas revenues in the short to medium term, with a clear priority to develop the Waitsia gas project in Western Australia and secure new gas sales contracts in the east and west coast gas markets at materially higher prices.
AWE also continues to progress the 101 million barrel (gross) Ande Ande Lumut oil project in Indonesia to ensure the project is development-ready should oil prices improve.
The company is now in a substantially different position to where it was 12 months ago. It is well positioned for the future with stable cash flows, a flexible balance sheet with low debt, a strong portfolio of Reserves and Contingent Resources, and two valuable, long life development assets in Waitsia and Ande Ande Lumut.
H O M E F I N A N C I A L S
4 A W E L I M I T E D A N N U A L R E P O R T 2 0 1 6
F R O M T H E C H A I R M A N
It’s now more than two years since the price of Brent oil began its plunge from US$115 per barrel in mid-June 2014, bottoming at US$29 per barrel in January 2016 before rallying back towards US$50 per barrel by mid-2016. In that relatively short space of time, the structure of oil and gas markets has changed significantly with a number of companies, industries and governments coming under sustained economic pressure.
Although low oil prices adversely impacted AWE’s share price, particularly since August 2015, our financial and operational performance in the 2016 financial year (FY16) was in line with guidance. This achievement reflects the underlying value in the skills of AWE’s people, and the diversity and quality of the company’s projects, reserves and resources.
Resetting the BarWe achieved the FY16 performance by reshaping AWE to operate in a “lower for longer” oil price environment. With a clear focus on capital discipline, cost reduction and asset consolidation, AWE managed ongoing market volatility and delivered a number of significant project milestones. We made a number of tough decisions designed to strengthen our overall financial position so that the company can continue to operate sustainably in a sub-US$50 per barrel market. AWE successfully:
+ reduced corporate overheads by 41%; + reduced total investment expenditure by 55%; + reduced our geographic footprint by exiting USA and China and downscaling operations in Indonesia;
+ reduced recurring capex through the sale of Sugarloaf; and
+ repaid debt with the proceeds of asset sales.
We also undertook to deliver revenue and cash flow certainty by hedging oil production from Sugarloaf, Tui and Cliff Head from October 2015 through to June 2016.
These measures made it possible for AWE to continue to deploy capital on two high quality, long life growth opportunities: the AWE-operated Waitsia gas project in Western Australia’s Perth Basin and the Ande Ande Lumut (AAL) oil project in Indonesia.
F R O M T H E C H A I R M A NFellow AWE shareholders
H O M E F I N A N C I A L S
5A W E L I M I T E D A N N U A L R E P O R T 2 0 1 6
RemunerationIn response to the tough external economic environment, the Board also made a number of important changes to the company’s remuneration structures. These changes included:
+ significant organisation restructuring resulting in a reduction of employee numbers by approximately 30%;
+ decreasing the size of the board; and no increase in the remaining Directors’ fees in FY16 and FY17;
+ no salary increase for senior executives in FY16 and FY17;
+ reduced fixed remuneration for the CEO and CFO positions in FY17;
+ no salary increases for other employees, other than promotions, for FY17;
+ no short term incentives awarded in FY16; and + discontinued retention plans for senior executives.
While none of these decisions were easy, the hardest by far was to reduce the number of employees, particularly in Sydney, New Plymouth and Jakarta. AWE is not a large company and many of the people impacted had been a part of the organisation for many years and were fellow shareholders. I would like to take this opportunity to thank them all for their hard work and their significant contribution to AWE.
Management refreshed and refocusedIn line with the Board’s succession planning strategy, in May 2016 we welcomed David Biggs as our new Managing Director and CEO, replacing the highly regarded Bruce Clement who stepped down from the role after almost six years.
In July 2016 we also welcomed Ian Bucknell as our Chief Financial Officer, following the departure of Ayten Saridas.
David and Ian bring extensive upstream oil and gas industry experience to the AWE management team, particularly in the areas of gas marketing and project financing and delivery. We are confident that their appointments will ensure AWE is equipped to deliver our key growth projects in Waitsia and AAL as well as enhanced revenue through recontracting east and west coast gas production at significantly higher prices.
F R O M T H E C H A I R M A N
M&A activityIn May 2016, AWE received an unsolicited indicative, conditional and non-binding proposal from Lone Star Japan Acquisitions on behalf of a Lone Star Fund to acquire all of the shares in the company for a cash consideration of $0.80 per share.
The AWE Board rejected the proposal after concluding that it was opportunistic and did not reflect the fair underlying asset value of the company.
Transition to long term rewardsDespite the harsh reality of current oil prices, the outlook for AWE remains positive.
In common with many of its contemporaries in the oil and gas industry, AWE is in a period of transition and evolution characterised by reduced production, revenue and investment. However, AWE has worked hard to progress two high quality, long life assets in Waitsia and AAL that are positioned to enter development, and we are ready to take advantage of anticipated higher domestic gas prices in Australia’s east and west coast gas markets.
The exciting Waitsia gas project continues to deliver on its potential to be the biggest onshore conventional gas field discovery in Australia in over 30 years. The development of Waitsia and its associated fields is a clear priority for AWE, and I’m pleased to report that the project achieved first gas sales from Stage 1A on time in August 2016 and under budget.
While the ultimate profitability of the AAL oil project in Indonesia remains tied to the oil price, ongoing cost reduction and positive results from the recent AAL-4XST1 appraisal well should improve the overall project economics ahead of a planned Final Investment Decision (FID) in the second half of calendar year 2017.
ConclusionFinally, I would like to extend my personal thanks to my fellow Board members, and to our patient shareholders for your support and contribution to our company during a very difficult year.
AWE is now a leaner, more efficient and focused organisation, better equipped to deal with the challenges ahead. With the dedication of our experienced management team, staff and contractors, and under the stewardship of the Board, I am confident AWE can deliver on its attractive long-term growth potential.
BRUCE PHILLIPS Chairman
H O M E F I N A N C I A L S
6 A W E L I M I T E D A N N U A L R E P O R T 2 0 1 6
P E R F O R M A N C E S U M M A R Y
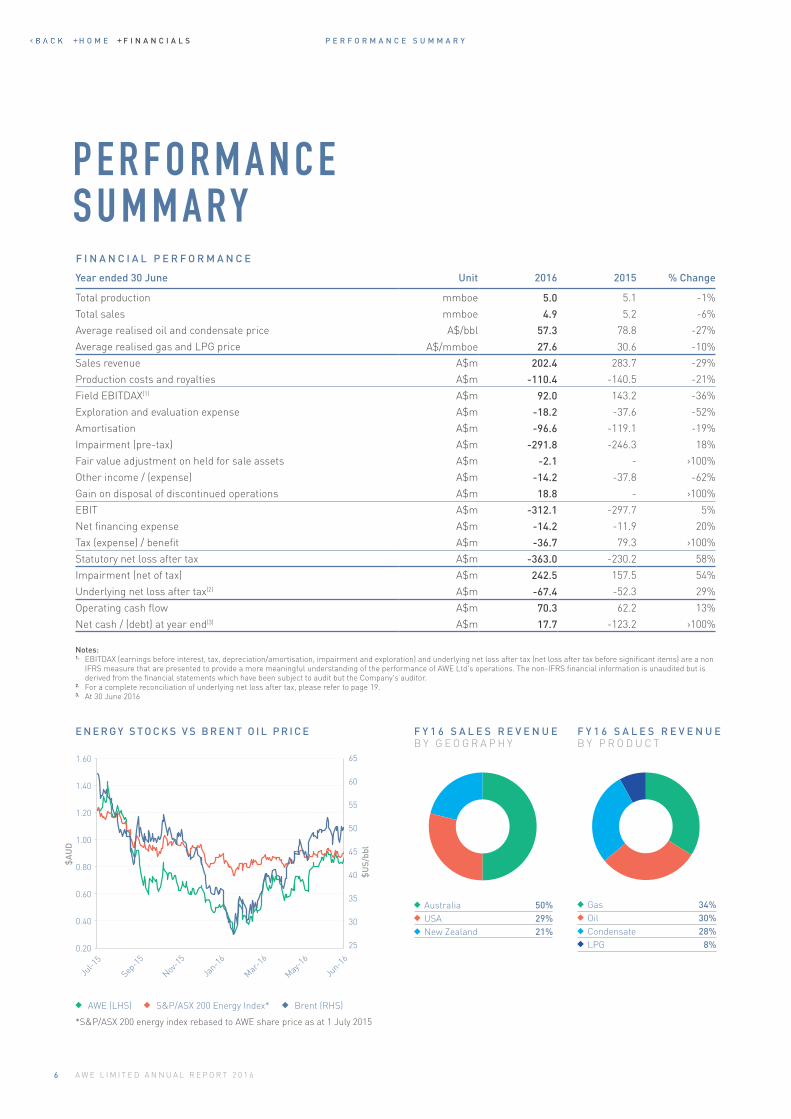
P E R F O R M A N C E S U M M A RY
Notes:1. EBITDAX (earnings before interest, tax, depreciation/amortisation, impairment and exploration) and underlying net loss after tax (net loss after tax before significant items) are a non
IFRS measure that are presented to provide a more meaningful understanding of the performance of AWE Ltd's operations. The non-IFRS financial information is unaudited but is derived from the financial statements which have been subject to audit but the Company's auditor.
2. For a complete reconciliation of underlying net loss after tax, please refer to page 19.3. At 30 June 2016
Year ended 30 June Unit 2016 2015 % Change
Total production mmboe 5.0 5.1 -1%
Total sales mmboe 4.9 5.2 -6%
Average realised oil and condensate price A$/bbl 57.3 78.8 -27%
Average realised gas and LPG price A$/mmboe 27.6 30.6 -10%
Sales revenue A$m 202.4 283.7 -29%
Production costs and royalties A$m -110.4 -140.5 -21%
Field EBITDAX(1) A$m 92.0 143.2 -36%
Exploration and evaluation expense A$m -18.2 -37.6 -52%
Amortisation A$m -96.6 -119.1 -19%
Impairment (pre-tax) A$m -291.8 -246.3 18%
Fair value adjustment on held for sale assets A$m -2.1 - ›100%
Other income / (expense) A$m -14.2 -37.8 -62%
Gain on disposal of discontinued operations A$m 18.8 - ›100%
EBIT A$m -312.1 -297.7 5%
Net financing expense A$m -14.2 -11.9 20%
Tax (expense) / benefit A$m -36.7 79.3 ›100%
Statutory net loss after tax A$m -363.0 -230.2 58%
Impairment (net of tax) A$m 242.5 157.5 54%
Underlying net loss after tax(2) A$m -67.4 -52.3 29%
Operating cash flow A$m 70.3 62.2 13%
Net cash / (debt) at year end(3) A$m 17.7 -123.2 ›100%
E N E R G Y S T O C K S V S B R E N T O I L P R I C E
AWE (LHS) Brent (RHS)S&P/ASX 200 Energy Index*
F I N A N C I A L P E R F O R M A N C E
1.60
1.40
1.20
1.00
0.80
0.60
0.40
0.20
$A
UD
$U
S/bb
l
65
60
55
50
45
40
35
30
25
*S&P/ASX 200 energy index rebased to AWE share price as at 1 July 2015
Gas 34% Oil 30% Condensate 28%LPG 8%
F Y 1 6 S A L E S R E V E N U E B Y P R O D U C T
Australia 50% USA 29% New Zealand 21%
F Y 1 6 S A L E S R E V E N U E B Y G E O G R A P H Y
H O M E F I N A N C I A L S
7A W E L I M I T E D A N N U A L R E P O R T 2 0 1 6
P E R F O R M A N C E S U M M A R Y
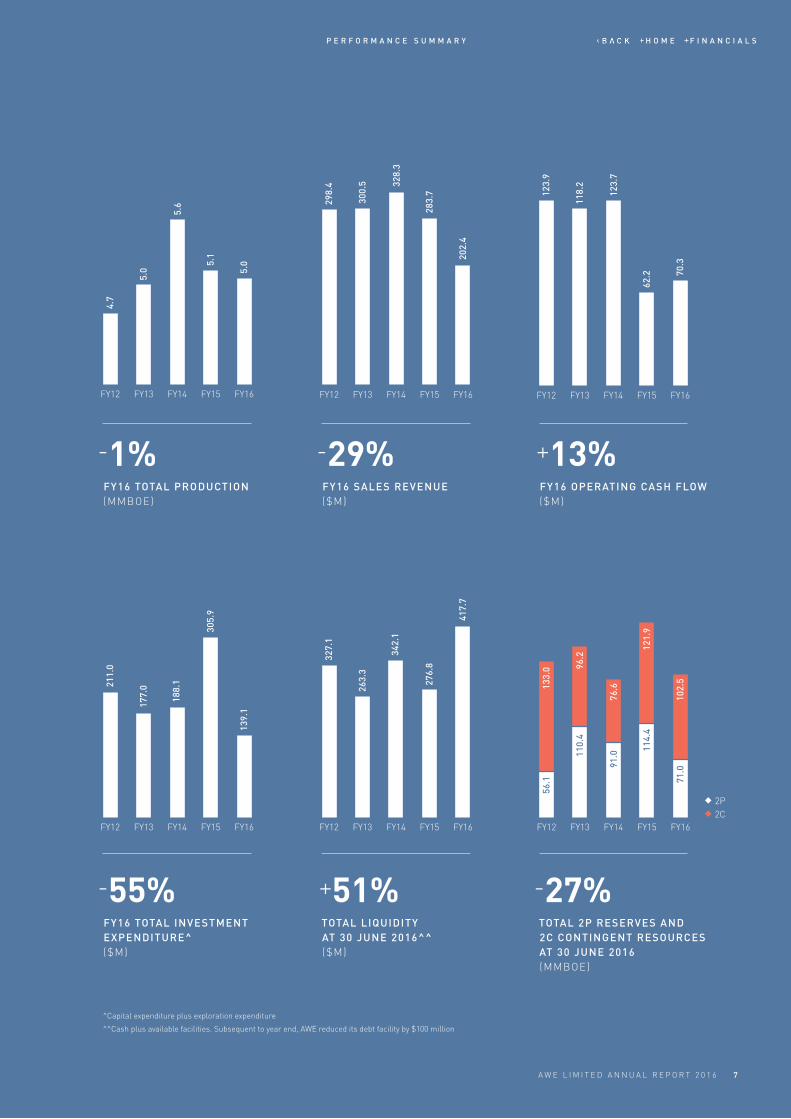
FY12 FY13 FY14 FY15 FY16
123.
9
118.
2
123.
7
62.2 70
.3
FY12 FY13 FY14 FY15 FY16
4.7
5.0
5.6
5.1
5.0
FY12 FY13 FY14 FY15 FY16
298.
4
300.
5 328.
3
283.
7
202.
4
-55%FY16 TOTAL INVESTMENT EXPENDITURE^ ($M)
^Capital expenditure plus exploration expenditure
^^Cash plus available facilities. Subsequent to year end, AWE reduced its debt facility by $100 million
FY12 FY13 FY14 FY15 FY16
211.
0
177.
0
188.
1
305.
9
139.
1
-1%FY16 TOTAL PRODUCTION(MMBOE)
FY12 FY13 FY14 FY15 FY16
327.
1
263.
3
342.
1
276.
8
417.
7
+51% TOTAL LIQUIDITY AT 30 JUNE 2016^^ ($M)
-29%FY16 SALES REVENUE($M)
+13%FY16 OPERATING CASH FLOW($M)
-27% TOTAL 2P RESERVES AND 2C CONTINGENT RESOURCES AT 30 JUNE 2016(MMBOE)
FY12 FY13 FY14 FY15 FY16
133.
0 96.2
76.6
121.
9
102.
571
.0
114.
4
91.011
0.4
56.1
2P2C
H O M E F I N A N C I A L S
8 A W E L I M I T E D A N N U A L R E P O R T 2 0 1 6
O P E R A T I O N A L O V E R V I E W
O P E R AT I O N A L OV E R V I E W
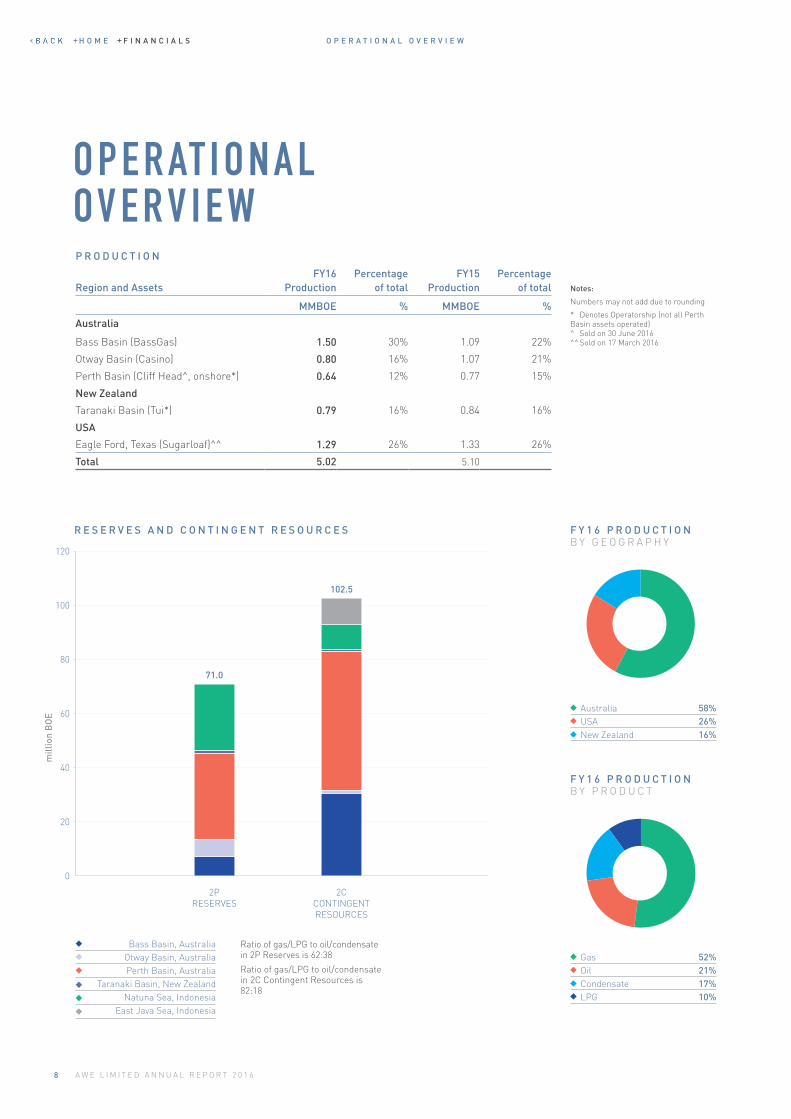
Region and AssetsFY16
ProductionPercentage
of totalFY15
ProductionPercentage
of total
MMBOE % MMBOE %
Australia
Bass Basin (BassGas) 1.50 30% 1.09 22%
Otway Basin (Casino) 0.80 16% 1.07 21%
Perth Basin (Cliff Head^, onshore*) 0.64 12% 0.77 15%
New Zealand
Taranaki Basin (Tui*) 0.79 16% 0.84 16%
USA
Eagle Ford, Texas (Sugarloaf)^^ 1.29 26% 1.33 26%
Total 5.02 5.10
P R O D U C T I O N
R E S E R V E S A N D C O N T I N G E N T R E S O U R C E S F Y 1 6 P R O D U C T I O NB Y G E O G R A P H Y
Australia 58% USA 26% New Zealand 16%
F Y 1 6 P R O D U C T I O NB Y P R O D U C T
Gas 52% Oil 21% Condensate 17%LPG 10%
Notes:
Numbers may not add due to rounding
* Denotes Operatorship (not all Perth Basin assets operated) ^ Sold on 30 June 2016 ^^ Sold on 17 March 2016
Ratio of gas/LPG to oil/condensate in 2P Reserves is 62:38
Ratio of gas/LPG to oil/condensate in 2C Contingent Resources is 82:18
Bass Basin, AustraliaOtway Basin, Australia Perth Basin, Australia
Taranaki Basin, New ZealandNatuna Sea, Indonesia
East Java Sea, Indonesia
102.5
120
100
80
60
40
20
0
2P RESERVES
2CCONTINGENT RESOURCES
mill
ion
BO
E
71.0
H O M E F I N A N C I A L S
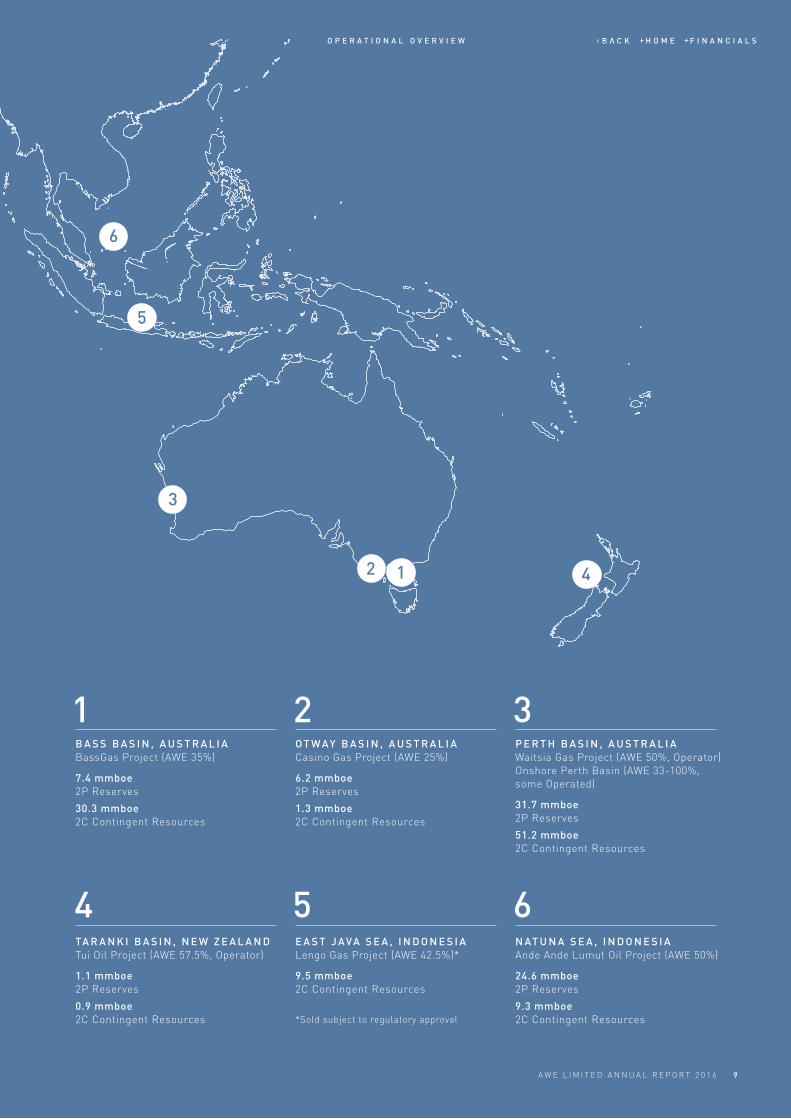
1
4
2
5
3
6
B A S S B A S I N , A U S T R A L I A BassGas Project (AWE 35%)
7.4 mmboe 2P Reserves
30.3 mmboe 2C Contingent Resources
TA R A N K I B A S I N , N E W Z E A L A N DTui Oil Project (AWE 57.5%, Operator)
1.1 mmboe 2P Reserves
0.9 mmboe 2C Contingent Resources
O T W AY B A S I N , A U S T R A L I A Casino Gas Project (AWE 25%)
6.2 mmboe 2P Reserves
1.3 mmboe 2C Contingent Resources
E A S T J AVA S E A , I N D O N E S I A Lengo Gas Project (AWE 42.5%)*
9.5 mmboe 2C Contingent Resources
P E R T H B A S I N , A U S T R A L I A Waitsia Gas Project (AWE 50%, Operator) Onshore Perth Basin (AWE 33-100%, some Operated)
31.7 mmboe 2P Reserves
51.2 mmboe 2C Contingent Resources
N AT U N A S E A , I N D O N E S I A Ande Ande Lumut Oil Project (AWE 50%)
24.6 mmboe 2P Reserves
9.3 mmboe 2C Contingent Resources*Sold subject to regulatory approval
O P E R A T I O N A L O V E R V I E W
9A W E L I M I T E D A N N U A L R E P O R T 2 0 1 6
3
5
6
42 1
H O M E F I N A N C I A L S
M A N A G I N G D I R E C T O R ' S R E V I E W
10 A W E L I M I T E D A N N U A L R E P O R T 2 0 1 6
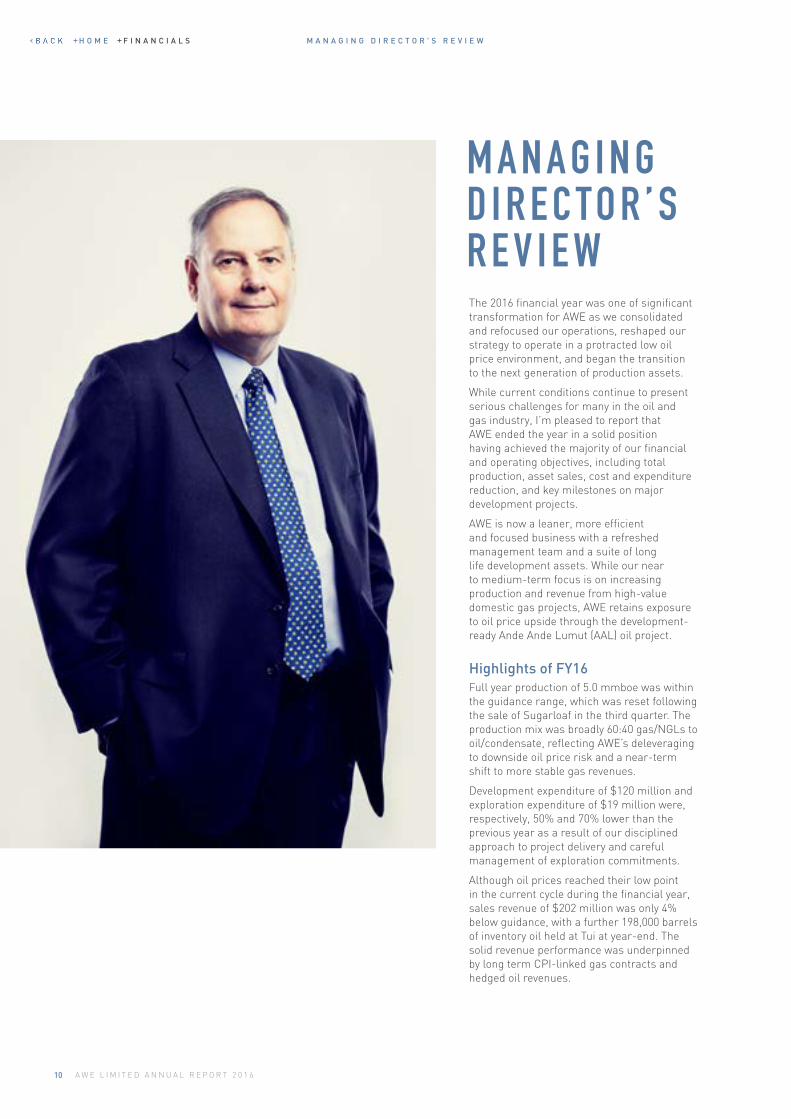
M A N A G I N G D I R E C TO R ’ S R E V I E WThe 2016 financial year was one of significant transformation for AWE as we consolidated and refocused our operations, reshaped our strategy to operate in a protracted low oil price environment, and began the transition to the next generation of production assets.
While current conditions continue to present serious challenges for many in the oil and gas industry, I’m pleased to report that AWE ended the year in a solid position having achieved the majority of our financial and operating objectives, including total production, asset sales, cost and expenditure reduction, and key milestones on major development projects.
AWE is now a leaner, more efficient and focused business with a refreshed management team and a suite of long life development assets. While our near to medium-term focus is on increasing production and revenue from high-value domestic gas projects, AWE retains exposure to oil price upside through the development-ready Ande Ande Lumut (AAL) oil project.
Highlights of FY16Full year production of 5.0 mmboe was within the guidance range, which was reset following the sale of Sugarloaf in the third quarter. The production mix was broadly 60:40 gas/NGLs to oil/condensate, reflecting AWE’s deleveraging to downside oil price risk and a near-term shift to more stable gas revenues.
Development expenditure of $120 million and exploration expenditure of $19 million were, respectively, 50% and 70% lower than the previous year as a result of our disciplined approach to project delivery and careful management of exploration commitments.
Although oil prices reached their low point in the current cycle during the financial year, sales revenue of $202 million was only 4% below guidance, with a further 198,000 barrels of inventory oil held at Tui at year-end. The solid revenue performance was underpinned by long term CPI-linked gas contracts and hedged oil revenues.
H O M E F I N A N C I A L S
11A W E L I M I T E D A N N U A L R E P O R T 2 0 1 6
M A N A G I N G D I R E C T O R ' S R E V I E W
Operating cash flow improved by 13% to $70 million, while Field EBITDAX at $92 million was impacted by lower oil prices. The average oil/condensate price for the financial year was A$57.30 per barrel compared to A$78.77 per barrel for FY15.
Non-cash impairments, reflecting lower oil prices and a write down of BassGas 2P Reserves, totalled $242 million after tax and were the major factor in the company’s full year $363 million statutory net loss after tax. After adjusting for non-recurring items, AWE’s underlying loss for the financial year was $67 million.
AWE focused on maintaining balance sheet flexibility during the year. We successfully implemented a program to divest non-core assets, including Sugarloaf in the USA, which significantly reduced recurring capex and future decommissioning liabilities and allowed the company to repay drawn debt. As a result, AWE finished FY16 in a net cash position of $18 million and, subsequent to year-end, reduced its debt facility by $100 million to $300 million.
The company also made excellent progress on reducing overheads with field operating costs down 21% to $110 million and corporate administration costs down 41% to $10 million. These savings were realised through the sale of Sugarloaf, closure of the Jakarta project office (replaced with a representative office), a reduction in staff numbers in Sydney and New Plymouth, and the implementation of more efficient procurement practices.
Importantly for the future, significant progress was made on developing our two primary high-quality growth opportunities – the Waitsia gas project in Western Australia, and the AAL oil project in Indonesia – with both projects now targeting a Final Investment Decision (FID) in late 2017.
Safety, Health and EnvironmentThe safety and health of our employees and contractors, and responsible environmental management, are fundamental priorities for AWE as an Operator of onshore and offshore oil and gas assets.
Consistent with our ground-up approach to safety management, I am very pleased to report there were no Lost Time Injuries (LTI) during the financial year. This reflects a strong safety culture at AWE that continues to prioritise the safety of all employees, contractors and visitors on operating sites.
Pleasingly, no reportable environmental incidents were recorded during the year. A more complete assessment of AWE’s environmental performance, including greenhouse gas emissions and intensity, will be available in the company’s 2016 Sustainability Report.
Divesting non-core assetsIn August 2015, as part of a series of cost control and business optimisation initiatives, we reprioritised our portfolio, narrowed our geographic focus, and commenced a program to divest non-core assets and recycle capital back into our balance sheet for re-deployment into our strong pipeline of growth projects.
In March 2016 we completed the sale of our 10% interest in the Sugarloaf unconventional oil project in the USA for US$190 million, a price that substantially exceeded market expectations. The sale of our 57.5% in the Cliff Head oil project, offshore Western Australia, for $3 million was completed in June 2016 and the sale of Lengo, a pre-development gas project in Indonesia, for up to $27 million was announced in May 2016 and is awaiting final regulatory approval.
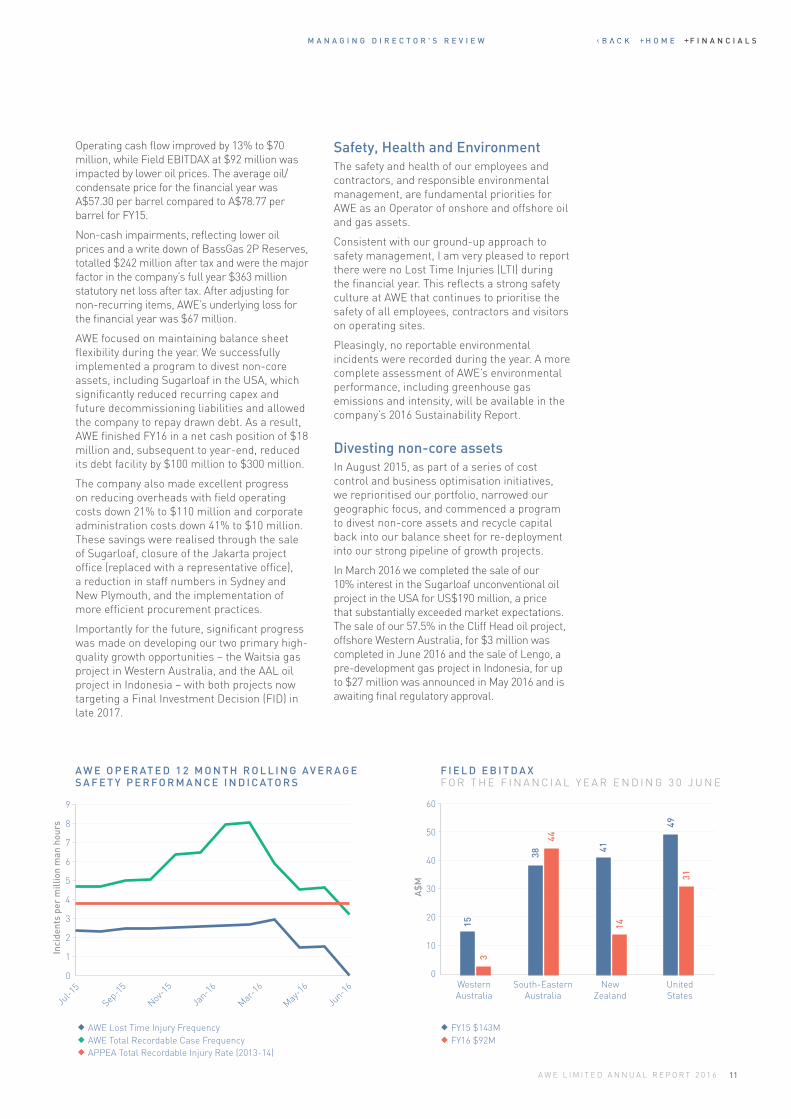
A W E O P E R AT E D 1 2 M O N T H R O L L I N G AV E R A G E S A F E T Y P E R F O R M A N C E I N D I C AT O R S
F I E L D E B I T D A X F O R T H E F I N A N C I A L Y E A R E N D I N G 3 0 J U N E
AWE Lost Time Injury Frequency FY15 $143MAWE Total Recordable Case Frequency FY16 $92MAPPEA Total Recordable Injury Rate (2013-14)
Inci
dent
s pe
r m
illio
n m
an h
ours
9
8
7
6
5
4
3
2
1
0
A$
M
60
50
40
30
20
10
0WesternAustralia
South-EasternAustralia
New Zealand
United States
15
3
38
44
14
41
49
31
H O M E F I N A N C I A L S
12 A W E L I M I T E D A N N U A L R E P O R T 2 0 1 6
M A N A G I N G D I R E C T O R ' S R E V I E W
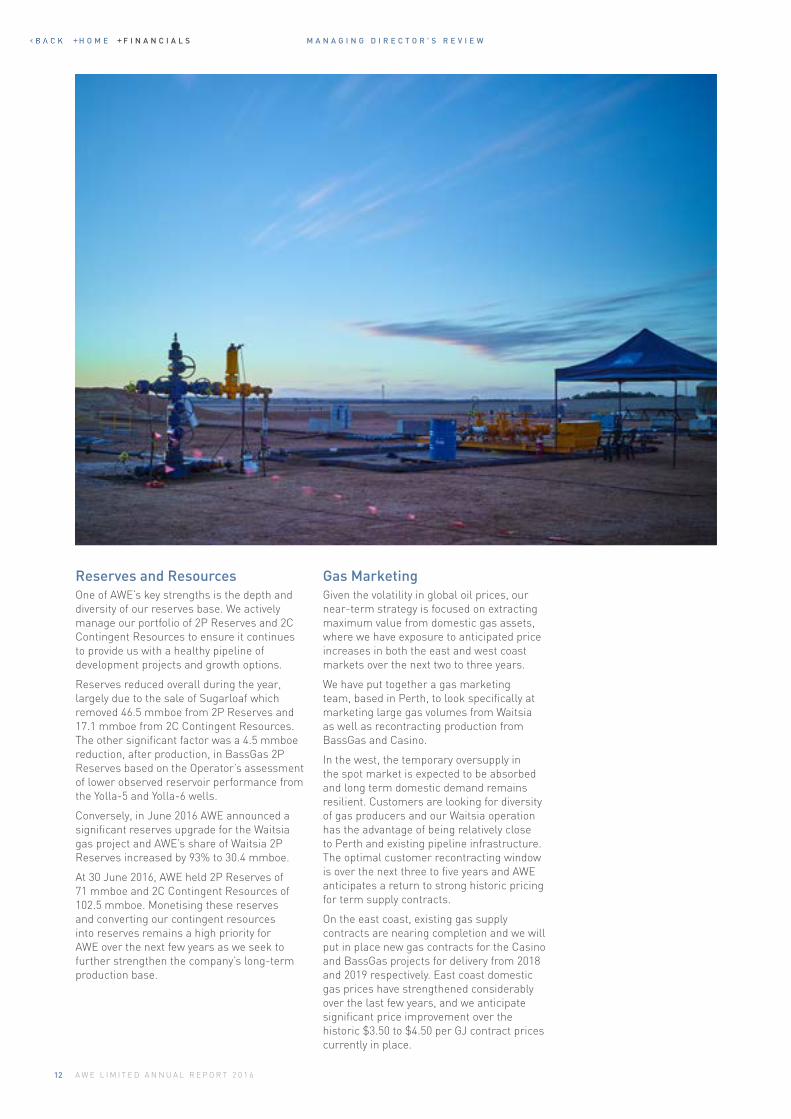
Reserves and Resources One of AWE’s key strengths is the depth and diversity of our reserves base. We actively manage our portfolio of 2P Reserves and 2C Contingent Resources to ensure it continues to provide us with a healthy pipeline of development projects and growth options.
Reserves reduced overall during the year, largely due to the sale of Sugarloaf which removed 46.5 mmboe from 2P Reserves and 17.1 mmboe from 2C Contingent Resources. The other significant factor was a 4.5 mmboe reduction, after production, in BassGas 2P Reserves based on the Operator’s assessment of lower observed reservoir performance from the Yolla-5 and Yolla-6 wells.
Conversely, in June 2016 AWE announced a significant reserves upgrade for the Waitsia gas project and AWE’s share of Waitsia 2P Reserves increased by 93% to 30.4 mmboe.
At 30 June 2016, AWE held 2P Reserves of 71 mmboe and 2C Contingent Resources of 102.5 mmboe. Monetising these reserves and converting our contingent resources into reserves remains a high priority for AWE over the next few years as we seek to further strengthen the company’s long-term production base.
Gas MarketingGiven the volatility in global oil prices, our near-term strategy is focused on extracting maximum value from domestic gas assets, where we have exposure to anticipated price increases in both the east and west coast markets over the next two to three years.
We have put together a gas marketing team, based in Perth, to look specifically at marketing large gas volumes from Waitsia as well as recontracting production from BassGas and Casino.
In the west, the temporary oversupply in the spot market is expected to be absorbed and long term domestic demand remains resilient. Customers are looking for diversity of gas producers and our Waitsia operation has the advantage of being relatively close to Perth and existing pipeline infrastructure. The optimal customer recontracting window is over the next three to five years and AWE anticipates a return to strong historic pricing for term supply contracts.
On the east coast, existing gas supply contracts are nearing completion and we will put in place new gas contracts for the Casino and BassGas projects for delivery from 2018 and 2019 respectively. East coast domestic gas prices have strengthened considerably over the last few years, and we anticipate significant price improvement over the historic $3.50 to $4.50 per GJ contract prices currently in place.
H O M E F I N A N C I A L S
13A W E L I M I T E D A N N U A L R E P O R T 2 0 1 6
M A N A G I N G D I R E C T O R ' S R E V I E W
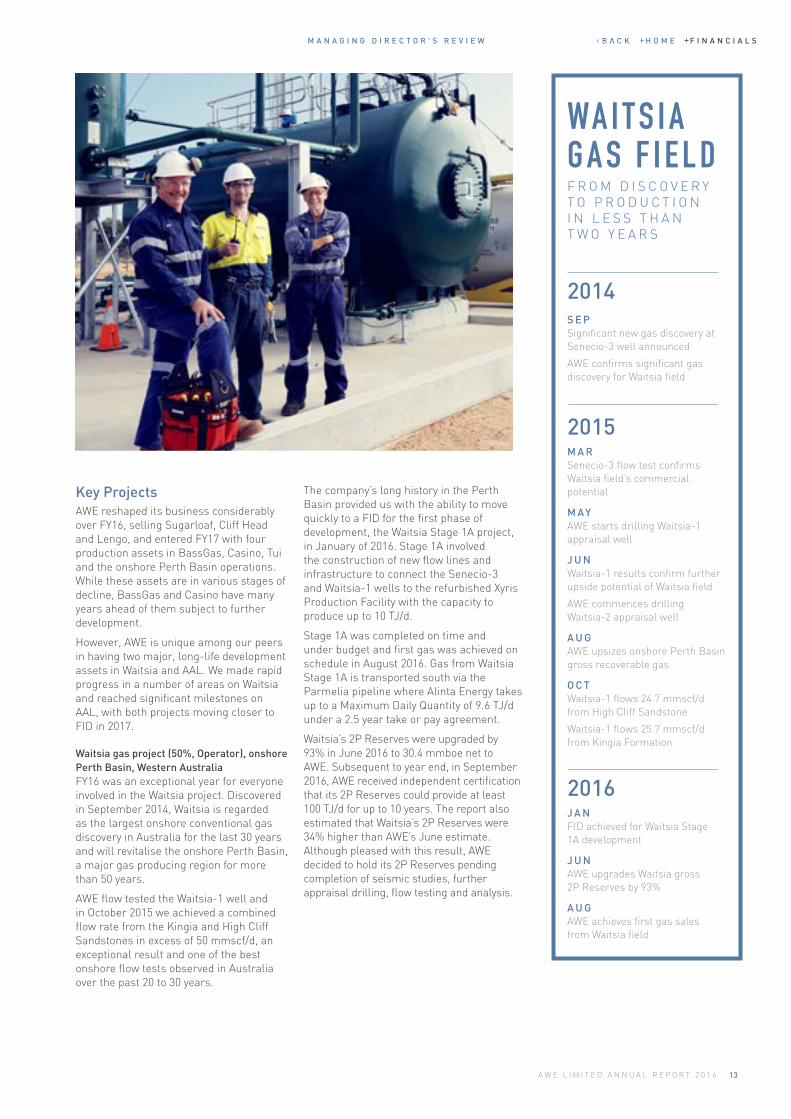
Key Projects AWE reshaped its business considerably over FY16, selling Sugarloaf, Cliff Head and Lengo, and entered FY17 with four production assets in BassGas, Casino, Tui and the onshore Perth Basin operations. While these assets are in various stages of decline, BassGas and Casino have many years ahead of them subject to further development.
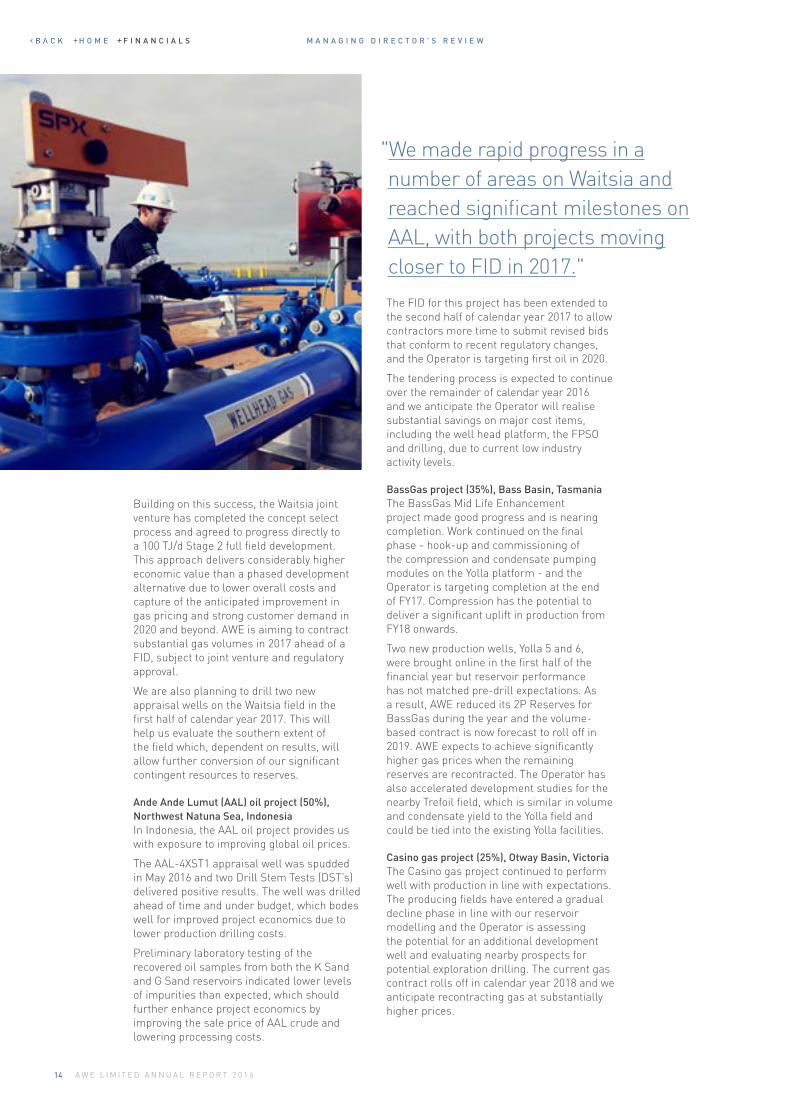
However, AWE is unique among our peers in having two major, long-life development assets in Waitsia and AAL. We made rapid progress in a number of areas on Waitsia and reached significant milestones on AAL, with both projects moving closer to FID in 2017.
Waitsia gas project (50%, Operator), onshore Perth Basin, Western AustraliaFY16 was an exceptional year for everyone involved in the Waitsia project. Discovered in September 2014, Waitsia is regarded as the largest onshore conventional gas discovery in Australia for the last 30 years and will revitalise the onshore Perth Basin, a major gas producing region for more than 50 years.
AWE flow tested the Waitsia-1 well and in October 2015 we achieved a combined flow rate from the Kingia and High Cliff Sandstones in excess of 50 mmscf/d, an exceptional result and one of the best onshore flow tests observed in Australia over the past 20 to 30 years.
The company’s long history in the Perth Basin provided us with the ability to move quickly to a FID for the first phase of development, the Waitsia Stage 1A project, in January of 2016. Stage 1A involved the construction of new flow lines and infrastructure to connect the Senecio-3 and Waitsia-1 wells to the refurbished Xyris Production Facility with the capacity to produce up to 10 TJ/d.
Stage 1A was completed on time and under budget and first gas was achieved on schedule in August 2016. Gas from Waitsia Stage 1A is transported south via the Parmelia pipeline where Alinta Energy takes up to a Maximum Daily Quantity of 9.6 TJ/d under a 2.5 year take or pay agreement.
Waitsia’s 2P Reserves were upgraded by 93% in June 2016 to 30.4 mmboe net to AWE. Subsequent to year end, in September 2016, AWE received independent certification that its 2P Reserves could provide at least 100 TJ/d for up to 10 years. The report also estimated that Waitsia’s 2P Reserves were 34% higher than AWE’s June estimate. Although pleased with this result, AWE decided to hold its 2P Reserves pending completion of seismic studies, further appraisal drilling, flow testing and analysis.
2014 S E P Significant new gas discovery at Senecio-3 well announced
AWE confirms significant gas discovery for Waitsia field
2015 M A R Senecio-3 flow test confirms Waitsia field’s commercial potential
M AY AWE starts drilling Waitsia-1 appraisal well
J U N Waitsia-1 results confirm further upside potential of Waitsia field
AWE commences drilling Waitsia-2 appraisal well
A U G AWE upsizes onshore Perth Basin gross recoverable gas
O C T Waitsia-1 flows 24.7 mmscf/d from High Cliff Sandstone
Waitsia-1 flows 25.7 mmscf/d from Kingia Formation
2016J A N FID achieved for Waitsia Stage 1A development
J U N AWE upgrades Waitsia gross 2P Reserves by 93%
A U G AWE achieves first gas sales from Waitsia field
WA I T S I A G A S F I E L DF R O M D I S C O V E R Y T O P R O D U C T I O N I N L E S S T H A N T W O Y E A R S
H O M E F I N A N C I A L S
14 A W E L I M I T E D A N N U A L R E P O R T 2 0 1 6
M A N A G I N G D I R E C T O R ' S R E V I E W
Building on this success, the Waitsia joint venture has completed the concept select process and agreed to progress directly to a 100 TJ/d Stage 2 full field development. This approach delivers considerably higher economic value than a phased development alternative due to lower overall costs and capture of the anticipated improvement in gas pricing and strong customer demand in 2020 and beyond. AWE is aiming to contract substantial gas volumes in 2017 ahead of a FID, subject to joint venture and regulatory approval.
We are also planning to drill two new appraisal wells on the Waitsia field in the first half of calendar year 2017. This will help us evaluate the southern extent of the field which, dependent on results, will allow further conversion of our significant contingent resources to reserves.
Ande Ande Lumut (AAL) oil project (50%), Northwest Natuna Sea, IndonesiaIn Indonesia, the AAL oil project provides us with exposure to improving global oil prices.
The AAL-4XST1 appraisal well was spudded in May 2016 and two Drill Stem Tests (DST’s) delivered positive results. The well was drilled ahead of time and under budget, which bodes well for improved project economics due to lower production drilling costs.
Preliminary laboratory testing of the recovered oil samples from both the K Sand and G Sand reservoirs indicated lower levels of impurities than expected, which should further enhance project economics by improving the sale price of AAL crude and lowering processing costs.
The FID for this project has been extended to the second half of calendar year 2017 to allow contractors more time to submit revised bids that conform to recent regulatory changes, and the Operator is targeting first oil in 2020.
The tendering process is expected to continue over the remainder of calendar year 2016 and we anticipate the Operator will realise substantial savings on major cost items, including the well head platform, the FPSO and drilling, due to current low industry activity levels.
BassGas project (35%), Bass Basin, TasmaniaThe BassGas Mid Life Enhancement project made good progress and is nearing completion. Work continued on the final phase - hook-up and commissioning of the compression and condensate pumping modules on the Yolla platform - and the Operator is targeting completion at the end of FY17. Compression has the potential to deliver a significant uplift in production from FY18 onwards.
Two new production wells, Yolla 5 and 6, were brought online in the first half of the financial year but reservoir performance has not matched pre-drill expectations. As a result, AWE reduced its 2P Reserves for BassGas during the year and the volume-based contract is now forecast to roll off in 2019. AWE expects to achieve significantly higher gas prices when the remaining reserves are recontracted. The Operator has also accelerated development studies for the nearby Trefoil field, which is similar in volume and condensate yield to the Yolla field and could be tied into the existing Yolla facilities.
Casino gas project (25%), Otway Basin, VictoriaThe Casino gas project continued to perform well with production in line with expectations. The producing fields have entered a gradual decline phase in line with our reservoir modelling and the Operator is assessing the potential for an additional development well and evaluating nearby prospects for potential exploration drilling. The current gas contract rolls off in calendar year 2018 and we anticipate recontracting gas at substantially higher prices.
"We made rapid progress in a number of areas on Waitsia and reached significant milestones on AAL, with both projects moving closer to FID in 2017."
H O M E F I N A N C I A L S
15A W E L I M I T E D A N N U A L R E P O R T 2 0 1 6
M A N A G I N G D I R E C T O R ' S R E V I E W
David Biggs Managing Director and CEO
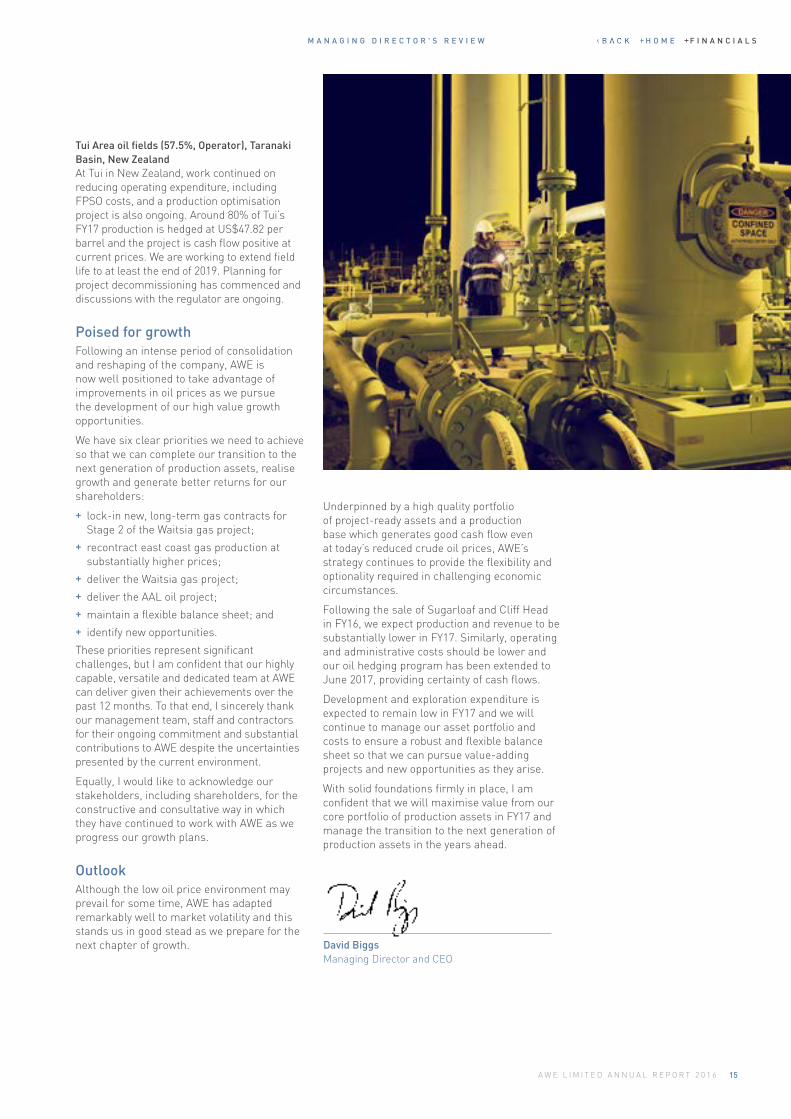
Tui Area oil fields (57.5%, Operator), Taranaki Basin, New ZealandAt Tui in New Zealand, work continued on reducing operating expenditure, including FPSO costs, and a production optimisation project is also ongoing. Around 80% of Tui’s FY17 production is hedged at US$47.82 per barrel and the project is cash flow positive at current prices. We are working to extend field life to at least the end of 2019. Planning for project decommissioning has commenced and discussions with the regulator are ongoing.
Poised for growthFollowing an intense period of consolidation and reshaping of the company, AWE is now well positioned to take advantage of improvements in oil prices as we pursue the development of our high value growth opportunities.
We have six clear priorities we need to achieve so that we can complete our transition to the next generation of production assets, realise growth and generate better returns for our shareholders:
+ lock-in new, long-term gas contracts for Stage 2 of the Waitsia gas project;
+ recontract east coast gas production at substantially higher prices;
+ deliver the Waitsia gas project; + deliver the AAL oil project; + maintain a flexible balance sheet; and + identify new opportunities.
These priorities represent significant challenges, but I am confident that our highly capable, versatile and dedicated team at AWE can deliver given their achievements over the past 12 months. To that end, I sincerely thank our management team, staff and contractors for their ongoing commitment and substantial contributions to AWE despite the uncertainties presented by the current environment.
Equally, I would like to acknowledge our stakeholders, including shareholders, for the constructive and consultative way in which they have continued to work with AWE as we progress our growth plans.
OutlookAlthough the low oil price environment may prevail for some time, AWE has adapted remarkably well to market volatility and this stands us in good stead as we prepare for the next chapter of growth.
Underpinned by a high quality portfolio of project-ready assets and a production base which generates good cash flow even at today’s reduced crude oil prices, AWE’s strategy continues to provide the flexibility and optionality required in challenging economic circumstances.
Following the sale of Sugarloaf and Cliff Head in FY16, we expect production and revenue to be substantially lower in FY17. Similarly, operating and administrative costs should be lower and our oil hedging program has been extended to June 2017, providing certainty of cash flows.
Development and exploration expenditure is expected to remain low in FY17 and we will continue to manage our asset portfolio and costs to ensure a robust and flexible balance sheet so that we can pursue value-adding projects and new opportunities as they arise.
With solid foundations firmly in place, I am confident that we will maximise value from our core portfolio of production assets in FY17 and manage the transition to the next generation of production assets in the years ahead.
H O M E F I N A N C I A L S

16 A W E L I M I T E D A N N U A L R E P O R T 2 0 1 6
B O A R D A N D M A N A G E M E N T
B OA R D O F D I R E C TO R S
M A N A G E M E N T T E A M
BRUCE PHILLIPS BSc (Hons) Geol
Independent Non-executive Director, Chairman
DAVID BIGGSLLB, MAICD
Managing Director and Chief Executive Officer
IAN BUCKNELLBBus, CPA, GAICD
Chief Financial Officer
DAVID BIGGSLLB, MAICD
Managing Director and Chief Executive Officer
DAVID McEVOYBSc (Physics), Grad Dip (Geophysics)
Independent Non-executive Director
ANDY FURNISSMSc Exploration Geophysics, BSc (Hons) Geological Sciences, FGS
General Manager Exploration and Geoscience
KENNETH WILLIAMS BEc (Hons), MAppFin, MAICD
Independent Non-executive Director
DR. SUZANNE HUNTBSc (Hons), MSc, PhD.
General Manager WA Assets and Engineering
RAY BETROSBEng Chemical, Grad Dip Process Plant Engineering
Independent Non-executive Director
NEVILLE KELLYBCom (Merit) CPA
Company Secretary and General Manager Corporate
KAREN PENROSEBComm CPA, GAICD
Independent Non-executive Director
H O M E F I N A N C I A L S
17A W E L I M I T E D A N N U A L R E P O R T 2 0 1 6
P E R M I T S
17A W E L I M I T E D A N N U A L R E P O R T 2 0 1 6
Directors’ report 18
Auditor’s independence declaration 28 to the directors of AWE Limited
Remuneration report 29
Financial statements 46
Consolidated income statement 47
Consolidated statement of 48 comprehensive income
Consolidated statement of financial position 49
Consolidated statement of cash flows 50
Consolidated statement of changes in equity 51
Notes to the consolidated 52 financial statements
Directors’ declaration 89
Independent auditor's report to 90 the members of AWE Limited
Note: A copy of AWE’s 2016 Corporate Governance Statement can be found on the Company’s website at www.awexplore.com
AW E L I M I T E D
2 0 1 6 F I N A N C I A L R E P O RT
F I N A N C I A L R E P O R T H O M E F I N A N C I A L S
18 A W E L I M I T E D A N N U A L R E P O R T 2 0 1 6
D I R E C T O R S ' R E P O R T
DIRECTORS’ REPORT
30 June 2016
30 June 2015 Variance
Overview of consolidated entity mmboe mmboe %
Production
Gas 2.59 2.59 0%
LPG production 0.52 0.46 14%
Condensate production 0.84 0.85 (1%)
Oil 1.07 1.20 (11%)
Total production 5.02 5.09 (1%)
The directors present their report together with the consolidated financial report of the entity being AWE Limited (“AWE” or “the Company”), and its controlled entities, for the year ended 30 June 2016 and the auditor’s report thereon.
The directors of the Company during the year are set out on page 24 of the Directors’ Report.
Operating and financial reviewThe Operating and Financial Review of the consolidated entity for the year ended 30 June 2016 is prepared in accordance with section 299A of the Corporations Act 2001 (Cth). The information provided in this review forms part of the Directors’ Report and provides information to assist readers assess the operations, financial position and business strategies of AWE.
The principal activities of AWE continue to be the exploration for, development and production of hydrocarbons.
1. Performance overviewFinancial year 2016 proved to be another challenging year for the oil and gas industry globally with continuing low oil prices. Like other organisations in the sector, AWE was impacted by these external market conditions, with lower oil prices leading to lower revenue, operating cash flow and profit for the year.
In the context of the decline in global oil prices and continuing volatility, the Company undertook a review which resulted in a number of key initiatives designed to respond to the challenges of the external environment. These included:
+ Ensuring certainty of cash flow - successful implementation of a hedging program which added $11.8m in revenues for the period (FY2015 $nil);
+ Reducing discretionary spending – reduced overheads by ›30% and implemented procurement and operating cost savings;
+ Optimising operating structure – closed Jakarta office, exited USA, reduced staffing levels by 30%;
+ Focusing in the near term on Australian gas assets - particularly west coast and east coast Australia;
+ Reducing total capital spend – reduced total capital spend by more than 50% from $242.5 million in FY2015 to $120.3 million in FY2016; and
+ Maintain flexible balance sheet – through a prioritising of investment spend and recycling of capital from asset sales to debt reduction.
Despite the challenges presented by these external conditions, the Company delivered a solid operating performance, with a number of important achievements:
+ HSE - No reportable environmental incidents recorded and no safety incidents during the period. The Company continues to prioritise the health and safety of employees and contractors at AWE sites;
+ Community and stakeholder engagement - continued open engagement with landowners, local communities, regulators and governments particularly in Western Australia and New Zealand where we operate;
+ Production - Total production of 5.0 mmboe, in line with market guidance and the previous year with 60:40 ratio of gas / NGL’s and liquids production;
+ Development - Successfully completed Stage 1A construction and commencement of gas production subsequent to the end of the period at the AWE operated Waitsia gas project;
+ Reserves - While reserves reduced overall due to the sale of Sugarloaf, a 93% increase in 2P Reserves to 344Bcf of gas (AWE share 172 Bcf of gas or 30.4 mmboe) and a 30% increase in 2C Contingent Resources to 630 Bcf (AWE share 315 Bcf or 55.7 mmboe) was recognised in respect of Waitsia gas project;
+ Completion of asset sales including Sugarloaf and Cliff Head enabling the recycling of capital to AWE’s Australian gas assets;
+ Reduced exposure to oil price - The near term exposure to oil price volatility has been significantly reduced;
+ Successful completion of an appraisal well for the Ande Ande Lumut project, which provides the opportunity to benefit from future improvements in the oil price;
+ Debt reduction - net debt repayment of $153.8 million during the period and net cash of $17.8 million held at 30 June 2016.
The following tables provide an overview of the production and financial performance of AWE as detailed in the subsequent Financial Report. It should be noted that continuing and discontinued operations have been aggregated in these tables and the following commentary.
H O M E F I N A N C I A L S
19A W E L I M I T E D A N N U A L R E P O R T 2 0 1 6
D I R E C T O R S ' R E P O R T
30 June 2016
30 June 2015 Variance
Overview of consolidated entity $million $million %
Sales revenue 202.4 283.7 (29%)
Production costs and royalties (110.4) (140.5) (21%)
Field EBITDAX(1) & (2) 92.0 143.2 (36%)
Exploration and evaluation expense
(18.2) (37.6) (52%)
Amortisation (96.6) (119.1) (19%)
Net financing expense (14.2) (11.9) 20%
Impairment (291.8) (246.3) 18%
Fair value adjustment on held for sale assets
(2.1) - -
Other income / (expense) (14.2) (37.8) (62%)
Gain on disposal of discontinued operations 18.8 - -
Statutory net loss before tax (326.3) (309.5) 5%
Tax (expense) / benefit (36.7) 79.3 ›100%
Statutory net loss after tax (NPAT) (363.0) (230.2) 58%
Cash flow from operating activities
70.3 62.2 13%
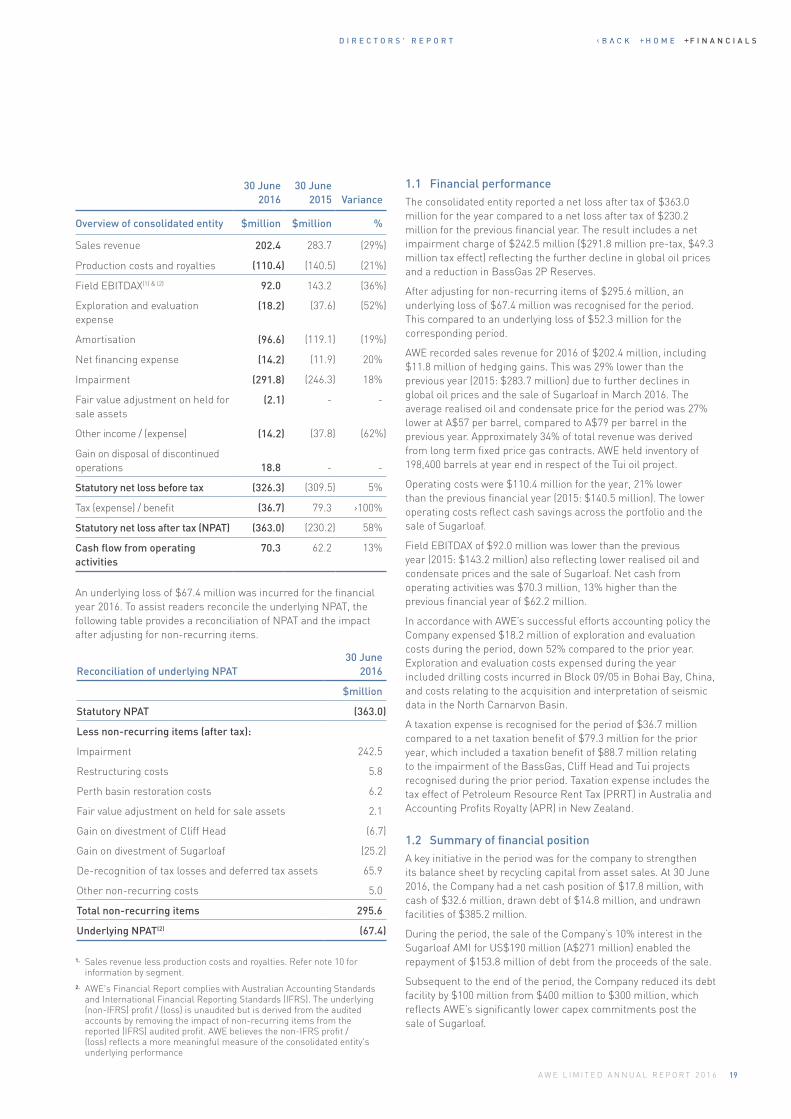
An underlying loss of $67.4 million was incurred for the financial year 2016. To assist readers reconcile the underlying NPAT, the following table provides a reconciliation of NPAT and the impact after adjusting for non-recurring items.
Reconciliation of underlying NPAT30 June
2016
$million
Statutory NPAT (363.0)
Less non-recurring items (after tax):
Impairment 242.5
Restructuring costs 5.8
Perth basin restoration costs 6.2
Fair value adjustment on held for sale assets 2.1
Gain on divestment of Cliff Head (6.7)
Gain on divestment of Sugarloaf (25.2)
De-recognition of tax losses and deferred tax assets 65.9
Other non-recurring costs 5.0
Total non-recurring items 295.6
Underlying NPAT(2) (67.4)
1. Sales revenue less production costs and royalties. Refer note 10 for information by segment.
2. AWE's Financial Report complies with Australian Accounting Standards and International Financial Reporting Standards (IFRS). The underlying (non-IFRS) profit / (loss) is unaudited but is derived from the audited accounts by removing the impact of non-recurring items from the reported (IFRS) audited profit. AWE believes the non-IFRS profit / (loss) reflects a more meaningful measure of the consolidated entity's underlying performance
1.1 Financial performanceThe consolidated entity reported a net loss after tax of $363.0 million for the year compared to a net loss after tax of $230.2 million for the previous financial year. The result includes a net impairment charge of $242.5 million ($291.8 million pre-tax, $49.3 million tax effect) reflecting the further decline in global oil prices and a reduction in BassGas 2P Reserves.
After adjusting for non-recurring items of $295.6 million, an underlying loss of $67.4 million was recognised for the period. This compared to an underlying loss of $52.3 million for the corresponding period.
AWE recorded sales revenue for 2016 of $202.4 million, including $11.8 million of hedging gains. This was 29% lower than the previous year (2015: $283.7 million) due to further declines in global oil prices and the sale of Sugarloaf in March 2016. The average realised oil and condensate price for the period was 27% lower at A$57 per barrel, compared to A$79 per barrel in the previous year. Approximately 34% of total revenue was derived from long term fixed price gas contracts. AWE held inventory of 198,400 barrels at year end in respect of the Tui oil project.
Operating costs were $110.4 million for the year, 21% lower than the previous financial year (2015: $140.5 million). The lower operating costs reflect cash savings across the portfolio and the sale of Sugarloaf.
Field EBITDAX of $92.0 million was lower than the previous year (2015: $143.2 million) also reflecting lower realised oil and condensate prices and the sale of Sugarloaf. Net cash from operating activities was $70.3 million, 13% higher than the previous financial year of $62.2 million.
In accordance with AWE’s successful efforts accounting policy the Company expensed $18.2 million of exploration and evaluation costs during the period, down 52% compared to the prior year. Exploration and evaluation costs expensed during the year included drilling costs incurred in Block 09/05 in Bohai Bay, China, and costs relating to the acquisition and interpretation of seismic data in the North Carnarvon Basin.
A taxation expense is recognised for the period of $36.7 million compared to a net taxation benefit of $79.3 million for the prior year, which included a taxation benefit of $88.7 million relating to the impairment of the BassGas, Cliff Head and Tui projects recognised during the prior period. Taxation expense includes the tax effect of Petroleum Resource Rent Tax (PRRT) in Australia and Accounting Profits Royalty (APR) in New Zealand.
1.2 Summary of financial positionA key initiative in the period was for the company to strengthen its balance sheet by recycling capital from asset sales. At 30 June 2016, the Company had a net cash position of $17.8 million, with cash of $32.6 million, drawn debt of $14.8 million, and undrawn facilities of $385.2 million.
During the period, the sale of the Company’s 10% interest in the Sugarloaf AMI for US$190 million (A$271 million) enabled the repayment of $153.8 million of debt from the proceeds of the sale.
Subsequent to the end of the period, the Company reduced its debt facility by $100 million from $400 million to $300 million, which reflects AWE’s significantly lower capex commitments post the sale of Sugarloaf.
H O M E F I N A N C I A L S
20 A W E L I M I T E D A N N U A L R E P O R T 2 0 1 6
D I R E C T O R S ' R E P O R T
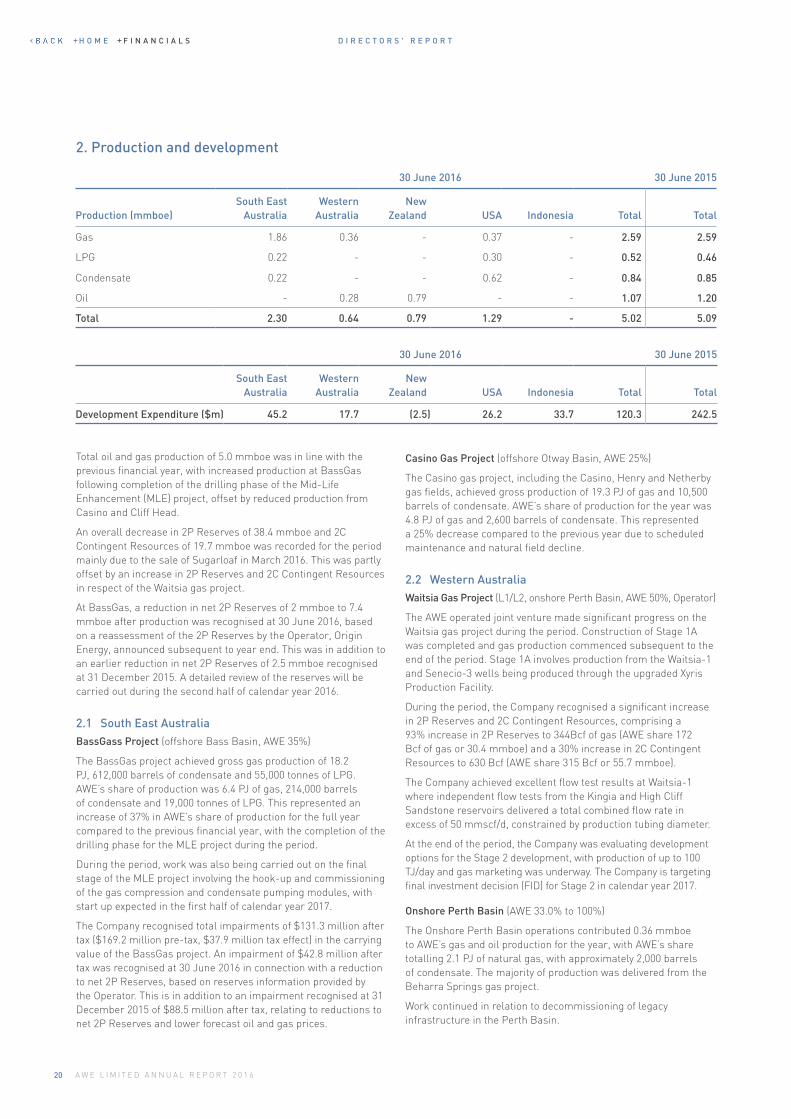
2. Production and development
30 June 2016 30 June 2015
Production (mmboe)South East
AustraliaWestern
AustraliaNew
Zealand USA Indonesia Total Total
Gas 1.86 0.36 - 0.37 - 2.59 2.59
LPG 0.22 - - 0.30 - 0.52 0.46
Condensate 0.22 - - 0.62 - 0.84 0.85
Oil - 0.28 0.79 - - 1.07 1.20
Total 2.30 0.64 0.79 1.29 - 5.02 5.09
30 June 2016 30 June 2015
South East Australia
Western Australia
New Zealand USA Indonesia Total Total
Development Expenditure ($m) 45.2 17.7 (2.5) 26.2 33.7 120.3 242.5
Total oil and gas production of 5.0 mmboe was in line with the previous financial year, with increased production at BassGas following completion of the drilling phase of the Mid-Life Enhancement (MLE) project, offset by reduced production from Casino and Cliff Head.
An overall decrease in 2P Reserves of 38.4 mmboe and 2C Contingent Resources of 19.7 mmboe was recorded for the period mainly due to the sale of Sugarloaf in March 2016. This was partly offset by an increase in 2P Reserves and 2C Contingent Resources in respect of the Waitsia gas project.
At BassGas, a reduction in net 2P Reserves of 2 mmboe to 7.4 mmboe after production was recognised at 30 June 2016, based on a reassessment of the 2P Reserves by the Operator, Origin Energy, announced subsequent to year end. This was in addition to an earlier reduction in net 2P Reserves of 2.5 mmboe recognised at 31 December 2015. A detailed review of the reserves will be carried out during the second half of calendar year 2016.
2.1 South East AustraliaBassGass Project (offshore Bass Basin, AWE 35%)
The BassGas project achieved gross gas production of 18.2 PJ, 612,000 barrels of condensate and 55,000 tonnes of LPG. AWE’s share of production was 6.4 PJ of gas, 214,000 barrels of condensate and 19,000 tonnes of LPG. This represented an increase of 37% in AWE’s share of production for the full year compared to the previous financial year, with the completion of the drilling phase for the MLE project during the period.
During the period, work was also being carried out on the final stage of the MLE project involving the hook-up and commissioning of the gas compression and condensate pumping modules, with start up expected in the first half of calendar year 2017.
The Company recognised total impairments of $131.3 million after tax ($169.2 million pre-tax, $37.9 million tax effect) in the carrying value of the BassGas project. An impairment of $42.8 million after tax was recognised at 30 June 2016 in connection with a reduction to net 2P Reserves, based on reserves information provided by the Operator. This is in addition to an impairment recognised at 31 December 2015 of $88.5 million after tax, relating to reductions to net 2P Reserves and lower forecast oil and gas prices.
Casino Gas Project (offshore Otway Basin, AWE 25%)
The Casino gas project, including the Casino, Henry and Netherby gas fields, achieved gross production of 19.3 PJ of gas and 10,500 barrels of condensate. AWE’s share of production for the year was 4.8 PJ of gas and 2,600 barrels of condensate. This represented a 25% decrease compared to the previous year due to scheduled maintenance and natural field decline.
2.2 Western AustraliaWaitsia Gas Project (L1/L2, onshore Perth Basin, AWE 50%, Operator)
The AWE operated joint venture made significant progress on the Waitsia gas project during the period. Construction of Stage 1A was completed and gas production commenced subsequent to the end of the period. Stage 1A involves production from the Waitsia-1 and Senecio-3 wells being produced through the upgraded Xyris Production Facility.
During the period, the Company recognised a significant increase in 2P Reserves and 2C Contingent Resources, comprising a 93% increase in 2P Reserves to 344Bcf of gas (AWE share 172 Bcf of gas or 30.4 mmboe) and a 30% increase in 2C Contingent Resources to 630 Bcf (AWE share 315 Bcf or 55.7 mmboe).
The Company achieved excellent flow test results at Waitsia-1 where independent flow tests from the Kingia and High Cliff Sandstone reservoirs delivered a total combined flow rate in excess of 50 mmscf/d, constrained by production tubing diameter.
At the end of the period, the Company was evaluating development options for the Stage 2 development, with production of up to 100 TJ/day and gas marketing was underway. The Company is targeting final investment decision (FID) for Stage 2 in calendar year 2017.
Onshore Perth Basin (AWE 33.0% to 100%)
The Onshore Perth Basin operations contributed 0.36 mmboe to AWE’s gas and oil production for the year, with AWE’s share totalling 2.1 PJ of natural gas, with approximately 2,000 barrels of condensate. The majority of production was delivered from the Beharra Springs gas project.
Work continued in relation to decommissioning of legacy infrastructure in the Perth Basin.
H O M E F I N A N C I A L S
21A W E L I M I T E D A N N U A L R E P O R T 2 0 1 6
D I R E C T O R S ' R E P O R T
Cliff Head Oil Project (offshore Perth Basin, AWE 57.5%)
The Cliff Head oil project contributed gross production of 0.48 million barrels of oil. AWE’s net share of production was approximately 0.28 million barrels for the year, a reduction of 23% due to natural field decline.
The Company recognised an impairment of $14.6 million after tax at 31 December 2015 due to lower long term oil price forecasts.
In June 2016, AWE sold its 57.5% interest in the Cliff Head oil project to Triangle Energy (Global) Limited for consideration of $3.2 million which resulted in a net gain of $16.4 million (post tax $6.7 million) following write back of net liabilities.
2.3 New ZealandTui Oil Project (offshore Taranaki Basin, AWE 57.5%)
The Tui oil project recorded gross oil production of 1.37 million barrels (AWE share 0.79 million barrels), down 6% on the previous year.
Inventory at the end of the period was 345,000 barrels (AWE share 198,400 barrels).
The Company recognised an impairment of $53.6 million after tax in the carrying value of the Tui oil project at 31 December 2015 due to lower long term oil price forecasts.
The contract for the “Umuroa” FPSO was renegotiated and extended by one year to 31 December 2017.
2.4 United States of AmericaSugarloaf AMI (onshore Texas, AWE share 10%, net ~7.5% after landowner royalties)
During the period, the Company’s interest in the Sugarloaf AMI contributed approximately 629,000 barrels of condensate, 2.2 PJ of gas and 25,700 tonnes of LPG, net of landowner royalties.
In March 2016, the Company sold its interest in the Sugarloaf AMI to Carrier Energy Partners II for USD$190 million, before purchase price adjustments. This asset has been included as a discontinued operation in the financial statements.
2.5 IndonesiaAnde Ande Lumut Oil Project (Northwest Natuna PSC, offshore Indonesia, AWE 50%)
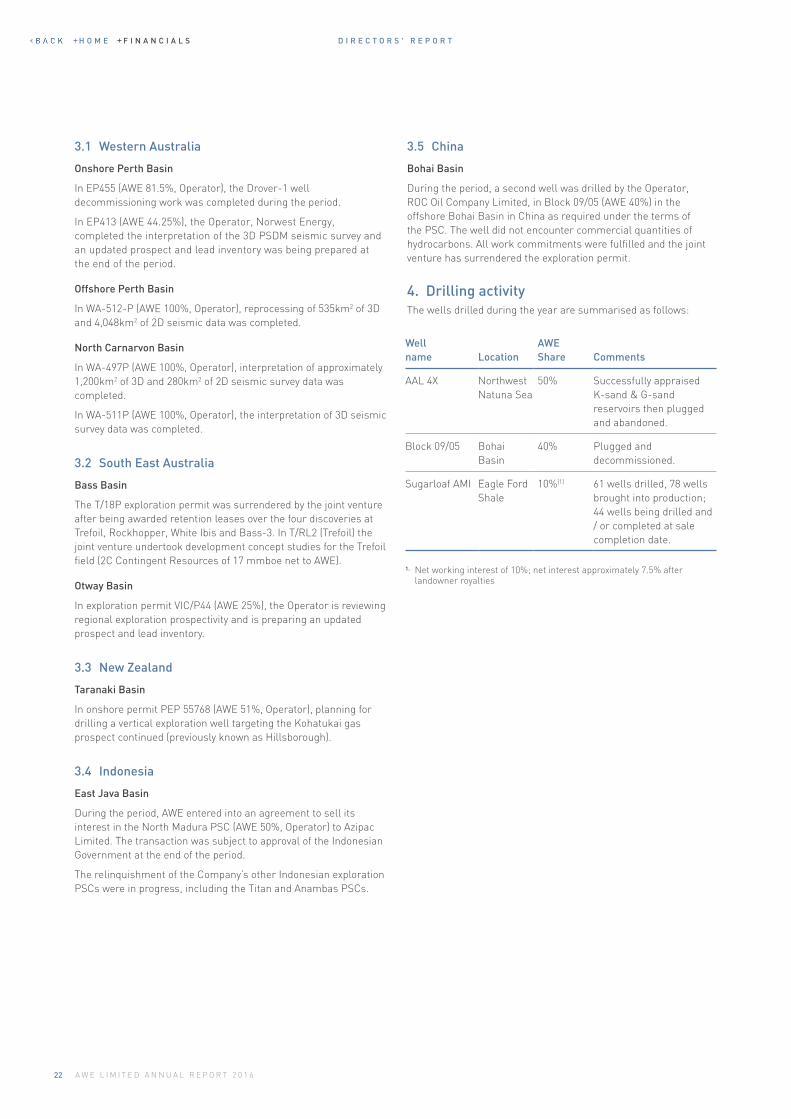
The AAL-4XST1 appraisal well was successfully drilled during the period and operations were completed subsequent to the end of the period. The primary target was the G Sand reservoir, estimated to contain 289 mmbbls gross oil in place and 36 mmbbls gross recoverable oil (net 8.4 mmbbls 2C Contingent Resources to AWE). The G Sand is located below the K Sand reservoir (101 mmbbls gross recoverable oil, net 24.3 mmbbls of 2P Reserves and 1.7 mmbbls 2C Contingent Resources).
Procurement processes for the wellhead platform and FPSO continued during the period. The Operator has extended the FID to the second half of calendar year 2017, and first oil is scheduled for 2020.
Lengo Gas Project (Bulu PSC, offshore Indonesia, AWE 42.5%)
The Lengo gas project is located in the Bulu PSC, offshore East Java. Development activities progressed during the period, with FEED work for the offshore facilities and pipeline and surveys for the well head platform site, pipeline route and the offshore receiving terminal being completed.
In May 2016, the Company announced that it had entered into an agreement to sell its 42.5% interest in the Bulu PSC to a subsidiary of HyOil Pte Ltd for up to A$27.5 million cash consideration. The sale is subject to the approval of the Indonesian Government. This asset is disclosed as an Asset held for sale in the financial statements.
30 June 2016 30 June 2015
Western
AustraliaSouth East
AustraliaNew
Zealand Indonesia China Other Total Total
Exploration Expenditure ($m) 5.9 0.9 (0.2) 1.8 9.9 0.6 18.8 63.4
3. Exploration activitiesIn view of the low oil price environment and the need to preserve capital, there was a significant reduction in exploration activity and expenditure during the period.
H O M E F I N A N C I A L S
22 A W E L I M I T E D A N N U A L R E P O R T 2 0 1 6
D I R E C T O R S ' R E P O R T
3.1 Western Australia
Onshore Perth Basin
In EP455 (AWE 81.5%, Operator), the Drover-1 well decommissioning work was completed during the period.
In EP413 (AWE 44.25%), the Operator, Norwest Energy, completed the interpretation of the 3D PSDM seismic survey and an updated prospect and lead inventory was being prepared at the end of the period.
Offshore Perth Basin
In WA-512-P (AWE 100%, Operator), reprocessing of 535km2 of 3D and 4,048km2 of 2D seismic data was completed.
North Carnarvon Basin
In WA-497P (AWE 100%, Operator), interpretation of approximately 1,200km2 of 3D and 280km2 of 2D seismic survey data was completed.
In WA-511P (AWE 100%, Operator), the interpretation of 3D seismic survey data was completed.
3.2 South East Australia
Bass Basin
The T/18P exploration permit was surrendered by the joint venture after being awarded retention leases over the four discoveries at Trefoil, Rockhopper, White Ibis and Bass-3. In T/RL2 (Trefoil) the joint venture undertook development concept studies for the Trefoil field (2C Contingent Resources of 17 mmboe net to AWE).
Otway Basin
In exploration permit VIC/P44 (AWE 25%), the Operator is reviewing regional exploration prospectivity and is preparing an updated prospect and lead inventory.
3.3 New Zealand
Taranaki Basin
In onshore permit PEP 55768 (AWE 51%, Operator), planning for drilling a vertical exploration well targeting the Kohatukai gas prospect continued (previously known as Hillsborough).
3.4 Indonesia
East Java Basin
During the period, AWE entered into an agreement to sell its interest in the North Madura PSC (AWE 50%, Operator) to Azipac Limited. The transaction was subject to approval of the Indonesian Government at the end of the period.
The relinquishment of the Company’s other Indonesian exploration PSCs were in progress, including the Titan and Anambas PSCs.
Well name Location
AWE Share Comments
AAL 4X Northwest Natuna Sea
50% Successfully appraised K-sand & G-sand reservoirs then plugged and abandoned.
Block 09/05 Bohai Basin
40% Plugged and decommissioned.
Sugarloaf AMI Eagle Ford Shale
10%(1) 61 wells drilled, 78 wells brought into production; 44 wells being drilled and / or completed at sale completion date.
1. Net working interest of 10%; net interest approximately 7.5% after landowner royalties
3.5 China
Bohai Basin
During the period, a second well was drilled by the Operator, ROC Oil Company Limited, in Block 09/05 (AWE 40%) in the offshore Bohai Basin in China as required under the terms of the PSC. The well did not encounter commercial quantities of hydrocarbons. All work commitments were fulfilled and the joint venture has surrendered the exploration permit.
4. Drilling activityThe wells drilled during the year are summarised as follows:
H O M E F I N A N C I A L S
23A W E L I M I T E D A N N U A L R E P O R T 2 0 1 6
D I R E C T O R S ' R E P O R T
5. Business strategy & opportunities
5.1 Business strategy
AWE’s goal is to be a leading energy company in Australia by building a sustainable business that delivers superior returns to shareholders.
The Company has implemented a strategy that is focused on pursuing opportunities in oil and high value gas in the geographic areas comprising Australia, New Zealand and Indonesia.
AWE has a suite of established and valuable producing assets that deliver stable operating cash flows and which underpins the ability of the Company to reinvest in key development projects to drive growth. In the near term, AWE is prioritising the development of its high value gas assets in the Perth Basin, while the Ande Ande Lumut oil project in Indonesia provides exposure to the potential upside in oil prices in the medium term.
AWE is committed to these goals while preserving our commitment of zero harm to our people, minimising our impact on the environment, supporting the communities in which we operate and building a motivated and engaged team.
5.2 Opportunities
During the period, the Company has implemented strategic initiatives in response to the low oil price environment, including a comprehensive review of the asset portfolio which has resulted in the successful divestment of a number of non-core assets and has significantly reduced ongoing exploration and development capital commitments, while also reducing debt by $153.8 million during the period.
The focus and objective of the Company is to generate sustainable returns to shareholders whilst maintaining a prudent and disciplined approach to financial management, including a continued focus on achieving cost savings across the business. AWE will pursue growth initiatives from its existing portfolio of exploration and development assets as well as new opportunities where it is value accretive and where we have the balance sheet capacity to support future development expenditure.
Key projects and opportunities being pursued during the next financial year include:
+ Development of the Waitsia gas project, which achieved the commencement of Stage 1A gas production after the end of the period. A key focus during FY2017 will be progressing towards achieving a final investment decision for the Stage 2 development, following further appraisal drilling planned for calendar year 2017.
+ At BassGas, the completion of the hook-up and commissioning of the gas compression and condensate pumping modules and development concept studies for the Trefoil field, adjacent to the existing Yolla field in the Bass Basin.
+ In the Otway Basin, the Casino joint venture will assess a range of options for the next phase of development for the project.
+ The AAL oil field development in Indonesia, where it is planned to progress the project through important milestones including the tendering for the FPSO and wellhead platform. FID is targeted for late 2017 calendar year and first oil in 2020.
AWE will continue to review a range of exploration and new business opportunities in conventional and unconventional oil and gas, but only where the business and economic case continues to be positive at low oil prices.
5.3 Material business risks
The following material business risks have been identified as key issues that have the potential to impact the Company’s performance:
+ Commodity price risk, which directly impacts AWE through the realised price received from the sale of hydrocarbons – gas, crude oil, condensate and LPG with the exception of Australian gas sales which are made under long-term contracts where the price is denominated in Australian dollars. The risk relating to oil prices has been mitigated in the near term by the sale of the Company’s interest in the Sugarloaf AMI and the implementation of an oil price hedging program during 2016 financial year.
+ Reserves and production risks, where future performance of individual assets may not meet current estimates and forecasts.
+ Execution of development and operating projects, including meeting schedule and budget, which could be subject to changes in future industry and economic conditions.
+ Sovereign risk relating to the expected fiscal, tax and regulatory environment in jurisdictions that AWE does business.
+ Health, Safety and Environmental risks which are recognised by AWE as being of critical importance in ensuring AWE continues to build and operate a sustainable business and which remain a key priority for the Company.
+ Maintaining the Company’s social licence to operate by pursuing operational excellence and proactively engaging with the communities, regulators and other key stakeholders, particularly in relation to onshore oil and gas exploration, development and production activities.
H O M E F I N A N C I A L S
24 A W E L I M I T E D A N N U A L R E P O R T 2 0 1 6
D I R E C T O R S ' R E P O R T
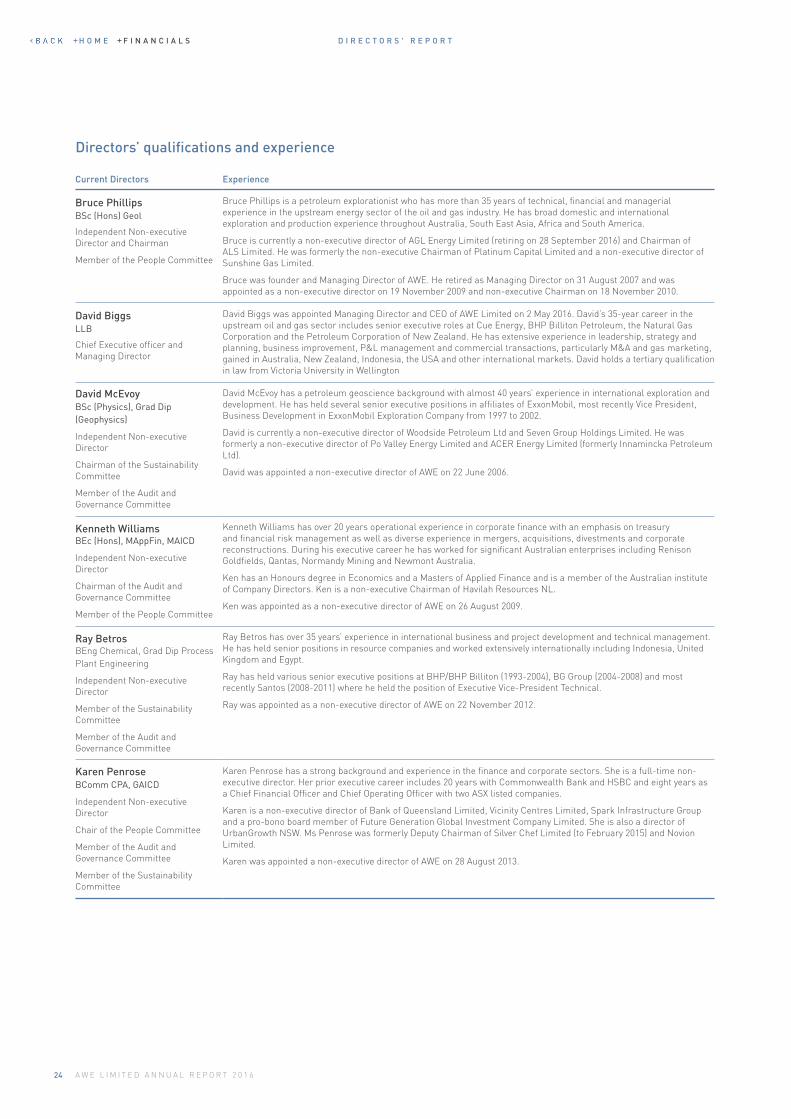
Current Directors Experience
Bruce Phillips BSc (Hons) Geol
Independent Non-executive Director and Chairman
Member of the People Committee
Bruce Phillips is a petroleum explorationist who has more than 35 years of technical, financial and managerial experience in the upstream energy sector of the oil and gas industry. He has broad domestic and international exploration and production experience throughout Australia, South East Asia, Africa and South America.
Bruce is currently a non-executive director of AGL Energy Limited (retiring on 28 September 2016) and Chairman of ALS Limited. He was formerly the non-executive Chairman of Platinum Capital Limited and a non-executive director of Sunshine Gas Limited.
Bruce was founder and Managing Director of AWE. He retired as Managing Director on 31 August 2007 and was appointed as a non-executive director on 19 November 2009 and non-executive Chairman on 18 November 2010.
David Biggs LLB
Chief Executive officer and Managing Director
David Biggs was appointed Managing Director and CEO of AWE Limited on 2 May 2016. David’s 35-year career in the upstream oil and gas sector includes senior executive roles at Cue Energy, BHP Billiton Petroleum, the Natural Gas Corporation and the Petroleum Corporation of New Zealand. He has extensive experience in leadership, strategy and planning, business improvement, P&L management and commercial transactions, particularly M&A and gas marketing, gained in Australia, New Zealand, Indonesia, the USA and other international markets. David holds a tertiary qualification in law from Victoria University in Wellington
David McEvoy BSc (Physics), Grad Dip (Geophysics)
Independent Non-executive Director
Chairman of the Sustainability Committee
Member of the Audit and Governance Committee
David McEvoy has a petroleum geoscience background with almost 40 years’ experience in international exploration and development. He has held several senior executive positions in affiliates of ExxonMobil, most recently Vice President, Business Development in ExxonMobil Exploration Company from 1997 to 2002.
David is currently a non-executive director of Woodside Petroleum Ltd and Seven Group Holdings Limited. He was formerly a non-executive director of Po Valley Energy Limited and ACER Energy Limited (formerly Innamincka Petroleum Ltd).
David was appointed a non-executive director of AWE on 22 June 2006.
Kenneth Williams BEc (Hons), MAppFin, MAICD
Independent Non-executive Director
Chairman of the Audit and Governance Committee
Member of the People Committee
Kenneth Williams has over 20 years operational experience in corporate finance with an emphasis on treasury and financial risk management as well as diverse experience in mergers, acquisitions, divestments and corporate reconstructions. During his executive career he has worked for significant Australian enterprises including Renison Goldfields, Qantas, Normandy Mining and Newmont Australia.
Ken has an Honours degree in Economics and a Masters of Applied Finance and is a member of the Australian institute of Company Directors. Ken is a non-executive Chairman of Havilah Resources NL.
Ken was appointed as a non-executive director of AWE on 26 August 2009.
Ray Betros BEng Chemical, Grad Dip Process Plant Engineering
Independent Non-executive Director
Member of the Sustainability Committee
Member of the Audit and Governance Committee
Ray Betros has over 35 years’ experience in international business and project development and technical management. He has held senior positions in resource companies and worked extensively internationally including Indonesia, United Kingdom and Egypt.
Ray has held various senior executive positions at BHP/BHP Billiton (1993-2004), BG Group (2004-2008) and most recently Santos (2008-2011) where he held the position of Executive Vice-President Technical.
Ray was appointed as a non-executive director of AWE on 22 November 2012.
Karen Penrose BComm CPA, GAICD
Independent Non-executive Director
Chair of the People Committee
Member of the Audit and Governance Committee
Member of the Sustainability Committee
Karen Penrose has a strong background and experience in the finance and corporate sectors. She is a full-time non-executive director. Her prior executive career includes 20 years with Commonwealth Bank and HSBC and eight years as a Chief Financial Officer and Chief Operating Officer with two ASX listed companies.
Karen is a non-executive director of Bank of Queensland Limited, Vicinity Centres Limited, Spark Infrastructure Group and a pro-bono board member of Future Generation Global Investment Company Limited. She is also a director of UrbanGrowth NSW. Ms Penrose was formerly Deputy Chairman of Silver Chef Limited (to February 2015) and Novion Limited.
Karen was appointed a non-executive director of AWE on 28 August 2013.
Directors’ qualifications and experience
H O M E F I N A N C I A L S
25A W E L I M I T E D A N N U A L R E P O R T 2 0 1 6
D I R E C T O R S ' R E P O R T
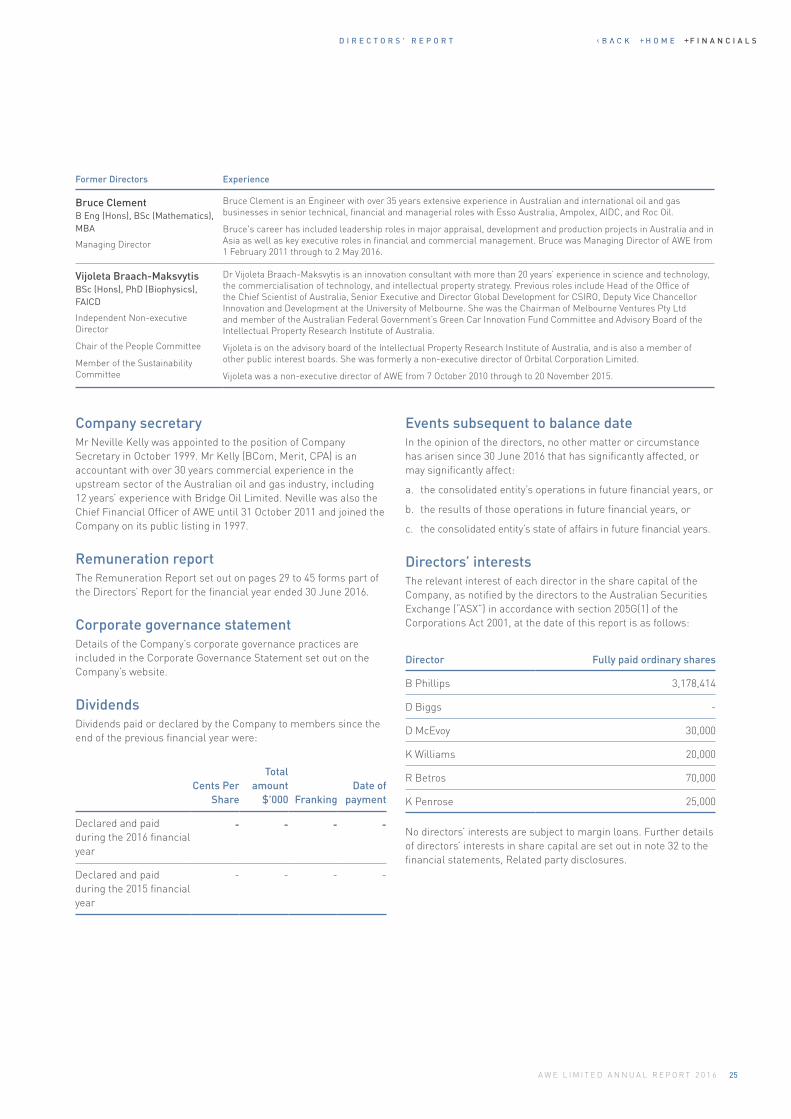
Former Directors Experience
Bruce Clement B Eng (Hons), BSc (Mathematics), MBA
Managing Director
Bruce Clement is an Engineer with over 35 years extensive experience in Australian and international oil and gas businesses in senior technical, financial and managerial roles with Esso Australia, Ampolex, AIDC, and Roc Oil.
Bruce's career has included leadership roles in major appraisal, development and production projects in Australia and in Asia as well as key executive roles in financial and commercial management. Bruce was Managing Director of AWE from 1 February 2011 through to 2 May 2016.
Vijoleta Braach-Maksvytis BSc (Hons), PhD (Biophysics), FAICD
Independent Non-executive Director
Chair of the People Committee
Member of the Sustainability Committee
Dr Vijoleta Braach-Maksvytis is an innovation consultant with more than 20 years’ experience in science and technology, the commercialisation of technology, and intellectual property strategy. Previous roles include Head of the Office of the Chief Scientist of Australia, Senior Executive and Director Global Development for CSIRO, Deputy Vice Chancellor Innovation and Development at the University of Melbourne. She was the Chairman of Melbourne Ventures Pty Ltd and member of the Australian Federal Government’s Green Car Innovation Fund Committee and Advisory Board of the Intellectual Property Research Institute of Australia.
Vijoleta is on the advisory board of the Intellectual Property Research Institute of Australia, and is also a member of other public interest boards. She was formerly a non-executive director of Orbital Corporation Limited.
Vijoleta was a non-executive director of AWE from 7 October 2010 through to 20 November 2015.
Company secretaryMr Neville Kelly was appointed to the position of Company Secretary in October 1999. Mr Kelly (BCom, Merit, CPA) is an accountant with over 30 years commercial experience in the upstream sector of the Australian oil and gas industry, including 12 years’ experience with Bridge Oil Limited. Neville was also the Chief Financial Officer of AWE until 31 October 2011 and joined the Company on its public listing in 1997.
Remuneration reportThe Remuneration Report set out on pages 29 to 45 forms part of the Directors’ Report for the financial year ended 30 June 2016.
Corporate governance statementDetails of the Company’s corporate governance practices are included in the Corporate Governance Statement set out on the Company’s website.
DividendsDividends paid or declared by the Company to members since the end of the previous financial year were:
Cents Per Share
Total amount
$'000 FrankingDate of
payment
Declared and paid during the 2016 financial year
- - - -
Declared and paid during the 2015 financial year
- - - -
Events subsequent to balance dateIn the opinion of the directors, no other matter or circumstance has arisen since 30 June 2016 that has significantly affected, or may significantly affect:
a. the consolidated entity’s operations in future financial years, or
b. the results of those operations in future financial years, or
c. the consolidated entity’s state of affairs in future financial years.
Directors’ interests The relevant interest of each director in the share capital of the Company, as notified by the directors to the Australian Securities Exchange (“ASX”) in accordance with section 205G(1) of the Corporations Act 2001, at the date of this report is as follows:
Director Fully paid ordinary shares
B Phillips 3,178,414
D Biggs -
D McEvoy 30,000
K Williams 20,000
R Betros 70,000
K Penrose 25,000
No directors’ interests are subject to margin loans. Further details of directors’ interests in share capital are set out in note 32 to the financial statements, Related party disclosures.
H O M E F I N A N C I A L S
26 A W E L I M I T E D A N N U A L R E P O R T 2 0 1 6
D I R E C T O R S ' R E P O R T
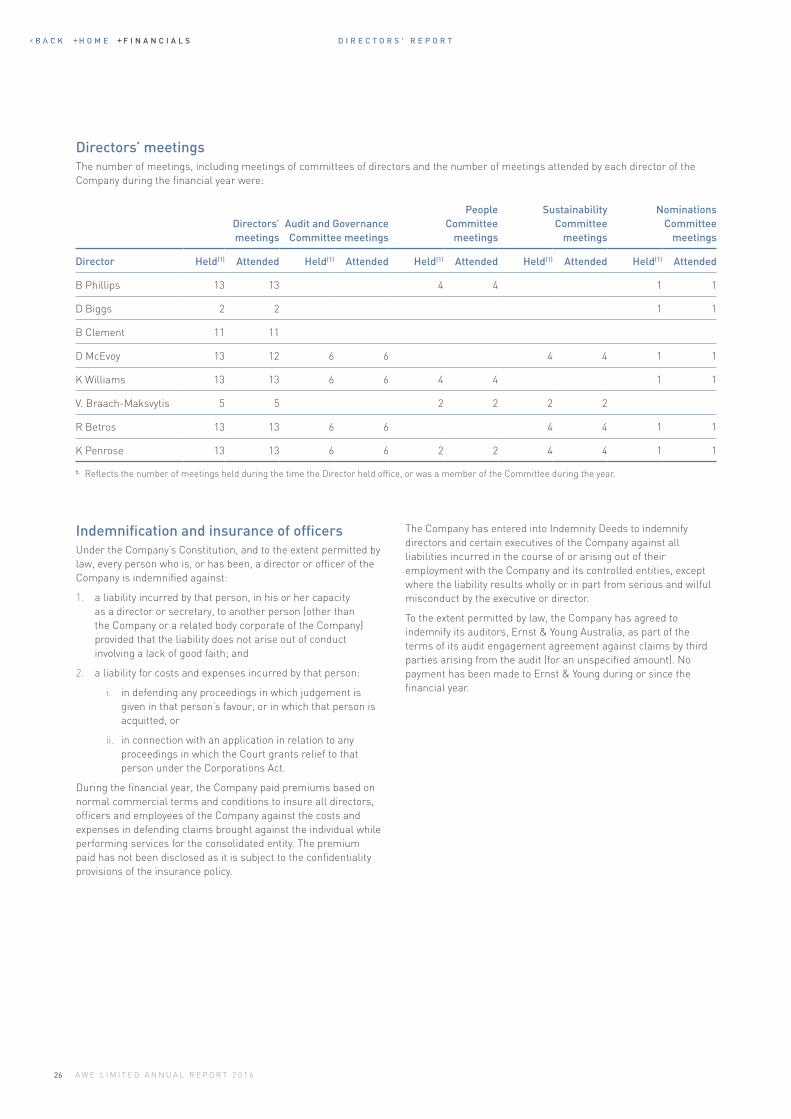
Directors’ meetings The number of meetings, including meetings of committees of directors and the number of meetings attended by each director of the Company during the financial year were:
Directors’ meetings
Audit and Governance Committee meetings
People Committee
meetings
Sustainability Committee
meetings
Nominations Committee
meetings
Director Held(1) Attended Held(1) Attended Held(1) Attended Held(1) Attended Held(1) Attended
B Phillips 13 13 4 4 1 1
D Biggs 2 2 1 1
B Clement 11 11
D McEvoy 13 12 6 6 4 4 1 1
K Williams 13 13 6 6 4 4 1 1
V. Braach-Maksvytis 5 5 2 2 2 2
R Betros 13 13 6 6 4 4 1 1
K Penrose 13 13 6 6 2 2 4 4 1 1
1. Reflects the number of meetings held during the time the Director held office, or was a member of the Committee during the year.
Indemnification and insurance of officersUnder the Company’s Constitution, and to the extent permitted by law, every person who is, or has been, a director or officer of the Company is indemnified against:
1. a liability incurred by that person, in his or her capacity as a director or secretary, to another person (other than the Company or a related body corporate of the Company) provided that the liability does not arise out of conduct involving a lack of good faith; and
2. a liability for costs and expenses incurred by that person:
i. in defending any proceedings in which judgement is given in that person’s favour, or in which that person is acquitted, or
ii. in connection with an application in relation to any proceedings in which the Court grants relief to that person under the Corporations Act.
During the financial year, the Company paid premiums based on normal commercial terms and conditions to insure all directors, officers and employees of the Company against the costs and expenses in defending claims brought against the individual while performing services for the consolidated entity. The premium paid has not been disclosed as it is subject to the confidentiality provisions of the insurance policy.
The Company has entered into Indemnity Deeds to indemnify directors and certain executives of the Company against all liabilities incurred in the course of or arising out of their employment with the Company and its controlled entities, except where the liability results wholly or in part from serious and wilful misconduct by the executive or director.
To the extent permitted by law, the Company has agreed to indemnify its auditors, Ernst & Young Australia, as part of the terms of its audit engagement agreement against claims by third parties arising from the audit (for an unspecified amount). No payment has been made to Ernst & Young during or since the financial year.
H O M E F I N A N C I A L S
27A W E L I M I T E D A N N U A L R E P O R T 2 0 1 6
D I R E C T O R S ' R E P O R T
Audit and non-audit services Details of the amounts paid to the auditor of the Company, Ernst & Young, and its related practices for audit and non-audit services provided during the year are set out below.
Ernst & Young2016
$2015
$
Audit services - auditor of the Company
Audit and review of financial reports 414,899 472,348
Taxation Services
Taxation compliance services 57,136 93,733
Other Services
Advisory and assurance services 32,346 21,480
Total remuneration of Ernst & Young 504,381 587,561
During the year Ernst & Young, the Company’s auditor, has performed certain other services in addition to their statutory duties. The Board has considered the non-audit services provided during the year by the auditor and in accordance with written advice provided by resolution of the Audit & Governance Committee, is satisfied that the provision of those non-audit services during the year by the auditor is compatible with the auditor independence requirements of the Corporations Act 2001 for the following reasons:
+ All non–audit services do not impact the integrity and objectivity of the auditor; and
+ The non-audit services do not undermine the general principles relating to auditor independence as set out in APES 110 Code of Ethics for Professional Accountants, as they did not involve reviewing or auditing the auditor’s own work, in a management or decision making capacity for the Company, acting as an advocate for the Company or jointly sharing risks and rewards.
Auditor’s independence declaration under section 307C of the Corporations Act 2001The auditor’s independence declaration is set out on page 28 and forms part of the Directors’ Report for the year ended 30 June 2016.
Rounding offThe Company is of a kind referred to in Australian Securities and Investments Commission (“ASIC”) Class Order 2016/191 dated 24 March 2016 and in accordance with that Class Order amounts in the financial report and the Directors’ Report have been rounded off to the nearest one thousand dollars unless otherwise stated.
Dated at Sydney this 25th day of August 2016
David Biggs Managing Director and CEO
BRUCE PHILLIPS Chairman
H O M E F I N A N C I A L S
28 A W E L I M I T E D A N N U A L R E P O R T 2 0 1 6
A U D I T O R ' S I N D E P E N D E N C E D E C L A R A T I O N
A member firm of Ernst & Young Global Limited Liability limited by a scheme approved under Professional Standards Legislation
Ernst & Young 200 George Street Sydney NSW 2000 Australia GPO Box 2646 Sydney NSW 2001
Tel: +61 2 9248 5555 Fax: +61 2 9248 5959 ey.com/au
Auditor’s Independence Declaration to the Directors of AWE Limited As lead auditor for the audit of AWE Limited for the year ended 30 June 2016, I declare to the best of my knowledge and belief, there have been:
a) no contraventions of the auditor independence requirements of the Corporations Act 2001 in relation to the audit; and
b) no contraventions of any applicable code of professional conduct in relation to the audit. This declaration is in respect of AWE Limited and the entities it controlled during the financial period. Ernst & Young Scott Jarrett Partner 25 August 2016
H O M E F I N A N C I A L S
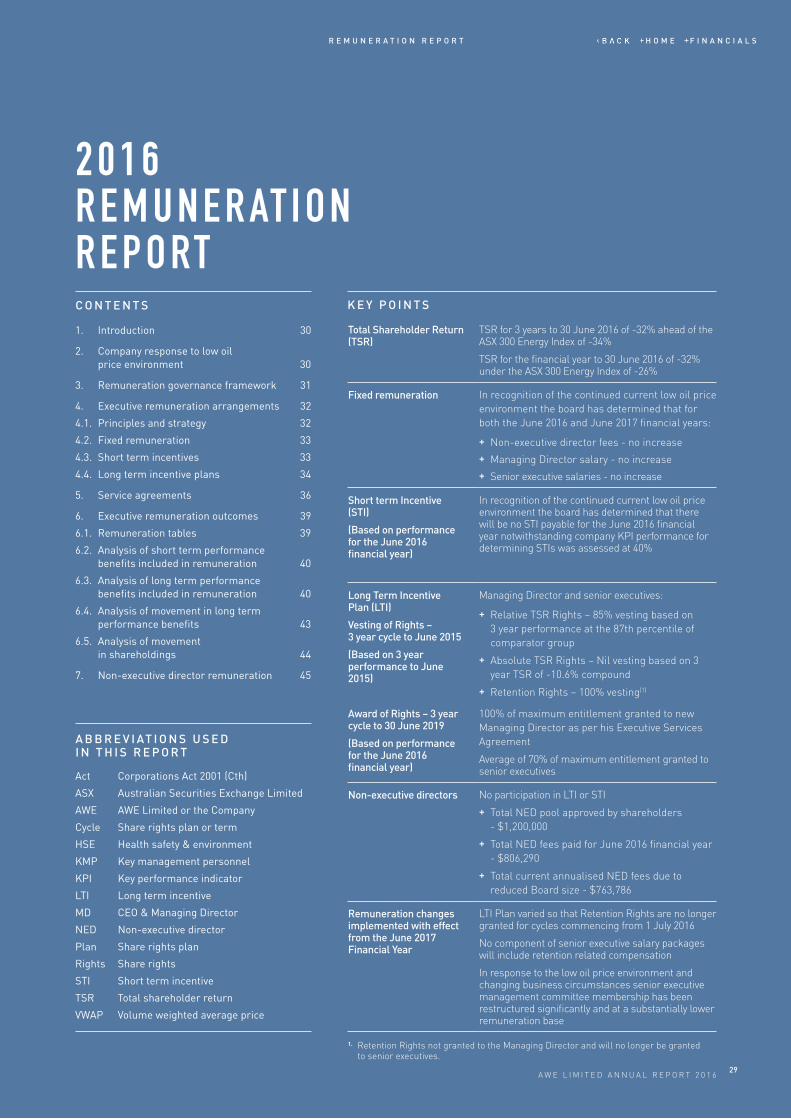
29A W E L I M I T E D A N N U A L R E P O R T 2 0 1 629
A W E L I M I T E D A N N U A L R E P O R T 2 0 1 6
1. Introduction 30
2. Company response to low oil price environment 30
3. Remuneration governance framework 31
4. Executive remuneration arrangements 32
4.1. Principles and strategy 32
4.2. Fixed remuneration 33
4.3. Short term incentives 33
4.4. Long term incentive plans 34
5. Service agreements 36
6. Executive remuneration outcomes 39
6.1. Remuneration tables 39
6.2. Analysis of short term performance benefits included in remuneration 40
6.3. Analysis of long term performance benefits included in remuneration 40
6.4. Analysis of movement in long term performance benefits 43
6.5. Analysis of movement in shareholdings 44
7. Non-executive director remuneration 45
Act Corporations Act 2001 (Cth)
ASX Australian Securities Exchange Limited
AWE AWE Limited or the Company
Cycle Share rights plan or term
HSE Health safety & environment
KMP Key management personnel
KPI Key performance indicator
LTI Long term incentive
MD CEO & Managing Director
NED Non-executive director
Plan Share rights plan
Rights Share rights
STI Short term incentive
TSR Total shareholder return
VWAP Volume weighted average price
K E Y P O I N T SC O N T E N T S
A B B R E V I AT I O N S U S E D I N T H I S R E P O R T
Total Shareholder Return (TSR)
TSR for 3 years to 30 June 2016 of -32% ahead of the ASX 300 Energy Index of -34%
TSR for the financial year to 30 June 2016 of -32% under the ASX 300 Energy Index of -26%
Fixed remuneration In recognition of the continued current low oil price environment the board has determined that for both the June 2016 and June 2017 financial years:
+ Non-executive director fees - no increase+ Managing Director salary - no increase+ Senior executive salaries - no increase
Short term Incentive (STI)
(Based on performance for the June 2016 financial year)
In recognition of the continued current low oil price environment the board has determined that there will be no STI payable for the June 2016 financial year notwithstanding company KPI performance for determining STIs was assessed at 40%
Long Term Incentive Plan (LTI)
Vesting of Rights – 3 year cycle to June 2015
(Based on 3 year performance to June 2015)
Award of Rights – 3 year cycle to 30 June 2019
(Based on performance for the June 2016 financial year)
Managing Director and senior executives:
+ Relative TSR Rights – 85% vesting based on 3 year performance at the 87th percentile of comparator group
+ Absolute TSR Rights – Nil vesting based on 3 year TSR of -10.6% compound
+ Retention Rights – 100% vesting(1)
100% of maximum entitlement granted to new Managing Director as per his Executive Services Agreement
Average of 70% of maximum entitlement granted to senior executives
Non-executive directors No participation in LTI or STI
+ Total NED pool approved by shareholders - $1,200,000
+ Total NED fees paid for June 2016 financial year - $806,290
+ Total current annualised NED fees due to reduced Board size - $763,786
Remuneration changes implemented with effect from the June 2017 Financial Year
LTI Plan varied so that Retention Rights are no longer granted for cycles commencing from 1 July 2016
No component of senior executive salary packages will include retention related compensation
In response to the low oil price environment and changing business circumstances senior executive management committee membership has been restructured significantly and at a substantially lower remuneration base
1. Retention Rights not granted to the Managing Director and will no longer be granted to senior executives.
2 0 1 6 R E M U N E R AT I O N R E P O RT
R E M U N E R A T I O N R E P O R T H O M E F I N A N C I A L S
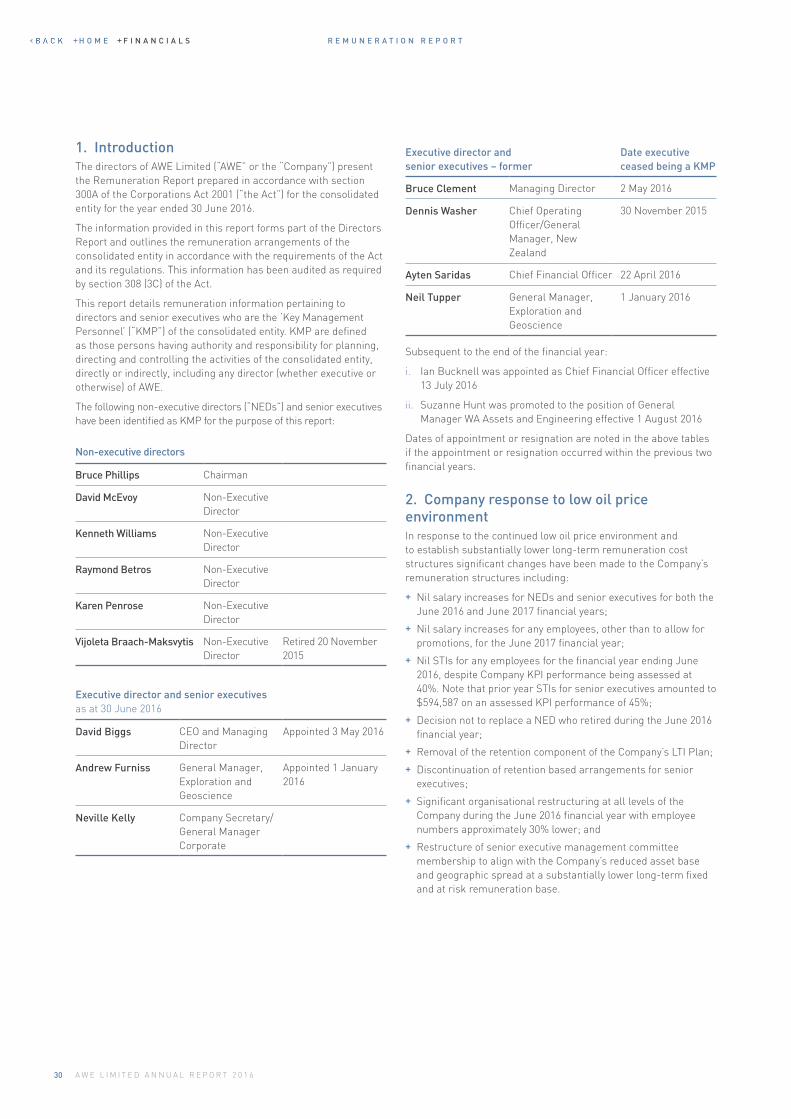
R E M U N E R A T I O N R E P O R T
30 A W E L I M I T E D A N N U A L R E P O R T 2 0 1 6
1. IntroductionThe directors of AWE Limited (“AWE” or the “Company”) present the Remuneration Report prepared in accordance with section 300A of the Corporations Act 2001 (“the Act”) for the consolidated entity for the year ended 30 June 2016.
The information provided in this report forms part of the Directors Report and outlines the remuneration arrangements of the consolidated entity in accordance with the requirements of the Act and its regulations. This information has been audited as required by section 308 (3C) of the Act.
This report details remuneration information pertaining to directors and senior executives who are the ‘Key Management Personnel’ (“KMP”) of the consolidated entity. KMP are defined as those persons having authority and responsibility for planning, directing and controlling the activities of the consolidated entity, directly or indirectly, including any director (whether executive or otherwise) of AWE.
The following non-executive directors (“NEDs”) and senior executives have been identified as KMP for the purpose of this report:
Executive director and senior executives as at 30 June 2016
David Biggs CEO and Managing Director
Appointed 3 May 2016
Andrew Furniss General Manager, Exploration and Geoscience
Appointed 1 January 2016
Neville Kelly Company Secretary/General Manager Corporate
Executive director and senior executives – former
Date executive ceased being a KMP
Bruce Clement Managing Director 2 May 2016
Dennis Washer Chief Operating Officer/General Manager, New Zealand
30 November 2015
Ayten Saridas Chief Financial Officer 22 April 2016
Neil Tupper General Manager, Exploration and Geoscience
1 January 2016
Non-executive directors
Bruce Phillips Chairman
David McEvoy Non-Executive Director
Kenneth Williams Non-Executive Director
Raymond Betros Non-Executive Director
Karen Penrose Non-Executive Director
Vijoleta Braach-Maksvytis Non-Executive Director
Retired 20 November 2015
Subsequent to the end of the financial year:
i. Ian Bucknell was appointed as Chief Financial Officer effective 13 July 2016
ii. Suzanne Hunt was promoted to the position of General Manager WA Assets and Engineering effective 1 August 2016
Dates of appointment or resignation are noted in the above tables if the appointment or resignation occurred within the previous two financial years.
2. Company response to low oil price environmentIn response to the continued low oil price environment and to establish substantially lower long-term remuneration cost structures significant changes have been made to the Company’s remuneration structures including:
+ Nil salary increases for NEDs and senior executives for both the June 2016 and June 2017 financial years;
+ Nil salary increases for any employees, other than to allow for promotions, for the June 2017 financial year;
+ Nil STIs for any employees for the financial year ending June 2016, despite Company KPI performance being assessed at 40%. Note that prior year STIs for senior executives amounted to $594,587 on an assessed KPI performance of 45%;
+ Decision not to replace a NED who retired during the June 2016 financial year;
+ Removal of the retention component of the Company’s LTI Plan;
+ Discontinuation of retention based arrangements for senior executives;
+ Significant organisational restructuring at all levels of the Company during the June 2016 financial year with employee numbers approximately 30% lower; and
+ Restructure of senior executive management committee membership to align with the Company’s reduced asset base and geographic spread at a substantially lower long-term fixed and at risk remuneration base.
H O M E F I N A N C I A L S
R E M U N E R A T I O N R E P O R T
31A W E L I M I T E D A N N U A L R E P O R T 2 0 1 6
3. Remuneration governance frameworkThe People Committee is responsible for making recommendations to the Board on remuneration policies and employment practices applicable to directors, senior executives and other employees.
The role and responsibilities of the People Committee is documented in a charter approved by the Board and is reviewed as required but in any event at least each two years. A copy of this charter is available on the Company’s website.
The People Committee must comprise at least three non-executive directors, the majority of whom shall be independent. No executive can be a member of the Committee. The People Committee comprises Karen Penrose (Chairman), Kenneth Williams (former committee Chairman), and Bruce Phillips, each of whom are non-executive directors and are considered by the Company to be independent.
RoleThe role of the People Committee as defined in the charter is to assist the Board in adopting remuneration policies and employment practices of AWE that are designed to:
+ Be consistent with the Company’s goals and objectives;
+ Deliver outcomes in line with strategic business goals;
+ Recognise the scale and complexity of the Company’s business activities;
+ Encourage directors and senior executives to deliver short term objectives and to pursue the long term growth and success of the Company within an appropriate control framework;
+ Deliver a level and composition of remuneration that is appropriate and fair to stakeholders;
+ Define the relationship of remuneration to corporate and individual performance; and
+ Attract and retain talented and effective directors, management and employees so as to encourage enhanced performance of the Company and to create value for shareholders.
The People Committee also evaluates the appropriateness of remuneration packages given trends in comparable companies, the need to drive a performance-based culture and the objectives of the Company’s remuneration strategy.
ResponsibilitiesThe responsibilities of the People Committee as defined in the charter are to review and make recommendations to the Board or its related committees on:
+ Policies for employment and remuneration of all AWE employees;
+ Recruitment, retention and termination policies, procedures and practices for senior executives;
+ The remuneration package of the Managing Director;
+ The remuneration packages of senior executives in consultation with the Managing Director;
+ Performance schemes including short term and long term incentives;
+ Superannuation arrangements;
+ The remuneration framework for non-executive directors, within the limit approved by shareholders;
+ Ongoing induction and education procedures for new Board appointees and key executives;
+ Training and development and continuing education practices for non-executive directors, senior executives and all AWE employees;
+ Management succession planning;
+ Procedures necessary to comply with employment practices law;
+ The appointment of external remuneration consultants and evaluation of advice from remuneration consultants in accordance with the Act;
+ The diversity disclosure plan and the Company’s progress in achieving measurable diversity objectives;
+ The annual Statutory Remuneration Report;
+ People related disclosures in the annual Sustainability Report; and
+ Other matters as requested by the Board.
Should the Company receive advice from external consultants to assist in making decisions on the amount or structure of the remuneration of one or more KMP:
+ The consultant is to be appointed by the People Committee or NEDs;
+ Advice received from the consultant must be provided directly to the People Committee or NEDs;
+ Fees paid to the consultant must be disclosed; and
+ The consultant must declare their independence.
No remuneration consultants were appointed during the current financial year.
H O M E F I N A N C I A L S
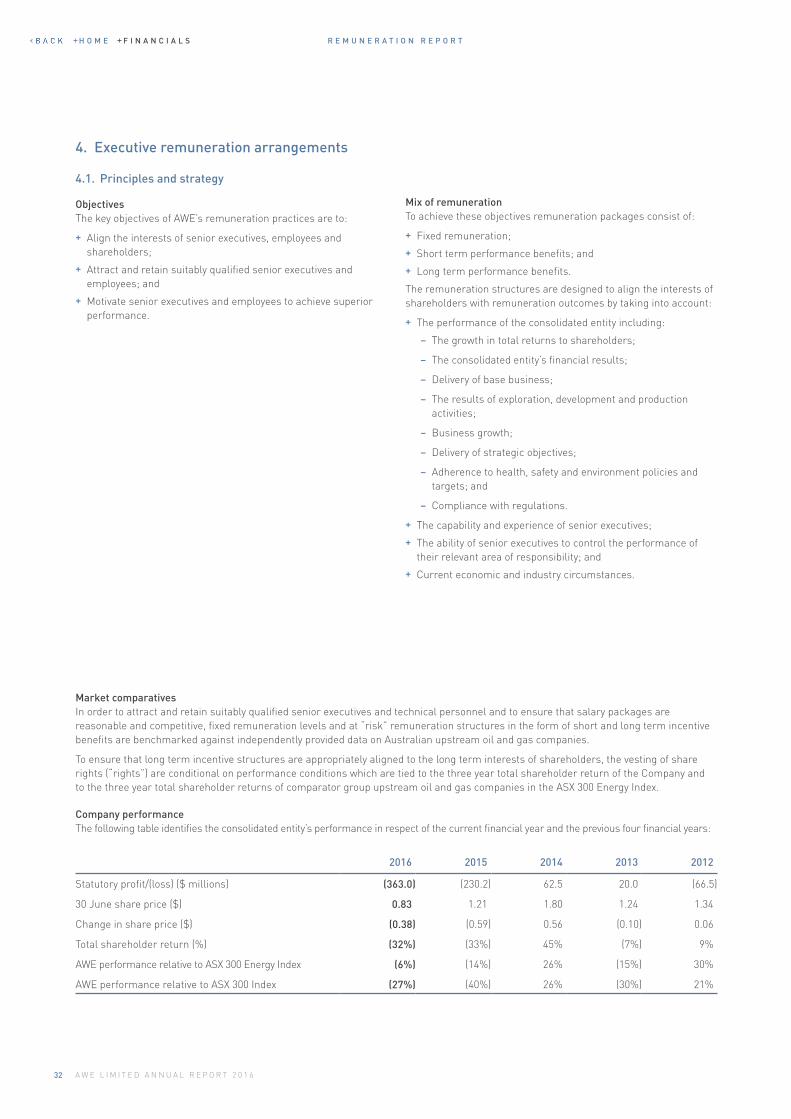
R E M U N E R A T I O N R E P O R T
32 A W E L I M I T E D A N N U A L R E P O R T 2 0 1 6
4. Executive remuneration arrangements
4.1. Principles and strategy
ObjectivesThe key objectives of AWE’s remuneration practices are to:
+ Align the interests of senior executives, employees and shareholders;
+ Attract and retain suitably qualified senior executives and employees; and
+ Motivate senior executives and employees to achieve superior performance.
Market comparativesIn order to attract and retain suitably qualified senior executives and technical personnel and to ensure that salary packages are reasonable and competitive, fixed remuneration levels and at “risk” remuneration structures in the form of short and long term incentive benefits are benchmarked against independently provided data on Australian upstream oil and gas companies.
To ensure that long term incentive structures are appropriately aligned to the long term interests of shareholders, the vesting of share rights (“rights”) are conditional on performance conditions which are tied to the three year total shareholder return of the Company and to the three year total shareholder returns of comparator group upstream oil and gas companies in the ASX 300 Energy Index.
Company performanceThe following table identifies the consolidated entity’s performance in respect of the current financial year and the previous four financial years:
2016 2015 2014 2013 2012
Statutory profit/(loss) ($ millions) (363.0) (230.2) 62.5 20.0 (66.5)
30 June share price ($) 0.83 1.21 1.80 1.24 1.34
Change in share price ($) (0.38) (0.59) 0.56 (0.10) 0.06
Total shareholder return (%) (32%) (33%) 45% (7%) 9%
AWE performance relative to ASX 300 Energy Index (6%) (14%) 26% (15%) 30%
AWE performance relative to ASX 300 Index (27%) (40%) 26% (30%) 21%
Mix of remunerationTo achieve these objectives remuneration packages consist of:
+ Fixed remuneration;
+ Short term performance benefits; and
+ Long term performance benefits.
The remuneration structures are designed to align the interests of shareholders with remuneration outcomes by taking into account:
+ The performance of the consolidated entity including:
− The growth in total returns to shareholders;
− The consolidated entity’s financial results;
− Delivery of base business;
− The results of exploration, development and production activities;
− Business growth;
− Delivery of strategic objectives;
− Adherence to health, safety and environment policies and targets; and
− Compliance with regulations.
+ The capability and experience of senior executives;
+ The ability of senior executives to control the performance of their relevant area of responsibility; and
+ Current economic and industry circumstances.
H O M E F I N A N C I A L S
R E M U N E R A T I O N R E P O R T
33A W E L I M I T E D A N N U A L R E P O R T 2 0 1 6
Deferral and Clawback of Performance – Based Remuneration
Scope
A deferral and clawback policy has been adopted for performance-based remuneration and applies to the Managing Director and senior executives. The policy applies on a prospective basis for STI and LTI awards granted from July 2014. The Board (or delegated committee of the Board) has discretion and authority to make determinations under this policy.
Application
Clawback can include reduction, clawback or cancellation of awards and applies to both vested awards which have been deferred and awards granted but not yet vested. Once an STI or LTI award is vested, 50% of that award will be deferred for a period of 12 months and will be subject to clawback.
Clawback Circumstances
+ Serious misconduct;
+ Material misstatement in AWE’s financial statements; or
+ Material error or miscalculation that results in the award of performance based remuneration that would not have otherwise been awarded.
Changes to remuneration structures
Changes to remuneration arrangements that were implemented with effect for financial year commencing 1 July 2016 include:
+ Removal of the retention component of the Company’s LTI Plan;
+ Agreement not to put in place any retention based arrangements for the Managing Director or senior executives; and
+ Removal of the distinction between base and stretch targets in determining the Company’s KPI performance for STI calculation purposes.
4.2. Fixed remunerationFixed remuneration consists of base salary calculated on a total cost basis, including fringe benefits tax and superannuation contributions (or equivalent).
Remuneration levels are reviewed at least annually by the People Committee through a process that considers independent externally provided remuneration data and also taking into account the overall performance of the consolidated entity to ensure that remuneration is appropriate and competitive in the market place.
In recognition of the current low oil price environment the board has determined that for the June 2017 financial year, there will be no increases to non-executive director fees or the salaries of the Managing Director or senior executive salaries. Further, no Company employee will receive an increase in salary, other than to allow for promotions.
For details of fixed remuneration paid to senior executives and directors refer to section 6 and 7.
4.3. Short term incentives
Short term performance benefits are awarded in the form of cash bonuses. These benefits are “at risk” and are paid for performance during the financial year and are designed to reward senior executives for meeting or exceeding Company and individual Key Performance Indicators (“KPIs”).
Managing Director KPIsEach year, the Board sets corporate KPIs for the Managing Director based on overall corporate performance targets.
The Board reviews the KPI’s for the Managing Director annually and will amend the KPIs to reflect the strategic objectives of the Company, changing circumstances in the upstream oil and gas sector as well as other operational and financial factors. The Board believes that the KPI’s should be set at robust and challenging levels and be aligned to activities that will achieve both short and long term sustainable shareholder returns.
June 2016 Financial Year – Current Managing Director: Mr Biggs
The Board determined the current Managing Director, who commenced employment in May 2016 is entitled to nil short term incentives for the year ended 30 June 2016 (refer to section 6.2).
June 2016 Financial Year – Former Managing Director: Mr Clement
For the June 2016 financial year the corporate KPIs for the former Managing Director were based on a balanced scorecard approach which are designed to deliver sustainable shareholder returns both in the short term and long term. These performance measures included:
+ Delivery of base business (45%)
+ Strategy and growth (35%)
+ Board discretion (20%)
Delivery of Base Business KPI’s includes delivery at or in excess of specific board agreed performance measures in the following areas of operation:
+ Safety and environment performance statistics;
+ Production within or better than market guidance;
+ Operating costs lower than or within budget;
+ Development projects on schedule and within budget;
+ Exploration program on schedule and within budget;
+ Balance sheet management and debt funding position;
+ People related activities including implementation of revised organisation structures in response to the low oil price environment, development of senior executive succession plans and improved staff engagement; and
+ Stakeholder management activities including shareholders, regulators, business partners and local communities and impacts on associated project schedules.
H O M E F I N A N C I A L S
R E M U N E R A T I O N R E P O R T
34 A W E L I M I T E D A N N U A L R E P O R T 2 0 1 6
Strategy and Growth KPIs includes delivery at or in excess of specific board agreed performance measures in the following areas of operation:
+ Share price to net asset value discount;
+ Portfolio management including asset divestments and exploration farmouts;
+ Conversion of 2C resources to 2P reserves and 2C/2P additions from exploration activities; and
+ Development of long-term strategy for onshore Perth Basin gas development.
Board discretion KPI’s includes an allowance to cover the potential and inevitable changing company and industry circumstances during the financial year.
On an assessment of actual performance for the June 2016 financial year the board has assessed KPI performance at 40% as follows:
+ Delivery of base business (20%)
+ Strategy and growth (20%)
+ Board discretion (nil%)
However, in recognition of the continued current low oil price environment the board has determined that there will be no STI payable for the June 2016 financial year notwithstanding company KPI performance for determining STIs was assessed at 40%.
For further details refer to section 6.2.
Senior Executives KPIsCorporate KPIs for senior executives are based on the same corporate KPIs as the Managing Director. In addition, the Managing Director sets individual KPIs for the senior executives. These KPIs take into account individual and departmental performance over which the senior executive has responsibility. The board believes that the attainment of these individual and departmental KPIs is essential in delivering overall corporate objectives.
The structure of these short term incentive (“STI”) benefits as a percentage of fixed remuneration is as follows:
Maximum Short Term Incentive Benefits as a percentage of fixed remuneration
Managing Director(1) 50%
Senior Executives(2) 40%
1. 100% of Managing Director KPIs are based on achieving corporate performance measures.
2. 50% of senior executive KPIs are based on the same corporate KPIs as the Managing Director and 50% are subject to individual and departmental KPIs over which the individual senior executive has responsibility.
With effect from the June 2017 financial year the distinction between base and stretch targets in setting and measuring these KPI’s has been removed.
The maximum STI is only payable if both the Company and individual performance has met or exceeded expectation. In exceptional circumstances where all of the Company performance targets have not been met but an individual has demonstrated outstanding performance, the Board may use its discretion award up to 100% of that individual’s short term performance benefit.
4.4. Long term incentive plans Long term incentive (“LTI”) “at risk” performance benefits are awarded in the form of share rights with vesting conditions tied to retention, absolute Total Shareholder Return (“TSR”) and relative TSR.
The rationale for the choice of these criteria includes:
+ To align employees with the commonly shared goals of delivering high returns for shareholders over the medium to long term;
+ To encourage and assist employees to become shareholders of AWE;
+ To provide a long term component of remuneration to enable AWE to compete effectively for the calibre of talent required for the Company to be successful; and
+ To help retain talented personnel and to minimise employee turnover.
Share Rights PlanThe Company has a Share Rights Plan in place for the award of long term performance benefits. The Plan is designed to generate performance-based awards that may be converted, at the Board’s discretion, into AWE shares or cash.
The key elements of the Plan include:
+ Rights are granted each year with the number of rights granted being determined by the employee’s level in the Company, fixed remuneration at the time of grant and taking into account both the Company and employee’s performance in the previous financial year;
+ There are three tranches of rights with separate vesting criteria:
− Retention(1);
− Absolute TSR; and
− Relative TSR.
+ The vesting period is for three years with rights lapsing after three years if not vested and there will be no retesting; and
+ Rights granted in any particular financial year are tested for vesting over the three year period commencing 1 July of the grant year.
The Plan defines TSR as “the percentage change over a period in shareholder value due to share price movement and dividends paid assuming dividends are reinvested into AWE shares”.
Unvested rights do not entitle the holder to receive dividends.
1. Retention rights are not granted to the Managing Director and with effect from the 3 year cycle commencing 1 July 2016, Retention Rights are no longer granted to senior executives.
H O M E F I N A N C I A L S
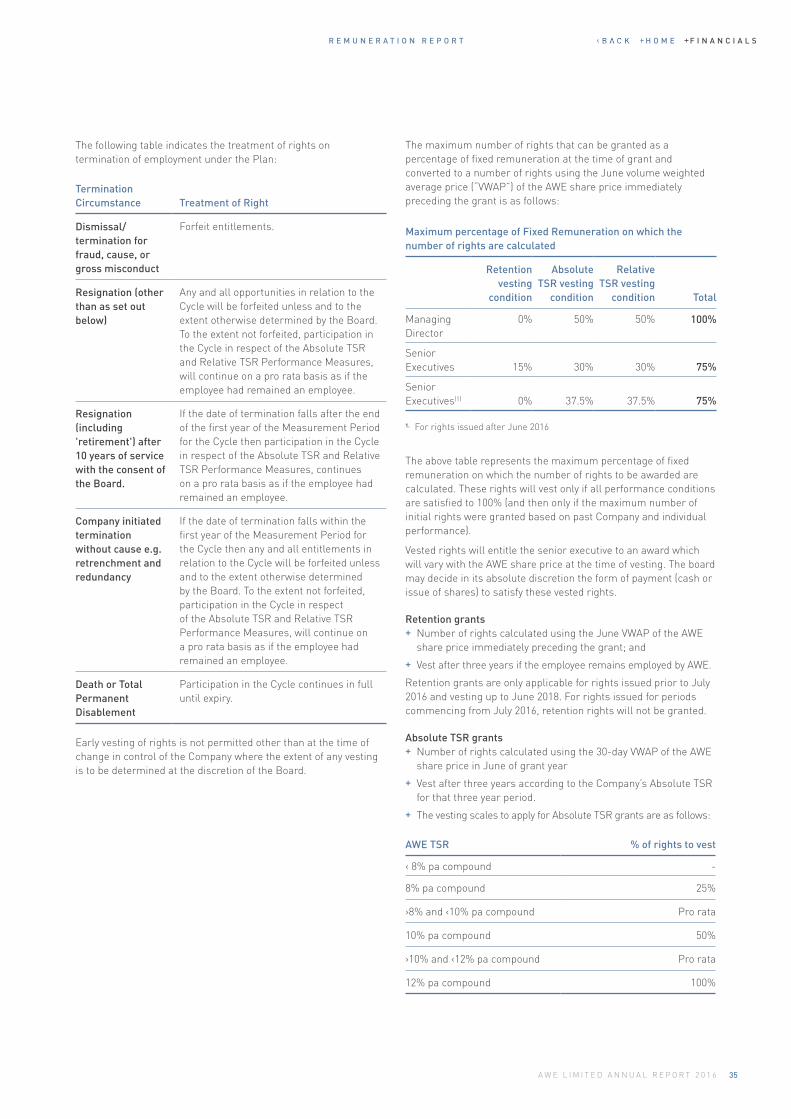
R E M U N E R A T I O N R E P O R T
35A W E L I M I T E D A N N U A L R E P O R T 2 0 1 6
The following table indicates the treatment of rights on termination of employment under the Plan:
Termination Circumstance Treatment of Right
Dismissal/termination for fraud, cause, or gross misconduct
Forfeit entitlements.
Resignation (other than as set out below)
Any and all opportunities in relation to the Cycle will be forfeited unless and to the extent otherwise determined by the Board. To the extent not forfeited, participation in the Cycle in respect of the Absolute TSR and Relative TSR Performance Measures, will continue on a pro rata basis as if the employee had remained an employee.
Resignation (including 'retirement') after 10 years of service with the consent of the Board.
If the date of termination falls after the end of the first year of the Measurement Period for the Cycle then participation in the Cycle in respect of the Absolute TSR and Relative TSR Performance Measures, continues on a pro rata basis as if the employee had remained an employee.
Company initiated termination without cause e.g. retrenchment and redundancy
If the date of termination falls within the first year of the Measurement Period for the Cycle then any and all entitlements in relation to the Cycle will be forfeited unless and to the extent otherwise determined by the Board. To the extent not forfeited, participation in the Cycle in respect of the Absolute TSR and Relative TSR Performance Measures, will continue on a pro rata basis as if the employee had remained an employee.
Death or Total Permanent Disablement
Participation in the Cycle continues in full until expiry.
Early vesting of rights is not permitted other than at the time of change in control of the Company where the extent of any vesting is to be determined at the discretion of the Board.
The maximum number of rights that can be granted as a percentage of fixed remuneration at the time of grant and converted to a number of rights using the June volume weighted average price (“VWAP”) of the AWE share price immediately preceding the grant is as follows:
Maximum percentage of Fixed Remuneration on which the number of rights are calculated
Retention vesting
condition
Absolute TSR vesting
condition
Relative TSR vesting
condition Total
Managing Director
0% 50% 50% 100%
Senior Executives 15% 30% 30% 75%
Senior Executives(1) 0% 37.5% 37.5% 75%
1. For rights issued after June 2016
The above table represents the maximum percentage of fixed remuneration on which the number of rights to be awarded are calculated. These rights will vest only if all performance conditions are satisfied to 100% (and then only if the maximum number of initial rights were granted based on past Company and individual performance).
Vested rights will entitle the senior executive to an award which will vary with the AWE share price at the time of vesting. The board may decide in its absolute discretion the form of payment (cash or issue of shares) to satisfy these vested rights.
Retention grants + Number of rights calculated using the June VWAP of the AWE
share price immediately preceding the grant; and
+ Vest after three years if the employee remains employed by AWE.
Retention grants are only applicable for rights issued prior to July 2016 and vesting up to June 2018. For rights issued for periods commencing from July 2016, retention rights will not be granted.
Absolute TSR grants + Number of rights calculated using the 30-day VWAP of the AWE
share price in June of grant year
+ Vest after three years according to the Company’s Absolute TSR for that three year period.
+ The vesting scales to apply for Absolute TSR grants are as follows:
AWE TSR % of rights to vest
‹ 8% pa compound -
8% pa compound 25%
›8% and ‹10% pa compound Pro rata
10% pa compound 50%
›10% and ‹12% pa compound Pro rata
12% pa compound 100%
H O M E F I N A N C I A L S
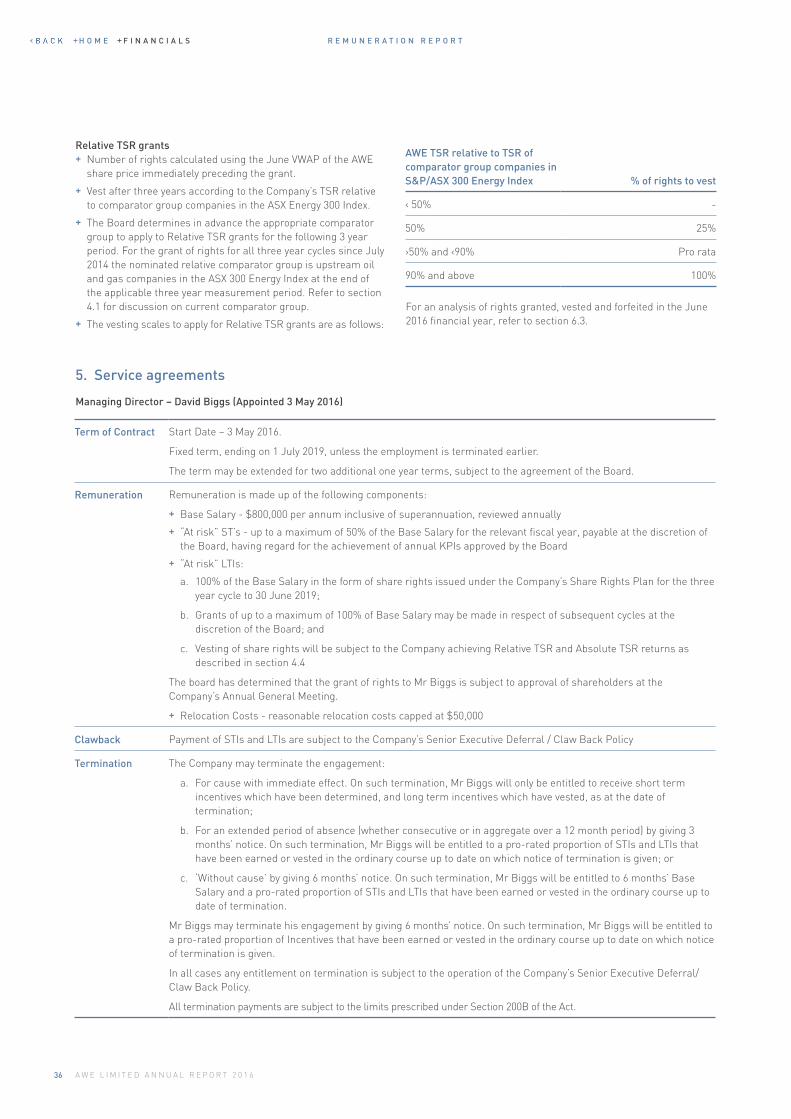
R E M U N E R A T I O N R E P O R T
36 A W E L I M I T E D A N N U A L R E P O R T 2 0 1 6
Relative TSR grants + Number of rights calculated using the June VWAP of the AWE
share price immediately preceding the grant.
+ Vest after three years according to the Company’s TSR relative to comparator group companies in the ASX Energy 300 Index.
+ The Board determines in advance the appropriate comparator group to apply to Relative TSR grants for the following 3 year period. For the grant of rights for all three year cycles since July 2014 the nominated relative comparator group is upstream oil and gas companies in the ASX 300 Energy Index at the end of the applicable three year measurement period. Refer to section 4.1 for discussion on current comparator group.
+ The vesting scales to apply for Relative TSR grants are as follows:
AWE TSR relative to TSR of comparator group companies in S&P/ASX 300 Energy Index % of rights to vest
‹ 50% -
50% 25%
›50% and ‹90% Pro rata
90% and above 100%
For an analysis of rights granted, vested and forfeited in the June 2016 financial year, refer to section 6.3.
5. Service agreements
Managing Director – David Biggs (Appointed 3 May 2016)
Term of Contract Start Date – 3 May 2016.
Fixed term, ending on 1 July 2019, unless the employment is terminated earlier.
The term may be extended for two additional one year terms, subject to the agreement of the Board.
Remuneration Remuneration is made up of the following components:
+ Base Salary - $800,000 per annum inclusive of superannuation, reviewed annually
+ “At risk” ST’s - up to a maximum of 50% of the Base Salary for the relevant fiscal year, payable at the discretion of the Board, having regard for the achievement of annual KPIs approved by the Board
+ “At risk” LTIs:
a. 100% of the Base Salary in the form of share rights issued under the Company’s Share Rights Plan for the three year cycle to 30 June 2019;
b. Grants of up to a maximum of 100% of Base Salary may be made in respect of subsequent cycles at the discretion of the Board; and
c. Vesting of share rights will be subject to the Company achieving Relative TSR and Absolute TSR returns as described in section 4.4
The board has determined that the grant of rights to Mr Biggs is subject to approval of shareholders at the Company’s Annual General Meeting.
+ Relocation Costs - reasonable relocation costs capped at $50,000
Clawback Payment of STIs and LTIs are subject to the Company’s Senior Executive Deferral / Claw Back Policy
Termination The Company may terminate the engagement:
a. For cause with immediate effect. On such termination, Mr Biggs will only be entitled to receive short term incentives which have been determined, and long term incentives which have vested, as at the date of termination;
b. For an extended period of absence (whether consecutive or in aggregate over a 12 month period) by giving 3 months’ notice. On such termination, Mr Biggs will be entitled to a pro-rated proportion of STIs and LTIs that have been earned or vested in the ordinary course up to date on which notice of termination is given; or
c. ‘Without cause’ by giving 6 months’ notice. On such termination, Mr Biggs will be entitled to 6 months’ Base Salary and a pro-rated proportion of STIs and LTIs that have been earned or vested in the ordinary course up to date of termination.
Mr Biggs may terminate his engagement by giving 6 months’ notice. On such termination, Mr Biggs will be entitled to a pro-rated proportion of Incentives that have been earned or vested in the ordinary course up to date on which notice of termination is given.
In all cases any entitlement on termination is subject to the operation of the Company’s Senior Executive Deferral/Claw Back Policy.
All termination payments are subject to the limits prescribed under Section 200B of the Act.
H O M E F I N A N C I A L S
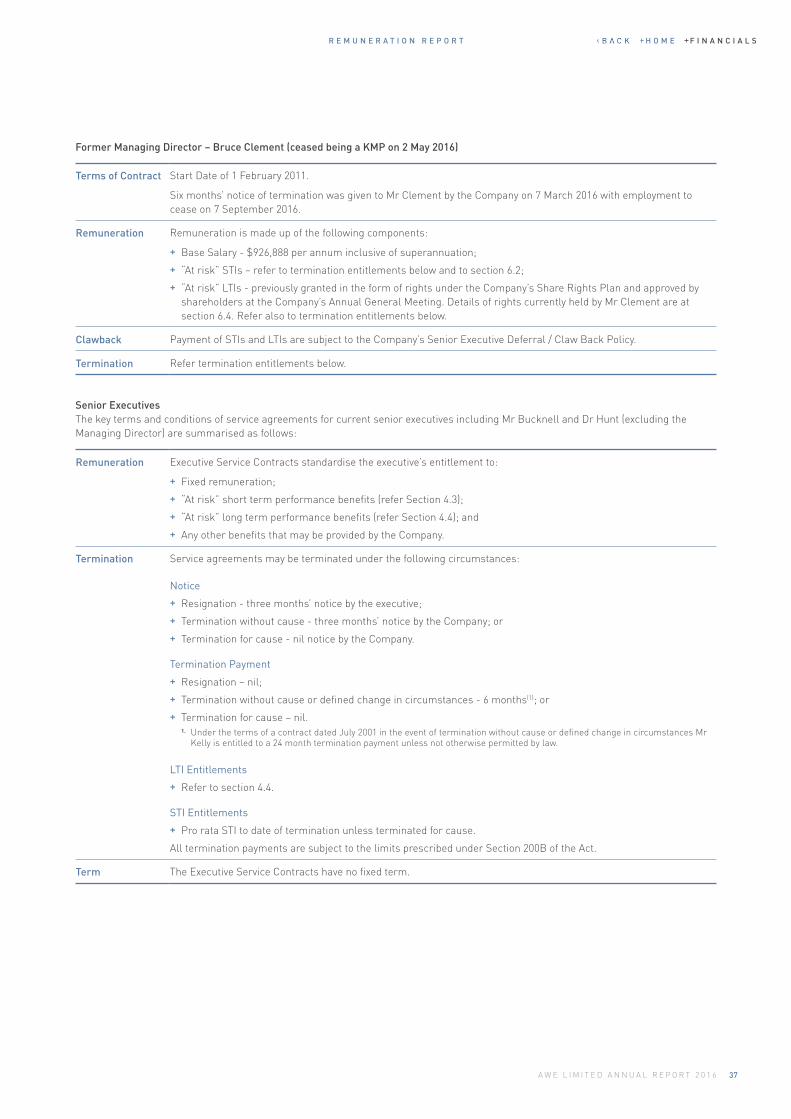
R E M U N E R A T I O N R E P O R T
37A W E L I M I T E D A N N U A L R E P O R T 2 0 1 6
Terms of Contract Start Date of 1 February 2011.
Six months’ notice of termination was given to Mr Clement by the Company on 7 March 2016 with employment to cease on 7 September 2016.
Remuneration Remuneration is made up of the following components:
+ Base Salary - $926,888 per annum inclusive of superannuation;
+ “At risk” STIs – refer to termination entitlements below and to section 6.2;
+ “At risk” LTIs - previously granted in the form of rights under the Company’s Share Rights Plan and approved by shareholders at the Company’s Annual General Meeting. Details of rights currently held by Mr Clement are at section 6.4. Refer also to termination entitlements below.
Clawback Payment of STIs and LTIs are subject to the Company’s Senior Executive Deferral / Claw Back Policy.
Termination Refer termination entitlements below.
Remuneration Executive Service Contracts standardise the executive’s entitlement to:
+ Fixed remuneration;
+ “At risk” short term performance benefits (refer Section 4.3);
+ “At risk” long term performance benefits (refer Section 4.4); and
+ Any other benefits that may be provided by the Company.
Termination Service agreements may be terminated under the following circumstances:
Notice
+ Resignation - three months’ notice by the executive;
+ Termination without cause - three months’ notice by the Company; or
+ Termination for cause - nil notice by the Company.
Termination Payment
+ Resignation – nil;
+ Termination without cause or defined change in circumstances - 6 months(1); or
+ Termination for cause – nil.1. Under the terms of a contract dated July 2001 in the event of termination without cause or defined change in circumstances Mr
Kelly is entitled to a 24 month termination payment unless not otherwise permitted by law.
LTI Entitlements
+ Refer to section 4.4.
STI Entitlements
+ Pro rata STI to date of termination unless terminated for cause.
All termination payments are subject to the limits prescribed under Section 200B of the Act.
Term The Executive Service Contracts have no fixed term.
Former Managing Director – Bruce Clement (ceased being a KMP on 2 May 2016)
Senior ExecutivesThe key terms and conditions of service agreements for current senior executives including Mr Bucknell and Dr Hunt (excluding the Managing Director) are summarised as follows:
H O M E F I N A N C I A L S
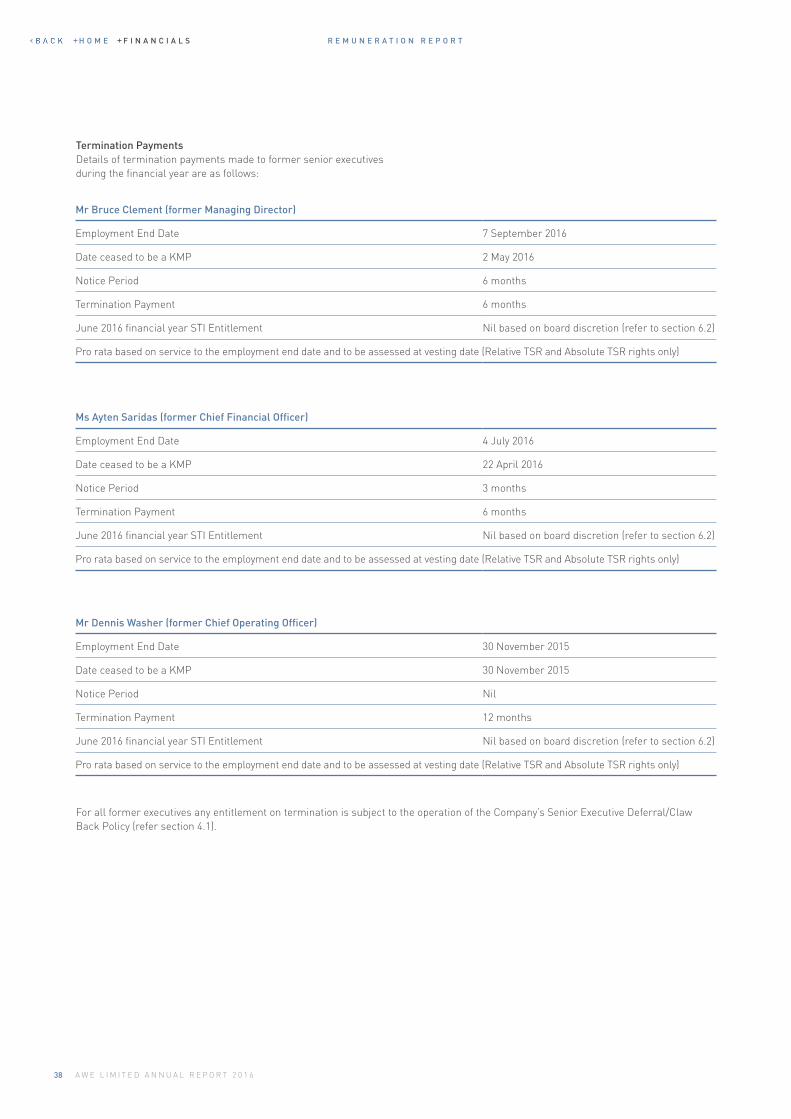
R E M U N E R A T I O N R E P O R T
38 A W E L I M I T E D A N N U A L R E P O R T 2 0 1 6
Termination PaymentsDetails of termination payments made to former senior executives during the financial year are as follows:
Mr Bruce Clement (former Managing Director)
Employment End Date 7 September 2016
Date ceased to be a KMP 2 May 2016
Notice Period 6 months
Termination Payment 6 months
June 2016 financial year STI Entitlement Nil based on board discretion (refer to section 6.2)
Pro rata based on service to the employment end date and to be assessed at vesting date (Relative TSR and Absolute TSR rights only)
Ms Ayten Saridas (former Chief Financial Officer)
Employment End Date 4 July 2016
Date ceased to be a KMP 22 April 2016
Notice Period 3 months
Termination Payment 6 months
June 2016 financial year STI Entitlement Nil based on board discretion (refer to section 6.2)
Pro rata based on service to the employment end date and to be assessed at vesting date (Relative TSR and Absolute TSR rights only)
Mr Dennis Washer (former Chief Operating Officer)
Employment End Date 30 November 2015
Date ceased to be a KMP 30 November 2015
Notice Period Nil
Termination Payment 12 months
June 2016 financial year STI Entitlement Nil based on board discretion (refer to section 6.2)
Pro rata based on service to the employment end date and to be assessed at vesting date (Relative TSR and Absolute TSR rights only)
For all former executives any entitlement on termination is subject to the operation of the Company’s Senior Executive Deferral/Claw Back Policy (refer section 4.1).
H O M E F I N A N C I A L S
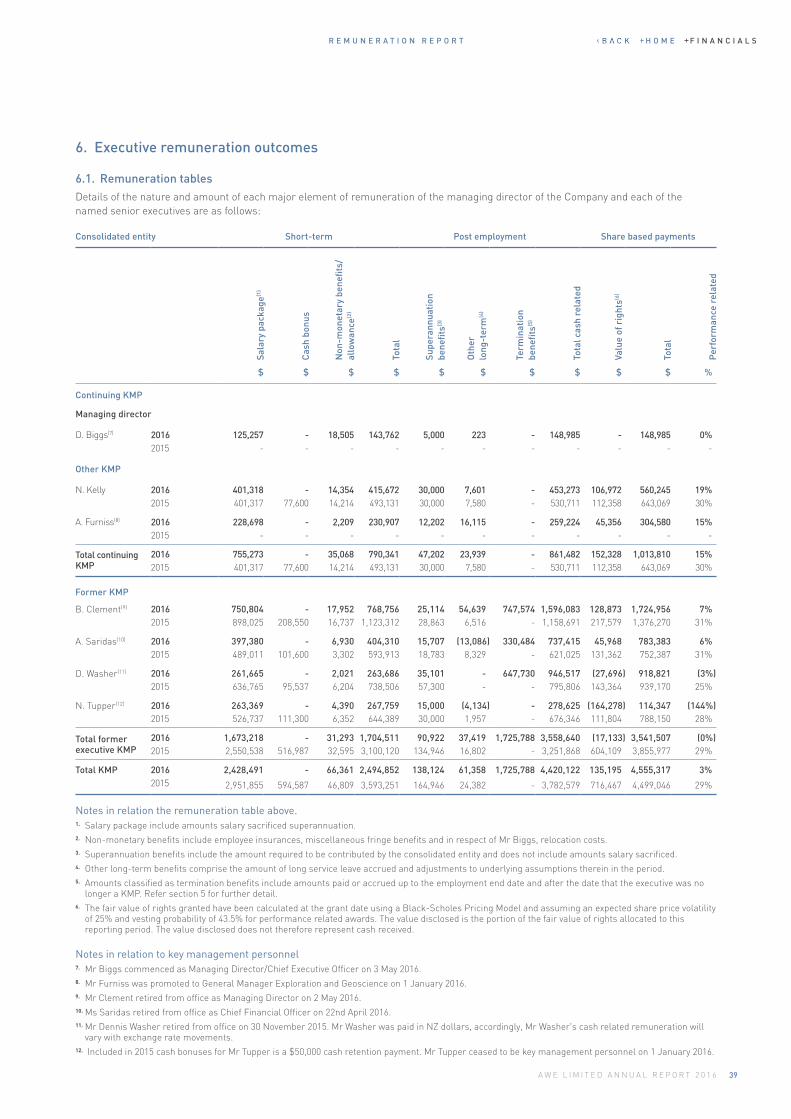
R E M U N E R A T I O N R E P O R T
39A W E L I M I T E D A N N U A L R E P O R T 2 0 1 6
Consolidated entity Short-term Post employment Share based payments
Sala
ry p
acka
ge(1
)
Cas
h bo
nus
Non
-mon
etar
y be
nefit
s/
allo
wan
ce(2
)
Tota
l
Supe
rann
uati
on
bene
fits(3
)
Oth
er
long
-ter
m(4
)
Term
inat
ion
be
nefit
s(5)
Tota
l cas
h re
late
d
Valu
e of
rig
hts(6
)
Tota
l
Per
form
ance
rel
ated
$ $ $ $ $ $ $ $ $ $ %
Continuing KMP
Managing director
D. Biggs(7) 2016 125,257 - 18,505 143,762 5,000 223 - 148,985 - 148,985 0%2015 - - - - - - - - - - -
Other KMP
N. Kelly 2016 401,318 - 14,354 415,672 30,000 7,601 - 453,273 106,972 560,245 19%2015 401,317 77,600 14,214 493,131 30,000 7,580 - 530,711 112,358 643,069 30%
A. Furniss(8) 2016 228,698 - 2,209 230,907 12,202 16,115 - 259,224 45,356 304,580 15%2015 - - - - - - - - - - -
Total continuing KMP
2016 755,273 - 35,068 790,341 47,202 23,939 - 861,482 152,328 1,013,810 15%2015 401,317 77,600 14,214 493,131 30,000 7,580 - 530,711 112,358 643,069 30%
Former KMP
B. Clement(9) 2016 750,804 - 17,952 768,756 25,114 54,639 747,574 1,596,083 128,873 1,724,956 7%2015 898,025 208,550 16,737 1,123,312 28,863 6,516 - 1,158,691 217,579 1,376,270 31%
A. Saridas(10) 2016 397,380 - 6,930 404,310 15,707 (13,086) 330,484 737,415 45,968 783,383 6%2015 489,011 101,600 3,302 593,913 18,783 8,329 - 621,025 131,362 752,387 31%
D. Washer(11) 2016 261,665 - 2,021 263,686 35,101 - 647,730 946,517 (27,696) 918,821 (3%)2015 636,765 95,537 6,204 738,506 57,300 - - 795,806 143,364 939,170 25%
N. Tupper(12) 2016 263,369 - 4,390 267,759 15,000 (4,134) - 278,625 (164,278) 114,347 (144%)2015 526,737 111,300 6,352 644,389 30,000 1,957 - 676,346 111,804 788,150 28%
Total former executive KMP
2016 1,673,218 - 31,293 1,704,511 90,922 37,419 1,725,788 3,558,640 (17,133) 3,541,507 (0%)2015 2,550,538 516,987 32,595 3,100,120 134,946 16,802 - 3,251,868 604,109 3,855,977 29%
Total KMP 2016 2,428,491 - 66,361 2,494,852 138,124 61,358 1,725,788 4,420,122 135,195 4,555,317 3%2015 2,951,855 594,587 46,809 3,593,251 164,946 24,382 - 3,782,579 716,467 4,499,046 29%
6. Executive remuneration outcomes
6.1. Remuneration tablesDetails of the nature and amount of each major element of remuneration of the managing director of the Company and each of the named senior executives are as follows:
Notes in relation the remuneration table above.1. Salary package include amounts salary sacrificed superannuation.2. Non-monetary benefits include employee insurances, miscellaneous fringe benefits and in respect of Mr Biggs, relocation costs. 3. Superannuation benefits include the amount required to be contributed by the consolidated entity and does not include amounts salary sacrificed.4. Other long-term benefits comprise the amount of long service leave accrued and adjustments to underlying assumptions therein in the period. 5. Amounts classified as termination benefits include amounts paid or accrued up to the employment end date and after the date that the executive was no
longer a KMP. Refer section 5 for further detail. 6. The fair value of rights granted have been calculated at the grant date using a Black-Scholes Pricing Model and assuming an expected share price volatility
of 25% and vesting probability of 43.5% for performance related awards. The value disclosed is the portion of the fair value of rights allocated to this reporting period. The value disclosed does not therefore represent cash received.
Notes in relation to key management personnel7. Mr Biggs commenced as Managing Director/Chief Executive Officer on 3 May 2016.8. Mr Furniss was promoted to General Manager Exploration and Geoscience on 1 January 2016.9. Mr Clement retired from office as Managing Director on 2 May 2016. 10. Ms Saridas retired from office as Chief Financial Officer on 22nd April 2016.11. Mr Dennis Washer retired from office on 30 November 2015. Mr Washer was paid in NZ dollars, accordingly, Mr Washer's cash related remuneration will
vary with exchange rate movements. 12. Included in 2015 cash bonuses for Mr Tupper is a $50,000 cash retention payment. Mr Tupper ceased to be key management personnel on 1 January 2016.
H O M E F I N A N C I A L S
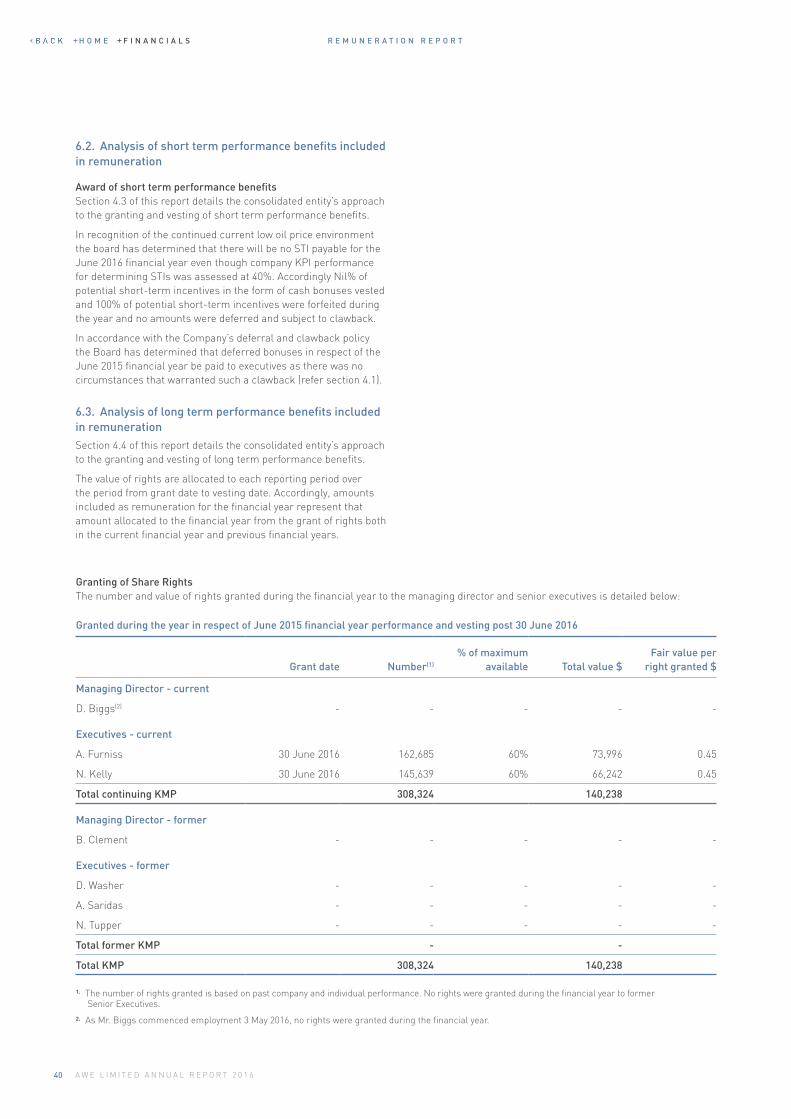
R E M U N E R A T I O N R E P O R T
40 A W E L I M I T E D A N N U A L R E P O R T 2 0 1 6
6.2. Analysis of short term performance benefits included in remuneration
Award of short term performance benefitsSection 4.3 of this report details the consolidated entity’s approach to the granting and vesting of short term performance benefits.
In recognition of the continued current low oil price environment the board has determined that there will be no STI payable for the June 2016 financial year even though company KPI performance for determining STIs was assessed at 40%. Accordingly Nil% of potential short-term incentives in the form of cash bonuses vested and 100% of potential short-term incentives were forfeited during the year and no amounts were deferred and subject to clawback.
In accordance with the Company’s deferral and clawback policy the Board has determined that deferred bonuses in respect of the June 2015 financial year be paid to executives as there was no circumstances that warranted such a clawback (refer section 4.1).
6.3. Analysis of long term performance benefits included in remunerationSection 4.4 of this report details the consolidated entity’s approach to the granting and vesting of long term performance benefits.
The value of rights are allocated to each reporting period over the period from grant date to vesting date. Accordingly, amounts included as remuneration for the financial year represent that amount allocated to the financial year from the grant of rights both in the current financial year and previous financial years.
Granted during the year in respect of June 2015 financial year performance and vesting post 30 June 2016
Grant date Number(1)
% of maximum available Total value $
Fair value per right granted $
Managing Director - current
D. Biggs(2) - - - - -
Executives - current
A. Furniss 30 June 2016 162,685 60% 73,996 0.45
N. Kelly 30 June 2016 145,639 60% 66,242 0.45
Total continuing KMP 308,324 140,238
Managing Director - former
B. Clement - - - - -
Executives - former
D. Washer - - - - -
A. Saridas - - - - -
N. Tupper - - - - -
Total former KMP - -
Total KMP 308,324 140,238
Granting of Share RightsThe number and value of rights granted during the financial year to the managing director and senior executives is detailed below:
1. The number of rights granted is based on past company and individual performance. No rights were granted during the financial year to former Senior Executives.
2. As Mr. Biggs commenced employment 3 May 2016, no rights were granted during the financial year.
H O M E F I N A N C I A L S
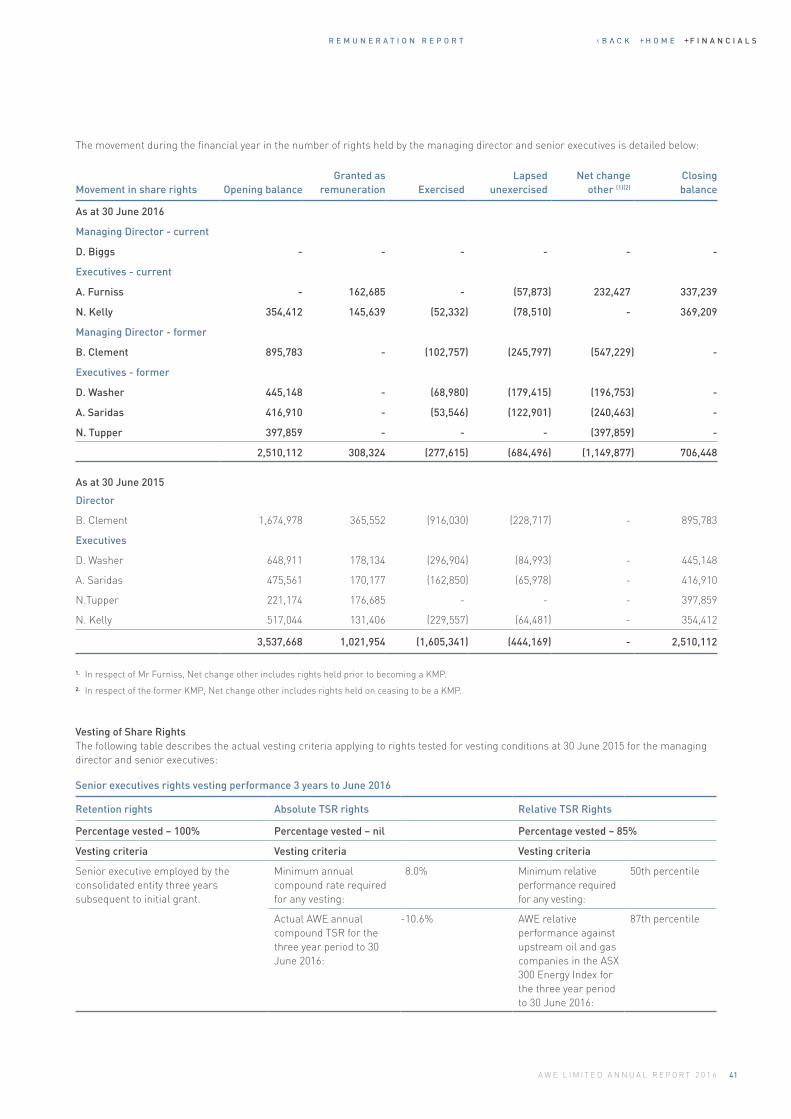
R E M U N E R A T I O N R E P O R T
41A W E L I M I T E D A N N U A L R E P O R T 2 0 1 6
The movement during the financial year in the number of rights held by the managing director and senior executives is detailed below:
Movement in share rights Opening balanceGranted as
remuneration ExercisedLapsed
unexercisedNet change
other (1)(2)
Closing balance
As at 30 June 2016
Managing Director - current
D. Biggs - - - - - -
Executives - current
A. Furniss - 162,685 - (57,873) 232,427 337,239
N. Kelly 354,412 145,639 (52,332) (78,510) - 369,209
Managing Director - former
B. Clement 895,783 - (102,757) (245,797) (547,229) -
Executives - former
D. Washer 445,148 - (68,980) (179,415) (196,753) -
A. Saridas 416,910 - (53,546) (122,901) (240,463) -
N. Tupper 397,859 - - - (397,859) -
2,510,112 308,324 (277,615) (684,496) (1,149,877) 706,448
As at 30 June 2015
Director
B. Clement 1,674,978 365,552 (916,030) (228,717) - 895,783
Executives
D. Washer 648,911 178,134 (296,904) (84,993) - 445,148
A. Saridas 475,561 170,177 (162,850) (65,978) - 416,910
N.Tupper 221,174 176,685 - - - 397,859
N. Kelly 517,044 131,406 (229,557) (64,481) - 354,412
3,537,668 1,021,954 (1,605,341) (444,169) - 2,510,112
1. In respect of Mr Furniss, Net change other includes rights held prior to becoming a KMP.2. In respect of the former KMP, Net change other includes rights held on ceasing to be a KMP.
Vesting of Share RightsThe following table describes the actual vesting criteria applying to rights tested for vesting conditions at 30 June 2015 for the managing director and senior executives:
Senior executives rights vesting performance 3 years to June 2016
Retention rights Absolute TSR rights Relative TSR Rights
Percentage vested – 100% Percentage vested – nil Percentage vested – 85%
Vesting criteria Vesting criteria Vesting criteria
Senior executive employed by the consolidated entity three years subsequent to initial grant.
Minimum annual compound rate required for any vesting:
8.0% Minimum relative performance required for any vesting:
50th percentile
Actual AWE annual compound TSR for the three year period to 30 June 2016:
-10.6% AWE relative performance against upstream oil and gas companies in the ASX 300 Energy Index for the three year period to 30 June 2016:
87th percentile
H O M E F I N A N C I A L S
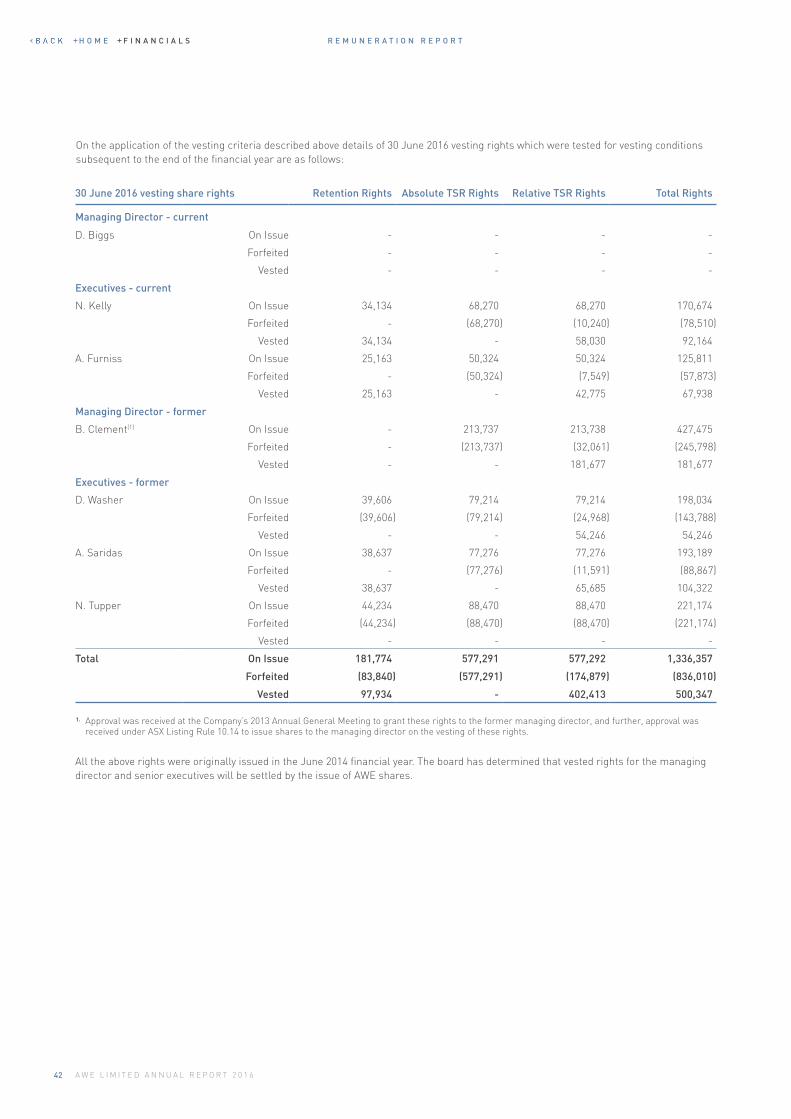
R E M U N E R A T I O N R E P O R T
42 A W E L I M I T E D A N N U A L R E P O R T 2 0 1 6
On the application of the vesting criteria described above details of 30 June 2016 vesting rights which were tested for vesting conditions subsequent to the end of the financial year are as follows:
30 June 2016 vesting share rights Retention Rights Absolute TSR Rights Relative TSR Rights Total Rights
Managing Director - current
D. Biggs On Issue - - - -
Forfeited - - - -
Vested - - - -
Executives - current
N. Kelly On Issue 34,134 68,270 68,270 170,674
Forfeited - (68,270) (10,240) (78,510)
Vested 34,134 - 58,030 92,164
A. Furniss On Issue 25,163 50,324 50,324 125,811
Forfeited - (50,324) (7,549) (57,873)
Vested 25,163 - 42,775 67,938
Managing Director - former
B. Clement(1) On Issue - 213,737 213,738 427,475
Forfeited - (213,737) (32,061) (245,798)
Vested - - 181,677 181,677
Executives - former
D. Washer On Issue 39,606 79,214 79,214 198,034
Forfeited (39,606) (79,214) (24,968) (143,788)
Vested - - 54,246 54,246
A. Saridas On Issue 38,637 77,276 77,276 193,189
Forfeited - (77,276) (11,591) (88,867)
Vested 38,637 - 65,685 104,322
N. Tupper On Issue 44,234 88,470 88,470 221,174
Forfeited (44,234) (88,470) (88,470) (221,174)
Vested - - - -
Total On Issue 181,774 577,291 577,292 1,336,357
Forfeited (83,840) (577,291) (174,879) (836,010)
Vested 97,934 - 402,413 500,347
1. Approval was received at the Company’s 2013 Annual General Meeting to grant these rights to the former managing director, and further, approval was received under ASX Listing Rule 10.14 to issue shares to the managing director on the vesting of these rights.
All the above rights were originally issued in the June 2014 financial year. The board has determined that vested rights for the managing director and senior executives will be settled by the issue of AWE shares.
H O M E F I N A N C I A L S
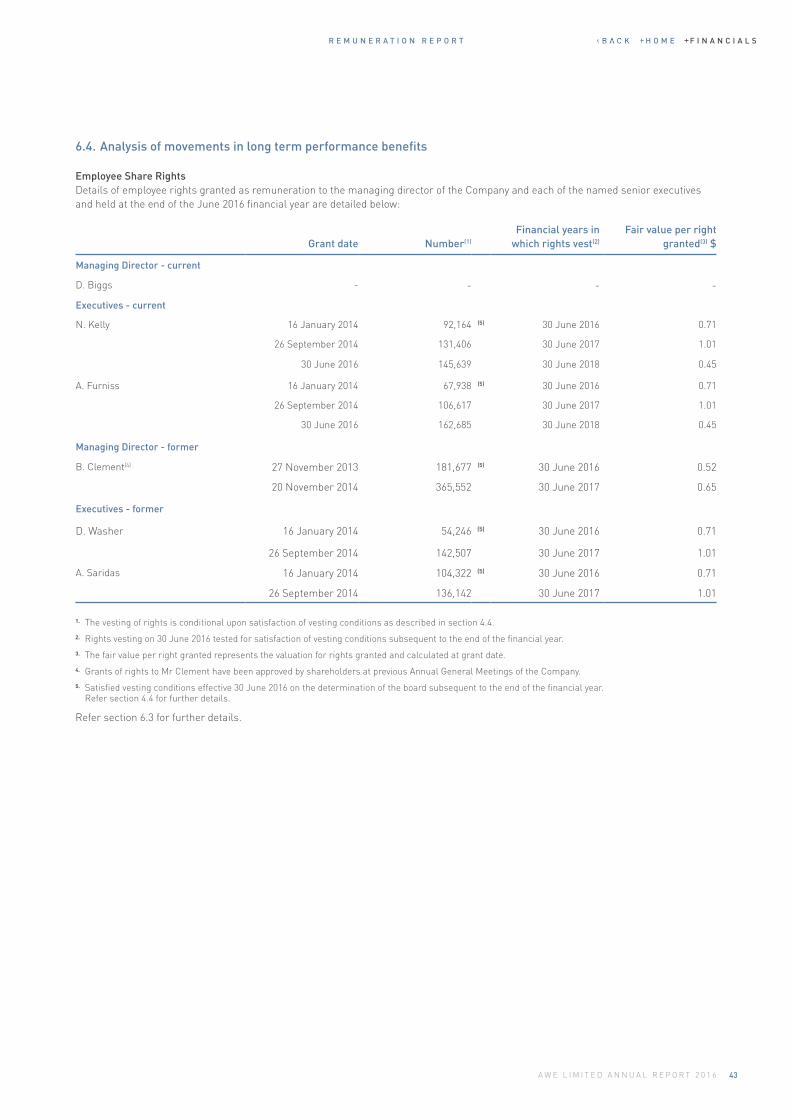
R E M U N E R A T I O N R E P O R T
43A W E L I M I T E D A N N U A L R E P O R T 2 0 1 6
6.4. Analysis of movements in long term performance benefits
Employee Share RightsDetails of employee rights granted as remuneration to the managing director of the Company and each of the named senior executives and held at the end of the June 2016 financial year are detailed below:
Grant date Number(1) Financial years in
which rights vest(2)
Fair value per right granted(3) $
Managing Director - current
D. Biggs - - - -
Executives - current
N. Kelly 16 January 2014 92,164 (5) 30 June 2016 0.71
26 September 2014 131,406 30 June 2017 1.01
30 June 2016 145,639 30 June 2018 0.45
A. Furniss 16 January 2014 67,938 (5) 30 June 2016 0.71
26 September 2014 106,617 30 June 2017 1.01
30 June 2016 162,685 30 June 2018 0.45
Managing Director - former
B. Clement(4) 27 November 2013 181,677 (5) 30 June 2016 0.52
20 November 2014 365,552 30 June 2017 0.65
Executives - former
D. Washer 16 January 2014 54,246 (5) 30 June 2016 0.71
26 September 2014 142,507 30 June 2017 1.01
A. Saridas 16 January 2014 104,322 (5) 30 June 2016 0.71
26 September 2014 136,142 30 June 2017 1.01
1. The vesting of rights is conditional upon satisfaction of vesting conditions as described in section 4.4.2. Rights vesting on 30 June 2016 tested for satisfaction of vesting conditions subsequent to the end of the financial year.3. The fair value per right granted represents the valuation for rights granted and calculated at grant date.4. Grants of rights to Mr Clement have been approved by shareholders at previous Annual General Meetings of the Company.5. Satisfied vesting conditions effective 30 June 2016 on the determination of the board subsequent to the end of the financial year.
Refer section 4.4 for further details.
Refer section 6.3 for further details.
H O M E F I N A N C I A L S
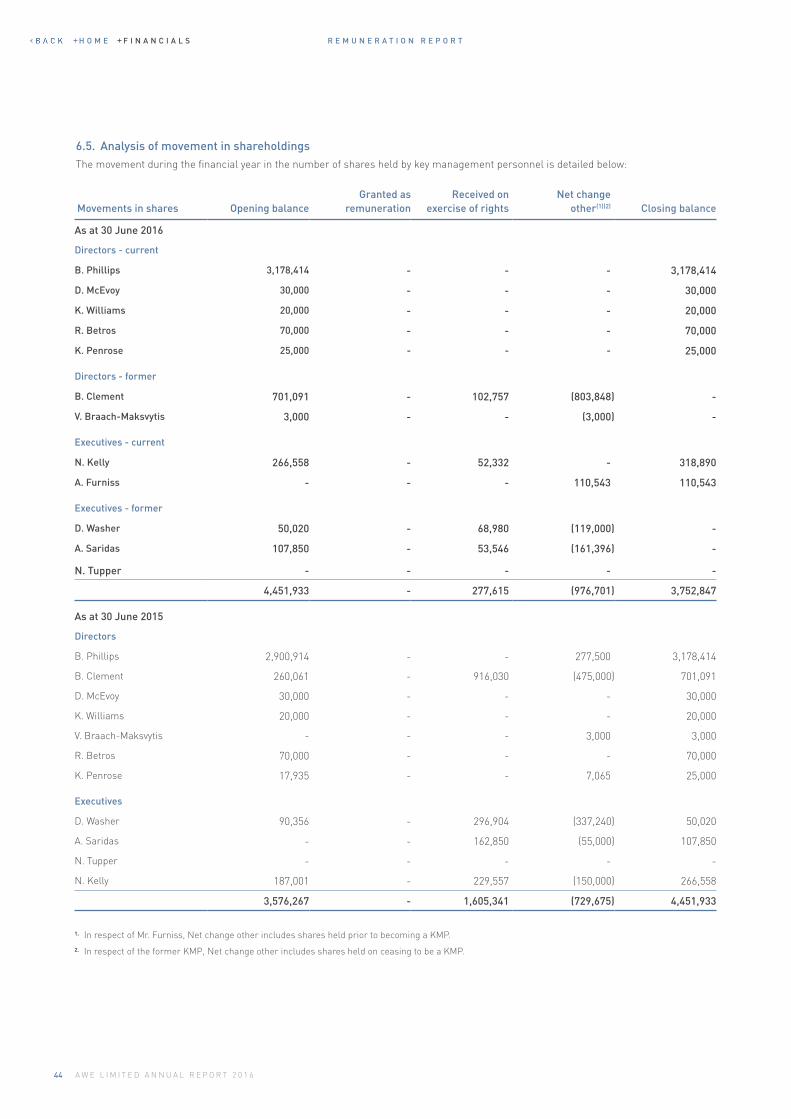
R E M U N E R A T I O N R E P O R T
44 A W E L I M I T E D A N N U A L R E P O R T 2 0 1 6
6.5. Analysis of movement in shareholdingsThe movement during the financial year in the number of shares held by key management personnel is detailed below:
Movements in shares Opening balanceGranted as
remunerationReceived on
exercise of rightsNet change
other(1)(2) Closing balance
As at 30 June 2016
Directors - current
B. Phillips 3,178,414 - - - 3,178,414
D. McEvoy 30,000 - - - 30,000
K. Williams 20,000 - - - 20,000
R. Betros 70,000 - - - 70,000
K. Penrose 25,000 - - - 25,000
Directors - former
B. Clement 701,091 - 102,757 (803,848) -
V. Braach-Maksvytis 3,000 - - (3,000) -
Executives - current
N. Kelly 266,558 - 52,332 - 318,890
A. Furniss - - - 110,543 110,543
Executives - former
D. Washer 50,020 - 68,980 (119,000) -
A. Saridas 107,850 - 53,546 (161,396) -
N. Tupper - - - - -
4,451,933 - 277,615 (976,701) 3,752,847
As at 30 June 2015
Directors
B. Phillips 2,900,914 - - 277,500 3,178,414
B. Clement 260,061 - 916,030 (475,000) 701,091
D. McEvoy 30,000 - - - 30,000
K. Williams 20,000 - - - 20,000
V. Braach-Maksvytis - - - 3,000 3,000
R. Betros 70,000 - - - 70,000
K. Penrose 17,935 - - 7,065 25,000
Executives
D. Washer 90,356 - 296,904 (337,240) 50,020
A. Saridas - - 162,850 (55,000) 107,850
N. Tupper - - - - -
N. Kelly 187,001 - 229,557 (150,000) 266,558
3,576,267 - 1,605,341 (729,675) 4,451,933
1. In respect of Mr. Furniss, Net change other includes shares held prior to becoming a KMP.2. In respect of the former KMP, Net change other includes shares held on ceasing to be a KMP.
H O M E F I N A N C I A L S
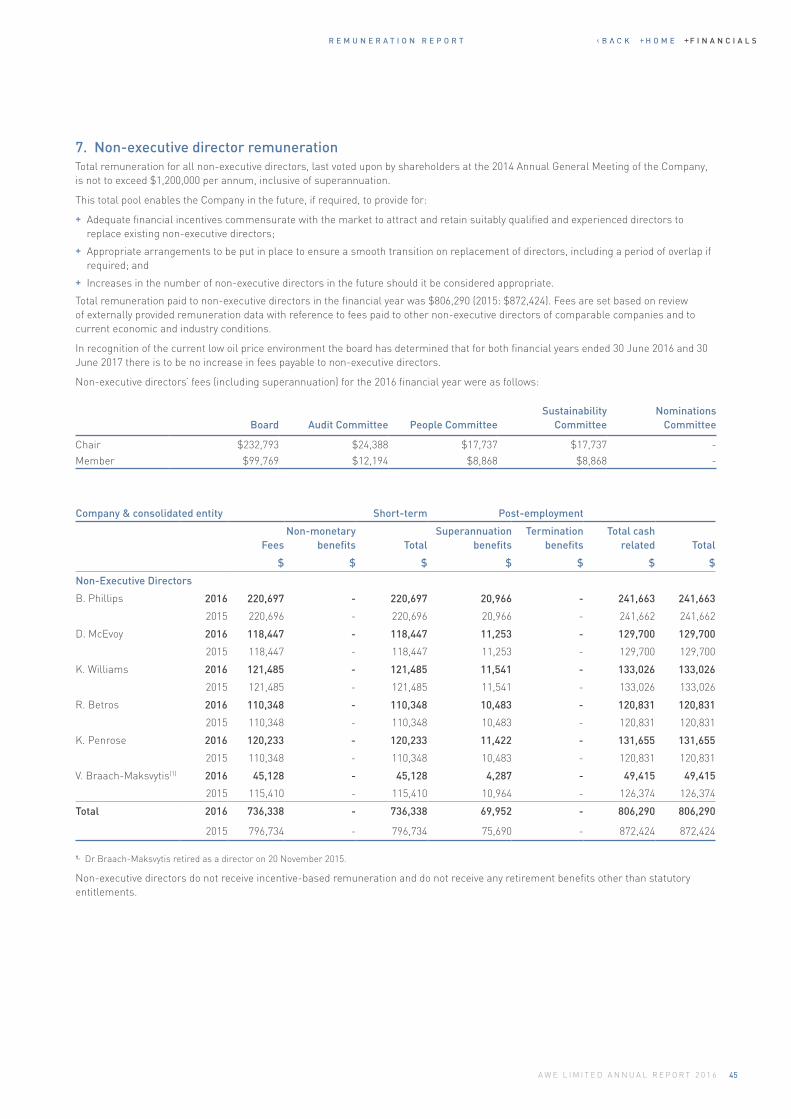
R E M U N E R A T I O N R E P O R T
45A W E L I M I T E D A N N U A L R E P O R T 2 0 1 6
7. Non-executive director remuneration Total remuneration for all non-executive directors, last voted upon by shareholders at the 2014 Annual General Meeting of the Company, is not to exceed $1,200,000 per annum, inclusive of superannuation.
This total pool enables the Company in the future, if required, to provide for:
+ Adequate financial incentives commensurate with the market to attract and retain suitably qualified and experienced directors to replace existing non-executive directors;
+ Appropriate arrangements to be put in place to ensure a smooth transition on replacement of directors, including a period of overlap if required; and
+ Increases in the number of non-executive directors in the future should it be considered appropriate.
Total remuneration paid to non-executive directors in the financial year was $806,290 (2015: $872,424). Fees are set based on review of externally provided remuneration data with reference to fees paid to other non-executive directors of comparable companies and to current economic and industry conditions.
In recognition of the current low oil price environment the board has determined that for both financial years ended 30 June 2016 and 30 June 2017 there is to be no increase in fees payable to non-executive directors.
Non-executive directors’ fees (including superannuation) for the 2016 financial year were as follows:
Company & consolidated entity Short-term Post-employment
FeesNon-monetary
benefits TotalSuperannuation
benefitsTermination
benefits Total cash
related Total
$ $ $ $ $ $ $
Non-Executive Directors
B. Phillips 2016 220,697 - 220,697 20,966 - 241,663 241,663
2015 220,696 - 220,696 20,966 - 241,662 241,662
D. McEvoy 2016 118,447 - 118,447 11,253 - 129,700 129,700
2015 118,447 - 118,447 11,253 - 129,700 129,700
K. Williams 2016 121,485 - 121,485 11,541 - 133,026 133,026
2015 121,485 - 121,485 11,541 - 133,026 133,026
R. Betros 2016 110,348 - 110,348 10,483 - 120,831 120,831
2015 110,348 - 110,348 10,483 - 120,831 120,831
K. Penrose 2016 120,233 - 120,233 11,422 - 131,655 131,655
2015 110,348 - 110,348 10,483 - 120,831 120,831
V. Braach-Maksvytis(1) 2016 45,128 - 45,128 4,287 - 49,415 49,415
2015 115,410 - 115,410 10,964 - 126,374 126,374
Total
2016 736,338 - 736,338 69,952 - 806,290 806,290
2015 796,734 - 796,734 75,690 - 872,424 872,424
Board Audit Committee People Committee Sustainability
CommitteeNominations
Committee
Chair $232,793 $24,388 $17,737 $17,737 -
Member $99,769 $12,194 $8,868 $8,868 -
1. Dr Braach-Maksvytis retired as a director on 20 November 2015.
Non-executive directors do not receive incentive-based remuneration and do not receive any retirement benefits other than statutory entitlements.
H O M E F I N A N C I A L S
46 A W E L I M I T E D A N N U A L R E P O R T 2 0 1 6
F I N A N C I A L S T A T E M E N T S
Consolidated income statement 47
Consolidated statement of 48 comprehensive income
Consolidated statement of financial position 49
Consolidated statement of cash flows 50
Consolidated statement of changes in equity 51
Notes to the consolidated 52 financial statements
Directors’ declaration 89
Independent auditor's report to 90 the members of AWE Limited
F I N A N C I A L S TAT E M E N T S
H O M E F I N A N C I A L S
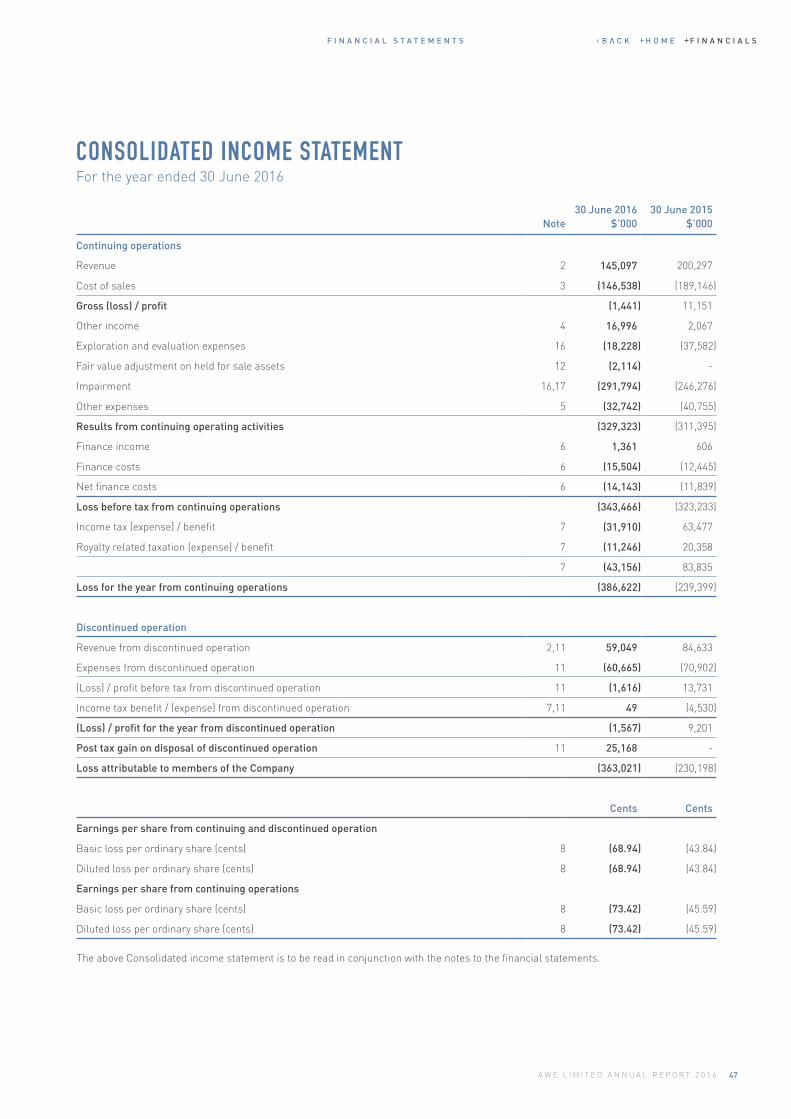
F I N A N C I A L S T A T E M E N T S
47A W E L I M I T E D A N N U A L R E P O R T 2 0 1 6
CONSOLIDATED INCOME STATEMENT For the year ended 30 June 2016
Note30 June 2016
$’00030 June 2015
$’000
Continuing operations
Revenue 2 145,097 200,297
Cost of sales 3 (146,538) (189,146)
Gross (loss) / profit (1,441) 11,151
Other income 4 16,996 2,067
Exploration and evaluation expenses 16 (18,228) (37,582)
Fair value adjustment on held for sale assets 12 (2,114) -
Impairment 16,17 (291,794) (246,276)
Other expenses 5 (32,742) (40,755)
Results from continuing operating activities (329,323) (311,395)
Finance income 6 1,361 606
Finance costs 6 (15,504) (12,445)
Net finance costs 6 (14,143) (11,839)
Loss before tax from continuing operations (343,466) (323,233)
Income tax (expense) / benefit 7 (31,910) 63,477
Royalty related taxation (expense) / benefit 7 (11,246) 20,358
7 (43,156) 83,835
Loss for the year from continuing operations (386,622) (239,399)
Discontinued operation
Revenue from discontinued operation 2,11 59,049 84,633
Expenses from discontinued operation 11 (60,665) (70,902)
(Loss) / profit before tax from discontinued operation 11 (1,616) 13,731
Income tax benefit / (expense) from discontinued operation 7,11 49 (4,530)
(Loss) / profit for the year from discontinued operation (1,567) 9,201
Post tax gain on disposal of discontinued operation 11 25,168 -
Loss attributable to members of the Company (363,021) (230,198)
Cents Cents
Earnings per share from continuing and discontinued operation
Basic loss per ordinary share (cents) 8 (68.94) (43.84)
Diluted loss per ordinary share (cents) 8 (68.94) (43.84)
Earnings per share from continuing operations
Basic loss per ordinary share (cents) 8 (73.42) (45.59)
Diluted loss per ordinary share (cents) 8 (73.42) (45.59)
The above Consolidated income statement is to be read in conjunction with the notes to the financial statements.
H O M E F I N A N C I A L S
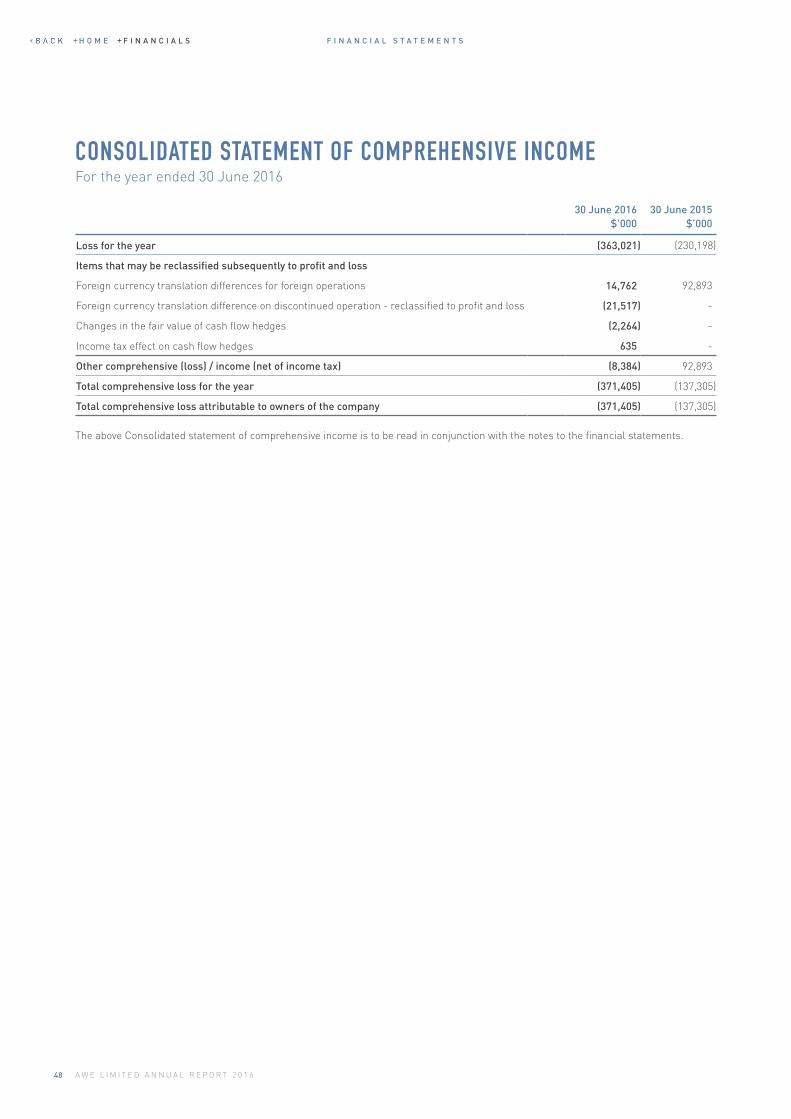
F I N A N C I A L S T A T E M E N T S
48 A W E L I M I T E D A N N U A L R E P O R T 2 0 1 6
CONSOLIDATED STATEMENT OF COMPREHENSIVE INCOME For the year ended 30 June 2016
30 June 2016 $’000
30 June 2015 $’000
Loss for the year (363,021) (230,198)
Items that may be reclassified subsequently to profit and loss
Foreign currency translation differences for foreign operations 14,762 92,893
Foreign currency translation difference on discontinued operation - reclassified to profit and loss (21,517) -
Changes in the fair value of cash flow hedges (2,264) -
Income tax effect on cash flow hedges 635 -
Other comprehensive (loss) / income (net of income tax) (8,384) 92,893
Total comprehensive loss for the year (371,405) (137,305)
Total comprehensive loss attributable to owners of the company (371,405) (137,305)
The above Consolidated statement of comprehensive income is to be read in conjunction with the notes to the financial statements.
H O M E F I N A N C I A L S
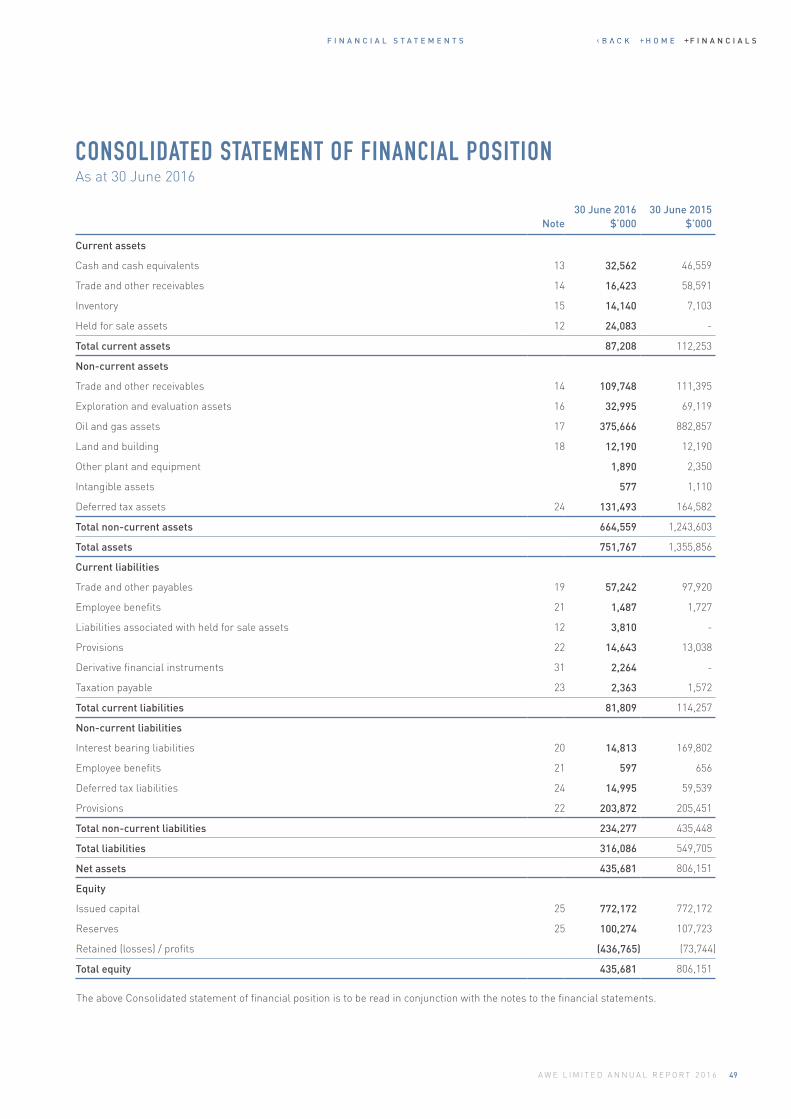
F I N A N C I A L S T A T E M E N T S
49A W E L I M I T E D A N N U A L R E P O R T 2 0 1 6
CONSOLIDATED STATEMENT OF FINANCIAL POSITION As at 30 June 2016
Note30 June 2016
$’00030 June 2015
$’000
Current assets
Cash and cash equivalents 13 32,562 46,559
Trade and other receivables 14 16,423 58,591
Inventory 15 14,140 7,103
Held for sale assets 12 24,083 -
Total current assets 87,208 112,253
Non-current assets
Trade and other receivables 14 109,748 111,395
Exploration and evaluation assets 16 32,995 69,119
Oil and gas assets 17 375,666 882,857
Land and building 18 12,190 12,190
Other plant and equipment 1,890 2,350
Intangible assets 577 1,110
Deferred tax assets 24 131,493 164,582
Total non-current assets 664,559 1,243,603
Total assets 751,767 1,355,856
Current liabilities
Trade and other payables 19 57,242 97,920
Employee benefits 21 1,487 1,727
Liabilities associated with held for sale assets 12 3,810 -
Provisions 22 14,643 13,038
Derivative financial instruments 31 2,264 -
Taxation payable 23 2,363 1,572
Total current liabilities 81,809 114,257
Non-current liabilities
Interest bearing liabilities 20 14,813 169,802
Employee benefits 21 597 656
Deferred tax liabilities 24 14,995 59,539
Provisions 22 203,872 205,451
Total non-current liabilities 234,277 435,448
Total liabilities 316,086 549,705
Net assets 435,681 806,151
Equity
Issued capital 25 772,172 772,172
Reserves 25 100,274 107,723
Retained (losses) / profits (436,765) (73,744)
Total equity 435,681 806,151
The above Consolidated statement of financial position is to be read in conjunction with the notes to the financial statements.
H O M E F I N A N C I A L S
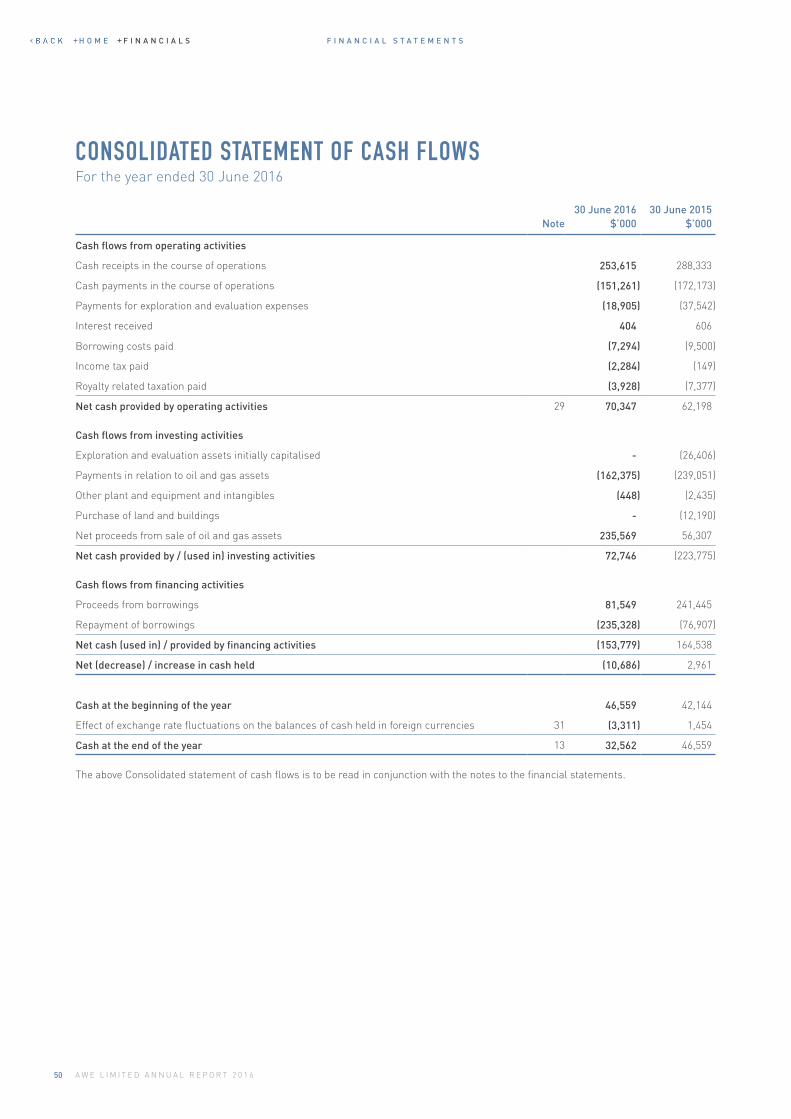
F I N A N C I A L S T A T E M E N T S
50 A W E L I M I T E D A N N U A L R E P O R T 2 0 1 6
CONSOLIDATED STATEMENT OF CASH FLOWS For the year ended 30 June 2016
Note30 June 2016
$’00030 June 2015
$’000
Cash flows from operating activities
Cash receipts in the course of operations 253,615 288,333
Cash payments in the course of operations (151,261) (172,173)
Payments for exploration and evaluation expenses (18,905) (37,542)
Interest received 404 606
Borrowing costs paid (7,294) (9,500)
Income tax paid (2,284) (149)
Royalty related taxation paid (3,928) (7,377)
Net cash provided by operating activities 29 70,347 62,198
Cash flows from investing activities
Exploration and evaluation assets initially capitalised - (26,406)
Payments in relation to oil and gas assets (162,375) (239,051)
Other plant and equipment and intangibles (448) (2,435)
Purchase of land and buildings - (12,190)
Net proceeds from sale of oil and gas assets 235,569 56,307
Net cash provided by / (used in) investing activities 72,746 (223,775)
Cash flows from financing activities
Proceeds from borrowings 81,549 241,445
Repayment of borrowings (235,328) (76,907)
Net cash (used in) / provided by financing activities (153,779) 164,538
Net (decrease) / increase in cash held (10,686) 2,961
Cash at the beginning of the year 46,559 42,144
Effect of exchange rate fluctuations on the balances of cash held in foreign currencies 31 (3,311) 1,454
Cash at the end of the year 13 32,562 46,559
The above Consolidated statement of cash flows is to be read in conjunction with the notes to the financial statements.
H O M E F I N A N C I A L S
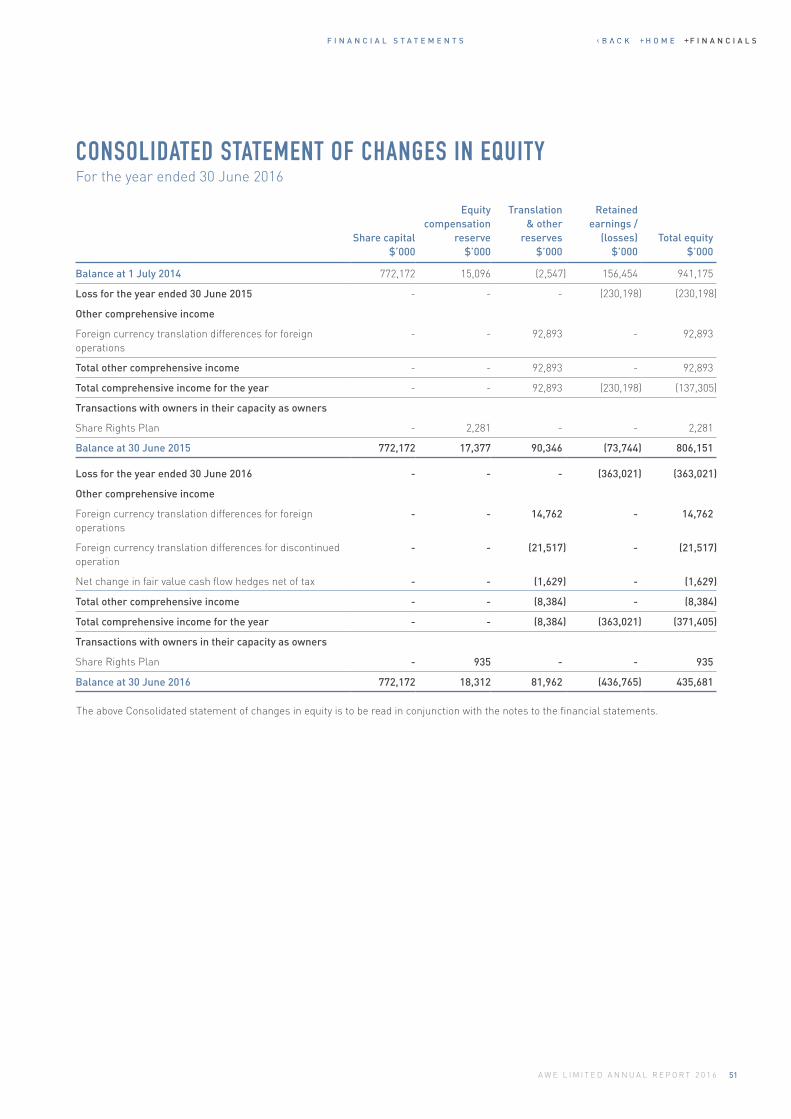
F I N A N C I A L S T A T E M E N T S
51A W E L I M I T E D A N N U A L R E P O R T 2 0 1 6
Share capital $’000
Equity compensation
reserve $’000
Translation & other
reserves $’000
Retained earnings /
(losses) $’000
Total equity $’000
Balance at 1 July 2014 772,172 15,096 (2,547) 156,454 941,175
Loss for the year ended 30 June 2015 - - - (230,198) (230,198)
Other comprehensive income
Foreign currency translation differences for foreign operations
- - 92,893 - 92,893
Total other comprehensive income - - 92,893 - 92,893
Total comprehensive income for the year - - 92,893 (230,198) (137,305)
Transactions with owners in their capacity as owners
Share Rights Plan - 2,281 - - 2,281
Balance at 30 June 2015 772,172 17,377 90,346 (73,744) 806,151
Loss for the year ended 30 June 2016 - - - (363,021) (363,021)
Other comprehensive income
Foreign currency translation differences for foreign operations
- - 14,762 - 14,762
Foreign currency translation differences for discontinued operation
- - (21,517) - (21,517)
Net change in fair value cash flow hedges net of tax - - (1,629) - (1,629)
Total other comprehensive income - - (8,384) - (8,384)
Total comprehensive income for the year - - (8,384) (363,021) (371,405)
Transactions with owners in their capacity as owners
Share Rights Plan - 935 - - 935
Balance at 30 June 2016 772,172 18,312 81,962 (436,765) 435,681
CONSOLIDATED STATEMENT OF CHANGES IN EQUITY For the year ended 30 June 2016
The above Consolidated statement of changes in equity is to be read in conjunction with the notes to the financial statements.
H O M E F I N A N C I A L S
N O T E S T O T H E C O N S O L I D A T E D F I N A N C I A L S T A T E M E N T S
52 A W E L I M I T E D A N N U A L R E P O R T 2 0 1 6
NOTES TO THE CONSOLIDATED FINANCIAL STATEMENTS
1. Statement of significant accounting policiesAWE Limited (the “Company”) is a for profit company domiciled in Australia. The consolidated financial statements of the Company for the financial year ended 30 June 2016 comprises the Company and its controlled entities (together referred to as the “consolidated entity”).
(a) Basis of preparation
(i) Statement of complianceThe consolidated financial statements are general purpose financial statements which have been prepared in accordance with Australian Accounting Standards (“AASBs”) (including Australian Interpretations) adopted by the Australian Accounting Standards Board (“AASB”) and the Corporations Act 2001. The consolidated financial statements also comply with International Financial Reporting Standards (IFRS) as issued by the International Accounting Standards Board.
The accounting policies set out in this note have been applied consistently to all periods presented in these consolidated financial statements. Certain comparative amounts have been reclassified to conform with the current year’s presentation.
The consolidated financial statements were authorised for issue by the directors on 25 August 2016.
(ii) Functional and presentation currency The financial statements are presented in Australian Dollars, which is the Company’s functional currency and the functional currency of the majority of controlled entities within the consolidated entity.
The Company is of a kind referred to in Class Order 2016/191, issued by the Australian Securities and Investments Commission (“ASIC”), relating to the “rounding off” of amounts in the financial statements. Amounts in the financial statements have been rounded off in accordance with that Class Order to the nearest thousand dollars, or in certain cases, the nearest dollar.
(iii) Basis of measurementThe financial statements are prepared on the historical cost basis except that derivative financial instruments and available for sale financial assets are stated at their fair value.
(iv) Use of estimates and judgements The preparation of financial statements in conformity with Australian Accounting Standards requires management to make judgements, estimates and assumptions that affect the application of policies and reported amounts of assets and liabilities, income and expenses. The estimates and associated assumptions are based on historical experience and various other factors that are believed to be reasonable under the circumstances, the results of which form the basis of making the judgements about carrying values of assets and liabilities that are not readily apparent from other sources. Actual results may differ from these estimates.
The estimates and underlying assumptions are reviewed on a regular basis. Revisions to accounting estimates are recognised in the period in which the estimate is revised if the revision affects only that period, or in the period of the revision and future periods if the revision affects both current and future periods.
The most significant estimates and assumptions that have a significant risk of causing a material adjustment to the carrying amounts of assets and liabilities within the next financial year relate to:
Exploration and evaluation assets
The consolidated entity’s accounting policy for exploration and evaluation expenditure is set out at Note 1 (l). The application of this policy necessarily requires management to make certain estimates and assumptions as to future events and circumstances, in particular, the assessment of whether economic quantities of reserves have been found. Any such estimates and assumptions may change as new information becomes available. If, after having capitalised expenditure under this policy, management concludes that the capitalised expenditure is unlikely to be recovered by future exploitation or sale, then the relevant capitalised amount will be written off to the income statement. Changes in assumptions may result in a material adjustment to the carrying amount of exploration and evaluation assets.
Restoration obligations
The consolidated entity estimates the future removal costs of production facilities and wells at the time of installation of the assets. In most instances, removal of assets occurs many years into the future. This requires judgemental assumptions regarding removal date, future environmental legislation, the extent of reclamation activities required, the engineering methodology for estimating cost, future removal technologies in determining the removal cost, and asset specific discount rates to determine the present value of these cash flows. The consolidated entity’s accounting policy for restoration obligations is set out at Note 1(q).
Reserve estimates
Estimates of recoverable quantities of proven and probable reserves reported include assumptions regarding commodity prices, exchange rates, discount rates, production and transportation costs for future cash flows. It also requires interpretation of geological and geophysical models in order to make an assessment of the size, shape, depth and quality of reservoirs and their anticipated recoveries. The economic, geological and technical factors used to estimate reserves may change from period to period. Changes in reported reserves can impact asset carrying values, the provision for restoration and the recognition of deferred tax assets, due to changes in expected future cash flows. Reserves are integral to the calculation of depreciation and amortisation charged to the income statement.
Oil and gas price forecast
Future oil and gas price forecasts are a combination of contracted gas prices, forward market prices at 30 June 2016 and longer term observable price forecasts.
H O M E F I N A N C I A L S
N O T E S T O T H E C O N S O L I D A T E D F I N A N C I A L S T A T E M E N T S
53A W E L I M I T E D A N N U A L R E P O R T 2 0 1 6
Impairment of oil and gas assets
The consolidated entity assesses whether oil and gas assets are impaired when preparing its annual and interim financial statements. Estimates of the recoverable amount of oil and gas assets are made based on the present value of future cash flows.
Income taxes
The consolidated entity is subject to income taxes in Australia and jurisdictions where it has foreign operations. Significant judgement is required in determining the worldwide provision for income taxes. There are certain transactions and calculations undertaken during the ordinary course of business for which the ultimate tax determination is uncertain. The consolidated entity estimates its tax liabilities based on the application of the relevant tax law. Where the final tax outcome of these matters is different from the amounts that were initially recorded, such differences will impact the current and deferred income tax assets and liabilities in the period in which such determination is made.
Share-based payment transactions
The consolidated entity measures the cost of equity-settled transactions with employees by reference to the fair value of the equity investments at the date on which they are granted.
(v) New and amended standards and interpretations The following standards and interpretations which became effective and were applied for the first time during the year ended 30 June 2016 were assessed to have no material impact on the Company:
AASB 2013-9 Amendments to Australian Accounting Standards – Conceptual Framework, Materiality and Financial Instruments
AASB 2015-3 Amendments to Australian Accounting Standards arising from the withdrawal of AASB 1031 materiality
The following recently issued standards and interpretations which are not yet effective and have not been applied, however the Company is in the process of assessing their impact:
AASB 9 Financial Instruments
AASB 2014–3 Amendments to Australian Accounting standards – Accounting for Acquisitions of Interests in Joint Operations
AASB 2014-4 Clarification of Acceptable Methods of Depreciation and Amortisation
AASB 15 Revenue from Contracts with Customers
AASB 1057 Application of Australian Accounting Standards
AASB 2014-9 Amendments to Australian Accounting Standards – Equity Method in Separate Financial Statements
AASB 2014-10 Amendments to Australian Accounting Standards – Sale or Contribution of Assets between an Investor and its Associate or Joint Venture
AASB 2015-1 Annual Improvements to IFRSs 2012-2014 Cycle
AASB 2015-2 Amendments to Australian Accounting Standards- Disclosure Initiatives: Amendments to AASB 101
AASB 2015-5 Amendments to Australian Accounting Standards- Investment Companies: Applying the Consolidation Exemption
AASB 2015-9 Amendments to Australian Accounting Standards – Scope and application in respect of AASB 8, AASB 133 and AASB 1057
AASB 16 Lease accounting
2016-1 Amendments to Australian Accounting Standards – Recognition of Deferred Tax Assets for Unrealised Losses
2016-2 Amendments to Australian Accounting Standards – Disclosure Initiative: Amendments to AASB 107, Statement of Cash Flows
IFRS 2 Classification and measurement of Share-based Payment Transactions (Amendments to IFRS 2)
(b) Basis of consolidation
(i) Controlled entities Controlled entities are entities controlled by the Company. Control exists when the Company has the power, directly or indirectly, to govern the financial and operating policies of an entity so as to obtain benefits from its activities. In assessing control, potential voting rights that presently are exercisable or convertible are taken into account. The financial statements of controlled entities are included in the consolidated financial statements from the date that control commences until the date that control ceases.
(ii) Jointly controlled operations and assetsThe Group has interests in joint operations. For the purpose of this financial report the joint operations have been denominated as “Joint Ventures” in accordance with Oil and Gas companies market practice.
Interests in unincorporated joint ventures and jointly controlled assets are brought to account by recognising in the financial statements the proportionate share of the assets they control, the liabilities and expenses they incur, and their share of the income that they earn from the sale of goods or services by the joint venture.
(iii) Transactions eliminated on consolidationIntragroup balances and any unrealised gains and losses or income and expenses arising from intragroup transactions, are eliminated in preparing the consolidated financial statements.
(iv) Changes in ownership interestsThe consolidated entity treats transactions with non-controlling interests that do not result in a loss of control as transactions with equity owners of the consolidated entity. A change in ownership interest results in an adjustment between the carrying amounts of the controlling and non-controlling interests to reflect their relative interests in the subsidiary. Any difference between the amount of the adjustment to non-controlling interests and any consideration paid or received is recognised in a separate reserve within equity attributable to owners of AWE Limited.
H O M E F I N A N C I A L S
N O T E S T O T H E C O N S O L I D A T E D F I N A N C I A L S T A T E M E N T S
54 A W E L I M I T E D A N N U A L R E P O R T 2 0 1 6
When the consolidated entity ceases to have control, joint control or significant influence, any retained interest in the entity is adjusted to fair value with the change in carrying amount recognised in profit or loss. The fair value is the initial carrying amount for the purposes of subsequently accounting for the retained interest as an associate, jointly controlled entity or financial asset. In addition, any amounts previously recognised in other comprehensive income in respect of that entity are accounted for as if the consolidated entity had directly disposed of the related assets or liabilities. This may mean that amounts previously recognised in other comprehensive income are reclassified to the income statement.
If the ownership interest in a jointly-controlled entity or an associate is reduced but joint control or significant influence is retained, only a proportionate share of the amounts previously recognised in other comprehensive income is reclassified to the income statement where appropriate.
(c) Foreign currency
(i) Foreign currency transactionsTransactions in foreign currencies are translated at the foreign exchange rate at the date of the transaction. Monetary assets and liabilities denominated in foreign currencies at the end of the reporting period are translated at the foreign exchange rate ruling at that date. Foreign exchange differences arising on translation are recognised in the income statement. Non-monetary assets and liabilities that are measured in terms of historical cost in a foreign currency are translated using the exchange rate at the date of the transaction. Non-monetary assets and liabilities denominated in foreign currencies that are stated at fair value are translated at foreign exchange rates ruling at the dates the fair value was determined.
(ii) Financial statements of foreign operationsThe assets and liabilities of foreign operations, including goodwill and fair value adjustments arising on consolidation, are translated to Australian dollars at foreign exchange rates at the end of the reporting period. The revenues and expenses of foreign operations are translated to Australian dollars at rates approximating the foreign exchange rates at the dates of the transactions. Foreign exchange differences arising on retranslation are recognised directly in a separate component of equity.
(iii) Presentation of foreign exchange gains and losses in the income statementThe consolidated entity presents its foreign exchange gains and losses within net financing income/expense in the income statement.
(d) ImpairmentThe carrying amounts of the Company’s and the consolidated entity’s assets, other than inventories (refer note 1(g)) and deferred tax assets (refer note 1(t)), are reviewed at the end of the reporting period to determine whether there is any indication of impairment. If any such indication exists, the asset’s recoverable amount is estimated.
An impairment loss is recognised whenever the carrying amount of an asset or its cash-generating unit exceeds its recoverable amount.
Calculation of recoverable amountThe recoverable amount of an asset is the greater of its fair value less cost to sell and value in use. In assessing value in use, the estimated future cash flows are discounted to their present value using a post-tax discount rate that reflects current market assessments of the time value of money and the risks specific to the asset. For an asset that does not generate independent cash inflows, the recoverable amount is determined for the cash-generating unit to which the asset belongs.
Reversals of impairmentAn impairment loss is reversed if there has been a change in the estimates used to determine the recoverable amount.
An impairment loss is reversed only to the extent that the asset’s carrying amount does not exceed the carrying amount that would have been determined, net of depreciation or amortisation, if no impairment loss had been recognised.
(e) Cash and cash equivalentsCash and cash equivalents comprise cash balances and call deposits. Bank overdrafts that are repayable on demand and form an integral part of the consolidated entity’s cash management are included as a component of cash and cash equivalents for the purpose of the statement of cash flows.
(f) Trade and other receivablesTrade receivables are recognised initially at fair value and subsequently measured at amortised cost using the effective interest method, less provision for impairment. Trade receivables are generally due for settlement between 14 and 30 days.
Collectability of trade receivables is reviewed on an ongoing basis. Debts which are known to be uncollectable are written off by reducing the carrying amount directly. An allowance account (provision for impairment of trade receivables) is used when there is objective evidence that the consolidated entity will not be able to collect all amounts due according to the original terms of the receivables. Significant financial difficulties of the debtor, probability that the debtor will enter bankruptcy or financial reorganisation, and default or delinquency in payments are considered indicators that the trade receivable is impaired. The amount of the impairment allowance is the difference between the asset’s carrying amount and the present value of estimated future cash flows, discounted at the original effective interest rate. Cash flows relating to short-term receivables are not discounted if the effect of discounting is immaterial.
The amount of the impairment loss is recognised in profit or loss within other expenses. When a trade receivable for which an impairment allowance had been recognised becomes uncollectable in a subsequent period, it is written off against the allowance account. Subsequent recoveries of amounts previously written off are credited against other expenses in profit or loss.
H O M E F I N A N C I A L S
N O T E S T O T H E C O N S O L I D A T E D F I N A N C I A L S T A T E M E N T S
55A W E L I M I T E D A N N U A L R E P O R T 2 0 1 6
(g) InventoryOil inventory is recorded at the lower of cost and net realisable value. Cost is determined on an average basis and includes production costs and amortisation of producing oil and gas assets. Net realisable value is the estimated selling price in the ordinary course of business, less estimated costs of completion and the estimated costs necessary to make the sale.
Other inventories are recorded at the lower of cost and net realisable value. The cost of inventories is based on the first-in first-out principle and includes expenditure incurred in acquiring the inventories and bringing them to their existing location and condition.
(h) Derivative financial instruments
BackgroundDuring the year the Group has entered into forward commodity hedge transactions related to highly probable forecast sales transactions and have designated these derivatives as cash flow hedges. The relationship between the hedging instrument and the hedged item is documented at the inception of the hedging transaction as well as the risk management objective and strategy for undertaking various hedge transactions. The process includes linking the derivative financial instruments designated to specific firm commitments or forecast transactions. In addition the Group assesses hedge effectiveness at inception and at regular intervals to ensure that the derivatives used in hedging transactions have been and will continue to be highly effective in offsetting cash flows of hedged items.
Derivative financial instruments are initially recognised at fair value on the date on which a derivative contract is entered into and are subsequently remeasured to fair value. On subsequent revaluation, the derivatives are carried as assets when their fair value is positive and liabilities when their fair value is negative.
In respect of cash flow hedges, the effective portion of changes in the fair value of derivatives that have been designated and qualify as cash flow hedges have been recognised in Other Comprehensive Income (OCI) in the hedging reserve. The gain or loss relating to the ineffective portion is recognised immediately in profit and loss within other income or other expense.
Amounts accumulated in the hedging reserve in equity are transferred to the profit and loss when the hedged transaction affects profit and loss, such as when the forecast sale occurs. The gain or loss related to the effective portion is recognised within ‘sales’. The gain or loss related to the ineffective portion is recognised immediately in profit and loss within other income or other expense.
Certain derivative instruments which do not qualify for hedge accounting are recognised immediately in profit and loss and are included in other income or other expense.
If the hedging instrument is terminated or is sold, or if its designation as a hedge is revoked or when the hedge no longer meets the criteria for hedge accounting, any cumulative gain or loss previously recognised in OCI is recycled to the profit and loss.
Fair value measurementWhen the fair values of financial assets and financial liabilities recorded in the statement of financial position cannot be measured based on quoted prices in active markets, their fair value is measured using valuation techniques including discounted cash flow models. The inputs to these models are taken from observable markets where possible, but where this is not feasible, a degree of judgement is required in establishing fair values. Judgements include considerations of inputs such as liquidity risk, credit risk and volatility. Changes in assumptions relating to these factors could affect the reported fair value of financial instruments.
(i) Investments and other financial assets
(i) ClassificationThe consolidated entity classifies its financial assets in the following categories: financial assets at fair value through profit or loss, loans and receivables, held-to-maturity investments and available-for-sale financial assets. The classification depends on the purpose for which the investments were acquired. Management determines the classification of its investments at initial recognition and, in the case of assets classified as held-to-maturity, re-evaluates this designation at the end of each reporting period.
Financial assets at fair value through profit or loss
A financial asset is classified as fair value through profit or loss if it is classified as held for trading or is designated as such upon initial recognition. A financial asset is classified in this category if acquired principally for the purpose of selling in the short term. Derivatives are classified as held for trading unless they are designated as hedges. Assets in this category are classified as current assets.
Loans and receivables
Loans and receivables are non-derivative financial assets with fixed or determinable payments that are not quoted in an active market. They are included in current assets, except for those with maturities greater than 12 months which are classified as non-current assets. Loans and receivables are included in trade and other receivables in the statement of financial position.
(ii) Subsequent measurementLoans and receivables and held-to-maturity investments are carried at amortised cost using the effective interest method.
Available-for-sale financial assets and financial assets at fair value through profit or loss are subsequently carried at fair value.
Gains or losses arising from changes in the fair value of the “financial assets at fair value through profit or loss” category are presented in profit or loss within other income or other expenses in the period in which they arise. Dividend income from financial assets at fair value through profit or loss is recognised in profit or loss as part of revenue from continuing operations when the consolidated entity’s right to receive payments is established.
Details on how the fair value of financial instruments is determined are disclosed in note 31.
H O M E F I N A N C I A L S
N O T E S T O T H E C O N S O L I D A T E D F I N A N C I A L S T A T E M E N T S
56 A W E L I M I T E D A N N U A L R E P O R T 2 0 1 6
(iii) ImpairmentThe consolidated entity assesses at the end of each reporting period whether there is objective evidence that a financial asset is impaired. In the case of equity securities classified as available-for-sale, a significant or prolonged decline in the fair value of a security below its cost is considered as an indicator that the securities are impaired. If any such evidence exists for available-for-sale financial assets, the cumulative loss - measured as the difference between the acquisition cost and the current fair value, less any impairment loss on that financial asset previously recognised in the income statement - is reclassified from equity and recognised in the income statement as a reclassification adjustment. Impairment losses recognised in profit or loss on equity instruments classified as available-for-sale are not reversed through the income statement.
If there is evidence of impairment for any of the consolidated entity’s financial assets carried at amortised cost, the loss is measured as the difference between the asset’s carrying amount and the present value of estimated future cash flows, excluding future credit losses that have not been incurred. The cash flows are discounted at an appropriate rate. The loss is recognised in the income statement.
(j) Discontinued operations and held for sale assetsThe Company will classify a segment or operation as discontinued if it has been disposed of and it represents a major line of business or a geographical area or operations.
The Company classifies non-current assets as held for sale if the carrying amounts will be recovered principally through a sale rather than through continuing use. Such assets are measured at the lower of their carrying value and fair value less costs to sell. The criteria for held for sale classification is regarded as met when the sale is highly probable and the asset or disposal group is available for immediate sale and management must be sufficiently committed to the sale such that it will occur within 1 year.
Refer to notes 11 and 12 for further details.
(k) Property, plant and equipment
(i) Oil and gas assetsThe cost of oil and gas producing assets and capitalised expenditure on oil and gas assets under development are accounted for separately and are stated at cost less accumulated depreciation and impairment losses. Costs include expenditure that is directly attributable to the acquisition or construction of the item as well as past exploration and evaluation costs. In addition, costs include:
i. the initial estimate at the time of installation and during the period of use, when relevant, of the costs of dismantling and removing the items and restoring the site on which they are located, and
ii. changes in the measurement of existing liabilities recognised for these costs resulting from changes in the timing or outflow of resources required to settle the obligation or from changes in the discount rate.
When an oil and gas asset commences production, costs carried forward will be amortised on a units of production basis over the life of the economically recoverable reserves. Changes in factors such as estimates of economically recoverable reserves that affect amortisation calculations do not give rise to prior financial period adjustments and are dealt with on a prospective basis.
Expenditure on major maintenance refits or overhauls comprises the cost of replacement assets or parts of assets, inspection costs and overhaul costs. Where an asset or part of an asset that was separately depreciated and is now written off is replaced and it is probable that future economic benefits associated will result, the expenditure is capitalised. Where part of the asset was not separately considered as a component, the replacement value is used to estimate the carrying amount of the replaced assets which is immediately written off. All other maintenance costs are expensed as incurred.
(ii) Land and buildingsLand and Buildings are measured at cost less accumulated depreciation on buildings and impairment losses recognised at the date of acquisition.
(l) Exploration and evaluationExploration and evaluation costs are accumulated in respect of each separate area of interest and are accounted for using the successful efforts method of accounting. An area of interest is usually represented by an individual oil or gas field.
The cost of acquisition of joint venture interests, successful drilling costs and costs incurred in relation to feasibility studies and the technical evaluation of a potential development are carried forward where right to tenure of the area of interest is current and they are expected to be recouped through sale or successful development and exploitation of the area of interest, or where the assessment to determine the existence of economically recoverable reserves for a potential development in an area of interest is not yet complete. Exploration and evaluation assets are reviewed for impairment indicators annually. When an indicator is identified, assessment is performed for each area of interest to which the exploration and evaluation expenditure is attributed. To the extent that capitalised expenditure is not expected to be recovered it is charged to the income statement.
All other exploration and evaluation costs, including pre-licence costs are expensed as incurred.
(m) Capitalised borrowing costsBorrowing costs relating to oil and gas assets under development up to the date of commencement of operations are capitalised as a cost of the development. Where funds are borrowed specifically for qualifying projects the actual borrowing costs incurred are capitalised. Where the projects are funded through general borrowings the borrowing costs are capitalised based on the weighted average borrowing rate. Other borrowing costs are expensed.
H O M E F I N A N C I A L S
N O T E S T O T H E C O N S O L I D A T E D F I N A N C I A L S T A T E M E N T S
57A W E L I M I T E D A N N U A L R E P O R T 2 0 1 6
(n) Trade and other payablesThese amounts represent liabilities for goods and services provided to the consolidated entity prior to the end of the financial year which are unpaid. The amounts are unsecured and are usually paid within 14 days of recognition.
(o) Interest-bearing borrowingsInterest-bearing borrowings are recognised at fair value.
Fees paid on the establishment of loan facilities are treated as a prepayment and are recognised as such to the extent that it is probable that the facility will be drawn down. These fees are recognised as transaction costs relating to the loan and are amortised over the period of the facility.
(p) Employee benefits
(i) Wages, salaries and annual leaveThe provisions for employee entitlements to wages, salaries and annual leave represents the amount which the consolidated entity has a present obligation to pay resulting from employees’ services provided up to the end of each reporting period. The provisions have been calculated at undiscounted amounts based on wage and salary rates that the consolidated entity expects to pay and include related on-costs.
(ii) Long-term service benefitsLong service leave represents the present value of the estimated future cash outflows to be made resulting from an employee’s services provided to the end of each reporting period. The provision is calculated using estimated future increases in wage and salary rates including related on-costs and expected settlement dates based on turnover history and is discounted using the rates attaching to national government securities at balance date which most closely match the terms of maturity of the related liabilities.
(iii) Share-based payment transactionsShare-based compensation benefits are provided to employees via the long-term Employee Share Rights Plan. Information relating to these schemes is set out in the remuneration report as well note 21 of this report.
The fair value of the rights granted is measured using the Black-Scholes Option Pricing model. In valuing the equity settled transactions no account is taken of any performance conditions other than conditions linked to market performance. The fair value of rights granted is recognised as an employee expense with a corresponding increase in equity or to the extent the share rights are expected to be cash settled, with a corresponding increase in liabilities. The Board has discretion regarding the settlement of share rights into either AWE shares or cash.
The total expense is recognised over the vesting period, which is the period over which all of the specified vesting conditions are to be satisfied. At the end of each period, the entity revises its estimates of the number of rights and options that are expected to vest based on the non-market and service related vesting conditions. It recognises the impact of the revision to original estimates, if any, in the income statement, with a corresponding adjustment to equity.
(iv) Superannuation plansObligations for contributions to accumulation type superannuation plans are recognised as an expense in the income statement as incurred.
(q) ProvisionsA provision is recognised in the statement of financial position when the consolidated entity has a present legal or constructive obligation as a result of a past event, and it is probable that an outflow of economic benefits will be required to settle the obligation. If the effect is material, provisions are determined by discounting the expected future cash flows at a pre-tax rate that reflects current market assessments of the time value of money and, where appropriate, the risks specific to the liability.
Site restorationProvisions made for decommissioning, restoration and environmental rehabilitation are recognised where there is a present obligation as a result of exploration, development or production activities having been undertaken, and it is probable that an outflow of economic benefits will be required to settle the obligation. The estimated future obligations include the costs of removing facilities, abandoning wells and restoring the affected areas. The provision for future restoration costs is the best estimate of the present value of the expenditure required to settle the obligation at the end of each reporting period, based on current legal requirements and technology. The ultimate costs are uncertain and cost estimates can vary in response to many factors including changes to relevant legal requirements, the emergence of new techniques or experience at other production sites. Future restoration costs are reviewed annually and any changes are reflected in the present value of the restoration provision at the end of the reporting period. The amount of the provision for future restoration costs relating to exploration and development activities is capitalised as a cost of those activities. If the effect is material, provisions are determined by discounting the expected future cash flows at a pre-tax rate that reflects current market assessments of the time value of money, and where appropriate the risks specific to the liability. The unwinding of discounting on the provision is recognised as a finance cost.
(r) Revenue recognition
(i) Sales revenueRevenue from the sale of oil and gas is recognised in the income statement when the significant risks and rewards of ownership have been transferred to the buyer. Revenue received during the commissioning phase of oil and gas assets is recorded, together with the related costs of production, against the capitalised carrying value of the asset.
Revenues received under take or pay sales contracts in respect of undelivered volumes are accounted for as deferred revenue.
(ii) Other revenuesOther revenues are recognised on an accrual basis and include royalty receipts and equipment rental income.
H O M E F I N A N C I A L S
N O T E S T O T H E C O N S O L I D A T E D F I N A N C I A L S T A T E M E N T S
58 A W E L I M I T E D A N N U A L R E P O R T 2 0 1 6
(s) Leased assetsLeases of property, plant and equipment where the consolidated entity, as lessee, has substantially all the risks and rewards of ownership are classified as finance leases. Finance leases are capitalised at the lease’s inception at the fair value of the leased property or, if lower, the present value of the minimum lease payments. The corresponding rental obligations, net of finance charges, are included in other short-term and long-term payables. Each lease payment is allocated between the liability and finance cost. The finance cost is charged to profit or loss over the lease period so as to produce a constant periodic rate of interest on the remaining balance of the liability for each period. The property, plant and equipment acquired under finance leases is depreciated over the asset's useful life or over the shorter of the asset’s useful life and the lease term if there is no reasonable certainty that the consolidated entity will obtain ownership at the end of the lease term
Leases in which a significant portion of the risks and rewards of ownership are not transferred to the consolidated entity as lessee are classified as operating leases and are not recognised on the consolidated entity’s statement of financial position. Payments made under operating leases (net of any incentives received from the lessor) are charged to profit or loss on a straight-line basis over the period of the lease.
(t) Taxation
(i) Income taxIncome tax on the income statement comprises current and deferred tax. Income tax is recognised in the income statement except to the extent that it relates to items recognised directly in equity, in which case it is recognised in equity.
Current tax is the expected tax payable on the taxable income for the year, using tax rates enacted or substantially enacted at the end of the reporting period, and any adjustment to tax payable in respect of previous years.
Deferred tax is provided using the balance sheet method, providing for temporary differences between the carrying amounts of assets and liabilities for financial reporting purposes and the amounts used for taxation purposes. The following temporary differences are not provided for goodwill not deductible for tax purposes, the initial recognition of assets or liabilities that affect neither accounting nor taxable profit, and differences relating to investments in controlled entities to the extent that they will probably not reverse in the foreseeable future. The amount of deferred tax provided is based on the expected manner of realisation or settlement of the carrying amount of assets and liabilities, using tax rates enacted or substantively enacted at the end of the reporting period.
A deferred tax asset is recognised only to the extent that it is probable that future taxable profits will be available against which the asset can be utilised. Deferred tax assets are reduced to the extent that it is no longer probable that the related tax benefit will be realised.
Additional income taxes that arise from the distribution of dividends are recognised at the same time as the liability to pay the related dividend.
(ii) Petroleum Resource Rent Tax (“PRRT”) and other government royaltiesIn addition to corporate income taxes, the consolidated financial statements also include and disclose certain taxes determined from oil and gas production and levied on net income.
Resource rent taxes and government royalties are treated as taxation arrangements when they are imposed under Government authority and when the calculation of the amount payable falls within the definition of “taxable profit” for the purposes of AASB 112. Current and deferred tax is then provided on the same basis as described in (i) above.
Royalty arrangements that do not meet the criteria for treatment as a tax are recognised on an accruals basis.
The Australian Government enacted legislation to extend the PRRT regime to all onshore oil and gas projects, from 1 July 2012. PRRT is applied to onshore and offshore oil and gas projects at a rate of 40%. State petroleum royalties will continue to apply to projects within state jurisdictions; however these royalties are fully creditable against PRRT liabilities. The extended PRRT applies to AWE’s onshore Perth basin operations.
Disclosures in relation to PRRT for the year ended 30 June 2016 in the consolidated financial statements are in relation to both onshore and offshore oil and gas projects.
(iii) Tax consolidationThe Company and its wholly-owned Australian resident entities have formed a tax consolidated group with effect from 1 July 2003 and are therefore taxed as a single entity from that date. The head entity within the tax-consolidated group is AWE Limited.
Current tax expense/income, deferred tax liabilities and deferred tax assets arising from temporary differences of the members of the tax-consolidated group are recognised in the separate financial statements of the members of the tax-consolidated group using a modified stand-alone tax allocation methodology.
Any current tax liabilities (or assets) and deferred tax assets arising from unused tax losses of the controlled entities are assumed by the head entity in the tax-consolidated group and are recognised as amounts payable (receivable) to (from) other entities in the tax-consolidated group in conjunction with any tax funding arrangements.
The Company recognises deferred tax assets arising from unused tax losses of the tax-consolidated group to the extent that it is probable that future taxable profits of the tax-consolidated group will be available against which the asset can be utilised. Any subsequent period adjustments to deferred tax assets arising from unused tax losses as a result of revised assessments of the probability of recoverability is recognised by the head company only.
(iv) Nature of tax funding and tax sharing arrangementsThe head entity, in conjunction with other members of the tax-consolidated group, has entered into a tax funding arrangement which sets out the funding obligations of members of the tax-consolidated group in respect of tax amounts. The tax funding arrangements require payments to/from the head entity equal to the current tax liability (asset) assumed by the head entity and any tax-loss deferred tax asset assumed by the head entity, resulting in the head entity recognising an inter-entity receivable (payable) equal in amount to the tax liability (asset) assumed. The inter-entity receivable (payable) is at call.
H O M E F I N A N C I A L S
N O T E S T O T H E C O N S O L I D A T E D F I N A N C I A L S T A T E M E N T S
59A W E L I M I T E D A N N U A L R E P O R T 2 0 1 6
(u) Goods and services taxRevenue, expenses and assets are recognised net of the amount of goods and services tax (“GST”), except where the amount of GST incurred is not recoverable from the taxation authority. In these circumstances, the GST is recognised as part of the cost of acquisition of the asset or as part of the expense.
Receivables and payables are stated with the amount of GST included. The net amount of GST recoverable from, or payable to, the Australian Taxation Office (“ATO”) is included as a current asset or liability in the statement of financial position.
Cash flows are included in the statement of cash flows on a gross basis. The GST components of cash flows arising from investing and financing activities which are recoverable from, or payable to, the ATO are classified as operating cash flows.
(v) Segment reportingAn operating segment is a component of the consolidated entity that engages in business activities from which it may earn revenues and incur expenses, including revenues and expenses that relate to transactions with any of the consolidated entity’s other components. An operating segment’s operating results are reviewed regularly by the chief operating decision maker to make decisions about resources to be allocated to the segment and assess its performance, and for which discrete financial information is available.
Segment results that are reported to the chief operating decision maker include items directly attributable to a segment as well as those that can be allocated on a reasonable basis.
Segment assets include both oil and gas assets, exploration assets and other assets, such as cash, receivables and inventory, which are directly attributable to the segment.
Unallocated items comprise mainly head office income and expenses, foreign exchange gains and losses and corporate assets.
(w) Contributed equityOrdinary shares are classified as equity. Incremental costs directly attributable to the issue of new shares, share rights or options are shown in equity as a deduction, net of tax, from the proceeds. Incremental costs directly attributable to the issue of new shares, share rights or options for the acquisition of a business are not included in the cost of the acquisition as part of the purchase consideration.
If the entity reacquires its own equity instruments, for example, as the result of a share buy-back, those instruments are deducted from equity and the associated shares are cancelled. No gain or loss is recognised in profit or loss and the consideration paid including any directly attributable incremental costs (net of income taxes) is recognised directly in equity.
(x) Dividends Provision is made for the amount of any dividend declared, being appropriately authorised and no longer at the discretion of the entity, on or before the end of the reporting period but not distributed at the end of the reporting period.
(y) Earnings per share
(i) Basic earnings per shareBasic earnings per share is calculated by dividing the profit attributable to owners of the Company by the weighted average number of ordinary shares outstanding during the financial year.
(ii) Diluted earnings per shareDiluted earnings per share adjusts the figures used in the determination of basic earnings per share to take into account the weighted average number of additional ordinary shares that would have been outstanding assuming the conversion of all dilutive potential ordinary shares.
H O M E F I N A N C I A L S
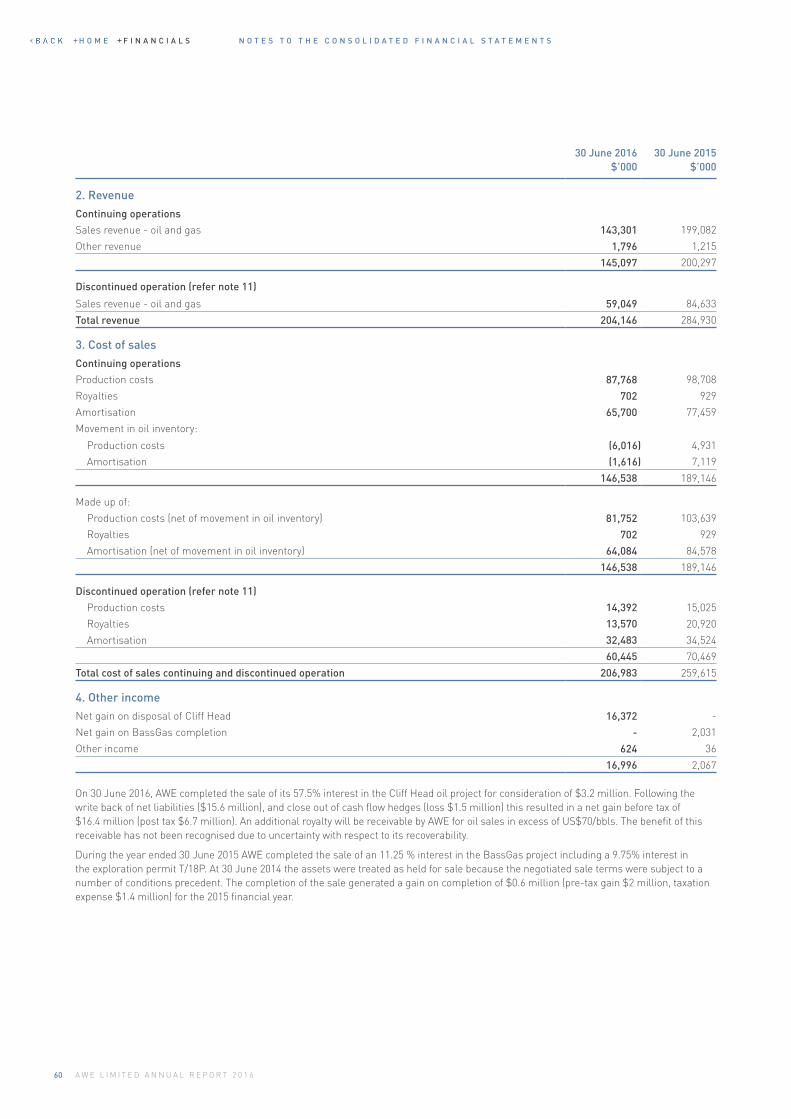
N O T E S T O T H E C O N S O L I D A T E D F I N A N C I A L S T A T E M E N T S
60 A W E L I M I T E D A N N U A L R E P O R T 2 0 1 6
30 June 2016 $’000
30 June 2015 $’000
2. Revenue
Continuing operations
Sales revenue - oil and gas 143,301 199,082
Other revenue 1,796 1,215
145,097 200,297
Discontinued operation (refer note 11)
Sales revenue - oil and gas 59,049 84,633
Total revenue 204,146 284,930
3. Cost of sales
Continuing operations
Production costs 87,768 98,708
Royalties 702 929
Amortisation 65,700 77,459
Movement in oil inventory:
Production costs (6,016) 4,931
Amortisation (1,616) 7,119
146,538 189,146
Made up of:
Production costs (net of movement in oil inventory) 81,752 103,639
Royalties 702 929
Amortisation (net of movement in oil inventory) 64,084 84,578
146,538 189,146
Discontinued operation (refer note 11)
Production costs 14,392 15,025
Royalties 13,570 20,920
Amortisation 32,483 34,524
60,445 70,469
Total cost of sales continuing and discontinued operation 206,983 259,615
4. Other incomeNet gain on disposal of Cliff Head 16,372 -
Net gain on BassGas completion - 2,031
Other income 624 36
16,996 2,067
On 30 June 2016, AWE completed the sale of its 57.5% interest in the Cliff Head oil project for consideration of $3.2 million. Following the write back of net liabilities ($15.6 million), and close out of cash flow hedges (loss $1.5 million) this resulted in a net gain before tax of $16.4 million (post tax $6.7 million). An additional royalty will be receivable by AWE for oil sales in excess of US$70/bbls. The benefit of this receivable has not been recognised due to uncertainty with respect to its recoverability.
During the year ended 30 June 2015 AWE completed the sale of an 11.25 % interest in the BassGas project including a 9.75% interest in the exploration permit T/18P. At 30 June 2014 the assets were treated as held for sale because the negotiated sale terms were subject to a number of conditions precedent. The completion of the sale generated a gain on completion of $0.6 million (pre-tax gain $2 million, taxation expense $1.4 million) for the 2015 financial year.
H O M E F I N A N C I A L S
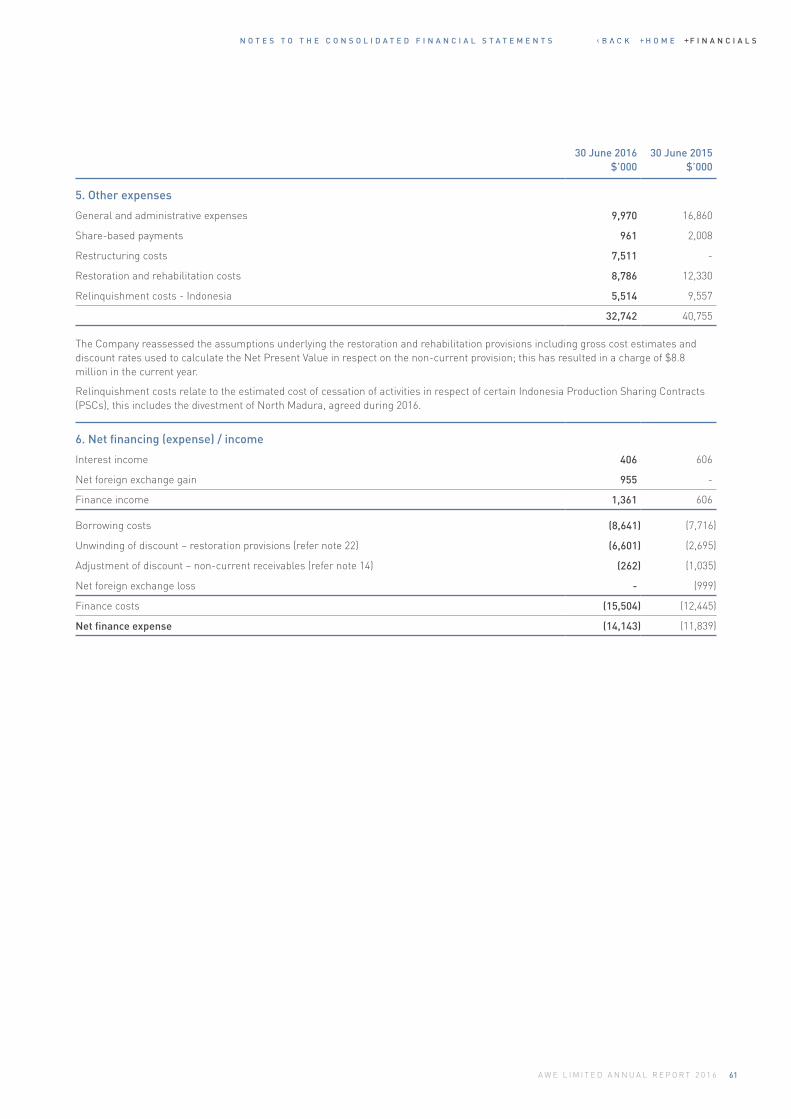
N O T E S T O T H E C O N S O L I D A T E D F I N A N C I A L S T A T E M E N T S
61A W E L I M I T E D A N N U A L R E P O R T 2 0 1 6
30 June 2016 $’000
30 June 2015 $’000
5. Other expenses
General and administrative expenses 9,970 16,860
Share-based payments 961 2,008
Restructuring costs 7,511 -
Restoration and rehabilitation costs 8,786 12,330
Relinquishment costs - Indonesia 5,514 9,557
32,742 40,755
6. Net financing (expense) / income
Interest income 406 606
Net foreign exchange gain 955 -
Finance income 1,361 606
Borrowing costs (8,641) (7,716)
Unwinding of discount – restoration provisions (refer note 22) (6,601) (2,695)
Adjustment of discount – non-current receivables (refer note 14) (262) (1,035)
Net foreign exchange loss - (999)
Finance costs (15,504) (12,445)
Net finance expense (14,143) (11,839)
The Company reassessed the assumptions underlying the restoration and rehabilitation provisions including gross cost estimates and discount rates used to calculate the Net Present Value in respect on the non-current provision; this has resulted in a charge of $8.8 million in the current year.
Relinquishment costs relate to the estimated cost of cessation of activities in respect of certain Indonesia Production Sharing Contracts (PSCs), this includes the divestment of North Madura, agreed during 2016.
H O M E F I N A N C I A L S
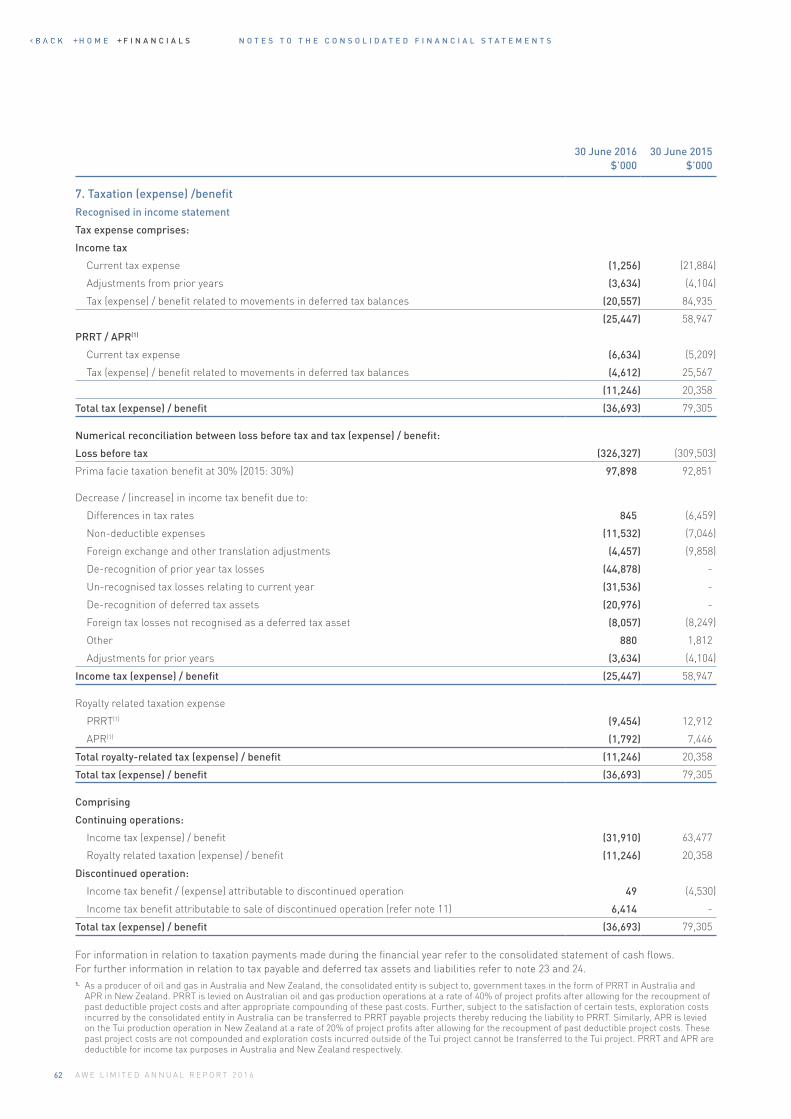
N O T E S T O T H E C O N S O L I D A T E D F I N A N C I A L S T A T E M E N T S
62 A W E L I M I T E D A N N U A L R E P O R T 2 0 1 6
30 June 2016 $’000
30 June 2015 $’000
7. Taxation (expense) /benefitRecognised in income statement
Tax expense comprises:
Income tax
Current tax expense (1,256) (21,884)
Adjustments from prior years (3,634) (4,104)
Tax (expense) / benefit related to movements in deferred tax balances (20,557) 84,935
(25,447) 58,947
PRRT / APR(1)
Current tax expense (6,634) (5,209)
Tax (expense) / benefit related to movements in deferred tax balances (4,612) 25,567
(11,246) 20,358
Total tax (expense) / benefit (36,693) 79,305
Numerical reconciliation between loss before tax and tax (expense) / benefit:
Loss before tax (326,327) (309,503)
Prima facie taxation benefit at 30% (2015: 30%) 97,898 92,851
Decrease / (increase) in income tax benefit due to:
Differences in tax rates 845 (6,459)
Non-deductible expenses (11,532) (7,046)
Foreign exchange and other translation adjustments (4,457) (9,858)
De-recognition of prior year tax losses (44,878) -
Un-recognised tax losses relating to current year (31,536) -
De-recognition of deferred tax assets (20,976) -
Foreign tax losses not recognised as a deferred tax asset (8,057) (8,249)
Other 880 1,812
Adjustments for prior years (3,634) (4,104)
Income tax (expense) / benefit (25,447) 58,947
Royalty related taxation expense
PRRT(1) (9,454) 12,912
APR(1) (1,792) 7,446
Total royalty-related tax (expense) / benefit (11,246) 20,358
Total tax (expense) / benefit (36,693) 79,305
Comprising
Continuing operations:
Income tax (expense) / benefit (31,910) 63,477
Royalty related taxation (expense) / benefit (11,246) 20,358
Discontinued operation:
Income tax benefit / (expense) attributable to discontinued operation 49 (4,530)
Income tax benefit attributable to sale of discontinued operation (refer note 11) 6,414 -
Total tax (expense) / benefit (36,693) 79,305
For information in relation to taxation payments made during the financial year refer to the consolidated statement of cash flows. For further information in relation to tax payable and deferred tax assets and liabilities refer to note 23 and 24.1. As a producer of oil and gas in Australia and New Zealand, the consolidated entity is subject to, government taxes in the form of PRRT in Australia and
APR in New Zealand. PRRT is levied on Australian oil and gas production operations at a rate of 40% of project profits after allowing for the recoupment of past deductible project costs and after appropriate compounding of these past costs. Further, subject to the satisfaction of certain tests, exploration costs incurred by the consolidated entity in Australia can be transferred to PRRT payable projects thereby reducing the liability to PRRT. Similarly, APR is levied on the Tui production operation in New Zealand at a rate of 20% of project profits after allowing for the recoupment of past deductible project costs. These past project costs are not compounded and exploration costs incurred outside of the Tui project cannot be transferred to the Tui project. PRRT and APR are deductible for income tax purposes in Australia and New Zealand respectively.
H O M E F I N A N C I A L S
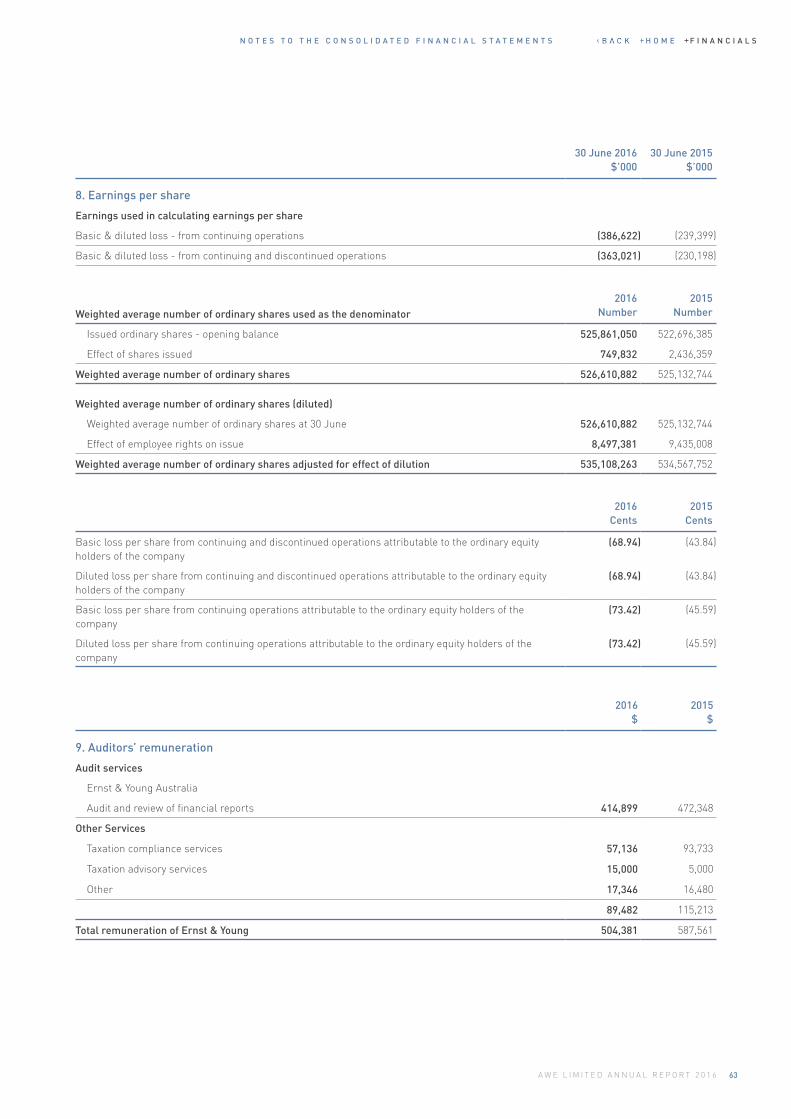
N O T E S T O T H E C O N S O L I D A T E D F I N A N C I A L S T A T E M E N T S
63A W E L I M I T E D A N N U A L R E P O R T 2 0 1 6
30 June 2016 $’000
30 June 2015 $’000
8. Earnings per share
Earnings used in calculating earnings per share
Basic & diluted loss - from continuing operations (386,622) (239,399)
Basic & diluted loss - from continuing and discontinued operations (363,021) (230,198)
Weighted average number of ordinary shares used as the denominator2016
Number2015
Number
Issued ordinary shares - opening balance 525,861,050 522,696,385
Effect of shares issued 749,832 2,436,359
Weighted average number of ordinary shares 526,610,882 525,132,744
Weighted average number of ordinary shares (diluted)
Weighted average number of ordinary shares at 30 June 526,610,882 525,132,744
Effect of employee rights on issue 8,497,381 9,435,008
Weighted average number of ordinary shares adjusted for effect of dilution 535,108,263 534,567,752
2016 Cents
2015 Cents
Basic loss per share from continuing and discontinued operations attributable to the ordinary equity holders of the company
(68.94) (43.84)
Diluted loss per share from continuing and discontinued operations attributable to the ordinary equity holders of the company
(68.94) (43.84)
Basic loss per share from continuing operations attributable to the ordinary equity holders of the company
(73.42) (45.59)
Diluted loss per share from continuing operations attributable to the ordinary equity holders of the company
(73.42) (45.59)
2016 $
2015 $
9. Auditors’ remuneration
Audit services
Ernst & Young Australia
Audit and review of financial reports 414,899 472,348
Other Services
Taxation compliance services 57,136 93,733
Taxation advisory services 15,000 5,000
Other 17,346 16,480
89,482 115,213
Total remuneration of Ernst & Young 504,381 587,561
H O M E F I N A N C I A L S
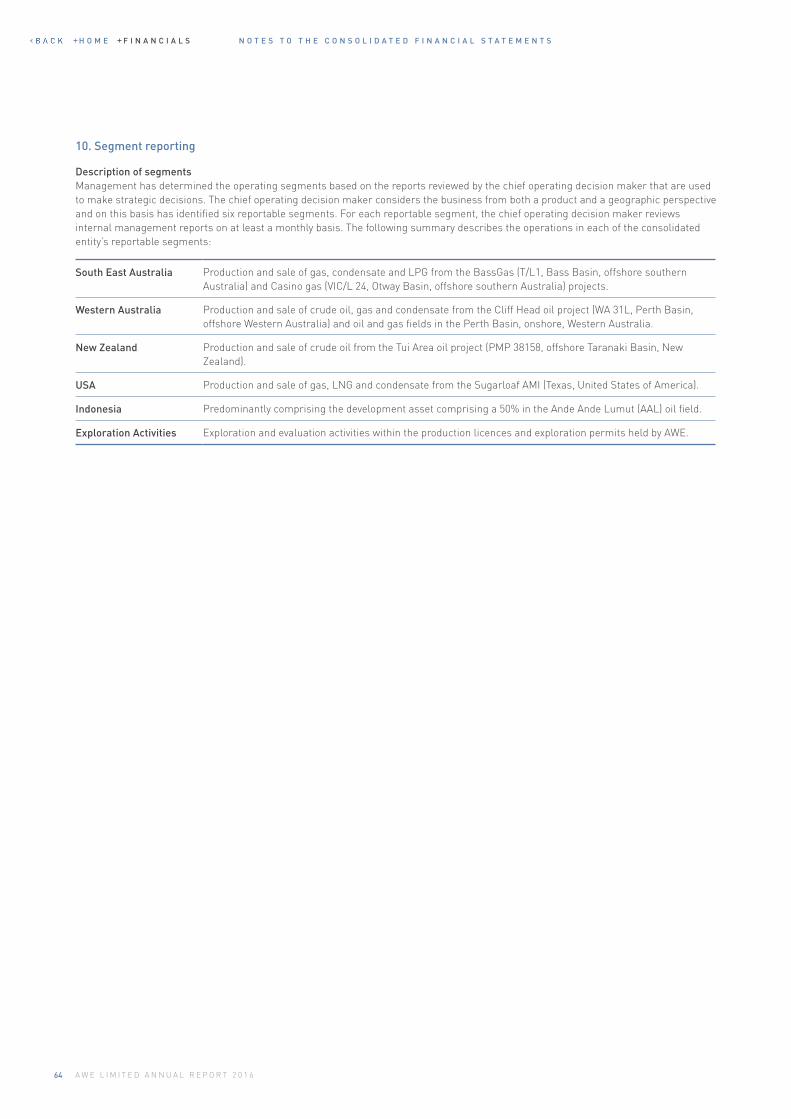
N O T E S T O T H E C O N S O L I D A T E D F I N A N C I A L S T A T E M E N T S
64 A W E L I M I T E D A N N U A L R E P O R T 2 0 1 6
10. Segment reporting
Description of segmentsManagement has determined the operating segments based on the reports reviewed by the chief operating decision maker that are used to make strategic decisions. The chief operating decision maker considers the business from both a product and a geographic perspective and on this basis has identified six reportable segments. For each reportable segment, the chief operating decision maker reviews internal management reports on at least a monthly basis. The following summary describes the operations in each of the consolidated entity’s reportable segments:
South East Australia Production and sale of gas, condensate and LPG from the BassGas (T/L1, Bass Basin, offshore southern Australia) and Casino gas (VIC/L 24, Otway Basin, offshore southern Australia) projects.
Western Australia Production and sale of crude oil, gas and condensate from the Cliff Head oil project (WA 31L, Perth Basin, offshore Western Australia) and oil and gas fields in the Perth Basin, onshore, Western Australia.
New Zealand Production and sale of crude oil from the Tui Area oil project (PMP 38158, offshore Taranaki Basin, New Zealand).
USA Production and sale of gas, LNG and condensate from the Sugarloaf AMI (Texas, United States of America).
Indonesia Predominantly comprising the development asset comprising a 50% in the Ande Ande Lumut (AAL) oil field.
Exploration Activities Exploration and evaluation activities within the production licences and exploration permits held by AWE.
H O M E F I N A N C I A L S
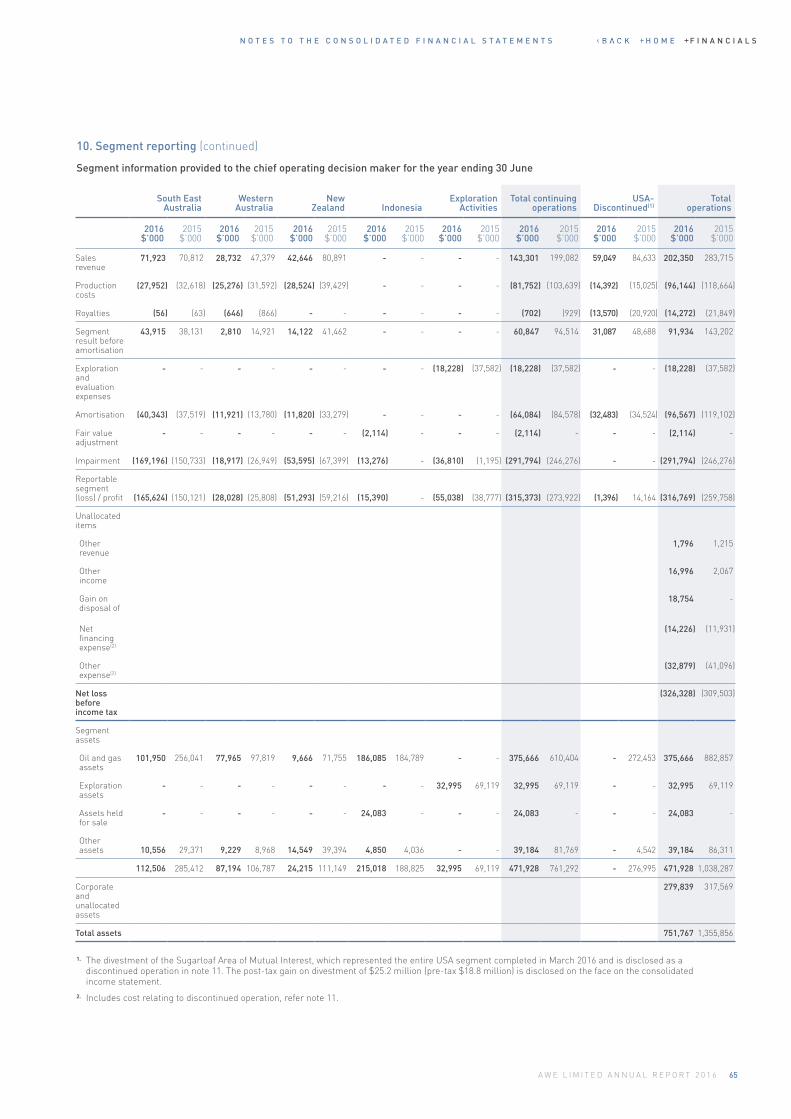
N O T E S T O T H E C O N S O L I D A T E D F I N A N C I A L S T A T E M E N T S
65A W E L I M I T E D A N N U A L R E P O R T 2 0 1 6
South East Australia
Western Australia
New Zealand Indonesia
Exploration Activities
Total continuing operations
USA- Discontinued(1)
Total operations
2016 $’000
2015 $’000
2016 $’000
2015 $’000
2016 $’000
2015 $’000
2016 $’000
2015 $’000
2016 $’000
2015 $’000
2016 $’000
2015 $’000
2016 $’000
2015 $’000
2016 $’000
2015 $’000
Sales revenue
71,923 70,812 28,732 47,379 42,646 80,891 - - - - 143,301 199,082 59,049 84,633 202,350 283,715
Production costs
(27,952) (32,618) (25,276) (31,592) (28,524) (39,429) - - - - (81,752) (103,639) (14,392) (15,025) (96,144) (118,664)
Royalties (56) (63) (646) (866) - - - - - - (702) (929) (13,570) (20,920) (14,272) (21,849)
Segment result before amortisation
43,915 38,131 2,810 14,921 14,122 41,462 - - - - 60,847 94,514 31,087 48,688 91,934 143,202
Exploration and evaluation expenses
- - - - - - - - (18,228) (37,582) (18,228) (37,582) - - (18,228) (37,582)
Amortisation (40,343) (37,519) (11,921) (13,780) (11,820) (33,279) - - - - (64,084) (84,578) (32,483) (34,524) (96,567) (119,102)
Fair value adjustment
- - - - - - (2,114) - - - (2,114) - - - (2,114) -
Impairment (169,196) (150,733) (18,917) (26,949) (53,595) (67,399) (13,276) - (36,810) (1,195) (291,794) (246,276) - - (291,794) (246,276)
Reportable segment (loss) / profit (165,624) (150,121) (28,028) (25,808) (51,293) (59,216) (15,390) - (55,038) (38,777) (315,373) (273,922) (1,396) 14,164 (316,769) (259,758)
Unallocated items
Other revenue
1,796 1,215
Other income
16,996 2,067
Gain on disposal of
18,754 -
Net financing expense(2)
(14,226) (11,931)
Other expense(2)
(32,879) (41,096)
Net loss before income tax
(326,328) (309,503)
Segment assets
Oil and gas assets
101,950 256,041 77,965 97,819 9,666 71,755 186,085 184,789 - - 375,666 610,404 - 272,453 375,666 882,857
Exploration assets
- - - - - - - - 32,995 69,119 32,995 69,119 - - 32,995 69,119
Assets held for sale
- - - - - - 24,083 - - - 24,083 - - - 24,083 -
Other assets 10,556 29,371 9,229 8,968 14,549 39,394 4,850 4,036 - - 39,184 81,769 - 4,542 39,184 86,311
112,506 285,412 87,194 106,787 24,215 111,149 215,018 188,825 32,995 69,119 471,928 761,292 - 276,995 471,928 1,038,287
Corporate and unallocated assets
279,839 317,569
Total assets 751,767 1,355,856
10. Segment reporting (continued)
Segment information provided to the chief operating decision maker for the year ending 30 June
1. The divestment of the Sugarloaf Area of Mutual Interest, which represented the entire USA segment completed in March 2016 and is disclosed as a discontinued operation in note 11. The post-tax gain on divestment of $25.2 million (pre-tax $18.8 million) is disclosed on the face on the consolidated income statement.
2. Includes cost relating to discontinued operation, refer note 11.
H O M E F I N A N C I A L S
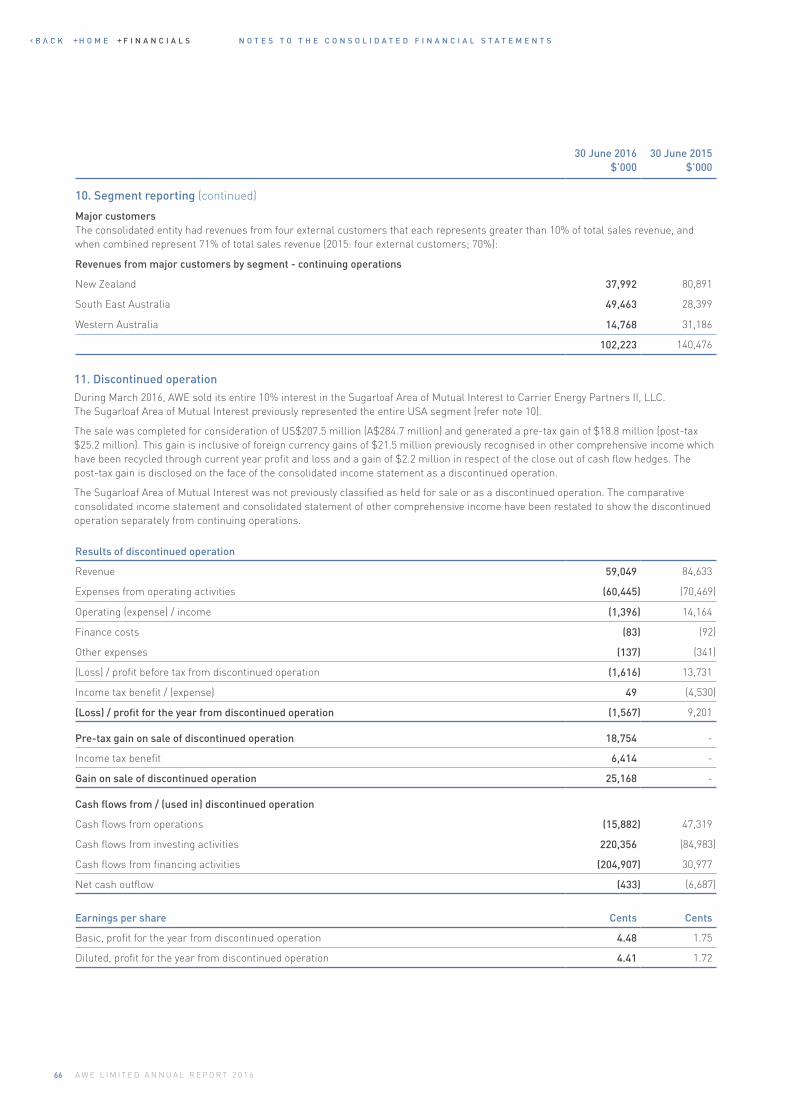
N O T E S T O T H E C O N S O L I D A T E D F I N A N C I A L S T A T E M E N T S
66 A W E L I M I T E D A N N U A L R E P O R T 2 0 1 6
30 June 2016 $’000
30 June 2015 $’000
10. Segment reporting (continued)
Major customersThe consolidated entity had revenues from four external customers that each represents greater than 10% of total sales revenue, and when combined represent 71% of total sales revenue (2015: four external customers; 70%):
Revenues from major customers by segment - continuing operations
New Zealand 37,992 80,891
South East Australia 49,463 28,399
Western Australia 14,768 31,186
102,223 140,476
Results of discontinued operation
Revenue 59,049 84,633
Expenses from operating activities (60,445) (70,469)
Operating (expense) / income (1,396) 14,164
Finance costs (83) (92)
Other expenses (137) (341)
(Loss) / profit before tax from discontinued operation (1,616) 13,731
Income tax benefit / (expense) 49 (4,530)
(Loss) / profit for the year from discontinued operation (1,567) 9,201
Pre-tax gain on sale of discontinued operation 18,754 -
Income tax benefit 6,414 -
Gain on sale of discontinued operation 25,168 -
Cash flows from / (used in) discontinued operation
Cash flows from operations (15,882) 47,319
Cash flows from investing activities 220,356 (84,983)
Cash flows from financing activities (204,907) 30,977
Net cash outflow (433) (6,687)
Earnings per share Cents Cents
Basic, profit for the year from discontinued operation 4.48 1.75
Diluted, profit for the year from discontinued operation 4.41 1.72
11. Discontinued operationDuring March 2016, AWE sold its entire 10% interest in the Sugarloaf Area of Mutual Interest to Carrier Energy Partners II, LLC. The Sugarloaf Area of Mutual Interest previously represented the entire USA segment (refer note 10).
The sale was completed for consideration of US$207.5 million (A$284.7 million) and generated a pre-tax gain of $18.8 million (post-tax $25.2 million). This gain is inclusive of foreign currency gains of $21.5 million previously recognised in other comprehensive income which have been recycled through current year profit and loss and a gain of $2.2 million in respect of the close out of cash flow hedges. The post-tax gain is disclosed on the face of the consolidated income statement as a discontinued operation.
The Sugarloaf Area of Mutual Interest was not previously classified as held for sale or as a discontinued operation. The comparative consolidated income statement and consolidated statement of other comprehensive income have been restated to show the discontinued operation separately from continuing operations.
H O M E F I N A N C I A L S
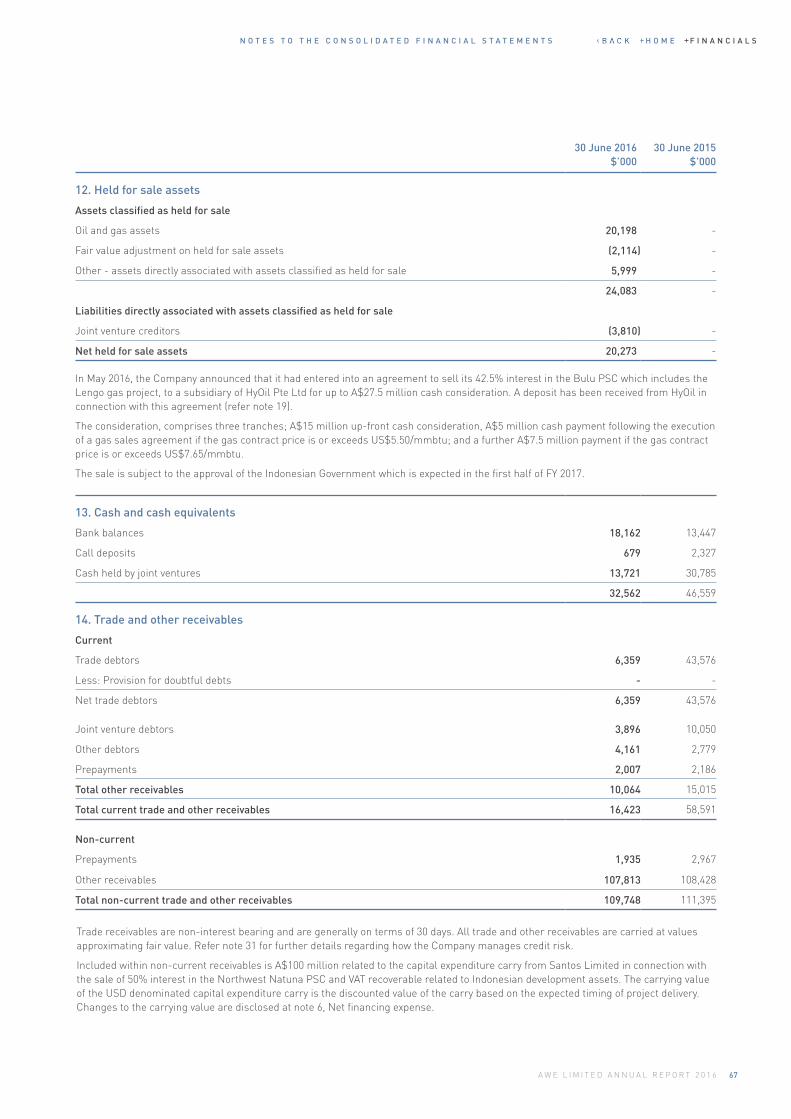
N O T E S T O T H E C O N S O L I D A T E D F I N A N C I A L S T A T E M E N T S
67A W E L I M I T E D A N N U A L R E P O R T 2 0 1 6
30 June 2016 $’000
30 June 2015 $’000
12. Held for sale assets
Assets classified as held for sale
Oil and gas assets 20,198 -
Fair value adjustment on held for sale assets (2,114) -
Other - assets directly associated with assets classified as held for sale 5,999 -
24,083 -
Liabilities directly associated with assets classified as held for sale
Joint venture creditors (3,810) -
Net held for sale assets 20,273 -
13. Cash and cash equivalents
Bank balances 18,162 13,447
Call deposits 679 2,327
Cash held by joint ventures 13,721 30,785
32,562 46,559
14. Trade and other receivables
Current
Trade debtors 6,359 43,576
Less: Provision for doubtful debts - -
Net trade debtors 6,359 43,576
Joint venture debtors 3,896 10,050
Other debtors 4,161 2,779
Prepayments 2,007 2,186
Total other receivables 10,064 15,015
Total current trade and other receivables 16,423 58,591
Non-current
Prepayments 1,935 2,967
Other receivables 107,813 108,428
Total non-current trade and other receivables 109,748 111,395
In May 2016, the Company announced that it had entered into an agreement to sell its 42.5% interest in the Bulu PSC which includes the Lengo gas project, to a subsidiary of HyOil Pte Ltd for up to A$27.5 million cash consideration. A deposit has been received from HyOil in connection with this agreement (refer note 19).
The consideration, comprises three tranches; A$15 million up-front cash consideration, A$5 million cash payment following the execution of a gas sales agreement if the gas contract price is or exceeds US$5.50/mmbtu; and a further A$7.5 million payment if the gas contract price is or exceeds US$7.65/mmbtu.
The sale is subject to the approval of the Indonesian Government which is expected in the first half of FY 2017.
Trade receivables are non-interest bearing and are generally on terms of 30 days. All trade and other receivables are carried at values approximating fair value. Refer note 31 for further details regarding how the Company manages credit risk.
Included within non-current receivables is A$100 million related to the capital expenditure carry from Santos Limited in connection with the sale of 50% interest in the Northwest Natuna PSC and VAT recoverable related to Indonesian development assets. The carrying value of the USD denominated capital expenditure carry is the discounted value of the carry based on the expected timing of project delivery. Changes to the carrying value are disclosed at note 6, Net financing expense.
H O M E F I N A N C I A L S
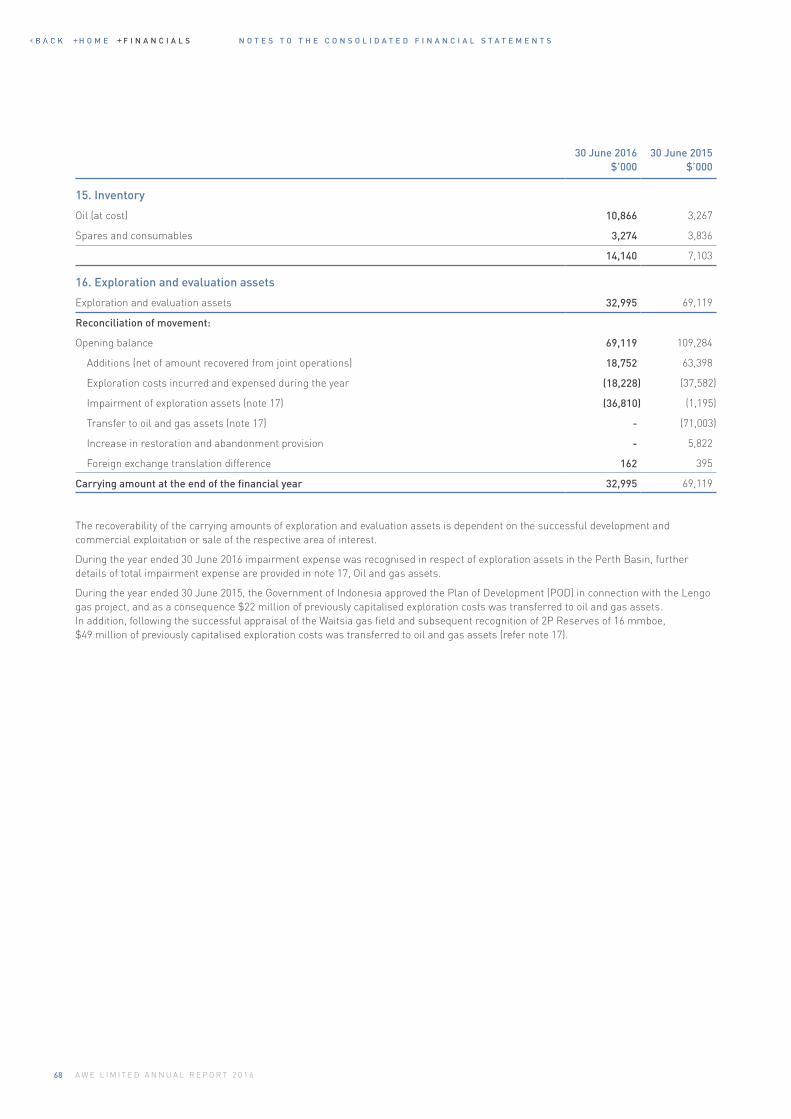
N O T E S T O T H E C O N S O L I D A T E D F I N A N C I A L S T A T E M E N T S
68 A W E L I M I T E D A N N U A L R E P O R T 2 0 1 6
30 June 2016 $’000
30 June 2015 $’000
15. Inventory
Oil (at cost) 10,866 3,267
Spares and consumables 3,274 3,836
14,140 7,103
16. Exploration and evaluation assets
Exploration and evaluation assets 32,995 69,119
Reconciliation of movement:
Opening balance 69,119 109,284
Additions (net of amount recovered from joint operations) 18,752 63,398
Exploration costs incurred and expensed during the year (18,228) (37,582)
Impairment of exploration assets (note 17) (36,810) (1,195)
Transfer to oil and gas assets (note 17) - (71,003)
Increase in restoration and abandonment provision - 5,822
Foreign exchange translation difference 162 395
Carrying amount at the end of the financial year 32,995 69,119
The recoverability of the carrying amounts of exploration and evaluation assets is dependent on the successful development and commercial exploitation or sale of the respective area of interest.
During the year ended 30 June 2016 impairment expense was recognised in respect of exploration assets in the Perth Basin, further details of total impairment expense are provided in note 17, Oil and gas assets.
During the year ended 30 June 2015, the Government of Indonesia approved the Plan of Development (POD) in connection with the Lengo gas project, and as a consequence $22 million of previously capitalised exploration costs was transferred to oil and gas assets. In addition, following the successful appraisal of the Waitsia gas field and subsequent recognition of 2P Reserves of 16 mmboe, $49 million of previously capitalised exploration costs was transferred to oil and gas assets (refer note 17).
H O M E F I N A N C I A L S
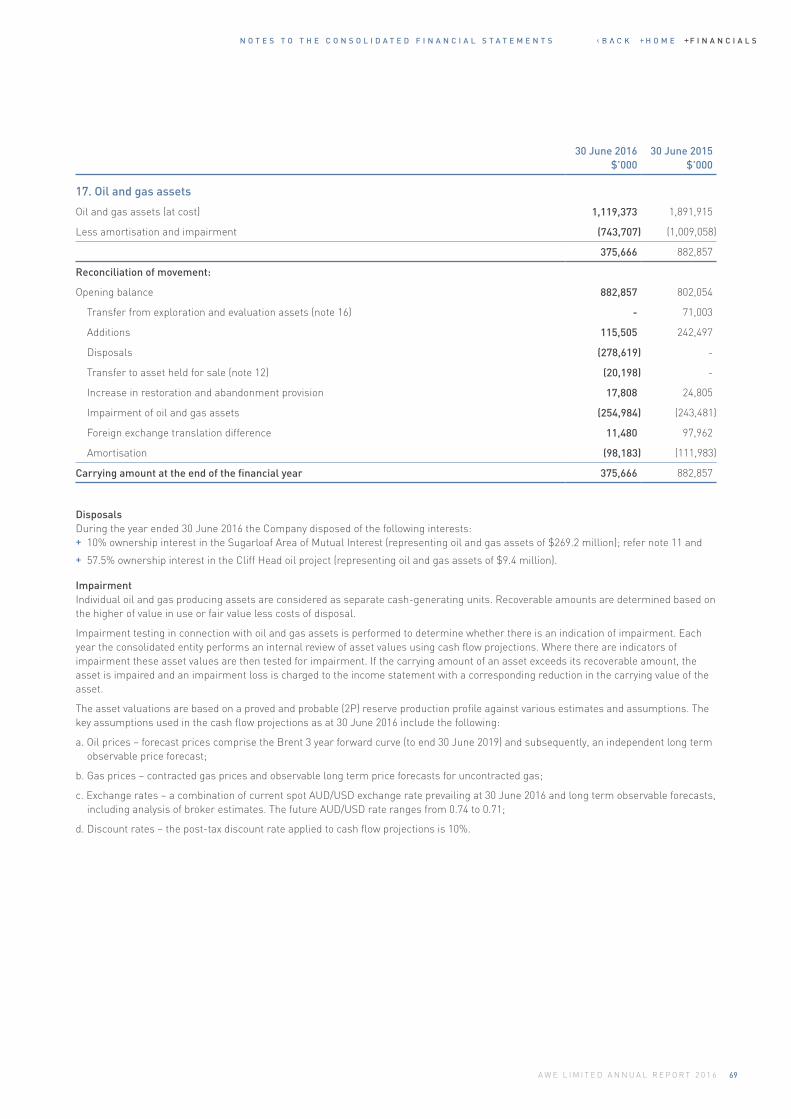
N O T E S T O T H E C O N S O L I D A T E D F I N A N C I A L S T A T E M E N T S
69A W E L I M I T E D A N N U A L R E P O R T 2 0 1 6
30 June 2016 $’000
30 June 2015 $’000
17. Oil and gas assets
Oil and gas assets (at cost) 1,119,373 1,891,915
Less amortisation and impairment (743,707) (1,009,058)
375,666 882,857
Reconciliation of movement:
Opening balance 882,857 802,054
Transfer from exploration and evaluation assets (note 16) - 71,003
Additions 115,505 242,497
Disposals (278,619) -
Transfer to asset held for sale (note 12) (20,198) -
Increase in restoration and abandonment provision 17,808 24,805
Impairment of oil and gas assets (254,984) (243,481)
Foreign exchange translation difference 11,480 97,962
Amortisation (98,183) (111,983)
Carrying amount at the end of the financial year 375,666 882,857
DisposalsDuring the year ended 30 June 2016 the Company disposed of the following interests:
+ 10% ownership interest in the Sugarloaf Area of Mutual Interest (representing oil and gas assets of $269.2 million); refer note 11 and
+ 57.5% ownership interest in the Cliff Head oil project (representing oil and gas assets of $9.4 million).
ImpairmentIndividual oil and gas producing assets are considered as separate cash-generating units. Recoverable amounts are determined based on the higher of value in use or fair value less costs of disposal.
Impairment testing in connection with oil and gas assets is performed to determine whether there is an indication of impairment. Each year the consolidated entity performs an internal review of asset values using cash flow projections. Where there are indicators of impairment these asset values are then tested for impairment. If the carrying amount of an asset exceeds its recoverable amount, the asset is impaired and an impairment loss is charged to the income statement with a corresponding reduction in the carrying value of the asset.
The asset valuations are based on a proved and probable (2P) reserve production profile against various estimates and assumptions. The key assumptions used in the cash flow projections as at 30 June 2016 include the following:
a. Oil prices – forecast prices comprise the Brent 3 year forward curve (to end 30 June 2019) and subsequently, an independent long term observable price forecast;
b. Gas prices – contracted gas prices and observable long term price forecasts for uncontracted gas;
c. Exchange rates – a combination of current spot AUD/USD exchange rate prevailing at 30 June 2016 and long term observable forecasts, including analysis of broker estimates. The future AUD/USD rate ranges from 0.74 to 0.71;
d. Discount rates – the post-tax discount rate applied to cash flow projections is 10%.
H O M E F I N A N C I A L S
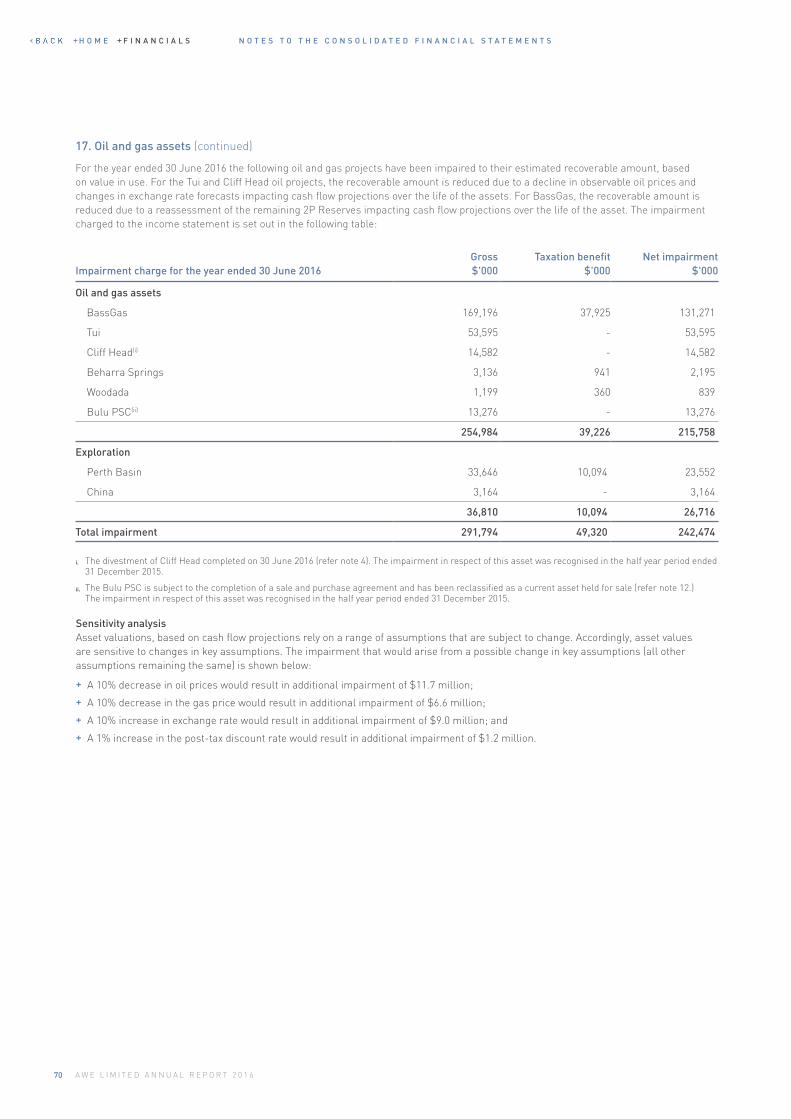
N O T E S T O T H E C O N S O L I D A T E D F I N A N C I A L S T A T E M E N T S
70 A W E L I M I T E D A N N U A L R E P O R T 2 0 1 6
17. Oil and gas assets (continued)
For the year ended 30 June 2016 the following oil and gas projects have been impaired to their estimated recoverable amount, based on value in use. For the Tui and Cliff Head oil projects, the recoverable amount is reduced due to a decline in observable oil prices and changes in exchange rate forecasts impacting cash flow projections over the life of the assets. For BassGas, the recoverable amount is reduced due to a reassessment of the remaining 2P Reserves impacting cash flow projections over the life of the asset. The impairment charged to the income statement is set out in the following table:
Impairment charge for the year ended 30 June 2016Gross $'000
Taxation benefit $'000
Net impairment $'000
Oil and gas assets
BassGas 169,196 37,925 131,271
Tui 53,595 - 53,595
Cliff Head(i) 14,582 - 14,582
Beharra Springs 3,136 941 2,195
Woodada 1,199 360 839
Bulu PSC(ii) 13,276 - 13,276
254,984 39,226 215,758
Exploration
Perth Basin 33,646 10,094 23,552
China 3,164 - 3,164
36,810 10,094 26,716
Total impairment 291,794 49,320 242,474
i. The divestment of Cliff Head completed on 30 June 2016 (refer note 4). The impairment in respect of this asset was recognised in the half year period ended 31 December 2015.
ii. The Bulu PSC is subject to the completion of a sale and purchase agreement and has been reclassified as a current asset held for sale (refer note 12.) The impairment in respect of this asset was recognised in the half year period ended 31 December 2015.
Sensitivity analysisAsset valuations, based on cash flow projections rely on a range of assumptions that are subject to change. Accordingly, asset values are sensitive to changes in key assumptions. The impairment that would arise from a possible change in key assumptions (all other assumptions remaining the same) is shown below:
+ A 10% decrease in oil prices would result in additional impairment of $11.7 million;
+ A 10% decrease in the gas price would result in additional impairment of $6.6 million;
+ A 10% increase in exchange rate would result in additional impairment of $9.0 million; and
+ A 1% increase in the post-tax discount rate would result in additional impairment of $1.2 million.
H O M E F I N A N C I A L S
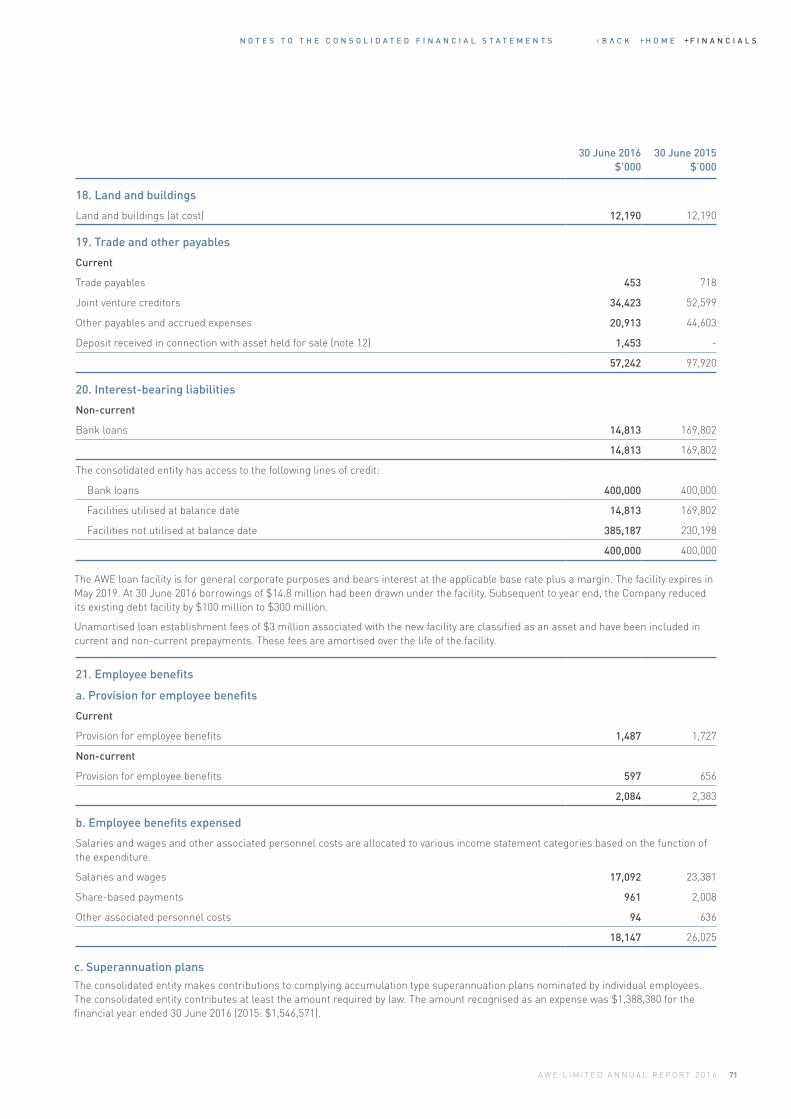
N O T E S T O T H E C O N S O L I D A T E D F I N A N C I A L S T A T E M E N T S
71A W E L I M I T E D A N N U A L R E P O R T 2 0 1 6
30 June 2016 $’000
30 June 2015 $’000
18. Land and buildings
Land and buildings (at cost) 12,190 12,190
19. Trade and other payables
Current
Trade payables 453 718
Joint venture creditors 34,423 52,599
Other payables and accrued expenses 20,913 44,603
Deposit received in connection with asset held for sale (note 12) 1,453 -
57,242 97,920
20. Interest-bearing liabilities
Non-current
Bank loans 14,813 169,802
14,813 169,802
The consolidated entity has access to the following lines of credit:
Bank loans 400,000 400,000
Facilities utilised at balance date 14,813 169,802
Facilities not utilised at balance date 385,187 230,198
400,000 400,000
21. Employee benefits
a. Provision for employee benefits
Current
Provision for employee benefits 1,487 1,727
Non-current
Provision for employee benefits 597 656
2,084 2,383
b. Employee benefits expensed
Salaries and wages and other associated personnel costs are allocated to various income statement categories based on the function of the expenditure.
Salaries and wages 17,092 23,381
Share-based payments 961 2,008
Other associated personnel costs 94 636
18,147 26,025
The AWE loan facility is for general corporate purposes and bears interest at the applicable base rate plus a margin. The facility expires in May 2019. At 30 June 2016 borrowings of $14.8 million had been drawn under the facility. Subsequent to year end, the Company reduced its existing debt facility by $100 million to $300 million.
Unamortised loan establishment fees of $3 million associated with the new facility are classified as an asset and have been included in current and non-current prepayments. These fees are amortised over the life of the facility.
c. Superannuation plansThe consolidated entity makes contributions to complying accumulation type superannuation plans nominated by individual employees. The consolidated entity contributes at least the amount required by law. The amount recognised as an expense was $1,388,380 for the financial year ended 30 June 2016 (2015: $1,546,571).
H O M E F I N A N C I A L S
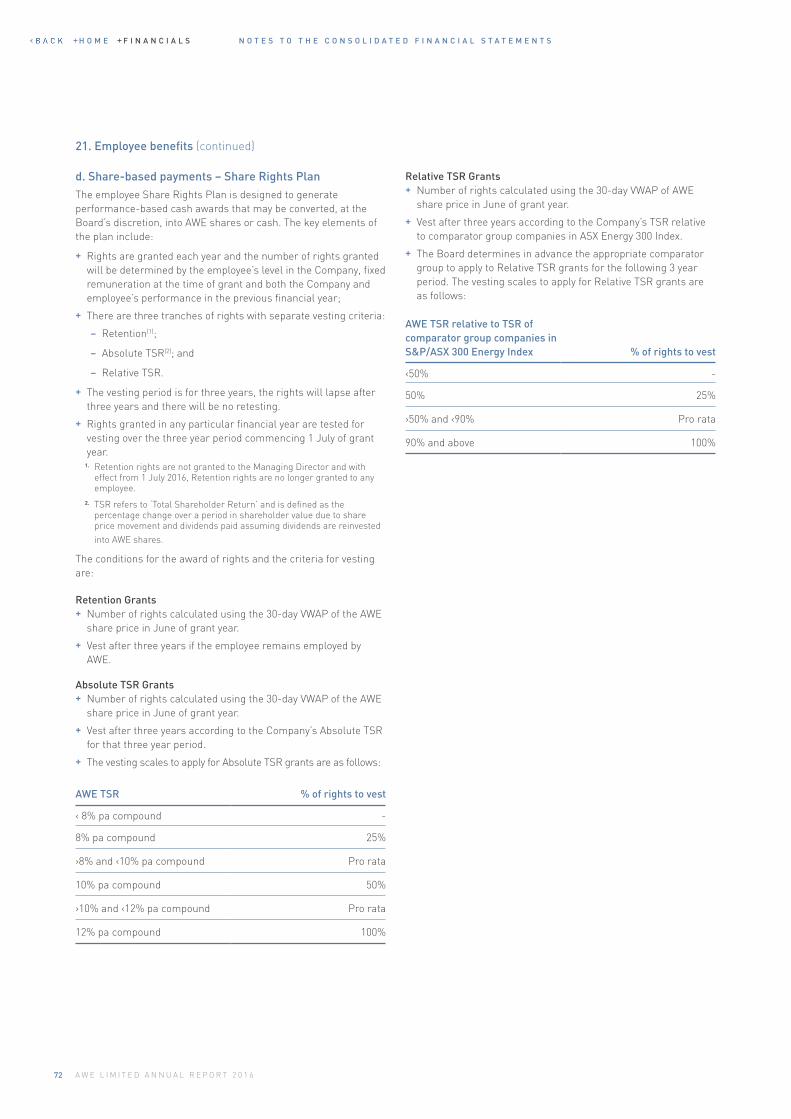
N O T E S T O T H E C O N S O L I D A T E D F I N A N C I A L S T A T E M E N T S
72 A W E L I M I T E D A N N U A L R E P O R T 2 0 1 6
21. Employee benefits (continued)
d. Share-based payments – Share Rights PlanThe employee Share Rights Plan is designed to generate performance-based cash awards that may be converted, at the Board’s discretion, into AWE shares or cash. The key elements of the plan include:
+ Rights are granted each year and the number of rights granted will be determined by the employee’s level in the Company, fixed remuneration at the time of grant and both the Company and employee’s performance in the previous financial year;
+ There are three tranches of rights with separate vesting criteria:
− Retention(1);
− Absolute TSR(2); and
− Relative TSR.
+ The vesting period is for three years, the rights will lapse after three years and there will be no retesting.
+ Rights granted in any particular financial year are tested for vesting over the three year period commencing 1 July of grant year.
1. Retention rights are not granted to the Managing Director and with effect from 1 July 2016, Retention rights are no longer granted to any employee.
2. TSR refers to ‘Total Shareholder Return’ and is defined as the percentage change over a period in shareholder value due to share price movement and dividends paid assuming dividends are reinvested into AWE shares.
The conditions for the award of rights and the criteria for vesting are:
Retention Grants + Number of rights calculated using the 30-day VWAP of the AWE
share price in June of grant year.
+ Vest after three years if the employee remains employed by AWE.
Absolute TSR Grants + Number of rights calculated using the 30-day VWAP of the AWE
share price in June of grant year.
+ Vest after three years according to the Company’s Absolute TSR for that three year period.
+ The vesting scales to apply for Absolute TSR grants are as follows:
AWE TSR % of rights to vest
‹ 8% pa compound -
8% pa compound 25%
›8% and ‹10% pa compound Pro rata
10% pa compound 50%
›10% and ‹12% pa compound Pro rata
12% pa compound 100%
AWE TSR relative to TSR of comparator group companies in S&P/ASX 300 Energy Index % of rights to vest
‹50% -
50% 25%
›50% and ‹90% Pro rata
90% and above 100%
Relative TSR Grants + Number of rights calculated using the 30-day VWAP of AWE
share price in June of grant year.
+ Vest after three years according to the Company’s TSR relative to comparator group companies in ASX Energy 300 Index.
+ The Board determines in advance the appropriate comparator group to apply to Relative TSR grants for the following 3 year period. The vesting scales to apply for Relative TSR grants are as follows:
H O M E F I N A N C I A L S
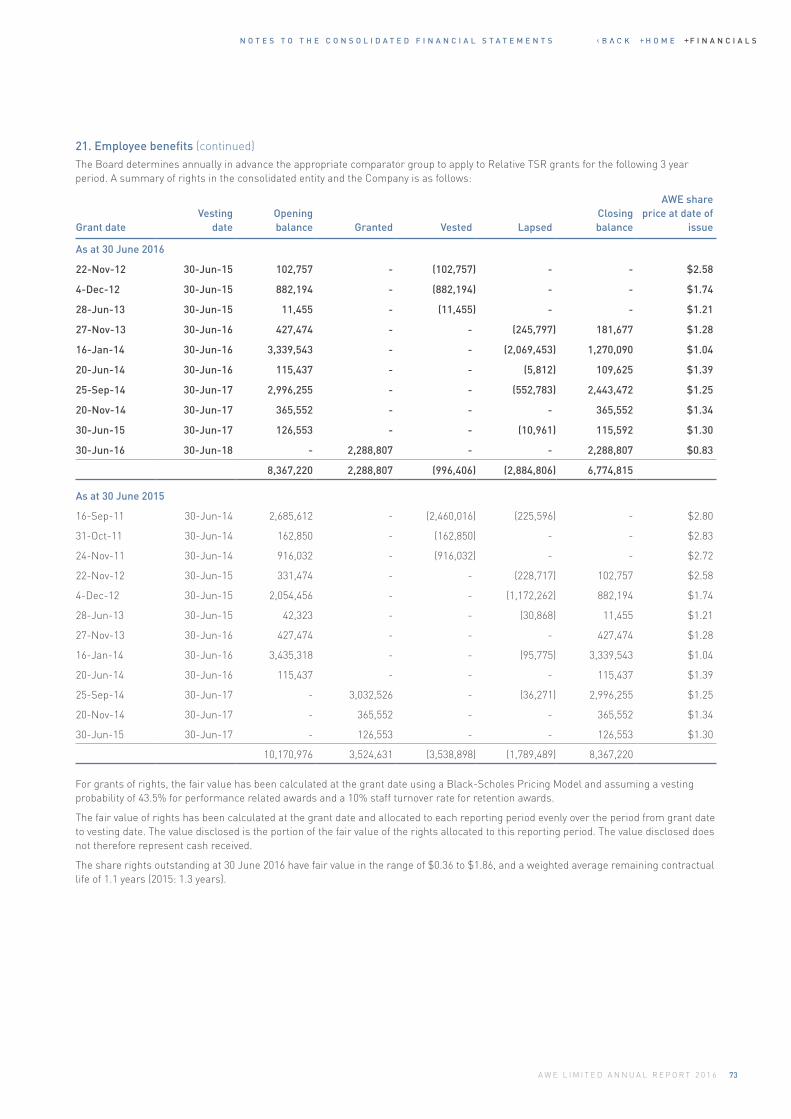
N O T E S T O T H E C O N S O L I D A T E D F I N A N C I A L S T A T E M E N T S
73A W E L I M I T E D A N N U A L R E P O R T 2 0 1 6
21. Employee benefits (continued)The Board determines annually in advance the appropriate comparator group to apply to Relative TSR grants for the following 3 year period. A summary of rights in the consolidated entity and the Company is as follows:
Grant dateVesting
dateOpening balance Granted Vested Lapsed
Closing balance
AWE share price at date of
issue
As at 30 June 2016
22-Nov-12 30-Jun-15 102,757 - (102,757) - - $2.58
4-Dec-12 30-Jun-15 882,194 - (882,194) - - $1.74
28-Jun-13 30-Jun-15 11,455 - (11,455) - - $1.21
27-Nov-13 30-Jun-16 427,474 - - (245,797) 181,677 $1.28
16-Jan-14 30-Jun-16 3,339,543 - - (2,069,453) 1,270,090 $1.04
20-Jun-14 30-Jun-16 115,437 - - (5,812) 109,625 $1.39
25-Sep-14 30-Jun-17 2,996,255 - - (552,783) 2,443,472 $1.25
20-Nov-14 30-Jun-17 365,552 - - - 365,552 $1.34
30-Jun-15 30-Jun-17 126,553 - - (10,961) 115,592 $1.30
30-Jun-16 30-Jun-18 - 2,288,807 - - 2,288,807 $0.83
8,367,220 2,288,807 (996,406) (2,884,806) 6,774,815
As at 30 June 2015
16-Sep-11 30-Jun-14 2,685,612 - (2,460,016) (225,596) - $2.80
31-Oct-11 30-Jun-14 162,850 - (162,850) - - $2.83
24-Nov-11 30-Jun-14 916,032 - (916,032) - - $2.72
22-Nov-12 30-Jun-15 331,474 - - (228,717) 102,757 $2.58
4-Dec-12 30-Jun-15 2,054,456 - - (1,172,262) 882,194 $1.74
28-Jun-13 30-Jun-15 42,323 - - (30,868) 11,455 $1.21
27-Nov-13 30-Jun-16 427,474 - - - 427,474 $1.28
16-Jan-14 30-Jun-16 3,435,318 - - (95,775) 3,339,543 $1.04
20-Jun-14 30-Jun-16 115,437 - - - 115,437 $1.39
25-Sep-14 30-Jun-17 - 3,032,526 - (36,271) 2,996,255 $1.25
20-Nov-14 30-Jun-17 - 365,552 - - 365,552 $1.34
30-Jun-15 30-Jun-17 - 126,553 - - 126,553 $1.30
10,170,976 3,524,631 (3,538,898) (1,789,489) 8,367,220
For grants of rights, the fair value has been calculated at the grant date using a Black-Scholes Pricing Model and assuming a vesting probability of 43.5% for performance related awards and a 10% staff turnover rate for retention awards.
The fair value of rights has been calculated at the grant date and allocated to each reporting period evenly over the period from grant date to vesting date. The value disclosed is the portion of the fair value of the rights allocated to this reporting period. The value disclosed does not therefore represent cash received.
The share rights outstanding at 30 June 2016 have fair value in the range of $0.36 to $1.86, and a weighted average remaining contractual life of 1.1 years (2015: 1.3 years).
H O M E F I N A N C I A L S
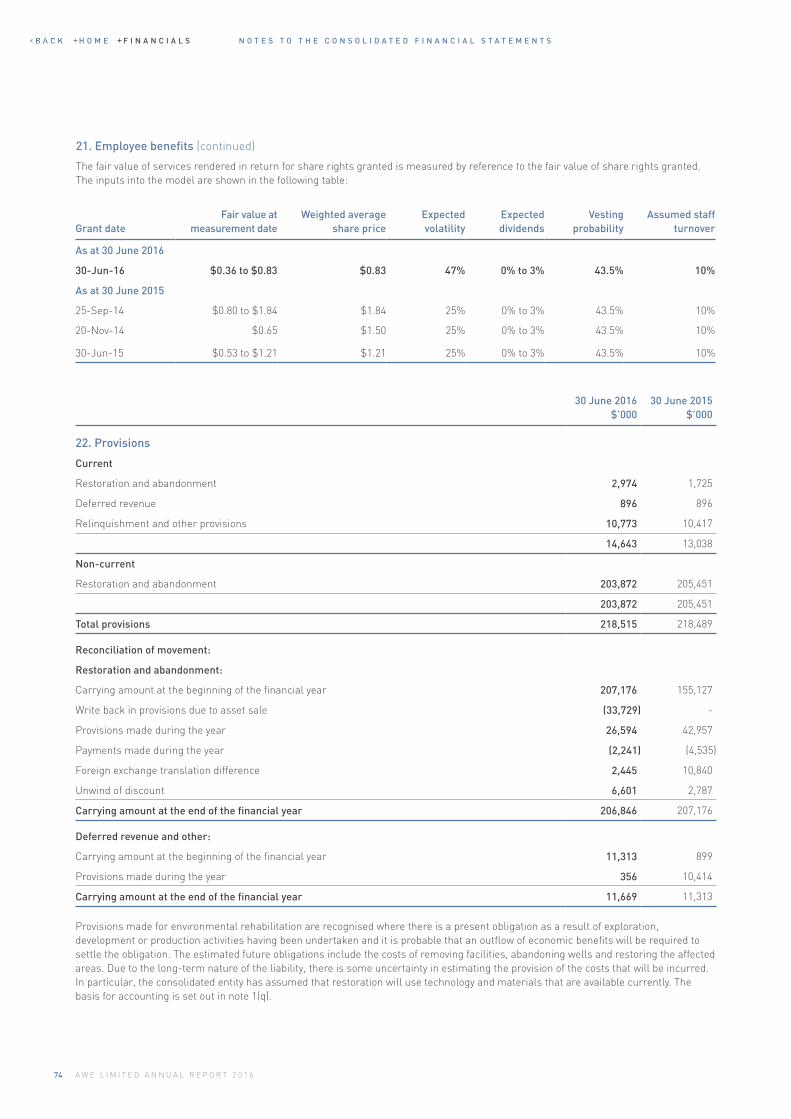
N O T E S T O T H E C O N S O L I D A T E D F I N A N C I A L S T A T E M E N T S
74 A W E L I M I T E D A N N U A L R E P O R T 2 0 1 6
21. Employee benefits (continued)
The fair value of services rendered in return for share rights granted is measured by reference to the fair value of share rights granted. The inputs into the model are shown in the following table:
Grant dateFair value at
measurement dateWeighted average
share priceExpected volatility
Expected dividends
Vesting probability
Assumed staff turnover
As at 30 June 2016
30-Jun-16 $0.36 to $0.83 $0.83 47% 0% to 3% 43.5% 10%
As at 30 June 2015
25-Sep-14 $0.80 to $1.84 $1.84 25% 0% to 3% 43.5% 10%
20-Nov-14 $0.65 $1.50 25% 0% to 3% 43.5% 10%
30-Jun-15 $0.53 to $1.21 $1.21 25% 0% to 3% 43.5% 10%
30 June 2016 $’000
30 June 2015 $’000
22. Provisions
Current
Restoration and abandonment 2,974 1,725
Deferred revenue 896 896
Relinquishment and other provisions 10,773 10,417
14,643 13,038
Non-current
Restoration and abandonment 203,872 205,451
203,872 205,451
Total provisions 218,515 218,489
Reconciliation of movement:
Restoration and abandonment:
Carrying amount at the beginning of the financial year 207,176 155,127
Write back in provisions due to asset sale (33,729) -
Provisions made during the year 26,594 42,957
Payments made during the year (2,241) (4,535)
Foreign exchange translation difference 2,445 10,840
Unwind of discount 6,601 2,787
Carrying amount at the end of the financial year 206,846 207,176
Deferred revenue and other:
Carrying amount at the beginning of the financial year 11,313 899
Provisions made during the year 356 10,414
Carrying amount at the end of the financial year 11,669 11,313
Provisions made for environmental rehabilitation are recognised where there is a present obligation as a result of exploration, development or production activities having been undertaken and it is probable that an outflow of economic benefits will be required to settle the obligation. The estimated future obligations include the costs of removing facilities, abandoning wells and restoring the affected areas. Due to the long-term nature of the liability, there is some uncertainty in estimating the provision of the costs that will be incurred. In particular, the consolidated entity has assumed that restoration will use technology and materials that are available currently. The basis for accounting is set out in note 1(q).
H O M E F I N A N C I A L S
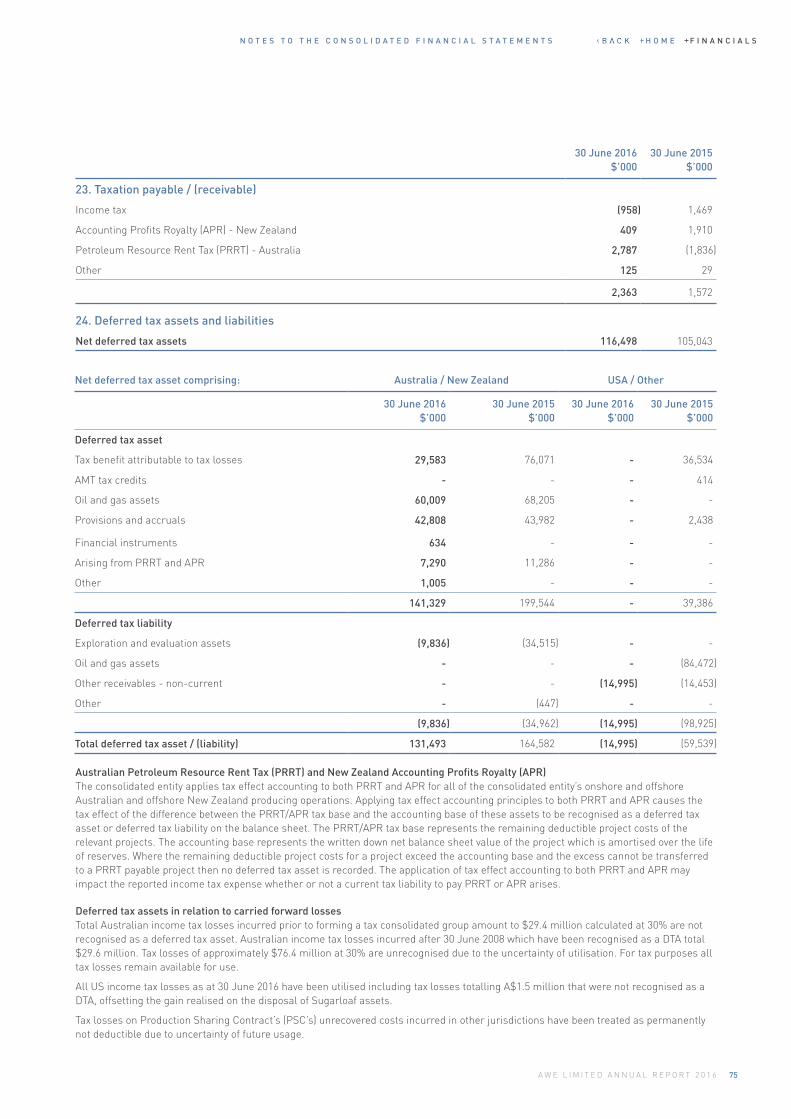
N O T E S T O T H E C O N S O L I D A T E D F I N A N C I A L S T A T E M E N T S
75A W E L I M I T E D A N N U A L R E P O R T 2 0 1 6
Net deferred tax asset comprising: Australia / New Zealand USA / Other
30 June 2016 $’000
30 June 2015 $’000
30 June 2016 $’000
30 June 2015 $’000
Deferred tax asset
Tax benefit attributable to tax losses 29,583 76,071 - 36,534
AMT tax credits - - - 414
Oil and gas assets 60,009 68,205 - -
Provisions and accruals 42,808 43,982 - 2,438
Financial instruments 634 - - -
Arising from PRRT and APR 7,290 11,286 - -
Other 1,005 - - -
141,329 199,544 - 39,386
Deferred tax liability
Exploration and evaluation assets (9,836) (34,515) - -
Oil and gas assets - - - (84,472)
Other receivables - non-current - - (14,995) (14,453)
Other - (447) - -
(9,836) (34,962) (14,995) (98,925)
Total deferred tax asset / (liability) 131,493 164,582 (14,995) (59,539)
30 June 2016 $’000
30 June 2015 $’000
23. Taxation payable / (receivable)
Income tax (958) 1,469
Accounting Profits Royalty (APR) - New Zealand 409 1,910
Petroleum Resource Rent Tax (PRRT) - Australia 2,787 (1,836)
Other 125 29
2,363 1,572
24. Deferred tax assets and liabilities
Net deferred tax assets 116,498 105,043
Australian Petroleum Resource Rent Tax (PRRT) and New Zealand Accounting Profits Royalty (APR)The consolidated entity applies tax effect accounting to both PRRT and APR for all of the consolidated entity’s onshore and offshore Australian and offshore New Zealand producing operations. Applying tax effect accounting principles to both PRRT and APR causes the tax effect of the difference between the PRRT/APR tax base and the accounting base of these assets to be recognised as a deferred tax asset or deferred tax liability on the balance sheet. The PRRT/APR tax base represents the remaining deductible project costs of the relevant projects. The accounting base represents the written down net balance sheet value of the project which is amortised over the life of reserves. Where the remaining deductible project costs for a project exceed the accounting base and the excess cannot be transferred to a PRRT payable project then no deferred tax asset is recorded. The application of tax effect accounting to both PRRT and APR may impact the reported income tax expense whether or not a current tax liability to pay PRRT or APR arises.
Deferred tax assets in relation to carried forward lossesTotal Australian income tax losses incurred prior to forming a tax consolidated group amount to $29.4 million calculated at 30% are not recognised as a deferred tax asset. Australian income tax losses incurred after 30 June 2008 which have been recognised as a DTA total $29.6 million. Tax losses of approximately $76.4 million at 30% are unrecognised due to the uncertainty of utilisation. For tax purposes all tax losses remain available for use.
All US income tax losses as at 30 June 2016 have been utilised including tax losses totalling A$1.5 million that were not recognised as a DTA, offsetting the gain realised on the disposal of Sugarloaf assets.
Tax losses on Production Sharing Contract’s (PSC’s) unrecovered costs incurred in other jurisdictions have been treated as permanently not deductible due to uncertainty of future usage.
H O M E F I N A N C I A L S
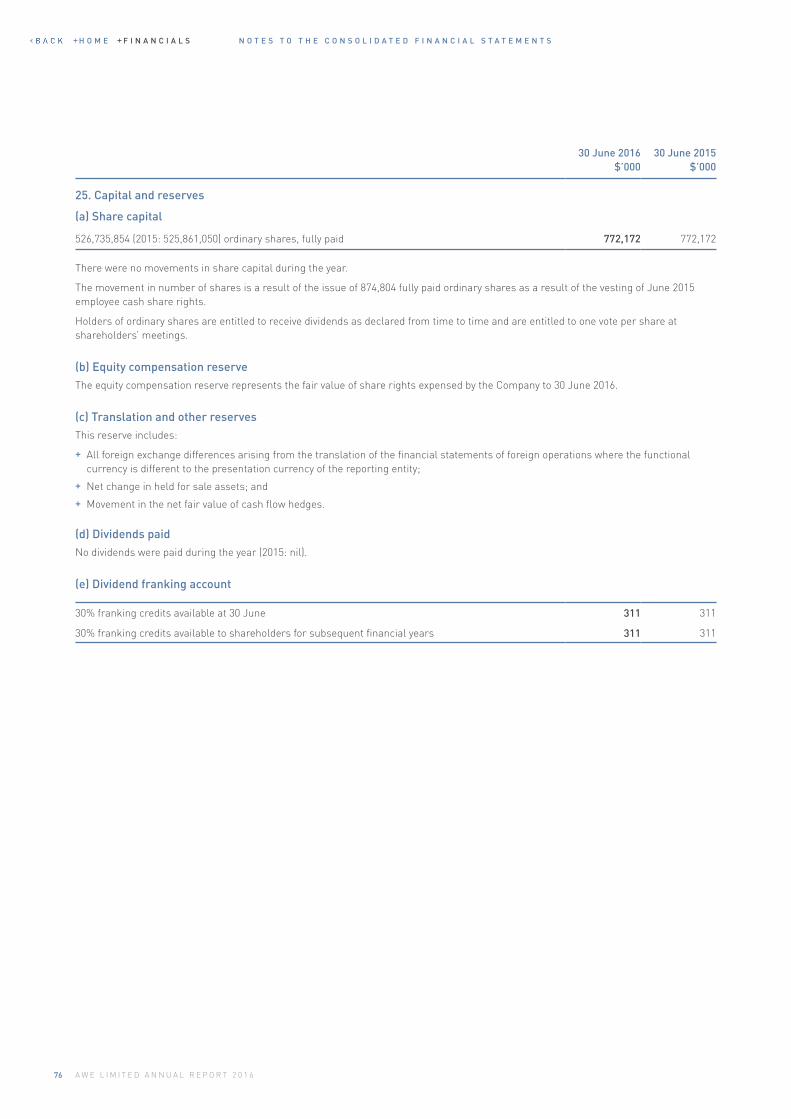
N O T E S T O T H E C O N S O L I D A T E D F I N A N C I A L S T A T E M E N T S
76 A W E L I M I T E D A N N U A L R E P O R T 2 0 1 6
30 June 2016 $’000
30 June 2015 $’000
25. Capital and reserves
(a) Share capital
526,735,854 (2015: 525,861,050) ordinary shares, fully paid 772,172 772,172
30% franking credits available at 30 June 311 311
30% franking credits available to shareholders for subsequent financial years 311 311
There were no movements in share capital during the year.
The movement in number of shares is a result of the issue of 874,804 fully paid ordinary shares as a result of the vesting of June 2015 employee cash share rights.
Holders of ordinary shares are entitled to receive dividends as declared from time to time and are entitled to one vote per share at shareholders’ meetings.
(b) Equity compensation reserveThe equity compensation reserve represents the fair value of share rights expensed by the Company to 30 June 2016.
(c) Translation and other reservesThis reserve includes:
+ All foreign exchange differences arising from the translation of the financial statements of foreign operations where the functional currency is different to the presentation currency of the reporting entity;
+ Net change in held for sale assets; and
+ Movement in the net fair value of cash flow hedges.
(d) Dividends paidNo dividends were paid during the year (2015: nil).
(e) Dividend franking account
H O M E F I N A N C I A L S
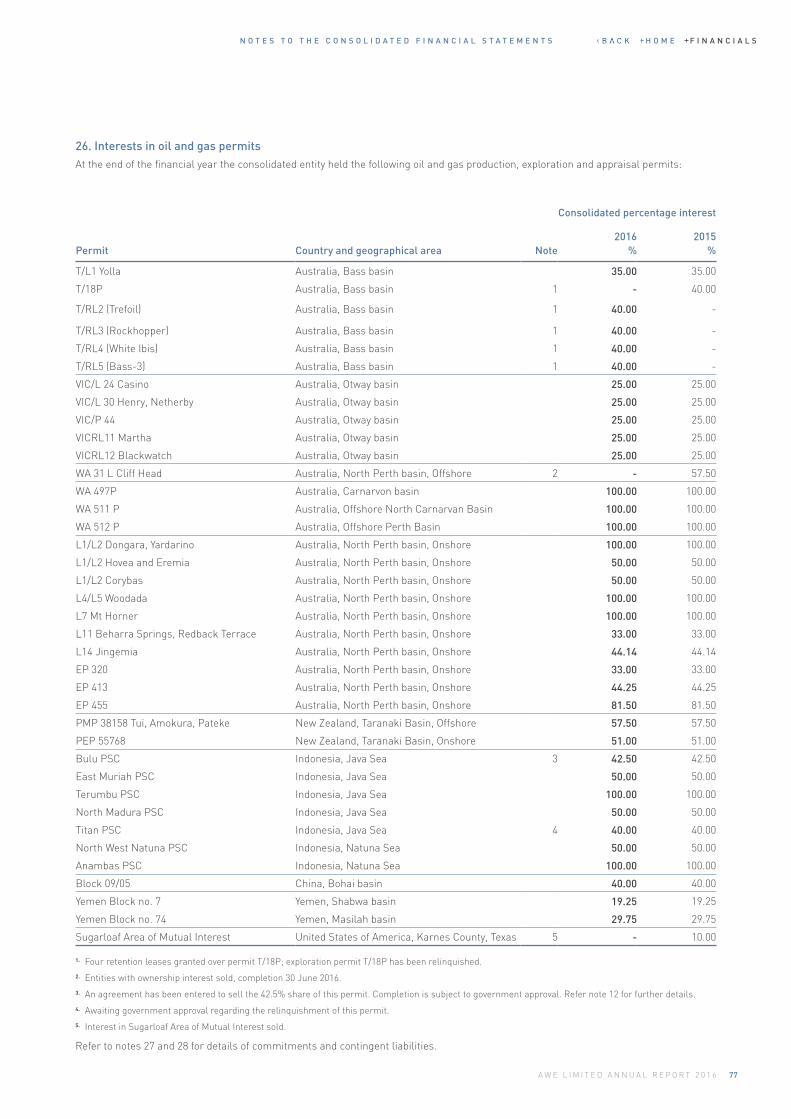
N O T E S T O T H E C O N S O L I D A T E D F I N A N C I A L S T A T E M E N T S
77A W E L I M I T E D A N N U A L R E P O R T 2 0 1 6
Consolidated percentage interest
Permit Country and geographical area Note2016
%2015
%
T/L1 Yolla Australia, Bass basin 35.00 35.00
T/18P Australia, Bass basin 1 - 40.00
T/RL2 (Trefoil) Australia, Bass basin 1 40.00 -
T/RL3 (Rockhopper) Australia, Bass basin 1 40.00 -
T/RL4 (White Ibis) Australia, Bass basin 1 40.00 -
T/RL5 (Bass-3) Australia, Bass basin 1 40.00 -
VIC/L 24 Casino Australia, Otway basin 25.00 25.00
VIC/L 30 Henry, Netherby Australia, Otway basin 25.00 25.00
VIC/P 44 Australia, Otway basin 25.00 25.00
VICRL11 Martha Australia, Otway basin 25.00 25.00
VICRL12 Blackwatch Australia, Otway basin 25.00 25.00
WA 31 L Cliff Head Australia, North Perth basin, Offshore 2 - 57.50
WA 497P Australia, Carnarvon basin 100.00 100.00
WA 511 P Australia, Offshore North Carnarvan Basin 100.00 100.00
WA 512 P Australia, Offshore Perth Basin 100.00 100.00
L1/L2 Dongara, Yardarino Australia, North Perth basin, Onshore 100.00 100.00
L1/L2 Hovea and Eremia Australia, North Perth basin, Onshore 50.00 50.00
L1/L2 Corybas Australia, North Perth basin, Onshore 50.00 50.00
L4/L5 Woodada Australia, North Perth basin, Onshore 100.00 100.00
L7 Mt Horner Australia, North Perth basin, Onshore 100.00 100.00
L11 Beharra Springs, Redback Terrace Australia, North Perth basin, Onshore 33.00 33.00
L14 Jingemia Australia, North Perth basin, Onshore 44.14 44.14
EP 320 Australia, North Perth basin, Onshore 33.00 33.00
EP 413 Australia, North Perth basin, Onshore 44.25 44.25
EP 455 Australia, North Perth basin, Onshore 81.50 81.50
PMP 38158 Tui, Amokura, Pateke New Zealand, Taranaki Basin, Offshore 57.50 57.50
PEP 55768 New Zealand, Taranaki Basin, Onshore 51.00 51.00
Bulu PSC Indonesia, Java Sea 3 42.50 42.50
East Muriah PSC Indonesia, Java Sea 50.00 50.00
Terumbu PSC Indonesia, Java Sea 100.00 100.00
North Madura PSC Indonesia, Java Sea 50.00 50.00
Titan PSC Indonesia, Java Sea 4 40.00 40.00
North West Natuna PSC Indonesia, Natuna Sea 50.00 50.00
Anambas PSC Indonesia, Natuna Sea 100.00 100.00
Block 09/05 China, Bohai basin 40.00 40.00
Yemen Block no. 7 Yemen, Shabwa basin 19.25 19.25
Yemen Block no. 74 Yemen, Masilah basin 29.75 29.75
Sugarloaf Area of Mutual Interest United States of America, Karnes County, Texas 5 - 10.00
26. Interests in oil and gas permitsAt the end of the financial year the consolidated entity held the following oil and gas production, exploration and appraisal permits:
1. Four retention leases granted over permit T/18P; exploration permit T/18P has been relinquished.2. Entities with ownership interest sold, completion 30 June 2016. 3. An agreement has been entered to sell the 42.5% share of this permit. Completion is subject to government approval. Refer note 12 for further details. 4. Awaiting government approval regarding the relinquishment of this permit. 5. Interest in Sugarloaf Area of Mutual Interest sold.
Refer to notes 27 and 28 for details of commitments and contingent liabilities.
H O M E F I N A N C I A L S
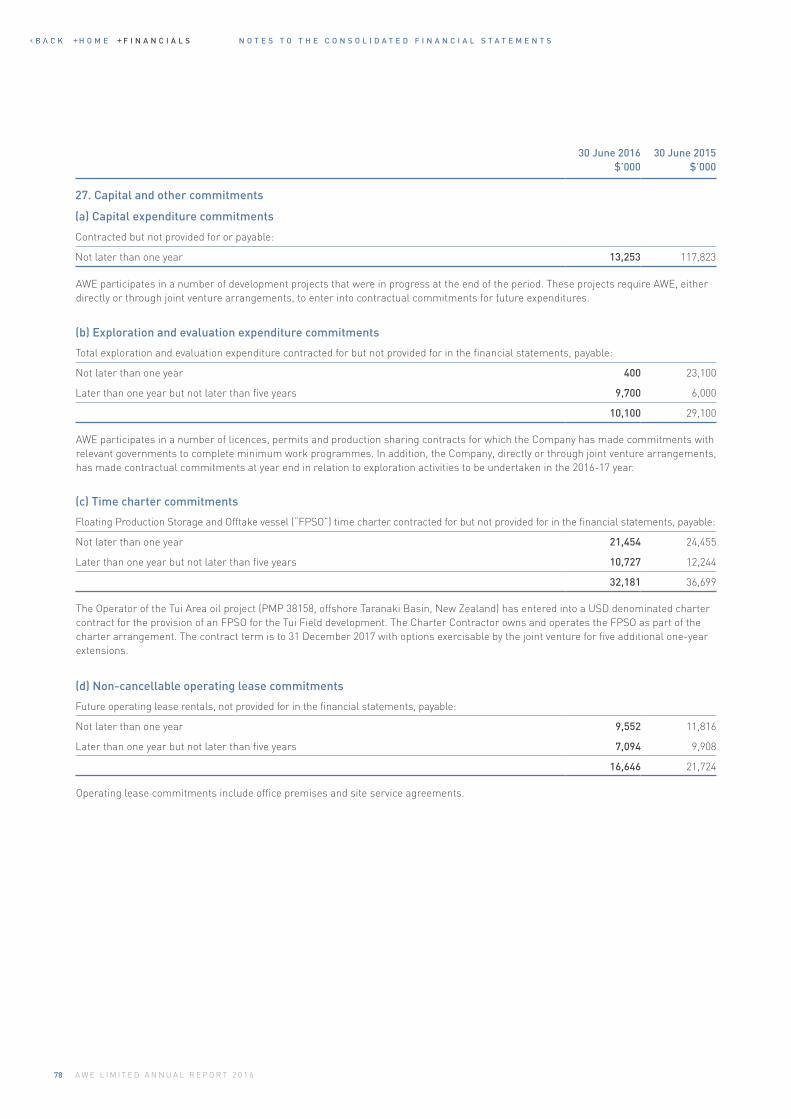
N O T E S T O T H E C O N S O L I D A T E D F I N A N C I A L S T A T E M E N T S
78 A W E L I M I T E D A N N U A L R E P O R T 2 0 1 6
30 June 2016 $’000
30 June 2015 $’000
27. Capital and other commitments
(a) Capital expenditure commitments
Contracted but not provided for or payable:
Not later than one year 13,253 117,823
(b) Exploration and evaluation expenditure commitments
Total exploration and evaluation expenditure contracted for but not provided for in the financial statements, payable:
Not later than one year 400 23,100
Later than one year but not later than five years 9,700 6,000
10,100 29,100
(c) Time charter commitments
Floating Production Storage and Offtake vessel (“FPSO”) time charter contracted for but not provided for in the financial statements, payable:
Not later than one year 21,454 24,455
Later than one year but not later than five years 10,727 12,244
32,181 36,699
(d) Non-cancellable operating lease commitments
Future operating lease rentals, not provided for in the financial statements, payable:
Not later than one year 9,552 11,816
Later than one year but not later than five years 7,094 9,908
16,646 21,724
AWE participates in a number of development projects that were in progress at the end of the period. These projects require AWE, either directly or through joint venture arrangements, to enter into contractual commitments for future expenditures.
AWE participates in a number of licences, permits and production sharing contracts for which the Company has made commitments with relevant governments to complete minimum work programmes. In addition, the Company, directly or through joint venture arrangements, has made contractual commitments at year end in relation to exploration activities to be undertaken in the 2016-17 year.
The Operator of the Tui Area oil project (PMP 38158, offshore Taranaki Basin, New Zealand) has entered into a USD denominated charter contract for the provision of an FPSO for the Tui Field development. The Charter Contractor owns and operates the FPSO as part of the charter arrangement. The contract term is to 31 December 2017 with options exercisable by the joint venture for five additional one-year extensions.
Operating lease commitments include office premises and site service agreements.
H O M E F I N A N C I A L S
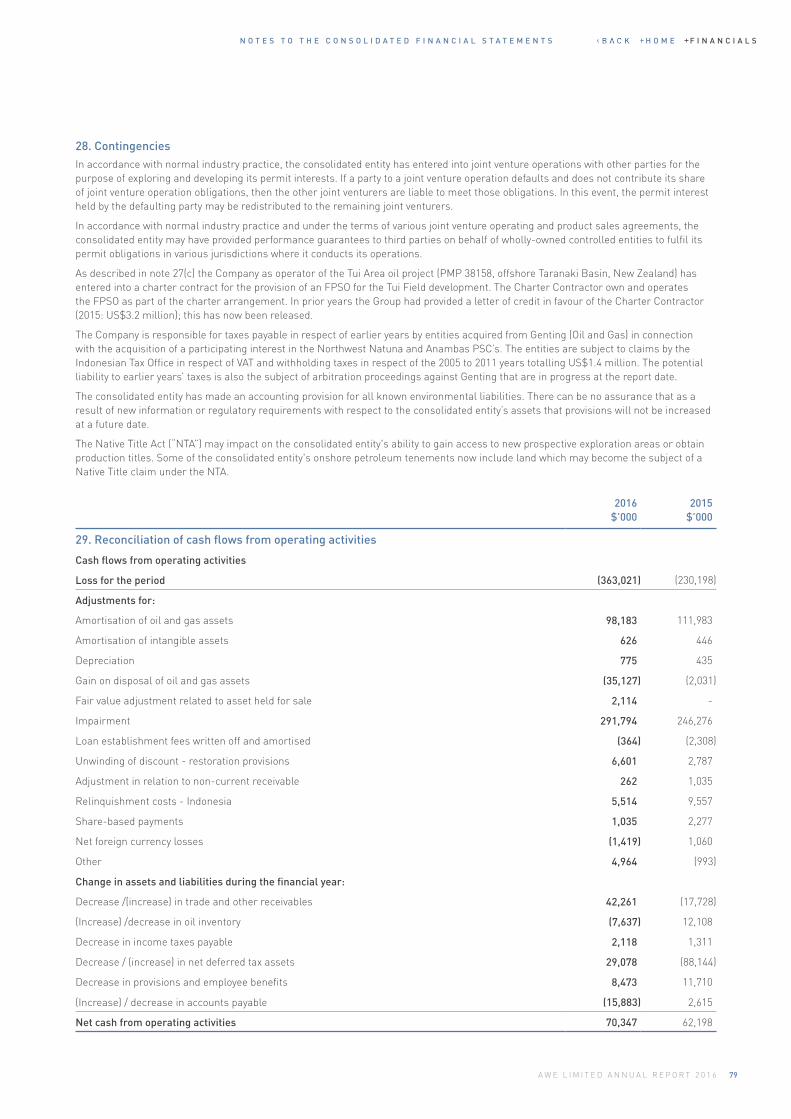
N O T E S T O T H E C O N S O L I D A T E D F I N A N C I A L S T A T E M E N T S
79A W E L I M I T E D A N N U A L R E P O R T 2 0 1 6
28. ContingenciesIn accordance with normal industry practice, the consolidated entity has entered into joint venture operations with other parties for the purpose of exploring and developing its permit interests. If a party to a joint venture operation defaults and does not contribute its share of joint venture operation obligations, then the other joint venturers are liable to meet those obligations. In this event, the permit interest held by the defaulting party may be redistributed to the remaining joint venturers.
In accordance with normal industry practice and under the terms of various joint venture operating and product sales agreements, the consolidated entity may have provided performance guarantees to third parties on behalf of wholly-owned controlled entities to fulfil its permit obligations in various jurisdictions where it conducts its operations.
As described in note 27(c) the Company as operator of the Tui Area oil project (PMP 38158, offshore Taranaki Basin, New Zealand) has entered into a charter contract for the provision of an FPSO for the Tui Field development. The Charter Contractor own and operates the FPSO as part of the charter arrangement. In prior years the Group had provided a letter of credit in favour of the Charter Contractor (2015: US$3.2 million); this has now been released.
The Company is responsible for taxes payable in respect of earlier years by entities acquired from Genting (Oil and Gas) in connection with the acquisition of a participating interest in the Northwest Natuna and Anambas PSC’s. The entities are subject to claims by the Indonesian Tax Office in respect of VAT and withholding taxes in respect of the 2005 to 2011 years totalling US$1.4 million. The potential liability to earlier years’ taxes is also the subject of arbitration proceedings against Genting that are in progress at the report date.
The consolidated entity has made an accounting provision for all known environmental liabilities. There can be no assurance that as a result of new information or regulatory requirements with respect to the consolidated entity’s assets that provisions will not be increased at a future date.
The Native Title Act (“NTA”) may impact on the consolidated entity's ability to gain access to new prospective exploration areas or obtain production titles. Some of the consolidated entity's onshore petroleum tenements now include land which may become the subject of a Native Title claim under the NTA.
2016 $’000
2015 $’000
29. Reconciliation of cash flows from operating activities
Cash flows from operating activities
Loss for the period (363,021) (230,198)
Adjustments for:
Amortisation of oil and gas assets 98,183 111,983
Amortisation of intangible assets 626 446
Depreciation 775 435
Gain on disposal of oil and gas assets (35,127) (2,031)
Fair value adjustment related to asset held for sale 2,114 -
Impairment 291,794 246,276
Loan establishment fees written off and amortised (364) (2,308)
Unwinding of discount - restoration provisions 6,601 2,787
Adjustment in relation to non-current receivable 262 1,035
Relinquishment costs - Indonesia 5,514 9,557
Share-based payments 1,035 2,277
Net foreign currency losses (1,419) 1,060
Other 4,964 (993)
Change in assets and liabilities during the financial year:
Decrease /(increase) in trade and other receivables 42,261 (17,728)
(Increase) /decrease in oil inventory (7,637) 12,108
Decrease in income taxes payable 2,118 1,311
Decrease / (increase) in net deferred tax assets 29,078 (88,144)
Decrease in provisions and employee benefits 8,473 11,710
(Increase) / decrease in accounts payable (15,883) 2,615
Net cash from operating activities 70,347 62,198
H O M E F I N A N C I A L S
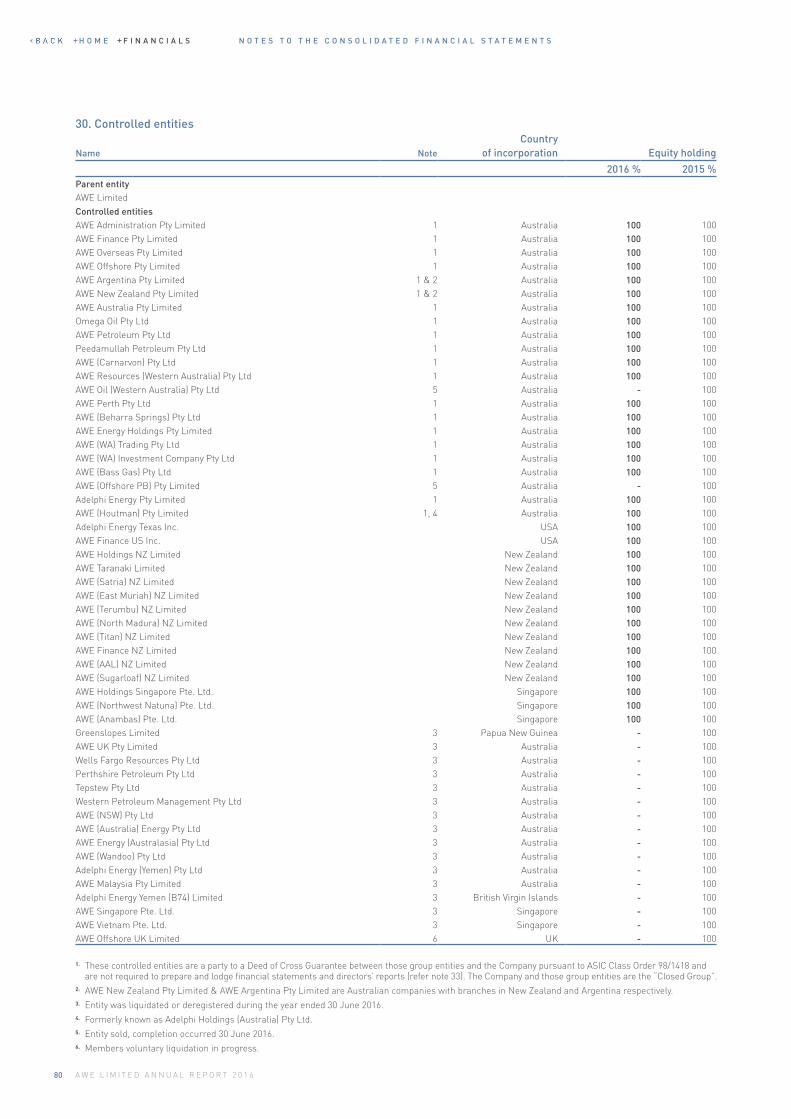
N O T E S T O T H E C O N S O L I D A T E D F I N A N C I A L S T A T E M E N T S
80 A W E L I M I T E D A N N U A L R E P O R T 2 0 1 6
Name NoteCountry
of incorporation Equity holding
2016 % 2015 %Parent entityAWE LimitedControlled entitiesAWE Administration Pty Limited 1 Australia 100 100AWE Finance Pty Limited 1 Australia 100 100AWE Overseas Pty Limited 1 Australia 100 100AWE Offshore Pty Limited 1 Australia 100 100AWE Argentina Pty Limited 1 & 2 Australia 100 100AWE New Zealand Pty Limited 1 & 2 Australia 100 100AWE Australia Pty Limited 1 Australia 100 100Omega Oil Pty Ltd 1 Australia 100 100AWE Petroleum Pty Ltd 1 Australia 100 100Peedamullah Petroleum Pty Ltd 1 Australia 100 100AWE (Carnarvon) Pty Ltd 1 Australia 100 100AWE Resources (Western Australia) Pty Ltd 1 Australia 100 100AWE Oil (Western Australia) Pty Ltd 5 Australia - 100AWE Perth Pty Ltd 1 Australia 100 100AWE (Beharra Springs) Pty Ltd 1 Australia 100 100AWE Energy Holdings Pty Limited 1 Australia 100 100AWE (WA) Trading Pty Ltd 1 Australia 100 100AWE (WA) Investment Company Pty Ltd 1 Australia 100 100AWE (Bass Gas) Pty Ltd 1 Australia 100 100AWE (Offshore PB) Pty Limited 5 Australia - 100Adelphi Energy Pty Limited 1 Australia 100 100AWE (Houtman) Pty Limited 1, 4 Australia 100 100Adelphi Energy Texas Inc. USA 100 100AWE Finance US Inc. USA 100 100AWE Holdings NZ Limited New Zealand 100 100AWE Taranaki Limited New Zealand 100 100AWE (Satria) NZ Limited New Zealand 100 100AWE (East Muriah) NZ Limited New Zealand 100 100AWE (Terumbu) NZ Limited New Zealand 100 100AWE (North Madura) NZ Limited New Zealand 100 100AWE (Titan) NZ Limited New Zealand 100 100AWE Finance NZ Limited New Zealand 100 100AWE (AAL) NZ Limited New Zealand 100 100AWE (Sugarloaf) NZ Limited New Zealand 100 100AWE Holdings Singapore Pte. Ltd. Singapore 100 100AWE (Northwest Natuna) Pte. Ltd. Singapore 100 100AWE (Anambas) Pte. Ltd. Singapore 100 100Greenslopes Limited 3 Papua New Guinea - 100AWE UK Pty Limited 3 Australia - 100Wells Fargo Resources Pty Ltd 3 Australia - 100Perthshire Petroleum Pty Ltd 3 Australia - 100Tepstew Pty Ltd 3 Australia - 100Western Petroleum Management Pty Ltd 3 Australia - 100AWE (NSW) Pty Ltd 3 Australia - 100AWE (Australia) Energy Pty Ltd 3 Australia - 100AWE Energy (Australasia) Pty Ltd 3 Australia - 100AWE (Wandoo) Pty Ltd 3 Australia - 100Adelphi Energy (Yemen) Pty Ltd 3 Australia - 100AWE Malaysia Pty Limited 3 Australia - 100Adelphi Energy Yemen (B74) Limited 3 British Virgin Islands - 100AWE Singapore Pte. Ltd. 3 Singapore - 100AWE Vietnam Pte. Ltd. 3 Singapore - 100AWE Offshore UK Limited 6 UK - 100
1. These controlled entities are a party to a Deed of Cross Guarantee between those group entities and the Company pursuant to ASIC Class Order 98/1418 and are not required to prepare and lodge financial statements and directors’ reports (refer note 33). The Company and those group entities are the “Closed Group”.
2. AWE New Zealand Pty Limited & AWE Argentina Pty Limited are Australian companies with branches in New Zealand and Argentina respectively.3. Entity was liquidated or deregistered during the year ended 30 June 2016.4. Formerly known as Adelphi Holdings (Australia) Pty Ltd. 5. Entity sold, completion occurred 30 June 2016.6. Members voluntary liquidation in progress.
30. Controlled entities
H O M E F I N A N C I A L S
N O T E S T O T H E C O N S O L I D A T E D F I N A N C I A L S T A T E M E N T S
81A W E L I M I T E D A N N U A L R E P O R T 2 0 1 6
31. Financial risk managementThe Group is involved in activities that expose it to a variety of financial risks including currency risk, fair value risk, interest rate risk and commodity pricing risk. In accordance with Board approved policies financial instruments may be used to hedge the exposure to fluctuations in exchange rates, interest rates and commodity prices.
The Board of Directors has overall responsibility for the establishment and oversight of the financial risk management framework of the consolidated entity. The Board has delegated to the Audit and Governance Committee the responsibility for developing and monitoring financial risk management policies across the Company. The Audit and Governance Committee’s primary role is to advise and assist the Board of Directors in assessing the management of key financial risks of the Company. The financial risk management policies and systems are reviewed annually by the Audit and Governance Committee to reflect changes in market conditions and the entity’s business activities.
Management of financial risks is carried out by a centralised treasury function which operates under Board approved policies. The Board approved Treasury and Risk Management Guidelines provide clear guidelines to management in respect of the management of financial risks of the Company and are designed to ensure that it adequately reflects the strategic risk management objectives of the Board.
The objective of AWE’s financial risk management strategy is to minimise the impact of volatility in financial markets on the financial performance, cash flows and shareholder returns of AWE. This includes the need to ensure that sufficient liquidity is available to fund its strategic business plans. Identification and analysis of relevant financial risks and its impact on the achievement of the Company’s objectives forms the basis for determining how such risks should be managed. The forecast financial position of the consolidated entity is regularly monitored and financial instruments may be used within approved guidelines to hedge exposure to fluctuations in interest rates, exchange rates and commodity prices.
(a) Market risk
(i) Commodity price riskThe consolidated entity is exposed to commodity price risk through its revenue from the sale of hydrocarbons – gas, crude oil, condensate and LPG. Australian gas sales are not subject to commodity price risk as the product is sold in Australian Dollars under long-term contracts with CPI escalators in place. However, crude oil, condensate and LPG are priced against world benchmark commodity prices and the consolidated entity is therefore subject to commodity price risk for these products.
Subject to approval of the Board, the consolidated entity may enter into certain derivative instruments to manage its commodity price risk. As at the end of the financial year, the consolidated entity has derivative financial instruments in place (commodity forward contracts) which have been valued using valuation techniques with market observable inputs. Further details are set out in Note 31 (d), Fair values of financial instruments.
(ii) Interest rate riskAs at 30 June 2016 the Company had available a secured multi-currency syndicated bank loan facility of A$400 million; this was reduced to A$300 million during July 2016. The facility utilised at 30 June 2016 was $14.8 million (2015: $169.8 million) (refer note 20). When drawn, the Australian Dollar portion of the facility bears interest at the bank bill swap rate plus a margin, the United States Dollar portion of the facility bears interest at LIBOR plus a margin and the New Zealand portion of the facility bears interest at BKBM plus a margin. Borrowings under the facility are at floating rates and when the facility is drawn the consolidated entity would be subject to interest rate risk from movements in the Australian dollar bank bill swap rate, United States dollar LIBOR and New Zealand BKBM. Similarly, the consolidated entity is subject to interest rate risk from movements in the Australian, United States and New Zealand cash deposits.
In accordance with Board approved policies, the consolidated entity may enter into certain derivative instruments to manage its interest rate risk. As at the end of the financial year, the consolidated entity has no interest rate hedging or derivatives in place.
(iii) Foreign exchange riskThe consolidated entity operates internationally and is exposed to foreign exchange risk arising from various currency exposures, primarily with respect to United States and New Zealand dollars. The consolidated entity is subject to foreign exchange risk through the sale of products denominated is US dollars, borrowings denominated in US and NZ dollars and foreign currency capital and operating expenditure.
The Company manages its foreign exchange exposures on a net basis and may use forward foreign exchange contracts or cross currency swaps to manage its exposures. As at the end of the financial year, the consolidated entity has no foreign exchange hedging or derivatives in place.
H O M E F I N A N C I A L S
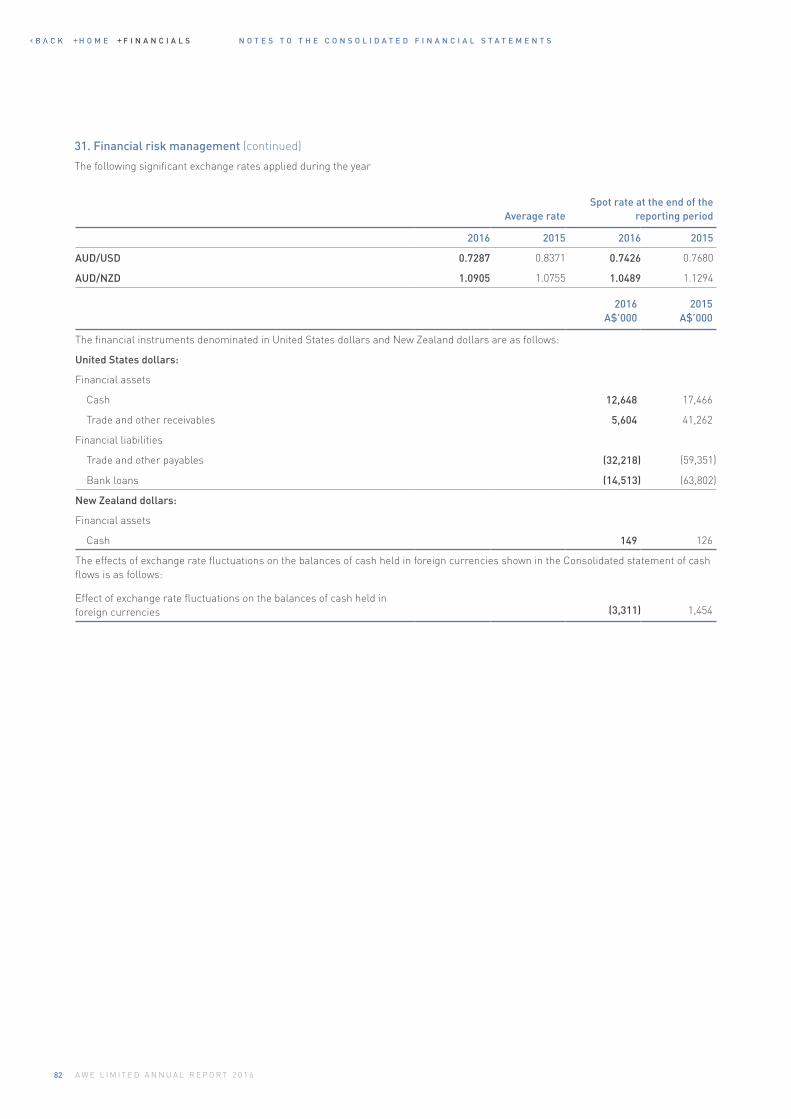
N O T E S T O T H E C O N S O L I D A T E D F I N A N C I A L S T A T E M E N T S
82 A W E L I M I T E D A N N U A L R E P O R T 2 0 1 6
Average rateSpot rate at the end of the
reporting period
2016 2015 2016 2015
AUD/USD 0.7287 0.8371 0.7426 0.7680
AUD/NZD 1.0905 1.0755 1.0489 1.1294
2016 A$’000
2015 A$’000
The financial instruments denominated in United States dollars and New Zealand dollars are as follows:
United States dollars:
Financial assets
Cash 12,648 17,466
Trade and other receivables 5,604 41,262
Financial liabilities
Trade and other payables (32,218) (59,351)
Bank loans (14,513) (63,802)
New Zealand dollars:
Financial assets
Cash 149 126
The effects of exchange rate fluctuations on the balances of cash held in foreign currencies shown in the Consolidated statement of cash flows is as follows:
Effect of exchange rate fluctuations on the balances of cash held in foreign currencies (3,311) 1,454
31. Financial risk management (continued)
The following significant exchange rates applied during the year
H O M E F I N A N C I A L S
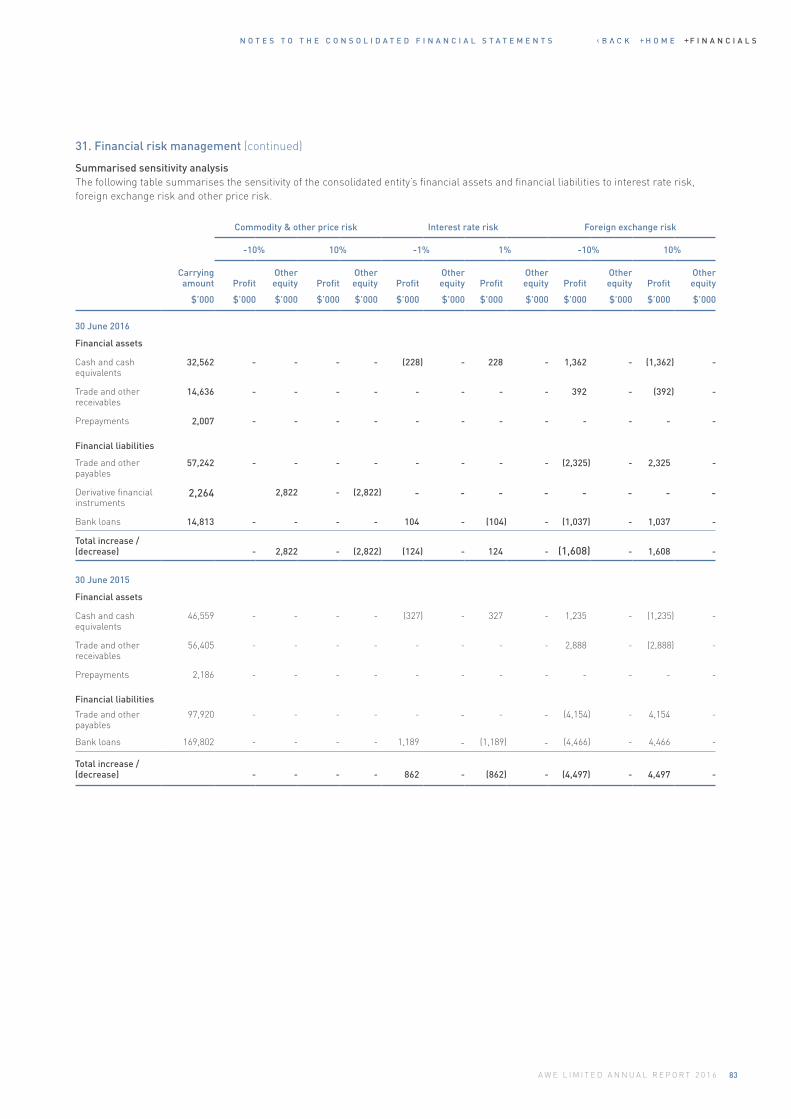
N O T E S T O T H E C O N S O L I D A T E D F I N A N C I A L S T A T E M E N T S
83A W E L I M I T E D A N N U A L R E P O R T 2 0 1 6
31. Financial risk management (continued)
Summarised sensitivity analysisThe following table summarises the sensitivity of the consolidated entity’s financial assets and financial liabilities to interest rate risk, foreign exchange risk and other price risk.
Carrying amount
$’000
Commodity & other price risk Interest rate risk Foreign exchange risk
-10% 10% -1% 1% -10% 10%
Profit
$’000
Other equity
$’000
Profit
$’000
Other equity
$’000
Profit
$’000
Other equity
$’000
Profit
$’000
Other equity
$’000
Profit
$’000
Other equity
$’000
Profit
$’000
Other equity
$’000
30 June 2016
Financial assets
Cash and cash equivalents
32,562 - - - - (228) - 228 - 1,362 - (1,362) -
Trade and other receivables
14,636 - - - - - - - - 392 - (392) -
Prepayments 2,007 - - - - - - - - - - - -
Financial liabilities
Trade and other payables
57,242 - - - - - - - - (2,325) - 2,325 -
Derivative financial instruments
2,264 2,822 - (2,822) - - - - - - - -
Bank loans 14,813 - - - - 104 - (104) - (1,037) - 1,037 -
Total increase / (decrease) - 2,822 - (2,822) (124) - 124 - (1,608) - 1,608 -
30 June 2015
Financial assets
Cash and cash equivalents
46,559 - - - - (327) - 327 - 1,235 - (1,235) -
Trade and other receivables
56,405 - - - - - - - - 2,888 - (2,888) -
Prepayments 2,186 - - - - - - - - - - - -
Financial liabilities
Trade and other payables
97,920 - - - - - - - - (4,154) - 4,154 -
Bank loans 169,802 - - - - 1,189 - (1,189) - (4,466) - 4,466 -
Total increase / (decrease) - - - - 862 - (862) - (4,497) - 4,497 -
H O M E F I N A N C I A L S
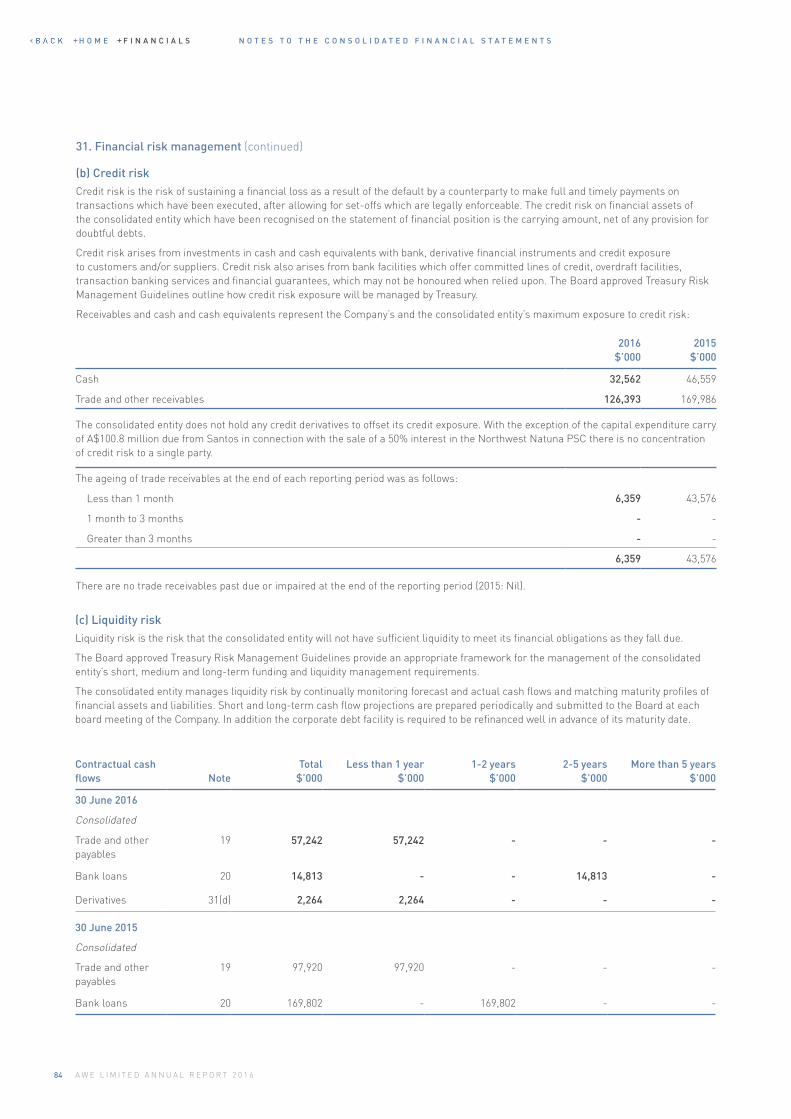
N O T E S T O T H E C O N S O L I D A T E D F I N A N C I A L S T A T E M E N T S
84 A W E L I M I T E D A N N U A L R E P O R T 2 0 1 6
31. Financial risk management (continued)
(b) Credit riskCredit risk is the risk of sustaining a financial loss as a result of the default by a counterparty to make full and timely payments on transactions which have been executed, after allowing for set-offs which are legally enforceable. The credit risk on financial assets of the consolidated entity which have been recognised on the statement of financial position is the carrying amount, net of any provision for doubtful debts.
Credit risk arises from investments in cash and cash equivalents with bank, derivative financial instruments and credit exposure to customers and/or suppliers. Credit risk also arises from bank facilities which offer committed lines of credit, overdraft facilities, transaction banking services and financial guarantees, which may not be honoured when relied upon. The Board approved Treasury Risk Management Guidelines outline how credit risk exposure will be managed by Treasury.
Receivables and cash and cash equivalents represent the Company’s and the consolidated entity’s maximum exposure to credit risk:
2016 $’000
2015 $’000
Cash 32,562 46,559
Trade and other receivables 126,393 169,986
The consolidated entity does not hold any credit derivatives to offset its credit exposure. With the exception of the capital expenditure carry of A$100.8 million due from Santos in connection with the sale of a 50% interest in the Northwest Natuna PSC there is no concentration of credit risk to a single party.
The ageing of trade receivables at the end of each reporting period was as follows:
Less than 1 month 6,359 43,576
1 month to 3 months - -
Greater than 3 months - -
6,359 43,576
There are no trade receivables past due or impaired at the end of the reporting period (2015: Nil).
(c) Liquidity riskLiquidity risk is the risk that the consolidated entity will not have sufficient liquidity to meet its financial obligations as they fall due.
The Board approved Treasury Risk Management Guidelines provide an appropriate framework for the management of the consolidated entity’s short, medium and long-term funding and liquidity management requirements.
The consolidated entity manages liquidity risk by continually monitoring forecast and actual cash flows and matching maturity profiles of financial assets and liabilities. Short and long-term cash flow projections are prepared periodically and submitted to the Board at each board meeting of the Company. In addition the corporate debt facility is required to be refinanced well in advance of its maturity date.
Contractual cash flows Note
Total $’000
Less than 1 year $’000
1-2 years $’000
2-5 years $’000
More than 5 years $’000
30 June 2016
Consolidated
Trade and other payables
19 57,242 57,242 - - -
Bank loans 20 14,813 - - 14,813 -
Derivatives 31(d) 2,264 2,264 - - -
30 June 2015
Consolidated
Trade and other payables
19 97,920 97,920 - - -
Bank loans 20 169,802 - 169,802 - -
H O M E F I N A N C I A L S
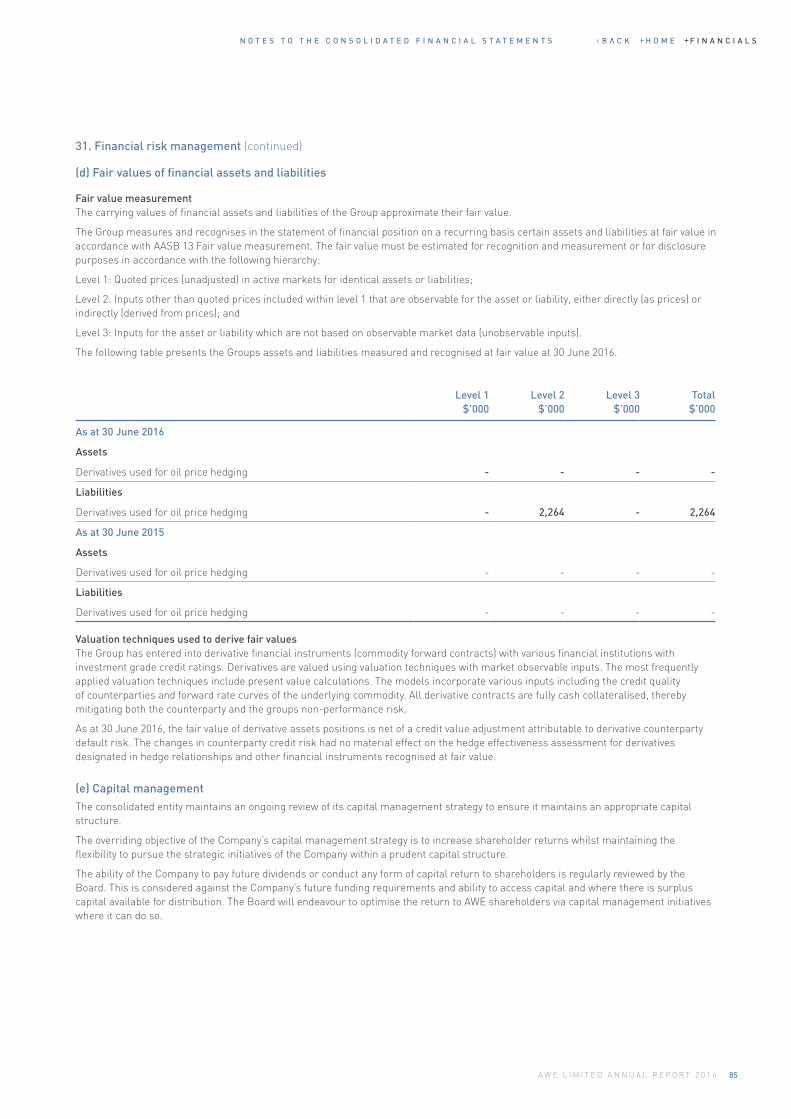
N O T E S T O T H E C O N S O L I D A T E D F I N A N C I A L S T A T E M E N T S
85A W E L I M I T E D A N N U A L R E P O R T 2 0 1 6
Level 1 $’000
Level 2 $’000
Level 3 $’000
Total $’000
As at 30 June 2016
Assets
Derivatives used for oil price hedging - - - -
Liabilities
Derivatives used for oil price hedging - 2,264 - 2,264
As at 30 June 2015
Assets
Derivatives used for oil price hedging - - - -
Liabilities
Derivatives used for oil price hedging - - - -
31. Financial risk management (continued)
(d) Fair values of financial assets and liabilities
Fair value measurementThe carrying values of financial assets and liabilities of the Group approximate their fair value.
The Group measures and recognises in the statement of financial position on a recurring basis certain assets and liabilities at fair value in accordance with AASB 13 Fair value measurement. The fair value must be estimated for recognition and measurement or for disclosure purposes in accordance with the following hierarchy:
Level 1: Quoted prices (unadjusted) in active markets for identical assets or liabilities;
Level 2: Inputs other than quoted prices included within level 1 that are observable for the asset or liability, either directly (as prices) or indirectly (derived from prices); and
Level 3: Inputs for the asset or liability which are not based on observable market data (unobservable inputs).
The following table presents the Groups assets and liabilities measured and recognised at fair value at 30 June 2016.
Valuation techniques used to derive fair valuesThe Group has entered into derivative financial instruments (commodity forward contracts) with various financial institutions with investment grade credit ratings. Derivatives are valued using valuation techniques with market observable inputs. The most frequently applied valuation techniques include present value calculations. The models incorporate various inputs including the credit quality of counterparties and forward rate curves of the underlying commodity. All derivative contracts are fully cash collateralised, thereby mitigating both the counterparty and the groups non-performance risk.
As at 30 June 2016, the fair value of derivative assets positions is net of a credit value adjustment attributable to derivative counterparty default risk. The changes in counterparty credit risk had no material effect on the hedge effectiveness assessment for derivatives designated in hedge relationships and other financial instruments recognised at fair value.
(e) Capital managementThe consolidated entity maintains an ongoing review of its capital management strategy to ensure it maintains an appropriate capital structure.
The overriding objective of the Company’s capital management strategy is to increase shareholder returns whilst maintaining the flexibility to pursue the strategic initiatives of the Company within a prudent capital structure.
The ability of the Company to pay future dividends or conduct any form of capital return to shareholders is regularly reviewed by the Board. This is considered against the Company’s future funding requirements and ability to access capital and where there is surplus capital available for distribution. The Board will endeavour to optimise the return to AWE shareholders via capital management initiatives where it can do so.
H O M E F I N A N C I A L S
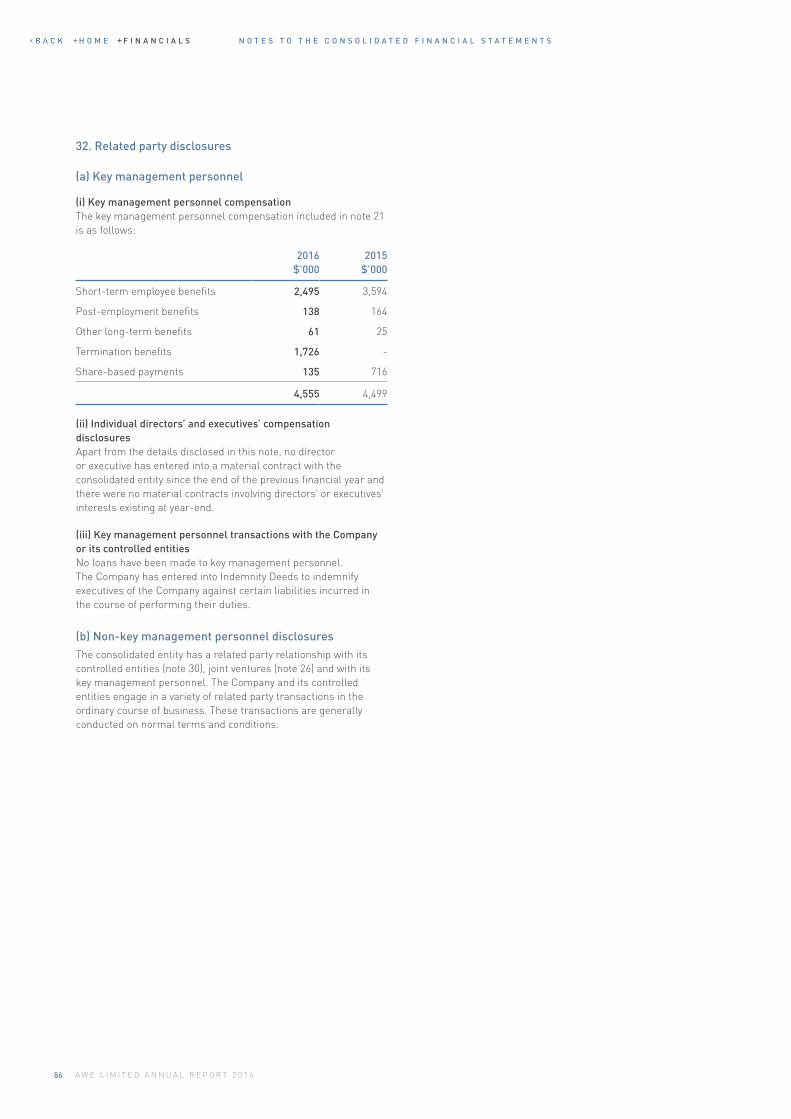
N O T E S T O T H E C O N S O L I D A T E D F I N A N C I A L S T A T E M E N T S
86 A W E L I M I T E D A N N U A L R E P O R T 2 0 1 6
32. Related party disclosures
(a) Key management personnel
(i) Key management personnel compensationThe key management personnel compensation included in note 21 is as follows:
2016 $’000
2015 $’000
Short-term employee benefits 2,495 3,594
Post-employment benefits 138 164
Other long-term benefits 61 25
Termination benefits 1,726 -
Share-based payments 135 716
4,555 4,499
(ii) Individual directors’ and executives’ compensation disclosuresApart from the details disclosed in this note, no director or executive has entered into a material contract with the consolidated entity since the end of the previous financial year and there were no material contracts involving directors’ or executives’ interests existing at year-end.
(iii) Key management personnel transactions with the Company or its controlled entitiesNo loans have been made to key management personnel. The Company has entered into Indemnity Deeds to indemnify executives of the Company against certain liabilities incurred in the course of performing their duties.
(b) Non-key management personnel disclosuresThe consolidated entity has a related party relationship with its controlled entities (note 30), joint ventures (note 26) and with its key management personnel. The Company and its controlled entities engage in a variety of related party transactions in the ordinary course of business. These transactions are generally conducted on normal terms and conditions.
H O M E F I N A N C I A L S
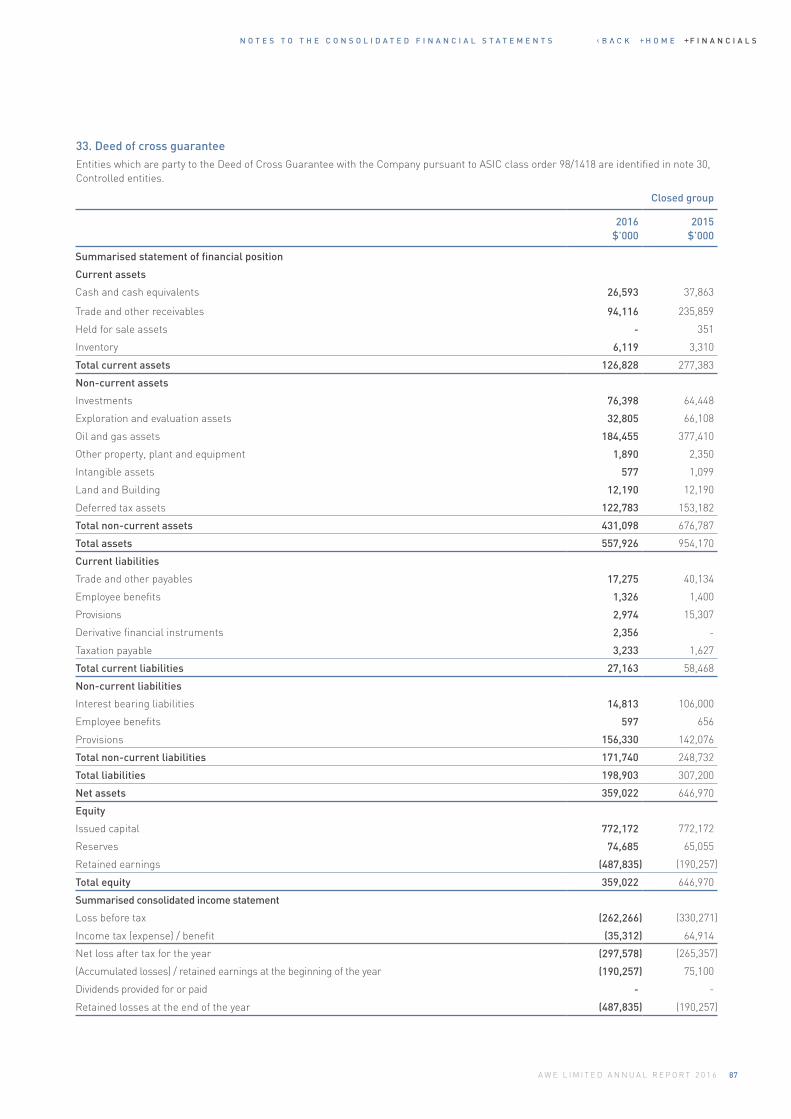
N O T E S T O T H E C O N S O L I D A T E D F I N A N C I A L S T A T E M E N T S
87A W E L I M I T E D A N N U A L R E P O R T 2 0 1 6
33. Deed of cross guaranteeEntities which are party to the Deed of Cross Guarantee with the Company pursuant to ASIC class order 98/1418 are identified in note 30, Controlled entities.
Closed group
2016 $’000
2015 $’000
Summarised statement of financial position
Current assets
Cash and cash equivalents 26,593 37,863
Trade and other receivables 94,116 235,859
Held for sale assets - 351
Inventory 6,119 3,310
Total current assets 126,828 277,383
Non-current assets
Investments 76,398 64,448
Exploration and evaluation assets 32,805 66,108
Oil and gas assets 184,455 377,410
Other property, plant and equipment 1,890 2,350
Intangible assets 577 1,099
Land and Building 12,190 12,190
Deferred tax assets 122,783 153,182
Total non-current assets 431,098 676,787
Total assets 557,926 954,170
Current liabilities
Trade and other payables 17,275 40,134
Employee benefits 1,326 1,400
Provisions 2,974 15,307
Derivative financial instruments 2,356 -
Taxation payable 3,233 1,627
Total current liabilities 27,163 58,468
Non-current liabilities
Interest bearing liabilities 14,813 106,000
Employee benefits 597 656
Provisions 156,330 142,076
Total non-current liabilities 171,740 248,732
Total liabilities 198,903 307,200
Net assets 359,022 646,970
Equity
Issued capital 772,172 772,172
Reserves 74,685 65,055
Retained earnings (487,835) (190,257)
Total equity 359,022 646,970
Summarised consolidated income statement
Loss before tax (262,266) (330,271)
Income tax (expense) / benefit (35,312) 64,914
Net loss after tax for the year (297,578) (265,357)
(Accumulated losses) / retained earnings at the beginning of the year (190,257) 75,100
Dividends provided for or paid - -
Retained losses at the end of the year (487,835) (190,257)
H O M E F I N A N C I A L S
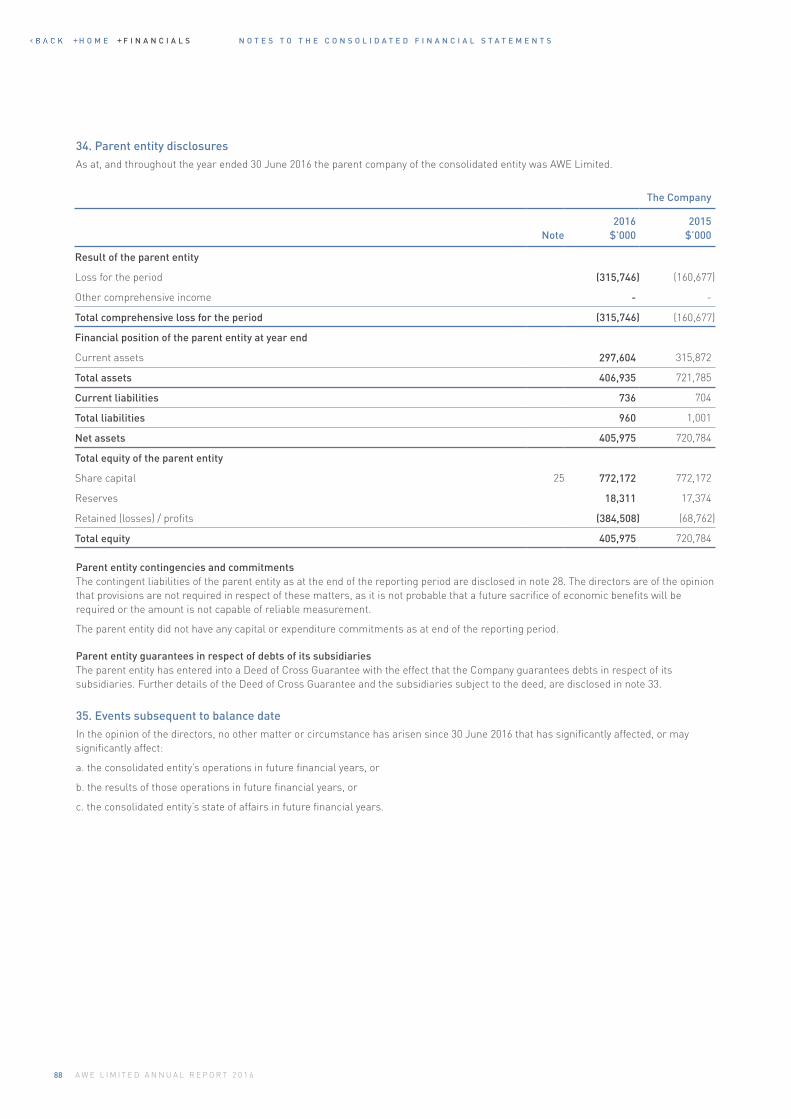
N O T E S T O T H E C O N S O L I D A T E D F I N A N C I A L S T A T E M E N T S
88 A W E L I M I T E D A N N U A L R E P O R T 2 0 1 6
The Company
Note2016
$’0002015
$’000
Result of the parent entity
Loss for the period (315,746) (160,677)
Other comprehensive income - -
Total comprehensive loss for the period (315,746) (160,677)
Financial position of the parent entity at year end
Current assets 297,604 315,872
Total assets 406,935 721,785
Current liabilities 736 704
Total liabilities 960 1,001
Net assets 405,975 720,784
Total equity of the parent entity
Share capital 25 772,172 772,172
Reserves 18,311 17,374
Retained (losses) / profits (384,508) (68,762)
Total equity 405,975 720,784
34. Parent entity disclosuresAs at, and throughout the year ended 30 June 2016 the parent company of the consolidated entity was AWE Limited.
Parent entity contingencies and commitmentsThe contingent liabilities of the parent entity as at the end of the reporting period are disclosed in note 28. The directors are of the opinion that provisions are not required in respect of these matters, as it is not probable that a future sacrifice of economic benefits will be required or the amount is not capable of reliable measurement.
The parent entity did not have any capital or expenditure commitments as at end of the reporting period.
Parent entity guarantees in respect of debts of its subsidiariesThe parent entity has entered into a Deed of Cross Guarantee with the effect that the Company guarantees debts in respect of its subsidiaries. Further details of the Deed of Cross Guarantee and the subsidiaries subject to the deed, are disclosed in note 33.
35. Events subsequent to balance dateIn the opinion of the directors, no other matter or circumstance has arisen since 30 June 2016 that has significantly affected, or may significantly affect:
a. the consolidated entity’s operations in future financial years, or
b. the results of those operations in future financial years, or
c. the consolidated entity’s state of affairs in future financial years.
H O M E F I N A N C I A L S
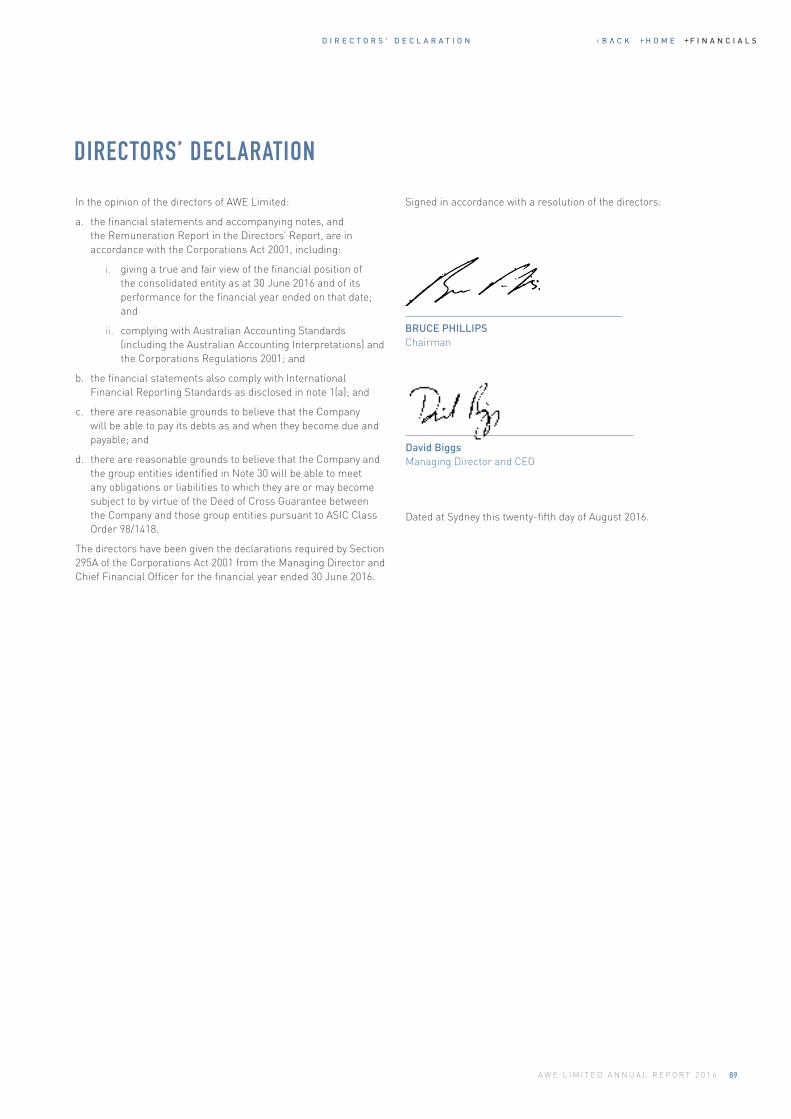
89A W E L I M I T E D A N N U A L R E P O R T 2 0 1 6
D I R E C T O R S ' D E C L A R A T I O N
DIRECTORS’ DECLARATION
In the opinion of the directors of AWE Limited:
a. the financial statements and accompanying notes, and the Remuneration Report in the Directors’ Report, are in accordance with the Corporations Act 2001, including:
i. giving a true and fair view of the financial position of the consolidated entity as at 30 June 2016 and of its performance for the financial year ended on that date; and
ii. complying with Australian Accounting Standards (including the Australian Accounting Interpretations) and the Corporations Regulations 2001; and
b. the financial statements also comply with International Financial Reporting Standards as disclosed in note 1(a); and
c. there are reasonable grounds to believe that the Company will be able to pay its debts as and when they become due and payable; and
d. there are reasonable grounds to believe that the Company and the group entities identified in Note 30 will be able to meet any obligations or liabilities to which they are or may become subject to by virtue of the Deed of Cross Guarantee between the Company and those group entities pursuant to ASIC Class Order 98/1418.
The directors have been given the declarations required by Section 295A of the Corporations Act 2001 from the Managing Director and Chief Financial Officer for the financial year ended 30 June 2016.
Signed in accordance with a resolution of the directors:
Dated at Sydney this twenty-fifth day of August 2016.
David Biggs Managing Director and CEO
BRUCE PHILLIPS Chairman
H O M E F I N A N C I A L S
90 A W E L I M I T E D A N N U A L R E P O R T 2 0 1 6
I N D E P E N D E N T A U D I T O R ' S R E P O R T
A member firm of Ernst & Young Global Limited Liability limited by a scheme approved under Professional Standards Legislation
Ernst & Young 200 George Street Sydney NSW 2000 Australia GPO Box 2646 Sydney NSW 2001
Tel: +61 2 9248 5555 Fax: +61 2 9248 5959 ey.com/au
Independent auditor's report to the members of AWE Limited
Report on the financial report We have audited the accompanying financial report of AWE Limited, which comprises the consolidated statement of financial position as at 30 June 2016, the consolidated income statement, the consolidated statement of comprehensive income, the consolidated statement of changes in equity and the consolidated statement of cash flows for the year then ended, notes comprising a summary of significant accounting policies and other explanatory information, and the directors' declaration of the consolidated entity comprising the company and the entities it controlled at the year's end or from time to time during the financial year.
Directors' responsibility for the financial report The directors of the company are responsible for the preparation of the financial report that gives a true and fair view in accordance with Australian Accounting Standards and the Corporations Act 2001 and for such internal controls as the directors determine are necessary to enable the preparation of the financial report that is free from material misstatement, whether due to fraud or error. In Note 1, the directors also state, in accordance with Accounting Standard AASB 101 Presentation of Financial Statements, that the financial statements comply with International Financial Reporting Standards.
Auditor's responsibility Our responsibility is to express an opinion on the financial report based on our audit. We conducted our audit in accordance with Australian Auditing Standards. Those standards require that we comply with relevant ethical requirements relating to audit engagements and plan and perform the audit to obtain reasonable assurance about whether the financial report is free from material misstatement.
An audit involves performing procedures to obtain audit evidence about the amounts and disclosures in the financial report. The procedures selected depend on the auditor's judgment, including the assessment of the risks of material misstatement of the financial report, whether due to fraud or error. In making those risk assessments, the auditor considers internal controls relevant to the entity's preparation and fair presentation of the financial report in order to design audit procedures that are appropriate in the circumstances, but not for the purpose of expressing an opinion on the effectiveness of the entity's internal controls. An audit also includes evaluating the appropriateness of accounting policies used and the reasonableness of accounting estimates made by the directors, as well as evaluating the overall presentation of the financial report.
We believe that the audit evidence we have obtained is sufficient and appropriate to provide a basis for our audit opinion.
Independence
In conducting our audit we have complied with the independence requirements of the Corporations Act 2001. We have given to the directors of the company a written Auditor’s Independence Declaration, a copy of which is included in the directors’ report.
A member firm of Ernst & Young Global Limited Liability limited by a scheme approved under Professional Standards Legislation
Opinion In our opinion:
a. the financial report of AWE Limited is in accordance with the Corporations Act 2001, including:
i giving a true and fair view of the consolidated entity's financial position as at 30 June 2016 and of its performance for the year ended on that date; and
ii complying with Australian Accounting Standards and the Corporations Regulations 2001; and
b. the financial report also complies with International Financial Reporting Standards as disclosed in Note 1.
Report on the remuneration report We have audited the Remuneration Report included in the directors' report for the year ended 30 June 2016. The directors of the company are responsible for the preparation and presentation of the Remuneration Report in accordance with section 300A of the Corporations Act 2001. Our responsibility is to express an opinion on the Remuneration Report, based on our audit conducted in accordance with Australian Auditing Standards.
Opinion In our opinion, the Remuneration Report of AWE Limited for the year ended 30 June 2016, complies with section 300A of the Corporations Act 2001.
Ernst & Young Scott Jarrett Partner Sydney 25 August 2016
H O M E F I N A N C I A L S
91A W E L I M I T E D A N N U A L R E P O R T 2 0 1 6
I N D E P E N D E N T A U D I T O R ' S R E P O R T
A member firm of Ernst & Young Global Limited Liability limited by a scheme approved under Professional Standards Legislation
Opinion In our opinion:
a. the financial report of AWE Limited is in accordance with the Corporations Act 2001, including:
i giving a true and fair view of the consolidated entity's financial position as at 30 June 2016 and of its performance for the year ended on that date; and
ii complying with Australian Accounting Standards and the Corporations Regulations 2001; and
b. the financial report also complies with International Financial Reporting Standards as disclosed in Note 1.
Report on the remuneration report We have audited the Remuneration Report included in the directors' report for the year ended 30 June 2016. The directors of the company are responsible for the preparation and presentation of the Remuneration Report in accordance with section 300A of the Corporations Act 2001. Our responsibility is to express an opinion on the Remuneration Report, based on our audit conducted in accordance with Australian Auditing Standards.
Opinion In our opinion, the Remuneration Report of AWE Limited for the year ended 30 June 2016, complies with section 300A of the Corporations Act 2001.
Ernst & Young Scott Jarrett Partner Sydney 25 August 2016
H O M E F I N A N C I A L S
N O T E S T O T H E C O N S O L I D A T E D F I N A N C I A L S T A T E M E N T S
92 A W E L I M I T E D A N N U A L R E P O R T 2 0 1 6
A D D I T I O N A L I N F O R M A T I O N
Reserves and contingent resources 93
Production and exploration permits 96
Stock exchange and shareholder information 98
Glossary and conversion tables 99
Five year financial summary 100
Corporate directory 101
A D D I T I O N A L I N F O R M AT I O N
H O M E F I N A N C I A L S
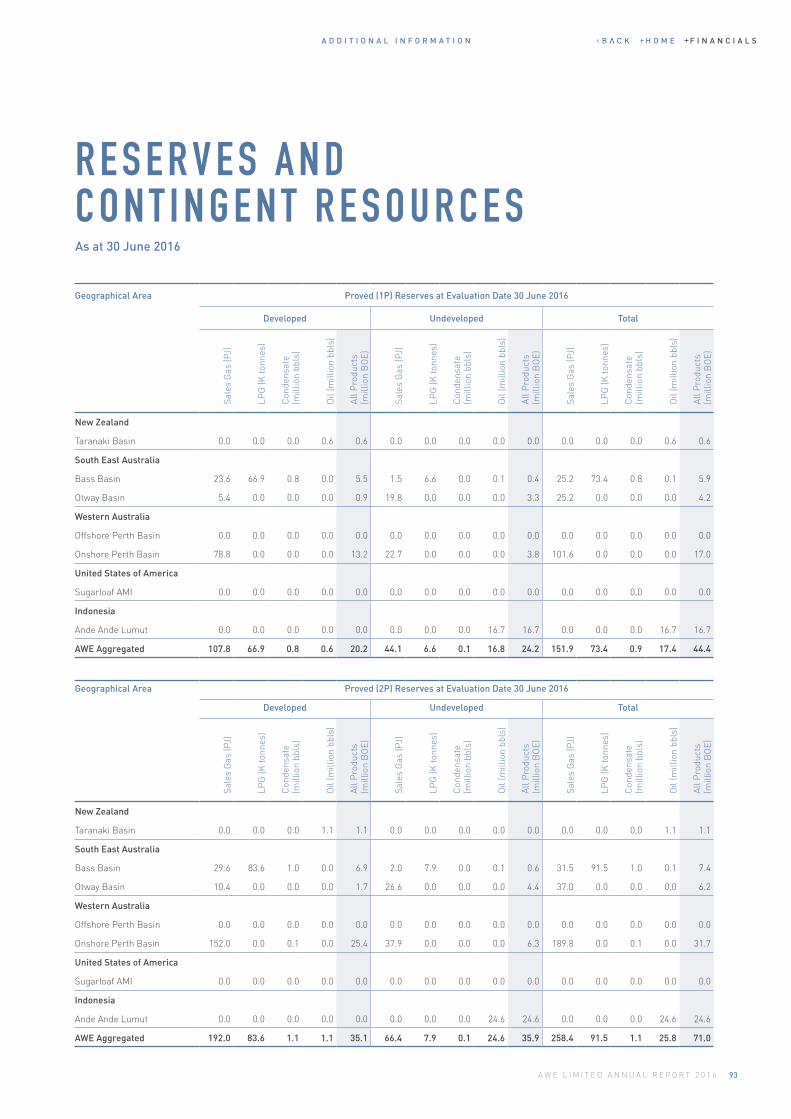
93A W E L I M I T E D A N N U A L R E P O R T 2 0 1 6
A D D I T I O N A L I N F O R M A T I O N
R E S E R V E S A N D C O N T I N G E N T R E S O U R C E SAs at 30 June 2016
Geographical Area Proved (1P) Reserves at Evaluation Date 30 June 2016
Developed Undeveloped Total
Sale
s G
as (P
J)
LPG
(K to
nnes
)
Con
dens
ate
(m
illio
n bb
ls)
Oil
(mill
ion
bbls
)
All P
rodu
cts
(mill
ion
BO
E)
Sale
s G
as (P
J)
LPG
(K to
nnes
)
Con
dens
ate
(mill
ion
bbls
)
Oil
(mill
ion
bbls
)
All P
rodu
cts
(mill
ion
BO
E)
Sale
s G
as (P
J)
LPG
(K to
nnes
)
Con
dens
ate
(mill
ion
bbls
)
Oil
(mill
ion
bbls
)
All P
rodu
cts
(mill
ion
BO
E)
New Zealand
Taranaki Basin 0.0 0.0 0.0 0.6 0.6 0.0 0.0 0.0 0.0 0.0 0.0 0.0 0.0 0.6 0.6
South East Australia
Bass Basin 23.6 66.9 0.8 0.0 5.5 1.5 6.6 0.0 0.1 0.4 25.2 73.4 0.8 0.1 5.9
Otway Basin 5.4 0.0 0.0 0.0 0.9 19.8 0.0 0.0 0.0 3.3 25.2 0.0 0.0 0.0 4.2
Western Australia
Offshore Perth Basin 0.0 0.0 0.0 0.0 0.0 0.0 0.0 0.0 0.0 0.0 0.0 0.0 0.0 0.0 0.0
Onshore Perth Basin 78.8 0.0 0.0 0.0 13.2 22.7 0.0 0.0 0.0 3.8 101.6 0.0 0.0 0.0 17.0
United States of America
Sugarloaf AMI 0.0 0.0 0.0 0.0 0.0 0.0 0.0 0.0 0.0 0.0 0.0 0.0 0.0 0.0 0.0
Indonesia
Ande Ande Lumut 0.0 0.0 0.0 0.0 0.0 0.0 0.0 0.0 16.7 16.7 0.0 0.0 0.0 16.7 16.7
AWE Aggregated 107.8 66.9 0.8 0.6 20.2 44.1 6.6 0.1 16.8 24.2 151.9 73.4 0.9 17.4 44.4
Geographical Area Proved (2P) Reserves at Evaluation Date 30 June 2016
Developed Undeveloped Total
Sale
s G
as (P
J)
LPG
(K to
nnes
)
Con
dens
ate
(mill
ion
bbls
)
Oil
(mill
ion
bbls
)
All P
rodu
cts
(mill
ion
BO
E)
Sale
s G
as (P
J)
LPG
(K to
nnes
)
Con
dens
ate
(mill
ion
bbls
)
Oil
(mill
ion
bbls
)
All P
rodu
cts
(mill
ion
BO
E)
Sale
s G
as (P
J)
LPG
(K to
nnes
)
Con
dens
ate
(mill
ion
bbls
)
Oil
(mill
ion
bbls
)
All P
rodu
cts
(mill
ion
BO
E)
New Zealand
Taranaki Basin 0.0 0.0 0.0 1.1 1.1 0.0 0.0 0.0 0.0 0.0 0.0 0.0 0.0 1.1 1.1
South East Australia
Bass Basin 29.6 83.6 1.0 0.0 6.9 2.0 7.9 0.0 0.1 0.6 31.5 91.5 1.0 0.1 7.4
Otway Basin 10.4 0.0 0.0 0.0 1.7 26.6 0.0 0.0 0.0 4.4 37.0 0.0 0.0 0.0 6.2
Western Australia
Offshore Perth Basin 0.0 0.0 0.0 0.0 0.0 0.0 0.0 0.0 0.0 0.0 0.0 0.0 0.0 0.0 0.0
Onshore Perth Basin 152.0 0.0 0.1 0.0 25.4 37.9 0.0 0.0 0.0 6.3 189.8 0.0 0.1 0.0 31.7
United States of America
Sugarloaf AMI 0.0 0.0 0.0 0.0 0.0 0.0 0.0 0.0 0.0 0.0 0.0 0.0 0.0 0.0 0.0
Indonesia
Ande Ande Lumut 0.0 0.0 0.0 0.0 0.0 0.0 0.0 0.0 24.6 24.6 0.0 0.0 0.0 24.6 24.6
AWE Aggregated 192.0 83.6 1.1 1.1 35.1 66.4 7.9 0.1 24.6 35.9 258.4 91.5 1.1 25.8 71.0
H O M E F I N A N C I A L S
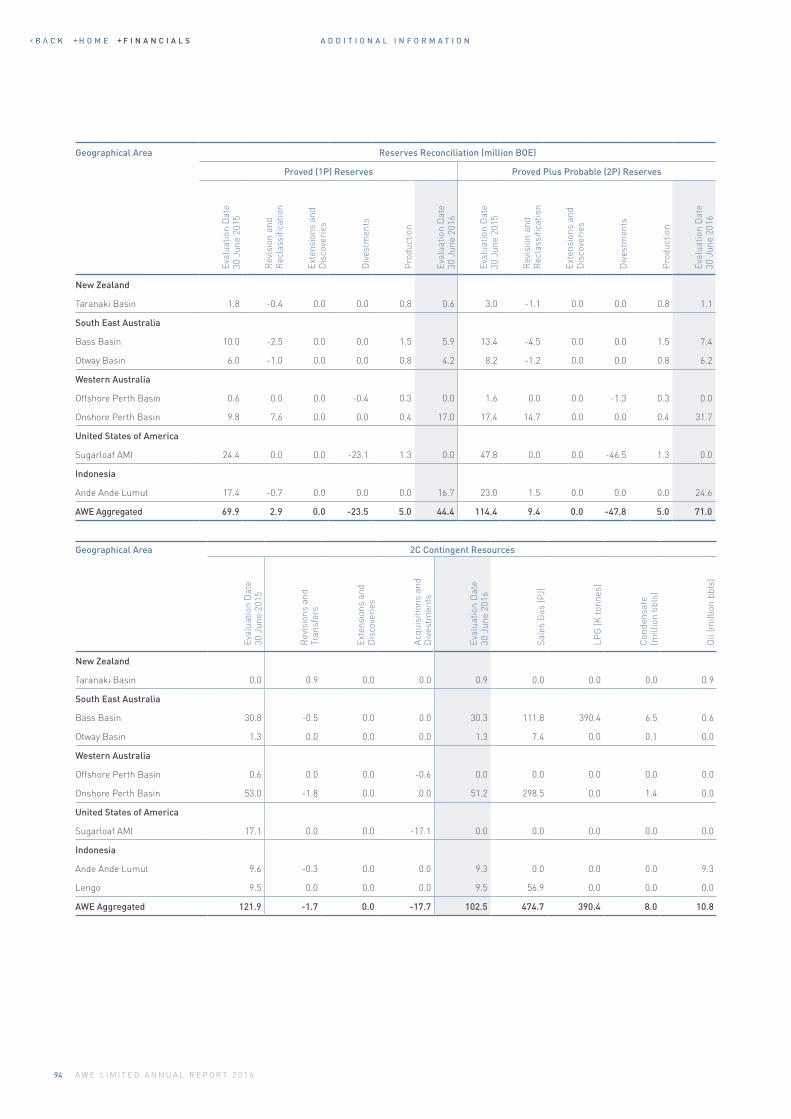
94 A W E L I M I T E D A N N U A L R E P O R T 2 0 1 6
A D D I T I O N A L I N F O R M A T I O N
Geographical Area Reserves Reconciliation (million BOE)
Proved (1P) Reserves Proved Plus Probable (2P) Reserves
Eval
uatio
n D
ate
30
Jun
e 20
15
Rev
isio
n an
d R
ecla
ssifi
catio
n
Exte
nsio
ns a
nd
Dis
cove
ries
Div
estm
ents
Pro
duct
ion
Eval
uatio
n D
ate
30
Jun
e 20
16
Eval
uatio
n D
ate
30
Jun
e 20
15
Rev
isio
n an
d R
ecla
ssifi
catio
n
Exte
nsio
ns a
nd
Dis
cove
ries
Div
estm
ents
Pro
duct
ion
Eval
uatio
n D
ate
30
Jun
e 20
16
New Zealand
Taranaki Basin 1.8 -0.4 0.0 0.0 0.8 0.6 3.0 -1.1 0.0 0.0 0.8 1.1
South East Australia
Bass Basin 10.0 -2.5 0.0 0.0 1.5 5.9 13.4 -4.5 0.0 0.0 1.5 7.4
Otway Basin 6.0 -1.0 0.0 0.0 0.8 4.2 8.2 -1.2 0.0 0.0 0.8 6.2
Western Australia
Offshore Perth Basin 0.6 0.0 0.0 -0.4 0.3 0.0 1.6 0.0 0.0 -1.3 0.3 0.0
Onshore Perth Basin 9.8 7.6 0.0 0.0 0.4 17.0 17.4 14.7 0.0 0.0 0.4 31.7
United States of America
Sugarloaf AMI 24.4 0.0 0.0 -23.1 1.3 0.0 47.8 0.0 0.0 -46.5 1.3 0.0
Indonesia
Ande Ande Lumut 17.4 -0.7 0.0 0.0 0.0 16.7 23.0 1.5 0.0 0.0 0.0 24.6
AWE Aggregated 69.9 2.9 0.0 -23.5 5.0 44.4 114.4 9.4 0.0 -47.8 5.0 71.0
Geographical Area 2C Contingent Resources
Eval
uatio
n D
ate
30
Jun
e 20
15
Rev
isio
ns a
nd
Tran
sfer
s
Exte
nsio
ns a
nd
Dis
cove
ries
Acqu
isiti
ons
and
Div
estm
ents
Eval
uatio
n D
ate
30
Jun
e 20
16
Sale
s G
as (P
J)
LPG
(K to
nnes
)
Con
dens
ate
(m
illio
n bb
ls)
Oil
(mill
ion
bbls
)
New Zealand
Taranaki Basin 0.0 0.9 0.0 0.0 0.9 0.0 0.0 0.0 0.9
South East Australia
Bass Basin 30.8 -0.5 0.0 0.0 30.3 111.8 390.4 6.5 0.6
Otway Basin 1.3 0.0 0.0 0.0 1.3 7.4 0.0 0.1 0.0
Western Australia
Offshore Perth Basin 0.6 0.0 0.0 -0.6 0.0 0.0 0.0 0.0 0.0
Onshore Perth Basin 53.0 -1.8 0.0 0.0 51.2 298.5 0.0 1.4 0.0
United States of America
Sugarloaf AMI 17.1 0.0 0.0 -17.1 0.0 0.0 0.0 0.0 0.0
Indonesia
Ande Ande Lumut 9.6 -0.3 0.0 0.0 9.3 0.0 0.0 0.0 9.3
Lengo 9.5 0.0 0.0 0.0 9.5 56.9 0.0 0.0 0.0
AWE Aggregated 121.9 -1.7 0.0 -17.7 102.5 474.7 390.4 8.0 10.8
H O M E F I N A N C I A L S
95A W E L I M I T E D A N N U A L R E P O R T 2 0 1 6
A D D I T I O N A L I N F O R M A T I O N
Notes:i. This reserves and contingent resource report is based on and
fairly represents information and supporting documentation prepared by and under the supervision of qualified petroleum reserves and resource evaluator Dr. Suzanne Hunt, AWE General Manager for WA Assets and Engineering, and Mr. Andrew Furniss, AWE General Manager for Exploration and Geoscience. Dr. Hunt, a Petroleum Engineer with a Ph.D. in Geomechanics, is a member of the Society of Petroleum Engineer Engineers and has over 19 years’ experience in the petroleum sector in geoscience, field development planning, reserves estimation, production and facilities engineering. Mr. Furniss, a member of the Society of Petroleum Engineers and the American Association of Petroleum Geologists, holds an MSc in Exploration Geophysics and a BSc (Hons) in Geological Sciences and has over 25 years’ of industry experience in strategic planning, portfolio management, prospect evaluation, technical due diligence and peer review, reserves and resource assessment, the application of advanced geophysical technology and business development. This report is issued with the prior written consent of Dr. Hunt and Mr Furniss as to the form and context in which the estimated petroleum reserves and contingent resources and supporting information are presented.
ii. AWE estimated the 30 June 2016 reserves and contingent resources in accordance with the following:
+ SPE/AAPG/WPC/SPEE Petroleum Resources Management System guidelines of November 2011;
+ SPEE Monograph 3 “Guideline for the Practical Evaluation of Undeveloped Reserves in Resource Plays”;
+ ASX Disclosure rules for Oil and Gas Entities, Chapter 5, July 2014;
+ ASX Listing Rules Guidance Note 32, July 2014.
iii. To ensure accuracy and compliance of reserves and resource estimations, AWE has put in place a robust process which incorporates the following governance arrangements and internal controls:
+ The reserves and contingent resource estimates are prepared by Asset Managers;
+ All material changes in reserves and contingent resources are presented to the AWE Reserves Committee. Governed by the AWE Reserves Committee Charter, which is formally reviewed and adopted by the Board, the AWE Reserves Committee reviews and endorses reserves and contingent resource proposals by the Technical Reserves Review Panel. The Committee meets as a minimum every six months or when any material changes trigger an ASX announcement based on the continuous disclosure requirements. An independent non-executive director, who is a member of the AWE Audit and Governance Committee and who has an extensive international experience in petroleum geoscience, attends the AWE Reserves Committee in an Observer capacity only. Any material changes to previously publicly reported reserves endorsed by the AWE Reserves Committee will be immediately reported to the Managing Director for consideration for disclosure to ASX under the continuous disclosure requirements of the ASX Listing Rules.
+ The endorsed reserves and contingent resource evaluations are reported to the AWE Audit and Governance Committee and form an integral part of the half-year and annual financial reporting.
+ The AWE practice is to initiate independent audits for those assets with significant reserves and/or resource potential on a semi-regular basis, typically at least once every two years subject to the materiality of the asset, complexity of the field and amount of new data that has become available. The purpose is to ensure that AWE reserve and resource assessments receive external and independent challenge with respect to methodology, technical validity and commercial rigour.
iv. The company intends to develop undeveloped petroleum reserves in material oil and gas projects. AWE actively supports the required engineering and commercial work to achieve final investment decisions for material undeveloped reserves in Bass Basin, Otway Basin, North Perth Basin and North West Natuna PSC.
v. AWE applied deterministic method for reserves and contingent resource estimation for all assets.
vi. The reserves were estimated at the lowest aggregation level (reservoir) and aggregated to field, asset, basin and company levels. Due to the portfolio effects of the arithmetic summation, 1P reserves volumes may be a very conservative estimate, whereas 3P reserves volumes may be very optimistic.
vii. Estimated contingent resources are un-risked and it is not certain that these resources will be commercially viable to produce.
viii. Any material concentrations of undeveloped petroleum reserves that remain undeveloped for more than 5 years:
a. are intended to be developed when required to meet contractual obligation; and
b. have note been developed to date because they have not yet been required to meet contractual obligations.
ix. Unless otherwise stated, all references to the quantities of petroleum reserves and contingent resources are AWE net share.
x. Conversion factors used:
+ Sales Gas: 6 PJ = 1 million BOE + LPG: 1 tonne =11.6 BOE + Oil: 1 barrel =1 BOE
+ Condensate: 1 barrel =1 BOE
Summary of Notable Changes + Taranaki Basin
Reduced economic field life of Tui due to downward revisions to corporate oil price forecasts.
+ Bass Basin Reduction of reserves and resources following the drilling of Yolla-5 and Yolla-6. Refer ASX announcement dated 15 August 2016.
+ Otway Basin Net write down of reserves and resources due to history matching of material balance models.
+ Offshore Perth Basin The divestment of the Cliff Head oil field was completed on 30 June, 2016 with an effective date of 1 January, 2016.
+ Onshore Perth Basin The upgrade of Waitsia reserves and resources in June, 2016 due to an evaluation of new core data. Additionally, further development progress has resulted in some transferal of volumes between categories.
+ Sugarloaf AMI The divestment of the asset was completed on 17 March, 2016 with an effective date of 1 January, 2016.
+ Lengo An agreement has been entered to divest this asset subject to the approval of the Indonesian government. The effective date of this transaction would be 1 April, 2016.
H O M E F I N A N C I A L S
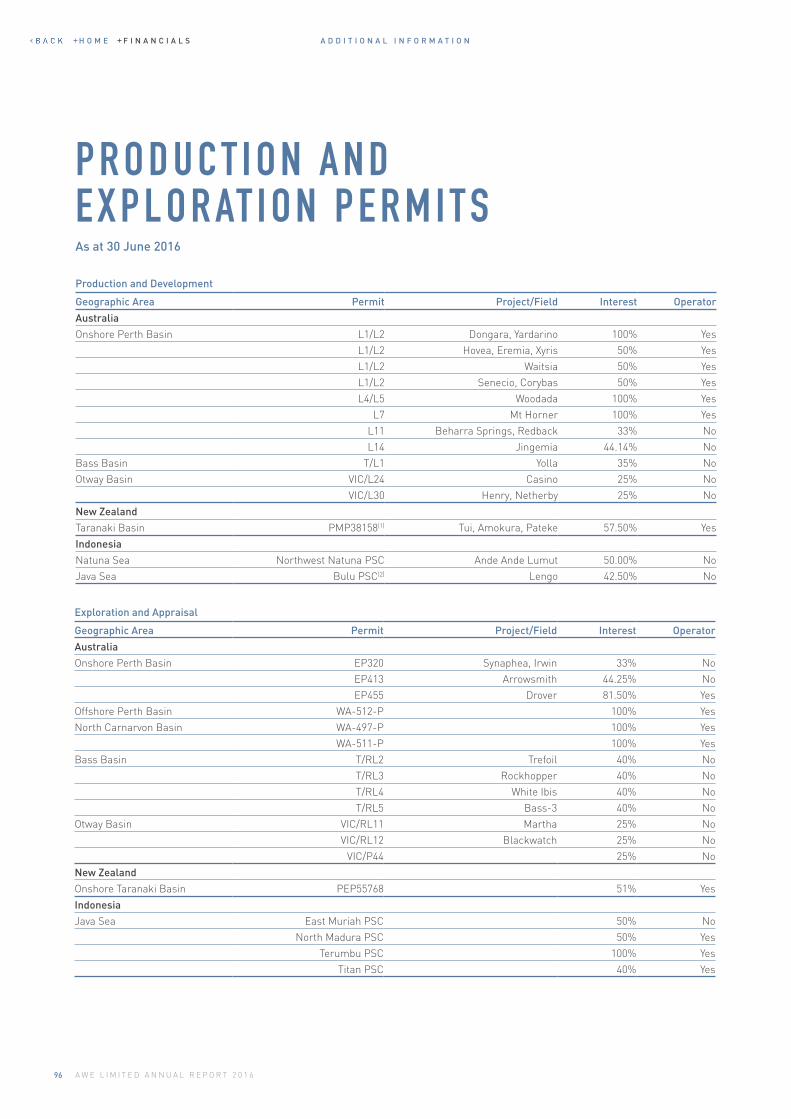
96 A W E L I M I T E D A N N U A L R E P O R T 2 0 1 6
A D D I T I O N A L I N F O R M A T I O N
Production and Development
Geographic Area Permit Project/Field Interest Operator
Australia
Onshore Perth Basin L1/L2 Dongara, Yardarino 100% Yes
L1/L2 Hovea, Eremia, Xyris 50% Yes
L1/L2 Waitsia 50% Yes
L1/L2 Senecio, Corybas 50% Yes
L4/L5 Woodada 100% Yes
L7 Mt Horner 100% Yes
L11 Beharra Springs, Redback 33% No
L14 Jingemia 44.14% No
Bass Basin T/L1 Yolla 35% No
Otway Basin VIC/L24 Casino 25% No
VIC/L30 Henry, Netherby 25% No
New Zealand
Taranaki Basin PMP38158(1) Tui, Amokura, Pateke 57.50% Yes
Indonesia
Natuna Sea Northwest Natuna PSC Ande Ande Lumut 50.00% No
Java Sea Bulu PSC(2) Lengo 42.50% No
Exploration and Appraisal
Geographic Area Permit Project/Field Interest Operator
Australia
Onshore Perth Basin EP320 Synaphea, Irwin 33% No
EP413 Arrowsmith 44.25% No
EP455 Drover 81.50% Yes
Offshore Perth Basin WA-512-P 100% Yes
North Carnarvon Basin WA-497-P 100% Yes
WA-511-P 100% Yes
Bass Basin T/RL2 Trefoil 40% No
T/RL3 Rockhopper 40% No
T/RL4 White Ibis 40% No
T/RL5 Bass-3 40% No
Otway Basin VIC/RL11 Martha 25% No
VIC/RL12 Blackwatch 25% No
VIC/P44 25% No
New Zealand
Onshore Taranaki Basin PEP55768 51% Yes
Indonesia
Java Sea East Muriah PSC 50% No
North Madura PSC 50% Yes
Terumbu PSC 100% Yes
Titan PSC 40% Yes
P R O D U C T I O N A N D E X P L O R AT I O N P E R M I T SAs at 30 June 2016
H O M E F I N A N C I A L S
97A W E L I M I T E D A N N U A L R E P O R T 2 0 1 6
A D D I T I O N A L I N F O R M A T I O N
Notes:1. Subject to a Net Cash interest payable to the previous owners of
a subsidiary of the company (AWE Taranaki Limited, previously New Zealand Overseas Petroleum Limited), if returns from the Tui Area oil project in PMP38158 exceed certain benchmark levels.
2. Asset sold, subject to government approval3. The company is also entitled to a Net Profits Royalty at rates
varying from 7.5% to 8.3% from the Tintaburra field in ATP299P. This royalty will be received when gross revenues from the permit exceed the sum of total expenditure from the permit.
Summary of Notable ChangesOn 20 June, 2016, AWE entered into an agreement to sell its 57.5% working interest in the Cliff Head oil project to Triangle Energy for A$3.2 million with an additional royalty of US$5/bbl receivable by AWE for oil sales in excess of US$70/bbl. The transaction was completed on 30 June, 2016 with an effective date of 1 January, 2016.
The T/18P Exploration License was relinquished in August 2015, following the approval of four retention license applications for the Trefoil, Rockhopper, White Ibis and Bass-3 fields; T/R L2, T/R L3, T/R L4, T/R L5.
On 27 January, 2016, AWE entered into an agreement to sell its 10% working interest in the Sugarloaf AMI to Carrier Energy Partners II, LLC for US$190 million. The transaction was completed on the 17 March, 2016 with an effective date of 1 January, 2016.
On 5 May, 2016, AWE entered into an agreement to sell its 42.5% interest in the Bulu PSC, including the undeveloped Lengo gas project, to a subsidiary of HyOil Pte Ltd for up to A$27.5 million cash. The effective date is 1 April 2016 and the transaction is subject to the approval of the Indonesian government.
Block 09/05 PSC, in the Bohai basin, was relinquished during the first quarter of 2016 following the unsuccessful drilling campaigns during 2014 and 2015.
H O M E F I N A N C I A L S
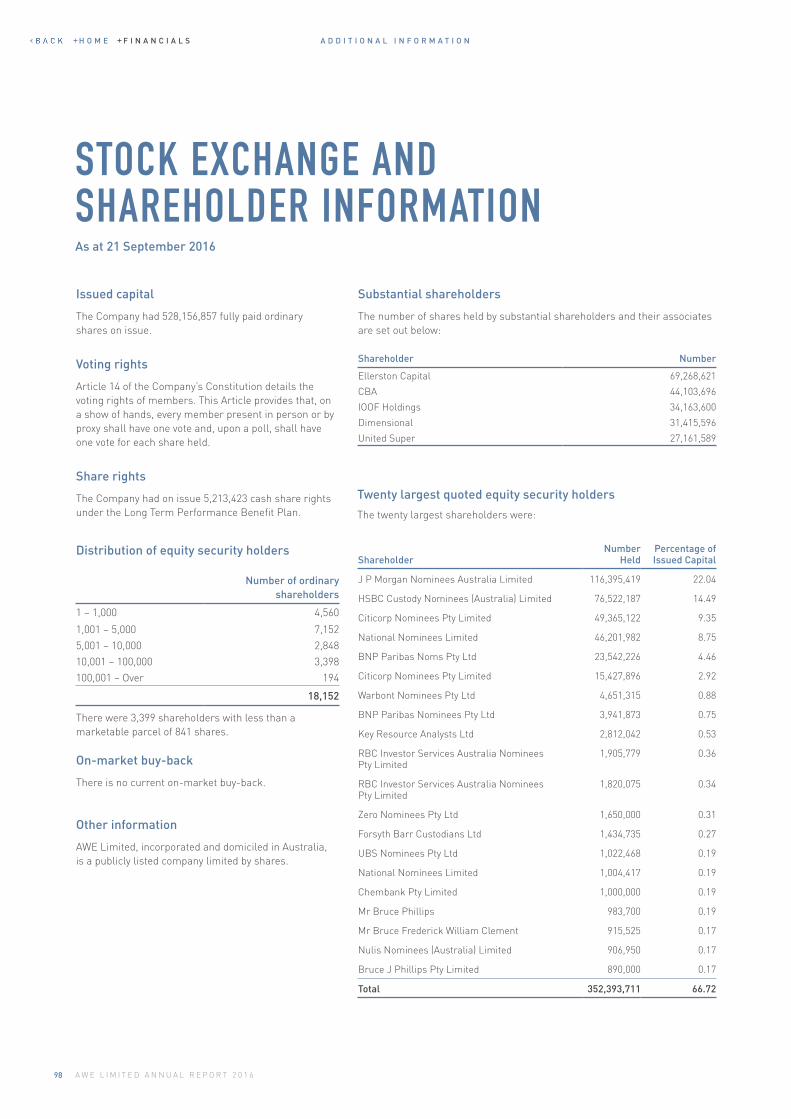
98 A W E L I M I T E D A N N U A L R E P O R T 2 0 1 6
A D D I T I O N A L I N F O R M A T I O N
STOCK EXCHANGE AND SHAREHOLDER INFORMATIONAs at 21 September 2016
Issued capital
The Company had 528,156,857 fully paid ordinary shares on issue.
Voting rights
Article 14 of the Company’s Constitution details the voting rights of members. This Article provides that, on a show of hands, every member present in person or by proxy shall have one vote and, upon a poll, shall have one vote for each share held.
Share rights
The Company had on issue 5,213,423 cash share rights under the Long Term Performance Benefit Plan.
Distribution of equity security holders
Number of ordinary shareholders
1 – 1,000 4,560
1,001 – 5,000 7,152
5,001 – 10,000 2,848
10,001 – 100,000 3,398
100,001 – Over 194
18,152
There were 3,399 shareholders with less than a marketable parcel of 841 shares.
On-market buy-back
There is no current on-market buy-back.
Other information
AWE Limited, incorporated and domiciled in Australia, is a publicly listed company limited by shares.
Twenty largest quoted equity security holders
The twenty largest shareholders were:
Shareholder Number
Ellerston Capital 69,268,621
CBA 44,103,696
IOOF Holdings 34,163,600
Dimensional 31,415,596
United Super 27,161,589
Substantial shareholders
The number of shares held by substantial shareholders and their associates are set out below:
Shareholder Number
HeldPercentage of Issued Capital
J P Morgan Nominees Australia Limited 116,395,419 22.04
HSBC Custody Nominees (Australia) Limited 76,522,187 14.49
Citicorp Nominees Pty Limited 49,365,122 9.35
National Nominees Limited 46,201,982 8.75
BNP Paribas Noms Pty Ltd 23,542,226 4.46
Citicorp Nominees Pty Limited 15,427,896 2.92
Warbont Nominees Pty Ltd 4,651,315 0.88
BNP Paribas Nominees Pty Ltd 3,941,873 0.75
Key Resource Analysts Ltd 2,812,042 0.53
RBC Investor Services Australia Nominees Pty Limited
1,905,779 0.36
RBC Investor Services Australia Nominees Pty Limited
1,820,075 0.34
Zero Nominees Pty Ltd 1,650,000 0.31
Forsyth Barr Custodians Ltd 1,434,735 0.27
UBS Nominees Pty Ltd 1,022,468 0.19
National Nominees Limited 1,004,417 0.19
Chembank Pty Limited 1,000,000 0.19
Mr Bruce Phillips 983,700 0.19
Mr Bruce Frederick William Clement 915,525 0.17
Nulis Nominees (Australia) Limited 906,950 0.17
Bruce J Phillips Pty Limited 890,000 0.17
Total 352,393,711 66.72
H O M E F I N A N C I A L S
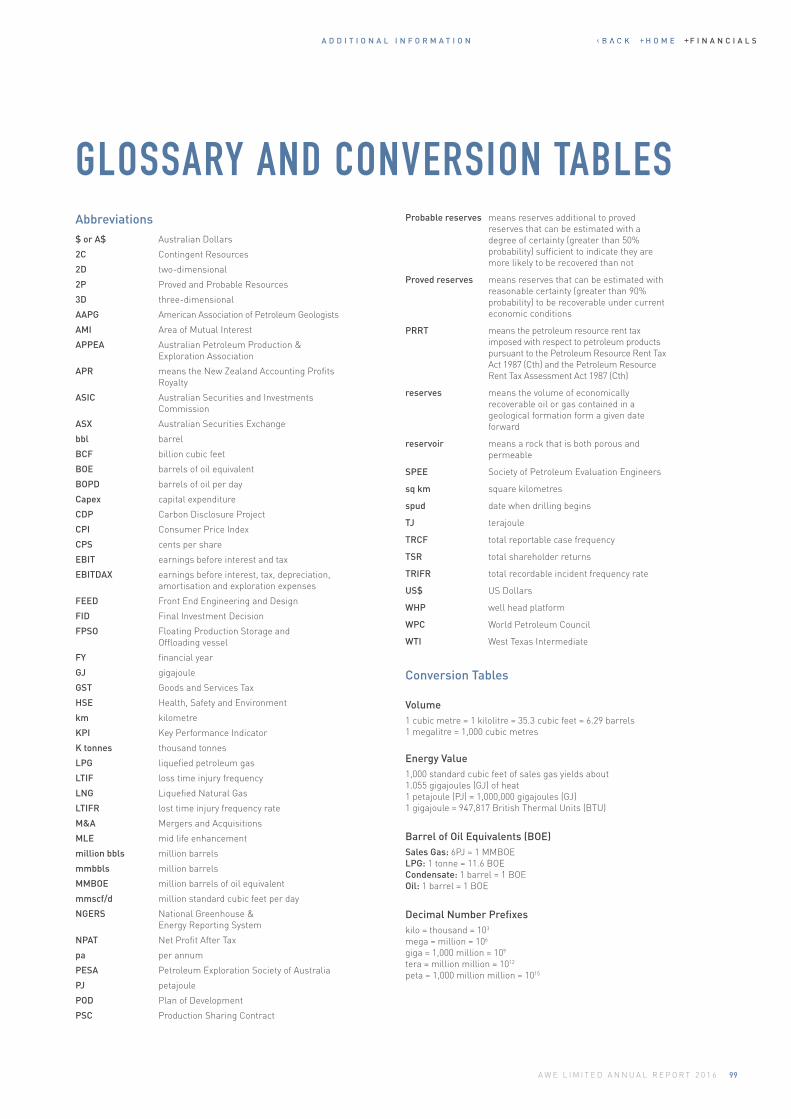
99A W E L I M I T E D A N N U A L R E P O R T 2 0 1 6
GLOSSARY AND CONVERSION TABLESAbbreviations $ or A$ Australian Dollars
2C Contingent Resources
2D two-dimensional
2P Proved and Probable Resources
3D three-dimensional
AAPG American Association of Petroleum Geologists
AMI Area of Mutual Interest
APPEA Australian Petroleum Production & Exploration Association
APR means the New Zealand Accounting Profits Royalty
ASIC Australian Securities and Investments Commission
ASX Australian Securities Exchange
bbl barrel
BCF billion cubic feet
BOE barrels of oil equivalent
BOPD barrels of oil per day
Capex capital expenditure
CDP Carbon Disclosure Project
CPI Consumer Price Index
CPS cents per share
EBIT earnings before interest and tax
EBITDAX earnings before interest, tax, depreciation, amortisation and exploration expenses
FEED Front End Engineering and Design
FID Final Investment Decision
FPSO Floating Production Storage and Offloading vessel
FY financial year
GJ gigajoule
GST Goods and Services Tax
HSE Health, Safety and Environment
km kilometre
KPI Key Performance Indicator
K tonnes thousand tonnes
LPG liquefied petroleum gas
LTIF loss time injury frequency
LNG Liquefied Natural Gas
LTIFR lost time injury frequency rate
M&A Mergers and Acquisitions
MLE mid life enhancement
million bbls million barrels
mmbbls million barrels
MMBOE million barrels of oil equivalent
mmscf/d million standard cubic feet per day
NGERS National Greenhouse & Energy Reporting System
NPAT Net Profit After Tax
pa per annum
PESA Petroleum Exploration Society of Australia
PJ petajoule
POD Plan of Development
PSC Production Sharing Contract
Probable reserves means reserves additional to proved reserves that can be estimated with a degree of certainty (greater than 50% probability) sufficient to indicate they are more likely to be recovered than not
Proved reserves means reserves that can be estimated with reasonable certainty (greater than 90% probability) to be recoverable under current economic conditions
PRRT means the petroleum resource rent tax imposed with respect to petroleum products pursuant to the Petroleum Resource Rent Tax Act 1987 (Cth) and the Petroleum Resource Rent Tax Assessment Act 1987 (Cth)
reserves means the volume of economically recoverable oil or gas contained in a geological formation form a given date forward
reservoir means a rock that is both porous and permeable
SPEE Society of Petroleum Evaluation Engineers
sq km square kilometres
spud date when drilling begins
TJ terajoule
TRCF total reportable case frequency
TSR total shareholder returns
TRIFR total recordable incident frequency rate
US$ US Dollars
WHP well head platform
WPC World Petroleum Council
WTI West Texas Intermediate
Conversion Tables
Volume1 cubic metre = 1 kilolitre = 35.3 cubic feet = 6.29 barrels1 megalitre = 1,000 cubic metres
Energy Value1,000 standard cubic feet of sales gas yields about 1.055 gigajoules (GJ) of heat 1 petajoule (PJ) = 1,000,000 gigajoules (GJ) 1 gigajoule = 947,817 British Thermal Units (BTU)
Barrel of Oil Equivalents (BOE)Sales Gas: 6PJ = 1 MMBOE LPG: 1 tonne = 11.6 BOE Condensate: 1 barrel = 1 BOE Oil: 1 barrel = 1 BOE
Decimal Number Prefixeskilo = thousand = 103
mega = million = 106 giga = 1,000 million = 109 tera = million million = 1012 peta = 1,000 million million = 1015
A D D I T I O N A L I N F O R M A T I O N H O M E F I N A N C I A L S
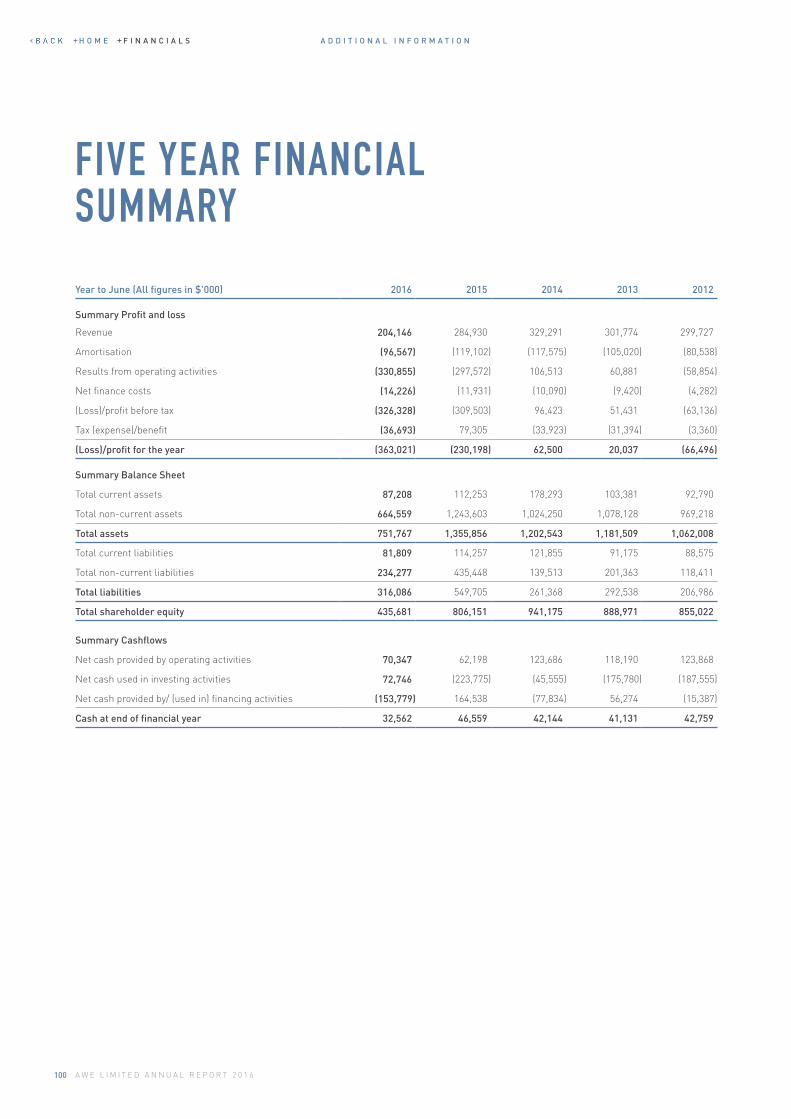
100 A W E L I M I T E D A N N U A L R E P O R T 2 0 1 6
A D D I T I O N A L I N F O R M A T I O N
FIVE YEAR FINANCIAL SUMMARY
Year to June (All figures in $'000) 2016 2015 2014 2013 2012
Summary Profit and loss
Revenue 204,146 284,930 329,291 301,774 299,727
Amortisation (96,567) (119,102) (117,575) (105,020) (80,538)
Results from operating activities (330,855) (297,572) 106,513 60,881 (58,854)
Net finance costs (14,226) (11,931) (10,090) (9,420) (4,282)
(Loss)/profit before tax (326,328) (309,503) 96,423 51,431 (63,136)
Tax (expense)/benefit (36,693) 79,305 (33,923) (31,394) (3,360)
(Loss)/profit for the year (363,021) (230,198) 62,500 20,037 (66,496)
Summary Balance Sheet
Total current assets 87,208 112,253 178,293 103,381 92,790
Total non-current assets 664,559 1,243,603 1,024,250 1,078,128 969,218
Total assets 751,767 1,355,856 1,202,543 1,181,509 1,062,008
Total current liabilities 81,809 114,257 121,855 91,175 88,575
Total non-current liabilities 234,277 435,448 139,513 201,363 118,411
Total liabilities 316,086 549,705 261,368 292,538 206,986
Total shareholder equity 435,681 806,151 941,175 888,971 855,022
Summary Cashflows
Net cash provided by operating activities 70,347 62,198 123,686 118,190 123,868
Net cash used in investing activities 72,746 (223,775) (45,555) (175,780) (187,555)
Net cash provided by/ (used in) financing activities (153,779) 164,538 (77,834) 56,274 (15,387)
Cash at end of financial year 32,562 46,559 42,144 41,131 42,759
H O M E F I N A N C I A L S
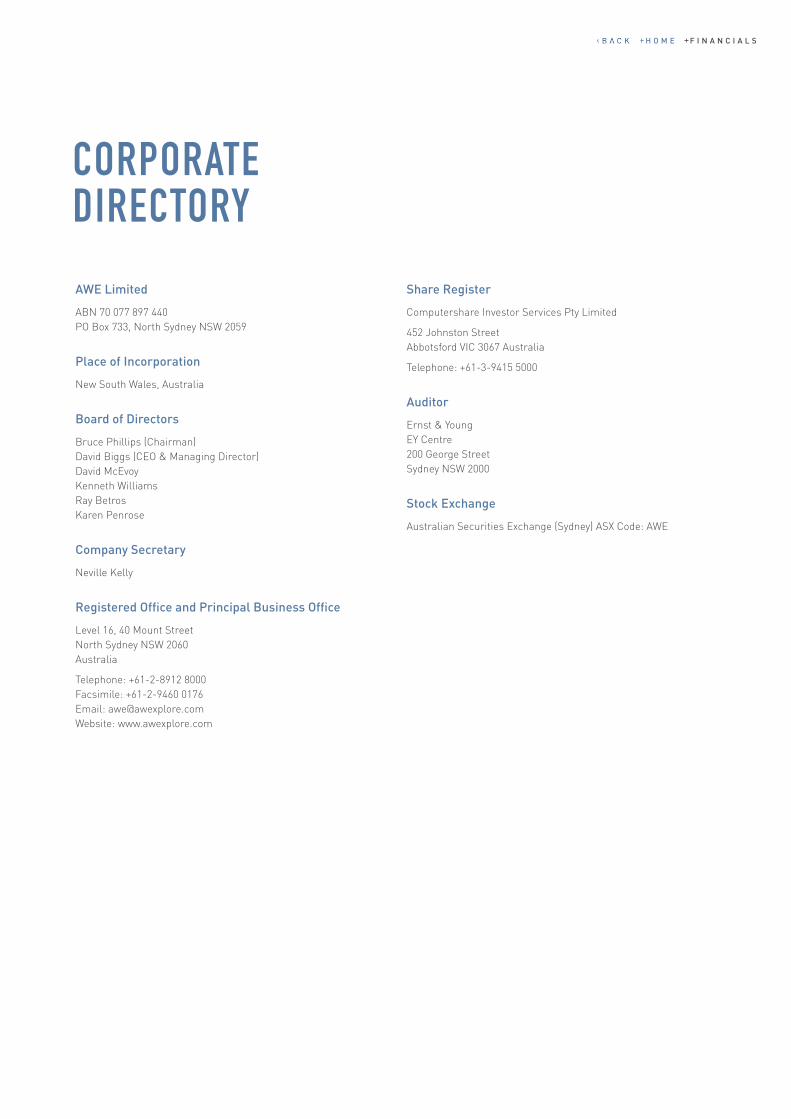
CORPORATE DIRECTORY
AWE Limited
ABN 70 077 897 440 PO Box 733, North Sydney NSW 2059
Place of Incorporation
New South Wales, Australia
Board of Directors
Bruce Phillips (Chairman) David Biggs (CEO & Managing Director) David McEvoy Kenneth Williams Ray Betros Karen Penrose
Company Secretary
Neville Kelly
Registered Office and Principal Business Office
Level 16, 40 Mount Street North Sydney NSW 2060 Australia
Telephone: +61-2-8912 8000 Facsimile: +61-2-9460 0176 Email: [email protected] Website: www.awexplore.com
Share Register
Computershare Investor Services Pty Limited
452 Johnston Street Abbotsford VIC 3067 Australia
Telephone: +61-3-9415 5000
Auditor
Ernst & Young EY Centre 200 George Street Sydney NSW 2000
Stock Exchange
Australian Securities Exchange (Sydney) ASX Code: AWE
H O M E F I N A N C I A L S

AWEXPLORE.COM