Embed Size (px)
Citation preview

Contents lists available at ScienceDirect
Neurobiology of Disease
journal homepage: www.elsevier.com/locate/ynbdi
Abnormal hippocampal theta and gamma hypersynchrony producesnetwork and spike timing disturbances in the Fmr1-KO mouse model ofFragile X syndrome
Tara Arbaba,b,c,⁎, Francesco P. Battagliaa,d, Cyriel M.A. Pennartza,e,1, Conrado A. Bosmana,e,⁎⁎,1
a Cognitive & Systems Neuroscience, Swammerdam Institute, Center for Neuroscience, Faculty of Science, University of Amsterdam, Sciencepark 904, 1098 XH Amsterdam,The NetherlandsbNetherlands Institute for Neuroscience, Institute of the Royal Netherlands Academy of Arts and Sciences, Meibergdreef 47, 1105 BA Amsterdam, The Netherlandsc Department of Psychiatry, Academic Medical Center, University of Amsterdam, Postal Box 22660, 1100 DD Amsterdam, The Netherlandsd Donders Institute for Brain, Cognition, and Behaviour, Radboud Universiteit Nijmegen, Heyendaalseweg 135, 6525 AJ Nijmegen, The Netherlandse Research Priority Program Brain and Cognition, University of Amsterdam, Postal Box 94216, 1090 GE Amsterdam, The Netherlands
A R T I C L E I N F O
Keywords:Fragile X syndromeHippocampusNeuronal network activitySpike-field coherenceGamma oscillationsTheta oscillations
A B S T R A C T
Neuronal networks can synchronize their activity through excitatory and inhibitory connections, which isconducive to synaptic plasticity. This synchronization is reflected in rhythmic fluctuations of the extracellularfield. In the hippocampus, theta and gamma band LFP oscillations are a hallmark of the processing of spatialinformation and memory. Fragile X syndrome (FXS) is an intellectual disability and the most common geneticcause of autism spectrum disorder (Belmonte and Bourgeron, 2006).
Here, we investigated how neuronal network synchronization in the mouse hippocampus is compromised bythe Fmr1 mutation that causes FXS (Santos et al., 2014), relating recently observed single-cell level impairments(Arbab et al., 2017) to neuronal network aberrations. We implanted tetrodes in hippocampus of freely movingFmr1-KO and littermate wildtype (WT) mice (Mientjes et al., 2006), to record spike trains from multiple, isolatedneurons as well as LFPs in a spatial exploration paradigm.
Compared to wild type mice, Fmr1-KO mice displayed greater power of hippocampal theta oscillations, andhigher coherence in the slow gamma band. Additionally, spike trains of Fmr1-KO interneurons show decreasedspike-count correlations and they are hypersynchronized with theta and slow gamma oscillations. The hy-persynchronization of Fmr1-KO oscillations and spike timing reflects functional deficits in local networks. Thisnetwork hypersynchronization pathologically decreases the heterogeneity of spike-LFP phase coupling, com-promising information processing within the hippocampal circuit. These findings may reflect a pathophysiolo-gical mechanism explaining cognitive impairments in FXS and autism, in which there is anomalous processing ofsocial and environmental cues and associated deficits in memory and cognition.
1. Introduction
Fragile X syndrome (FXS) is a monogenic intellectual disability thatshows behavioral overlap with autism spectrum disorder (ASD)(Belmonte and Bourgeron, 2006), accounting for an estimated 5% of itsprevalence (Budimirovic and Kaufmann, 2011). FXS arises from a tri-plet expansion of the Fmr1 gene, silencing expression of the fragile Xmental retardation protein (FMRP). FMRP binds mRNAs encoding ap-proximately one third of pre- and postsynaptic proteins, most
significantly targeting those involved in synaptic signaling pathwaysinvolved in long-term potentiation (LTP) and depression (LTD), CREBsignaling, glutamate receptor regulation, and GABA receptor mediatedinhibition (Darnell et al., 2011; Bhakar et al., 2012). FMRP silencingeffectively leads to disturbed synaptic function and plasticity of bothinterneurons and pyramidal cells (Santos et al., 2014; Pilpel et al.,2009).
FXS is a promising target for obtaining a multi-dimensional under-standing from genes, to microcircuits and networks, to cognitive
https://doi.org/10.1016/j.nbd.2018.02.011Received 22 November 2017; Received in revised form 12 February 2018; Accepted 21 February 2018
⁎ Correspondence to: T. Arbab, Netherlands Institute for Neuroscience, Institute of the Royal Netherlands Academy of Arts and Sciences, Meibergdreef 47, 1105 BA Amsterdam, TheNetherlands.
⁎⁎ Correspondence to: C.A. Bosman, Research Priority Program Brain and Cognition, University of Amsterdam, Postal Box 94216, 1090 GE Amsterdam, The Netherlands.
1 These authors contributed equally to this manuscript.E-mail addresses: [email protected] (T. Arbab), [email protected] (C.A. Bosman).
Neurobiology of Disease 114 (2018) 65–73
Available online 24 February 20180969-9961/ © 2018 The Authors. Published by Elsevier Inc. This is an open access article under the CC BY-NC-ND license (http://creativecommons.org/licenses/BY-NC-ND/4.0/).
T

impairment in neuropsychiatric disease due to its relatively simplegenetic etiology (Fung and Reiss, 2016) and the development of rodentmodels (Mientjes et al., 2006; Berzhanskaya et al., 2017). Particularlyaffected in human patients and animal models is the hippocampus(Kates et al., 1997; Reiss et al., 1994), a structure essential for storingand consolidating experiences into long-term episodic and semanticmemory.
Both animal (Kim and Fanselow, 1992; Morris et al., 1982) andhuman (Manns et al., 2003; Moscovitch et al., 2016) studies link thehippocampus to spatial, contextual, autobiographical and semanticmemory. Single hippocampal neurons respond to the concept of givenindividuals, landmarks or objects (Quiroga et al., 2005). In FXS animalmodels, learning and memory deficits have been associated with dys-function of the mechanisms underlying activity-dependent synapticplasticity in the hippocampus (Bhakar et al., 2012; Huber et al., 2002).
Synaptic plasticity strongly depends on the precise temporal co-ordination of neuronal activity (Markram et al., 1997). This temporalcoordination of neuronal activity is reflected in rhythmic oscillations ofthe local field potential (LFP) (Buzsáki et al., 2012). Neuronal oscilla-tions have been associated with several cognitive and mechanisticprocesses through the brain, including neuronal communication andprecise spike timing of activated neuronal groups (Bosman et al., 2014;Fries, 2015; Sejnowski and Paulsen, 2006). Hippocampal theta (4–8 Hz)chunks this experiential information in oscillation cycles (Skaggs andMcNaughton, 1996; Gupta et al., 2012), and theta-nested gamma(20–100 Hz) oscillations induce synaptic plasticity, supporting memoryconsolidation processes (Bosman et al., 2014; Zheng et al., 2016; Colginand Moser, 2010). Recently, abnormal gamma and theta phase-ampli-tude patterns of dendritic CA1 LFP oscillations were found in a mousemodel of FXS (Radwan et al., 2016), related to an impaired excitatory-inhibitory equilibrium in FXS neuronal networks (Fenton, 2015;Contractor et al., 2015). However, it is unknown how these oscillatorydysfunctions affect the temporal coordination of spiking responses inthese networks. Here, we hypothesize that compromised synapticfunction in Fmr1-KO mice affects both the temporal coordination of cellensembles and hippocampal oscillatory rhythms supporting neuronalsynchronization. We evaluated this hypothesis using tetrode recordingsthe CA1 region of freely moving Fmr1-KO mice.
2. Material and methods
2.1. Subjects
We used four male Fmr1-KO (Mientjes et al., 2006) and four litter-mate wildtype (WT) control mice. All experiments were performed inaccordance with Dutch National Animal Experiments regulations, wereapproved by the University of Amsterdam. Animals were received fromthe Erasmus MC Rotterdam breeding unit at an age of 8 weeks andgroup-housed until surgery. They were maintained on a regular 12-hourlight-dark cycle (lights on: 8 am, lights off: 8 pm) and received waterand food ad libitum throughout the experiment. To minimize bias due topossible undetected changes in environmental conditions, Fmr1-KO andWT animals were always studied in pairs; both recordings were done onthe same day and counterbalanced per genotype. Therefore, the ex-perimenter was not blind to genotype during the experiments: pairs ofone Fmr1-KO and one WT mouse were implanted with a microdrive ineach experiment. Once habituated to the experimenter and handling,mice underwent drive implantation surgery under buprenorphine-iso-flurane anesthesia and were left to recover before the experiments.
2.2. Electrophysiological techniques
Six independently moveable tetrodes were loaded into a custom-made microdrive (Battaglia et al., 2009) and implanted over dorsalhippocampus (AP: −2.0mm, ML: −2mm; Fig. 1A). The tetrodes wereadvanced into the CA1 pyramidal cell layer guided by electro-physiological signals (sharp wave-ripple events) over the course of daysfollowing implantation surgery. Electrophysiological activity was re-corded on an analog 27-channel Neuralynx data acquisition system at a32 kHz sampling rate. Tetrode signals (bandpass filtered 0.6–6.0 kHzfor single unit and 0.1–475 Hz for LFP) were referred to a nearby te-trode which was targeted to a location devoid of single unit activity.Single-unit data were preprocessed with Klustakwik (Harris et al.,2000) for automated spike clustering and the results were manuallyrefined using Klusters (Hazan et al., 2006). The resulting spike trainswere analyzed using custom-written MATLAB code. LFP analyses weredone in MATLAB using FieldTrip (Oostenveld et al., 2011) and custom-made routines. Animal tracking position was extracted from videofootage by Ethovision XT software (Noldus, Wageningen, the Nether-lands) which was synchronized with the electrophysiological data
Fig. 1. Experimental setup and behavior.(A) Left, Schematic of microdrive implantation target. Right,Coronal section showing the recording location (lesion) of atetrode (arrow) in dorsal hippocampus CA1. (B) Schematic ofthe behavioral protocol. Animals freely explored a circularopen field arena (middle) which was surrounded by fourposters with geometric figures. (C) Accumulated trajectoriesof a WT (blue) and KO (red) animal exploring the arenaduring an example session in which the animal moved abovethreshold speed (3 cm/s). Inactivity periods (< 3 cm/s) areshown in black. (D) Average speed (> 3 cm/s) of WT and KOanimals during arena exploration. (E) Average time per ses-sion where speed of WT and KO animals was> 3 cm/s. (F)Average time WT and KO animals spent at varying distancesfrom the center of the arena (as a measure of thigmotaxis).Data (D–F) are represented as mean ± SEM.
T. Arbab et al. Neurobiology of Disease 114 (2018) 65–73
66

acquisition system. At the end of experiments, electrolytic lesions weremade to verify tetrode placement. Brains were fixed by transcardialperfusion and Nissl stained (Fig. 1A). Only animals with clear lesions inthe CA1 pyramidal layer were included in the analysis.
2.3. Behavioral protocol
A full experiment consisted of four sessions (two per day on twoconsecutive days) during which hippocampal neuronal network activitywas recorded as the mice freely explored a fully transparent, circularopen field arena (diameter 64 cm) for 30min. The arena was sur-rounded by black curtains and four large visual cues (Fig. 1B). In thefinal (fourth) session, three of the visual cues were removed. For thecurrent analyses, we excluded this last session and pooled the others.The two daily recording sessions were separated by a two-hour break,during which the animal rested in its home cage. Each animal was usedfor multiple experiments; a new set of cues was selected for each ex-periment.
2.4. Analysis of neural data
Tracking of animal position was automated. For further control,however, tracking data were visually inspected, checked for accuracy,and corrected manually when necessary. Inactivity periods (animalspeed<3 cm/s) were excluded from analysis. Recording stability of in-dividual neuronal clusters was examined; clusters whose first principalcomponent exceeded more than three standard deviations from begin-ning to end of recording were excluded from analysis. Using a fuzzyclustering algorithm (Fuzzy Clustering and Data Analysis Toolbox,http://www.abonyilab.com/software-and-data/fclusttoolbox), the re-maining clusters were separated in putative interneurons and pyramidalcells based on their firing rate and the mean width of their spike intervalautocorrelograms (mean AC) (Lansink et al., 2010). The fuzzy clusteringalgorithm quantifies the certainty (e.g., confidence level) that a neuronbelongs to either group. Thus, neurons with a < 70% certainty of be-longing to either group (unclassified) were excluded from analysis.
2.5. Spectral analysis
Power line artifacts of LFP raw traces were eliminated using aDiscrete Fourier Transform (DFT) filter at 50 Hz and its 2nd and 3rdharmonic (Schoffelen et al., 2005). Each epoch of interest (where an-imal speed was>3 cm/s), was centered in 10 s of the continuoussignal. We then calculated the DFT of this 10 s epoch at 50 Hz, 100 Hz,and 150 Hz, and subtracted their respective sine waves from the con-tinuous raw signal, with the amplitudes and phases as estimated by therespective DFTs. The epoch of interest (animal speed > 3 cm/s) wascut out from the cleaned 10 s epoch (Schoffelen et al., 2005). LFPsegments containing artifacts were discarded from further analyses.Remaining data were Z-transformed to equalize the contribution ofdifferent tetrodes and sessions across animals. Raw LFP data was de-meaned and divided by its standard deviation. Periods of animal ac-tivity (speed > 3 cm/s) were segmented in epochs of 1 s, Hanning ta-pered and Fourier transformed. Power estimates were normalized persession and animal relative to the mean power between 4 and 100 Hz(Malkki et al., 2016). An additional normalization to the maximumvalue of the averaged power spectrum across animals and sessions wasused in Fig. 4A. Time-frequency estimates were calculated using asliding window of 0.5 s with 95% overlap across the original segments.The average estimation over the first 4 s of activity in each segment isrepresented in Fig. 4B.
Coherence between LFP channels across different tetrodes was cal-culated using the weighted phase lag index (WPLI) (Vinck et al., 2011).The WPLI is a measure of phase-synchronization between LFP signalswhich is less affected by volume-conduction, noise and sample size. TheWPLI was computed by:
=E X sgn X
E XΦ
| { { }} ( { })|{| { }|}
I I
I (1)
where ℑ{X} represents the imaginary part of the cross-spectrum be-tween channels (Schoffelen et al., 2005). Normalized power and WPLIspectra were averaged across sessions and animals.
The consistency with which a cell fired spikes in a given phase rangeof an LFP oscillation was quantified using the pairwise phase con-sistency (PPC), a pairwise measure which is not biased by the numberof spikes and non-Poissonian effects within spike trains (Vinck et al.,2010). Briefly, for each frequency f we determined spike-LFP phases inepochs of 2/f (2 cycles) length centered around each spike, in order tomaintain the same resolution at any frequency bin. These segmentswere Fourier transformed using a Kayser taper (β=3). The resultingcomplex arguments were used to quantify the PPC per cell and perfrequency bin as follows:
=∑ ∑ +
−
= ≠ψθ θ θ θ
N N
(sin( ) sin( ) cos( ) cos( ))
( 1)jN
k jN
j m k m j m k m
m m
1 , , , ,m m
(2)
where θ,m and θk,m are the jth and kth spikes at frequency f in trial mand Nm denotes the number of spikes N in trial m (Vinck et al., 2010).Additionally, we calculated the LFP spike-triggered average of± 0.5 ssegments around spikes.
2.6. Spike count correlations
The spike-count correlation (rSC) measures the Pearson correlationbetween binned firing rate fluctuations of spike trains of two neurons(Cohen and Kohn, 2011; Averbeck and Lee, 2006; Kass et al., 2005). It isdefined as:
=∑ − × −
×=
r r r rσ σ
r( ) ( )n
Nin
i in
j
i jSC
1
(3)
where N is the number of trials and rni is the number of spikes of cell i intrial n over a specific spike-count window. The resulting spike-countsare z-scored using the mean spiking rate ri and standard deviation of thefiring rate of neuron i (σi) across sessions, to allow comparisons betweendifferent sessions and animals (Nandy et al., 2017). In our analyses, rSCwas calculated over a spike-count window of 0.5 s across data segmentsin which animals were active (speed>3 cm/s). To control for trial-to-trial variability in spike-count correlation (Kass and Ventura, 2006), werepeated the spike-count correlation analysis through different spike-count windows, ranging from 0.05 to 1 s (Fig. 3C).
2.7. Statistical testing
Spike-count correlations and behavioral differences between geno-types were quantified using a Wilcoxon rank sum test, with a sig-nificance threshold of p < 0.05. Spectral estimates (Power, WPLI,Spike-LFP PPC) were tested across all frequencies for significance at ap < 0.05 level, using a nonparametric randomization test, correctedfor multiple comparisons across frequencies (Bosman et al., 2012). Wefirst calculated a spectral estimate across all epochs per genotype. Then,we calculated the T-statistic between genotypes for every frequencybin. Next, we performed 10,000 randomizations, in which: (Belmonteand Bourgeron, 2006) the epochs from both conditions were randomlyredistributed; (Santos et al., 2014) from these two new random dis-tributions, we calculated the T-statistics for every frequency bin; and(Arbab et al., 2017) the maxima and minima of these T-statistics wereassigned to two distributions. These randomizations yielded two dis-tributions of the 10,000 maximal and minimal differences between therandomly redistributed epochs. Finally, the experimentally observed T-statistics were compared to the maximal and minimal distributions. Ifdifferences were smaller than the 2.5th percentile of the minimal dis-tribution or larger than the 97.5th percentile of the maximal
T. Arbab et al. Neurobiology of Disease 114 (2018) 65–73
67

distribution, they were considered significant at a p < 0.05 level. Thiscorresponds to a two-sided test with multiple comparison correctionacross frequencies (Maris et al., 2007; Nichols and Holmes, 2001). Ef-fect sizes and p-values for genotypic differences were quantified using aWilcoxon rank sum test over the average of the different frequencybands.
3. Results
Four Fmr1-KO (KO) (Mientjes et al., 2006) and four wild-type (WT)mice were implanted with six independently movable tetrodes in theCA1 pyramidal cell layer (Fig. 1A). Mice were habituated to an openfield arena, surrounded by 4 different visual cues (Fig. 1B). The beha-vioral protocol consisted of three sessions of 30min each, spread across2 days, in which mice freely explored the arena. Altogether, mice wererecorded over 69 sessions (WT: 34, KO: 35).
Both genotypes showed similar exploratory behavior across all re-corded sessions. WT and KO mice ran indistinctly through the openarena (Fig. 1C). We did not observe significant differences in runningspeed (Fig. 1D: WT: 6.4 ± 0.4 cm/s, KO: 5.8 ± 0.4 cm/s, p= 0.45,Wilcoxon rank sum test). The amount of time the animal spent actively(> 3 cm/s) exploring the environment was similar in both genotypes(Fig. 1E: WT: 1067 ± 56.8 s, 1004 ± 59.3 s, p= 0.26, Wilcoxon ranksum test). Thigmotaxis, the tendency to remain in the periphery of thearena, did not differ between WT and KO mice either (Fig. 1F: WT:center 1975 ± 261 s, periphery 27.94×10³ ± 1.45×10³ s,p < 0.001; KO: center 2416 ± 675 s, periphery28.97× 103 ± 2.28×10³ s, p < 0.001; comparison across
genotypes, periphery, p= 0.87, Wilcoxon rank sum test). The lack ofbasic behavioral effects in this phenotypic characterization of the Fmr1-KO mice is in agreement with the mild behavioral effects of the Fmr1deletion observed elsewhere (Kazdoba et al., 2014).
Electrophysiological recordings were performed while mice freelyexplored the arena. We compiled and analyzed epochs in which runningspeed was above 3 cm/s. In both genotypes, CA1 LFP signals showedstrong theta band (4 to 8 Hz) activity (Figs. 2A, 4A and B) with nestedgamma (Fig. 2A), both features typical of mouse hippocampal LFPduring motor activity (Buzsáki et al., 2003). We recorded approxi-mately 6 neurons per recording session (381 neurons in total). Using afuzzy clustering algorithm on the recorded neurons (Lansink et al.,2010), we identified 310 putative pyramidal neurons (152 for WT, 158for KO) and 71 putative interneurons (WT: 36, KO: 35). Fig. 2B and Cshow the different waveforms obtained for both neuronal types andgenotypes. Importantly, waveform parameters did not differ betweengenotypes. The fuzzy clustering algorithm allowed us to identify puta-tive interneurons and pyramidal cells for both genotypes (Fig. 2B andC). We calculated three different waveform parameters: mean AC, In-itial slope of valley decay (ISVD) (Lansink et al., 2010) and the peak-to-valley ratio for the previously identified neuronal types, separated bygenotype (Table 1). We used a 2-way ANOVA test to reveal potentialsignificant effects for neuronal type and genotype using these waveformparameters. We found a significant effect for mean AC and ISVD (butnot for peak-to-valley ratio) for neuronal type (Mean AC:F1,380= 154.7, p < 0.001; ISVD: F1,350= 12.08, p < 0.001; peak-to-valley ratio: F1,378= 0.02, p= 0.93). We did not find any significanteffect for genotype (Mean AC: F1,380= 3.18, p= 0.08; ISVD:
Fig. 2. LFP and neuronal recordings.(A) Left, example CA1 LFP traces for WT and KO. Middle and right, same traces bandpass filtered for theta (4–8 Hz) and gamma (20–100 Hz) frequencies. (B) Normalized spike waveformsof pyramidal cells (Pyr, black) and interneurons (Int, green) for WT. (C) Same as in (B), for KO.
T. Arbab et al. Neurobiology of Disease 114 (2018) 65–73
68
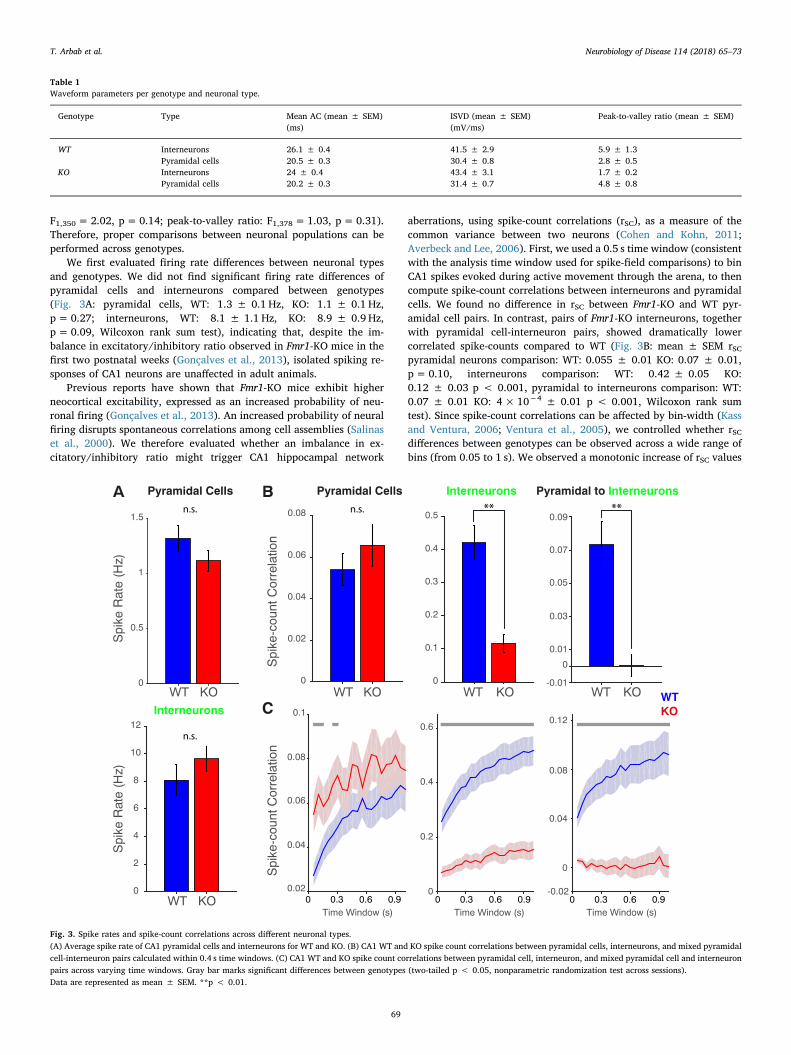
F1,350= 2.02, p=0.14; peak-to-valley ratio: F1,378= 1.03, p= 0.31).Therefore, proper comparisons between neuronal populations can beperformed across genotypes.
We first evaluated firing rate differences between neuronal typesand genotypes. We did not find significant firing rate differences ofpyramidal cells and interneurons compared between genotypes(Fig. 3A: pyramidal cells, WT: 1.3 ± 0.1 Hz, KO: 1.1 ± 0.1 Hz,p=0.27; interneurons, WT: 8.1 ± 1.1 Hz, KO: 8.9 ± 0.9 Hz,p=0.09, Wilcoxon rank sum test), indicating that, despite the im-balance in excitatory/inhibitory ratio observed in Fmr1-KO mice in thefirst two postnatal weeks (Gonçalves et al., 2013), isolated spiking re-sponses of CA1 neurons are unaffected in adult animals.
Previous reports have shown that Fmr1-KO mice exhibit higherneocortical excitability, expressed as an increased probability of neu-ronal firing (Gonçalves et al., 2013). An increased probability of neuralfiring disrupts spontaneous correlations among cell assemblies (Salinaset al., 2000). We therefore evaluated whether an imbalance in ex-citatory/inhibitory ratio might trigger CA1 hippocampal network
aberrations, using spike-count correlations (rSC), as a measure of thecommon variance between two neurons (Cohen and Kohn, 2011;Averbeck and Lee, 2006). First, we used a 0.5 s time window (consistentwith the analysis time window used for spike-field comparisons) to binCA1 spikes evoked during active movement through the arena, to thencompute spike-count correlations between interneurons and pyramidalcells. We found no difference in rSC between Fmr1-KO and WT pyr-amidal cell pairs. In contrast, pairs of Fmr1-KO interneurons, togetherwith pyramidal cell-interneuron pairs, showed dramatically lowercorrelated spike-counts compared to WT (Fig. 3B: mean ± SEM rSCpyramidal neurons comparison: WT: 0.055 ± 0.01 KO: 0.07 ± 0.01,p=0.10, interneurons comparison: WT: 0.42 ± 0.05 KO:0.12 ± 0.03 p < 0.001, pyramidal to interneurons comparison: WT:0.07 ± 0.01 KO: 4× 10⁻⁴ ± 0.01 p < 0.001, Wilcoxon rank sumtest). Since spike-count correlations can be affected by bin-width (Kassand Ventura, 2006; Ventura et al., 2005), we controlled whether rSCdifferences between genotypes can be observed across a wide range ofbins (from 0.05 to 1 s). We observed a monotonic increase of rSC values
Table 1Waveform parameters per genotype and neuronal type.
Genotype Type Mean AC (mean ± SEM)(ms)
ISVD (mean ± SEM)(mV/ms)
Peak-to-valley ratio (mean ± SEM)
WT Interneurons 26.1 ± 0.4 41.5 ± 2.9 5.9 ± 1.3Pyramidal cells 20.5 ± 0.3 30.4 ± 0.8 2.8 ± 0.5
KO Interneurons 24 ± 0.4 43.4 ± 3.1 1.7 ± 0.2Pyramidal cells 20.2 ± 0.3 31.4 ± 0.7 4.8 ± 0.8
Fig. 3. Spike rates and spike-count correlations across different neuronal types.(A) Average spike rate of CA1 pyramidal cells and interneurons for WT and KO. (B) CA1 WT and KO spike count correlations between pyramidal cells, interneurons, and mixed pyramidalcell-interneuron pairs calculated within 0.4 s time windows. (C) CA1 WT and KO spike count correlations between pyramidal cell, interneuron, and mixed pyramidal cell and interneuronpairs across varying time windows. Gray bar marks significant differences between genotypes (two-tailed p < 0.05, nonparametric randomization test across sessions).Data are represented as mean ± SEM. **p < 0.01.
T. Arbab et al. Neurobiology of Disease 114 (2018) 65–73
69

associated with augmented counting window segments (Fig. 3C), whichis particularly evident in all WT comparisons, but less prominent for allKO comparisons. This increase of rSC values has been related to excessof variability in spike timing across trials (Nandy et al., 2017), whichtends to be reduced with larger bins of observation (Richter et al.,2015). Nevertheless, spike-count correlations between interneurons andbetween interneurons and pyramidal cells of KO mice were not affectedby the window selection. Differences between genotypes remain sig-nificant over a wide range of counting window segments (Fig. 3C: graybar denotes a two-tailed p value < 0.05, nonparametric randomizationtest across recording sessions), indicative of a significant difference inthe common variability between interneurons and between inter-neurons and pyramidal cells between both genotypes. These resultsconfirm that synaptic dysfunctions caused by Fmr1 protein deficits af-fect hippocampal circuit organization, decreasing the correlated var-iance between cell assemblies.
Next, we wondered whether the observed differences in hippo-campal spike-count correlations are associated with other electro-physiological changes. Previous reports reveal the presence of twodifferent gamma bands (slow (20–50 Hz) and fast (50–100 Hz)), bothinvolved in the communication between CA1 and CA3 and betweenCA1 and entorhinal cortex (Colgin et al., 2009; Csicsvari et al., 2003;Bragin et al., 1995). We evaluated LFP power in theta, beta, slow, andfast gamma bands of the CA1 pyramidal cell layer during exploration.Both genotypes showed strong theta band LFP activity (Fig. 4A), buttheta frequency power was significantly larger in Fmr1-KO than WTmice when compared across sessions (Fig. 4A and B: p < 0.05, non-parametric randomization test). This effect was preserved after com-piling sessions and computing the average per animal (Fig. 4C: Thetaband: median WT: 0.05, KO: 0.08, p= 0.03; Beta band: median WT:0.01, KO: 0.01, p=0.54; Slow Gamma band: median WT: 4.7×10⁻³,KO: 5.5×10⁻³, p= 0.69; Fast Gamma band: median WT: 2.3×10⁻³,KO: 2.2×10⁻³, p= 0.22, Wilcoxon rank sum test).
We did not find significant power differences in the slow and fastgamma band activity in CA1 between genotypes (Fig. 4C). However,
power spectra can fail to reveal changes in rhythms that are detectablewith metrics of LFP-LFP phase locking (Vinck et al., 2013; Brunet et al.,2014). Therefore, we quantified phase synchronization using theweighted phase lag index metric (WPLI, see Methods). Fmr1-KO miceshowed increased phase synchronization in the slow gamma bandacross neighboring electrodes compared to WT (Fig. 5A: p < 0.05,non-parametric randomization test across sessions). This effect waspreserved after compiling sessions and computing the average per an-imal (Fig. 5B: Theta WT: 0.69, KO: 0.86, p=0.68; Beta WT: 0.37, KO:0.59, p= 0.34; Slow Gamma WT: 0.47, KO: 0.89, p=0.02; FastGamma WT: 0.71, KO: 0.72, p=0.34, Wilcoxon rank sum test).
Finally, we evaluated the spike-LFP phase consistency (PPC) acrossdifferent neuronal types in CA1. We calculated spike-triggered averages(STAs) of pyramidal cells and interneurons for both genotypes (Fig. 6Aand B). Pyramidal cells of both genotypes showed a weak phase lockingto a low (~10 Hz) frequency component of the LFP (Fig. 6A). Con-versely, interneuron spikes of Fmr1-KO were more strongly locked to alow-frequency rhythm than WT interneurons (Fig. 6B). We calculatedthe pairwise phase consistency across frequencies (PPC, see Methods)(Vinck et al., 2010) to quantify these observations. Pyramidal cells ofboth genotypes showed a PPC spectra peaked at theta frequency(Malkki et al., 2016), but no significant differences between groups(Fig. 6C). Notably, Fmr1-KO interneurons locked to two frequencybands (5–8 Hz and 19–21 Hz) significantly stronger than those of WTmice (Fig. 6D: p < 0.05; non-parametric randomization test acrosssessions), suggesting an abnormal phase consistency for multi -fre-quency LFP rhythms in the Fmr1-KO mouse.
4. Discussion
In the present study, we took advantage of the spatial resolutionprovided by tetrode recordings in a mouse model of FXS to characterizehow decreased FMRP expression affects CA1 hippocampal networks.We found increased theta power (5–8 Hz) associated with an increase ofslow gamma (19–21 Hz) LFP-LFP synchronization in Fmr1-KO mice
Fig. 4. LFP power.(A) WT and KO time frequency power spectra of LFP recorded in hippocampal CA1, during the first 4 s of each continuous recorded segment in which the animal moved above thresholdspeed (3 cm/s). (B) Full spectrum CA1 LFP power for WT and KO mice. Gray bar marks significant differences between genotypes (p < 0.05). (C) Boxplot of WT and KO CA1 LFP powerper frequency band. Data in (B) are represented as mean ± SEM. *p < 0.05.
T. Arbab et al. Neurobiology of Disease 114 (2018) 65–73
70

compared with WT controls, two findings that are consistent with pa-thological hypersynchronization of Fmr1-KO neurons to the most pro-minent hippocampal rhythm. Also, we observed decreased spike-countcorrelation in the Fmr1-KO mouse mainly across pairs of interneuronsand pyramidal-interneurons, although it was also present betweenpyramidal cells at spike-counting windows below 0.3 s. A decrease inspike-count correlations has been linked to V4 cell assemblies duringattention (Mitchell et al., 2009). Active states lead to a common var-iance reduction across connected neurons, which has been associatedwith increased phase-locking to specific LFPs oscillations (Womelsdorfet al., 2012). Our results suggest that FMRP deficits can be character-ized by a hypersynchronized state between CA1 neurons.
Pathologically synchronized neuronal networks can account forseveral of the symptoms observed in FXS (Fung and Reiss, 2016). FXSpatients show a major incidence of epilepsy and enhanced reactivity tosensory stimulation compared to normal subjects (Finelli et al., 1985;Sabaratnam et al., 2001), and abnormal fronto-parietal coherence inalpha, theta and beta frequency bands (van der Molen et al., 2014).Moreover, FXS patients exhibit increased resting-state gamma fre-quency band power, correlated with impaired social and sensory
processing (Wang et al., 2017). This hypersynchronized state has alsobeen found in animal models of FXS. In a FXS rat model, abnormal high-frequency power increases in association with decreased interneuronalfiring-rate correlations have been observed in visual cortex duringresting states (Berzhanskaya et al., 2017). Also, in the CA1 region ofFmr1-KO mice, an abnormal cross-frequency coupling between low andhigh-frequency LFP bands has been associated with cognitive inflex-ibility in a place-avoidance paradigm (Radwan et al., 2016). Experi-mental and modeling studies have shown that synchronized neuronalinputs cause increased excitability (Salinas et al., 2000; Azouz andGray, 2000). In our study, Fmr1-KO mice exhibited increased thetapower and gamma WPLI when compared with control mice, a findingthat is consistent with increased microcircuit excitability in FXS(Berzhanskaya et al., 2017; Gonçalves et al., 2013). As gamma oscil-lations are nested in theta oscillations, this increased Fmr1-KO gammasynchronization might be driven by the increased power of the thetaoscillations.
Hippocampal gamma oscillations in CA1 reflect mainly theweighted sum of postsynaptic inhibitory potentials from local inter-neurons, which homogenize and temporally align neuronal network
Fig. 5. LFP coherence.(A) Full spectrum of LFP coherence (debiased WPLI) among tetrodes in WT (blue) and KO CA1 (red). Gray bar marks significant differences between genotypes (p < 0.05). Data arerepresented as mean ± SEM. (B) Boxplot of WT and KO CA1 LFP coherence per frequency band. *p < 0.05.
Fig. 6. Spike-triggered LFP average and spike-LFP consistency.(A) Spike-triggered LFP average of WT and KO CA1 pyramidal cells. (B) Spike-triggered LFP average of WT and KO CA1 interneurons. (C) Pairwise Phase Consistency (PPC) of spike-LFPphase-locking of WT and KO CA1 pyramidal cells. (D) Consistency of spike-LFP phase-locking of WT and KO CA1 interneurons. Gray bars mark significant differences between genotypes(p < 0.05). Data are represented as mean ± SEM. *p < 0.05.
T. Arbab et al. Neurobiology of Disease 114 (2018) 65–73
71

activity upon rhythmic input from CA3 (slow gamma) and entorhinalcortex (fast gamma) (Csicsvari et al., 2003). These two types of gammaactivity appear to have functionally distinct roles: sensory signals car-rying spatial information may be communicated from entorhinal cortexto CA1 through synchronization of fast gamma (suitable for inducingsynaptic plasticity supporting consolidation of this information),whereas synchronization of CA1 to CA3 slow gamma occurs duringmemory retrieval (Colgin et al., 2009; Bieri et al., 2014). The increasedphase consistency in CA1 slow gamma observed Fmr1-KO mice maysuggest a preferential communication with the CA3 region (Colginet al., 2009), reducing the effect of “on-line” inputs from entorhinalcortex and thus, overriding novel memory encoding mechanisms. Thisdysregulated communication may underlie deficits in spatial codingobserved in these animals (Arbab et al., 2017).
Contrary to our results, Radwan and colleagues (Radwan et al.,2016) found minimal hippocampal CA1 power spectral differencesbetween WT and Fmr1-KO. This discrepancy might be explained bydifferences in the behavioral protocols used in both studies. Radwanand colleagues (Radwan et al., 2016) used an active place avoidanceprotocol, producing behavioral differences across conditions and gen-otypes, but limiting free movement of the animals. Conversely, ourrecordings were obtained in animals freely moving in an open field, andno behavioral differences between genotypes were observed. Never-theless, Radwan and colleagues (Radwan et al., 2016) also found ab-normal rhythmic coupling in the hippocampus of Fmr1-KO.
In neocortex, FXS animal models show increased spiking activity(Berzhanskaya et al., 2017; Gonçalves et al., 2013). While our hippo-campal recordings did not show spike rate differences between geno-types, we found significant differences in spike-count correlations be-tween different cell types. Active neocortical states decorrelatespontaneous neuronal activity (Vinck et al., 2015; Renart et al., 2010;Montijn et al., 2015), possibly through coordinated fluctuations betweenexcitatory and inhibitory populations (Renart et al., 2010). This un-correlated state has been found in other studies. For instance, barrelcortex activity is actively desynchronized during active whisking (Pouletand Petersen, 2008) and visual cortical neurons show attention-depen-dent reduction in correlated low-frequency firing rate fluctuations(Mitchell et al., 2009; Hansen et al., 2012). In hippocampus, two-photoncalcium imaging in CA1 neuronal populations has shown increased cal-cium event-count correlation of neuronal populations sharing commoninputs (Modi et al., 2014). Once animals have been exposed to associa-tive learning training, these spontaneous correlations tend to decreaseand form separate clusters of correlated activity (Modi et al., 2014;Montijn et al., 2016). Thus, uncorrelated neuronal activity is importantto efficiently transfer information across neuronal populations. At firstglance, it seems counterintuitive that Fmr1-KO mice show decreasedspike-count correlations compared with WT. However, this uncorrelatedactivity was observed together with an abnormal phase locking of in-terneurons to theta and slow gamma oscillations, and other studies haveshown that increased spike phase-locking to gamma rhythm decreasesnoise correlations during visual stimulation in V1 cells (Womelsdorfet al., 2012). Possibly, synaptic deficits in Fmr1-KO may interfere withinterneuron locking to the LFP, imposing an aberrant temporal precisionto the activity of both pyramidal cells and interneurons in area CA1. Inturn, this temporal precision, imposed on interneuron activity, may de-crease the common variance across cells measured by spike-count cor-relations. Future studies will need to investigate whether this aberranthippocampal activity affects hippocampus-dependent learning andmemory consolidation processes in Fmr1-KO mice.
In conclusion, our results support the notion that deficits in FRMPproduce an increased and pathological synchronization of CA1 neurons,probably because of an inadequate excitatory/inhibitory coupling be-tween neurons, expressed in the theta and gamma ranges (Fenton,2015). Hypersynchrony is thus not only related to neocortical activity,but is a more general feature of FXS, affecting both neocortical andhippocampal microcircuits.
Acknowledgements
We thank L. Noldus for the use of Ethovision XT software, K. Harrisfor the use of Klustakwik, and L. Hazan for the use of Klusters. Thiswork was supported by SenterNovem BSIK grant 03053, STW grantAET7613, and EU project 720270 (HBP SGA1, Human Brain Project) toCMAP and the FLAG-ERA JTC 2015 project CANON (co-financed byNWO to CAB). Animals were kindly provided by Prof. Dr. R. Willemsenat the Department of Clinical Genetics, Erasmus MC in Rotterdam, TheNetherlands.
Financial disclosures
The authors declare no competing financial interests.
References
Arbab, T., Pennartz, C.M.A., Battaglia, F.P., 2017. Impaired hippocampal representationof place in the Fmr1-knockout mouse model of fragile X syndrome. bioRxiv. http://dx.doi.org/10.1101/191775.
Averbeck, B.B., Lee, D., 2006. Effects of noise correlations on information encoding anddecoding. J Neurophysiol 95, 3633–3644.
Azouz, R., Gray, C.M., 2000. Dynamic spike threshold reveals a mechanism for synapticcoincidence detection in cortical neurons in vivo. Proc Natl Acad Sci U S A 97,8110–8115.
Battaglia, F.P., Kalenscher, T., Cabral, H., Winkel, J., Bos, J., Manuputy, R., et al., 2009.The lantern: an ultra-light micro-drive for multi-tetrode recordings in mice and othersmall animals. J Neurosci Methods 178, 291–300.
Belmonte, M.K., Bourgeron, T., 2006. Fragile X syndrome and autism at the intersectionof genetic and neural networks. Nat Neurosci 9, 1221–1225.
Berzhanskaya, J., Phillips, M.A., Gorin, A., Lai, C., Shen, J., Colonnese, M.T., 2017.Disrupted cortical state regulation in a rat model of fragile X syndrome. Cereb Cortex27, 1386–1400.
Bhakar, A.L., Dölen, G., Bear, M.F., 2012. The pathophysiology of fragile X (and what itteaches us about synapses). Annu Rev Neurosci 35, 417–443.
Bieri, K.W., Bobbitt, K.N., Colgin, L.L., 2014. Slow and fast γ rhythms coordinate differentspatial coding modes in hippocampal place cells. Neuron 82, 670–681.
Bosman, C.A., Lansink, C.S., Pennartz, C.M.A., 2014. Functions of gamma-band syn-chronization in cognition: from single circuits to functional diversity across corticaland subcortical systems. Eur J Neurosci 39, 1982–1999.
Bosman, C.A., Schoffelen, J.-M., Brunet, N., Oostenveld, R., Bastos, A.M., Womelsdorf, T.,et al., 2012. Attentional stimulus selection through selective synchronization be-tween monkey visual areas. Neuron 75, 875–888.
Bragin, A., Jando, G., Nadasdy, Z., Hetke, J., Wise, K., Buzsáki, G., 1995. Gamma(40–100 Hz) oscillation in the hippocampus of the behaving rat. J Neurosci 15,47–60.
Brunet, N., Vinck, M., Bosman, C.A., Singer, W., Fries, P., 2014. Gamma or no gamma,that is the question. Trends Cogn Sci 18, 507–509.
Budimirovic, D.B., Kaufmann, W.E., 2011. What can we learn about autism from studyingfragile X syndrome? Dev Neurosci 33, 379–394.
Buzsáki, G., Anastassiou, C.A., Koch, C., 2012. The origin of extracellular fields andcurrents - EEG, ECoG, LFP and spikes. Nat Rev Neurosci 13, 407–420.
Buzsáki, G., Buhl, D.L., Harris, K.D., Csicsvari, J., Czéh, B., Morozov, A., 2003.Hippocampal network patterns of activity in the mouse. Neuroscience 116, 201–211.
Cohen, M.R., Kohn, A., 2011. Measuring and interpreting neuronal correlations. NatNeurosci 14, 811–819.
Colgin, L.L., Denninger, T., Fyhn, M., Hafting, T., Bonnevie, T., Jensen, O., et al., 2009.Frequency of gamma oscillations routes flow of information in the hippocampus.Nature 462, 353–357.
Colgin, L.L., Moser, E.I., 2010. Gamma oscillations in the hippocampus. Physiology(Bethesda) 25, 319–329.
Contractor, A., Klyachko, V.A., Portera-Cailliau, C., 2015. Altered neuronal and circuitexcitability in fragile X syndrome. Neuron 87, 699–715.
Csicsvari, J., Jamieson, B., Wise, K.D., Buzsáki, G., 2003. Mechanisms of gamma oscil-lations in the hippocampus of the behaving rat. Neuron 37, 311–322.
Darnell, J.C., Van Driesche, S.J., Zhang, C., Hung, K.Y.S., Mele, A., Fraser, C.E., et al.,2011. FMRP stalls ribosomal translocation on mRNAs linked to synaptic function andautism. Cell 146, 247–261.
Fenton, A.A., 2015. Excitation-inhibition discoordination in rodent models of mentaldisorders. Biol Psychiatry 77, 1079–1088.
Finelli, P.F., Pueschel, S.M., Padre-Mendoza, T., O'Brien, M.M., 1985. Neurologicalfindings in patients with the fragile-X syndrome. J Neurol Neurosurg Psychiatry 48,150–153.
Fries, P., 2015. Rhythms for cognition: communication through coherence. Neuron 88,220–235.
Fung, L.K., Reiss, A.L., 2016. Moving toward integrative, multidimensional research inmodern psychiatry: lessons learned from fragile X syndrome. Biol Psychiatry 80,100–111.
Gonçalves, J.T., Anstey, J.E., Golshani, P., Portera-Cailliau, C., 2013. Circuit level defectsin the developing neocortex of fragile X mice. Nat Neurosci 16, 903–909.
T. Arbab et al. Neurobiology of Disease 114 (2018) 65–73
72

Gupta, A.S., van der Meer, M.A.A., Touretzky, D.S., Redish, A.D., 2012. Segmentation ofspatial experience by hippocampal theta sequences. Nat Neurosci 15, 1032–1039.
Hansen, B.J., Chelaru, M.I., Dragoi, V., 2012. Correlated variability in laminar corticalcircuits. 76, 590–602.
Harris, K.D., Henze, D.A., Csicsvari, J., Hirase, H., Buzsáki, G., 2000. Accuracy of tetrodespike separation as determined by simultaneous intracellular and extracellularmeasurements. J Neurophysiol 84, 401–414.
Hazan, L., Zugaro, M., Buzsáki, G., 2006. Klusters, NeuroScope, NDManager: a freesoftware suite for neurophysiological data processing and visualization. J NeurosciMethods 155, 207–216.
Huber, K.M., Gallagher, S.M., Warren, S.T., Bear, M.F., 2002. Altered synaptic plasticityin a mouse model of fragile X mental retardation. Proc Natl Acad Sci U S A 99,7746–7750.
Kass, R.E., Ventura, V., 2006. Spike count correlation increases with length of time in-terval in the presence of trial-to-trial variation. Neural Comput 18, 2583–2591.
Kass, R.E., Ventura, V., Brown, E.N., 2005. Statistical issues in the analysis of neuronaldata. J Neurophysiol 94, 8–25.
Kates, W.R., Abrams, M.T., Kaufmann, W.E., Breiter, S.N., Reiss, A.L., 1997. Reliabilityand validity of MRI measurement of the amygdala and hippocampus in children withfragile X syndrome. Psychiatry Res 75, 31–48.
Kazdoba, T.M., Leach, P.T., Silverman, J.L., Crawley, J.N., 2014. Modeling fragile Xsyndrome in the Fmr1 knockout mouse. IRDR 3, 118–133.
Kim, J.J., Fanselow, M.S., 1992. Modality-specific retrograde amnesia of fear. Science256, 675–677.
Lansink, C.S., Goltstein, P.M., Lankelma, J.V., Pennartz, C.M.A., 2010. Fast-spiking in-terneurons of the rat ventral striatum: temporal coordination of activity with prin-cipal cells and responsiveness to reward. Eur J Neurosci 32, 494–508.
Malkki, H.A.I., Mertens, P.E.C., Lankelma, J.V., Vinck, M., van Schalkwijk, F.J., vanMourik-Donga, L.B., et al., 2016. Effects of Arc/Arg3.1 gene deletion on rhythmicsynchronization of hippocampal CA1 neurons during locomotor activity and sleep.Neurobiol Learn Mem 131, 155–165.
Manns, J.R., Hopkins, R.O., Reed, J.M., Kitchener, E.G., Squire, L.R., 2003. Recognitionmemory and the human hippocampus. Neuron 37, 171–180.
Maris, E., Schoffelen, J.-M., Fries, P., 2007. Nonparametric statistical testing of coherencedifferences. J Neurosci Methods 163, 161–175.
Markram, H., Lübke, J., Frotscher, M., Sakmann, B., 1997. Regulation of synaptic efficacyby coincidence of postsynaptic APs and EPSPs. Science 275, 213–215.
Mientjes, E.J., Nieuwenhuizen, I., Kirkpatrick, L., Zu, T., Hoogeveen-Westerveld, M.,Severijnen, L., et al., 2006. The generation of a conditional Fmr1 knock out mousemodel to study Fmrp function in vivo. Neurobiol Dis 21, 549–555.
Mitchell, J.F., Sundberg, K.A., Reynolds, J.H., 2009. Spatial attention decorrelates in-trinsic activity fluctuations in macaque area V4. Neuron 63, 879–888.
Modi, M.N., Dhawale, A.K., Bhalla, U.S., 2014. CA1 cell activity sequences emerge afterreorganization of network correlation structure during associative learning. Elife 3,e01982.
van der Molen, M.J.W., Stam, C.J., van der Molen, M.W., 2014. Resting-state EEG os-cillatory dynamics in fragile X syndrome: abnormal functional connectivity and brainnetwork organization. (F. J. Esteban, editor). PLoS One 9, e88451.
Montijn, J.S., Goltstein, P.M., Pennartz, C.M., 2015. Mouse V1 population correlates ofvisual detection rely on heterogeneity within neuronal response patterns. (D. C. VanEssen, editor). Elife 4, e10163.
Montijn, J.S., Meijer, G.T., Lansink, C.S., Pennartz, C.M.A., 2016. Population-level neuralcodes are robust to single-neuron variability from a multidimensional coding per-spective. Cell Rep 16, 2486–2498.
Morris, R.G., Garrud, P., Rawlins, J.N., O'Keefe, J., 1982. Place navigation impaired inrats with hippocampal lesions. Nature 297, 681–683.
Moscovitch, M., Cabeza, R., Winocur, G., Nadel, L., 2016. Episodic memory and beyond:the hippocampus and neocortex in transformation. Annu Rev Psychol 67, 105–134.
Nandy, A.S., Nassi, J.J., Reynolds, J.H., 2017. Laminar organization of attentional
modulation in macaque visual area V4. Neuron 93, 235–246.Nichols, T.E., Holmes, A.P., 2001. Nonparametric permutation tests for functional neu-
roimaging: a primer with examples. Hum Brain Mapp 15, 1–25.Oostenveld, R., Fries, P., Maris, E., Schoffelen, J.-M., 2011. FieldTrip: open source soft-
ware for advanced analysis of MEG, EEG, and invasive electrophysiological data.Comput Intell Neurosci 2011, 156869.
Pilpel, Y., Kolleker, A., Berberich, S., Ginger, M., Frick, A., Mientjes, E., et al., 2009.Synaptic ionotropic glutamate receptors and plasticity are developmentally altered inthe CA1 field of Fmr1 knockout mice. J Physiol 587, 787–804.
Poulet, J.F.A., Petersen, C.C.H., 2008. Internal brain state regulates membrane potentialsynchrony in barrel cortex of behaving mice. Nature 454, 881–885.
Quiroga, R.Q., Reddy, L., Kreiman, G., Koch, C., Fried, I., 2005. Invariant visual re-presentation by single neurons in the human brain. Nature 435, 1102–1107.
Radwan, B., Dvorak, D., Fenton, A.A., 2016. Impaired cognitive discrimination and dis-coordination of coupled theta-gamma oscillations in Fmr1 knockout mice. NeurobiolDis 88, 125–138.
Reiss, A.L., Lee, J., Freund, L., 1994. Neuroanatomy of fragile X syndrome: the temporallobe. Neurology 44, 1317–1324.
Renart, A., La Rocha, De J., Bartho, P., Hollender, L., Parga, N., Reyes, A., Harris, K.D.,2010. The asynchronous state in cortical circuits. Science 327, 587–590.
Richter, C.G., Thompson, W.H., Bosman, C.A., Fries, P., 2015. A jackknife approach toquantifying single-trial correlation between covariance-based metrics undefined on asingle-trial basis. Neuroimage 114, 57–70.
Sabaratnam, M., Vroegop, P.G., Gangadharan, S.K., 2001. Epilepsy and EEG findings in18 males with fragile X syndrome. Seizure 10, 60–63.
Salinas, E., Salinas, E., Sejnowski, T.J., 2000. Impact of correlated synaptic input onoutput firing rate and variability in simple neuronal models. J Neurosci 20,6193–6209.
Santos, A.R., Kanellopoulos, A.K., Bagni, C., 2014. Learning and behavioral deficits as-sociated with the absence of the fragile X mental retardation protein: what a fly andmouse model can teach us. Learn Mem 21, 543–555.
Schoffelen, J.M., Oostenveld, R., Fries, P., 2005. Neuronal coherence as a mechanism ofeffective corticospinal interaction. Science 308, 111–113.
Sejnowski, T.J., Paulsen, O., 2006. Network oscillations: emerging computational prin-ciples. J Neurosci 26, 1673–1676.
Skaggs, W.E., McNaughton, B.L., 1996. Replay of neuronal firing sequences in rat hip-pocampus during sleep following spatial experience. Science 271, 1870–1873.
Ventura, V., Cai, C., Kass, R.E., 2005. Trial-to-trial variability and its effect on time-varying dependency between two neurons. J Neurophysiol 94, 2928–2939.
Vinck, M., Batista-Brito, R., Knoblich, U., Cardin, J.A., 2015. Arousal and locomotionmake distinct contributions to cortical activity patterns and visual encoding. Neuron86, 740–754.
Vinck, M., Oostenveld, R., van Wingerden, M., Battaglia, F., Pennartz, C.M.A., 2011. Animproved index of phase-synchronization for electrophysiological data in the pre-sence of volume-conduction, noise and sample-size bias. Neuroimage 55, 1548–1565.
Vinck, M., van Wingerden, M., Womelsdorf, T., Fries, P., Pennartz, C.M.A., 2010. Thepairwise phase consistency: a bias-free measure of rhythmic neuronal synchroniza-tion. Neuroimage 51, 112–122.
Vinck, M., Womelsdorf, T., Buffalo, E.A., Desimone, R., Fries, P., 2013. Attentionalmodulation of cell-class-specific gamma-band synchronization in awake monkey areav4. 80, 1077–1089.
Wang, J., Ethridge, L.E., Mosconi, M.W., White, S.P., Binder, D.K., Pedapati, E.V., et al.,2017. A resting EEG study of neocortical hyperexcitability and altered functionalconnectivity in fragile X syndrome. J Neurodev Disord 9 (1) 2017. (9: 11).
Womelsdorf, T., Lima, B., Vinck, M., Oostenveld, R., Singer, W., Neuenschwander, S.,Fries, P., 2012. Orientation selectivity and noise correlation in awake monkey areaV1 are modulated by the gamma cycle. Proc Natl Acad Sci U S A 109, 4302–4307.
Zheng, C., Bieri, K.W., Hsiao, Y.-T., Colgin, L.L., 2016. Spatial sequence coding differsduring slow and fast gamma rhythms in the hippocampus. Neuron 89, 398–408.
T. Arbab et al. Neurobiology of Disease 114 (2018) 65–73
73