Embed Size (px)
Citation preview
Junior Secondary Mathematics Student’s Learning Environment and Satisfaction in Brunei Darussalam
Abdul Majeed, Barry J. Fraser & Jill M. Aldridge
Curtin University of Technology, Western Australia
Paper Presented at the Annual Conference of the Australian Association for Research in Education
December 2-6, 2001, Fremantle, Western Australia
ABSTRACT
This paper reports a study of lower secondary mathematics classroom learning environments in Brunei Darussalam and their associations with students’ satisfaction with learning mathematics among a sample of 1,565 students from 81 classes in 15 government secondary schools. Students’ perceptions of the classroom learning environments were assessed with a version of the My Class Inventory (MCI) and a measure of student satisfaction also was included. Both measures had been modified for the Brunei context. The study revealed satisfactory reliability and validity for a refined three-scale version of the MCI assessing cohesiveness, difficulty and competition. Mean scores were generated from the data to provide a profile of what a typical classroom is like. Sex differences in classroom environment were explored using a one-way MANOVA with the set of MCI scales as the dependent variables. Overall, the study suggests that students’ perceived a positive learning environment in mathematics classes. Also the study supported earlier research suggesting that boys and girls hold different perceptions of the same classroom learning environments. Relationships between student satisfaction and classroom environment were investigated using simple and multiple correlation analyses. Associations between satisfaction and the learning environment were statistically significant both at student and class levels for most MCI scales.
INTRODUCTION
The education policy, the school’s culture and specific situational factors all contribute to the routine habits of teachers and students. A school’s culture has its own language, knowledge and vocabulary which each contribute to a particular orientation to mathematics education.
The education system in Brunei Darussalam is centralised and examination oriented. At various stages during their education, students in Brunei Darussalam undergo examinations that determine their selection, placement and promotion. The education system is largely content driven, with an emphasis on students passing the examinations. There would appear to be limited change in teaching styles and general classroom management since the 1960s, with reports (Ministry of Education, 1993a) indicating that teachers are experiencing problems in the teaching and learning mathematics in Brunei Darussalam's schools.
The present study investigated the extent to which these reported problems might be affecting the mathematics classroom environment in Brunei Darussalam's junior secondary schools. In addition, because students' attitudes towards mathematics are considered an important factor in mathematics classrooms, this study also included assessment of students’ attitudes and investigated their association with the nature of the mathematics classroom learning environment.
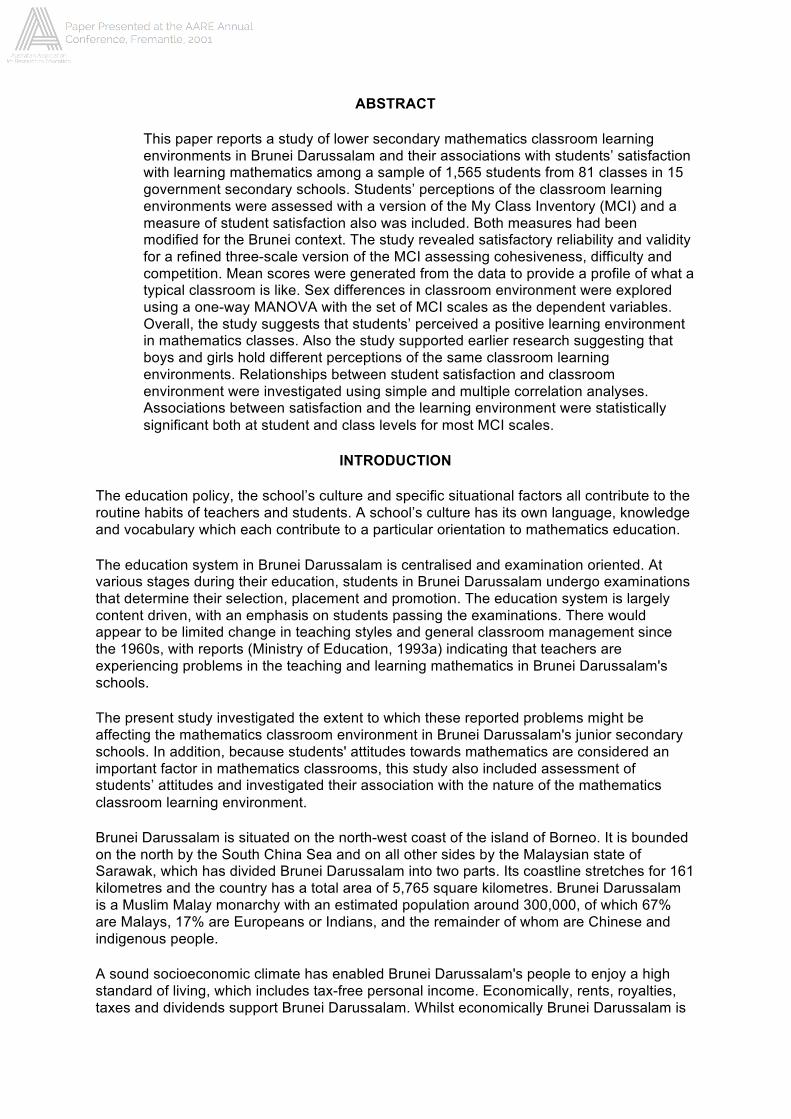
Brunei Darussalam is situated on the north-west coast of the island of Borneo. It is bounded on the north by the South China Sea and on all other sides by the Malaysian state of Sarawak, which has divided Brunei Darussalam into two parts. Its coastline stretches for 161 kilometres and the country has a total area of 5,765 square kilometres. Brunei Darussalam is a Muslim Malay monarchy with an estimated population around 300,000, of which 67% are Malays, 17% are Europeans or Indians, and the remainder of whom are Chinese and indigenous people.
A sound socioeconomic climate has enabled Brunei Darussalam's people to enjoy a high standard of living, which includes tax-free personal income. Economically, rents, royalties, taxes and dividends support Brunei Darussalam. Whilst economically Brunei Darussalam is
dependent on the production of crude oil and natural gas, a series of five-year national development plans has been used to diversify the economy by encouraging development in other fields.
Although the official language of Brunei Darussalam is Malay, English, Chinese and a number of native dialects are also spoken. In Brunei Darussalam, education is free for all citizens from the primary level (aged from five years) to the tertiary level. Students can select to attend either government schools, which are administered by the Ministry of Education, or private schools, which are funded by different communities and work directly under the supervision of Ministry of Education. During the last Five-Year Plan, more secondary schools were opened to speed up the national development program.
The school system consists of the three stages of primary education, secondary education and higher education. Students attend primary education for 7 years, which includes one year of pre-schooling. For the first four years of primary education, the medium of instruction is Malay, the official language of Brunei Darussalam. From grade 5 onwards, the medium of instruction for science and mathematics is English, whilst all other subjects are taught in Malay. Mathematics is compulsory at all grade levels from primary through to secondary levels. At the lower primary level (grades 1-3), students are taught mathematics for 12 periods a week and, at the upper primary level (grades 4-6), 10 of the 45 periods taught per week are allocated to mathematics.
At the lower secondary school level, students learn mathematics for six periods a week whilst, at the upper secondary level (form 4 and 5), five periods are allocated to mathematics. However, bright students are encouraged to study additional mathematics during these two years. After completing their 'O' Levels, students with adequate and relevant Ordinary Level passes may proceed to sixth form centres to do a further two-year pre-university course leading to the Brunei-Cambridge Advanced Level Certificate of Education or GCE ‘A’ Level. After this, students proceed to higher studies either at the University of Brunei Darussalam or abroad. Others might decide to opt for employment or to undertake education and training programs at the Sinaut Agricultural Training Centre, technical colleges, vocational schools, or the Nursing College.
During their education, students attending school in Brunei Darussalam are expected to sit for three public examinations, which are conducted by the Ministry of Education. The Primary Certificate of Education Examination (PCE) is taken at the end of primary school; the Brunei Junior Certificate of Education Examination (BJCE) is taken after three years at senior school; and the General Certificate of Education Examination (GCE ' O ' Level) is taken at the end of five years at senior school.
This study of mathematics classroom learning environments in Brunei Darussalam is described using the following headings:
• Background to the Field of Learning Environments • Research Objectives and Significance • Research Methods • Findings and Results • Discussion and Conclusions
BACKGROUND TO THE FIELD OF LEARNING ENVIRONMENTS
Although the study of learning environments has a history of three decades in other countries, it made its first appearance in Brunei Darussalam relatively recently with research into student perceptions of science classrooms by Asghar (1993), Asghar and Fraser (1995),
Poh (1995), Ling (1996) and Riah and Fraser (1997, 1998). The present study is distinctive because it was the first investigation of classroom environments in lower secondary mathematics classes in Brunei Darussalam.
Historical Background
Educational environments can be considered as the social-psychological contexts or determinants of learning (Fraser, 1994). A growing amount of interest within the field of educational research has been focused on what is described as the classroom learning environment (Fraser, 1991, 1998a; Fraser & Walberg, 1991; Moos, 1979; Walberg, 1979). This interest in human environments is also shared to some extent by researchers in other fields including those of psychology, sociology, physiology and engineering (Knirk, 1992; Vasi & Laguardia, 1992; Weinstein, 1979).
In an overview of research on classroom and school climate, Fraser (1994) noted that Herbert Walberg (1976) and Rudolf Moos (1974) independently laid the foundations in the late 1960s for later work on educational environments. Studies now conducted by educators on classroom learning environments owe much to this earlier work and its application to educational settings. Fraser described research on learning environments as being both descriptive of the classroom and potentially predictive of student learning.
A variety of approaches have been used in the study of educational environments. These methods range from so-called subjective measures, such as students’ and teachers’ perceptions of the learning environment, to so-called objective measures, such as frequency counts of certain observed behaviours. These different approaches have also been categorised as, respectively, ‘high’ and ‘low’ inference measures. Work still is needed to determine the appropriate context for the optimum usefulness of each type of methodology.
The way in which the important pioneering work of Walberg and Moos on perceptions of classroom environment developed into major research programs and spawned a lot of other research is reflected in numerous comprehensive literature overviews. These include books (Fraser, 1986; Fraser & Walberg, 1991; Moos, 1979; Walberg, 1979), monographs (Fraser, 1981; Fraser & Fisher, 1983a), guest-edited journal issues (Fraser, 1980; McRobbie & Ellett, 1997), an annotated bibliography (Moos & Spinrad, 1984), several literature reviews (Anderson & Walberg, 1974; Chavez, 1984; Fraser, 1989, 1991, 1994, 1998a; MacAuley, 1990; Randhawa & Fu, 1973; Walberg, 1976; Walberg & Haertel, 1980), including special purpose reviews with an emphasis on classroom environment work in science education (Fraser & Walberg, 1981), in Australia (Fraser, 1981), and in Germany (Dreesman, 1982; Wolf, 1983). As well, the American Educational Research Association established a very successful Special Interest Group (SIG) on the study of Learning Environments in 1984 and this group sponsored an annual monograph (e.g., Fraser, 1986, 1987, 1988; Waxman & Ellett, 1990). In 1998, Kluwer Academic Publishers initiated a new international journal called Learning Environment Research(Fraser, 1998c).
The concept of learning environment has taken root science the 1930s, especially with the emergence of Murray’s needs-press model (1938) and Lewin’s social-psychological work (1936) that recognised that behaviour is a function of the person and the environment [B=f(P, E)]. In 1960, a framework for the analysis of the classroom group as a unique social system was developed by Getzels and Thelen (1960). Stern (1970) formulated a theory of person-environment congruence in which complementary combinations of personal needs and environmental press enhance student outcomes. Later, Doyle (1979) proposed that the classroom be viewed from an ecological viewpoint, hence placing strong emphasis on the inter-relationships and communications among all members in the classroom community.
Learning activities always are accompanied by interpersonal interaction and interpersonal sentiments.
Over the previous quarter of a century, considerable interest has been shown internationally in the conceptualisation, measurement and investigation perceptions of psychosocial characteristics of the learning environment of classrooms at the primary, secondary and higher education levels (Fraser, 1986, 1994, 1998a, 1998b; Fraser & Walberg, 1991; McRobbie & Ellett, 1997). Classroom environment instruments have been used as sources of predictor and criterion variables in a variety of research studies that are reviewed below. Use of student perceptions of actual classroom environment as independent variables in several different countries has established consistent relationships between the nature of the classroom environment and various student cognitive and affective outcomes (Fraser, 1986, 1998a; Fraser & Fisher, 1982; Haertel, Walberg & Haertel, 1981). Research involving a person-environment fit perspective has shown that students achieve better where there is greater congruence between the actual classroom environment and that preferred by students (Fraser & Fisher, 1983a, 1983b). The combination of qualitative and quantitative methods has been a feature of several recent learning environment studies (Fraser & Tobin, 1991; Tobin & Fraser, 1998).
Studies involving use of the actual form of classroom environment scales as criterion variables have revealed that classroom psychosocial climate varies between different types of schools (Trickett, 1978) and between coeducational and single-sex schools (Trickett, Trickett, Castro & Schaffner, 1982). Both researchers and teachers have found it useful to employ classroom climate dimensions as process criteria of effectiveness in curriculum evaluation because they have differentiated revealingly between alternative curricula when student outcome measures have shown little sensitivity (Fraser, Williamson & Tobin, 1987). Research in the USA (Moos, 1979), Australia (Fisher & Fraser, 1983) and The Netherlands (Wubbels, Brekelmans & Hooymayers, 1991) compared students’ and teachers’ perceptions and found that, first, both students and teachers preferred a more positive classroom environment than that perceived as being actually present and, second, teachers tended to perceive the classroom environment more positively than did their students in the same classroom. In promising small-scale practical applications, teachers have used assessments of their students’ perceptions of their actual and preferred classroom environment as a basis for identification and discussion of actual-preferred discrepancies, followed by a systematic attempt to improve classrooms (Fraser & Fisher, 1986; Thorp, Burden & Fraser, 1994; Yarrow, Millwater & Fraser, 1997).
Associations Between Classroom Environment and Student Outcomes
The strongest tradition in past classroom environment research has involved investigation of associations between students’ perceptions of psychosocial characteristics of their classrooms and their cognitive and affective learning outcomes. Fraser’s (1994) tabulation of 40 past studies shows that associations between a variety of cognitive and affective outcome measures and classroom environment perceptions have been replicated using a variety of classroom environment instruments and samples ranging across numerous countries and grade levels.
Some of these studies have included the use of the Science Laboratory Environment Inventory (SLEI) and have found associations with students’ cognitive and affective outcomes for a sample of approximately 80 senior high school chemistry classes in Australia (Fraser & McRobbie, 1995; McRobbie & Fraser, 1993), 489 senior high school biology students in Australia (Fisher, Henderson & Fraser, 1997) and 1,592 Grade 10 chemistry students in Singapore (Wong & Fraser, 1995). Using an instrument suited for computer-assisted instruction classrooms, Teh and Fraser (1995a) found associations between
classroom environment, achievement and attitudes among a sample of 671 high school geography students in 24 classes in Singapore. Using the Questionnaire on Teacher Interaction (QTI), associations between students’ outcomes and perceived patterns of teacher-student interaction were reported for samples of 489 senior high school biology students in Australia (Fisher, Henderson & Fraser, 1995), 3,994 high school science and mathematics students in Australia (Fisher, Fraser & Rickards, 1997) and 1,512 primary school mathematics students in Singapore (Goh, Young & Fraser, 1995).
Although many past learning environment studies have employed techniques such as multiple regression analysis, few have used multilevel analysis (Bock, 1989; Bryk & Raudenbush, 1992), which takes cognisance of the hierarchical nature of classroom settings. Recently, however, two studies compared the results from multiple regression analysis with those from an analysis involving the hierarchical linear model. In Wong, Young and Fraser’s (1997) study in Singapore, associations were investigated between three student attitude measures and a modified version of the Science Laboratory Environment Inventory (SLEI). In Goh, Young, and Fraser's (1995) study in Singapore, scores on a modified version of the My Class Inventory (MCI) were related to student achievement and attitude. Most of the statistically significant results from the multiple regression analysis were replicated in the HLM analysis, and associations were consistent in direction.
In a meta-analysis involving 734 correlations from 12 studies involving 823 classes, eight subject areas, 17,805 students and four nations (Haertel, Walberg, & Haertel, 1981), learning posttest scores and regression-adjusted gains were consistently and strongly associated with cognitive and affective learning outcomes. Correlations were generally higher in samples of older students and in studies employing classes or schools (as opposed to individual students) as the unit of statistical analysis. In particular, better achievement on a variety of outcome measures was found consistently in classes perceived as having greater Cohesiveness, Satisfaction and Goal Direction and less Disorganisation and Friction.
In Walberg’s (1981) multi-factor psychological model of educational productivity, the psychosocial learning environment is one factor in a model which holds that learning is a function of student age, ability and motivation; of the quality and quantity of instruction; and of the psychosocial environments of the home, the classroom, the peer group and the mass media. In principle, any factor at a zero-point results in zero learning. Moreover, it does less good to raise a factor that already is high than to improve one that currently is the main constraint to learning. Empirical probes of the educational productivity model involved extensive research syntheses involving the correlations of learning with factors in the model (Fraser, Walberg, Welch & Hattie, 1987; Walberg, 1986) and secondary analyses of large data bases collected as part of the National Assessment of Educational Achievement (Walberg, 1986). Classroom and school environment was found to be a strong predictor of both achievement and attitudes even when a comprehensive set of other factors in the productivity model was held constant.
Studies have also used actual and preferred forms of educational environment instruments together to examine whether students achieve better when there is a higher similarity between the actual classroom environment and that preferred by students (Fraser & Fisher, 1983a, 1983b). Findings from past studies suggest that actual-preferred congruence (or person-environment fit) could be as important as the environment per se in predicting student achievement of affective and cognitive aims. These findings suggest that changing the actual classroom environment in ways that make it more congruent with that preferred by the class are likely to enhance student outcomes.
Replications and Cross-National Studies in Asian Countries
Educational research which crosses national boundaries offers much promise for generating new insights for at least two reasons (Fraser, 1997). First, there usually is greater variation in variables of interest (e.g. teaching methods, student attitudes) in a sample drawn from multiple countries than from a one-country sample. Second, the taken-for-granted familiar educational practices, beliefs and attitudes in one country can be exposed, made ‘strange’ and questioned when research involves two countries.
Reviews of past research on educational environments certainly attest to its international character and indicate that research which first began in one country sometimes has been replicated in other countries. However, it is rare for learning environment researchers to design from the outset studies that involve the cross-national development, validation and application of instruments for assessing educational environments. Fraser, Giddings and McRobbie (1995), however, describe a study in which the Science Laboratory Environment Inventory was validated and applied simultaneously in six countries (the USA, Canada, England, Australia, Israel and Nigeria). This study involved approximately 5,500 students in approximately 270 classes at the senior high school and higher education levels. In addition, Fraser, Giddings and McRobbie (1995) provide a useful overview of the major advantages of cross-national research and some timely warnings about the pitfalls that need to be avoided in future cross-national studies.
Although a recent literature review (Fraser, 1998a) shows that the majority of the classroom environment studies ever undertaken involved Western students, a number of important studies have been carried out in non-Western countries. Early studies established the validity of classroom environment instruments that had been translated into the Indian (Walberg, Singh & Rasher, 1977) and Indonesian (Fraser, Pearse & Azmi, 1982; Schibeci, Rideng & Fraser, 1987) languages and replicated associations between student outcomes and classroom environment perceptions. Recently, Asian researchers working in Singapore (Chionh & Fraser, 1998; Fraser & Chionh, 2000; Goh, Young & Fraser, 1995; Teh & Fraser, 1994, 1995a, 1995b; Wong & Fraser, 1996), Brunei (Riah & Fraser, 1998), Korea (Kim, Fisher & Fraser, 1999; Lee & Fraser, 2001) and Indonesia (Margianti & Fraser, 2000) have made important contributions to the field of learning environments.
In Singapore, the growing pool of literature related to classroom learning environments across different subjects includes computing (Khoo & Fraser, 1998; Teh & Fraser, 1994), geography (Chionh & Fraser, 1998), mathematics (Goh, Young & Fraser, 1995) and science (Wong & Fraser, 1996; Wong, Young & Fraser, 1997). Also a study from Brunei investigated how the introduction of new curricula has influenced learning environment in high school chemistry classes (Riah & Fraser, 1998). The questionnaires used in these studies were written in English and validated for use in Singapore or Brunei. The findings in each study replicate those of past research, reporting strong associations between the learning environment and student outcomes for almost all scales.
In Hong Kong, qualitative methods involving open-ended questions were used to explore students’ perceptions of the learning environment in Grade 9 classrooms (Wong, 1993, 1996). This study found that many students identified the teacher as the most crucial element in a positive classroom learning environment. These teachers were found to keep order and discipline whilst creating an atmosphere that was not boring or solemn. They also interacted with students in ways that could be considered friendly and showed concern for the students. Also, in Hong Kong, Cheung (1993) used multilevel analysis to investigate the effects of the learning environment on students’ learning. The findings of this study provide insights that could help to explain why Hong Kong was found to rank highly in achievement in physics, chemistry and biology in international comparisons (Keeves, 1992).
A study in Taiwan went beyond past research in non-Western countries to involve a multimethod approach that emerged in the light of new findings (Aldridge & Fraser, 2000; Aldridge, Fraser & Huang, 1999). The study was used not only to replicate previous research, but also to explore causal factors associated with students’ perceptions of their learning environment. Furthermore, by drawing on a range of paradigms, past research on learning environments was extended by piecing together a more in-depth understanding of social and cultural influences on the classroom environments created in each country.
In this cross-national study, six Australian and seven Taiwanese researchers worked together on research on learning environments (Aldridge & Fraser, 2000; Aldridge, Fraser & Huang, 1999). The What is Happening in this Class questionnaire (WIHIC; Fraser, Fisher & McRobbie, 1996) was administered to 50 junior high school science classes in each of Taiwan (1,879 students) and Australia (1,081 students). Team members translated an English version of the questionnaire into Chinese, and this was followed by team members who were not involved in the original translation doing an independent back translation of the Chinese version into English again. Qualitative data, involving interviews with teachers and students and classroom observations, were collected to complement the quantitative information and to clarify reasons for patterns and differences in the means in each country.
The largest differences in means between the two countries occurred for the scales of Involvement and Equity, with Australian students perceiving each scale more positively than students from Taiwan. Data from the questionnaires guided the collection of qualitative data. Student responses to individual items were used to form an interview schedule to clarify whether students had interpreted items consistently and to help to explain differences in questionnaire scale means between countries. Classrooms were selected for observations on the basis of the questionnaire data, and specific scales formed the focus for observations in these classrooms. The qualitative data provided valuable insights into the perceptions of students in each of the countries, helped to explain some of the differences in the means between countries, and highlighted the need for caution when interpreting differences between the questionnaire results from two countries with cultural differences (Aldridge, Fraser & Huang, 1999).
In Brunei Darussalam, classroom environment research is fairly recent and has involved the investigation of associations between classroom environments and students' outcomes. Research on learning environments in Brunei Darussalam includes a study of lower secondary schools using the Individualised Classroom Environment Questionnaire (ICEQ; Fraser, 1990). In this study, Asghar (1993) found that Grade 7 students perceived a more positive classroom environment than did Grade 9 students. Moreover, he found no gender differences in the students' perception of Grade 9 classroom environments. In another study involving senior high school students in Brunei Darussalam using the Science Laboratory Environment Inventory (SLEI; Fraser, Giddings & McRobbie, 1992) to measure students' psychosocial perceptions of biology laboratory environment, Poh (1995) reported that classroom environment dimensions were related to laboratory process skills.
A study by Asghar and Fraser (1995), using the Individualised Classroom Environment Questionnaire (ICEQ), found that classroom environment dimensions were predictors of students' attitudinal outcomes in lower secondary schools in Brunei. Ling (1996) studied primary students' perceptions of mathematics classroom environment in Brunei Darussalam and reported that students preferred a more favourable classroom environment than was actually present.
In a cross-validation study using the What is Happening in this Class? (WIHIC; Fraser, Fisher & McRobbie, 1996) questionnaire, Science Laboratory Environment Inventory (SLEI; Fraser, Giddings & McRobbie, 1992) and Questionnaire on Teacher Interaction(QTI;
Wubbels & Levy, 1993), a sample of 644 grade 10 chemistry students from 23 schools in Brunei, Riah and Fraser (1997, 1998) reported positive student perceptions of their chemistry theory and laboratory classroom environments. The results also highlighted that some aspects of the learning environment and teacher interpersonal behaviour are associated with students' cognitive outcomes.
Scott and Fisher (2000) investigated students’ perceptions of science teachers’ interpersonal behaviours in government primary schools in Brunei Darussalam. The study validated a version of a 48-item Australian version of the Questionnaire on Teacher Interaction (QTI; Wubbels & Levy 1993) that had been translated into Standard Malay. Analyses of the data collected from a sample of 3,104 students in 136 primary school classes supported the reliability and validity of the Standard Malay version of the QTI. Scott and Fisher (2000) reported statistically significant correlations between the scores achieved by students on an external science examination and three of the eight QTI scales, namely, Helping/Friendly, Understanding and Uncertainty behaviour.
The results of this cross-validation study supported that these instruments are reliable and valid for use in Brunei Darussalam. In particular, each scale in each instrument displayed satisfactory internal consistency reliability with either of the student or class mean as the unit of analysis, as well as differentiating between the perceptions of students in different classrooms. Riah and Fraser (1998) established the factorial validity of the WIHIC and SLEI in Brunei. The study also supported the notion that classroom environment instruments developed originally in Western countries can be reliable and valid for use in different cultural settings.
The present study is consistent with, but extends, the traditions of past learning environment research begun in Brunei Darussalam. It cross-validated a different classroom environment questionnaire (namely, the My Class Inventory) and used it in a number of research applications. A distinctive feature of the study is that it is the first learning environment study in mathematics classes in Brunei.
RESEARCH OBJECTIVES AND SIGNIFICANCE
The problems in mathematics education in Brunei Darussalam include concerns about falling student achievement in mathematics, as well as students’ lack of motivation for learning mathematics, a centralised system of education, and the presence of numerous external examinations that are likely to encourage teacher-centred classroom practices and a preoccupation with preparing students for examinations. Given this context of mathematics education in Brunei Darussalam, it was timely to undertake the first study of mathematics classroom environments in that country. As a foundation for future research and future attempts for reform mathematics education in Brunei Darussalam, it is important to have high-quality baseline information about the nature and effects of classroom learning environments. Consequently, the study described in this paper was undertaken into the assessment, description and effects on students of mathematics classroom environments in Brunei Darussalam. The present study included four main objectives:
1. To validate the My Class Inventory (MCI) for assessing perceptions of classroom learning environment among lower secondary school mathematics students in Brunei Darussalam in terms of (a) factor structure, (b) scale internal consistency reliability and (c) ability to differentiate between classrooms.
2. To describe the typical mathematics classroom environment at the lower secondary level in Brunei Darussalam in terms of the dimensions of the MCI.
3. To investigate within-class sex differences in student perceptions of the mathematics classroom learning environment.
4. To investigate associations between student satisfaction and the nature of the mathematics classroom learning environment.
This study is important because it is one of the first studies of learning environments in Brunei Darussalam. As such, this research has the potential to provide baseline information to guide policy-makers and practitioners in future improvement attempts, and to provide future researchers with a widely-applicable and validated instrument for assessing classroom environment. Also, this study represents one of only a handful of learning environment studies anywhere in the world that has focused specifically on mathematics classes. As such, it is likely to contribute to the international field of learning environment research.
The study also is significant as it validated, with a large sample, a generally applicable and easy-to-read questionnaire for future use by researchers and teachers in Brunei. Because the MCI provides the lowest reading level of all existing classroom environment instruments, it was the natural choice for the present study. A revised factor structure was established that can be used in future studies, and this is a noteworthy contribution because the factorial validity of the MCI has not been established in previous research.
The practical significance of the study is that findings of relationships between student satisfaction and classroom environment provides tentative guidance for improving student satisfaction through changing the classroom environment.
RESEARCH METHODS
The purpose of this study was to assess and investigate the perceptions of psychosocial characteristics of mathematics classroom learning environments in government junior secondary schools in Brunei Darussalam. The choice of research method, instrument, sample and statistical analyses are described below.
Choice of Methodology for Studying Classroom Environment
Three common approaches to studying classroom environment involve systematic observation, case studies, and assessing student and teacher perceptions. Perceptual measures formed the major focus in this study. Some strengths of this approach are outlined by Fraser and Walberg (1981). First, paper-and-pencil perceptual measures are more economical than classroom observation techniques that involve the expense of trained outside observers. Second, perceptual measures are based on students’ experiences over many lessons, while observational data usually are restricted to a very small number of lessons. Third, perceptual measures involve the pooled judgements of all students in a class, whereas observation techniques typically involve only a single observer. Fourth, students’ perceptions, because they are the determinants of student behaviour more so than the real situation, can be more important than observed behaviours. Fifth, perceptual measures of classroom environment typically have been found to account for considerably more variance in student learning outcomes than have directly-observed variables. Although questionnaire surveys formed the main data-gathering method in this study, the advantages of combining quantitative and qualitative methods in learning environment research are fully acknowledged (Tobin & Fraser, 1998).
Instrument Chosen for Assessing Classroom Environment: The My Class Inventory (MCI)
The My Class Inventory (MCI) was the major instrument used in the present study. The initial development and validation of the Learning Environment Inventory (LEI) began in the late 1960s in conjunction with the evaluation and research related to Harvard Project Physics (Fraser, Anderson & Walberg, 1982; Walberg & Anderson, 1968). The final version contains 105 statements in 15 scales (seven per scale) descriptive of typical school classes. However, because the LEI was designed for the senior high school level, it is too long and too difficult to read for students at lower grade levels (e.g., junior high school students for whom English is not their first language, as in the present research).
The My Class Inventory (MCI) is a simplified form of LEI for use among children aged 8-12 years (Fisher & Fraser, 1981; Fraser, Anderson & Walberg, 1982; Fraser & O'Brien, 1985). Although the MCI was developed originally for use at the primary school level, it also has been found to be useful with students in the junior high school, especially those with limited reading skills in English (e.g., the sample in the present study). The MCI differs from the LEI in five important ways, First, in order to minimise fatigue among younger children, the MCI contains only five of the LEI's original 15 scales. Second, item wording is simplified to enhance readability. Third, the LEI's four-point response format is reduced to a two-point (Yes-No) response format. Fourth, students answer on the questionnaire itself instead of on a separate response sheet to avoid errors in transferring responses from one place to another.
The final form of the MCI contains 38 items altogether, although Fraser and O'Brien (1985) developed a short 25-item version. Typical items are "Children are always fighting with each other" (Friction) and "Most children can do their school work without help" (Difficulty). Goh, Young and Fraser (1995) changed the MCI's Yes-No response format to a three-point response format (Seldom, Sometimes and Most of the Time) in a modified version of the MCI which includes a Task Orientation scale and which was used in Singapore. The original version of the MCI, with 38 items and the Yes-No response format, was used in the present investigation.
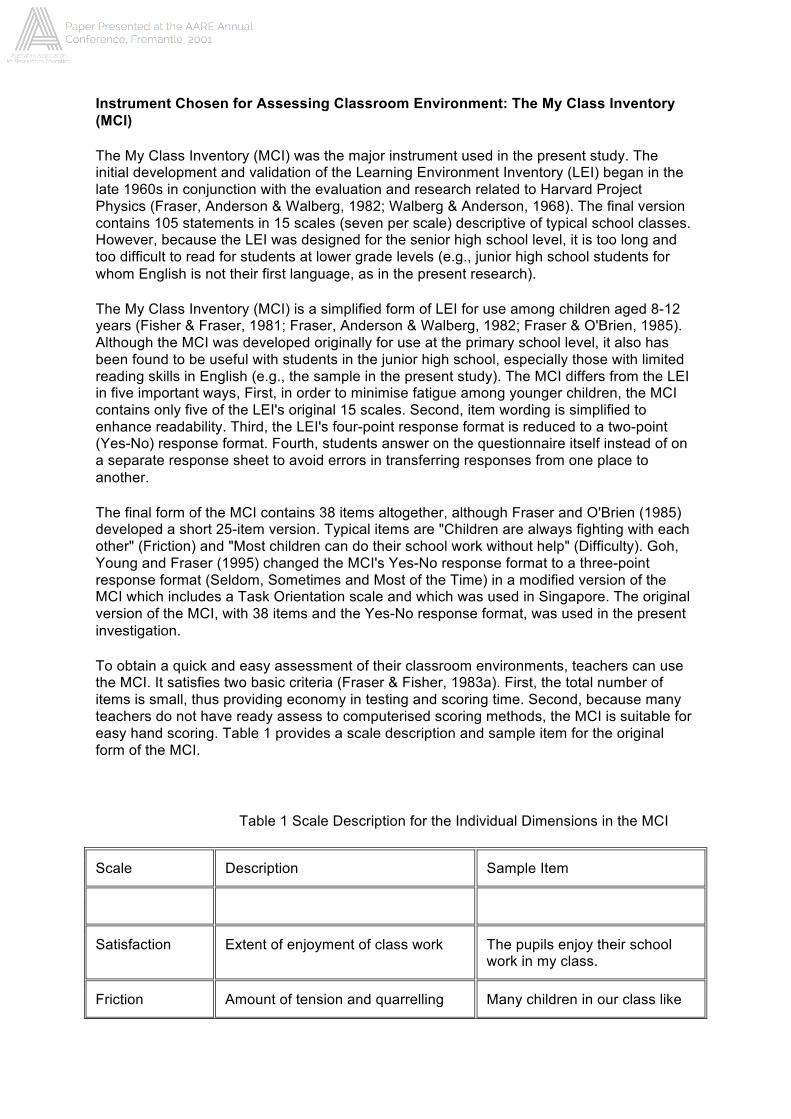
To obtain a quick and easy assessment of their classroom environments, teachers can use the MCI. It satisfies two basic criteria (Fraser & Fisher, 1983a). First, the total number of items is small, thus providing economy in testing and scoring time. Second, because many teachers do not have ready assess to computerised scoring methods, the MCI is suitable for easy hand scoring. Table 1 provides a scale description and sample item for the original form of the MCI.
Table 1 Scale Description for the Individual Dimensions in the MCI
Scale Description Sample Item
Satisfaction Extent of enjoyment of class work The pupils enjoy their school work in my class.
Friction Amount of tension and quarrelling Many children in our class like
among students to fight.
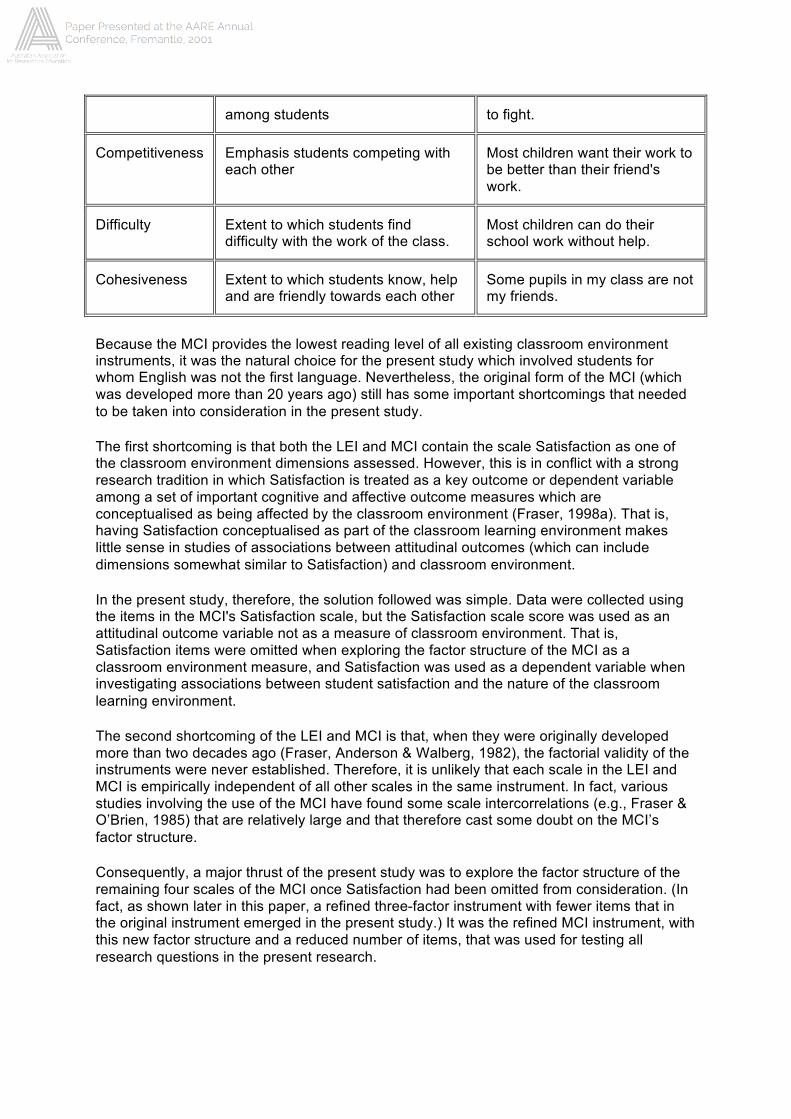
Competitiveness Emphasis students competing with each other
Most children want their work to be better than their friend's work.
Difficulty Extent to which students find difficulty with the work of the class.
Most children can do their school work without help.
Cohesiveness Extent to which students know, help and are friendly towards each other
Some pupils in my class are not my friends.
Because the MCI provides the lowest reading level of all existing classroom environment instruments, it was the natural choice for the present study which involved students for whom English was not the first language. Nevertheless, the original form of the MCI (which was developed more than 20 years ago) still has some important shortcomings that needed to be taken into consideration in the present study.
The first shortcoming is that both the LEI and MCI contain the scale Satisfaction as one of the classroom environment dimensions assessed. However, this is in conflict with a strong research tradition in which Satisfaction is treated as a key outcome or dependent variable among a set of important cognitive and affective outcome measures which are conceptualised as being affected by the classroom environment (Fraser, 1998a). That is, having Satisfaction conceptualised as part of the classroom learning environment makes little sense in studies of associations between attitudinal outcomes (which can include dimensions somewhat similar to Satisfaction) and classroom environment.
In the present study, therefore, the solution followed was simple. Data were collected using the items in the MCI's Satisfaction scale, but the Satisfaction scale score was used as an attitudinal outcome variable not as a measure of classroom environment. That is, Satisfaction items were omitted when exploring the factor structure of the MCI as a classroom environment measure, and Satisfaction was used as a dependent variable when investigating associations between student satisfaction and the nature of the classroom learning environment.
The second shortcoming of the LEI and MCI is that, when they were originally developed more than two decades ago (Fraser, Anderson & Walberg, 1982), the factorial validity of the instruments were never established. Therefore, it is unlikely that each scale in the LEI and MCI is empirically independent of all other scales in the same instrument. In fact, various studies involving the use of the MCI have found some scale intercorrelations (e.g., Fraser & O’Brien, 1985) that are relatively large and that therefore cast some doubt on the MCI’s factor structure.
Consequently, a major thrust of the present study was to explore the factor structure of the remaining four scales of the MCI once Satisfaction had been omitted from consideration. (In fact, as shown later in this paper, a refined three-factor instrument with fewer items that in the original instrument emerged in the present study.) It was the refined MCI instrument, with this new factor structure and a reduced number of items, that was used for testing all research questions in the present research.
The Sample
The sample to which the MCI was administered consisted of a large and representative group of 1,565 students (747 boys and 818 girls) at the lower secondary school (Form 2) level in 81 mathematics classes from 15 government secondary schools throughout Brunei Darussalam. This represents almost 80% of the total population of Form 2 students in government schools in Brunei Darussalam. The sample included one boys’ and two girls’ schools, with the rest of the schools being coeducational institutions. The average class size was 25, and ranged from 20 to 35 students. Twelve schools were from Brunei Muara, two schools from Tutong, and one school from the Kuala Balit district.
Data Analysis Methods
Validation of MCI
The SPSS (version 6.1) statistical package was used to analyse students’ responses to furnish evidence for the MCI regarding factor structure, scale internal consistency reliability, and ability to differentiate between the perception of students in different classrooms. Both factor and item analyses were conducted. A principal components factor analysis with varimax rotation was used to determine whether all of the items from the four MCI scales in the original questionnaire (Cohesiveness, Friction, Difficulty and Competition) formed four independent measures of the psychosocial learning environment (once the Satisfaction scale had been omitted from consideration). The factor analysis led to a refined instrument with fewer items and fewer scales.
The Cronbach alpha coefficient was computed for each scale of the MCI as an estimate of the internal consistency reliability. The discriminant validity of each scale was determined by calculating the mean correlation of each scale with other scales. All of these analyses were performed at both the individual student and the class levels. An ANOVA (with class membership as the independent variable) was used to determine the ability of each MCI scale to differentiate between classes.
Descriptive Analysis
To describe the classroom environment of mathematics classes in Brunei Darussalam, descriptive analysis, based on students’ responses to the MCI, were used. The average item mean, or the scale mean divided by the number of items in a scale, was used as the basis of comparison between different scales of the MCI. These were used to produce graphical representations of students’ average perceptions of their classroom environment for the whole sample as well as the average student perceptions of their classroom environment for two classes to illustrate some of the variations within the sample.
Associations Between Satisfaction and Classroom Environment
The strongest tradition in past classroom environment research has involved investigation of associations between students’ cognitive and affective learning outcomes and their perceptions of psychosocial characteristics of their classrooms (Fraser, 1998a; Haertel, Walberg & Haertel, 1981). Numerous research programs have shown that student perceptions account for appreciable amounts of variance in learning outcomes, often beyond that attributable to background student characteristics. In the present study, associations between student satisfaction and aspects of the mathematics classroom environment were investigated using simple correlations, multiple correlations and standardised regression coefficients at both the student and class levels.
Sex Differences in Mathematics Classroom Learning Environments
Over the past two decades, many researchers have studied the topic of gender differences, especially in mathematics and science education (Parker, Rennie & Fraser, 1996). Models to explain gender-related behaviour have become more complex (Terwel, Brekelmans, Wubbels, & Eeden. 1994). One approach to research into gender and mathematics is the development and testing of intervention programs that are supposed to have a positive effect on the achievements and attitudes of girls (Kelly, 1987).
To examine sex differences in classroom environment perceptions and in satisfaction in the present study, data were analysed with a one-way MANOVA for repeated measures and using the within-class gender subgroup mean as the unit of analysis. Sex was the repeated measures factor, and the MCI scales formed the set of dependent variables. Because the multivariate test produced statistically significant results, a t test for correlated samples was used for each individual MCI scale to investigate whether boys and girls had different perceptions of their classrooms. As boys and girls are not found in equal number in every class, the within-class gender mean was chosen as the unit of analysis, and the analyses were restricted to coeducational classes. The within-class gender mean provides a matched pair of means — one within-class mean for boys and one within-class mean for girls. This reduces confounding in that, for each group of boys within a particular classroom, there is a corresponding group of girls in the same classroom.
FINDINGS AND RESULTS
The purposes of this study of learning environments in mathematics classrooms were to (1) validate the MCI for use in Brunei Darussalam in terms of factor structure, internal consistency reliability and ability to differentiate between classrooms, (2) to describe the average classroom environment in terms of the dimensions of the MCI, (3) to investigate associations between classroom environment and students’ satisfaction, and (4) to investigate gender differences in students’ perceptions of classroom environment. These four aims are used to structure the discussion below.
Validity of the MCI Scales
Factor Structure
Using the questionnaire data obtained from 1,565 students, factor and item analyses were conducted in order to identify faulty questionnaire items that could be removed in order to improve the internal consistency reliability and factorial validity of the four scales in the MCI. The Satisfaction scale was omitted from these analyses, which were restricted to the four original scales of Competition, Cohesiveness, Friction and Difficulty.
Several principal component factor analyses with varimax rotation eventually resulted in the factor loadings presented in Table 2 as the best structure based on the present data base. As a result of the analyses, 21 items from the MCI scales were retained from the original questionnaire in the three independent scales of student Cohesiveness, Difficulty and Competition. Table 3 shows the factor loading for each of the 21 items for the individual as the unit of analysis.
The originally separate scales of Competition and Friction came together to form one scale that was named as Competition. The a priori factor structure of the revised version of the questionnaire was replicated using the student as the unit of analysis. Nearly all of the 21 items had a factor loading of at least 0.30 on their a priori scale and no other scale (see Table 3).
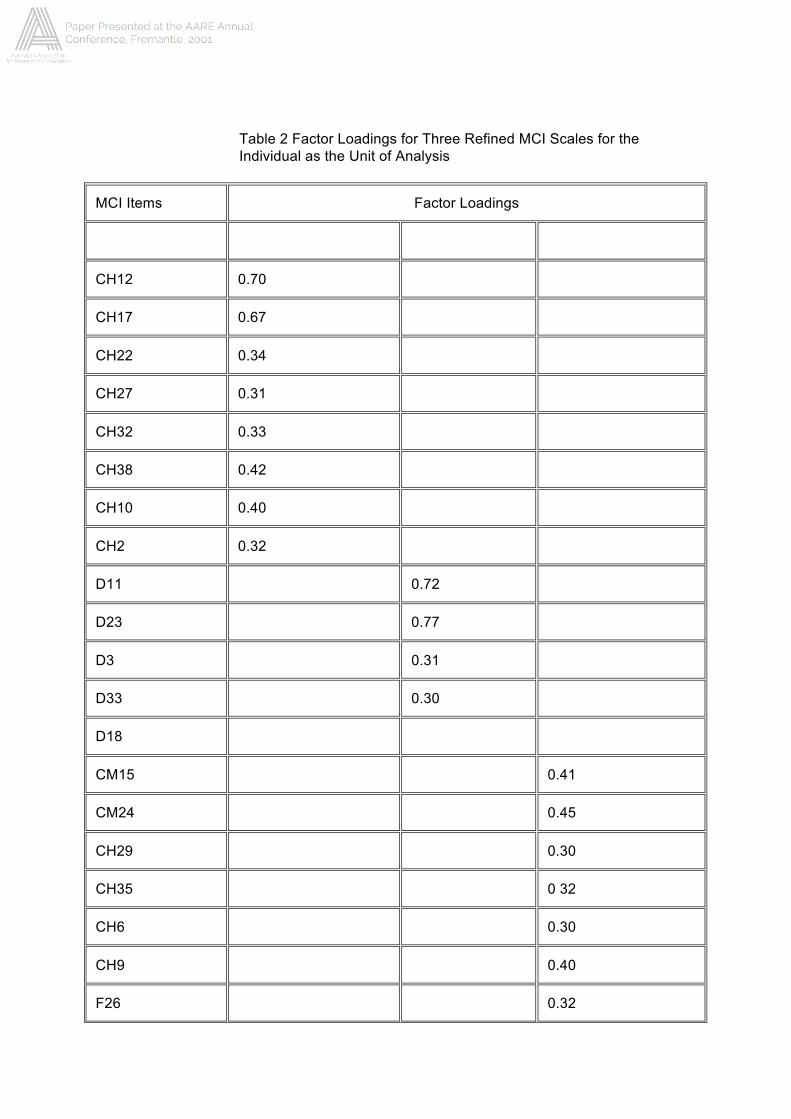
Table 2 Factor Loadings for Three Refined MCI Scales for the Individual as the Unit of Analysis
MCI Items Factor Loadings
CH12 0.70
CH17 0.67
CH22 0.34
CH27 0.31
CH32 0.33
CH38 0.42
CH10 0.40
CH2 0.32
D11 0.72
D23 0.77
D3 0.31
D33 0.30
D18
CM15 0.41
CM24 0.45
CH29 0.30
CH35 0 32
CH6 0.30
CH9 0.40
F26 0.32
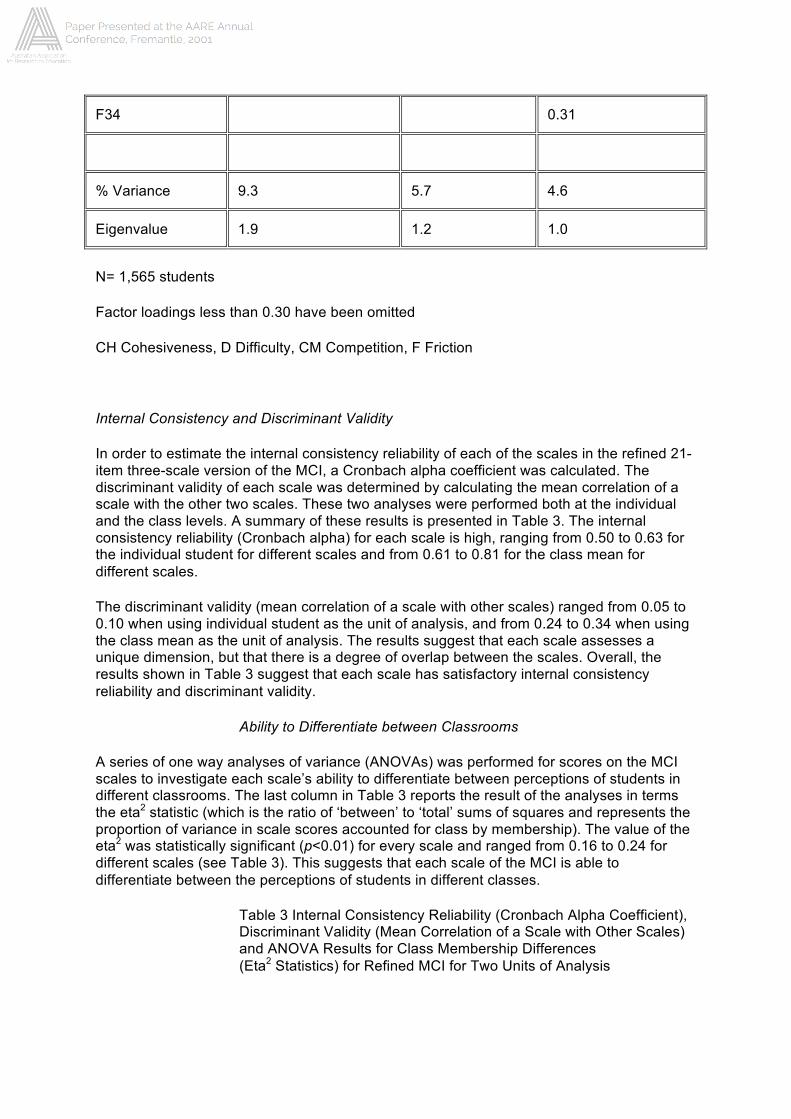
F34 0.31
% Variance 9.3 5.7 4.6
Eigenvalue 1.9 1.2 1.0
N= 1,565 students
Factor loadings less than 0.30 have been omitted
CH Cohesiveness, D Difficulty, CM Competition, F Friction
Internal Consistency and Discriminant Validity
In order to estimate the internal consistency reliability of each of the scales in the refined 21-item three-scale version of the MCI, a Cronbach alpha coefficient was calculated. The discriminant validity of each scale was determined by calculating the mean correlation of a scale with the other two scales. These two analyses were performed both at the individual and the class levels. A summary of these results is presented in Table 3. The internal consistency reliability (Cronbach alpha) for each scale is high, ranging from 0.50 to 0.63 for the individual student for different scales and from 0.61 to 0.81 for the class mean for different scales.
The discriminant validity (mean correlation of a scale with other scales) ranged from 0.05 to 0.10 when using individual student as the unit of analysis, and from 0.24 to 0.34 when using the class mean as the unit of analysis. The results suggest that each scale assesses a unique dimension, but that there is a degree of overlap between the scales. Overall, the results shown in Table 3 suggest that each scale has satisfactory internal consistency reliability and discriminant validity.
Ability to Differentiate between Classrooms
A series of one way analyses of variance (ANOVAs) was performed for scores on the MCI scales to investigate each scale’s ability to differentiate between perceptions of students in different classrooms. The last column in Table 3 reports the result of the analyses in terms the eta2 statistic (which is the ratio of ‘between’ to ‘total’ sums of squares and represents the proportion of variance in scale scores accounted for class by membership). The value of the eta2 was statistically significant (p<0.01) for every scale and ranged from 0.16 to 0.24 for different scales (see Table 3). This suggests that each scale of the MCI is able to differentiate between the perceptions of students in different classes.
Table 3 Internal Consistency Reliability (Cronbach Alpha Coefficient), Discriminant Validity (Mean Correlation of a Scale with Other Scales) and ANOVA Results for Class Membership Differences (Eta2 Statistics) for Refined MCI for Two Units of Analysis
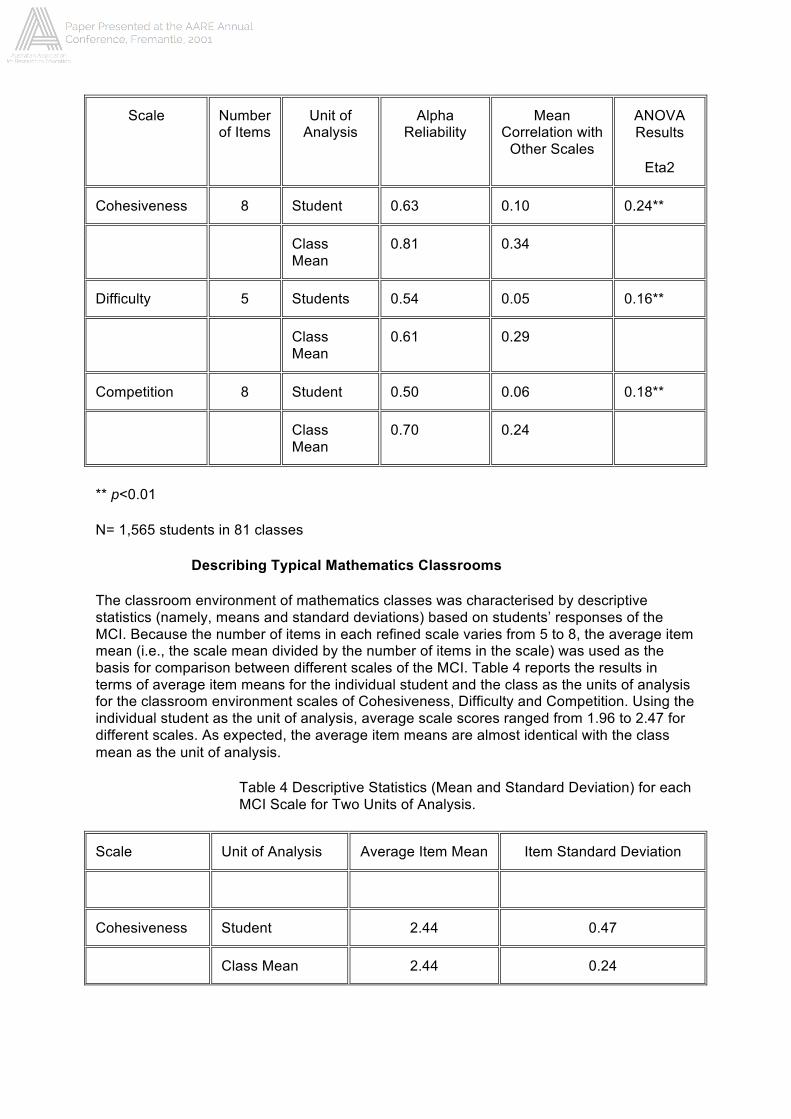
Scale Number of Items
Unit of Analysis
Alpha Reliability
Mean Correlation with
Other Scales
ANOVA Results
Eta2
Cohesiveness 8 Student 0.63 0.10 0.24**
Class Mean
0.81 0.34
Difficulty 5 Students 0.54 0.05 0.16**
Class Mean
0.61 0.29
Competition 8 Student 0.50 0.06 0.18**
Class Mean
0.70 0.24
** p<0.01
N= 1,565 students in 81 classes
Describing Typical Mathematics Classrooms
The classroom environment of mathematics classes was characterised by descriptive statistics (namely, means and standard deviations) based on students’ responses of the MCI. Because the number of items in each refined scale varies from 5 to 8, the average item mean (i.e., the scale mean divided by the number of items in the scale) was used as the basis for comparison between different scales of the MCI. Table 4 reports the results in terms of average item means for the individual student and the class as the units of analysis for the classroom environment scales of Cohesiveness, Difficulty and Competition. Using the individual student as the unit of analysis, average scale scores ranged from 1.96 to 2.47 for different scales. As expected, the average item means are almost identical with the class mean as the unit of analysis.
Table 4 Descriptive Statistics (Mean and Standard Deviation) for each MCI Scale for Two Units of Analysis.
Scale Unit of Analysis Average Item Mean Item Standard Deviation
Cohesiveness Student 2.44 0.47
Class Mean 2.44 0.24
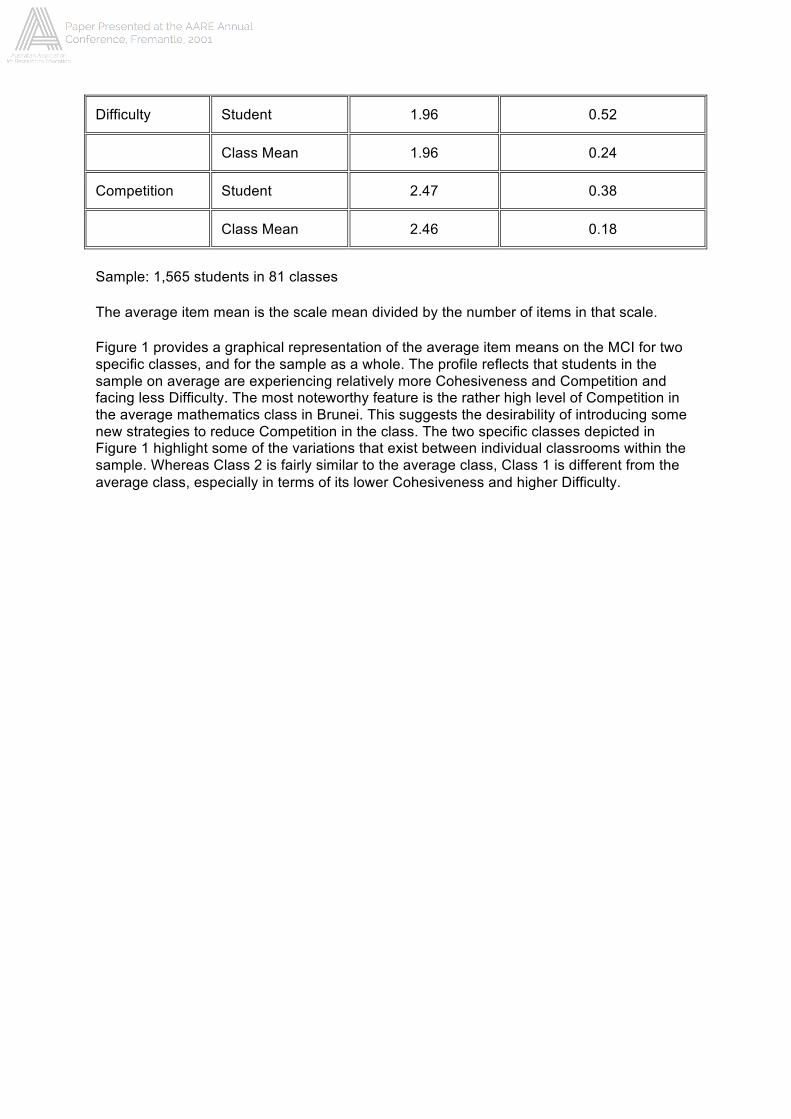
Difficulty Student 1.96 0.52
Class Mean 1.96 0.24
Competition Student 2.47 0.38
Class Mean 2.46 0.18
Sample: 1,565 students in 81 classes
The average item mean is the scale mean divided by the number of items in that scale.
Figure 1 provides a graphical representation of the average item means on the MCI for two specific classes, and for the sample as a whole. The profile reflects that students in the sample on average are experiencing relatively more Cohesiveness and Competition and facing less Difficulty. The most noteworthy feature is the rather high level of Competition in the average mathematics class in Brunei. This suggests the desirability of introducing some new strategies to reduce Competition in the class. The two specific classes depicted in Figure 1 highlight some of the variations that exist between individual classrooms within the sample. Whereas Class 2 is fairly similar to the average class, Class 1 is different from the average class, especially in terms of its lower Cohesiveness and higher Difficulty.
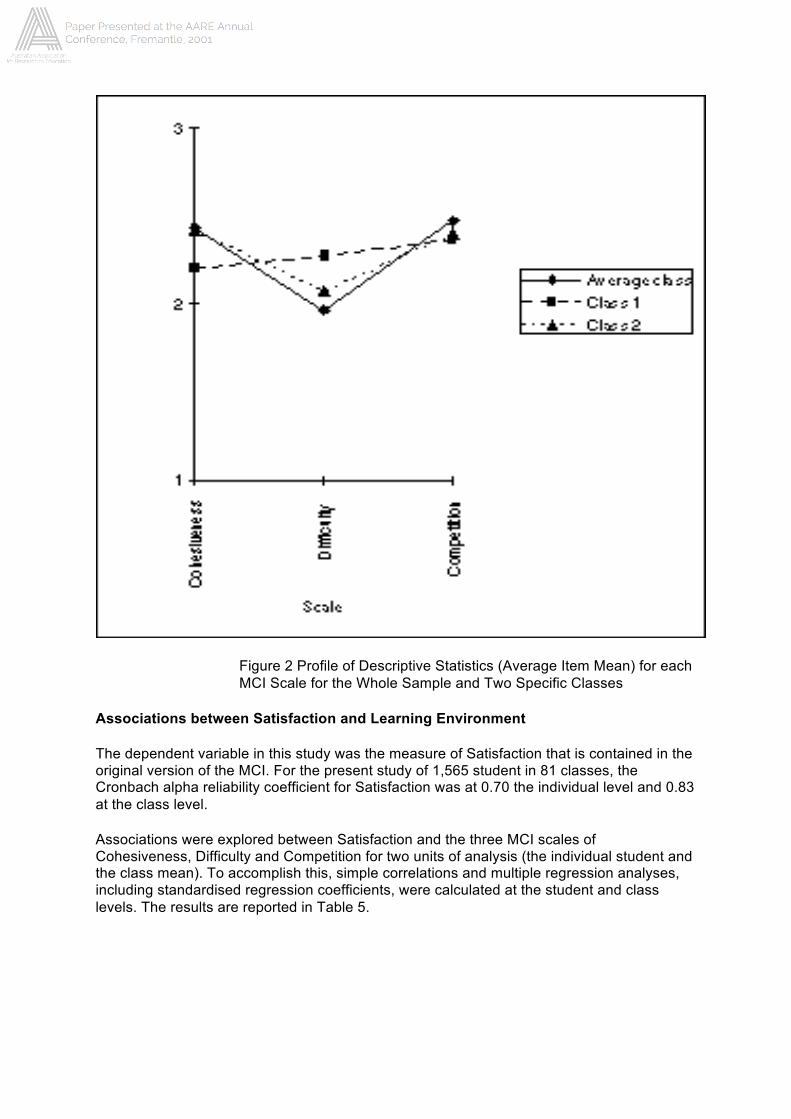
Figure 2 Profile of Descriptive Statistics (Average Item Mean) for each MCI Scale for the Whole Sample and Two Specific Classes
Associations between Satisfaction and Learning Environment
The dependent variable in this study was the measure of Satisfaction that is contained in the original version of the MCI. For the present study of 1,565 student in 81 classes, the Cronbach alpha reliability coefficient for Satisfaction was at 0.70 the individual level and 0.83 at the class level.
Associations were explored between Satisfaction and the three MCI scales of Cohesiveness, Difficulty and Competition for two units of analysis (the individual student and the class mean). To accomplish this, simple correlations and multiple regression analyses, including standardised regression coefficients, were calculated at the student and class levels. The results are reported in Table 5.
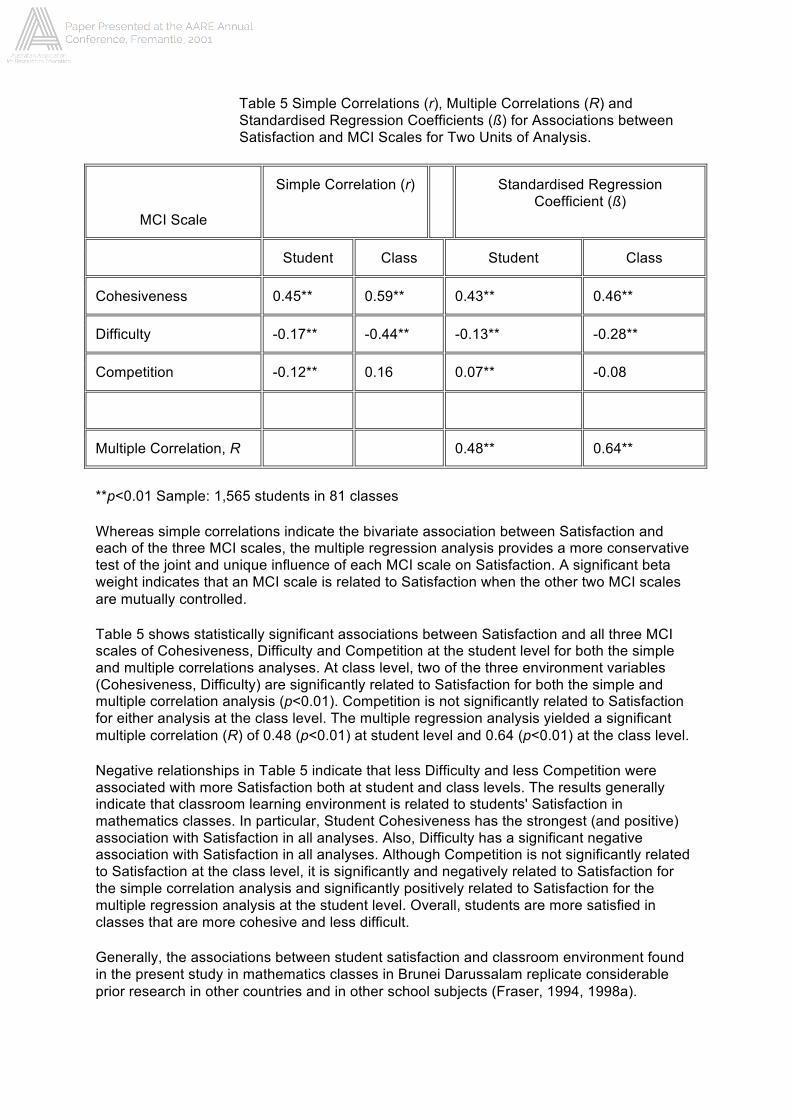
Table 5 Simple Correlations (r), Multiple Correlations (R) and Standardised Regression Coefficients (ß) for Associations between Satisfaction and MCI Scales for Two Units of Analysis.
MCI Scale
Simple Correlation (r) Standardised Regression Coefficient (ß)
Student Class Student Class
Cohesiveness 0.45** 0.59** 0.43** 0.46**
Difficulty -0.17** -0.44** -0.13** -0.28**
Competition -0.12** 0.16 0.07** -0.08
Multiple Correlation, R 0.48** 0.64**
**p<0.01 Sample: 1,565 students in 81 classes
Whereas simple correlations indicate the bivariate association between Satisfaction and each of the three MCI scales, the multiple regression analysis provides a more conservative test of the joint and unique influence of each MCI scale on Satisfaction. A significant beta weight indicates that an MCI scale is related to Satisfaction when the other two MCI scales are mutually controlled.
Table 5 shows statistically significant associations between Satisfaction and all three MCI scales of Cohesiveness, Difficulty and Competition at the student level for both the simple and multiple correlations analyses. At class level, two of the three environment variables (Cohesiveness, Difficulty) are significantly related to Satisfaction for both the simple and multiple correlation analysis (p<0.01). Competition is not significantly related to Satisfaction for either analysis at the class level. The multiple regression analysis yielded a significant multiple correlation (R) of 0.48 (p<0.01) at student level and 0.64 (p<0.01) at the class level.
Negative relationships in Table 5 indicate that less Difficulty and less Competition were associated with more Satisfaction both at student and class levels. The results generally indicate that classroom learning environment is related to students' Satisfaction in mathematics classes. In particular, Student Cohesiveness has the strongest (and positive) association with Satisfaction in all analyses. Also, Difficulty has a significant negative association with Satisfaction in all analyses. Although Competition is not significantly related to Satisfaction at the class level, it is significantly and negatively related to Satisfaction for the simple correlation analysis and significantly positively related to Satisfaction for the multiple regression analysis at the student level. Overall, students are more satisfied in classes that are more cohesive and less difficult.
Generally, the associations between student satisfaction and classroom environment found in the present study in mathematics classes in Brunei Darussalam replicate considerable prior research in other countries and in other school subjects (Fraser, 1994, 1998a).
Sex Differences in Classroom Environment Perceptions
It is well-documented in reviews of literature that women are under-represented in science and technological courses and careers (Greenfield, 1996; Kahle & Meece, 1994) and that boys outperform girls in science (especially physical science) (Beller & Gafni, 1996; Kahle & Meece, 1994; Murphy, 1996). Among the sources that could explain these differences are individual, cognitive, attitudinal, sociocultural, home and family, and educational variables (Baker, 1998; Farenga & Joyce, 1997; Kahle & Meece, 1994). In the classroom context, boys and girls might not have equal opportunities in science activities, and this could cause gender differences in science achievement (Fraser, Tobin & Kahle, 1992; Harding 1996; Warrington & Younger, 1996). Because educational variables are one of the important sources for accounting for gender differences in students’ achievement in science, and for participation in science activities, a study of sex differences in learning environments could provide a useful perspective for understanding these differences (Riah & Fraser, 1998).
In order to avoid the confounding that can arise when gender comparisons are based on a sample drawn from single-sex schools, only the 64 coeducational classes were included in the analyses. Also, because boys and girls are not found in equal number in every class, the unit of analysis chosen was the within-class gender mean. Therefore, every class provided a matched pair of means — one within-class mean for boys and one within-class mean for girls. This reduced confounding by providing a ‘counterbalancing’ of school environments in that, for each group of boys within a particular classroom, there is a corresponding group of girls in the same classroom. The sample consisted of 64 matched pairs of within-class gender means for coeducational classes. Altogether, 611 boys and 641 girls were involved in forming the 64 pairs of within-class gender means.
Despite extensive research on classroom environment, it is only recently that educators have investigated sex differences in students’ perceptions of classroom learning environment. Reports of these investigations seem to suggest that students’ perceptions of their classroom environment are related to the sex of the student (Henderson, Fisher & Fraser, 1995; Wong & Fraser, 1994).
In the present study of sex differences, students’ perceptions of the mathematics classroom learning environment in junior high schools, as measured by the MCI, were analysed with a one-way MANOVA for repeated measured and using the within-class gender subgroup mean as the unit of analysis. Student Satisfaction also was included. The set of three MCI scales and Satisfaction comprised the dependent variables and gender was the repeated measures factor. Because the multivariate test produced significant results, a t test for correlated samples was carried out for each individual scale to ascertain whether boys and girls had different perceptions of their classroom environment.
Table 6 shows that boys perceived significantly more Cohesiveness and significantly less Competition than did girls. Sex differences were negligible for Difficulty (see Table 6), as well as being statistically nonsignificant for Satisfaction. Overall, the results suggest that the mathematics classroom environment was perceived more favourably by boys than by girls.
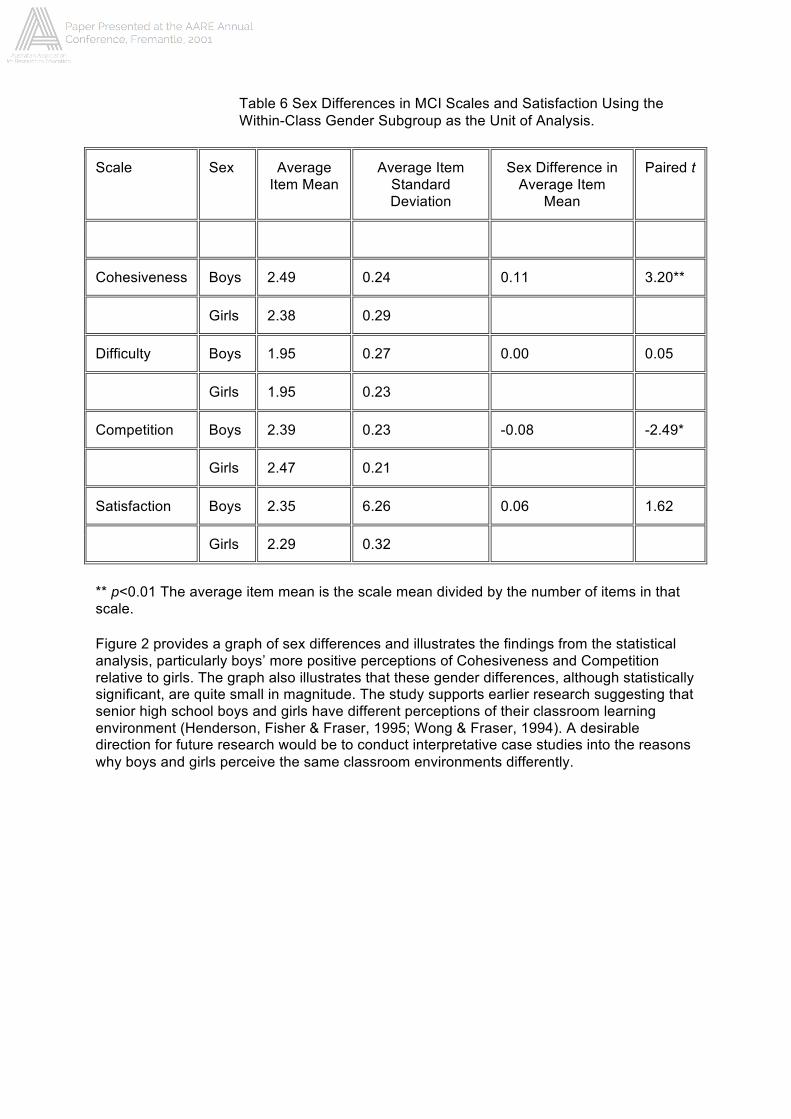
Table 6 Sex Differences in MCI Scales and Satisfaction Using the Within-Class Gender Subgroup as the Unit of Analysis.
Scale Sex Average Item Mean
Average Item Standard Deviation
Sex Difference in Average Item
Mean
Paired t
Cohesiveness Boys 2.49 0.24 0.11 3.20**
Girls 2.38 0.29
Difficulty Boys 1.95 0.27 0.00 0.05
Girls 1.95 0.23
Competition Boys 2.39 0.23 -0.08 -2.49*
Girls 2.47 0.21
Satisfaction Boys 2.35 6.26 0.06 1.62
Girls 2.29 0.32
** p<0.01 The average item mean is the scale mean divided by the number of items in that scale.
Figure 2 provides a graph of sex differences and illustrates the findings from the statistical analysis, particularly boys’ more positive perceptions of Cohesiveness and Competition relative to girls. The graph also illustrates that these gender differences, although statistically significant, are quite small in magnitude. The study supports earlier research suggesting that senior high school boys and girls have different perceptions of their classroom learning environment (Henderson, Fisher & Fraser, 1995; Wong & Fraser, 1994). A desirable direction for future research would be to conduct interpretative case studies into the reasons why boys and girls perceive the same classroom environments differently.
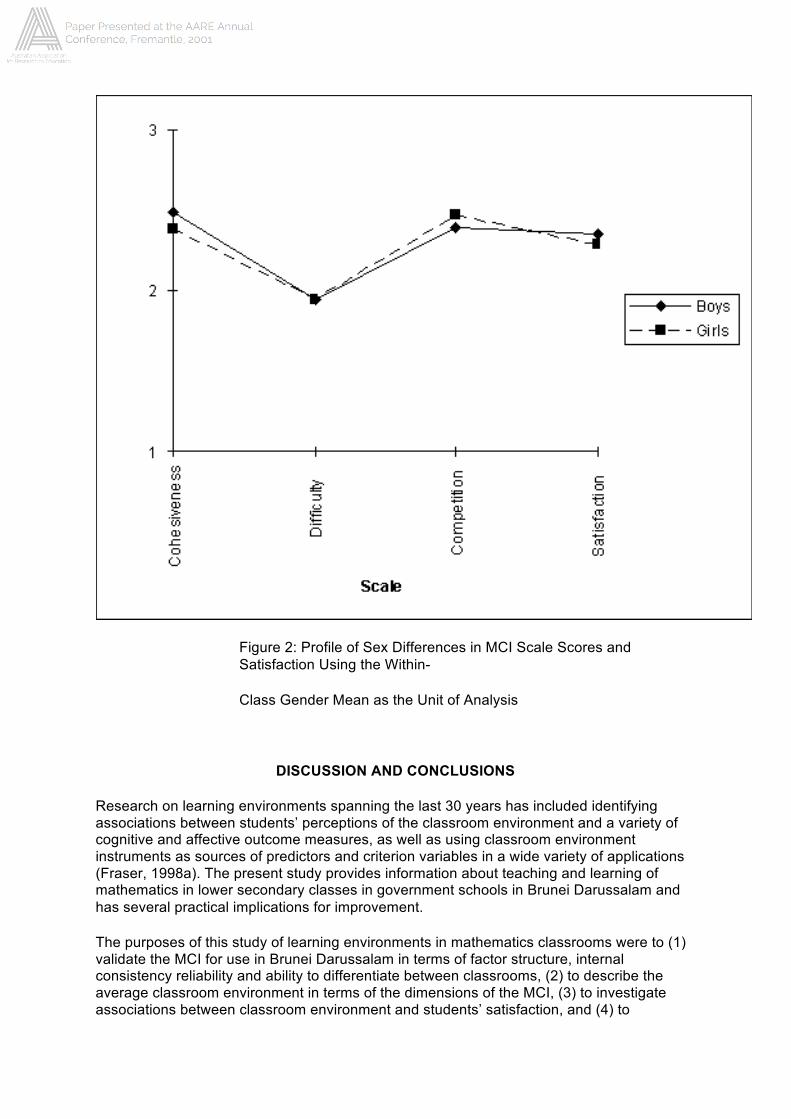
Figure 2: Profile of Sex Differences in MCI Scale Scores and Satisfaction Using the Within-
Class Gender Mean as the Unit of Analysis
DISCUSSION AND CONCLUSIONS
Research on learning environments spanning the last 30 years has included identifying associations between students’ perceptions of the classroom environment and a variety of cognitive and affective outcome measures, as well as using classroom environment instruments as sources of predictors and criterion variables in a wide variety of applications (Fraser, 1998a). The present study provides information about teaching and learning of mathematics in lower secondary classes in government schools in Brunei Darussalam and has several practical implications for improvement.
The purposes of this study of learning environments in mathematics classrooms were to (1) validate the MCI for use in Brunei Darussalam in terms of factor structure, internal consistency reliability and ability to differentiate between classrooms, (2) to describe the average classroom environment in terms of the dimensions of the MCI, (3) to investigate associations between classroom environment and students’ satisfaction, and (4) to
investigate gender differences in students’ perceptions of classroom environment. Data was collected from a sample of 1,565 junior high school mathematics students in 81 classes in government schools in Brunei Darussalam using the original 38-item five-scale version of the My Class Inventory (MCI). The intent of the questionnaire was to obtain student responses regarding their perceptions of the learning environment in their mathematics classrooms. The data were used to generate information regarding the factor structure of the questionnaire and each scale’s internal consistency reliability, discriminant validity and ability to distinguish among the different class groupings. Together, these statistical measures provide an indication of the suitability of this questionnaire for describing the psychosocial environment in the studied classrooms, as well as evidence supporting the validity of the questionnaire for future and wider use in Brunei Darussalam.
A factor analysis with varimax rotation suggested the need to revise the a priori four-factor structure of the MCI to form a three-factor instrument with 21 items. Overall, factor and item analyses confirmed good reliability and validity for a refined three-factor version of the MCI assessing Cohesiveness, Difficulty and Competition as independent measures of the psychosocial learning environment. In particular, the scales of the refined MCI exhibited sound internal consistency reliability and discriminant validity for two units of analysis (the student and the class mean). These data suggest that each MCI scale assesses a unique dimension, but that there is a degree of overlap. Moreover, each scale of the MCI differentiated significantly between the perceptions of students in different classes.
Descriptive statistics generally suggested that these students in Brunei Darussalam perceived a positive learning environment in the typical mathematics class in terms of relatively high Cohesiveness, low Difficulty and low Competition.
Associations were explored between Satisfaction and the three MCI scales for two units of analysis (the individual student and the class mean). Simple correlations and multiple regression analyses, including standardised regression coefficients, were calculated at the student and class levels. All environment variables were related significantly to Satisfaction at the student level for both simple and multiple correlations analyses. At the class level, two of the scales were significantly related to Satisfaction, namely, Cohesiveness and Difficulty. The results generally indicate that the classroom learning environment is related to students' Satisfaction in mathematics classes, and this replicates research in other countries in other subject areas (Fraser, 1998a). Student Cohesiveness had the strongest (and positive) association with Satisfaction, while Difficulty was negatively and significantly associated with Satisfaction at student and class levels for both the simple correlation and multiple regression analysis.
Following the use of MANOVA, t tests for paired samples, using the within-class gender means, were used to investigate whether boys and girls had different perceptions of their classroom environment. The results indicated that boys perceived significantly more Cohesiveness and less Competition than did the girls. Sex differences were negligible for Difficulty as well as being statistically nonsignificant for Satisfaction. Overall, the results suggest that the mathematics classroom environment was perceived more favourably by boys than by girls. However, these statistically significant sex differences were small in magnitude. The present study supports earlier research suggesting that high school boys and girls have different perceptions of their classroom learning environment (Henderson, Fisher & Fraser, 1995; Wong & Fraser, 1994).
Overall, this study made several distinctive contributions to the field of learning environment research. It is one of the few learning environment studies undertaken worldwide in mathematics. It provides a comprehensive study of junior high school mathematics classes in Brunei Darussalam and contributes to the beginnings of the field of classroom
environment research in Brunei Darussalam. The My Class Inventory (MCI), in a modified form, was validated for the Brunei context and appears to be highly useful for future research and practical applications. Finally, the study has practical implications about how to change mathematics classroom environments in order to enhance student satisfaction.
While this study has provided a detailed, holistic and national approach to the study of classroom environments associated with student satisfaction, a number of important limitations to the study should be recognised. First, as this study involved only Form 2 junior high school mathematics students in Brunei Darussalam, findings might not apply to other groups of students. Second, because English is not the first language of the students in the sample, it is possible that some students misinterpreted some questionnaire items (despite the fact that the MCI has a very low reading level). Third, as the scope of the study permitted the inclusion of only one student outcome (namely, student satisfaction), no information is provided about the types of classroom environment that promote a broader range of important students’ cognitive and attitudinal outcomes. Methodologically, the study employed predominantly quantitative methods and the scope of the research permitted a relatively limited use of valuable qualitative methods (e.g., student interviews).
This study has broken new ground in assessing learning environment in mathematics classes in Brunei Darussalam’s schools and in investigating learning environment correlates of student satisfaction. Although the study has produced several worthwhile outcomes, limitations to the study suggest several recommendations for future research. First, the study should be replicated with students from a greater range of grade levels. Second, future classroom environment research in Brunei should encompass a broader range of students’ cognitive and affective outcomes. Third, more sensitive qualitative methods should be included in future research to complement the qualitative methods used in the present study as recommended by Tobin and Fraser (1998). Fourth, now that the validity and usefulness of the MCI has been established in Brunei, it should be used in Brunei in some of the other lines of past classroom environment research (e.g., evaluation of educational innovations, studies of the transition from primary to secondary schooling, school psychology, teacher education, and teacher-as-researcher attempts to improve classroom environments).
REFERENCES
Aldridge, J. M. & Fraser, B. J. (2000). A cross-cultural study of classroom learning environments in Australia and Taiwan.Learning Environment Research: An International Journal, 3, 101-134.
Aldridge, J. M., Fraser, B. J., & Huang, I. T.-C. (1999). Investigating classroom environments in Taiwan and Australia with multiple research methods. Journal of Educational Research, 93, 48-62.
Anderson, G. L., & Walberg, H. J. (1974). Learning environments. In H. J. Walberg (Ed.), Evaluating educational performance: A sourcebook of methods, instruments, and examples (pp. 81-98). Berkeley, CA: McCutchan.
Asghar, M. (1993). Perceptions of science classroom environment of lower secondary pupils: Gender differences and relationship with science achievement. Paper presented at the Seventh Conference of the Educational Research Association, Singapore.
Asghar, M. & Fraser, B. J. (1995). Classroom environment and attitudes to science in Brunei Darussalam. Journal of Science and Mathematics in S.E. Asia, XVIII, 41-47.
Baker, D. L. (1998). Equity issues in science education. In B. J. Fraser & K. Tobin (Eds.), International handbook of science education (pp. 869-895). Dordrecht, The Netherlands: Kluwer.
Bellar, M. & Gafni, N. (1996). The 1991 international assessment of educational progress in mathematics and sciences: The gender differences perspective. Journal of Educational Psychology, 88, 365-377.
Bock, R. D. (Ed.). (1989). Multilevel analysis of educational data. San Diego, CA: Academic Press.
Bryk, A. S., & Raudenbush, S. W. (1992). Hierarchical linear models: Applications and data analysis methods. Newbury Park, CA: Sage.
Chavez, R. C. (1984). The use of high inference measures to study classroom climates: A review. Review of Educational Research, 54, 237-261.
Cheung, K. C. (1993). The learning environment and its effects on learning: Product and process modelling for science achievement at the sixth form level in Hong Kong. School Effectiveness and School Improvement, 4, 242-264.
Chionh, Y. H., & Fraser, B. J. (1998, April). Validation and use of the ‘What is Happening in this Class’ (WIHIC) questionnaire in Singapore. Paper presented at the annual meeting of the American Educational Research Association, San Diego, CA.
Doyle, W. (1979). Making managerial decisions in classrooms. In D. Duke (Ed.), Classroom management (pp. 42-74) (Seventy-eighth Yearbook of the National Society for the Study of Education, Part 2). Chicago, IL: University of Chicago Press.
Dreesman, H. (1982). Classroom climate: Contributions from a European country. Studies in Educational Evaluation, 8, 53-64.
Farenga, S. J. & Joyce, B. A. (1997). What children bring to the classroom: Learning science from experience. School Science and Mathematics, 97, 248-252.
Fisher, D. L. & Fraser B. J. (1981). Validity and use of My Class Inventory. Science Education, 65, 145-156.
Fisher, D. L. & Fraser B. J. (1983). Validity and use of Classroom Environment Scale. Educational Evaluation and Policy Analysis, 5, 261-271.
Fisher, D. L., Fraser B. J. & Rickards, T. (1997, March). Gender and cultural differences in teacher-student interpersonal behaviour. Paper presented at the annual meeting of the American Educational Research Association, Chicago, IL.
Fisher, D. L., Henderson, D. & Fraser, B. J. (1995). Interpersonal behaviour in senior high school biology classes. Research in Science Education, 25, 125-133.
Fisher, D. L., Henderson, D. & Fraser, B. J. (1997). Laboratory environments and student outcomes in senior high school biology. American Biology Teacher, 59, 214-219.
Fraser, B. J. (1979). Evaluation of a science-based curriculum. In H. J. Walberg (Ed.), Educational environments and effects: Evaluation, policy, and productivity (pp. 218-234). Berkeley, CA: McCutchan.
Fraser, B. J. (1980). Guest editor’s introduction: Classroom environment research in the 1970’s and 1980’s. Studies in Educational Evaluation, 6, 221-223.
Fraser, B. J. (1981). Learning environment in curriculum evaluation: A review (Evaluation in Education series). Oxford: Pergamon.
Fraser, B. J. (1982). Differences between student and teacher perceptions of actual and preferred classroom learning environment. Educational Evaluation and Policy Analysis, 4, 511-519.
Fraser B. J. (1986). Classroom environment. London: Croom Helm.
Fraser, B. J. (1987). Study of learning environments, Volume 3. Perth, Western Australia: Curtin University of Technology.
Fraser, B. J. (1988). Study of learning environments, Volume 4. Perth, Western Australia: Curtin University of Technology.
Fraser B. J. (1989). Twenty years of classroom climate work: Progress and prospect. Journal of Curriculum Studies, 21, 307-327.
Fraser, B. J. (1990). Individualised Classroom Environment Questionnaire. Melbourne, Australia: Australian Council for Educational Research.
Fraser B. J. (1991). Two decades of classroom environment research. In B. J. Fraser and H. J. Walberg (Eds.), Educational environments: Evaluation, antecedents and consequences (pp. 3-27). Oxford, England: Pergamon Press.
Fraser B. J. (1994). Research on classroom and school climate. In D. Gabel (Ed.), Handbook of research on science teaching and learning (pp. 493-541). New York: Macmillan.
Fraser B. J. (1997, March). NARST’s expansion, internationalisation and cross-nationalisation: History in the making.Presidential address at the annual meeting of the National Association for Research in Science Teaching, St Louis, MO.
Fraser B. J. (1998a). Science Learning environments. Assessment, effects and determinants. In B. J. Fraser and K. Tobin (Eds.),International handbook of science education (pp. 527-564). Dordrecht, The Netherlands: Kluwer.
Fraser B. J. (1998b). Classroom environment instruments: Development, validity and applications. Learning Environments Research: An International Journal, 1, 7-33.
Fraser, B. J. (1998c). The birth of a new journal: Editor’s introduction. Learning Environments Research: An International Journal, 1, 1-5.
Fraser B. J., Anderson, G. J. & Walberg, H. J. (1982). Assessment of learning environments: Manual for Learning Environment Inventory (LEI) and My Class
Inventory (MCI) (3rd. version). Perth, Australia: Western Australian Institute of Technology.
Fraser, B. J., & Chionh, Y.-H. (2000, April). Classroom environment, self-esteem, achievement, and attitudes in geography and mathematics in Singapore. Paper presented at the annual meeting of the American Educational Research Association, New Orleans, LA.
Fraser B. J. & Fisher, D. L. (1982). Effects of classroom psychosocial environment on student learning. British Journal of Psychology, 52, 374-377.
Fraser B. J. & Fisher, D. L. (1983a). Student achievement as a function of person-environment fit: A regression surface analysis.British Journal of Educational Psychology, 53, 89-99.
Fraser B. J. & Fisher, D. L. (1983b). Use of actual and preferred classroom environment scales in person-environment fit research. Journal of Educational Psychology, 75, 303-313.
Fraser B. J. & Fisher, D. L. (1986). Using short forms of classroom climate instruments to assess and improve classroom psychosocial environment. Journal of Research in Science Teaching, 23, 287-413.
Fraser B. J., Fisher, D. L. & McRobbie, C. J. (1996, April). Development, validation and use of personal and class forms of a new classroom environment instrument. Paper presented at the annual meeting of the American Educational Research Association, New York.
Fraser, B. J., Giddings, G. J. & McRobbie, C. J. (1992). Assessing the climate of science laboratory classes (What Research Says to Science and Mathematics Teachers, No. 8). Perth, Western Australia: National Key Centre for School Science and Mathematics, Curtin University of Technology.
Fraser, B. J., Giddings, G. J. & McRobbie, C. J. (1995). Evolution and validation of a personal form of an instrument for assessing science laboratory classroom environments. Journal of Research in Science Teaching, 32, 399-422.
Fraser, B. J. & McRobbie, C. J. (1995). Science laboratory classrooms at schools and universities: A cross-national study.Educational Research and Evaluation: An International Journal on Theory and Practice, 1(4), 1-25.
Fraser, B. J. & O’Brien, P. (1985). Student and teacher perceptions of the environment of elementary-school classrooms.Elementary School Journal, 85, 567-580.
Fraser, B. J., Pearse, R. & Azmi (1982). A study of Indonesian students’ perceptions of classroom psychosocial environment.International Review of Education, 28, 337-355.
Fraser, B. J. & Tobin, K. (1991). Combining qualitative and quantitative methods in classroom environment research. In B. J. Fraser & H. J. Walberg (Eds.), Educational environments: Evaluation, antecedents and consequences (pp. 271-292). London: Pergamon.
Fraser, B. J., Tobin, K. & Kahle, J. B. (1992). Learning science with understanding: In search of the holy grail. Research in Science and Technological Education, 10, 65-81.
Fraser, B. J., & Walberg, H. J. (1981). Psychosocial learning environment in science classrooms: A review of research. Studies in Science Education, 8, 67-92.
Fraser, B. J. & Walberg, H. J. (Eds.). (1991). Educational environments: Evaluation, antecedents, and consequences. Oxford, England: Pergamon Press.
Fraser, B. J., Walberg, H. J., Welch, W. W., & Hattie, J. A. (1987). Syntheses of educational productivity research.International Journal of Educational Research, 11, 145-252.
Fraser, B. J., Williamson, J. C. & Tobin, K. (1987). Use of classroom and school climate scales in evaluating alternative high schools. Teaching and Teacher Education, 3, 219-231.
Getzels, J. W., & Thelen, H. A. (1960). The classroom as a unique social system. In N.B. Henry (Ed.), The dynamics of instructional groups: Sociopsychological aspects of teaching and learning (Fifty-ninth Yearbook of the National Society for the Study of Education, Part 2, pp. 53-82). Chicago: University of Chicago Press.
Goh, S. C., Young, D. J. & Fraser, B. J. (1995). Psychosocial climate and student outcomes in elementary mathematics classrooms: A multilevel analysis. Journal of Experimental Education, 64, 29-40.
Greenfield, T. A. (1996). Gender, ethnicity, science achievement and attitudes. Journal of Research in Science Teaching, 33, 901-933.
Haertel, G. D., Walberg, H. J. & Haertel E. H. (1981). Socio-psychological environments and learning: A quantitative synthesis.British Educational Research Journal, 7, 27-36.
Harding, J. (1996). Girls’ achievement in science and technology: Implications for pedagogy. In P. F. Murphy and C. V. Gipps (Eds.), Equity in the classroom (pp. 111-123). London: The Falmer Press.
Henderson, D., Fisher, D. L. & Fraser, B. J. (1995, April). Gender differences in biology students’ perceptions of actual and preferred learning environments. Paper presented at the annual meeting of National Association for Science Teaching, San Francisco.
Keeves, J. P. (1992). The IEA study of science III. Changes in science education and achievement: 1970 to 1984. Oxford: Pergamon Press.
Kelly, A. (Ed). (1987). Science for girls? Philadelphia, PA: Open University Press.
Kahle, J. B. & Meece, J. (1994). Research on gender issues in the classroom. In D. Gabel (Ed.), Handbook of research on science teaching and learning (pp. 92-134). New York: Macmillan.
Khoo, H. S., & Fraser, B. J. (1998, April). Using classroom environment dimensions in the evaluation of adult computer courses. Paper presented at the annual meeting of the National Association for Research in Science Teaching, San Diego, CA.
Kim, H. B, Fisher, D. L., & Fraser, B. J. (1999). Assessment and investigation of constructivist learning environments in Korea.Research in Science and Technological Education, 17, 239-249.
Knirk, D. (1992). Gender issues in information technology as found in schools: Authentic, synthetic, fantastic? Educational Technology, 32(4), 28-35.
Lee, S. & Fraser, B. J. (2001) High school science classroom learning environments in Korea. Paper presented at the annual meeting of the National Association for Research in Science Teaching, New York.
Lewin, K. (1936). Principles of topological psychology. New York: McGraw.
Ling. L. E. (1996). Mathematics classroom environment in Brunei Darussalam. Unpublished Master’s project, Curtin University of Technology.
MacAuley, D. J. (1990). Classroom environment: A literature review. Educational Psychology, 10, 239-253.
Margianti, E. S. & Fraser, B. J. (2000, January). Learning environment, mathematical ability and students’ outcomes in university computing courses in Indonesia. Paper presented at the Second International Conference on Science, Mathematics and Technology Education, Taipei, Taiwan.
McRobbie, C. J. & Ellett, C. D. (Guest Eds.). (1997). Advances in research on educational learning environments. International Journal of Educational Research, 27(4). (whole issue)
McRobbie, C. J. & Fraser, B. J. (1993). Association between student outcomes and psychosocial science environment. Journal of Educational Research, 87, 78-85.
Ministry of Education. (1993a November). Report of the Working Committee on Mathematics for Examination, Brunei-Cambridge GCE ‘O’ Level. Bandar Seri Begawan, Brunei Darussalam: Ministry of Education.
Ministry of Education. (1993b). Report of the Jawatankuasa Mata Pelajaran Matematik bagi Peperiksaan Brunei Cambridge GCE ‘O’ Level. Bandar Seri Begawan, Brunei Darussalam: Ministry of Education.
Moos, R. H. (1974). The Social Climate Scales: An overview. Palo Alto, CA: Consulting Psychologists Press.
Moos, R. H. (1979). Evaluating educational environments: Procedures, measures, findings and policy implications. San Francisco: Jossey-Bass.
Moos, R. H. & Spinrad, S. (1984). The Social Climate Scales: Annotated bibliography 1979-1983. Palo Alto, CA: Consulting Psychologists Press.
Murphy, P. (1996). The IEA assessment of science achievement. Assessment in Education, 3, 213-232.
Murray, H. A. (1938). Explorations in personality. New York: Oxford University Press.
Owens, L. C., & Straton, R. G. (1980). The development of a cooperative, competitive and individualised learning preference scale for students. British Journal of Educational Psychology, 49, 269-277.
Parker, L. H., Rennie, L. J., & Fraser, B. J. (Eds.). (1996). Gender, science and mathematics: Shortening the shadow. Dordrecht, The Netherlands: Kluwer.
Poh, S. H. (1995). An evaluation of O-Level biology teaching across government secondary schools in Brunei Darussalam: Process skills and learning environment. Unpublished Master’s Project, Curtin University of Technology, Perth, Western Australia.
Randhawa, B. S. & Fu, L. L. W. (1973). Assessment and effect of some classroom environment variables. Review of Educational Research, 43, 303-321.
Riah, H., & Fraser, B. J. (1997, December). Gender differences in students’ perception of classroom learning environment in Brunei Darussalam. Paper presented at the Australian Regional GASAT Conference, Perth, Western Australia.
Riah, H. & Fraser, B. J. (1998, April). Chemistry learning environment and its association with students’ achievement in chemistry. Paper presented at the annual meeting of the American Educational Research Association, San Diego, CA.
Schibeci, R. A., Rideng, I. M., & Fraser, B. J. (1987). Effects of classroom environments on science attitudes: A cross-cultural replication in Indonesia. International Journal of Science Education, 9, 169-186.
Scott, R & Fisher, D. (2000). Validation and use of a Malay translation of an elementary school version of the Questionnaire on Teacher Interaction. In D. Fisher & T. Rickards (Eds.), Improving classroom research through international cooperation: Proceedings of the Second Conference on Science Mathematics and Technology Education (pp. 445-455). Perth, Western Australia: Curtin University of Technology.
Stern, G. G. (1970). People in context: Measuring person-environment congruence in education and industry. New York: Wiley.
Teh, G., & Fraser, B. J. (1994). An evaluation of computer-assisted learning in terms of achievement, attitudes and classroom environment. Evaluation and Research in Education, 8, 147-161.
Teh, G., & Fraser, B. J. (1995a). Development and validation of an instrument for assessing the psychosocial environment of computer-assisted learning classrooms. Journal of Educational Computing Research, 12, 177-193.
Teh, G., & Fraser, B. J. (1995b). Associations between student outcomes and geography classroom environment. International Research in Geographical and Environmental Education, 4(1), 3-18.
Terwel, J., Brekelmans, M., Wubbels, Th., & Eeden, P. (1994). Gender differences in perceptions of the learning environment in physics and mathematics education. In D. L. Fisher (Ed.), The study of learning environments, Volume 8 (pp. 39-51). Perth, Australia: Curtin University of Technology.
Thorp, H., Burden, R. L., & Fraser, B. J. (1994) Assessing and improving classroom environment. School Science Review, 75,107-113.
Tobin, K., & Fraser, B. (Eds.). (1998). Qualitative and quantitative landscapes of classroom learning environments. In B. J. Fraser & K. G. Tobin (Eds.), The international handbook of science education (pp. 623-640). Dordrecht, The Netherlands: Kluwer.
Trickett, E. J. (1978). Toward a social-ecological conception of adolescent socialisation: Normative data on contrasting types of public school classrooms. Child Development, 49, 408-414.
Trickett, E. J., Trickett, P. K., Castro, J. J. & Schaffner, P. (1982). The independent school experience. Aspects of normative environments of single-sex and co-ed schools. Journal of Educational Psychology, 74, 374-381.
Vasi, J. & Laguardia, C. (1992). Setting up CD ROM work areas. CD-ROM Professional, 5, 44 - 46.
Walberg, H. J. (1976). The psychology of learning environments: Behavioral, structural, or perceptual? Review of Research in Education, 4, 142-178.
Walberg, H. J. (Ed.). (1979). Educational environments and effects: Evaluation, policy and productivity. Berkeley, CA: McCutchan.
Walberg, H. J. (1981). A psychological theory of educational productivity. In F. Farley & N. J. Gordon (Eds.), Psychology and education: The state of the union (pp. 81-108). Berkeley, CA: McCutchan.
Walberg, H. J. (1986). Synthesis of research on teaching. In M. C. Wittrock (Ed.), Handbook of research on teaching (3rd. ed.) (pp. 214-229). Washington, DC: American Educational Research Association.
Walberg, H. J. & Anderson G. J. (1968). Classroom climate and individual learning. Journal of Educational Psychology, 59,414-419.
Walberg, H. J. & Haertel, G. D. (1980). Validity and use of educational environment assessments. Studies in Educational Evaluation, 6, 225-238.
Walberg, H. J., Singh, R., & Rasher, S. P. (1977). Predictive validity of students’ perceptions: A cross-cultural replication.American Educational Research Journal, 14, 45-49.
Warrington, M. & Younger, M. (1996). Goals, expectations and motivation: Gender differences in achievement at GSE.Curriculum, 17, 80-93.
Waxman, H. & Ellett, C. D. (Eds.). (1990). Study of learning environments, Volume 6. Perth, Western Australia: Curtin University of Technology.
Weinstein, R. S. (1979). The physical environment of the school: A review of research. Review of Educational Research, 49,577-610.
Welch, W. W. & Walberg, H. J. (1972). A national experiment in curriculum evaluation. American Educational Research Journal, 9, 373-383.
Wolf, B. (1983). On the assessment of the learning environment. Studies in Educational Evaluation, 9, 253-265.
Wong, A. F. L., & Fraser, B. J. (1994, April). Science laboratory classroom environments and student attitudes in chemistry classes in Singapore. Paper presented at the annual meeting of American Educational Research Association, New Orleans, LA.
Wong, A. F. L. & Fraser, B. J. (1995). Cross-validation in Singapore of the Science Laboratory Environment Inventory.Psychological Reports, 76, 907-911.
Wong, A. F. L., & Fraser, B. J. (1996). Environment-attitude associations in the chemistry laboratory classroom. Research in Science and Technological Education, 64, 29-40.
Wong, A. F. L., Young, D. J., & Fraser, B. J. (1997). A multilevel analysis of learning environments and student attitudes.Educational Psychology, 17, 449-468.
Wong, N. Y. (1993). Psychosocial environments in the Hong Kong mathematics classroom. Journal of Mathematical Behavior, 12, 303-309.
Wong, N. Y. (1996). Students’ perceptions of the mathematics classroom in Hong Kong. Hiroshima Journal of Mathematics Education, 4, 89-107.
Wubbels, Th., Brekelmans, M. & Hooymayers, H. (1991). Interpersonal teacher behaviour in the classroom. In B. J. Fraser & H. J. Walberg (Eds.), Educational environments: Evaluation, antecedents and consequences (pp. 141-160). Oxford, England: Pergamon Press.
Wubbels, Th., & Levy, J. (Eds.). (1993). Do you know what you look like?: Interpersonal relationships in education. London: Falmer Press.
Yarrow, A., Millwater, J., & Fraser, B. J. (1997). Improving university and primary school classroom environments through preservice teachers’ action research. International Journal of Practical Experiences in Professional Education, 1(1), 68-93.