Embed Size (px)
Citation preview

January 2018
Abbreviated Comparative Report Sample
Parish Life Survey
St. John XXIII Parish Middletown, Alaska
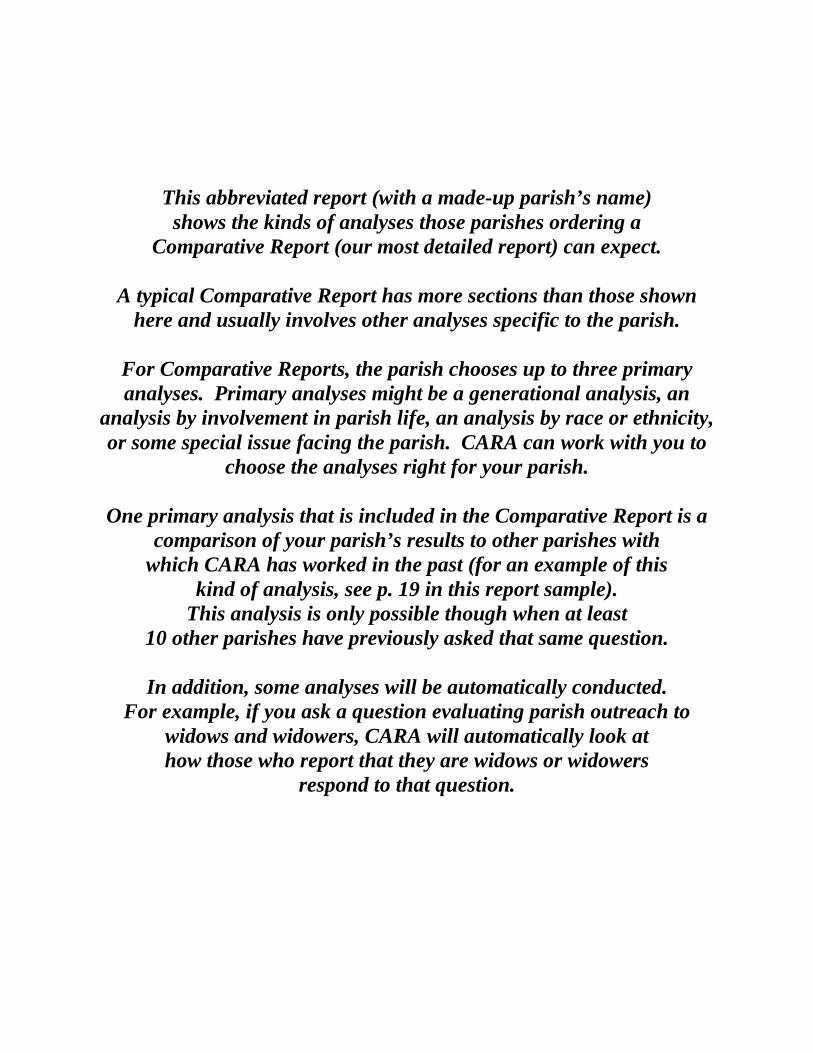
This abbreviated report (with a made-up parish’s name) shows the kinds of analyses those parishes ordering a
Comparative Report (our most detailed report) can expect.
A typical Comparative Report has more sections than those shown here and usually involves other analyses specific to the parish.
For Comparative Reports, the parish chooses up to three primary analyses. Primary analyses might be a generational analysis, an
analysis by involvement in parish life, an analysis by race or ethnicity, or some special issue facing the parish. CARA can work with you to
choose the analyses right for your parish.
One primary analysis that is included in the Comparative Report is a comparison of your parish’s results to other parishes with
which CARA has worked in the past (for an example of this kind of analysis, see p. 19 in this report sample).
This analysis is only possible though when at least 10 other parishes have previously asked that same question.
In addition, some analyses will be automatically conducted.
For example, if you ask a question evaluating parish outreach to widows and widowers, CARA will automatically look at how those who report that they are widows or widowers
respond to that question.
Center for Applied Research in the Apostolate Georgetown University
Washington, DC
Parish Life Survey
St. John XXIII Parish Middletown, Alaska
January 2018
Jonathon L. Wiggins, Ph.D. Mary L. Gautier, Ph.D.
Table of Contents
Executive Summary ................................................................................................. 2 Introduction .............................................................................................................. 6
Interpreting This Report .......................................................................................... 6 Section I: Demographics of Respondents ............................................................. 8
Marital Status ........................................................................................................11 Section II: Religious Characteristics of Respondents ........................................13
Parish Registration ................................................................................................13 Years at the Parish ................................................................................................13
Section III: Evaluation of Parish Life .................................................................16 Aspects of Parish Life ...........................................................................................16 Program Evaluations .............................................................................................18 Parish Communication ..........................................................................................20 Priority for Parish Needs .......................................................................................23 Attitudes about Parish Life ...................................................................................26
Appendix I: Response Frequencies to All Questions .........................................32

2
Center for Applied Research in the Apostolate
Parish Life Survey Report for St. John XXIII Parish Middletown, Alaska
Executive Summary The St. John XXIII Parish Life Survey was designed by the Center for Applied Research in the Apostolate (CARA) at Georgetown University. The questions were derived from CARA’s database of nationally tested questions, including some that were used previously by the parish in its 2011 CARA Parish Life Survey. Where applicable and significant, this report highlights comparisons between the findings from the current survey and the 2011 survey. The parish distributed the questionnaire to those attending the parish liturgies over one weekend in November 2017. In all, there were 1,842 valid responses.
Major findings can be summarized as follows:
Respondent Demographics
• St. John XXIII respondents average 55 years old, comparable to the average age of 54 at the time of the 2011 survey. Almost four in ten are under age 50, and nearly half are in their 50s and 60s.
• Almost three-quarters are married or remarried (73 percent). Among those not currently married, 14 percent have never married, 7 percent are either divorced or separated, and 6 percent are widowed. Nearly three in ten report having children, stepchildren, or grandchildren living with them.
Religious Characteristics of Respondents
• Of all respondents, 91 percent are registered at St. John XXIII Parish. Five percent of
respondents report regularly attending the parish but are not registered there. On average, respondents have attended the parish for 17 years. More than six in ten have attended for more than 10 years.
• Similar to 2011 respondents, just under half are involved in at least one parish ministry or activity. The percentage involved in three or more ministries or activities, however, has increased from 2 percent in 2011 to 15 percent in 2017.
Evaluations of Parish Life
• Almost all respondents (99 percent) give St. John XXIII Parish overall a positive evaluation, with almost nine in ten rating it as “excellent.” Compared to the 2011 survey
3
results, 2017 respondents are 10 percentage points more likely to give the parish overall an “excellent” rating.
• Respondents to the 2017 survey are also at least 10 percentage points more likely to give an “excellent” rating to these general evaluations of aspects of parish life: the sense of community within the parish, the vision provided by parish leaders, efforts to spread the Gospel or evangelize, efforts to promote responsible stewardship among parishioners, and Masses and liturgies in general.
• More than nine in ten agree at least “somewhat” that they feel included in parish life, with more than half agreeing “strongly” that they do. Members of the oldest generation of parishioners and those involved in at least one parish ministry or activity are particularly likely to agree “strongly” that they feel included.
• Masses and liturgies in general receive a positive evaluation from almost all respondents. Three-quarters give them an “excellent” rating. More than half report being attracted to the parish “very much” by the following: the quality of the liturgy, the sense of belonging they feel there, the people/parish community, its closeness to their homes, the programs and activities, it having been their family parish for years, and its opportunities for spiritual growth.
• Developing a parish sense of community and youth ministry are especially likely to receive high priority from respondents. About three-quarters give each “very much” priority.
• When asked to write in what ministries or services are most needed at the parish, respondents are particularly likely to cite the need for outreach to and formation for specific groups of people in the community. Children and young adults are particularly likely to be singled out for more ministries and services.
Formation
• Efforts to educate parishioners in the faith receive a positive evaluation from more than nine in ten respondents. Seven in ten rate these efforts as “excellent.” Parish efforts to foster spiritual growth receive an “excellent” rating from two-thirds of respondents. Those belonging to the oldest generation of parishioners are particularly likely to give high priority to adult faith formation and to say that the parish’s faith formation for adults attracts them to the parish “very much.”
• Three-quarters rate as “excellent” youth ministry at the parish. Nearly six in ten give as high of a rating to faith formation for adults and children’s religious education programs/PSR. Three-quarters place “very much” priority on youth ministry, with a little more than six in ten giving as much priority to young adult ministry. Adult faith formation receives as much priority from almost six in ten respondents.

4
Stewardship
• The promotion of responsible stewardship among parishioners receives a positive evaluation from almost all respondents. Six in ten rate it as “excellent.” Slightly more than a third “strongly agree” that parish leaders encourage them to explore their vocation within the parish. Less than two in ten “strongly agree” that they have felt a calling to a greater role in parish ministry. Further, fewer, one in ten, of those currently not involved in any parish ministries or activities agree as strongly that they have felt such a calling.
• About two-thirds of respondents give an “excellent” rating to efforts to invite participation in parish ministries. More than half say their busy schedules or lack of time “very much” prevent them from volunteering more for the parish. At least six in ten of those of the two youngest generations of parishioners, as well as those currently not involved with any parish ministries or activities, cite that reason.
• When asked what one factor most prevents them from leading a ministry at the parish, about two-thirds cite their busy schedules or lack of time. About one in ten says their already volunteering as much as they would like and their lack of awareness of parish needs most prevents them from doing so. Members of the youngest generation of parishioners are least likely to cite their busy schedules or lack of time as what most prevents their leading a parish ministry, but are most likely to cite that they already volunteer as much as they would like.
• Nine in ten report giving to the parish’s offertory collection regularly.
Sense of Community
• Nearly all respondents give a positive evaluation to the sense of community within the parish. Seven in ten rate it as “excellent.” This is 15 percentage points higher than the percentage that rated it as “excellent” in 2011.
• Social activities receive “excellent” ratings from almost two-thirds of respondents. The older the generation, the more likely its members are to give social activities an “excellent” rating.
• Developing a parish sense of community receives “very much” priority from three-quarters of respondents.
Parish Communications
• Six in ten “strongly agree” that they feel well informed about what goes on in the parish.
Members of the oldest generation of parishioners are particularly likely to agree “strongly” that they feel well informed.

5
• When asked how effective different means of communication are for communicating parish news, respondents are particularly likely to say that the Sunday bulletins, inserts in those bulletins, and the announcements read at Mass are “very” effective.
• About three in ten of those of the youngest generation and those who responded to the survey at the 5:30 p.m. Sunday Mass report that social media such as Facebook and Twitter are “very” effective ways of communicating parish news to them.
Leadership
• Almost all respondents give a positive evaluation to the vision provided by parish leaders,
with seven in ten rating that vision as “excellent.”
• Seven in ten rate efforts to manage parish finances as “excellent.” More than eight in ten rate as “excellent” efforts to maintain parish facilities.
• Efforts to consult with parishioners before making important decisions and to plan for future leadership changes receive “excellent” evaluations from more than half of respondents. Almost half “strongly agree” that parishioners are encouraged to have a role in decision making in the parish. Those of the oldest generation are especially likely to agree “strongly” that they are.
Evangelization and Parish Outreach
• Efforts to spread the Gospel/evangelize and to promote social justice receive positive evaluations from more than nine in ten. Slightly less than six in ten give these efforts “excellent” ratings. About half have invited someone to attend a parish worship service or activity at least once in the past year. Just over two in ten have done so three or more times.
• One in 20 “strongly agree” that the parish should reach out more to them.
• Parish efforts to reach out to teens are especially likely to be highly evaluated, followed by those sick or homebound, senior citizens and children. About half to three-quarters give outreach to each of these groups an “excellent” rating. On the other end of the continuum, about one-third give “excellent” ratings to parish outreach to “Empty Nesters,” those in the area belonging to other faith communities, those in the area only seasonally, and inactive Catholics.

6
Center for Applied Research in the Apostolate
Parish Life Survey Report for St. John XXIII Parish
Middletown, Alaska
Introduction The St. John XXIII Parish Life Survey was designed by the Center for Applied Research in the Apostolate (CARA) at Georgetown University. The questions were derived from CARA’s database of nationally tested questions, including some that were used previously by the parish in its 2011 CARA Parish Life Survey. Where applicable and significant, this report highlights comparisons between the findings from the current survey and the 2011 survey. The parish distributed the questionnaire to those attending the parish liturgies over one weekend in November 2017. In all, there were 1,842 valid responses, including 69 responses by those ages 17 and younger.
Interpreting This Report Most of the questions in this survey use four point response scales (“not at all,” “only a little,” “somewhat,” “very much”; or “poor,” “fair,” “good,” “excellent”). These scales allow half of the responses to be interpreted as relatively more “negative” (“poor” and “ fair,” for example) and half as relatively more “positive” (“good” and “excellent,” for example). In parts of the analysis in this report, these responses are combined to allow for clearer comparisons. However, sometimes examining the most positive response distinguishes important contrasts in level of support. In addition, readers may also wish to compare the difference between the two extreme responses, say “poor” and “excellent,” to compare the level of intensity with which opposing opinions are held. These comparisons and others may be drawn by referring to the actual percentage responses given in Appendix I. That appendix shows the percentage responses for each item, calculated out of 100 percent, as well as the percentage of all respondents that did not respond to each question, separately calculated out of 100 percent for clarity of comparison. In addition to summarizing the responses to most questions for respondents as a whole, the report also compares the responses of those from selected subgroups. The first section of the report describes the characteristics of the respondents as well as the subgroups that are used in the analyses that follow. Throughout the report, the tables and charts that compare differences between and among these various subgroups are presented following the responses for parishioners as a whole in each section. The margin of error for differences between subgroups, such as the differences among those of different generations or those with different levels of involvement, depends on the size
7
of the subgroups being compared. Unless otherwise noted, all subgroup differences described in this report are statistically significant: that is, they pass standard tests of statistical inference and can be considered to be “real” differences. In some instances, differences between or among subgroups that are not statistically significant are also noted. These differences should be treated as merely suggestive of real differences that may exist between the subgroups under consideration. CARA regularly conducts parish surveys through its Pastoral Assistance Surveys and Services (PASS). PASS is a series of dynamic survey instruments for pastoral planning, including survey data collection, analyses of key stakeholders and demographic groups, and user-friendly reports and products. From the aggregate data collected through PASS over the past 15 years, CARA has a database of characteristics of parish life gathered from more than 750 parishes nationwide. While this database is not a random sample of parishes, and therefore not necessarily representative of all parishes nationwide, it is the most comprehensive source of data of its kind and covers a broad range of topics important to vibrant parish life. In this report, results from St. John XXIII’s current Parish Life Survey are compared to those from St. John XXIII’s 2011 Parish Life Survey. In addition, where possible, aggregate responses from the PASS National Database of Parish Life are compared to those from the St. John XXIII Parish Survey to put the parish results into a larger national context. Additionally, where available, comparisons are made to findings from CARA’s nationally representative surveys of adult self-identified Catholics conducted since 2000. In addition to the quantitative data analyzed in this report, two open-ended questions on the survey collected qualitative data. For these data, respondents were prompted with one question and given an open box for written comments, rather than select from a set of response options. These comments are analyzed along with the quantitative data as well as in separate sections throughout this report. While these responses are not suitable for statistical analyses, they do add depth to the data that is not attainable through closed-ended questions only. The results of this survey fairly represent the characteristics and attitudes of people ages who attend Mass at St. John XXIII Parish, including 69 who are under age 18. It cannot be used to make inferences about populations outside of Mass attendees at the parish; it is not representative of those who do not attend Mass or those who are only involved in parish functions excluding Mass.

8
Section I: Demographics of Respondents This section of the report includes demographic and other descriptive data for respondents to this survey. These data may be helpful in considering who responded to the survey, which populations are represented in the data, and characteristics of a typical weekend at the parish.
Age
The average age of respondents is 58 years old.
Age of Respondents Percentage responding 18-19 <1% 20-29 2 30-39 6 40-49 25 50-59 26 60-69 17 70-79 15 80 and above 8 Mean 58
Responding parishioners were born between 1920 and 1995 and range in age from 18 to 93 years old. Those born between 1954 and 1963 (ages 50-59) and those born between 1973 and 1964 (ages 40-49) each represent one-fourth of respondents (26 percent and 25 percent, respectively). Four in ten respondents (40 percent) are age 60 or over, with one-sixth of them (17 percent) currently in their sixties. The average (mean) age is 58, which is slightly older than respondents at Catholic parishes nationally, where the average age is 53.
9
Generation
Important differences between groups in parishes are typically found among those who belong to different generations. CARA divides Catholics into the following four generations, reflective of the age categories used by many other Catholic researchers.
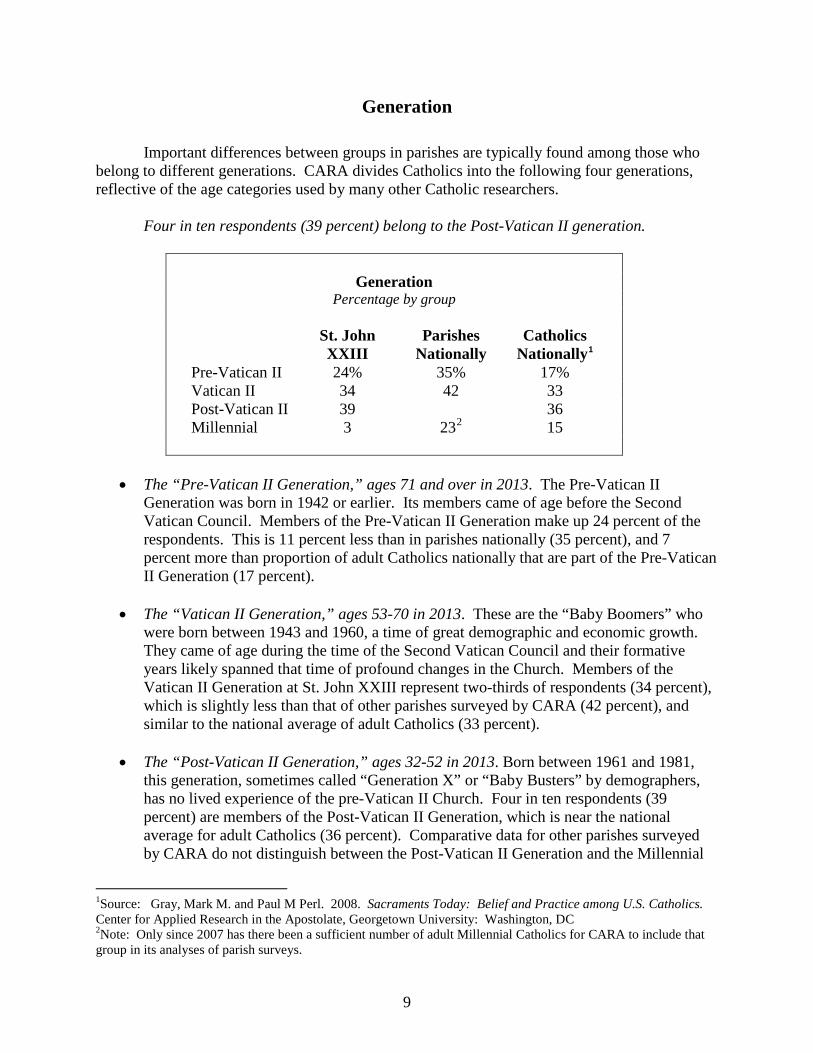
Four in ten respondents (39 percent) belong to the Post-Vatican II generation.
Generation
Percentage by group St. John
XXIII Parishes
Nationally Catholics
Nationally1
Pre-Vatican II 24% 35% 17% Vatican II 34 42 33 Post-Vatican II 39
232 36
Millennial 3 15
• The “Pre-Vatican II Generation,” ages 71 and over in 2013. The Pre-Vatican II
Generation was born in 1942 or earlier. Its members came of age before the Second Vatican Council. Members of the Pre-Vatican II Generation make up 24 percent of the respondents. This is 11 percent less than in parishes nationally (35 percent), and 7 percent more than proportion of adult Catholics nationally that are part of the Pre-Vatican II Generation (17 percent).
• The “Vatican II Generation,” ages 53-70 in 2013. These are the “Baby Boomers” who
were born between 1943 and 1960, a time of great demographic and economic growth. They came of age during the time of the Second Vatican Council and their formative years likely spanned that time of profound changes in the Church. Members of the Vatican II Generation at St. John XXIII represent two-thirds of respondents (34 percent), which is slightly less than that of other parishes surveyed by CARA (42 percent), and similar to the national average of adult Catholics (33 percent).
• The “Post-Vatican II Generation,” ages 32-52 in 2013. Born between 1961 and 1981,
this generation, sometimes called “Generation X” or “Baby Busters” by demographers, has no lived experience of the pre-Vatican II Church. Four in ten respondents (39 percent) are members of the Post-Vatican II Generation, which is near the national average for adult Catholics (36 percent). Comparative data for other parishes surveyed by CARA do not distinguish between the Post-Vatican II Generation and the Millennial
1Source: Gray, Mark M. and Paul M Perl. 2008. Sacraments Today: Belief and Practice among U.S. Catholics. Center for Applied Research in the Apostolate, Georgetown University: Washington, DC 2Note: Only since 2007 has there been a sufficient number of adult Millennial Catholics for CARA to include that group in its analyses of parish surveys.
10
Generation because CARA has only recently begun to collect these data separately for these two generations.
• The “Millennial Generation,”ages 18-31 in 2013. This generation, born in 1982 or later
(up to 1995 among adults), has come of age primarily under the papacies of John Paul II and Benedict XVI. Because some still live with their parents, their religious practice is often closely related to that of their families of origin. Three percent of respondents belong to the Millennial Generation, about one-fifth the size of this generation in the national adult Catholic population (15 percent).
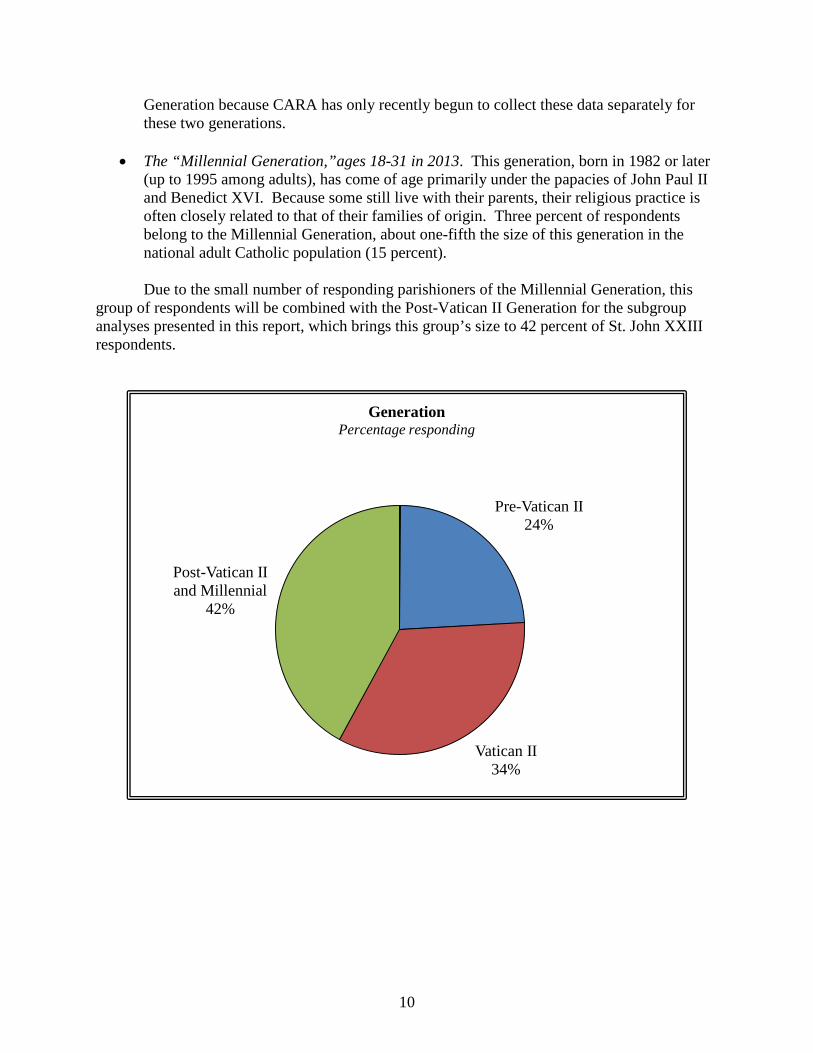
Due to the small number of responding parishioners of the Millennial Generation, this
group of respondents will be combined with the Post-Vatican II Generation for the subgroup analyses presented in this report, which brings this group’s size to 42 percent of St. John XXIII respondents.
Pre-Vatican II 24%
Vatican II 34%
Post-Vatican II and Millennial
42%
Generation Percentage responding

11
Marital Status Almost three-quarters (73 percent) of respondents are currently married or remarried.
Marital Status
Percentage responding St John
XXIII 2017
St. John XXIII 2011
Parishes Nationally
Adult Catholics Nationally3
Married or remarried 73% 80% 73% 62% Single, never married 14 10 12 24 Divorced or separated 7 4 7 9 Widowed 6 6 8 5
• More than one-quarter (27 percent) of respondents are currently not married, including those who are single and never married (14 percent), divorced or separated (7 percent) and widowed (6 percent).
• Compared to the 2011 survey, respondents are slightly more likely to be married or to be divorced or separated, and are slightly less likely to have never married.
• St. John XXIII Parish respondents are very similar to parishes nationally with regard to their marital status, with 2 percentage points the largest differences. Compared to adult Catholics nationally, however, respondents at St. John XXIII are more likely to be married (73 percent to 62 percent, respectively) and less likely to be single, never married (14 percent compared to 24 percent.
Source: Gray, Mark M., and Mary L. Gautier. 2017. Catholic New Media Use in the United States, 2017.
12
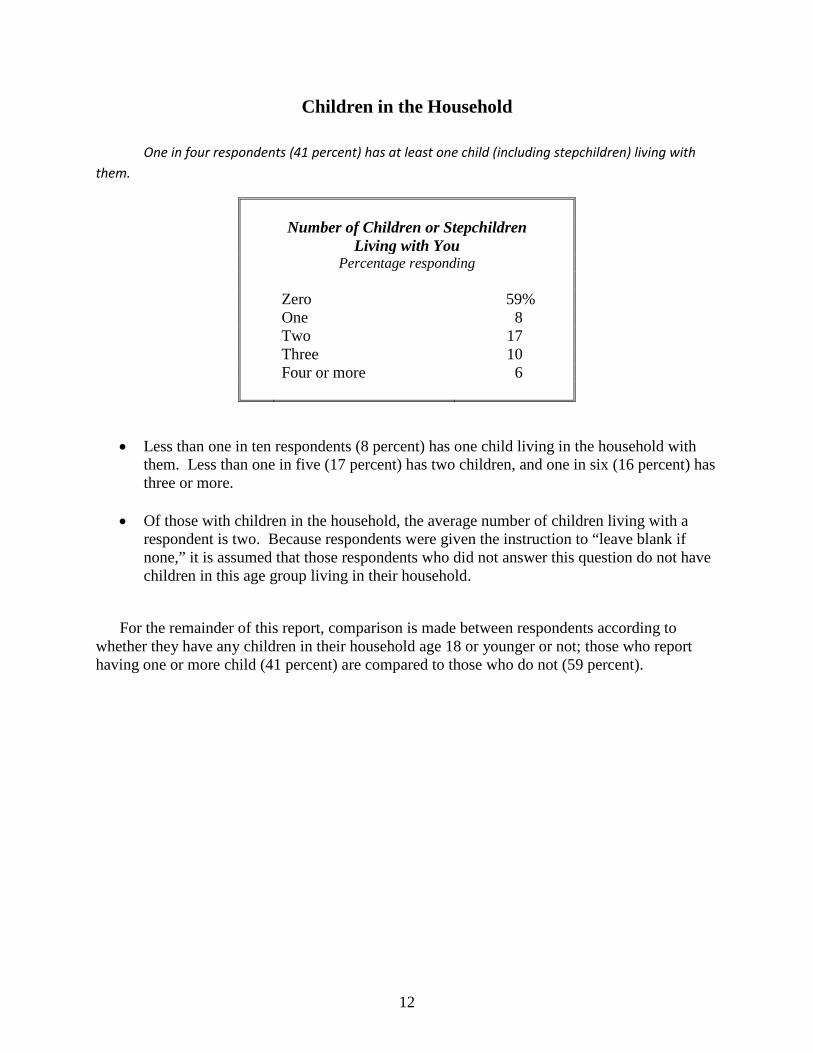
Children in the Household One in four respondents (41 percent) has at least one child (including stepchildren) living with them.
Number of Children or Stepchildren
Living with You Percentage responding
Zero 59% One 8 Two 17 Three 10 Four or more 6
• Less than one in ten respondents (8 percent) has one child living in the household with them. Less than one in five (17 percent) has two children, and one in six (16 percent) has three or more.
• Of those with children in the household, the average number of children living with a
respondent is two. Because respondents were given the instruction to “leave blank if none,” it is assumed that those respondents who did not answer this question do not have children in this age group living in their household.
For the remainder of this report, comparison is made between respondents according to whether they have any children in their household age 18 or younger or not; those who report having one or more child (41 percent) are compared to those who do not (59 percent).
13
Section II: Religious Characteristics of Respondents
This part of the report describes several characteristics of respondents that relate to their religious attributes and parish-related behaviors.
Parish Registration
Of all respondents, 91 percent report being registered at St. John XXIII Parish. While at
least 90 percent of those of the other generations are registered, slightly fewer among the Millennial Generation have registered (85 percent). Ninety-six percent of respondents report that the parish is their primary place of worship. In total, 107 respondents (5 percent) reported that they regularly attend the parish but are not registered there.
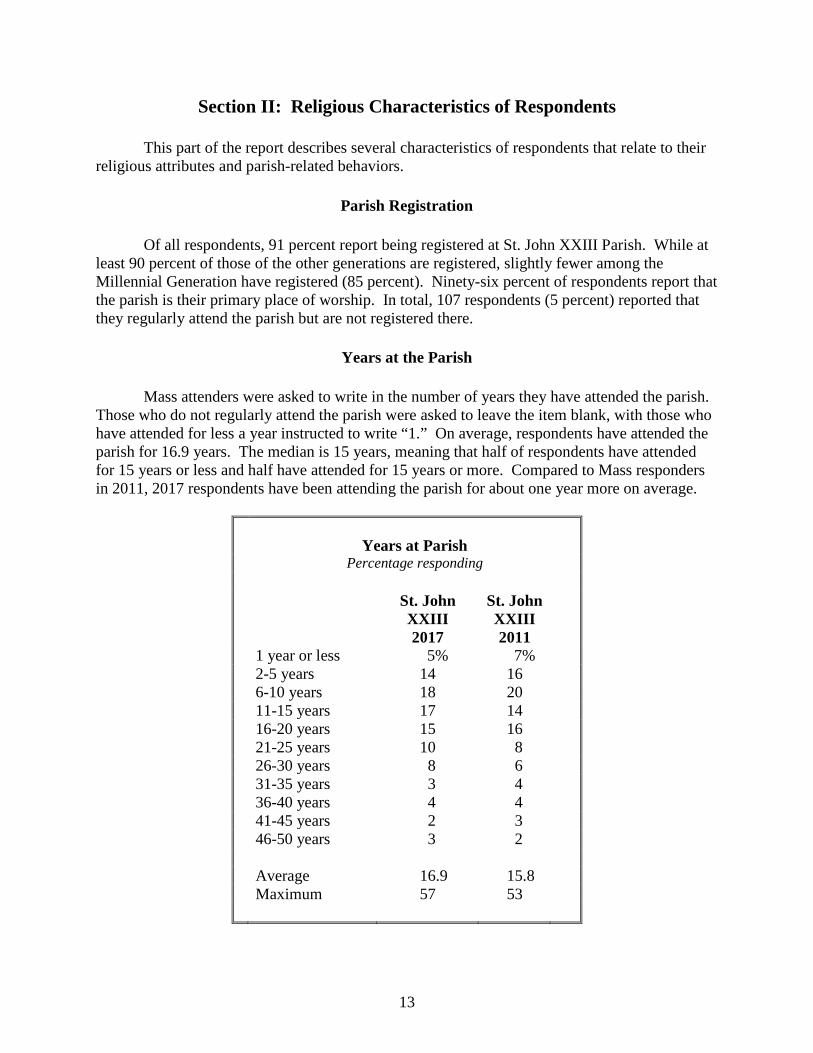
Years at the Parish Mass attenders were asked to write in the number of years they have attended the parish.
Those who do not regularly attend the parish were asked to leave the item blank, with those who have attended for less a year instructed to write “1.” On average, respondents have attended the parish for 16.9 years. The median is 15 years, meaning that half of respondents have attended for 15 years or less and half have attended for 15 years or more. Compared to Mass responders in 2011, 2017 respondents have been attending the parish for about one year more on average.
Years at Parish Percentage responding St. John
XXIII 2017
St. John XXIII 2011
1 year or less 5% 7% 2-5 years 14 16 6-10 years 18 20 11-15 years 17 14 16-20 years 15 16 21-25 years 10 8 26-30 years 8 6 31-35 years 3 4 36-40 years 4 4 41-45 years 2 3 46-50 years 3 2 Average 16.9 15.8 Maximum 57 53
14
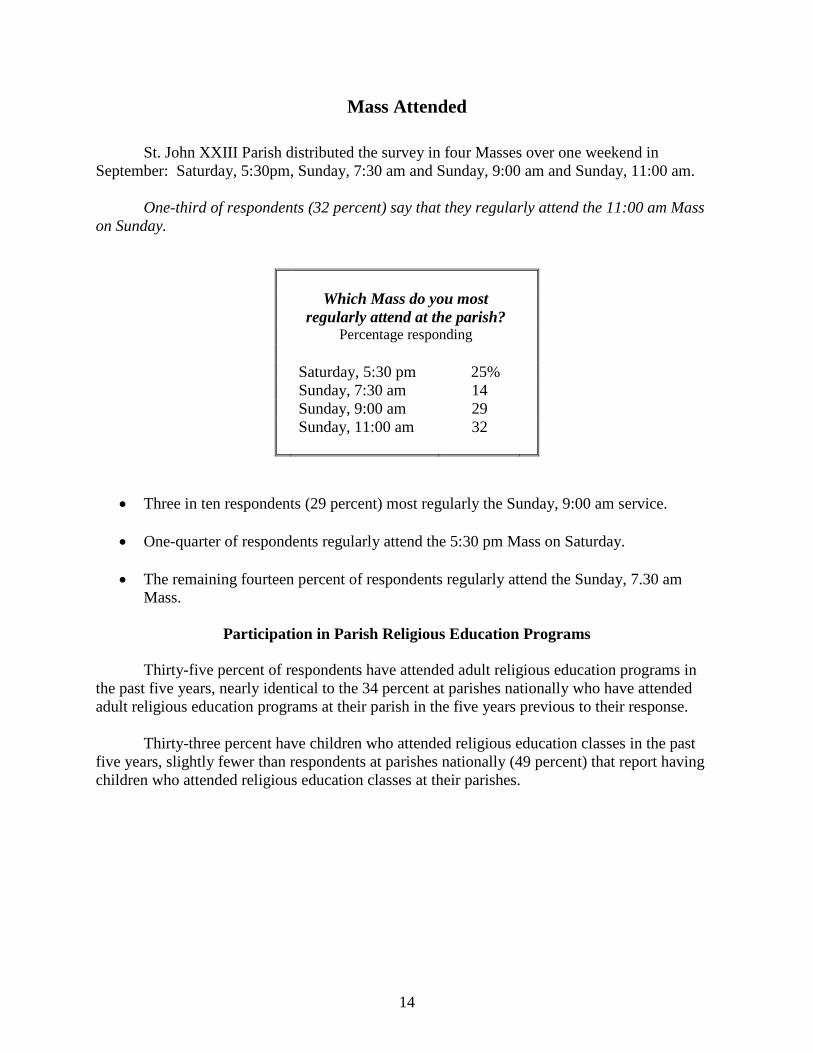
Mass Attended St. John XXIII Parish distributed the survey in four Masses over one weekend in September: Saturday, 5:30pm, Sunday, 7:30 am and Sunday, 9:00 am and Sunday, 11:00 am. One-third of respondents (32 percent) say that they regularly attend the 11:00 am Mass on Sunday.
Which Mass do you most
regularly attend at the parish?
Percentage responding Saturday, 5:30 pm 25% Sunday, 7:30 am 14 Sunday, 9:00 am 29 Sunday, 11:00 am 32
• Three in ten respondents (29 percent) most regularly the Sunday, 9:00 am service.
• One-quarter of respondents regularly attend the 5:30 pm Mass on Saturday.
• The remaining fourteen percent of respondents regularly attend the Sunday, 7.30 am Mass.
Participation in Parish Religious Education Programs
Thirty-five percent of respondents have attended adult religious education programs in the past five years, nearly identical to the 34 percent at parishes nationally who have attended adult religious education programs at their parish in the five years previous to their response. Thirty-three percent have children who attended religious education classes in the past five years, slightly fewer than respondents at parishes nationally (49 percent) that report having children who attended religious education classes at their parishes.
15
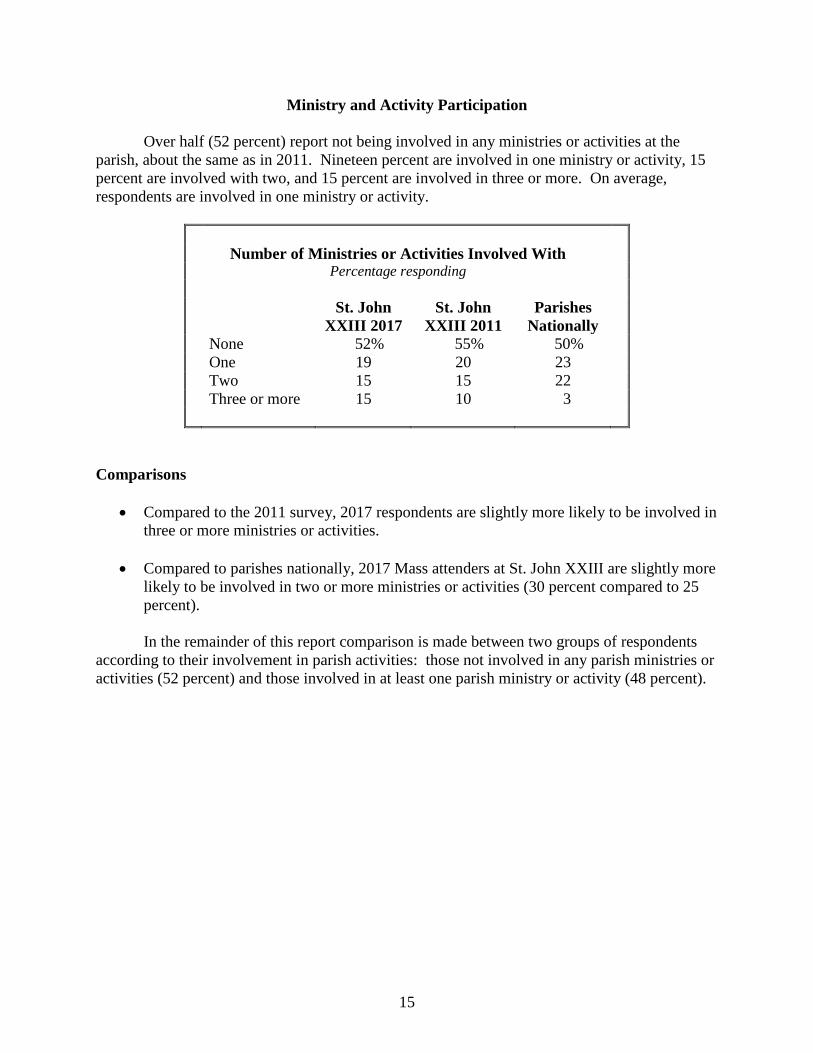
Ministry and Activity Participation Over half (52 percent) report not being involved in any ministries or activities at the parish, about the same as in 2011. Nineteen percent are involved in one ministry or activity, 15 percent are involved with two, and 15 percent are involved in three or more. On average, respondents are involved in one ministry or activity.
Number of Ministries or Activities Involved With
Percentage responding St. John
XXIII 2017 St. John
XXIII 2011 Parishes
Nationally
None 52% 55% 50% One 19 20 23 Two 15 15 22 Three or more 15 10 3
Comparisons
• Compared to the 2011 survey, 2017 respondents are slightly more likely to be involved in three or more ministries or activities.
• Compared to parishes nationally, 2017 Mass attenders at St. John XXIII are slightly more likely to be involved in two or more ministries or activities (30 percent compared to 25 percent). In the remainder of this report comparison is made between two groups of respondents
according to their involvement in parish activities: those not involved in any parish ministries or activities (52 percent) and those involved in at least one parish ministry or activity (48 percent).
16
Section III: Evaluation of Parish Life The results from the sections comprising the main body of the questionnaire are presented here.
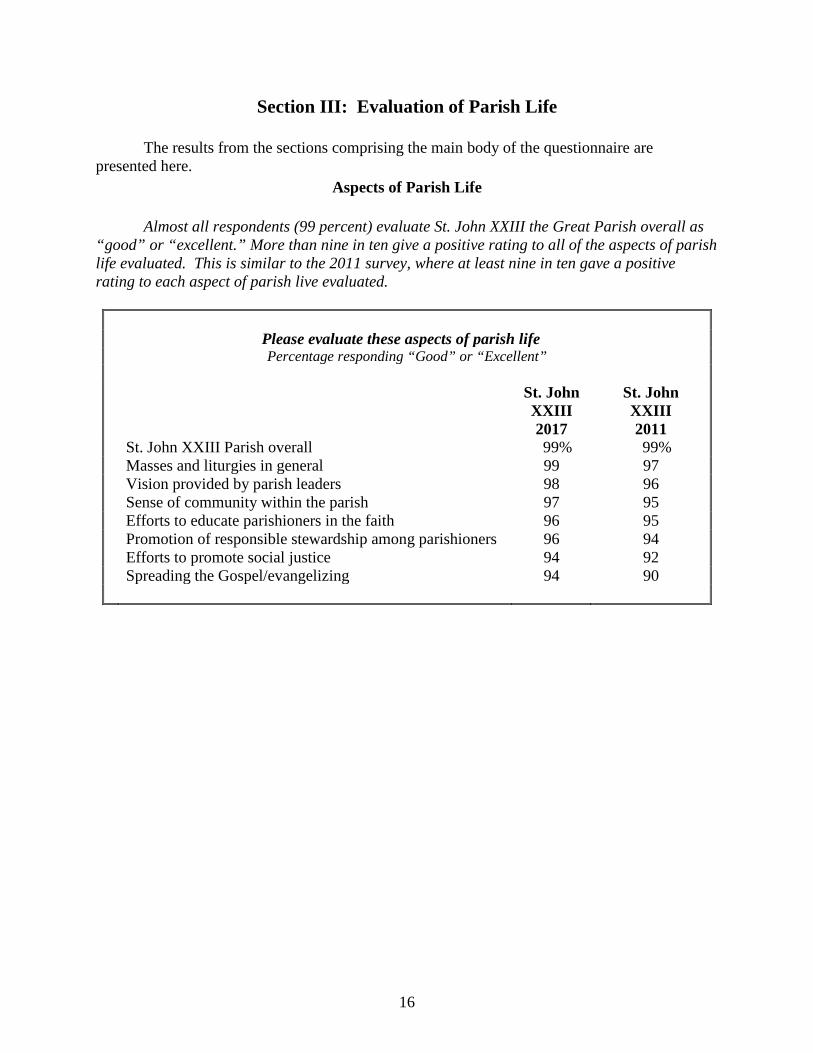
Aspects of Parish Life Almost all respondents (99 percent) evaluate St. John XXIII the Great Parish overall as “good” or “excellent.” More than nine in ten give a positive rating to all of the aspects of parish life evaluated. This is similar to the 2011 survey, where at least nine in ten gave a positive rating to each aspect of parish live evaluated.
Please evaluate these aspects of parish life Percentage responding “Good” or “Excellent”
St. John
XXIII 2017
St. John XXIII 2011
St. John XXIII Parish overall 99% 99% Masses and liturgies in general 99 97 Vision provided by parish leaders 98 96 Sense of community within the parish 97 95 Efforts to educate parishioners in the faith 96 95 Promotion of responsible stewardship among parishioners 96 94 Efforts to promote social justice 94 92 Spreading the Gospel/evangelizing 94 90
17
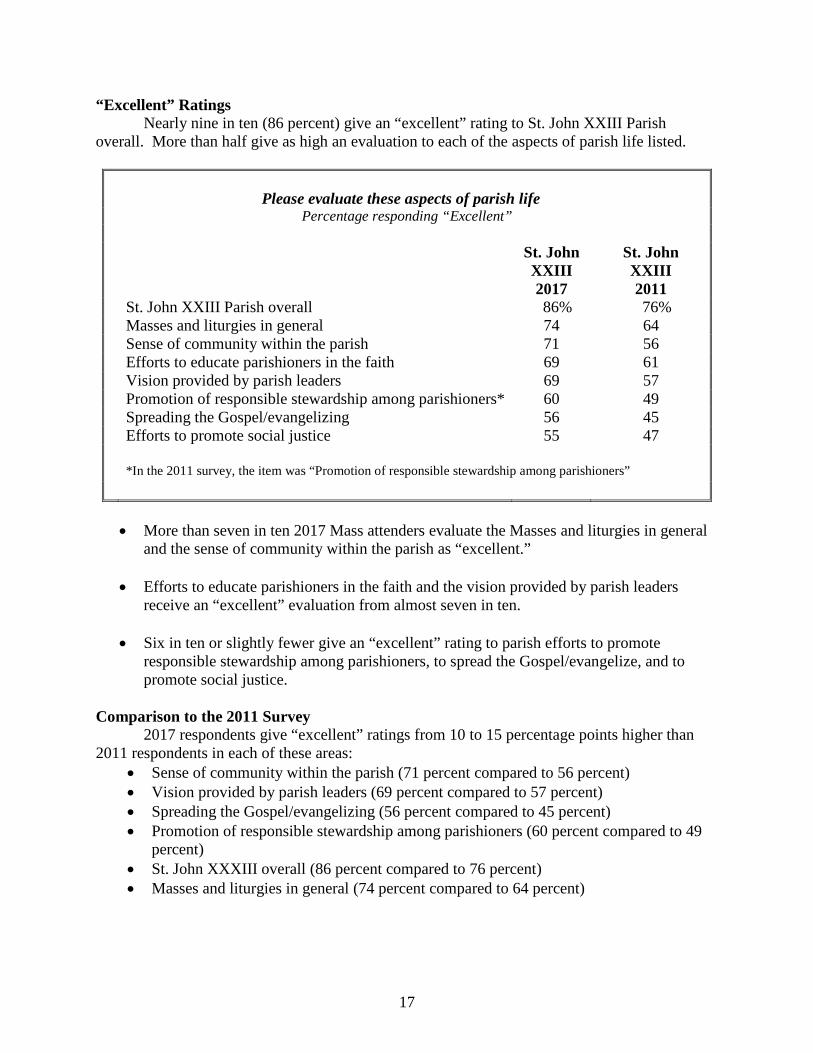
“Excellent” Ratings Nearly nine in ten (86 percent) give an “excellent” rating to St. John XXIII Parish overall. More than half give as high an evaluation to each of the aspects of parish life listed.
Please evaluate these aspects of parish life
Percentage responding “Excellent” St. John
XXIII 2017
St. John XXIII 2011
St. John XXIII Parish overall 86% 76% Masses and liturgies in general 74 64 Sense of community within the parish 71 56 Efforts to educate parishioners in the faith 69 61 Vision provided by parish leaders 69 57 Promotion of responsible stewardship among parishioners* 60 49 Spreading the Gospel/evangelizing 56 45 Efforts to promote social justice 55 47 *In the 2011 survey, the item was “Promotion of responsible stewardship among parishioners”
• More than seven in ten 2017 Mass attenders evaluate the Masses and liturgies in general
and the sense of community within the parish as “excellent.”
• Efforts to educate parishioners in the faith and the vision provided by parish leaders receive an “excellent” evaluation from almost seven in ten.
• Six in ten or slightly fewer give an “excellent” rating to parish efforts to promote responsible stewardship among parishioners, to spread the Gospel/evangelize, and to promote social justice.
Comparison to the 2011 Survey 2017 respondents give “excellent” ratings from 10 to 15 percentage points higher than 2011 respondents in each of these areas:
• Sense of community within the parish (71 percent compared to 56 percent) • Vision provided by parish leaders (69 percent compared to 57 percent) • Spreading the Gospel/evangelizing (56 percent compared to 45 percent) • Promotion of responsible stewardship among parishioners (60 percent compared to 49
percent) • St. John XXXIII overall (86 percent compared to 76 percent) • Masses and liturgies in general (74 percent compared to 64 percent)

18
Program Evaluations
Over nine in ten respondents to the 2017 survey give a positive evaluation to all four of the programs listed. These are similar to the percentages in the 2011 survey.
Please evaluate the following programs
Percentage responding “Good” or “Excellent” St. John
XXIII 2017
St. John XXIII 2011
Youth ministry 98% 95% Faith formation for adults 96 95 Social activities 95 95 Children’s religious education programs/PSR 93 91
“Excellent” Ratings Youth ministry is given an “excellent” rating by about three-quarters of respondents. Just under six in ten give as high a rating to faith formation for adults and children’s religious education programs/PSR. Social activities are rated as “excellent” by almost two in three.
Please evaluate the following programs
Percentage responding “Excellent” St. John
XXIII 2017
St. John XXIII 2011
Youth ministry 74% 57% Social activities 64 54 Faith formation for adults 59 52 Children’s religious education programs/PSR 57 52
Comparison to the 2011 Survey Respondents in 2017 are more likely than 2011 respondents to give an “excellent” rating to youth ministry (17 percentage point difference) and social activities (10 percentage point difference).

19
Comparison to Parishes Nationally Compared to those at parishes nationally, respondents to the 2017 survey are more than twice as likely to give an “excellent” rating to youth ministry, social activities, and faith formation for adults. They are also more likely to rate as “excellent” the children’s religious education programs/PSR.
Differences by Generation Members of the oldest generation are particularly likely to give an “excellent” rating to social activities and faith formation for adults. Those of the Millennial Generation are least likely to give as high of a rating to social .
74% 64% 59% 57%
31% 27% 27% 39%
0%20%40%60%80%
100%
Youth ministry Social activities Faith formationfor adults
Children'sreligiouseducation
programs/PSR
"Excellent" Evaluations of Parish Programs, Compared to Parishes Nationally
St. John XXIII Parish Parishes Nationally
51% 60% 59% 63% 63% 59%
75% 67%
0%
20%
40%
60%
80%
100%
Social activities Faith formation for adults
"Excellent" Evaluations of Parish Programs, by Generations
Millennial Post-Vatican II Vatican II Pre-Vatican II
20
Parish Communication
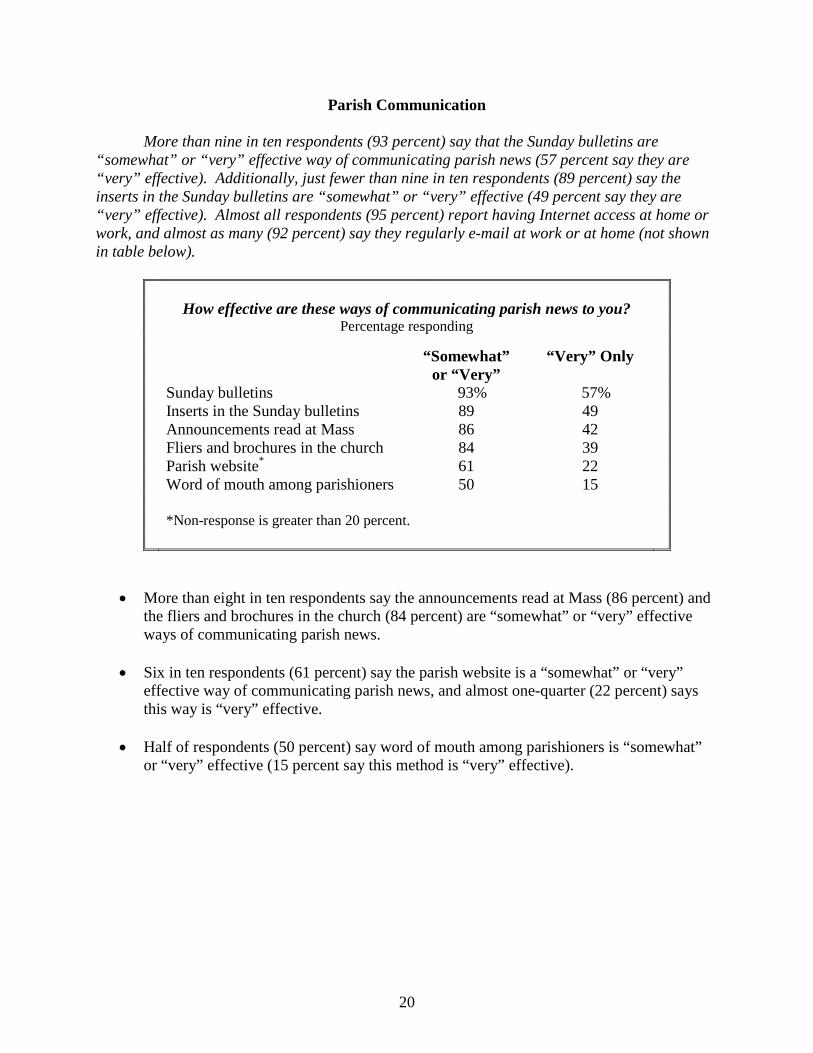
More than nine in ten respondents (93 percent) say that the Sunday bulletins are “somewhat” or “very” effective way of communicating parish news (57 percent say they are “very” effective). Additionally, just fewer than nine in ten respondents (89 percent) say the inserts in the Sunday bulletins are “somewhat” or “very” effective (49 percent say they are “very” effective). Almost all respondents (95 percent) report having Internet access at home or work, and almost as many (92 percent) say they regularly e-mail at work or at home (not shown in table below).
How effective are these ways of communicating parish news to you? Percentage responding “Somewhat”
or “Very” “Very” Only
Sunday bulletins 93% 57% Inserts in the Sunday bulletins 89 49 Announcements read at Mass 86 42 Fliers and brochures in the church 84 39 Parish website* 61 22 Word of mouth among parishioners 50 15 *Non-response is greater than 20 percent.
• More than eight in ten respondents say the announcements read at Mass (86 percent) and the fliers and brochures in the church (84 percent) are “somewhat” or “very” effective ways of communicating parish news.
• Six in ten respondents (61 percent) say the parish website is a “somewhat” or “very”
effective way of communicating parish news, and almost one-quarter (22 percent) says this way is “very” effective.
• Half of respondents (50 percent) say word of mouth among parishioners is “somewhat”
or “very” effective (15 percent say this method is “very” effective).
21
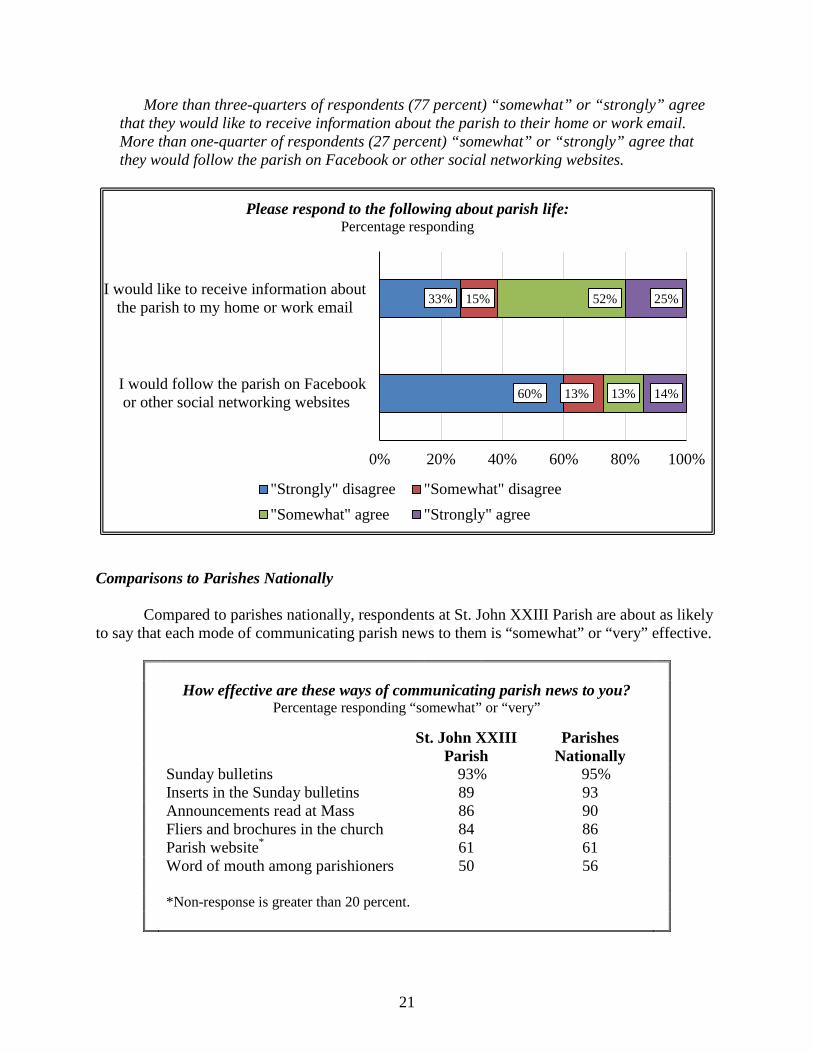
More than three-quarters of respondents (77 percent) “somewhat” or “strongly” agree that they would like to receive information about the parish to their home or work email. More than one-quarter of respondents (27 percent) “somewhat” or “strongly” agree that they would follow the parish on Facebook or other social networking websites.
Comparisons to Parishes Nationally Compared to parishes nationally, respondents at St. John XXIII Parish are about as likely to say that each mode of communicating parish news to them is “somewhat” or “very” effective.
How effective are these ways of communicating parish news to you? Percentage responding “somewhat” or “very” St. John XXIII
Parish Parishes
Nationally
Sunday bulletins 93% 95% Inserts in the Sunday bulletins 89 93 Announcements read at Mass 86 90 Fliers and brochures in the church 84 86 Parish website* 61 61 Word of mouth among parishioners 50 56 *Non-response is greater than 20 percent.
60%
33%
13%
15%
13%
52%
14%
25%
0% 20% 40% 60% 80% 100%
I would follow the parish on Facebookor other social networking websites
I would like to receive information aboutthe parish to my home or work email
Please respond to the following about parish life: Percentage responding
"Strongly" disagree "Somewhat" disagree"Somewhat" agree "Strongly" agree
22
Differences by Generation
Respondents who are members of the Post-Vatican II or Millennial Generation are less likely than those who are members of other generations to say that fliers and brochures in church are “very effective” ways of communicating parish news to them (31 percent among Post-Vatican II and Millennial respondents, compared to 42 percent among Pre-Vatican II respondents and 27 percent among Vatican II respondents). This pattern is similar when respondents are asked about Sunday bulletins. Members of the Post-Vatican II and Millennial Generations are more likely than those who are members of older generations to “somewhat” or “strongly” agree that they would like to receive information about the parish to their home or work email (61 percent compared to 44 percent) and that they would follow the parish on Facebook or other social networking websites (35 percent compared to 21 percent).
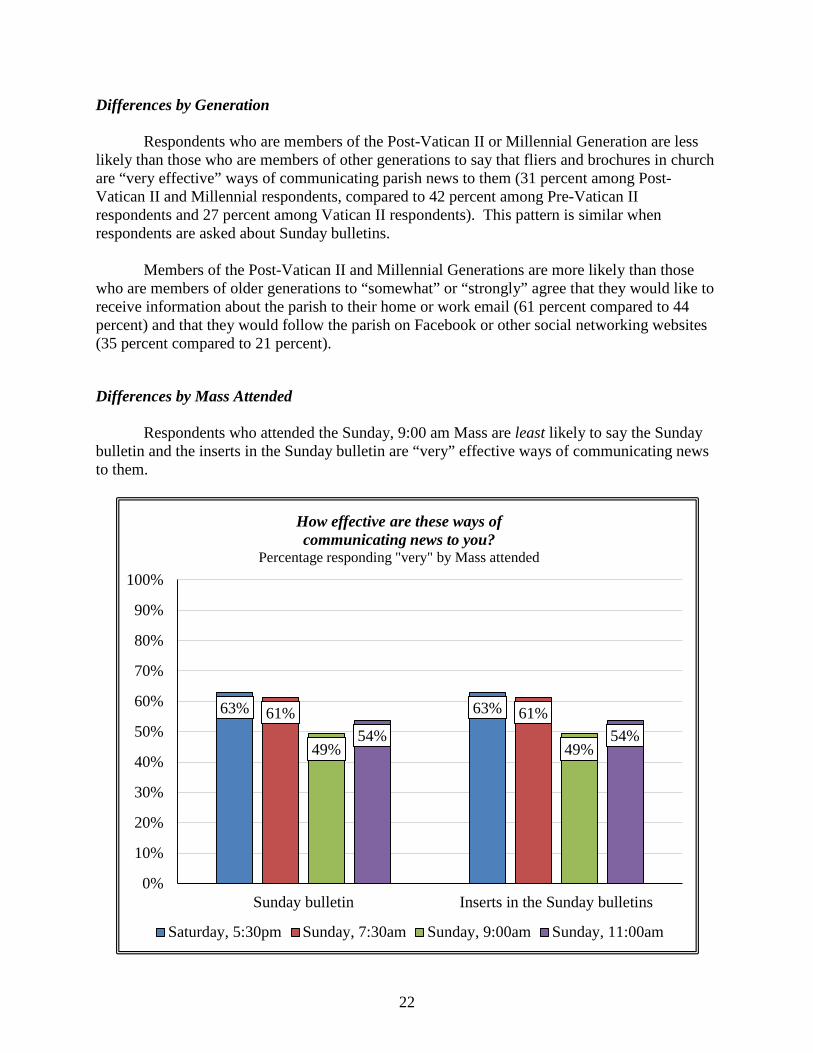
Differences by Mass Attended Respondents who attended the Sunday, 9:00 am Mass are least likely to say the Sunday bulletin and the inserts in the Sunday bulletin are “very” effective ways of communicating news to them.
63% 63% 61% 61%
49% 49% 54% 54%
0%
10%
20%
30%
40%
50%
60%
70%
80%
90%
100%
Sunday bulletin Inserts in the Sunday bulletins
How effective are these ways of communicating news to you?
Percentage responding "very" by Mass attended
Saturday, 5:30pm Sunday, 7:30am Sunday, 9:00am Sunday, 11:00am
23
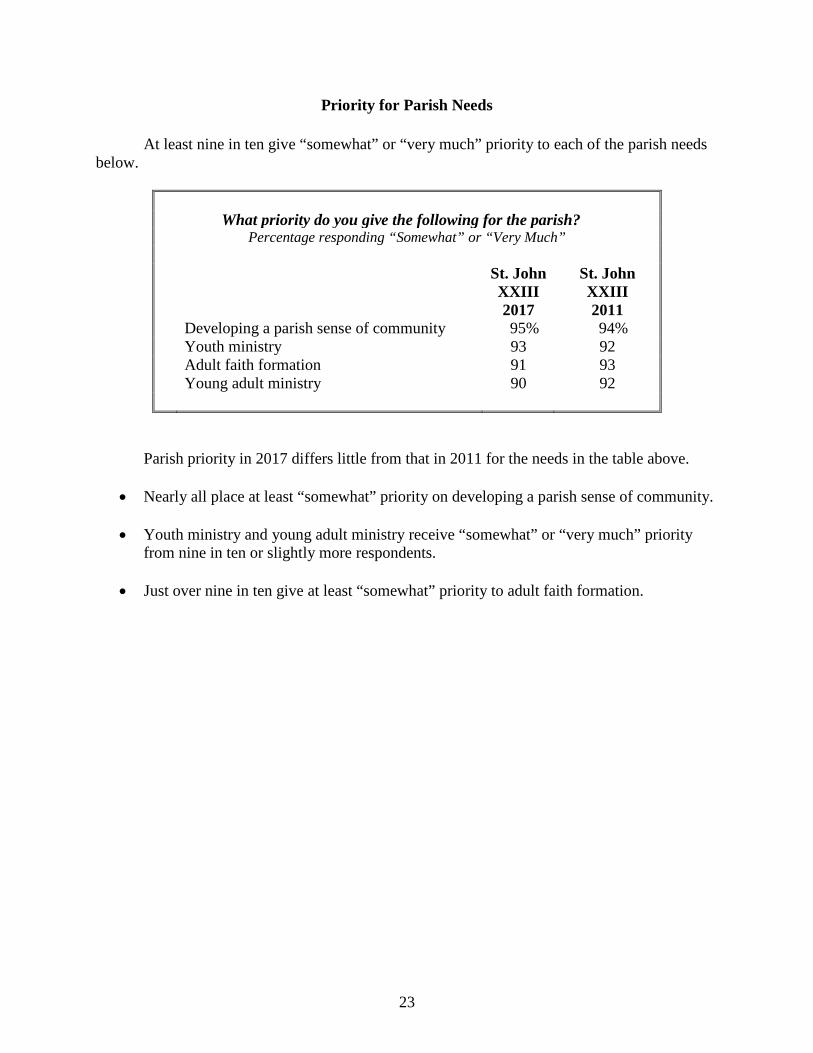
Priority for Parish Needs At least nine in ten give “somewhat” or “very much” priority to each of the parish needs below.
What priority do you give the following for the parish?
Percentage responding “Somewhat” or “Very Much” St. John
XXIII 2017
St. John XXIII 2011
Developing a parish sense of community 95% 94% Youth ministry 93 92 Adult faith formation 91 93 Young adult ministry 90 92
Parish priority in 2017 differs little from that in 2011 for the needs in the table above.
• Nearly all place at least “somewhat” priority on developing a parish sense of community.
• Youth ministry and young adult ministry receive “somewhat” or “very much” priority from nine in ten or slightly more respondents.
• Just over nine in ten give at least “somewhat” priority to adult faith formation.

24
“Very Much” Priority Developing a parish sense of community receives “very much” priority from three-quarters of respondents.
What priority do you give the following for the parish?
Percentage responding “Very Much” St. John
XXIII 2017
St. John XXIII 2011
Developing a parish sense of community 75% 70% Youth ministry 74 69 Young adult ministry 62 58 Adult faith formation 55 50
2017 respondents are similar to 2011 respondents in the high priority they place on the parish needs above.
• About three-quarters of 2017 respondents place “very much” priority on youth ministry. Just over six in ten give as much priority to young adult ministry.
• Adult faith formation receives high priority from more than half of respondents.
25
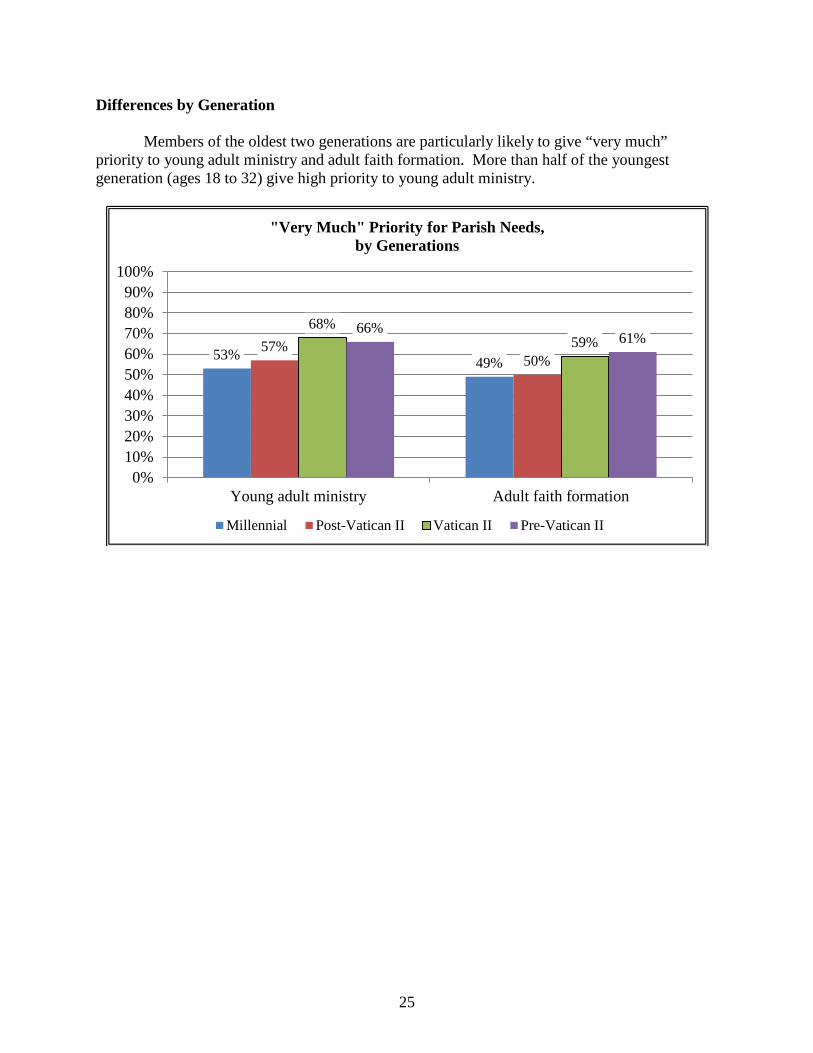
Differences by Generation Members of the oldest two generations are particularly likely to give “very much” priority to young adult ministry and adult faith formation. More than half of the youngest generation (ages 18 to 32) give high priority to young adult ministry.
53% 49% 57%
50%
68% 59%
66% 61%
0%10%20%30%40%50%60%70%80%90%
100%
Young adult ministry Adult faith formation
"Very Much" Priority for Parish Needs, by Generations
Millennial Post-Vatican II Vatican II Pre-Vatican II
26
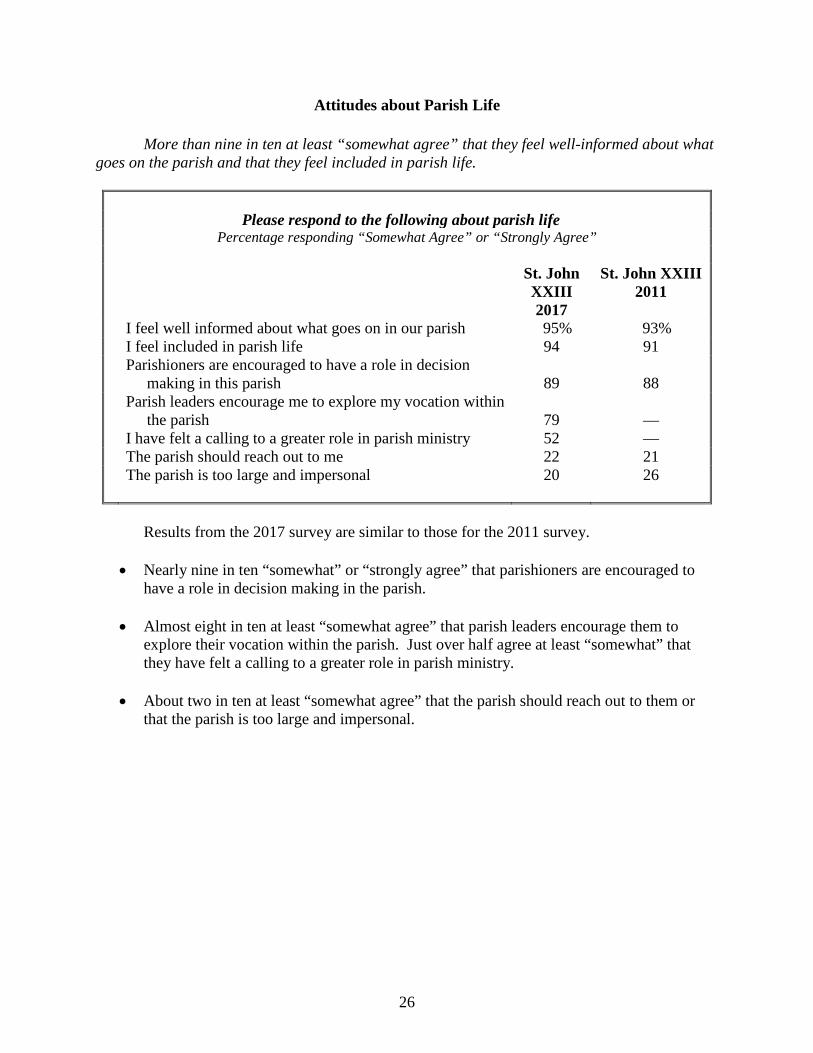
Attitudes about Parish Life More than nine in ten at least “somewhat agree” that they feel well-informed about what goes on the parish and that they feel included in parish life.
Please respond to the following about parish life
Percentage responding “Somewhat Agree” or “Strongly Agree” St. John
XXIII 2017
St. John XXIII 2011
I feel well informed about what goes on in our parish 95% 93% I feel included in parish life 94 91 Parishioners are encouraged to have a role in decision
making in this parish
89
88 Parish leaders encourage me to explore my vocation within
the parish
79
— I have felt a calling to a greater role in parish ministry 52 — The parish should reach out to me 22 21 The parish is too large and impersonal 20 26
Results from the 2017 survey are similar to those for the 2011 survey.
• Nearly nine in ten “somewhat” or “strongly agree” that parishioners are encouraged to have a role in decision making in the parish.
• Almost eight in ten at least “somewhat agree” that parish leaders encourage them to explore their vocation within the parish. Just over half agree at least “somewhat” that they have felt a calling to a greater role in parish ministry.
• About two in ten at least “somewhat agree” that the parish should reach out to them or that the parish is too large and impersonal.

27
“Strongly Agree” About six in ten “strongly agree” that they feel well informed about what goes on in the parish.
Please respond to the following about parish life
Percentage responding “Strongly Agree” St. John
XXIII 2017
St. John XXIII 2011
I feel well informed about what goes on in our parish 59% 59% I feel included in parish life 55 49 Parishioners are encouraged to have a role in decision
making in this parish
48
46 Parish leaders encourage me to explore my vocation within
the parish
35
— I have felt a calling to a greater role in parish ministry 17 — The parish is too large and impersonal 5 5 The parish should reach out to me 5 4
Nearly six in ten “strongly agree” that they feel included in parish life. At the other end
of the continuum, only one in 20 “strongly agree” that the parish is too large and impersonal or that the parish should reach out more to them.
• Almost half “strongly agree” that parishioners are encouraged to have a role in decision making in the parish.
• Just over one-third “strongly agree” that parish leaders encourage them to explore their vocation within the parish. Less than two in ten agree as strongly that they have felt a calling to a greater role in parish ministry.
• Findings from the 2017 survey are similar to those from the 2011 survey.
28
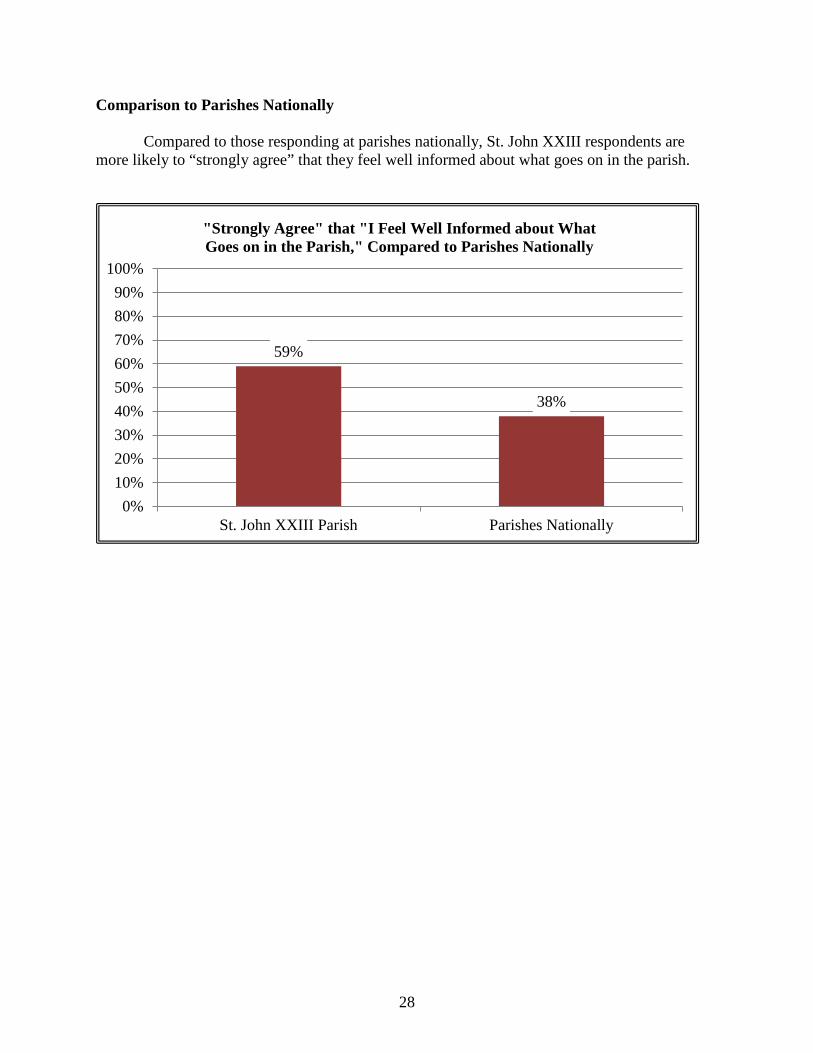
Comparison to Parishes Nationally Compared to those responding at parishes nationally, St. John XXIII respondents are more likely to “strongly agree” that they feel well informed about what goes on in the parish.
59%
38%
0%10%20%30%40%50%60%70%80%90%
100%
St. John XXIII Parish Parishes Nationally
"Strongly Agree" that "I Feel Well Informed about What Goes on in the Parish," Compared to Parishes Nationally
29
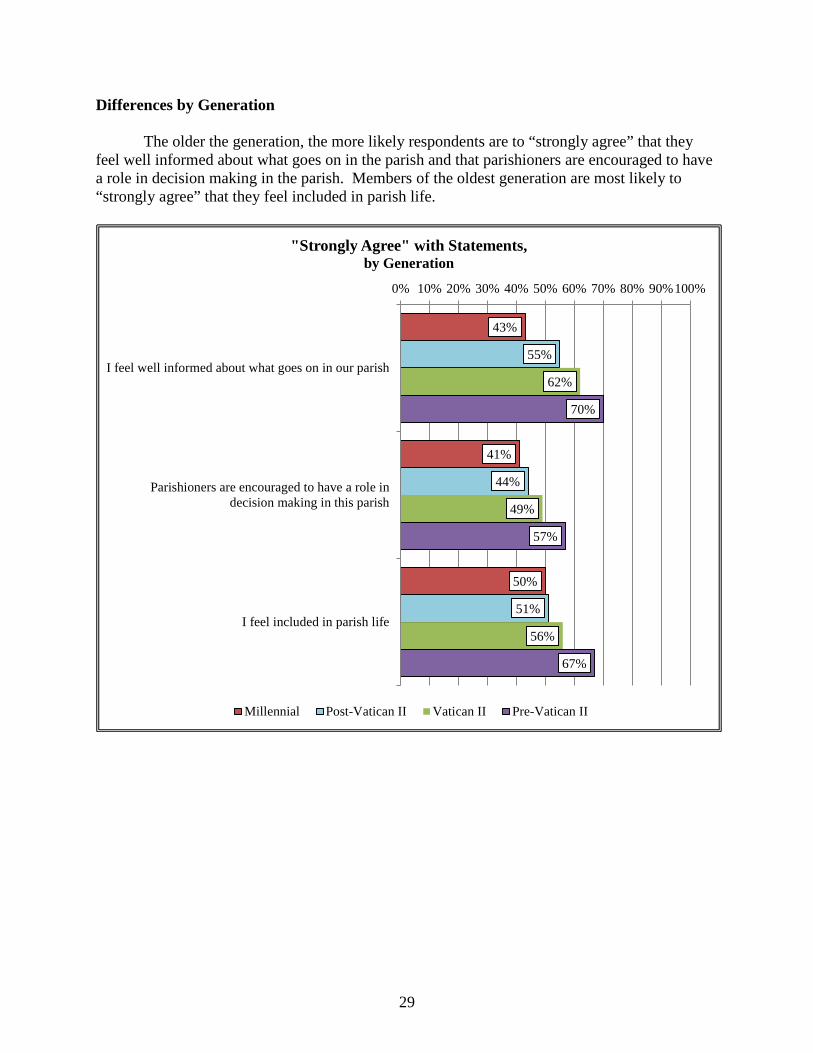
Differences by Generation The older the generation, the more likely respondents are to “strongly agree” that they feel well informed about what goes on in the parish and that parishioners are encouraged to have a role in decision making in the parish. Members of the oldest generation are most likely to “strongly agree” that they feel included in parish life.
43%
41%
50%
55%
44%
51%
62%
49%
56%
70%
57%
67%
0% 10% 20% 30% 40% 50% 60% 70% 80% 90%100%
I feel well informed about what goes on in our parish
Parishioners are encouraged to have a role indecision making in this parish
I feel included in parish life
"Strongly Agree" with Statements, by Generation
Millennial Post-Vatican II Vatican II Pre-Vatican II
30
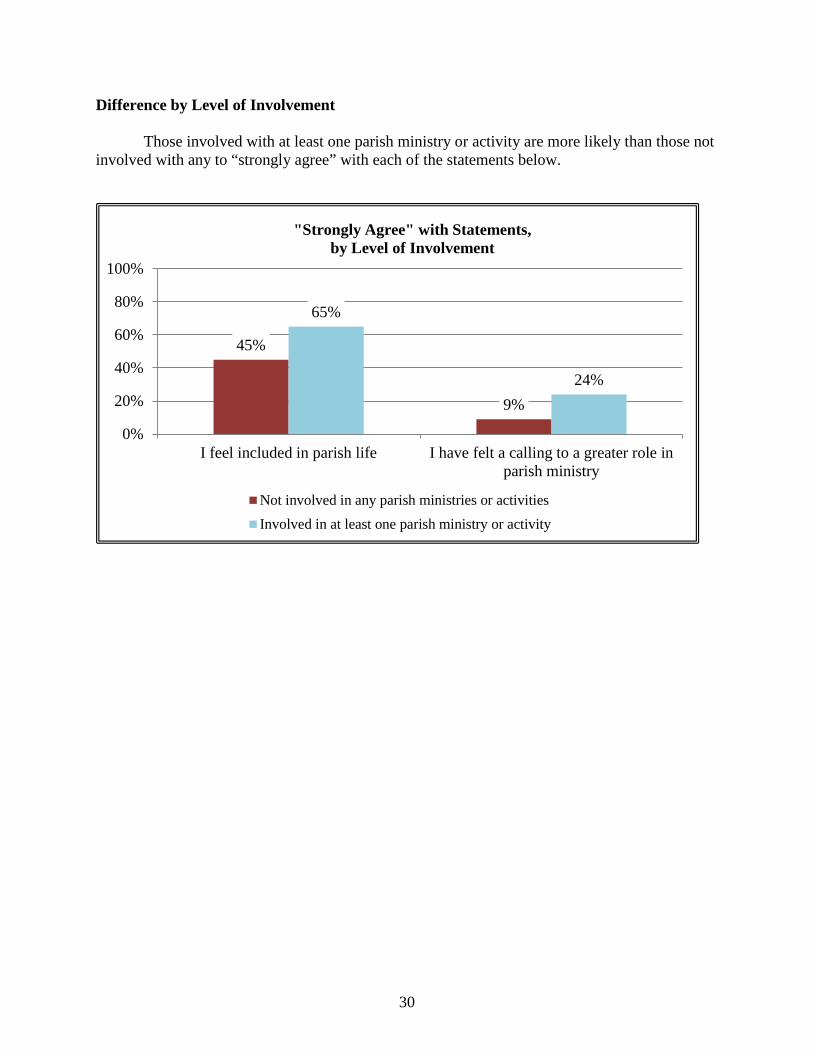
Difference by Level of Involvement Those involved with at least one parish ministry or activity are more likely than those not involved with any to “strongly agree” with each of the statements below.
45%
9%
65%
24%
0%
20%
40%
60%
80%
100%
I feel included in parish life I have felt a calling to a greater role inparish ministry
"Strongly Agree" with Statements, by Level of Involvement
Not involved in any parish ministries or activitiesInvolved in at least one parish ministry or activity
31
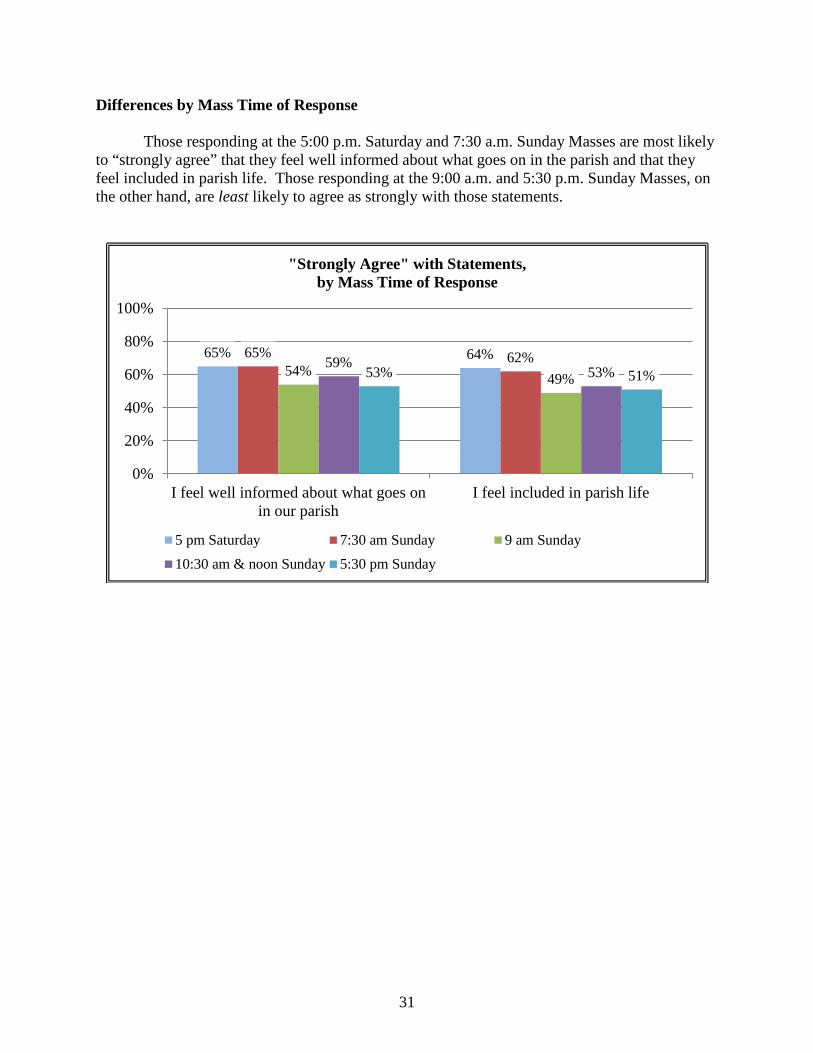
Differences by Mass Time of Response Those responding at the 5:00 p.m. Saturday and 7:30 a.m. Sunday Masses are most likely to “strongly agree” that they feel well informed about what goes on in the parish and that they feel included in parish life. Those responding at the 9:00 a.m. and 5:30 p.m. Sunday Masses, on the other hand, are least likely to agree as strongly with those statements.
65% 64% 65% 62% 54% 49%
59% 53% 53% 51%
0%
20%
40%
60%
80%
100%
I feel well informed about what goes onin our parish
I feel included in parish life
"Strongly Agree" with Statements, by Mass Time of Response
5 pm Saturday 7:30 am Sunday 9 am Sunday10:30 am & noon Sunday 5:30 pm Sunday
32
Appendix I: Response Frequencies to All Questions
33
Parish Life Survey for St. John XXIII Parish Middletown, Alaska
Center for Applied Research in the Apostolate
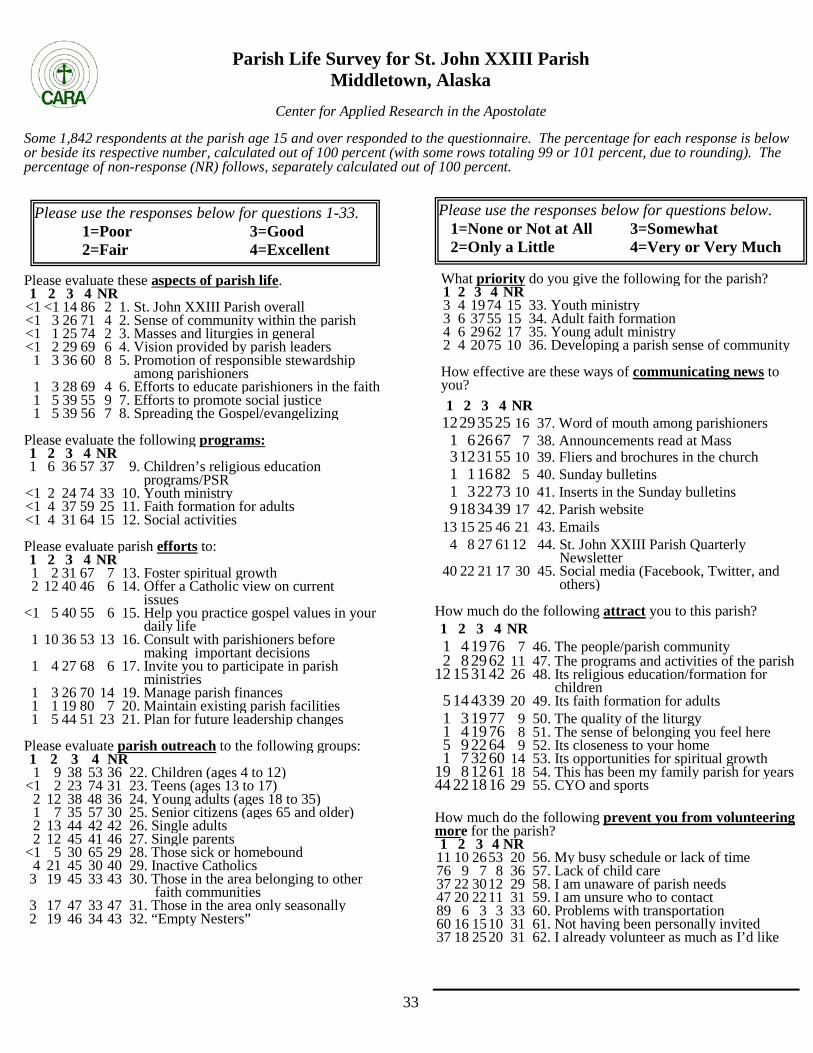
Some 1,842 respondents at the parish age 15 and over responded to the questionnaire. The percentage for each response is below or beside its respective number, calculated out of 100 percent (with some rows totaling 99 or 101 percent, due to rounding). The percentage of non-response (NR) follows, separately calculated out of 100 percent.
Please evaluate these aspects of parish life. 1 2 3 4 NR
<1 <1 14 86 2 1. St. John XXIII Parish overall <1 3 26 71 4 2. Sense of community within the parish <1 1 25 74 2 3. Masses and liturgies in general <1 2 29 69 6 4. Vision provided by parish leaders 1 3 36 60 8 5. Promotion of responsible stewardship
among parishioners 1 3 28 69 4 6. Efforts to educate parishioners in the faith 1 5 39 55 9 7. Efforts to promote social justice 1 5 39 56 7 8. Spreading the Gospel/evangelizing
Please evaluate the following programs: 1 2 3 4 NR 1 6 36 57 37 9. Children’s religious education
programs/PSR <1 2 24 74 33 10. Youth ministry <1 4 37 59 25 11. Faith formation for adults <1 4 31 64 15 12. Social activities
Please evaluate parish efforts to: 1 2 3 4 NR 1 2 31 67 7 13. Foster spiritual growth 2 12 40 46 6 14. Offer a Catholic view on current
issues <1 5 40 55 6 15. Help you practice gospel values in your
daily life 1 10 36 53 13 16. Consult with parishioners before
making important decisions 1 4 27 68 6 17. Invite you to participate in parish
ministries 1 3 26 70 14 19. Manage parish finances 1 1 19 80 7 20. Maintain existing parish facilities 1 5 44 51 23 21. Plan for future leadership changes
Please evaluate parish outreach to the following groups: 1 2 3 4 NR
1 9 38 53 36 22. Children (ages 4 to 12) <1 2 23 74 31 23. Teens (ages 13 to 17) 2 12 38 48 36 24. Young adults (ages 18 to 35) 1 7 35 57 30 25. Senior citizens (ages 65 and older) 2 13 44 42 42 26. Single adults 2 12 45 41 46 27. Single parents <1 5 30 65 29 28. Those sick or homebound 4 21 45 30 40 29. Inactive Catholics 3 19 45 33 43 30. Those in the area belonging to other
faith communities 3 17 47 33 47 31. Those in the area only seasonally 2 19 46 34 43 32. “Empty Nesters”
What priority do you give the following for the parish? 1 2 3 4 NR 3 4 19 74 15 33. Youth ministry 3 6 37 55 15 34. Adult faith formation 4 6 29 62 17 35. Young adult ministry 2 4 20 75 10 36. Developing a parish sense of community
How effective are these ways of communicating news to you? 1 2 3 4 NR
12 29 35 25 16 37. Word of mouth among parishioners 1 6 26 67 7 38. Announcements read at Mass 3 12 31 55 10 39. Fliers and brochures in the church 1 1 16 82 5 40. Sunday bulletins 1 3 22 73 10 41. Inserts in the Sunday bulletins 9 18 34 39 17 42. Parish website 13 15 25 46 21 43. Emails 4 8 27 61 12 44. St. John XXIII Parish Quarterly
Newsletter 40 22 21 17 30 45. Social media (Facebook, Twitter, and
others)
How much do the following attract you to this parish? 1 2 3 4 NR
1 4 19 76 7 46. The people/parish community 2 8 29 62 11 47. The programs and activities of the parish 12 15 31 42 26 48. Its religious education/formation for
children 5 14 43 39 20 49. Its faith formation for adults 1 3 19 77 9 50. The quality of the liturgy 1 4 19 76 8 51. The sense of belonging you feel here 5 9 22 64 9 52. Its closeness to your home 1 7 32 60 14 53. Its opportunities for spiritual growth 19 8 12 61 18 54. This has been my family parish for years 44 22 18 16 29 55. CYO and sports
How much do the following prevent you from volunteering more for the parish? 1 2 3 4 NR
11 10 26 53 20 56. My busy schedule or lack of time 76 9 7 8 36 57. Lack of child care 37 22 30 12 29 58. I am unaware of parish needs 47 20 22 11 31 59. I am unsure who to contact 89 6 3 3 33 60. Problems with transportation 60 16 15 10 31 61. Not having been personally invited 37 18 25 20 31 62. I already volunteer as much as I’d like
Please use the responses below for questions 1-33. 1=Poor 3=Good 2=Fair 4=Excellent
Please use the responses below for questions below. 1=None or Not at All 3=Somewhat 2=Only a Little 4=Very or Very Much
34
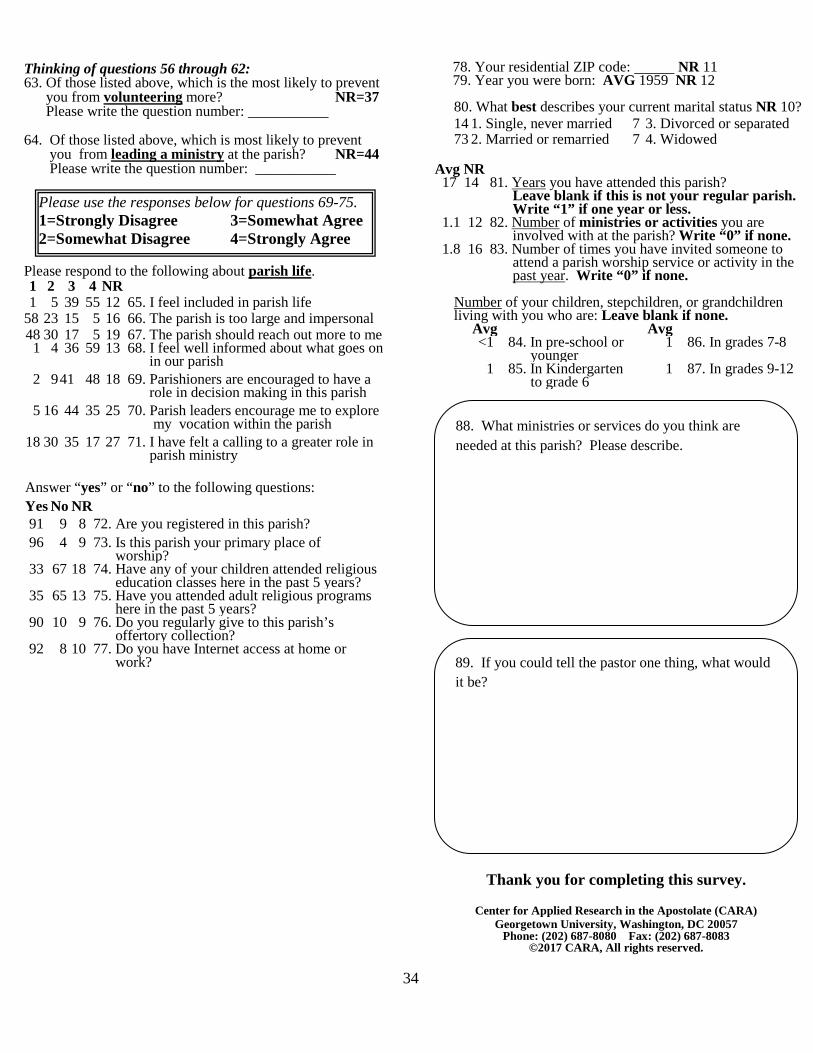
Thinking of questions 56 through 62: 63. Of those listed above, which is the most likely to prevent you from volunteering more? NR=37 Please write the question number: ___________ 64. Of those listed above, which is most likely to prevent you from leading a ministry at the parish? NR=44 Please write the question number: ___________
Please respond to the following about parish life. 1 2 3 4 NR 1 5 39 55 12 65. I feel included in parish life
58 23 15 5 16 66. The parish is too large and impersonal 48 30 17 5 19 67. The parish should reach out more to me 1 4 36 59 13 68. I feel well informed about what goes on
in our parish 2 9 41 48 18 69. Parishioners are encouraged to have a
role in decision making in this parish 5 16 44 35 25 70. Parish leaders encourage me to explore
my vocation within the parish 18 30 35 17 27 71. I have felt a calling to a greater role in
parish ministry
Answer “yes” or “no” to the following questions: Yes No NR 91 9 8 72. Are you registered in this parish? 96 4 9 73. Is this parish your primary place of
worship? 33 67 18 74. Have any of your children attended religious
education classes here in the past 5 years? 35 65 13 75. Have you attended adult religious programs
here in the past 5 years? 90 10 9 76. Do you regularly give to this parish’s
offertory collection? 92 8 10 77. Do you have Internet access at home or
work?
78. Your residential ZIP code: NR 11 79. Year you were born: AVG 1959 NR 12
80. What best describes your current marital status NR 10? 14 1. Single, never married 7 3. Divorced or separated 73 2. Married or remarried 7 4. Widowed
Avg NR 17 14 81. Years you have attended this parish?
Leave blank if this is not your regular parish. Write “1” if one year or less.
1.1 12 82. Number of ministries or activities you are involved with at the parish? Write “0” if none.
1.8 16 83. Number of times you have invited someone to attend a parish worship service or activity in the past year. Write “0” if none.
Number of your children, stepchildren, or grandchildren living with you who are: Leave blank if none. Avg Avg
<1 84. In pre-school or younger
1 86. In grades 7-8
1 85. In Kindergarten to grade 6
1 87. In grades 9-12
Thank you for completing this survey.
Center for Applied Research in the Apostolate (CARA) Georgetown University, Washington, DC 20057
Phone: (202) 687-8080 Fax: (202) 687-8083 ©2017 CARA, All rights reserved.
Please use the responses below for questions 69-75. 1=Strongly Disagree 3=Somewhat Agree 2=Somewhat Disagree 4=Strongly Agree
88. What ministries or services do you think are needed at this parish? Please describe.
89. If you could tell the pastor one thing, what would it be?

35