Embed Size (px)
Citation preview
The University of Texas at Austin Section A1Comprehensive Flare Study ProjectQuality Assurance Project Plan
Revision No. 1 Page 1 of 11 8/10
A1.1 Preface
This Quality Assurance Project Plan (QAPP) is submitted in partial fulfillment of theComprehensive Flare Study Project contract issued by the Texas Commission on EnvironmentalQuality (TCEQ) to The University of Texas at Austin, Center for Energy and EnvironmentalResources under Grant Activities No. 582-8-862-45-FY09-04, Tracking No. 2008-81. It has beenprepared in accordance with the Environmental Protection Agency QA-R5 document format forNational Air Monitoring Stations/State and Local Air Monitoring Stations (NAMS/SLAMS) andPhotochemical Assessment Monitoring Stations (PAMS). In this regard, the most current versions(at the time of initial preparation) of the TCEQ NAMS/SLAMS/PAMS QAPPs for air monitoring inTexas have been used as the basis for this document. It is expected that during the life of thisproject, the requirements of this QAPP will always meet or exceed the TCEQNAMS/SLAMS/PAMS QAPPs for air monitoring in Texas.
Contact:
Edward L. MichelFlare Tests CoordinatorComprehensive Flare Study
E-mail Address: [email protected]
The University of Texas at AustinCenter for Energy & Environmental Resources (R7100)10100 Burnet Road, EME (Bldg 133)Austin, TX 78758
The University of Texas at Austin Section A1Comprehensive Flare Study ProjectQuality Assurance Project Plan
Revision No. 0 Page 2 of 11 8/10
A1.2 Approval Page
Project ManagerAir Quality DivisionTexas Commission on EnvironmentalQuality Danielle Nesvacil Date
Project ManagerAir Quality DivisionTexas Commission on EnvironmentalQuality Russ Nettles Date
Project ManagerAir Quality DivisionTexas Commission on EnvironmentalQuality Kevin Cauble Date
Project Quality Assurance ManagerAir Quality DivisionTexas Commission on EnvironmentalQuality Bryan Foster Date
The University of Texas at Austin Section A1Comprehensive Flare Study ProjectQuality Assurance Project Plan
Revision No. 0 Page 3 of 11 8/10
A1.2 Approval Page (Continued)
TCEQ Technical Review CommitteeComprehensive Flare Study Project Peter Gogolek, Ph.D. Date
TCEQ Technical Review CommitteeComprehensive Flare Study Project John Pohl, Sc.D. Date
TCEQ Technical Review CommitteeComprehensive Flare Study Project Eben Thoma, Ph.D. Date
The University of Texas at Austin Section A1Comprehensive Flare Study ProjectQuality Assurance Project Plan
Revision No. 0 Page 4 of 11 8/10
A1.2 Approval Page (Continued)
Principal InvestigatorComprehensive Flare Study ProjectThe University of Texas at AustinAustin, Texas
David T. Allen, Ph.D. Date
Project ManagerComprehensive Flare Study ProjectThe University of Texas at AustinAustin, Texas
Vincent M. Torres,MSE, PE
Date
Project Quality Assurance ManagerComprehensive Flare Study ProjectThe University of Texas at AustinAustin, Texas
Flare Tests CoordinatorComprehensive Flare Study ProjectThe University of Texas at AustinAustin, Texas
Dave Sullivan, Ph.D
___________________Edward L. Michel
Date
___________Date
The University of Texas at Austin Section A1Comprehensive Flare Study ProjectQuality Assurance Project Plan
Revision No. 0 Page 5 of 11 8/10
A1.2 Approval Page (Continued)
Project Representative/ Project DirectorAerodyne Research, Inc.Billerica, Massachusetts Scott Herndon, Ph.D. Date
Project Quality Assurance OfficerAerodyne Research, Inc.Billerica, Massachusetts Charles E. Kolb, Ph.D. Date
The University of Texas at Austin Section A1Comprehensive Flare Study ProjectQuality Assurance Project Plan
Revision No. 0 Page 6 of 11 8/10
A1.2 Approval Page (Continued)
Project Representative/ Project DirectorIndustrial Monitor and ControlCorporationRound Rock, Texas Robert L. Spellicy, Ph.D. Date
Project Quality Assurance OfficerIndustrial Monitor and ControlCorporationRound Rock, Texas Curt Laush, Ph.D. Date
The University of Texas at Austin Section A1Comprehensive Flare Study ProjectQuality Assurance Project Plan
Revision No. 0 Page 7 of 11 8/10
A1.2 Approval Page (Continued)
Project Representative/ Project DirectorJohn Zink Company, Inc.Tulsa, Oklahoma Robert Schwartz Date
Project Quality Assurance OfficerJohn Zink Company, Inc.Tulsa, Oklahoma Wes Bussman, Ph.D. Date
Project Operations DirectorJohn Zink Company, Inc.Tulsa, Oklahoma
_______________________Zachary Kodesh
______________Date
The University of Texas at Austin Section A1Comprehensive Flare Study ProjectQuality Assurance Project Plan
Revision No. 0 Page 8 of 11 8/10
A1.2 Approval Page (Continued)
Project Representative/ Project DirectorLeak Surveys, Inc.Early, Texas Bud McCorkle Date
Project Quality Assurance OfficerLeak Surveys, Inc.Early, Texas Joshua Furry Date
The University of Texas at Austin Section A1Comprehensive Flare Study ProjectQuality Assurance Project Plan
Revision No. 0 Page 9 of 11 8/10
A1.2 Approval Page (Continued)
Project Representative/ Project DirectorTelopsQuebec City, QuebecCanada Vincent Farley Date
Project Quality Assurance OfficerTelopsQuebec City, QuebecCanada Jean Giroux Date
The University of Texas at Austin Section A1Comprehensive Flare Study ProjectQuality Assurance Project Plan
Revision No. 0 Page 10 of 11 8/10
A1.2 Approval Page (Continued)
Project Representative/ Project DirectorTRCAustin, Texas Jim Barufaldi Date
Project Quality Assurance OfficerTRCAustin, Texas Clayton Elliot Date
The University of Texas at Austin Section A1Comprehensive Flare Study ProjectQuality Assurance Project Plan
Revision No. 0 Page 11 of 11 8/10
A1.2 Approval Page (Continued)
Project Representative/ Project DirectorZephyr Environmental ConsultingAustin, Texas Karen Olsen Date
Project Quality Assurance OfficerZephyr Environmental ConsultingAustin, Texas Maria Gou Date
The University of Texas at Austin Section A2Comprehensive Flare Study ProjectQuality Assurance Project Plan
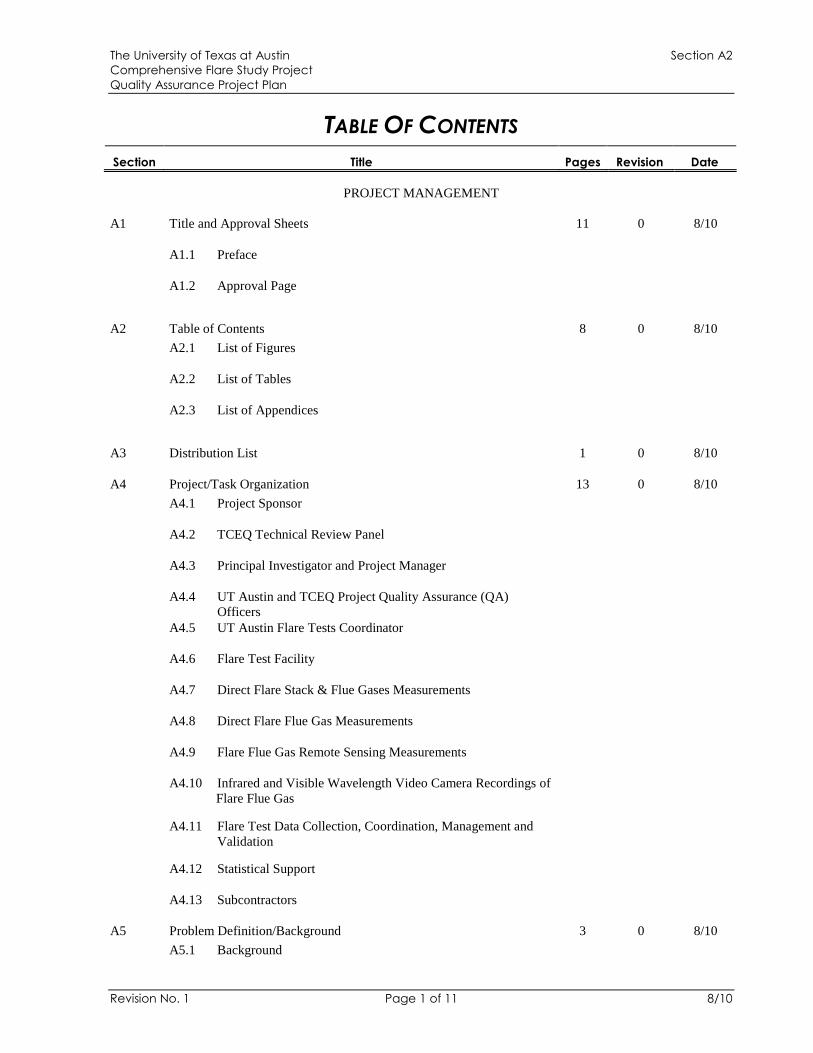
TABLE OF CONTENTS
Section Title Pages Revision Date
Revision No. 1 Page 1 of 11 8/10
PROJECT MANAGEMENT
A1 Title and Approval Sheets 11 0 8/10
A1.1 Preface
A1.2 Approval Page
A2 Table of Contents 8 0 8/10A2.1 List of Figures
A2.2 List of Tables
A2.3 List of Appendices
A3 Distribution List 1 0 8/10
A4 Project/Task Organization 13 0 8/10A4.1 Project Sponsor
A4.2 TCEQ Technical Review Panel
A4.3 Principal Investigator and Project Manager
A4.4 UT Austin and TCEQ Project Quality Assurance (QA)Officers
A4.5 UT Austin Flare Tests Coordinator
A4.6 Flare Test Facility
A4.7 Direct Flare Stack & Flue Gases Measurements
A4.8 Direct Flare Flue Gas Measurements
A4.9 Flare Flue Gas Remote Sensing Measurements
A4.10 Infrared and Visible Wavelength Video Camera Recordings ofFlare Flue Gas
A4.11 Flare Test Data Collection, Coordination, Management andValidation
A4.12 Statistical Support
A4.13 Subcontractors
A5 Problem Definition/Background 3 0 8/10A5.1 Background
The University of Texas at Austin Section A2Comprehensive Flare Study ProjectQuality Assurance Project Plan
TABLE OF CONTENTS
Section Title Pages Revision Date
Revision No. 1 Page 2 of 11 8/10
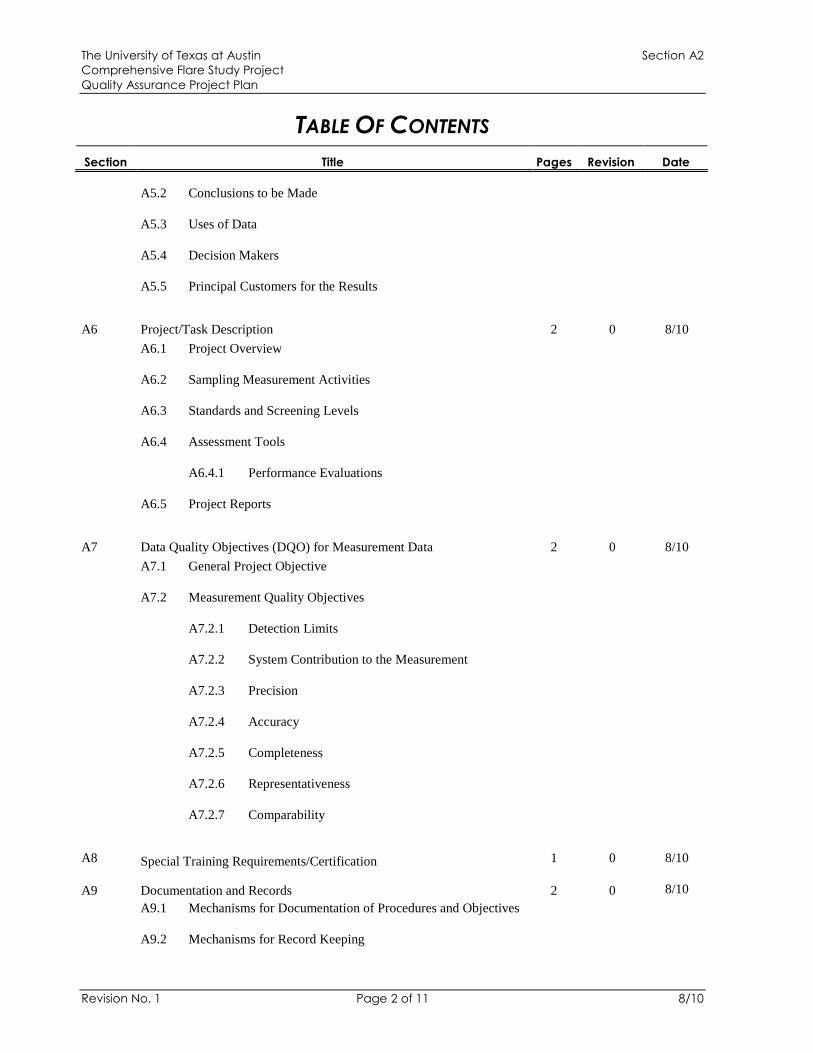
A5.2 Conclusions to be Made
A5.3 Uses of Data
A5.4 Decision Makers
A5.5 Principal Customers for the Results
A6 Project/Task Description 2 0 8/10A6.1 Project Overview
A6.2 Sampling Measurement Activities
A6.3 Standards and Screening Levels
A6.4 Assessment Tools
A6.4.1 Performance Evaluations
A6.5 Project Reports
A7 Data Quality Objectives (DQO) for Measurement Data 2 0 8/10A7.1 General Project Objective
A7.2 Measurement Quality Objectives
A7.2.1 Detection Limits
A7.2.2 System Contribution to the Measurement
A7.2.3 Precision
A7.2.4 Accuracy
A7.2.5 Completeness
A7.2.6 Representativeness
A7.2.7 Comparability
A8 Special Training Requirements/Certification 1 0 8/10
A9 Documentation and Records 2 0 8/10A9.1 Mechanisms for Documentation of Procedures and Objectives
A9.2 Mechanisms for Record Keeping
The University of Texas at Austin Section A2Comprehensive Flare Study ProjectQuality Assurance Project Plan
TABLE OF CONTENTS
Section Title Pages Revision Date
Revision No. 1 Page 3 of 11 8/10
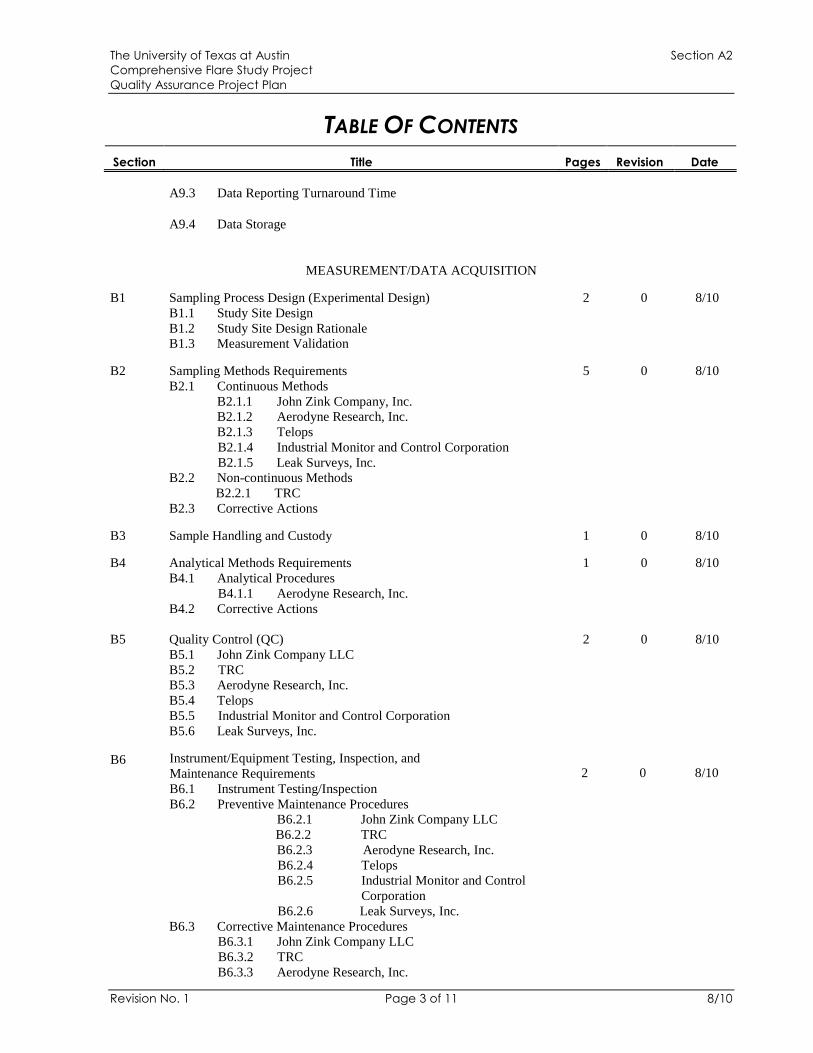
A9.3 Data Reporting Turnaround Time
A9.4 Data Storage
MEASUREMENT/DATA ACQUISITION
B1 Sampling Process Design (Experimental Design) 2 0 8/10B1.1 Study Site DesignB1.2 Study Site Design RationaleB1.3 Measurement Validation
B2 Sampling Methods Requirements 5 0 8/10B2.1 Continuous Methods
B2.1.1 John Zink Company, Inc.B2.1.2 Aerodyne Research, Inc.B2.1.3 TelopsB2.1.4 Industrial Monitor and Control CorporationB2.1.5 Leak Surveys, Inc.
B2.2 Non-continuous MethodsB2.2.1 TRC
B2.3 Corrective Actions
B3 Sample Handling and Custody 1 0 8/10
B4 Analytical Methods Requirements 1 0 8/10B4.1 Analytical Procedures
B4.1.1 Aerodyne Research, Inc.B4.2 Corrective Actions
B5 Quality Control (QC) 2 0 8/10B5.1 John Zink Company LLCB5.2 TRCB5.3 Aerodyne Research, Inc.B5.4 TelopsB5.5 Industrial Monitor and Control CorporationB5.6 Leak Surveys, Inc.
B6 Instrument/Equipment Testing, Inspection, andMaintenance Requirements 2 0 8/10B6.1 Instrument Testing/InspectionB6.2 Preventive Maintenance Procedures
B6.2.1 John Zink Company LLCB6.2.2 TRCB6.2.3 Aerodyne Research, Inc.B6.2.4 TelopsB6.2.5 Industrial Monitor and Control
CorporationB6.2.6 Leak Surveys, Inc.
B6.3 Corrective Maintenance ProceduresB6.3.1 John Zink Company LLCB6.3.2 TRCB6.3.3 Aerodyne Research, Inc.
The University of Texas at Austin Section A2Comprehensive Flare Study ProjectQuality Assurance Project Plan
TABLE OF CONTENTS
Section Title Pages Revision Date
Revision No. 1 Page 4 of 11 8/10
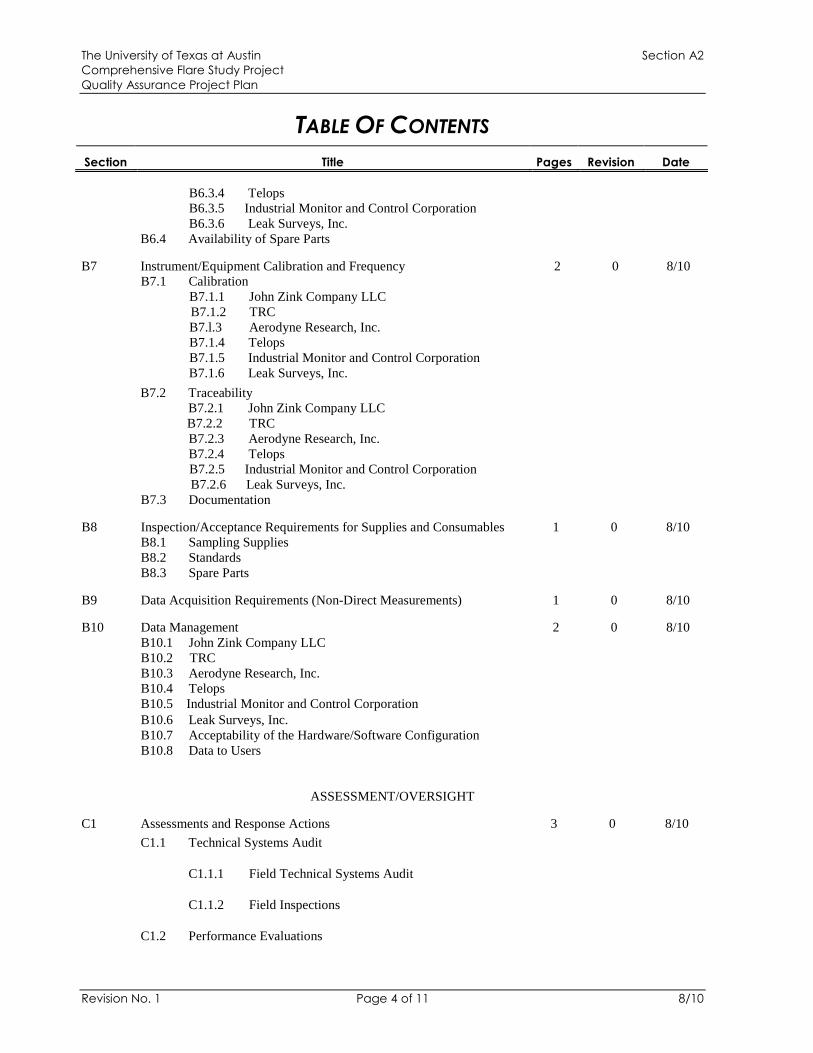
B6.3.4 TelopsB6.3.5 Industrial Monitor and Control CorporationB6.3.6 Leak Surveys, Inc.
B6.4 Availability of Spare Parts
B7 Instrument/Equipment Calibration and Frequency 2 0 8/10B7.1 Calibration
B7.1.1 John Zink Company LLCB7.1.2 TRCB7.l.3 Aerodyne Research, Inc.B7.1.4 TelopsB7.1.5 Industrial Monitor and Control CorporationB7.1.6 Leak Surveys, Inc.
B7.2 TraceabilityB7.2.1 John Zink Company LLCB7.2.2 TRCB7.2.3 Aerodyne Research, Inc.B7.2.4 TelopsB7.2.5 Industrial Monitor and Control CorporationB7.2.6 Leak Surveys, Inc.
B7.3 Documentation
B8 Inspection/Acceptance Requirements for Supplies and Consumables 1 0 8/10B8.1 Sampling SuppliesB8.2 StandardsB8.3 Spare Parts
B9 Data Acquisition Requirements (Non-Direct Measurements) 1 0 8/10
B10 Data Management 2 0 8/10B10.1 John Zink Company LLCB10.2 TRCB10.3 Aerodyne Research, Inc.B10.4 TelopsB10.5 Industrial Monitor and Control CorporationB10.6 Leak Surveys, Inc.B10.7 Acceptability of the Hardware/Software ConfigurationB10.8 Data to Users
ASSESSMENT/OVERSIGHT
C1 Assessments and Response Actions 3 0 8/10C1.1 Technical Systems Audit
C1.1.1 Field Technical Systems Audit
C1.1.2 Field Inspections
C1.2 Performance Evaluations
The University of Texas at Austin Section A2Comprehensive Flare Study ProjectQuality Assurance Project Plan
TABLE OF CONTENTS
Section Title Pages Revision Date
Revision No. 1 Page 5 of 11 8/10
C1.2.1 Field Assessment
C1.3 Assessment of Data Quality Indicators
C1.3.1 Specific Procedures to Assess Data Quality
C1.3.1.1 Data Precision Assessment
C1.3.1.2 Data Accuracy Assessment
C1.3.1.3 Data Completeness Assessment
C1.4 Audits of Data Quality
C1.5 Corrective Actions
C2 Reports to Management 1 0 8/10C2.1 Quality Assurance (QA) Audit Reports
C2.2 Annual Project QA Report
C2.3 Data Reports
C2.3.1 Field Activity Reports
C2.3.2 Quality Assurance Reports
C2.4 Reporting Schedule
DATA VALIDATION AND VERIFICATION
D1 Data Review, Validation, and Verification 3 0 8/10D1.1 Data Validation
D1.1.1 John Zink Company LLC
D1.1.2 TRC
D1.1.3 Aerodyne Research, Inc.
D1.1.4 Telops
D1.1.5 Industrial Monitor and Control Corporation
D1.1.6 Leak Surveys, Inc.
D1.2 Data Custody
D1.2.1 John Zink Company LLC
The University of Texas at Austin Section A2Comprehensive Flare Study ProjectQuality Assurance Project Plan
TABLE OF CONTENTS
Section Title Pages Revision Date
Revision No. 1 Page 6 of 11 8/10
D1.2.2 TRC
D1.2.3 Aerodyne Research, Inc.
D1.2.4 Telops
D1.2.5 Industrial Monitor and Control Corporation
D1.2.6 Leak Surveys, Inc.
D2 Validation and Verification Methods 2 0 8/10D2.1 John Zink Company LLC
D2.2 TRC
D2.3 Aerodyne Research, Inc.
D2.4 Telops
D2.5 Industrial Monitor and Control Corporation
D2.6 Leak Surveys, Inc.
D2.7 Data Review
D3 Reconciliation with User Requirements 3 0 8/10D3.1 Detection Limits
D3.2 Precision
D3.2.1 John Zink Company LLC
D3.2.2 TRC
D3.2.3 Aerodyne Research, Inc.
D3.2.4 Telops
D3.2.5 Industrial Monitor and Control Corporation
D3.2.6 Leak Surveys, Inc.
D3.3 Accuracy
D3.3.1 John Zink Company LLC
D3.3.2 TRC
D3.3.3 Aerodyne Research, Inc.
D3.3.4 Telops
D3.3.5 Industrial Monitor and Control Corporation
D3.3.6 Leak Surveys, Inc.
The University of Texas at Austin Section A2Comprehensive Flare Study ProjectQuality Assurance Project Plan
TABLE OF CONTENTS
Section Title Pages Revision Date
Revision No. 1 Page 7 of 11 8/10
D3.4 Completeness
The University of Texas at Austin Section A2Comprehensive Flare Study ProjectQuality Assurance Project Plan
LIST OF FIGURES
Section Title Pages Revision Date
Revision No. 1 Page 8 of 11 8/10
A4 Figure A4.A Comprehensive Flare Study ProjectOrganization
1 0 8/10
B2 Figure B2.A LSI Camera Image 1 0 8/10B5 Figure B5.A Aerodyne Mass Spectrometer
Appendix F1 0 8/10
The University of Texas at Austin Section A2Comprehensive Flare Study ProjectQuality Assurance Project Plan
LIST OF TABLES
Section Title Pages Revision Date
Revision No. 1 Page 9 of 11 8/10
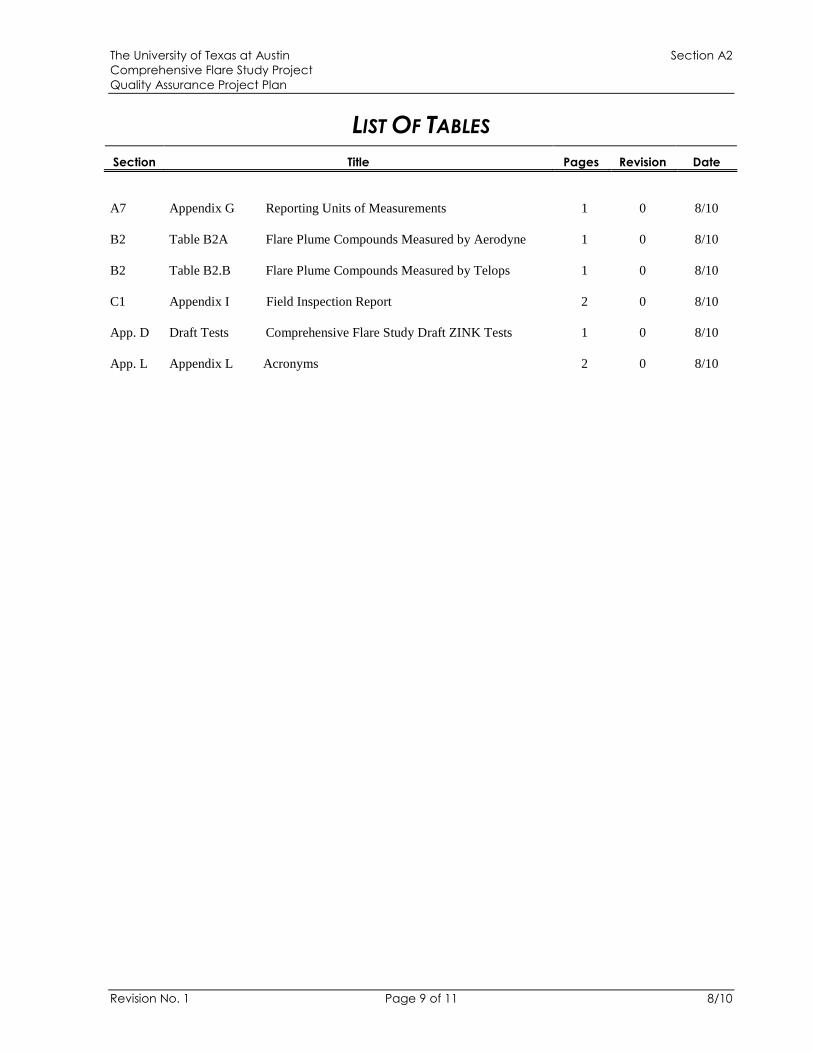
A7 Appendix G Reporting Units of Measurements 1 0 8/10
B2 Table B2A Flare Plume Compounds Measured by Aerodyne 1 0 8/10
B2 Table B2.B Flare Plume Compounds Measured by Telops 1 0 8/10
C1 Appendix I Field Inspection Report 2 0 8/10
App. D Draft Tests Comprehensive Flare Study Draft ZINK Tests 1 0 8/10
App. L Appendix L Acronyms 2 0 8/10
The University of Texas at Austin Section A2Comprehensive Flare Study ProjectQuality Assurance Project Plan
LIST OF APPENDICES
Appendix Title Pages Revision Date
Revision No. 1 Page 10 of 11 8/10
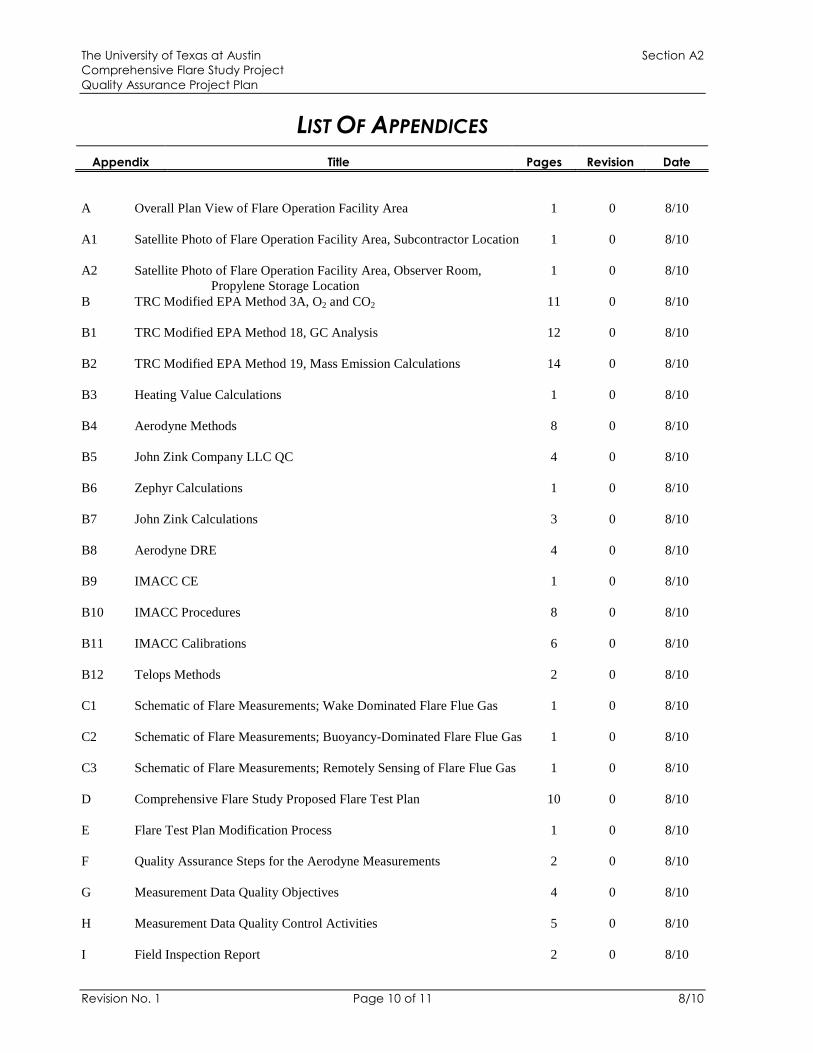
A Overall Plan View of Flare Operation Facility Area 1 0 8/10
A1 Satellite Photo of Flare Operation Facility Area, Subcontractor Location 1 0 8/10
A2 Satellite Photo of Flare Operation Facility Area, Observer Room,Propylene Storage Location
1 0 8/10
B TRC Modified EPA Method 3A, O2 and CO2 11 0 8/10
B1 TRC Modified EPA Method 18, GC Analysis 12 0 8/10
B2 TRC Modified EPA Method 19, Mass Emission Calculations 14 0 8/10
B3 Heating Value Calculations 1 0 8/10
B4 Aerodyne Methods 8 0 8/10
B5 John Zink Company LLC QC 4 0 8/10
B6 Zephyr Calculations 1 0 8/10
B7 John Zink Calculations 3 0 8/10
B8 Aerodyne DRE 4 0 8/10
B9 IMACC CE 1 0 8/10
B10 IMACC Procedures 8 0 8/10
B11 IMACC Calibrations 6 0 8/10
B12 Telops Methods 2 0 8/10
C1 Schematic of Flare Measurements; Wake Dominated Flare Flue Gas 1 0 8/10
C2 Schematic of Flare Measurements; Buoyancy-Dominated Flare Flue Gas 1 0 8/10
C3 Schematic of Flare Measurements; Remotely Sensing of Flare Flue Gas 1 0 8/10
D Comprehensive Flare Study Proposed Flare Test Plan 10 0 8/10
E Flare Test Plan Modification Process 1 0 8/10
F Quality Assurance Steps for the Aerodyne Measurements 2 0 8/10
G Measurement Data Quality Objectives 4 0 8/10
H Measurement Data Quality Control Activities 5 0 8/10
I Field Inspection Report 2 0 8/10
The University of Texas at Austin Section A2Comprehensive Flare Study ProjectQuality Assurance Project Plan
LIST OF APPENDICES
Appendix Title Pages Revision Date
Revision No. 1 Page 11 of 11 8/10
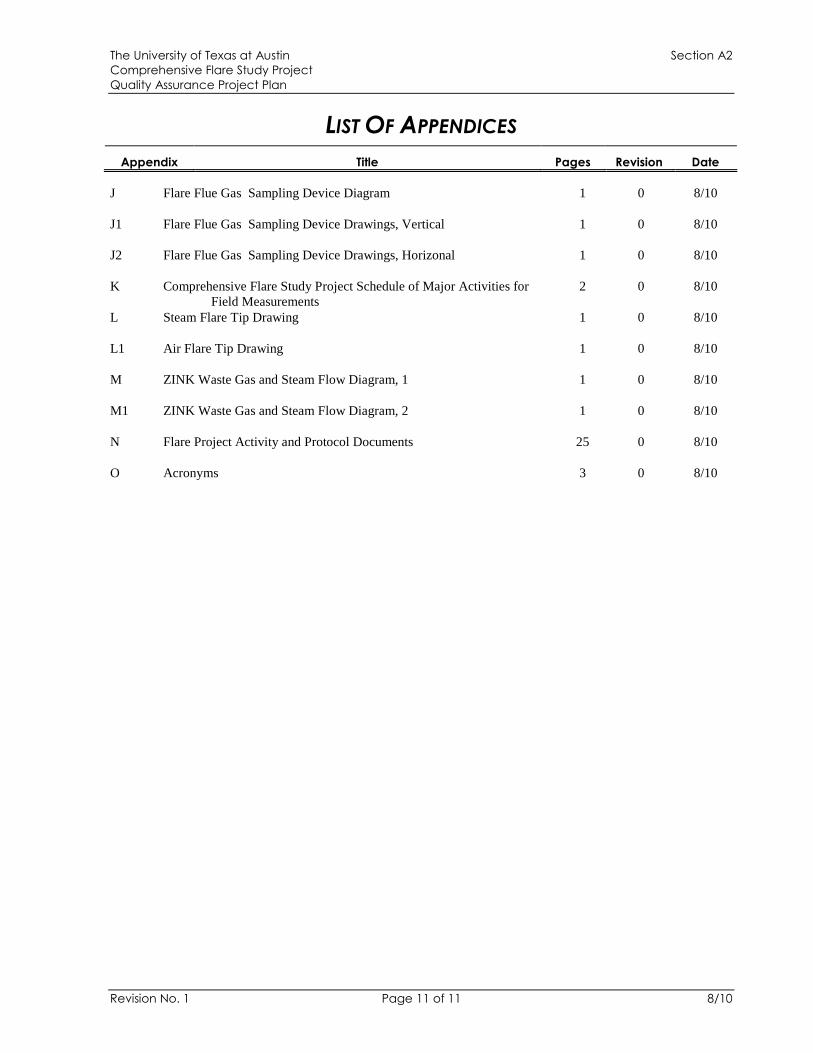
J Flare Flue Gas Sampling Device Diagram 1 0 8/10
J1 Flare Flue Gas Sampling Device Drawings, Vertical 1 0 8/10
J2 Flare Flue Gas Sampling Device Drawings, Horizonal 1 0 8/10
K Comprehensive Flare Study Project Schedule of Major Activities forField Measurements
2 0 8/10
L Steam Flare Tip Drawing 1 0 8/10
L1 Air Flare Tip Drawing 1 0 8/10
M ZINK Waste Gas and Steam Flow Diagram, 1 1 0 8/10
M1 ZINK Waste Gas and Steam Flow Diagram, 2 1 0 8/10
N Flare Project Activity and Protocol Documents 25 0 8/10
O Acronyms 3 0 8/10
The University of Texas at Austin Section A3Comprehensive Flare Study ProjectQuality Assurance Project Plan
Revision No. 1 Page 1 of 1 8/10
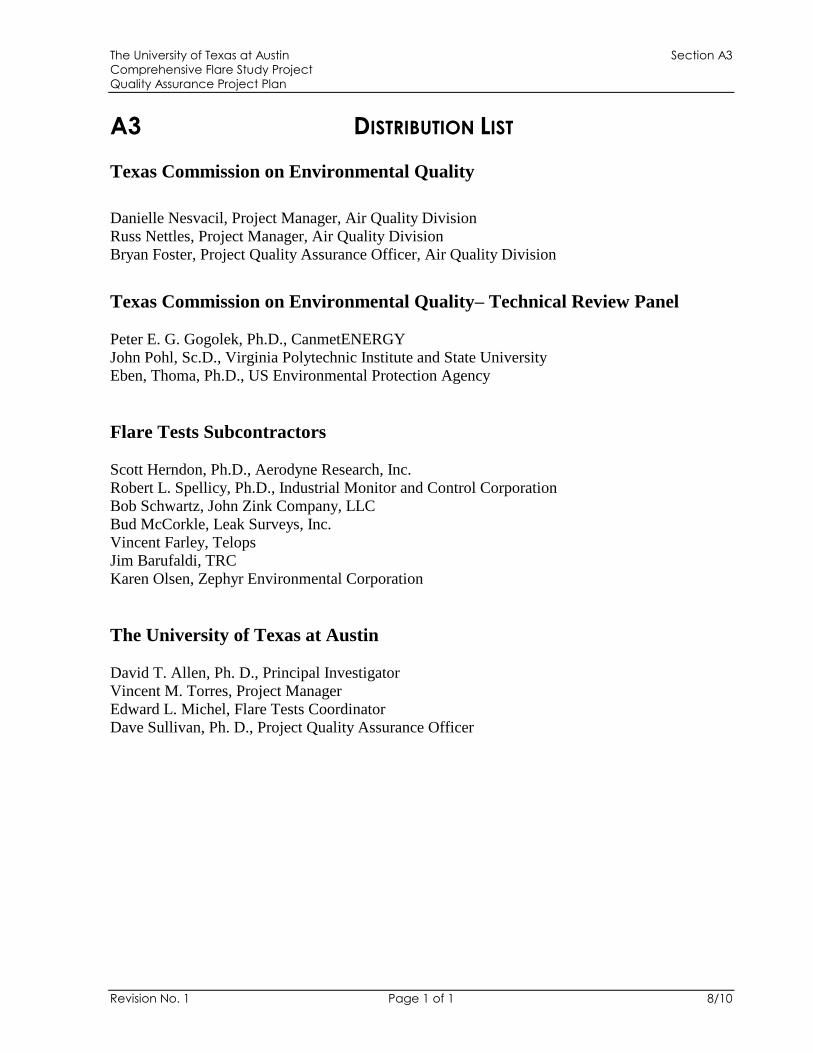
A3 DISTRIBUTION LIST
Texas Commission on Environmental Quality
Danielle Nesvacil, Project Manager, Air Quality DivisionRuss Nettles, Project Manager, Air Quality DivisionBryan Foster, Project Quality Assurance Officer, Air Quality Division
Texas Commission on Environmental Quality–Technical Review Panel
Peter E. G. Gogolek, Ph.D., CanmetENERGYJohn Pohl, Sc.D., Virginia Polytechnic Institute and State UniversityEben, Thoma, Ph.D., US Environmental Protection Agency
Flare Tests Subcontractors
Scott Herndon, Ph.D., Aerodyne Research, Inc.Robert L. Spellicy, Ph.D., Industrial Monitor and Control CorporationBob Schwartz, John Zink Company, LLCBud McCorkle, Leak Surveys, Inc.Vincent Farley, TelopsJim Barufaldi, TRCKaren Olsen, Zephyr Environmental Corporation
The University of Texas at Austin
David T. Allen, Ph. D., Principal InvestigatorVincent M. Torres, Project ManagerEdward L. Michel, Flare Tests CoordinatorDave Sullivan, Ph. D., Project Quality Assurance Officer
The University of Texas at Austin Section A4Comprehensive Flare Study ProjectQuality Assurance Project Plan
Revision No. 1 Page 1 of 13 8/10
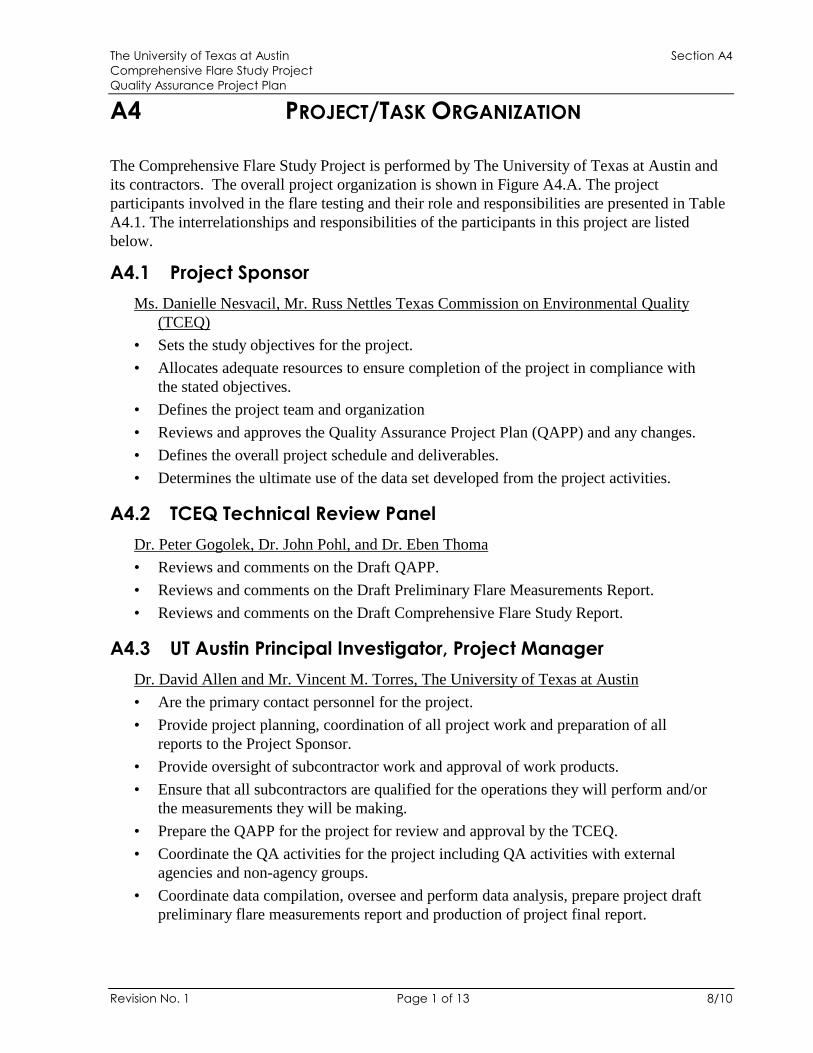
A4 PROJECT/TASK ORGANIZATION
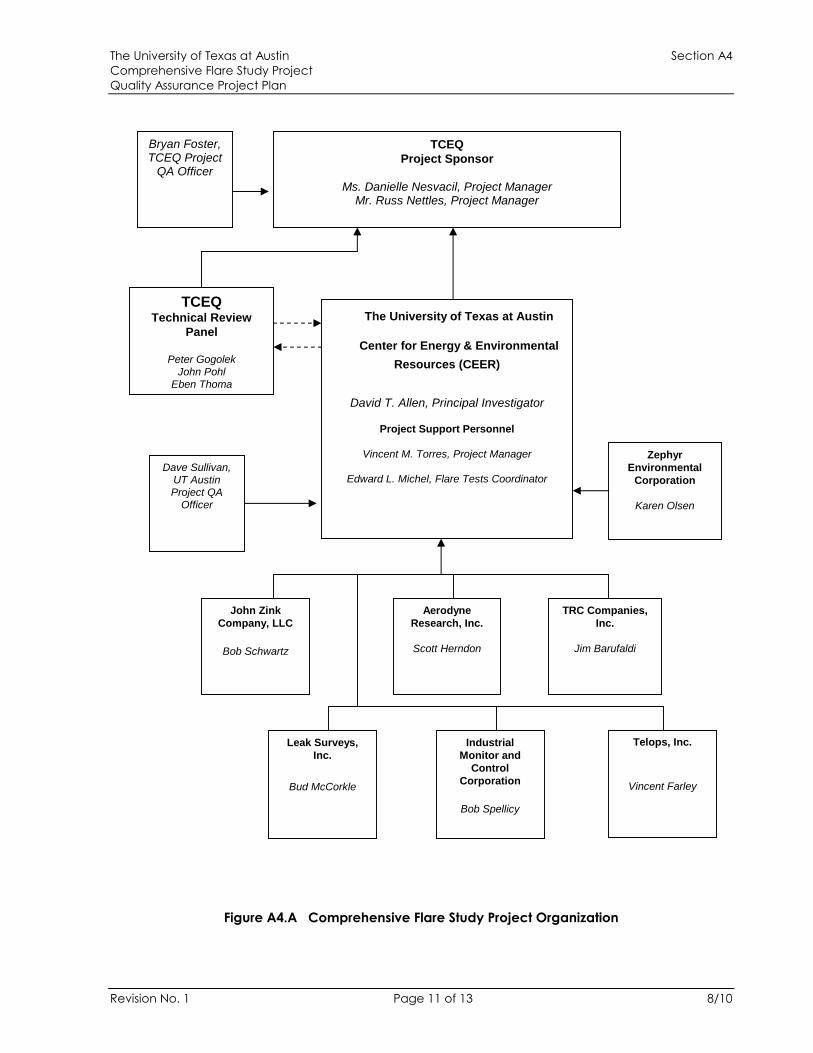
The Comprehensive Flare Study Project is performed by The University of Texas at Austin andits contractors. The overall project organization is shown in Figure A4.A. The projectparticipants involved in the flare testing and their role and responsibilities are presented in TableA4.1. The interrelationships and responsibilities of the participants in this project are listedbelow.
A4.1 Project Sponsor
Ms. Danielle Nesvacil, Mr. Russ Nettles Texas Commission on Environmental Quality(TCEQ)
• Sets the study objectives for the project.• Allocates adequate resources to ensure completion of the project in compliance with
the stated objectives.• Defines the project team and organization• Reviews and approves the Quality Assurance Project Plan (QAPP) and any changes.• Defines the overall project schedule and deliverables.• Determines the ultimate use of the data set developed from the project activities.
A4.2 TCEQ Technical Review Panel
Dr. Peter Gogolek, Dr. John Pohl, and Dr. Eben Thoma• Reviews and comments on the Draft QAPP.• Reviews and comments on the Draft Preliminary Flare Measurements Report.• Reviews and comments on the Draft Comprehensive Flare Study Report.
A4.3 UT Austin Principal Investigator, Project Manager
Dr. David Allen and Mr. Vincent M. Torres, The University of Texas at Austin• Are the primary contact personnel for the project.• Provide project planning, coordination of all project work and preparation of all
reports to the Project Sponsor.• Provide oversight of subcontractor work and approval of work products.• Ensure that all subcontractors are qualified for the operations they will perform and/or
the measurements they will be making.• Prepare the QAPP for the project for review and approval by the TCEQ.• Coordinate the QA activities for the project including QA activities with external
agencies and non-agency groups.• Coordinate data compilation, oversee and perform data analysis, prepare project draft
preliminary flare measurements report and production of project final report.
The University of Texas at Austin Section A4Comprehensive Flare Study ProjectQuality Assurance Project Plan
Revision No. 1 Page 2 of 13 8/10
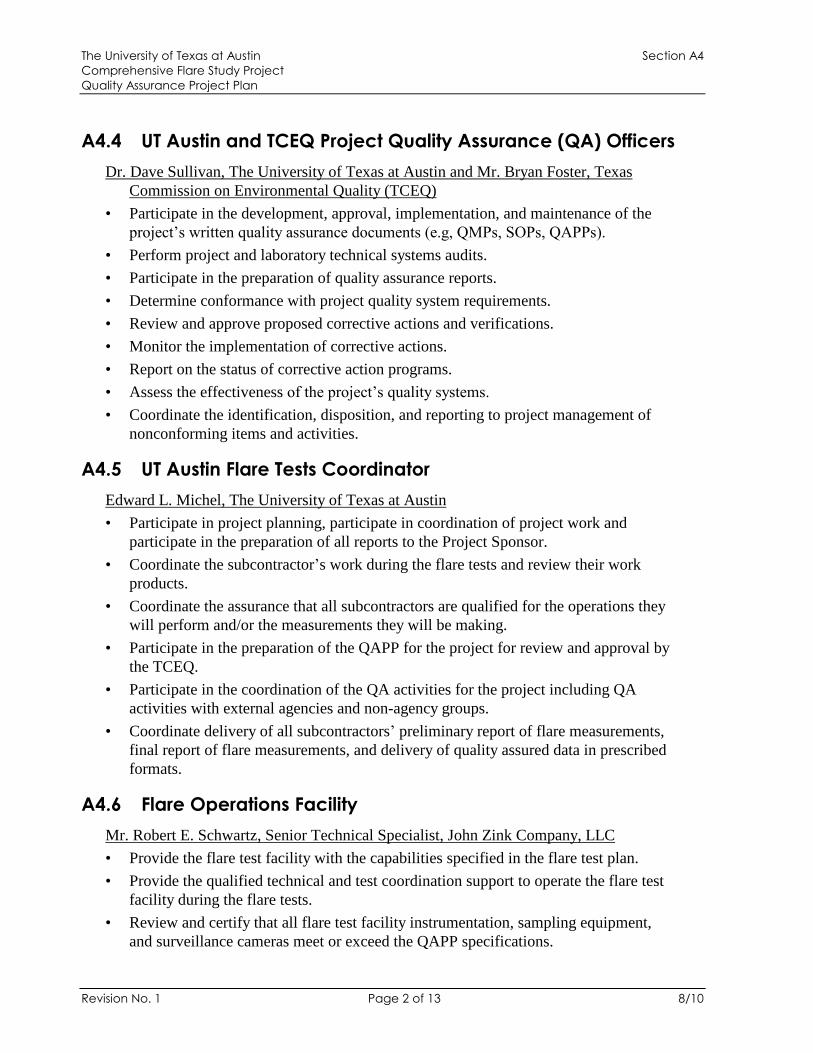
A4.4 UT Austin and TCEQ Project Quality Assurance (QA) Officers
Dr. Dave Sullivan, The University of Texas at Austin and Mr. Bryan Foster, TexasCommission on Environmental Quality (TCEQ)
• Participate in the development, approval, implementation, and maintenance of theproject’s written quality assurance documents (e.g, QMPs, SOPs, QAPPs).
• Perform project and laboratory technical systems audits.• Participate in the preparation of quality assurance reports.• Determine conformance with project quality system requirements.• Review and approve proposed corrective actions and verifications.• Monitor the implementation of corrective actions.• Report on the status of corrective action programs.• Assess the effectivenessof the project’s quality systems.• Coordinate the identification, disposition, and reporting to project management of
nonconforming items and activities.
A4.5 UT Austin Flare Tests Coordinator
Edward L. Michel, The University of Texas at Austin• Participate in project planning, participate in coordination of project work and
participate in the preparation of all reports to the Project Sponsor.• Coordinate the subcontractor’s work during the flare tests and review their work
products.• Coordinate the assurance that all subcontractors are qualified for the operations they
will perform and/or the measurements they will be making.• Participate in the preparation of the QAPP for the project for review and approval by
the TCEQ.• Participate in the coordination of the QA activities for the project including QA
activities with external agencies and non-agency groups.• Coordinate delivery of all subcontractors’preliminary report of flare measurements,
final report of flare measurements, and delivery of quality assured data in prescribedformats.
A4.6 Flare Operations Facility
Mr. Robert E. Schwartz, Senior Technical Specialist, John Zink Company, LLC• Provide the flare test facility with the capabilities specified in the flare test plan.• Provide the qualified technical and test coordination support to operate the flare test
facility during the flare tests.• Review and certify that all flare test facility instrumentation, sampling equipment,
and surveillance cameras meet or exceed the QAPP specifications.
The University of Texas at Austin Section A4Comprehensive Flare Study ProjectQuality Assurance Project Plan
Revision No. 1 Page 3 of 13 8/10
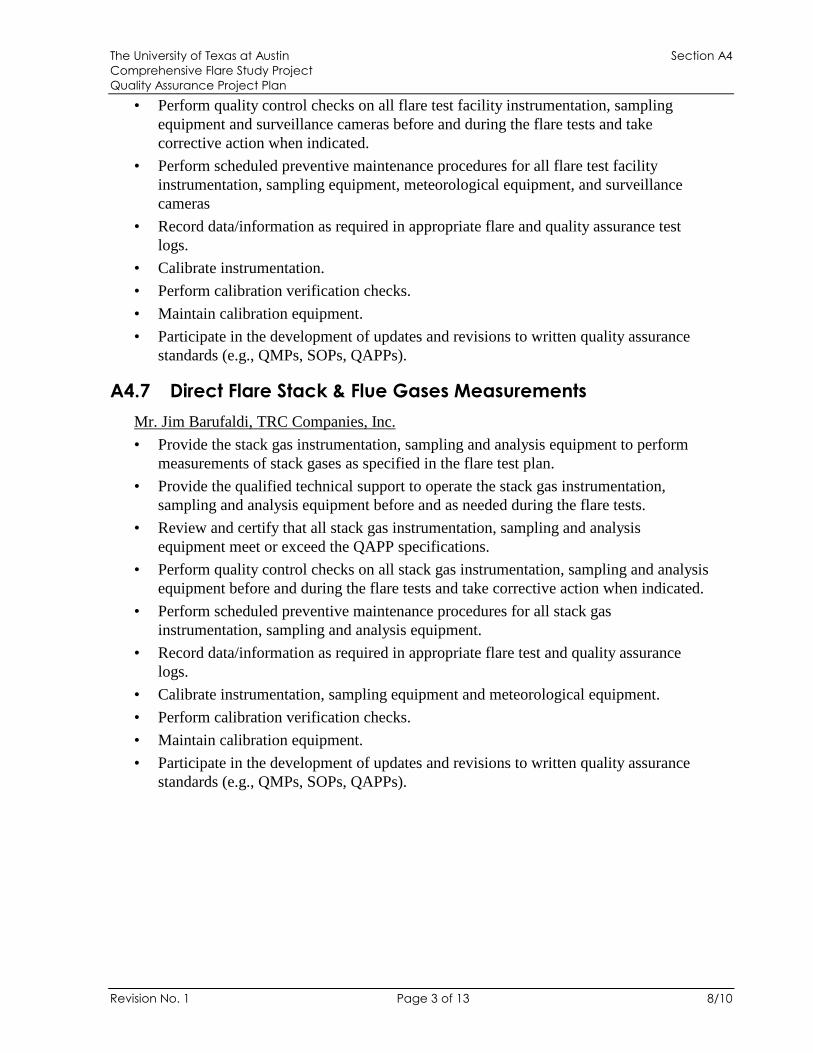
• Perform quality control checks on all flare test facility instrumentation, samplingequipment and surveillance cameras before and during the flare tests and takecorrective action when indicated.
• Perform scheduled preventive maintenance procedures for all flare test facilityinstrumentation, sampling equipment, meteorological equipment, and surveillancecameras
• Record data/information as required in appropriate flare and quality assurance testlogs.
• Calibrate instrumentation.• Perform calibration verification checks.• Maintain calibration equipment.• Participate in the development of updates and revisions to written quality assurance
standards (e.g., QMPs, SOPs, QAPPs).
A4.7 Direct Flare Stack & Flue Gases Measurements
Mr. Jim Barufaldi, TRC Companies, Inc.• Provide the stack gas instrumentation, sampling and analysis equipment to perform
measurements of stack gases as specified in the flare test plan.• Provide the qualified technical support to operate the stack gas instrumentation,
sampling and analysis equipment before and as needed during the flare tests.• Review and certify that all stack gas instrumentation, sampling and analysis
equipment meet or exceed the QAPP specifications.• Perform quality control checks on all stack gas instrumentation, sampling and analysis
equipment before and during the flare tests and take corrective action when indicated.• Perform scheduled preventive maintenance procedures for all stack gas
instrumentation, sampling and analysis equipment.• Record data/information as required in appropriate flare test and quality assurance
logs.• Calibrate instrumentation, sampling equipment and meteorological equipment.• Perform calibration verification checks.• Maintain calibration equipment.• Participate in the development of updates and revisions to written quality assurance
standards (e.g., QMPs, SOPs, QAPPs).
The University of Texas at Austin Section A4Comprehensive Flare Study ProjectQuality Assurance Project Plan
Revision No. 1 Page 4 of 13 8/10
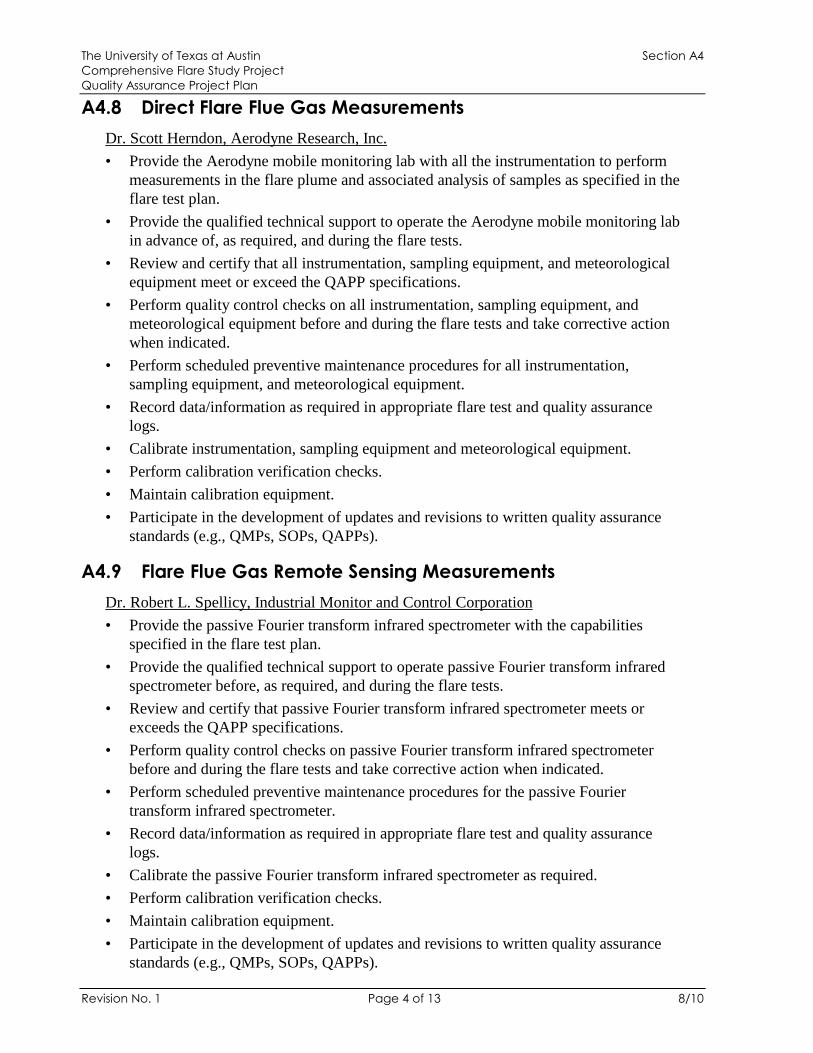
A4.8 Direct Flare Flue Gas Measurements
Dr. Scott Herndon, Aerodyne Research, Inc.• Provide the Aerodyne mobile monitoring lab with all the instrumentation to perform
measurements in the flare plume and associated analysis of samples as specified in theflare test plan.
• Provide the qualified technical support to operate the Aerodyne mobile monitoring labin advance of, as required, and during the flare tests.
• Review and certify that all instrumentation, sampling equipment, and meteorologicalequipment meet or exceed the QAPP specifications.
• Perform quality control checks on all instrumentation, sampling equipment, andmeteorological equipment before and during the flare tests and take corrective actionwhen indicated.
• Perform scheduled preventive maintenance procedures for all instrumentation,sampling equipment, and meteorological equipment.
• Record data/information as required in appropriate flare test and quality assurancelogs.
• Calibrate instrumentation, sampling equipment and meteorological equipment.• Perform calibration verification checks.• Maintain calibration equipment.• Participate in the development of updates and revisions to written quality assurance
standards (e.g., QMPs, SOPs, QAPPs).
A4.9 Flare Flue Gas Remote Sensing Measurements
Dr. Robert L. Spellicy, Industrial Monitor and Control Corporation• Provide the passive Fourier transform infrared spectrometer with the capabilities
specified in the flare test plan.• Provide the qualified technical support to operate passive Fourier transform infrared
spectrometer before, as required, and during the flare tests.• Review and certify that passive Fourier transform infrared spectrometer meets or
exceeds the QAPP specifications.• Perform quality control checks on passive Fourier transform infrared spectrometer
before and during the flare tests and take corrective action when indicated.• Perform scheduled preventive maintenance procedures for the passive Fourier
transform infrared spectrometer.• Record data/information as required in appropriate flare test and quality assurance
logs.• Calibrate the passive Fourier transform infrared spectrometer as required.• Perform calibration verification checks.• Maintain calibration equipment.• Participate in the development of updates and revisions to written quality assurance
standards (e.g., QMPs, SOPs, QAPPs).
The University of Texas at Austin Section A4Comprehensive Flare Study ProjectQuality Assurance Project Plan
Revision No. 1 Page 5 of 13 8/10
Mr. Vincent Farley, Telops, Inc• Provide an infrared hyper-spectral imaging instrument with the capabilities specified
in the flare test plan.• Provide the qualified technical support to operate the infrared hyper-spectral imaging
instrument before, as required, and during the flare tests.• Review and certify that the infrared hyper-spectral imaging instrument meets or
exceeds the QAPP specifications.• Perform quality control checks on passive the infrared hyper-spectral imaging
instrument before and during the flare tests and take corrective action when indicated.• Perform scheduled preventive maintenance procedures for the infrared hyper-spectral
imaging instrument.• Record data/information as required in appropriate flare test and quality assurance
logs.• Calibrate the passive infrared hyper-spectral imaging instrument as required.• Perform calibration verification checks.• Maintain calibration equipment.• Participate in the development of updates and revisions to written quality assurance
standards (e.g., QMPs, SOPs, QAPPs).
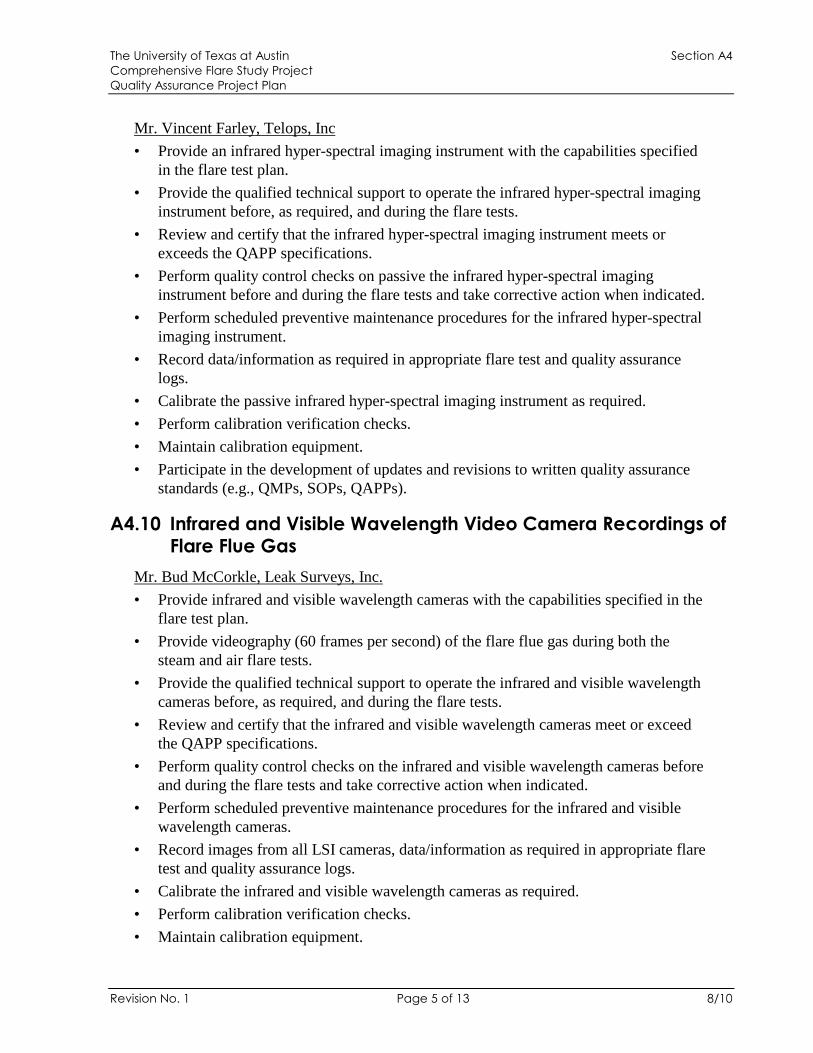
A4.10 Infrared and Visible Wavelength Video Camera Recordings ofFlare Flue Gas
Mr. Bud McCorkle, Leak Surveys, Inc.• Provide infrared and visible wavelength cameras with the capabilities specified in the
flare test plan.• Provide videography (60 frames per second) of the flare flue gas during both the
steam and air flare tests.• Provide the qualified technical support to operate the infrared and visible wavelength
cameras before, as required, and during the flare tests.• Review and certify that the infrared and visible wavelength cameras meet or exceed
the QAPP specifications.• Perform quality control checks on the infrared and visible wavelength cameras before
and during the flare tests and take corrective action when indicated.• Perform scheduled preventive maintenance procedures for the infrared and visible
wavelength cameras.• Record images from all LSI cameras, data/information as required in appropriate flare
test and quality assurance logs.• Calibrate the infrared and visible wavelength cameras as required.• Perform calibration verification checks.• Maintain calibration equipment.
The University of Texas at Austin Section A4Comprehensive Flare Study ProjectQuality Assurance Project Plan
Revision No. 1 Page 6 of 13 8/10
• Participate in the development of updates and revisions to written quality assurancestandards (e.g., QMPs, SOPs, QAPPs).
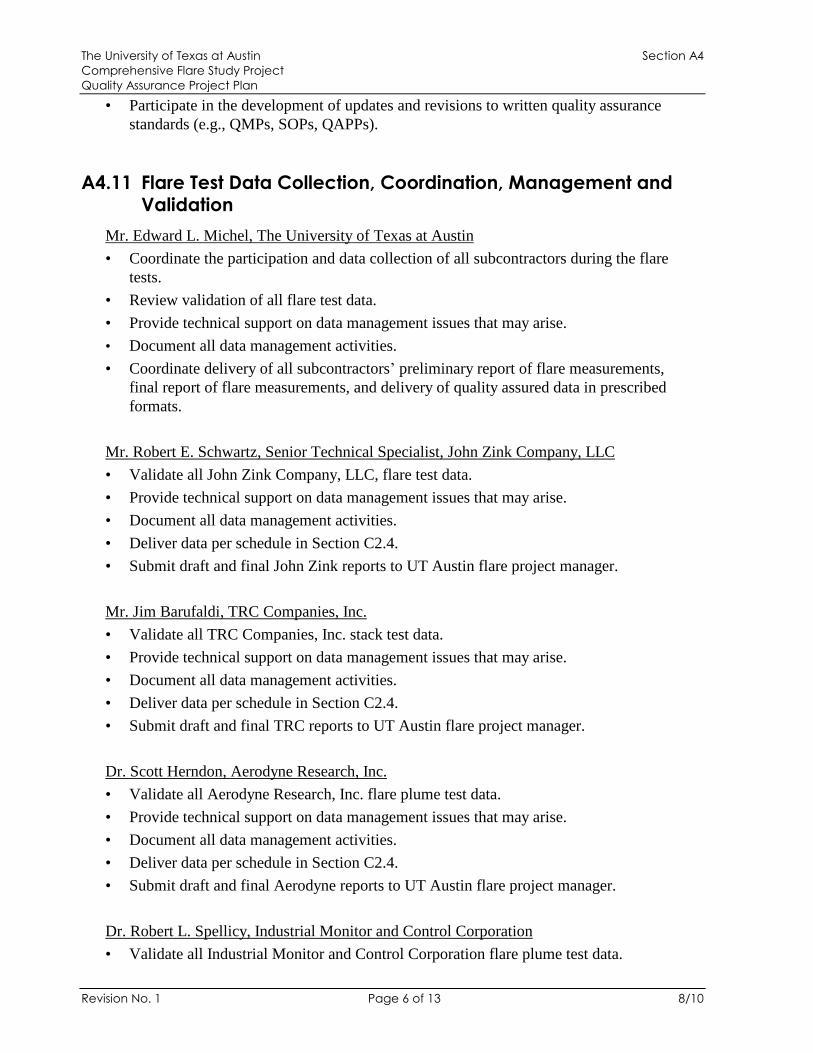
A4.11 Flare Test Data Collection, Coordination, Management andValidation
Mr. Edward L. Michel, The University of Texas at Austin• Coordinate the participation and data collection of all subcontractors during the flare
tests.• Review validation of all flare test data.• Provide technical support on data management issues that may arise.• Document all data management activities.• Coordinate delivery of all subcontractors’preliminary report of flare measurements,
final report of flare measurements, and delivery of quality assured data in prescribedformats.
Mr. Robert E. Schwartz, Senior Technical Specialist, John Zink Company, LLC• Validate all John Zink Company, LLC, flare test data.• Provide technical support on data management issues that may arise.• Document all data management activities.• Deliver data per schedule in Section C2.4.• Submit draft and final John Zink reports to UT Austin flare project manager.
Mr. Jim Barufaldi, TRC Companies, Inc.• Validate all TRC Companies, Inc. stack test data.• Provide technical support on data management issues that may arise.• Document all data management activities.• Deliver data per schedule in Section C2.4.• Submit draft and final TRC reports to UT Austin flare project manager.
Dr. Scott Herndon, Aerodyne Research, Inc.• Validate all Aerodyne Research, Inc. flare plume test data.• Provide technical support on data management issues that may arise.• Document all data management activities.• Deliver data per schedule in Section C2.4.• Submit draft and final Aerodyne reports to UT Austin flare project manager.
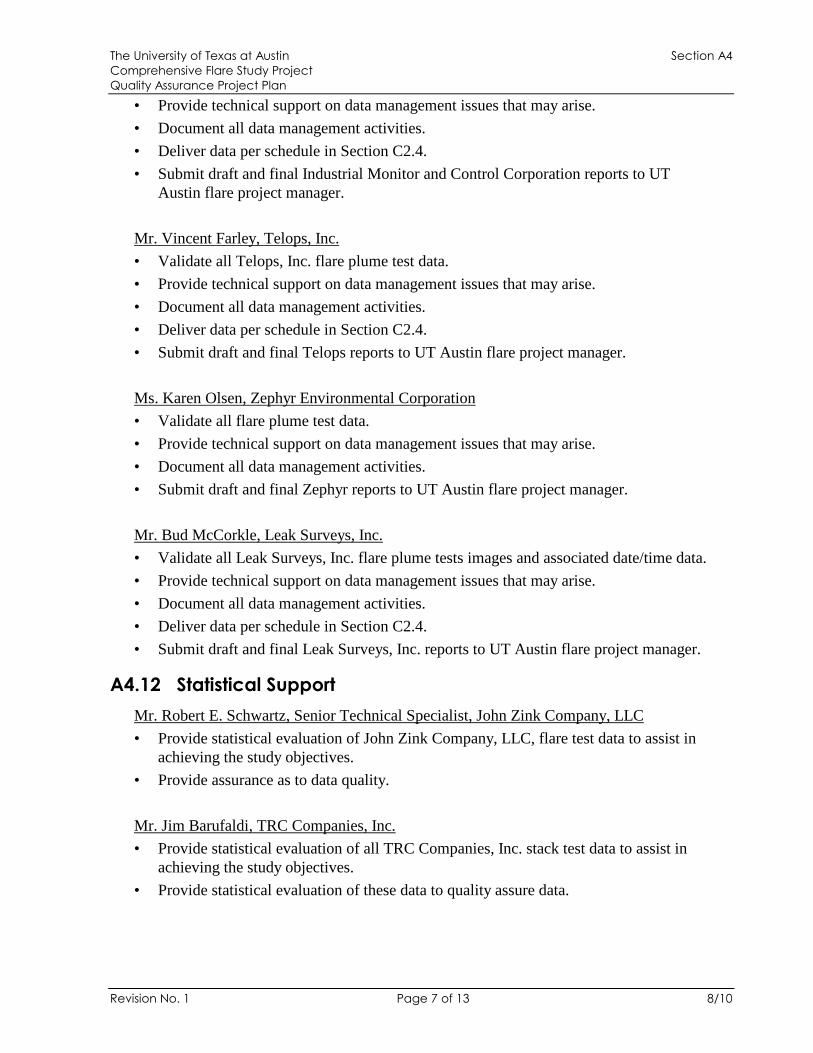
Dr. Robert L. Spellicy, Industrial Monitor and Control Corporation• Validate all Industrial Monitor and Control Corporation flare plume test data.
The University of Texas at Austin Section A4Comprehensive Flare Study ProjectQuality Assurance Project Plan
Revision No. 1 Page 7 of 13 8/10
• Provide technical support on data management issues that may arise.• Document all data management activities.• Deliver data per schedule in Section C2.4.• Submit draft and final Industrial Monitor and Control Corporation reports to UT
Austin flare project manager.
Mr. Vincent Farley, Telops, Inc.• Validate all Telops, Inc. flare plume test data.• Provide technical support on data management issues that may arise.• Document all data management activities.• Deliver data per schedule in Section C2.4.• Submit draft and final Telops reports to UT Austin flare project manager.
Ms. Karen Olsen, Zephyr Environmental Corporation• Validate all flare plume test data.• Provide technical support on data management issues that may arise.• Document all data management activities.• Submit draft and final Zephyr reports to UT Austin flare project manager.
Mr. Bud McCorkle, Leak Surveys, Inc.• Validate all Leak Surveys, Inc. flare plume tests images and associated date/time data.• Provide technical support on data management issues that may arise.• Document all data management activities.• Deliver data per schedule in Section C2.4.• Submit draft and final Leak Surveys, Inc. reports to UT Austin flare project manager.
A4.12 Statistical Support
Mr. Robert E. Schwartz, Senior Technical Specialist, John Zink Company, LLC• Provide statistical evaluation of John Zink Company, LLC, flare test data to assist in
achieving the study objectives.• Provide assurance as to data quality.
Mr. Jim Barufaldi, TRC Companies, Inc.• Provide statistical evaluation of all TRC Companies, Inc. stack test data to assist in
achieving the study objectives.• Provide statistical evaluation of these data to quality assure data.
The University of Texas at Austin Section A4Comprehensive Flare Study ProjectQuality Assurance Project Plan
Revision No. 1 Page 8 of 13 8/10
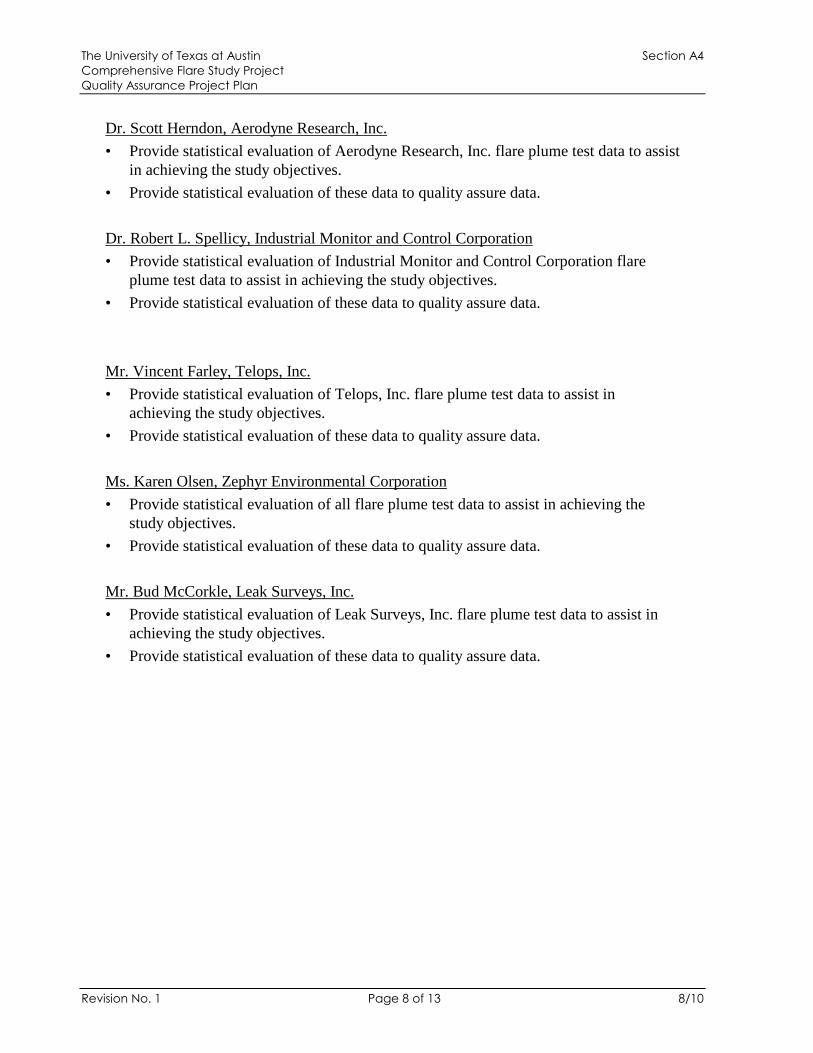
Dr. Scott Herndon, Aerodyne Research, Inc.• Provide statistical evaluation of Aerodyne Research, Inc. flare plume test data to assist
in achieving the study objectives.• Provide statistical evaluation of these data to quality assure data.
Dr. Robert L. Spellicy, Industrial Monitor and Control Corporation• Provide statistical evaluation of Industrial Monitor and Control Corporation flare
plume test data to assist in achieving the study objectives.• Provide statistical evaluation of these data to quality assure data.
Mr. Vincent Farley, Telops, Inc.• Provide statistical evaluation of Telops, Inc. flare plume test data to assist in
achieving the study objectives.• Provide statistical evaluation of these data to quality assure data.
Ms. Karen Olsen, Zephyr Environmental Corporation• Provide statistical evaluation of all flare plume test data to assist in achieving the
study objectives.• Provide statistical evaluation of these data to quality assure data.
Mr. Bud McCorkle, Leak Surveys, Inc.• Provide statistical evaluation of Leak Surveys, Inc. flare plume test data to assist in
achieving the study objectives.• Provide statistical evaluation of these data to quality assure data.
The University of Texas at Austin Section A4Comprehensive Flare Study ProjectQuality Assurance Project Plan
Revision No. 1 Page 9 of 13 8/10
A4.13 Subcontractors
Mr. Robert Schwartz, Project RepresentativeJohn Zink Company, LLC11920 East ApacheTulsa, Oklahoma 74116-1300
Mr. Jim Barufaldi, Project RepresentativeTRC9225 US Highway 183 SouthAustin, Texas 78747
Dr. Scott Herndon, Project RepresentativeAerodyne, Research, Inc.45 Manning RoadBillerica, Massachusetts 01821-3976
Dr. Robert L. Spellicy, ProjectRepresentativeIndustrial Monitor and Control Corp.800 Paloma, Suite 100Round Rock, Texas 78664
Mr. Bud McCorkle, Project RepresentativeLeak Surveys, Inc.1102 Early Blvd.Early, Texas 76803
Mr. Vincent Farley, Project RepresentativeTELOPS10-2600 St-Jean-Baptiste AvenueQuebec City, QuebecCanadaG2E 6J5
Ms. Karen Olsen, Project RepresentativeZephyr Environmental2600 Via Fortuna, Suite 450Austin, Texas 78746
According to terms of the contract, responsibilities include but are not limited to:• Provide and operate test, instrumentation and/or sampling equipment according to this
approved QAPP.• Perform quality control checks on test, instrumentation, and/or sampling equipment as
specified in this approved QAPP.• Calibrate and maintain all equipment as required for use during the flare tests period.• Perform data validation.
According to terms of the contract, contractor’s communications responsibilities include, but are not limited to:• Maintain an open line of communication between The University of Texas Project
Representatives, TCEQ Personnel, and other subcontractors.• Attend and/or provide information for, if requested, any meetings that may be
requested by The University of Texas Project Representatives and TCEQ Personnel.
The types and frequency of communications may include:
The University of Texas at Austin Section A4Comprehensive Flare Study ProjectQuality Assurance Project Plan
Revision No. 1 Page 10 of 13 8/10
• Cell phone, land-line, and e-mail exchanges several times per week among TheUniversity of Texas Project Representatives, TCEQ Personnel, and subcontractors.
• Daily on-site meetings at the John Zink flare test facility in Tulsa, Oklahoma betweenthe subcontractors, TCEQ Personnel and The University of Texas ProjectRepresentatives.
• Intermittent meetings among The University of Texas Project Representatives, TCEQ Personnel, and subcontractors.
• Written and electronic versions of reports of test data in the format specified by the The University of Texas Project Manager per the contract deliverables schedule.Section C2.4.
The University of Texas Project Manager and Project Quality Assurance Officers monitor thesubcontractors through these communications.
The University of Texas at Austin Section A4Comprehensive Flare Study ProjectQuality Assurance Project Plan
Revision No. 1 Page 11 of 13 8/10
Figure A4.A Comprehensive Flare Study Project Organization
AerodyneResearch, Inc.
Scott Herndon
John ZinkCompany, LLC
Bob Schwartz
TRC Companies,Inc.
Jim Barufaldi
TCEQTechnical Review
Panel
Peter GogolekJohn Pohl
Eben Thoma
TCEQProject Sponsor
Ms. Danielle Nesvacil, Project ManagerMr. Russ Nettles, Project Manager
The University of Texas at Austin
Center for Energy & Environmental
Resources (CEER)
David T. Allen, Principal Investigator
Project Support Personnel
Vincent M. Torres, Project Manager
Edward L. Michel, Flare Tests Coordinator
Leak Surveys,Inc.
Bud McCorkle
Telops, Inc.
Vincent Farley
ZephyrEnvironmental
Corporation
Karen Olsen
Bryan Foster,TCEQ Project
QA Officer
Dave Sullivan,UT AustinProject QA
Officer
IndustrialMonitor and
ControlCorporation
Bob Spellicy
The University of Texas at Austin Section A4Comprehensive Flare Study ProjectQuality Assurance Project Plan
Revision No. 1 Page 12 of 13 8/10
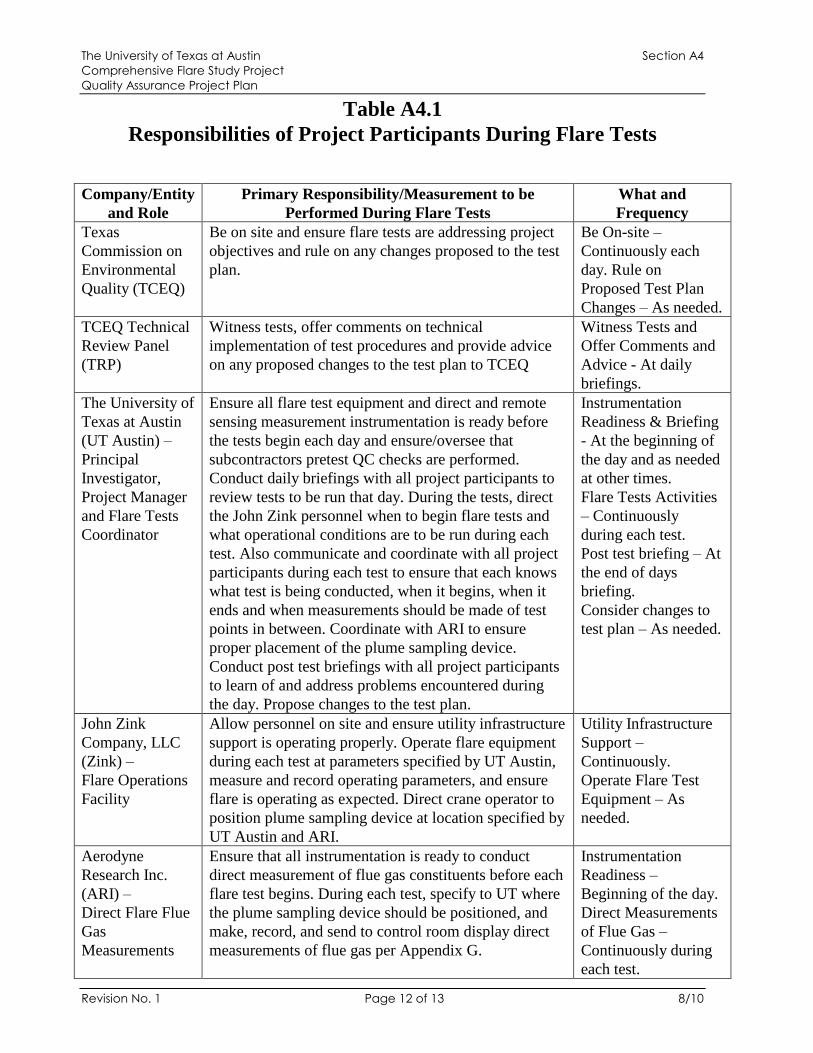
Table A4.1Responsibilities of Project Participants During Flare Tests
Company/Entityand Role
Primary Responsibility/Measurement to bePerformed During Flare Tests
What andFrequency
TexasCommission onEnvironmentalQuality (TCEQ)
Be on site and ensure flare tests are addressing projectobjectives and rule on any changes proposed to the testplan.
Be On-site–Continuously eachday. Rule onProposed Test PlanChanges–As needed.
TCEQ TechnicalReview Panel(TRP)
Witness tests, offer comments on technicalimplementation of test procedures and provide adviceon any proposed changes to the test plan to TCEQ
Witness Tests andOffer Comments andAdvice - At dailybriefings.
The University ofTexas at Austin(UT Austin)–PrincipalInvestigator,Project Managerand Flare TestsCoordinator
Ensure all flare test equipment and direct and remotesensing measurement instrumentation is ready beforethe tests begin each day and ensure/oversee thatsubcontractors pretest QC checks are performed.Conduct daily briefings with all project participants toreview tests to be run that day. During the tests, directthe John Zink personnel when to begin flare tests andwhat operational conditions are to be run during eachtest. Also communicate and coordinate with all projectparticipants during each test to ensure that each knowswhat test is being conducted, when it begins, when itends and when measurements should be made of testpoints in between. Coordinate with ARI to ensureproper placement of the plume sampling device.Conduct post test briefings with all project participantsto learn of and address problems encountered duringthe day. Propose changes to the test plan.
InstrumentationReadiness & Briefing- At the beginning ofthe day and as neededat other times.Flare Tests Activities–Continuouslyduring each test.Post test briefing–Atthe end of daysbriefing.Consider changes totest plan–As needed.
John ZinkCompany, LLC(Zink)–Flare OperationsFacility
Allow personnel on site and ensure utility infrastructuresupport is operating properly. Operate flare equipmentduring each test at parameters specified by UT Austin,measure and record operating parameters, and ensureflare is operating as expected. Direct crane operator toposition plume sampling device at location specified byUT Austin and ARI.
Utility InfrastructureSupport–Continuously.Operate Flare TestEquipment–Asneeded.
AerodyneResearch Inc.(ARI)–Direct Flare FlueGasMeasurements
Ensure that all instrumentation is ready to conductdirect measurement of flue gas constituents before eachflare test begins. During each test, specify to UT wherethe plume sampling device should be positioned, andmake, record, and send to control room display directmeasurements of flue gas per Appendix G.
InstrumentationReadiness–Beginning of the day.Direct Measurementsof Flue Gas–Continuously duringeach test.
The University of Texas at Austin Section A4Comprehensive Flare Study ProjectQuality Assurance Project Plan
Revision No. 1 Page 13 of 13 8/10
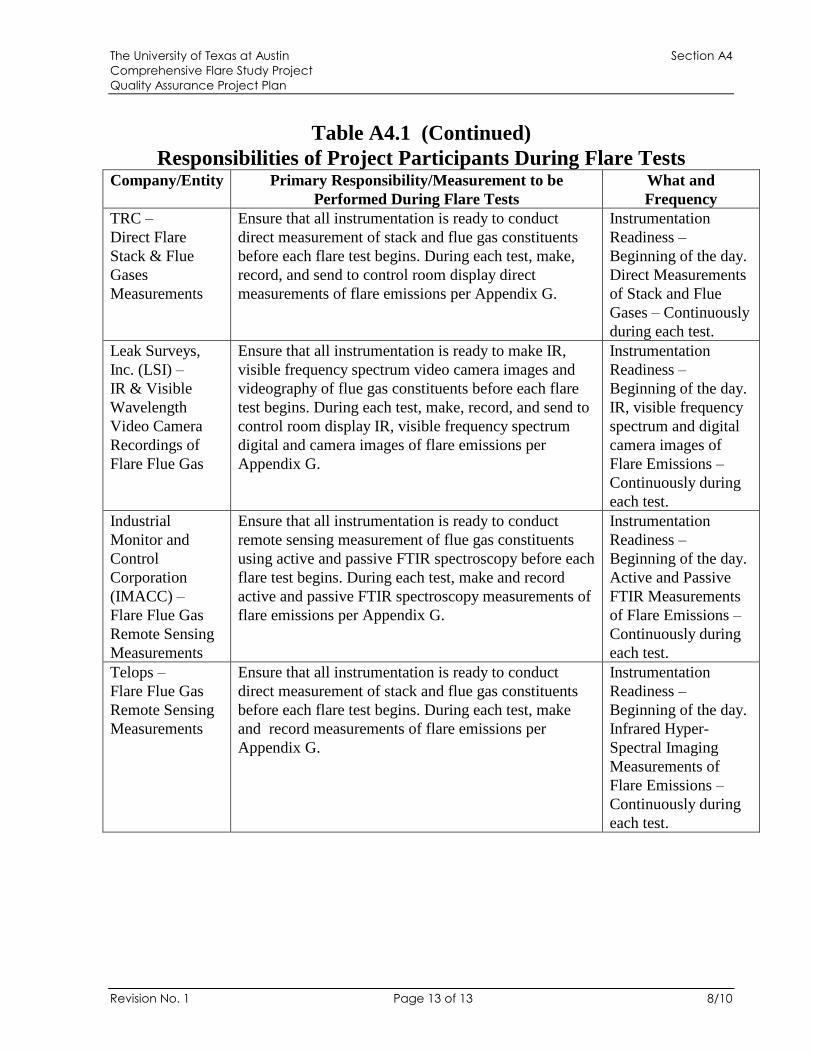
Table A4.1 (Continued)Responsibilities of Project Participants During Flare Tests
Company/Entity Primary Responsibility/Measurement to bePerformed During Flare Tests
What andFrequency
TRC–Direct FlareStack & FlueGasesMeasurements
Ensure that all instrumentation is ready to conductdirect measurement of stack and flue gas constituentsbefore each flare test begins. During each test, make,record, and send to control room display directmeasurements of flare emissions per Appendix G.
InstrumentationReadiness–Beginning of the day.Direct Measurementsof Stack and FlueGases–Continuouslyduring each test.
Leak Surveys,Inc. (LSI)–IR & VisibleWavelengthVideo CameraRecordings ofFlare Flue Gas
Ensure that all instrumentation is ready to make IR,visible frequency spectrum video camera images andvideography of flue gas constituents before each flaretest begins. During each test, make, record, and send tocontrol room display IR, visible frequency spectrumdigital and camera images of flare emissions perAppendix G.
InstrumentationReadiness–Beginning of the day.IR, visible frequencyspectrum and digitalcamera images ofFlare Emissions–Continuously duringeach test.
IndustrialMonitor andControlCorporation(IMACC)–Flare Flue GasRemote SensingMeasurements
Ensure that all instrumentation is ready to conductremote sensing measurement of flue gas constituentsusing active and passive FTIR spectroscopy before eachflare test begins. During each test, make and recordactive and passive FTIR spectroscopy measurements offlare emissions per Appendix G.
InstrumentationReadiness–Beginning of the day.Active and PassiveFTIR Measurementsof Flare Emissions–Continuously duringeach test.
Telops–Flare Flue GasRemote SensingMeasurements
Ensure that all instrumentation is ready to conductdirect measurement of stack and flue gas constituentsbefore each flare test begins. During each test, makeand record measurements of flare emissions perAppendix G.
InstrumentationReadiness–Beginning of the day.Infrared Hyper-Spectral ImagingMeasurements ofFlare Emissions–Continuously duringeach test.
The University of Texas at Austin Section A5Comprehensive Flare Study ProjectQuality Assurance Project Plan
Revision No. 1 Page 1 of 3 8/10
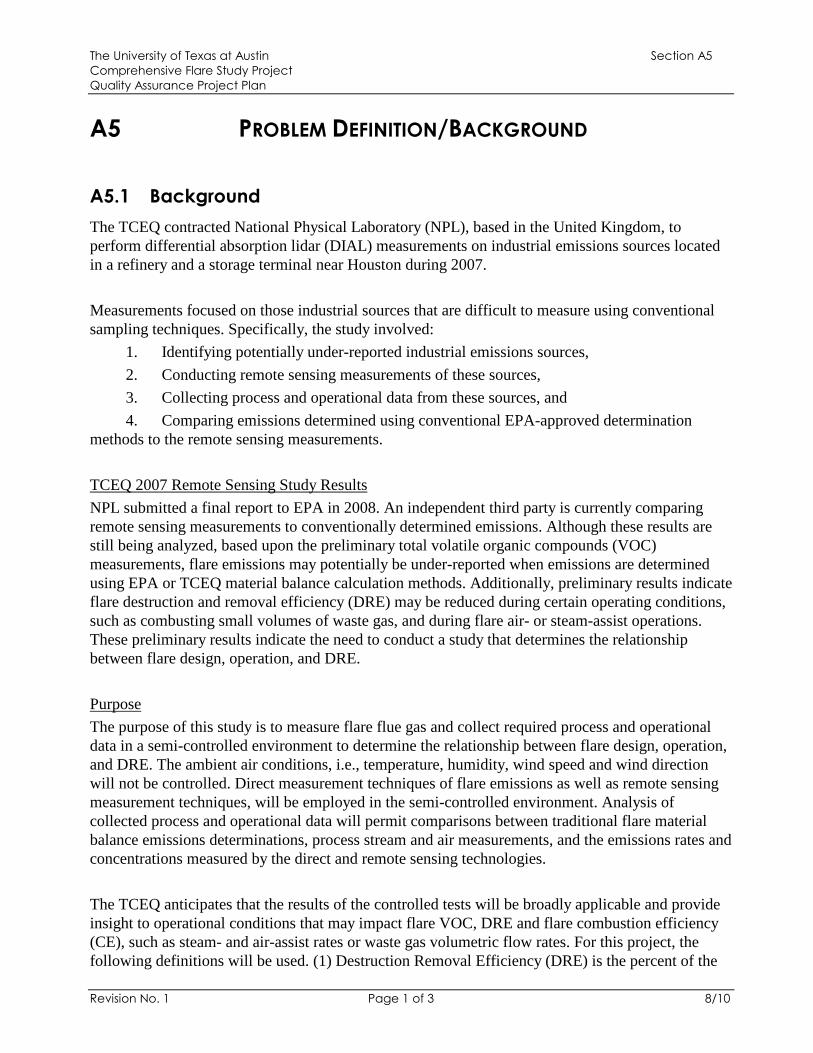
A5 PROBLEM DEFINITION/BACKGROUND
A5.1 Background
The TCEQ contracted National Physical Laboratory (NPL), based in the United Kingdom, toperform differential absorption lidar (DIAL) measurements on industrial emissions sources locatedin a refinery and a storage terminal near Houston during 2007.
Measurements focused on those industrial sources that are difficult to measure using conventionalsampling techniques. Specifically, the study involved:
1. Identifying potentially under-reported industrial emissions sources,2. Conducting remote sensing measurements of these sources,3. Collecting process and operational data from these sources, and4. Comparing emissions determined using conventional EPA-approved determination
methods to the remote sensing measurements.
TCEQ 2007 Remote Sensing Study ResultsNPL submitted a final report to EPA in 2008. An independent third party is currently comparingremote sensing measurements to conventionally determined emissions. Although these results arestill being analyzed, based upon the preliminary total volatile organic compounds (VOC)measurements, flare emissions may potentially be under-reported when emissions are determinedusing EPA or TCEQ material balance calculation methods. Additionally, preliminary results indicateflare destruction and removal efficiency (DRE) may be reduced during certain operating conditions,such as combusting small volumes of waste gas, and during flare air- or steam-assist operations.These preliminary results indicate the need to conduct a study that determines the relationshipbetween flare design, operation, and DRE.
PurposeThe purpose of this study is to measure flare flue gas and collect required process and operationaldata in a semi-controlled environment to determine the relationship between flare design, operation,and DRE. The ambient air conditions, i.e., temperature, humidity, wind speed and wind directionwill not be controlled. Direct measurement techniques of flare emissions as well as remote sensingmeasurement techniques, will be employed in the semi-controlled environment. Analysis ofcollected process and operational data will permit comparisons between traditional flare materialbalance emissions determinations, process stream and air measurements, and the emissions rates andconcentrations measured by the direct and remote sensing technologies.
The TCEQ anticipates that the results of the controlled tests will be broadly applicable and provideinsight to operational conditions that may impact flare VOC, DRE and flare combustion efficiency(CE), such as steam- and air-assist rates or waste gas volumetric flow rates. For this project, thefollowing definitions will be used. (1) Destruction Removal Efficiency (DRE) is the percent of the
The University of Texas at Austin Section A5Comprehensive Flare Study ProjectQuality Assurance Project Plan
Revision No. 1 Page 2 of 3 8/10
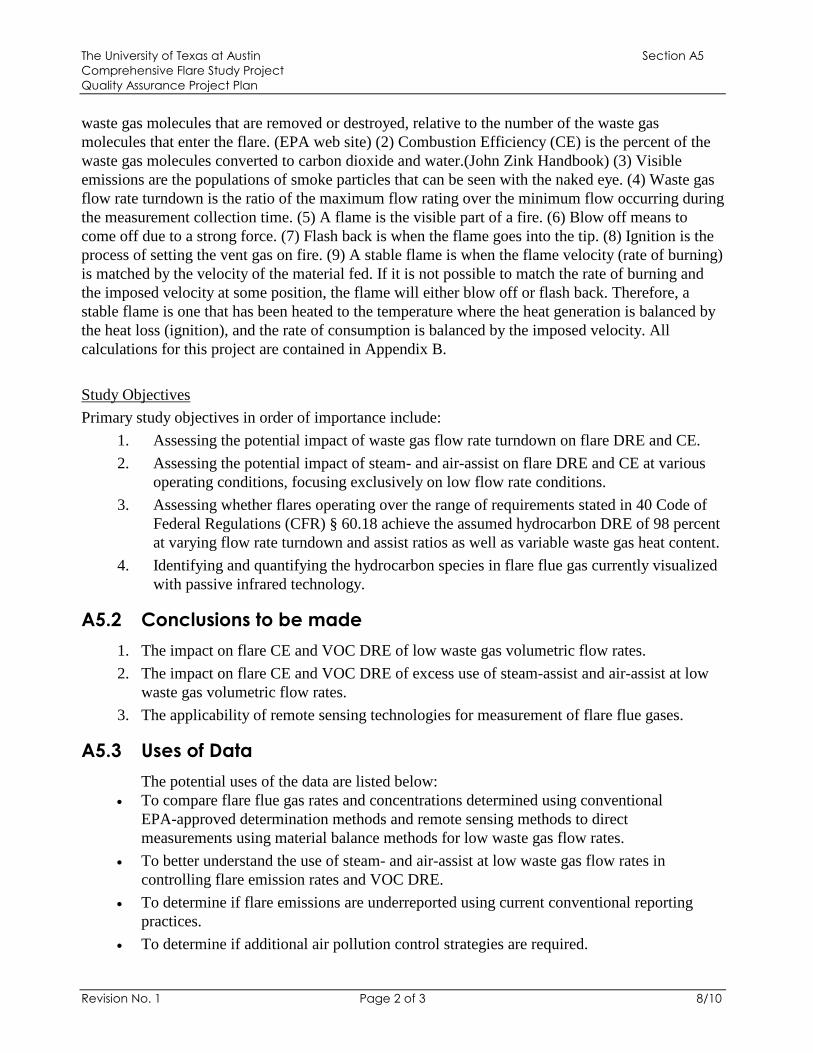
waste gas molecules that are removed or destroyed, relative to the number of the waste gasmolecules that enter the flare. (EPA web site) (2) Combustion Efficiency (CE) is the percent of thewaste gas molecules converted to carbon dioxide and water.(John Zink Handbook) (3) Visibleemissions are the populations of smoke particles that can be seen with the naked eye. (4) Waste gasflow rate turndown is the ratio of the maximum flow rating over the minimum flow occurring duringthe measurement collection time. (5) A flame is the visible part of a fire. (6) Blow off means tocome off due to a strong force. (7) Flash back is when the flame goes into the tip. (8) Ignition is theprocess of setting the vent gas on fire. (9) A stable flame is when the flame velocity (rate of burning)is matched by the velocity of the material fed. If it is not possible to match the rate of burning andthe imposed velocity at some position, the flame will either blow off or flash back. Therefore, astable flame is one that has been heated to the temperature where the heat generation is balanced bythe heat loss (ignition), and the rate of consumption is balanced by the imposed velocity. Allcalculations for this project are contained in Appendix B.
Study ObjectivesPrimary study objectives in order of importance include:
1. Assessing the potential impact of waste gas flow rate turndown on flare DRE and CE.2. Assessing the potential impact of steam- and air-assist on flare DRE and CE at various
operating conditions, focusing exclusively on low flow rate conditions.3. Assessing whether flares operating over the range of requirements stated in 40 Code of
Federal Regulations (CFR) § 60.18 achieve the assumed hydrocarbon DRE of 98 percentat varying flow rate turndown and assist ratios as well as variable waste gas heat content.
4. Identifying and quantifying the hydrocarbon species in flare flue gas currently visualizedwith passive infrared technology.
A5.2 Conclusions to be made
1. The impact on flare CE and VOC DRE of low waste gas volumetric flow rates.2. The impact on flare CE and VOC DRE of excess use of steam-assist and air-assist at low
waste gas volumetric flow rates.3. The applicability of remote sensing technologies for measurement of flare flue gases.
A5.3 Uses of Data
The potential uses of the data are listed below: To compare flare flue gas rates and concentrations determined using conventional
EPA-approved determination methods and remote sensing methods to directmeasurements using material balance methods for low waste gas flow rates.
To better understand the use of steam- and air-assist at low waste gas flow rates incontrolling flare emission rates and VOC DRE.
To determine if flare emissions are underreported using current conventional reportingpractices.
To determine if additional air pollution control strategies are required.
The University of Texas at Austin Section A5Comprehensive Flare Study ProjectQuality Assurance Project Plan
Revision No. 1 Page 3 of 3 8/10
To assess the use of the remote sensing technologies included in this study formeasurement of flare flue gases.
A5.4 Decision Makers
Ms. Danielle Nesvacil, Project Manager, Air Quality Division, Texas Commission onEnvironmental Quality.
Mr. Russ Nettles, Project Manager, Air Quality Division, Texas Commission onEnvironmental Quality.
Dr. David Allen, Principal Investigator, the University of Texas at Austin.
A5.5 Principal Customers for the Results
Texas Commission on Environmental Quality. Environmental Protection Agency. Chemical and Petrochemical Industry. The University of Texas at Austin. Local city and county health departments. Texas citizens.
The University of Texas at Austin Section A6Comprehensive Flare Study ProjectQuality Assurance Project Plan
Revision No. 1 Page 1 of 3 8/10
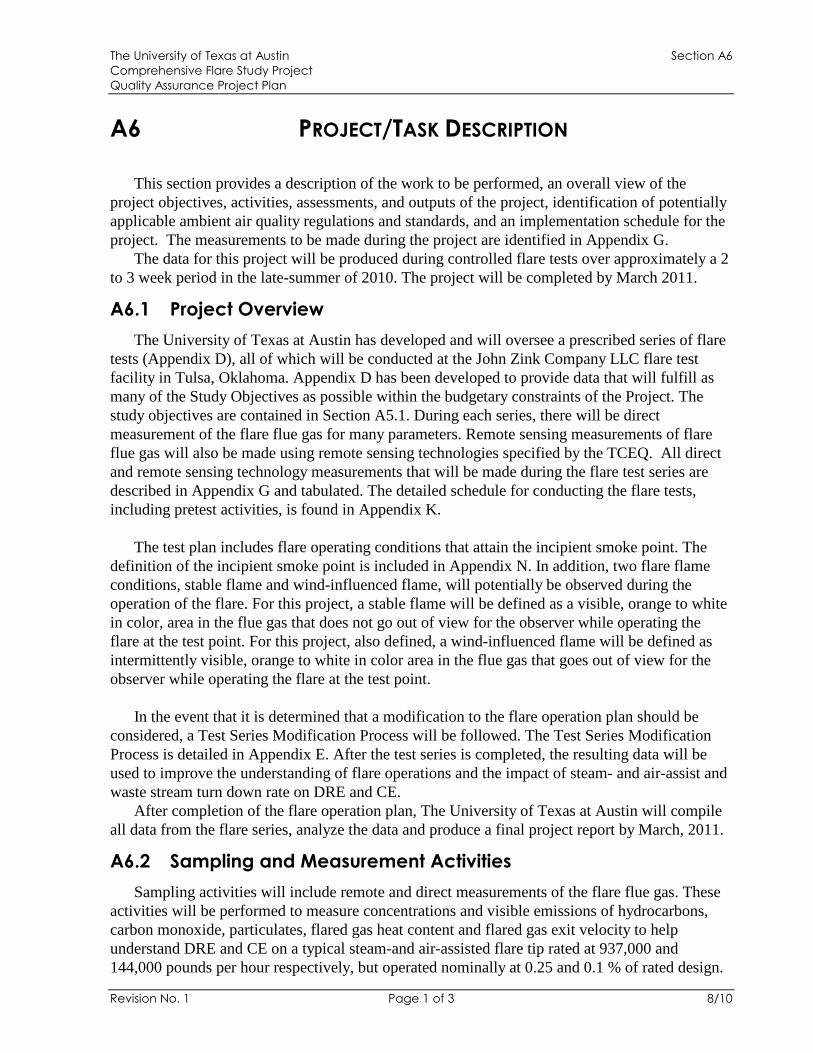
A6 PROJECT/TASK DESCRIPTION
This section provides a description of the work to be performed, an overall view of theproject objectives, activities, assessments, and outputs of the project, identification of potentiallyapplicable ambient air quality regulations and standards, and an implementation schedule for theproject. The measurements to be made during the project are identified in Appendix G.
The data for this project will be produced during controlled flare tests over approximately a 2to 3 week period in the late-summer of 2010. The project will be completed by March 2011.
A6.1 Project Overview
The University of Texas at Austin has developed and will oversee a prescribed series of flaretests (Appendix D), all of which will be conducted at the John Zink Company LLC flare testfacility in Tulsa, Oklahoma. Appendix D has been developed to provide data that will fulfill asmany of the Study Objectives as possible within the budgetary constraints of the Project. Thestudy objectives are contained in Section A5.1. During each series, there will be directmeasurement of the flare flue gas for many parameters. Remote sensing measurements of flareflue gas will also be made using remote sensing technologies specified by the TCEQ. All directand remote sensing technology measurements that will be made during the flare test series aredescribed in Appendix G and tabulated. The detailed schedule for conducting the flare tests,including pretest activities, is found in Appendix K.
The test plan includes flare operating conditions that attain the incipient smoke point. Thedefinition of the incipient smoke point is included in Appendix N. In addition, two flare flameconditions, stable flame and wind-influenced flame, will potentially be observed during theoperation of the flare. For this project, a stable flame will be defined as a visible, orange to whitein color, area in the flue gas that does not go out of view for the observer while operating theflare at the test point. For this project, also defined, a wind-influenced flame will be defined asintermittently visible, orange to white in color area in the flue gas that goes out of view for theobserver while operating the flare at the test point.
In the event that it is determined that a modification to the flare operation plan should beconsidered, a Test Series Modification Process will be followed. The Test Series ModificationProcess is detailed in Appendix E. After the test series is completed, the resulting data will beused to improve the understanding of flare operations and the impact of steam- and air-assist andwaste stream turn down rate on DRE and CE.
After completion of the flare operation plan, The University of Texas at Austin will compileall data from the flare series, analyze the data and produce a final project report by March, 2011.
A6.2 Sampling and Measurement Activities
Sampling activities will include remote and direct measurements of the flare flue gas. Theseactivities will be performed to measure concentrations and visible emissions of hydrocarbons,carbon monoxide, particulates, flared gas heat content and flared gas exit velocity to helpunderstand DRE and CE on a typical steam-and air-assisted flare tip rated at 937,000 and144,000 pounds per hour respectively, but operated nominally at 0.25 and 0.1 % of rated design.
The University of Texas at Austin Section A6Comprehensive Flare Study ProjectQuality Assurance Project Plan
Revision No. 1 Page 2 of 3 8/10
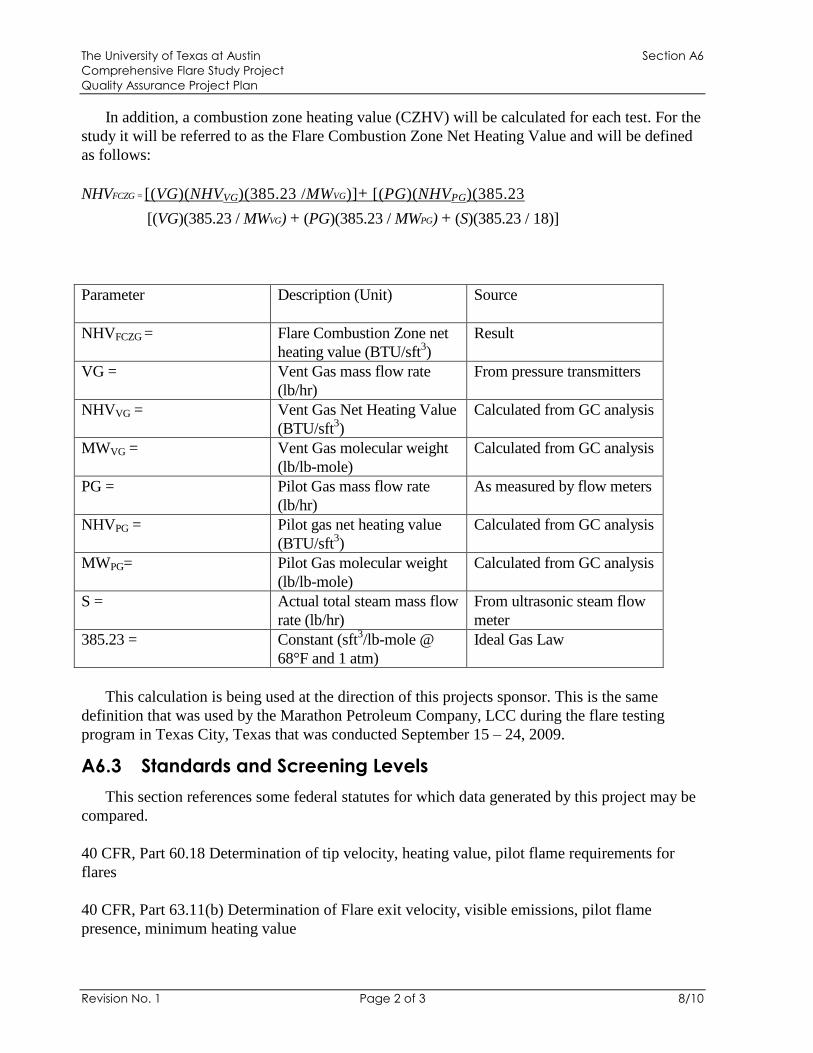
In addition, a combustion zone heating value (CZHV) will be calculated for each test. For thestudy it will be referred to as the Flare Combustion Zone Net Heating Value and will be definedas follows:
NHVFCZG = [(VG)(NHVVG)(385.23 /MWVG)]+ [(PG)(NHVPG)(385.23
[(VG)(385.23 / MWVG) + (PG)(385.23 / MWPG) + (S)(385.23 / 18)]
Parameter Description (Unit) Source
NHVFCZG = Flare Combustion Zone netheating value (BTU/sft3)
Result
VG = Vent Gas mass flow rate(lb/hr)
From pressure transmitters
NHVVG = Vent Gas Net Heating Value(BTU/sft3)
Calculated from GC analysis
MWVG = Vent Gas molecular weight(lb/lb-mole)
Calculated from GC analysis
PG = Pilot Gas mass flow rate(lb/hr)
As measured by flow meters
NHVPG = Pilot gas net heating value(BTU/sft3)
Calculated from GC analysis
MWPG= Pilot Gas molecular weight(lb/lb-mole)
Calculated from GC analysis
S = Actual total steam mass flowrate (lb/hr)
From ultrasonic steam flowmeter
385.23 = Constant (sft3/lb-mole @68°F and 1 atm)
Ideal Gas Law
This calculation is being used at the direction of this projects sponsor. This is the samedefinition that was used by the Marathon Petroleum Company, LCC during the flare testingprogram in Texas City, Texas that was conducted September 15 –24, 2009.
A6.3 Standards and Screening Levels
This section references some federal statutes for which data generated by this project may becompared.
40 CFR, Part 60.18 Determination of tip velocity, heating value, pilot flame requirements forflares
40 CFR, Part 63.11(b) Determination of Flare exit velocity, visible emissions, pilot flamepresence, minimum heating value
The University of Texas at Austin Section A6Comprehensive Flare Study ProjectQuality Assurance Project Plan
Revision No. 1 Page 3 of 3 8/10
A6.4 Assessment Tools
Assessment tools that will be used are described in this section.
A6.4.1 Performance Evaluations
Performance evaluations will not be able to be performed by the respective projectparticipants on the instruments and sampling systems provided by each project participant due tothe fact that this is a first of its kind research project, therefore not lending itself to commerciallyavailable performance standards.
A6.5 Project Reports
The following reports will be produced. See Section C2.4 for more detailed information.
• Daily Field Activity Reports will be provided by each project participant.• Comprehensive Flare Study Draft and Final Report.• Daily Quality Assurance Reports will be provided by each project participant.• Final Project Report.• Final Quality Assurance Report will be provided by each project participant.
The University of Texas at Austin Section A7Comprehensive Flare Study ProjectQuality Assurance Project Plan
Revision No. 1 Page 1 of 2 8/10
A7 DATA QUALITY OBJECTIVES (DQO)FOR MEASUREMENT DATA
This section presents the data quality objectives for the project.
The results of the DQO process include:1. specifying the intended use of the data;2. defining the type of data needed to support the decision;3. identifying the conditions under which the data should be collected; and4. Specifying tolerable limits on the probability of making a decision error due to
uncertainty in the data.
The quality control indicators of each measurement technique for this project are presented inAppendix G.
A7.1 General Project Objectives
Provide direct and remote sensing measurements of flare flue gas to be used incalculating CE and DRE for low waste gas flow rates and typical steam- and air-assistoperating conditions.
Provide data and information on flare flue gas to guide in the minimization of flareflue gas during periods of low waste gas flow rates.
Guide in the use of remote sensing technologies and design of future flare test work.
A7.2 Measurement Quality Objectives
The approaches used to assess data uncertainty and the measurement quality objectivesfor each type of measurement are addressed in this section. Total Measurement Error is thecombination of the published instrument error and the potential error from installation andapplication of the equipment to this project. Appendix G presents the measurement qualityobjectives for each measurement that will be employed.
A7.2.1 Detection Limits
Detection limits are expressed in units of concentration and reflect the smallestconcentration of a compound that can be measured with a defined degree of certainty. Thedetection limits for each parameter measured during the project are provided in Appendix G.
A7.2.2 System Contribution to the Measurement
A blank or “zero air”level is part of each calibration and span check for eachmeasurement that is reported in units of ppm, ppb or ppt. The units for each projectmeasurement are contained in Appendix G. As part of the calibration, the zero level is usedalong with the upscale (span) concentrations to establish the monitor’s calibration curve. As
The University of Texas at Austin Section A7Comprehensive Flare Study ProjectQuality Assurance Project Plan
Revision No. 1 Page 2 of 2 8/10
part of the span check, this upscale level is used as a quality control check for a monitor’szero drift.
A7.2.3 Precision
Precision is a measure of the repeatability of the results. Estimates of precision areassessed in different ways for different measurement technologies. Each project participant’sprecision criteria are presented in Appendix G.
A7.2.4 Accuracy
Accuracy is the closeness of a measurement to a reference value, and reflects elements ofboth bias and precision. Each project participant’s accuracy criteria are presented inAppendix G.
A7.2.5 Completeness
Data completeness for all measurements is calculated on the basis of the number of validmeasurements made out of the total possible number of measurements. Data completeness iscalculated as follows:
% Completeness = Number of valid measurements x 100Total possible measurements
Each contractor will provide an assesment of data completeness in the draft and finalreports provided to the UT Austin Project Manager.
A7.2.6 Representativeness
Representativeness is the extent to which a set of measurements reflects actualconditions for a specific application. The representativeness objective for the data is notstated numerically as a quality assurance objective because quantitation is generally notpossible. The measurement results from each test will represent the actual flare flue gasunder low flow conditions.
A7.2.7 Comparability
Comparability is achieved when the results are reported in standard units to facilitatecomparisons between the data. In order to accomplish this objective, the reporting units forall measurements of this project are contained in Appendix G. Comparison of manymeasurements will be reported by UT Austin in the draft report documents, which will thenbe incorporated into the final report.
The University of Texas at Austin Section A8Comprehensive Flare Study ProjectQuality Assurance Project Plan
Revision No. 1 Page 1 of 1 8/10
A8 SPECIAL TRAINING REQUIREMENTS/CERTIFICATION
Specialized training/certification required to operate any instruments will be theresponsibility of each subcontractor.
The University of Texas at Austin Section A9Comprehensive Flare Study ProjectQuality Assurance Project Plan
Revision No. 1 Page 1 of 2 8/10
A9 DOCUMENTATION AND RECORDS
All subcontractor personnel working on this project are expected to maintain records for threeyears from date of termination of the subcontractors contract, that include sufficient informationto reconstruct each final reported measurement from the test data originally gathered during theflare tests conducted at the John Zink Company LLC test facility for a period of no less thanthree (3) years. These records include but are not limited to information (raw data, electronicfiles, and/or hard copy printouts) related to media preparation, sampler calibration, samplecollection, sample handling (Chain-of-Custody and processing activities), measurementinstrument calibration, quality control checks of sampling or measurement equipment, "ascollected" measurement values, an audit trail for any modifications made to the "as collected"measurement values, and traceability documentation for reference standards.
Difficulties encountered during data collection, sampling or analysis need to be documentedand must clearly indicate the affected measurements. All electronic versions of data sets shouldreflect the limitations associated with individual measurement values.
A9.1 Mechanisms for Documentation of Procedures and Objectives
• Comprehensive Flare Study Project Quality Assurance Project Plan.• Published guidance (Code of Federal Regulations, U.S. Environmental Protection
Agency [EPA] documents, and EPA Quality Assurance Handbooks).• Method-specific Standard Operating Procedures (SOP’s)
A9.2 Mechanisms for Record Keeping
The following electronic or hard copy documents are maintained by the analysts (e.g., Chain-of-Custody forms in the laboratory with final data), field operators (e.g., activity logs), or datamanagers (e.g., electronic logs). All hard copy documentation is recorded in non-erasable ink,with any changes denoted by a single line through the entry, the initials of the person making thechange, and the date.
• Sampling information and Chain-of-Custody forms;• Instrument calibration data forms;• Electronic run logs;• Electronic and manual daily activity logs;• Electronic and manual data processing and validation logs;• Electronic and manual data management activity logs;• Records of assessment, such as performance evaluation records; and• Exception reports.
The University of Texas at Austin Section A9Comprehensive Flare Study ProjectQuality Assurance Project Plan
Revision No. 1 Page 2 of 2 8/10
A9.3 Data Reporting Turnaround Time
After the end of the flare test, all measurements made as specified in the contract shall beprovided in a preliminary form 15 days after the flare tests are completed. The final report ofmeasurements will be due 30 days after the flare tests are completed.
A9.4 Data Storage
All data shall be stored by the contractor for no less than three years from termination of thecontractor’s contract with UT. Electronic copies of all measurements shall be provided with theproject final report in MS Excel and MS Word 2003 or newer. The format for all video imagesshall be MS Movie (.wmv), Apple QuickTime (.mp4 or newer) or other format approved inadvance of collection of any data by the UT Project Manager.
The University of Texas at Austin Section B1Comprehensive Flare Study ProjectQuality Assurance Project Plan
Revision No. 1 Page 1 of 4 8/10
B1 SAMPLING PROCESS DESIGN(EXPERIMENTAL DESIGN)
B1.1 Study Site Design
The laboratory that has been selected to conduct the field tests is the John Zink Company,LCC flare test facility in Tulsa, Oklahoma. The John Zink Company, LCC has a long history oftesting combustion equipment. Built in 1991 and the subject of several major expansions, thecurrent John Zink Company, LCC test facility provides rare capabilities. The facility includesmultiple furnaces for the testing of process burners, boiler burners, and duct burners. It alsoincludes an area for thermal oxidizer technology testing as well as a flare testing area. The flaretesting area is a comprehensive, industrial-scale research and development test center with state-of-the-art equipment that can accommodate steam-assisted flares, air-assisted flares, enclosedflares, and high pressure flare arrays. The flare testing capabilities include large and small flowrates, a variety of fuels and fuel mixes, and a data acquisition system which records everythingfrom flows, pressures, and temperatures, to radiation and noise. This facility is capable ofcharacterizing the performance and operation of flares over a wide range of operating conditionsand also has the flexibility and its personnel have the expertise to design and conduct flare testssafely at conditions never used before, i.e., low waste gas flow rates with extensiveinstrumentation of the waste gas flow and the steam flow rates, while at the same timeaccommodating the remote sensing technologies concurrently during the flare tests. Thisflexibility and expertise will be critical to the success of this project. The following URL hasmore details about the ZINK facility. http://www.johnzink.com/tech/rd_ctr/html/t_rd_ctr.htm
The flare test equipment utilized in the Comprehensive Flare Study Project consists of a fuelsupply system, fuel metering system, steam supply system, steam metering system, steamassisted flare, air supply and measuring system, air assisted flare, and a data acquisition system.The study site is designed so that an unobstructed view of the project’s test flare’s flue gas maybe seen from all directions within an arc of at least 180° about the centerline of the flare burner.The challenge is to allow for in situ sampling of the flare flue gas during each test that will notblock the view required by the remote sensing technologies. See Appendix A for the study sitediagram and satellite aerial photo. All measurements taken are classified as critical to meetproject objectives. All steam-assisted and air-assisted flare tests proposed comply with 40CFR,Part 60.18 requirements for BTU and exit velocity for the flare flue gas emissions and presenceof a pilot flame on each flare tip. (refer to Appendix D).
At the sponsor’s direction, a 36”diameter flare burner with tip exit 13 feet above the groundwill be used for the steam-assisted flare and a 24”diameter flare burner with tip exit 33 feetabove the ground will be used for the air-assisted flare tip. These flare burners are designed formaximum capacities of 937,000 and 144,000 pounds per hour, respectively. At these heights,both direct and remote sensing technology measurements are possible. The steam-assisted flaretip is a ZINK model QSC. This tip design has an upper ring for injecting steam around theperimeter of the tip. It also has a center steam injection nozzle for injecting steam inside thebody of the tip. This tip is equipped with three natural gas pilots. The air-assisted flare tip is aZINK model LHTS. This tip design receives the fuel gas through a central riser. The assist air isdelivered in an annulus around the fuel gas riser. This tip is equipped with three natural gas
The University of Texas at Austin Section B1Comprehensive Flare Study ProjectQuality Assurance Project Plan
Revision No. 1 Page 2 of 4 8/10
pilots. Drawings of the steam- and air-assisted flare tips are included in Appendix L and L1. InAppendix A are the diagrams and aerial photos of the ZINK facility showing the site layout andlocations of the project participants making direct and remote sensing measurements of the flareflue gas during each test.
The control room that is marked in the photo of Appendix A will be where the flare systemoperator will monitor steam, air and waste gas flow to each flare. Only one flare burner will beoperated during any test. Operation of the equipment consists of manually adjusting the fuelcontrol valves until the desired flow rate is achieved. Steam flow is also manually controlled byadjusting the steam control valves. Manual control is used on both the fuel and the steam inorder to achieve fine control of flows. Air flow to the air assisted flare is manually controlled bythe operator. The operator will command between 10 to 100% rotation via the computer.
Waste gas flow control will be monitored through the use of calibrated orifice plates andtransmitters. Mixing of the waste gas components (Tulsa Natural Gas, propylene and nitrogen) isaccomplished by injecting the components into a mixing manifold which contains a mixingdevice. The flow of each component is carefully monitored to achieve the desired lower heatingvalue (LHV) for each test. Temperature of the steam will be monitored through the use ofcalibrated thermocouples and steam pressure will be monitored using calibrated pressuretransmitters.
The flare flue gas will be characterized by direct, real-time measurements and by remotesensing technologies. The flare flue gas for this study is defined as the exhaust gas that exits fromthe flare tip. Direct measurements will be conducted by continuously extracting samples of theflue gas using the plume sampling device shown in Appendix’s J and J1. The device consists of,an inlet cone, a sample preparation section, a sample extraction section, and eductor. The inletface of the cone is 20” diameter tapered to a 12”outlet. The 12”outlet is connected to a 90degree elbow which in turn is connected to the inlet of the sample preparation section. There arethree exposed junction temperature elements located equidistant around the perimeter of the inletto the 20” diameter cone to measure the temperature of the flue gas as it enters the cone.
Attached to the elbow is the sample preparationsection, which consists of a 12” diameter Vortab insertion type flow mixer to homogenize the sample. This mixer is 3 feet into the inlet ofthe 9.5’long sample preparation section which consists of a 12”diameter stainless steel straightpipe. The sample preparation section will mix the gases to obtain a uniform composition. At theexit of the sample preparation section is the extractive sampling section. The sampling section is1.5 feet long and consists of a pitot tube for measurement of the flue gas velocity in theapparatus, an exposed junction temperature element, and two flue gas sampling probes. The flareflue gas sample that will be analyzed for emissions composition will be obtained from thislocation.
Downstream of the sampling section 7.5 feet is the end of the flare flue gas sampling devicewhere the eductor is attached. The eductor utilizes compressed air to induce a flow through theapparatus. By varying the pressure of the compressed air at the eductor, the flue gas eductionrate can be varied.
Pipe clamps are used to lift the apparatus with a crane. Rotation of the pipe in the clampsallows orientation of the cone inlet so the inlet plane can be positioned either horizontal to theground to collect flue gas exiting vertically from the flare, perpendicular to the ground to collectflue gas exiting and traveling horizontally from the flare due to strong cross winds, or at anyangle in-between.
The University of Texas at Austin Section B1Comprehensive Flare Study ProjectQuality Assurance Project Plan
Revision No. 1 Page 3 of 4 8/10
During the flare operation, the sampling device cone inlet will be positioned outside thevisible flame and downwind of the end of the visible flame approximately one flame length. Theposition of the inlet to the cone will be adjusted so that the average temperature readings of thethree inlet temperature thermocouples is no more than 500°F or the temperature determined to bethe point where all the combustion has ceased by O2 concentration measured in the samplingdevice using a O2 monitor and CO2 concentration measured in the sampling device using a CO2
monitor. It is expected that the oxygen content of the homogenized gases will be between 18.0%and 20.5%. Lower oxygen levels could indicate that the sampling is being conducted in an areawhere combustion reactions may still be occurring.
The carbon dioxide concentration will also be monitored to help position the entrance to thecone of the sampling device. A low O2 concentration and a high CO2 concentration will be anadditional indication that the sampling device is located at a point in the flare flue gas where nofurther combustion or oxidation will occur. Analysis of the flue gas samples collected at thislocation by Aerodyne and TRC will be used to establish the true DRE and CE of each testcondition. The correct positioning of the sampling apparatus will be determined by UT Austinand Aerodyne after careful review of the sample probe inlet temperature readings, CO2 and O2
concentrations, and the concentration of the other products of combustion determined by thecarbon fraction analysis method as described in Appendix B8. If it is determined through thisanalysis that samples from multiple points in the flare flue gas are needed, then multiple sampleswill be collected and the analysis from the multiple samples integrated to calculate a DRE for thetest condition.
The remote sensing technologies will be located with clear line-of-sight to the flare tip atvarious (as needed by each vendor) distances away from the flare test apparatus. The remotesensing technologies will be allowed maximum flexibility to relocate instruments to account forwind direction or other physical attributes of the flare test setup so as to maximize performanceof their instruments.
LSI will be collecting digital IR, and visible frequency ranges of images of the flare flue gasconstantly during each air and steam flare test. These images will be posted in the control roomand observers’conference room live during each test. One set of cameras consisting of digital IR,and visible frequency range camera will be aimed perpendicular to the flare flue gas exit from thetip. A second set of digital IR and visible frequency range cameras will be mobile around theflare testing pad and used primarily to view the flare flue gas from and angle perpendicular to thefirst set of cameras. The lenses for the digital IR cameras will be determined on a case by casebasis. Selection of the lens depends on many factors that can influence the quality of the imagedesired.
B1.2 Study Site Design Rationale
The study site design was developed to conduct tests on an air-assisted and steam-assistedflare tips at low waste gas flow rates that will provide data to answer as many of the studyobjectives as possible. This site design will also allow up to 6 types of remote air quality sensing(monitoring) devices the ability to collect data at the same time without interfering with eachother as well as the continuous direct measurements of the flare flue gas.
The University of Texas at Austin Section B1Comprehensive Flare Study ProjectQuality Assurance Project Plan
Revision No. 1 Page 4 of 4 8/10
B1.3 Measurement Validation
Appendix B references the measurement methods used to obtain data in this project. Standardmethodology has been followed whenever possible. Sampling and validation efforts aredescribed in Sections B2 and Appendix B. All data will be reviewed by the respectivesubcontractor’s quality assurance officer foracceptable data quality and compliance with projectobjectives before inclusion in the final project report. The meteorological (met) data used for thisproject will be that measured using Aerodyne Research instrumentation. Aerodyne will use theadjacent John Zink Company LCC and Tulsa airport met data as a data validation tool. If there isa difference in the Aerodyne, ZINK, Tulsa airport meteorological data, the Aerodyne validatedmet data will be used as the valid data set for this project. UT Austin will conduct an on-siteaudit of all the Aerodyne meteorological equipment prior to beginning testing and after thetesting ends. Project data may be invalidated due meteorological data on a case by case basis.Meteorological data will not be used to disqualify flare emissions data. When the acceptancecriteria for a measurement are not achieved, the corrective action criteria will be followed byeach project participant as noted in Appendix H.
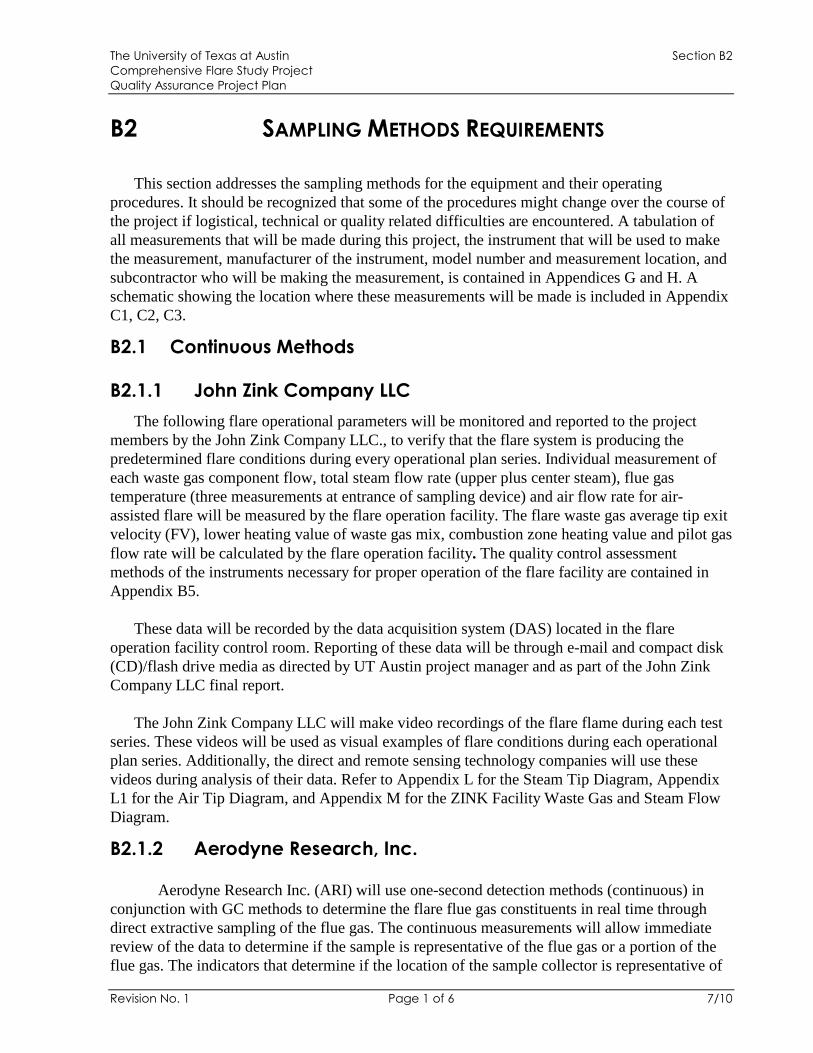
The University of Texas at Austin Section B2Comprehensive Flare Study ProjectQuality Assurance Project Plan
Revision No. 1 Page 1 of 6 7/10
B2 SAMPLING METHODS REQUIREMENTS
This section addresses the sampling methods for the equipment and their operatingprocedures. It should be recognized that some of the procedures might change over the course ofthe project if logistical, technical or quality related difficulties are encountered. A tabulation ofall measurements that will be made during this project, the instrument that will be used to makethe measurement, manufacturer of the instrument, model number and measurement location, andsubcontractor who will be making the measurement, is contained in Appendices G and H. Aschematic showing the location where these measurements will be made is included in AppendixC1, C2, C3.
B2.1 Continuous Methods
B2.1.1 John Zink Company LLC
The following flare operational parameters will be monitored and reported to the projectmembers by the John Zink Company LLC., to verify that the flare system is producing thepredetermined flare conditions during every operational plan series. Individual measurement ofeach waste gas component flow, total steam flow rate (upper plus center steam), flue gastemperature (three measurements at entrance of sampling device) and air flow rate for air-assisted flare will be measured by the flare operation facility. The flare waste gas average tip exitvelocity (FV), lower heating value of waste gas mix, combustion zone heating value and pilot gasflow rate will be calculated by the flare operation facility. The quality control assessmentmethods of the instruments necessary for proper operation of the flare facility are contained inAppendix B5.
These data will be recorded by the data acquisition system (DAS) located in the flareoperation facility control room. Reporting of these data will be through e-mail and compact disk(CD)/flash drive media as directed by UT Austin project manager and as part of the John ZinkCompany LLC final report.
The John Zink Company LLC will make video recordings of the flare flame during each testseries. These videos will be used as visual examples of flare conditions during each operationalplan series. Additionally, the direct and remote sensing technology companies will use thesevideos during analysis of their data. Refer to Appendix L for the Steam Tip Diagram, AppendixL1 for the Air Tip Diagram, and Appendix M for the ZINK Facility Waste Gas and Steam FlowDiagram.
B2.1.2 Aerodyne Research, Inc.
Aerodyne Research Inc. (ARI) will use one-second detection methods (continuous) inconjunction with GC methods to determine the flare flue gas constituents in real time throughdirect extractive sampling of the flue gas. The continuous measurements will allow immediatereview of the data to determine if the sample is representative of the flue gas or a portion of theflue gas. The indicators that determine if the location of the sample collector is representative of
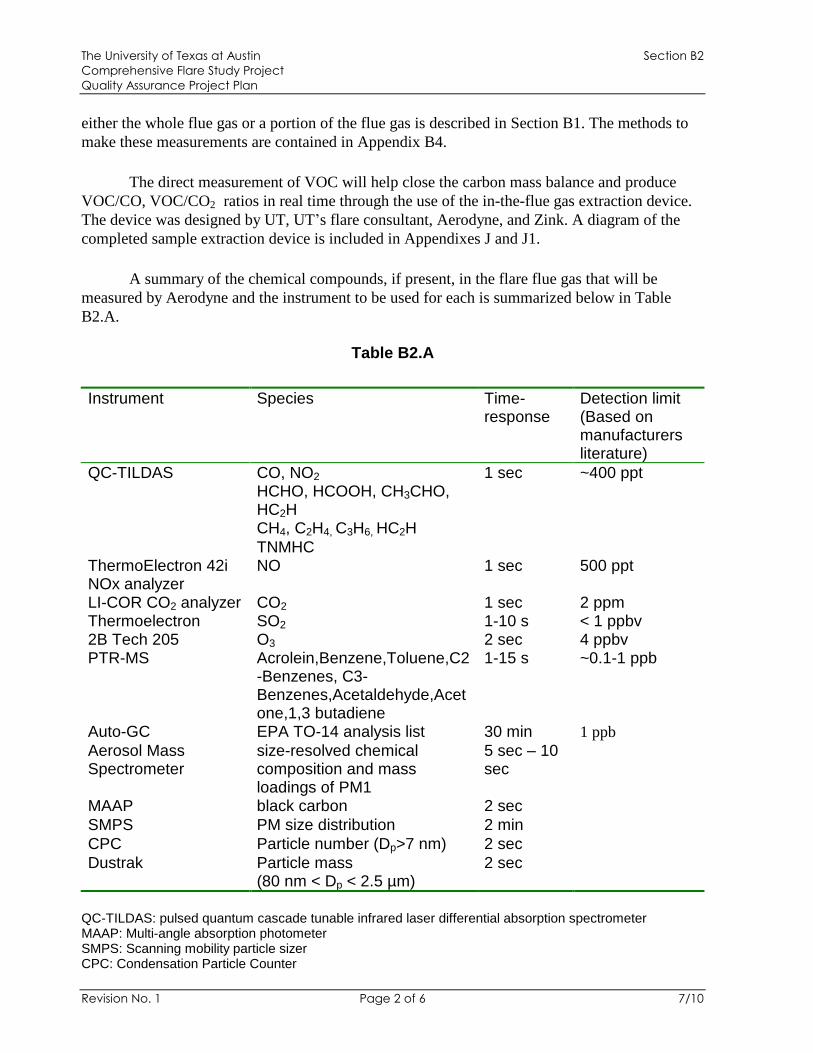
The University of Texas at Austin Section B2Comprehensive Flare Study ProjectQuality Assurance Project Plan
Revision No. 1 Page 2 of 6 7/10
either the whole flue gas or a portion of the flue gas is described in Section B1. The methods tomake these measurements are contained in Appendix B4.
The direct measurement of VOC will help close the carbon mass balance and produceVOC/CO, VOC/CO2 ratios in real time through the use of the in-the-flue gas extraction device.The device was designed by UT, UT’s flare consultant, Aerodyne, and Zink. A diagram of thecompleted sample extraction device is included in Appendixes J and J1.
A summary of the chemical compounds, if present, in the flare flue gas that will bemeasured by Aerodyne and the instrument to be used for each is summarized below in TableB2.A.
Table B2.A
Instrument Species Time-response
Detection limit(Based onmanufacturersliterature)
QC-TILDAS CO, NO2 1 sec ~400 pptHCHO, HCOOH, CH3CHO,HC2HCH4, C2H4, C3H6, HC2HTNMHC
ThermoElectron 42iNOx analyzer
NO 1 sec 500 ppt
LI-COR CO2 analyzer CO2 1 sec 2 ppmThermoelectron SO2 1-10 s < 1 ppbv2B Tech 205 O3 2 sec 4 ppbvPTR-MS Acrolein,Benzene,Toluene,C2
-Benzenes, C3-Benzenes,Acetaldehyde,Acetone,1,3 butadiene
1-15 s ~0.1-1 ppb
Auto-GC EPA TO-14 analysis list 30 min 1 ppbAerosol MassSpectrometer
size-resolved chemicalcomposition and massloadings of PM1
5 sec –10sec
MAAP black carbon 2 secSMPS PM size distribution 2 minCPC Particle number (Dp>7 nm) 2 secDustrak Particle mass
(80 nm < Dp < 2.5 µm)2 sec
QC-TILDAS: pulsed quantum cascade tunable infrared laser differential absorption spectrometerMAAP: Multi-angle absorption photometerSMPS: Scanning mobility particle sizerCPC: Condensation Particle Counter
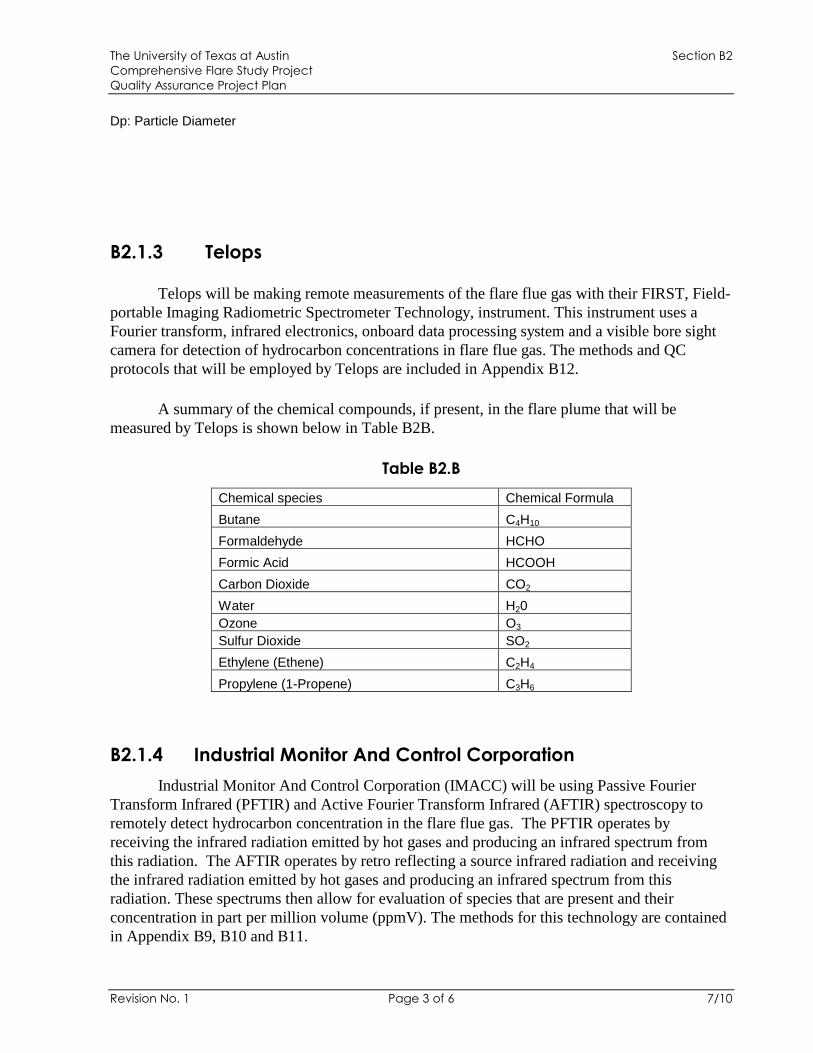
The University of Texas at Austin Section B2Comprehensive Flare Study ProjectQuality Assurance Project Plan
Revision No. 1 Page 3 of 6 7/10
Dp: Particle Diameter
B2.1.3 Telops
Telops will be making remote measurements of the flare flue gas with their FIRST, Field-portable Imaging Radiometric Spectrometer Technology, instrument. This instrument uses aFourier transform, infrared electronics, onboard data processing system and a visible bore sightcamera for detection of hydrocarbon concentrations in flare flue gas. The methods and QCprotocols that will be employed by Telops are included in Appendix B12.
A summary of the chemical compounds, if present, in the flare plume that will bemeasured by Telops is shown below in Table B2B.
Table B2.B
Chemical species Chemical Formula
Butane C4H10
Formaldehyde HCHO
Formic Acid HCOOH
Carbon Dioxide CO2
Water H20Ozone O3
Sulfur Dioxide SO2
Ethylene (Ethene) C2H4
Propylene (1-Propene) C3H6
B2.1.4 Industrial Monitor And Control Corporation
Industrial Monitor And Control Corporation (IMACC) will be using Passive FourierTransform Infrared (PFTIR) and Active Fourier Transform Infrared (AFTIR) spectroscopy toremotely detect hydrocarbon concentration in the flare flue gas. The PFTIR operates byreceiving the infrared radiation emitted by hot gases and producing an infrared spectrum fromthis radiation. The AFTIR operates by retro reflecting a source infrared radiation and receivingthe infrared radiation emitted by hot gases and producing an infrared spectrum from thisradiation. These spectrums then allow for evaluation of species that are present and theirconcentration in part per million volume (ppmV). The methods for this technology are containedin Appendix B9, B10 and B11.
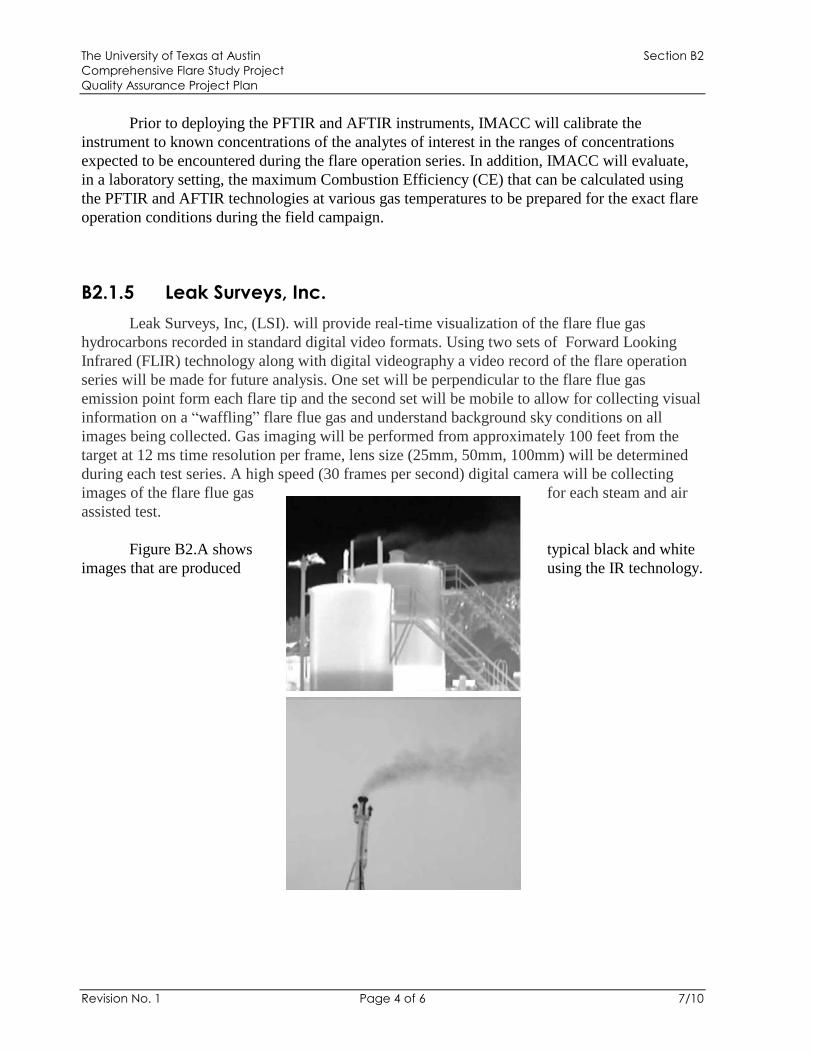
The University of Texas at Austin Section B2Comprehensive Flare Study ProjectQuality Assurance Project Plan
Revision No. 1 Page 4 of 6 7/10
Prior to deploying the PFTIR and AFTIR instruments, IMACC will calibrate theinstrument to known concentrations of the analytes of interest in the ranges of concentrationsexpected to be encountered during the flare operation series. In addition, IMACC will evaluate,in a laboratory setting, the maximum Combustion Efficiency (CE) that can be calculated usingthe PFTIR and AFTIR technologies at various gas temperatures to be prepared for the exact flareoperation conditions during the field campaign.
B2.1.5 Leak Surveys, Inc.
Leak Surveys, Inc, (LSI). will provide real-time visualization of the flare flue gashydrocarbons recorded in standard digital video formats. Using two sets of Forward LookingInfrared (FLIR) technology along with digital videography a video record of the flare operationseries will be made for future analysis. One set will be perpendicular to the flare flue gasemission point form each flare tip and the second set will be mobile to allow for collecting visualinformation on a“waffling”flare flue gas and understand background sky conditions on allimages being collected. Gas imaging will be performed from approximately 100 feet from thetarget at 12 ms time resolution per frame, lens size (25mm, 50mm, 100mm) will be determinedduring each test series. A high speed (30 frames per second) digital camera will be collectingimages of the flare flue gas for each steam and airassisted test.
Figure B2.A shows typical black and whiteimages that are produced using the IR technology.
The University of Texas at Austin Section B2Comprehensive Flare Study ProjectQuality Assurance Project Plan
Revision No. 1 Page 5 of 6 7/10
Figure B2.A
B2.2 Non-Continuous Methods
B2.2.1 TRC
Concentrations of methane, ethane and propylene in the waste gas fed to each flare and in theflare flue gas will be reported every 10 minutes through the use of a Gas Chromatograph (GC)equipped with a flame ionization detector (FID) and an electronic integrator. Appendix B1contains this analysis method. A National Institute of Standards and Technology (NIST)traceable standard containing a known concentration of methane, ethane and propylene will beused to calibrate the GC. The samples will be collected from the mixed fuel supply piping, priorto combustion and the flare flue gas using a heated transfer line to transport the sample to the GCinside the TRC trailer. Reporting of these data will be through e-mail and compact disk(CD)/flash drive media to the project participants and UT Austin project representative.
Mass emission rates will be calculated using a modified EPA Method 19 that is contained inAppendix B2. This reference is written to calculate sulfur compound concentrations emitted fromflares and applied to methane, ethane and propylene for this project. Preliminary calculations willbe available immediately after each flare operation series.
The method for determining the oxygen and carbon dioxide concentrations of the flare fluegas are contained in Appendix B.
There will be three sample lines used in this test. The plume sampler will draw and mix alarge volume of air and two of the sample points will draw sample from this mixed flow. As thetest matrix proceeds, a third probe, which does not ‘premix’ portions of the plume may be sampled in order to address the scale of combustion dynamics.
Sample LocationsSample probe after mixing, non dilution tipSample probe after mixing, dilution tipSample probe before mixing, dilution tip
The non-dilution probe tip refers to whole sample being drawn through a temperature-controlled manifold to the instrument packages. The temperature will be kept high to preventcombustion water or added steam from condensing.
The dilution tip probes add nitrogen within 1 mm of the sample entrainment in the probe.The dilution ratio will be adjusted to keep the sum of the measured CO and CO2 less than 2000ppm by volume. Based on the anticipated C:H ratio in the fuel stocks for this test, this will keepthe level of H2O below the condensation point for the anticipated ambient temperatures. Thelevel of dilution by nitrogen will not affect the calculated DRE based on carbon mass balance.The dilution ratio will be measured by the difference between the total flow (in-line venturi flowmeter) and the added nitrogen. The dilution level estimates will be corroborated by flow
The University of Texas at Austin Section B2Comprehensive Flare Study ProjectQuality Assurance Project Plan
Revision No. 1 Page 6 of 6 7/10
calculated dilution factor to the effect of dilution on stable atmospheric species such as CO2 andCH4.
Past experience with the dilution system suggests it is an effective way to arrest tracecombustion and preserve the hydrocarbon speciation (particularly oxygenated compounds such asformaldehyde) through the sample lines.
B2.3 Corrective Actions
During the field testing, each subcontractor is responsible for operating their respectiveequipment and initiating minor corrective actions on equipment when required. Equipmentproblems are generally detected through a failed sample run or through performing routinequality control (QC) checks. The QC checks that are performed on the sampling equipment areidentified in Section B5.
When a major equipment problem is encountered, the company operating the equipment hasthe responsibility to follow up on restoring the equipment to its proper operating status. TheUniversity of Texas at Austin Project Manager shall also be informed of major problems and thecorrective action employed to solve the problem and documented in the daily field inspectionreport. Appendix I has an example of a daily field inspection report.
Any equipment problems that can result in the loss of data are addressed as high priority. Allsituations requiring corrective action will be documented in the site activity logs. Section B4.2contains additional information on documentation of corrective action.
B2.4 Equipment Failure
In the event that one of Aerodyne’s measurement instruments fail or LSI’s, Zink’s, TRC’s,Telops’or IMACC’s equipment fail, the UT project manager will consult with the projectsponsor to determine whether to continue flare operation series, postpone, or cancel the testinguntil a correction is implemented. This project is not being conducted to compare remotemeasurements with the in situ measurements, so if a remote technology fails, testing willcontinue. Flare testing will not be terminated if a remote sensing technology is unable to continuemaking measurements.
The University of Texas at Austin Section B3Comprehensive Flare Study ProjectQuality Assurance Project Plan
Revision No. 1 Page 1 of 1 8/10
B3 SAMPLE HANDLING AND CUSTODY
There are no discrete samples handled by individuals for the methods in this project with oneexception. There may be a need for Aerodyne to collect Summa® polished evacuated canistersamples.
If there is a need to collect Summa® polished evacuated canister samples for this project,Aerodyne will “T”off the main flare flue gas sampling line to collect a 6 liter sample. Thecanister will be shipped over night for analysis at the UT Austin, NELAC accredited, laboratoryin Austin, Texas. In addition, if there is a need for an ambient air sample collected in a Summa®polished evacuated canister, Aerodyne will collect a “grab”sample and ship it over night to theUT Austin, NELAC accredited laboratory in Austin, Texas. All analysis results will be reportedto the project manager for inclusion into the final project report.
The University of Texas at Austin Section B4Comprehensive Flare Study ProjectQuality Assurance Project Plan
Revision No. 1 Page 1 of 1 8/10
B4 ANALYTICAL METHODS
B4.1 Analytical Procedures
B4.1.1 Aerodyne Research, Inc.
The analysis of any Summa® polished evacuated canister samples will beaccomplished through the use of the EPA TO-14 method.
B4.2 Corrective Actions
Documentation of the problem will be through using the site activity logs. Generallythe subcontractor is responsible for or arranging for the repair of all equipment. Thesubcontractor shall notify the UT Austin Project Manager of all corrective action.
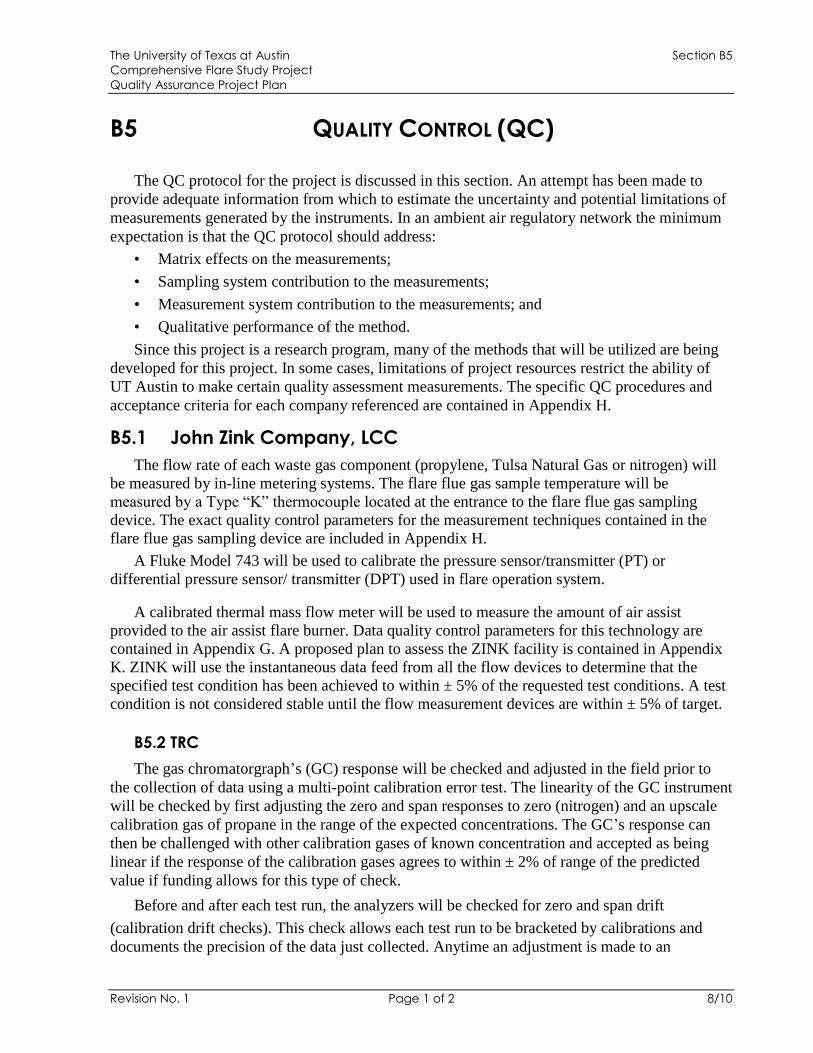
The University of Texas at Austin Section B5Comprehensive Flare Study ProjectQuality Assurance Project Plan
Revision No. 1 Page 1 of 2 8/10
B5 QUALITY CONTROL (QC)
The QC protocol for the project is discussed in this section. An attempt has been made toprovide adequate information from which to estimate the uncertainty and potential limitations ofmeasurements generated by the instruments. In an ambient air regulatory network the minimumexpectation is that the QC protocol should address:• Matrix effects on the measurements;• Sampling system contribution to the measurements;• Measurement system contribution to the measurements; and• Qualitative performance of the method.Since this project is a research program, many of the methods that will be utilized are being
developed for this project. In some cases, limitations of project resources restrict the ability ofUT Austin to make certain quality assessment measurements. The specific QC procedures andacceptance criteria for each company referenced are contained in Appendix H.
B5.1 John Zink Company, LCCThe flow rate of each waste gas component (propylene, Tulsa Natural Gas or nitrogen) will
be measured by in-line metering systems. The flare flue gas sample temperature will bemeasured by a Type “K” thermocouple located at the entrance to the flare flue gas samplingdevice. The exact quality control parameters for the measurement techniques contained in theflare flue gas sampling device are included in Appendix H.
A Fluke Model 743 will be used to calibrate the pressure sensor/transmitter (PT) ordifferential pressure sensor/ transmitter (DPT) used in flare operation system.
A calibrated thermal mass flow meter will be used to measure the amount of air assistprovided to the air assist flare burner. Data quality control parameters for this technology arecontained in Appendix G. A proposed plan to assess the ZINK facility is contained in AppendixK. ZINK will use the instantaneous data feed from all the flow devices to determine that thespecified test condition has been achieved to within ± 5% of the requested test conditions. A testcondition is not considered stable until the flow measurement devices are within ± 5% of target.
B5.2 TRC
The gas chromatorgraph’s (GC) response will be checked and adjusted in the field prior tothe collection of data using a multi-point calibration error test. The linearity of the GC instrumentwill be checked by first adjusting the zero and span responses to zero (nitrogen) and an upscalecalibration gas of propane in the range of the expected concentrations. The GC’s response canthen be challenged with other calibration gases of known concentration and accepted as beinglinear if the response of the calibration gases agrees to within ± 2% of range of the predictedvalue if funding allows for this type of check.
Before and after each test run, the analyzers will be checked for zero and span drift(calibration drift checks). This check allows each test run to be bracketed by calibrations anddocuments the precision of the data just collected. Anytime an adjustment is made to an
The University of Texas at Austin Section B5Comprehensive Flare Study ProjectQuality Assurance Project Plan
Revision No. 1 Page 2 of 2 8/10
analyzer, a calibration error test will be performed. Measurement data quality objectives for thistechnology are contained in Appendix G.
B5.3 Aerodyne Research, Inc.
Please refer to Appendix F for the Aerodyne quality assurance step for their analyticalmethods. Measurement data quality objective for this technology are contained in Appendix G.
B5.4 Telops
The QC checks will be performed using a black body on the flare stack. Measurement dataquality control objectives for this technology are contained in Appendix H.
B5.5 Industrial Monitor and Control Corporation
A log will be kept with the beginning and ending times of activities. Sample, background andcalibration measurement times will be recorded. Start time, time of stable IR signal and test endtime will be recorded for each test condition for time averaging of the data.
Before the unit is shipped to John Zink, a laboratory calibration of the unit will occur toallow comparison to the field calibration so that any instrument adjustment that may benecessary will take place.
On a daily basis temperature calibration of the IR will conducted using a black body sourceat known temperatures.
Before and during each test series, a sky background spectrum will be collected to enablecorrection of the IR signal to the background signal.
During all tests measurements, the data will be manually checked for completeness andaccuracy to insure that the IR system is operating in a quality manner. Measurement data qualitycontrol objectives for this technology are contained in Appendix H.
B5.6 Leak Surveys, Inc.
Daily, the camera systems will be allowed to condition for 30 minutes before actual videofootage will be recorded. If during this conditioning time it is discovered that the images are notclear and concise by operator review, adjustment to the systems will be accomplished to achievea quality image determined by the operator. Before each test, a propane cylinder will be openedand the camera will be aimed at the cylinder so that the camera can prove it is detectinghydrocarbons.
The University of Texas at Austin Section B6Comprehensive Flare Study ProjectQuality Assurance Project Plan
Revision No. 1 Page 1 of 2 8/10
B6 INSTRUMENT/EQUIPMENT TESTING, INSPECTION,AND MAINTENANCE REQUIREMENTS
This section describes the procedures to ensure and maintain the readiness of the fieldequipment throughout all phases of the project.
B6.1 Instrument Testing/Inspection
Each contractor that is providing an instrument to assess the flare flue gas will test andinspect their monitors in accordance with company standards.
B6.2 Preventive Maintenance Procedures
This section describes the routine preventive maintenance procedures performed onequipment used to assess the flare flue gas. This project will be conducted over a two weekperiod, due to the short operation of the equipment, preventive maintenance may not benecessary for all instruments during the testing period.
B6.2.1 John Zink Company LLC
Flow metering system maintenance will be conducted, as necessary, in accordance with themanufactures requirements.
B6.2.2 TRC
Routine preventative maintenance procedures and schedules for the Gas Chromatograph(GC) are described in the instrument service manuals. The TRC Standard Operating Proceduresfor monitoring using a GC are contained in Appendix B.
B6.2.3 Aerodyne Research, Inc.
If preventative maintenance is required, it will be in accordance with recommendations fromthe manufacturer of the analysis and meteorological equipment.
B6.2.4 Telops
Routine preventive maintenance procedures are not available since this is an experimentaltechnology.
B6.2.5 Industrial Monitor And Control Corporation
Routine preventive maintenance procedures are not available since this is an experimentaltechnology.
The University of Texas at Austin Section B6Comprehensive Flare Study ProjectQuality Assurance Project Plan
Revision No. 1 Page 2 of 2 8/10
B6.2.6 Leak Surveys, Inc.
If routine preventive maintenance procedures are required, they will be in accordance withthe instrument manual direction.
B6.3 Corrective Maintenance ProceduresThis section describes the corrective maintenance procedures performed on the technologies
participating in this flare project.
B6.3.1 John Zink Company LLCCorrective maintenance procedures for the flow monitors follow the
Manufacturer’srecommendations in the device service manuals.
B6.3.2 TRCCorrective maintenance procedures for the gas chromatograph monitor follow the
manufacturer's recommendations in the instrument service manuals.
B6.3.3 Aerodyne Research, Inc.Corrective maintenance procedures for the mobile lab follow the manufacturer's
recommendations in the service manuals.
B6.3.4 TelopsCorrective maintenance procedures for the spectral imaging equipment follow the
manufacturer's recommendations in the instrument service manuals.
B6.3.5 Industrial Monitor And Control Corporation
Corrective maintenance procedures for the infra red camera follow the manufacturer'srecommendations in the service manual.
B6.3.6 Leak Surveys, Inc.
Corrective maintenance procedures for the infra red camera will follow the manufacturer'srecommendations in the service manual.
B6.4 Availability of Spare Parts
A minimum stock level shall be maintained by the subcontractors and stored in the areadesignated by each subcontractor.
The University of Texas at Austin Section B7Comprehensive Flare Study ProjectQuality Assurance Project Plan
Revision No. 1 Page 1 of 2 8/10
B7 INSTRUMENT/EQUIPMENT CALIBRATION AND FREQUENCY
This section identifies the instruments, tools, and standards whose quality must becontrolled, the methods and frequency of calibration, the calibration and performance standards,and the traceability of the standards. It is the responsibility of each participant to maintaindocumentation regarding the traceability of the standard materials used as references forcalibration purposes via logbooks or electronic logs.
B7.1 Calibration
B7.1.1 John Zink Company LLC
Second source standards are used by ZINK for this project. Calibration frequency iscontained in Appendix H.
B7.1.2 TRC
The methane, ethane and propylene calibration gases will be derived from secondarystandard span gas bottles that have been certified by the vendor. The primary cylinders aretraceable to a National Institute of Standards and Technology (NIST) Standard ReferenceMaterials (SRMs). Calibration frequency is contained in Appendix H.
B7.1.3 Aerodyne Research, Inc.
The calibration of the formaldehyde measurement is performed using a calibratedpermeation source diluted into zero air. NIST traceable sources of Carbon Monoxide, CarbonDioxide, Nitrogen Oxide and Sulfur Dioxide are used as standards. An effusive source ofnaphthalene, mounted inside the ionization region of the mass spectrometer provides a lowconcentration constant background signal which is used to provide a mass calibration marker at128 amu. The PTR-MS (Ionicon Analytic GMBH) is a chemical ionization based massspectrometry method that utilizes H3O+ as a reagent ion. These H3O+ reagent ions are pulledthrough the air sample by an electric field where they can react via proton transfer reactions. Thereagent ions and the resulting proton transfer reaction products are mass selected and detectedusing the mass spectrometer. Calibration frequency is contained in Appendix H.
B7.1.4 Telops
The gas signatures are from a library of spectral data. Calibration frequency is contained inAppendix H.
B7.1.5 Industrial Monitor And Control Corporation
Before the unit is shipped to John Zink Company, Inc., a laboratory calibration of the unitwill occur to allow comparison to the field calibration so that any instrument adjustment thatmay be necessary will take place.
On a daily basis, temperature calibration of the IR will conducted using a black body source atknown temperatures.
The University of Texas at Austin Section B7Comprehensive Flare Study ProjectQuality Assurance Project Plan
Revision No. 1 Page 2 of 2 8/10
Before and during each test series, a sky background spectrum will be collected to enablecorrection of the IR signal to the background signal. Calibration frequency is contained inAppendix H.
B7.1.6 Leak Surveys, Inc.
There are no standards used by the Leak Surveys company for this project.
B7.2 Traceability
Each contractor will provide documentation as requested of the traceability of theirstandards.
B7.2.1 John Zink Company LLCThere are no standards used by the John Zink Company LLC for this project.
B7.2.2 TRCThe primary cylinders are traceable to National Institute of Standards and Technology
(NIST) Standard Reference Materials (SRMs).
B7.2.3 Aerodyne Research, Inc.
NIST-traceable certified sources of Carbon Monoxide, Carbon Dioxide, Nitrogen Oxideand Sulfur Dioxide are used as standards. An effusive source of naphthalene, mounted inside theionization region of the mass spectrometer, provides a low concentration constant backgroundsignal which is used to provide a mass calibration marker at 128 amu. The PTR-MS (IoniconAnalytic GMBH) is a chemical ionization based mass spectrometry method that utilizes H3O+ asa reagent ion.
B7.2.4 Telops
The gas signatures are from a library of spectral data.
B7.2.5 Industrial Monitor And Control Corporation
The gas signatures are from a library of spectral data.
B7.2.6 Leak Surveys, Inc.
There are no standards used by the Leak Surveys, Inc. for this project.
B7.3 Documentation
It is the responsibility of each subcontractor to maintain documentation regarding thetraceability of the standard materials used as references for calibration purposes. Site logbooks,electronic logs, and data are maintained by each company’s operators.
The University of Texas at Austin Section B8Comprehensive Flare Study ProjectQuality Assurance Project Plan
Revision No. 1 Page 1 of 1 8/10
B8 INSPECTION/ACCEPTANCE REQUIREMENTSFOR SUPPLIES AND CONSUMABLES
This section identifies the quality objectives for supplies and consumables to ensure high,valid data return.
B8.1 Sampling Supplies
Each subcontractor is required to order/obtain, prepare, and store all required samplingmaterials and supplies for operating analyzers and samplers.
B8.2 Standards
Standards for the analytical calibrations shall be ordered by the subcontractor on an as neededbasis either from EPA or from commercial suppliers who provide standards meeting applicableEPA requirements. Standards are either traceable to National Institute of Standards andTechnology (NIST) or are certified by the vendor and certification of traceability is kept on fileby each laboratory.
B8.3 Spare Parts
Each subcontractor shall procure, store and maintain an inventory of spare parts for allequipment based on equipment manufacturer’s recommendations, experience, and project history.
The University of Texas at Austin Section B9Comprehensive Flare Study ProjectQuality Assurance Project Plan
Revision No. 1 Page 1 of 1 8/10
B9 DATA ACQUISITION REQUIREMENTS(NON-DIRECT MEASUREMENTS)
All data for this project are expected to be direct measurements.
The University of Texas at Austin Section B10Comprehensive Flare Study ProjectQuality Assurance Project Plan
Revision No. 1 Page 1 of 3 8/10
B10 DATA MANAGEMENT
Continuously sampled data are managed by each subcontractor within their own datamanagement system. Subcontractor data will be handled in flat file format in Excel 2003 ornewer spreadsheets. The UT Quality Assurance officer will compile all data collected under thisQAPP so that the data may provide for analysis of DRE and CE.
B10.1 Zink
Data collected by ZINK will be stored at the ZINK facility for up to three years. The datawill be reported to UT in Excel 2003 or newer spreadsheets, after the subcontractor validates thedata. In addition, the subcontractor’s data validators keep individual notebooks of corrections todata files.
B10.2 TRC
Data will be collected on the TRC data acquisition system and reported to UT in Excel 2003 ornewer spreadsheets after the subcontractor validates the data. In addition, the subcontractor’s data validators keep individual notebooks of corrections to data files. After the validated datahave been archived, project personnel continue to review the data for higher levels of datavalidation. If there is clear evidence that a problem exists that was not detected by earlier stagesof data validation, then the Project Quality Assurance Officer may choose to invalidate the data.
B10.3 Aerodyne
Data will be collected on the Aerodyne mobile lab data acquisition system and reported to UTin Excel 2003 or newer spreadsheets, after the subcontractor validates the data. In addition, thesubcontractor’s data validators keep individual notebooks of correctionsto data files. After thevalidated data have been archived, project personnel continue to review the data for higher levelsof data validation. If there is clear evidence that a problem exists that was not detected by earlierstages of data validation, then the Project Quality Assurance Officer may choose to invalidate thedata.
B10.4 Telops
Data will be collected on the Telops data acquisition system and reported to UT in Excel 2003or newer spreadsheets after the subcontractor validates the data.In addition, the subcontractor’s data validators keep individual notebooks of corrections to data files. After the validated datahave been archived, project personnel continue to review the data for higher levels of datavalidation. If there is clear evidence that a problem exists that was not detected by earlier stages ofdata validation, then the Project Quality Assurance Officer may choose to invalidate the data.
B10.5 IMACC
Data will be collected on the IMACC mobile lab data acquisition system and reported to UT inExcel 2003 or newer spreadsheets after the subcontractor validates the data. In addition, the
The University of Texas at Austin Section B10Comprehensive Flare Study ProjectQuality Assurance Project Plan
Revision No. 1 Page 2 of 3 8/10
subcontractor’s data validators keep individual notebooks of corrections to data files. After the validated data have been archived, project personnel continue to review the data for higher levelsof data validation. If there is clear evidence that a problem exists that was not detected by earlierstages of data validation, then the Project Quality Assurance Officer may choose to invalidate thedata.
PLAN to Ensure Data Processing Without Multiple Algorithms
Purpose: To insure the raw spectral data collected during each test are post-processed with 1) thenormal industrial process data usually provided, i.e., gas flow and gas composition, as if thesetests were conducted at an industrial facility 2) that a copy of the algorithm used by each remotesensing technology is provided to the UT project manager prior to the field campaign so that anindependent post processing of test data may occur.
Method: The UT flares test coordinator will follow up to be sure each remote sensing technologyprovides the post processing algorithm prior to the first day of testing. The flares test coordinatorwill monitor the communication between the test facility personnel, direct measurementpersonnel and remote sensing measurement personnel before, during and after each testsequence.
Status Checks: During the field inspection data acquisition each morning, a visual review of theremote sensing measurement stations will be made to verify that there are no cell phone orwalkie talkie devices to allow for communication with anyone who could relay test conditioninformation to the remote measurements teams. If these types of devices are discovered, theflares test coordinator will have these devices removed by the measurements company.Periodically during the day, the field tests coordinator will have the remote measurementscompanies download recently generated data to a removable drive for later comparison to thedata presented in the company’s preliminary report. If the comparison proves that thepreliminary post processed data does not match the independent post processing of the data, thenthis company’s data will be deleted from the project final report with a footnote replacing thedata stating post processed data were not acceptable.
B10.6 Leak Surveys
Data will be collected on the Leak Surveys data acquisition system and reported to UT in avideo format after the subcontractor validates the data. In addition, the subcontractor’s data validators keep individual notebooks of corrections to data files. After the validated data havebeen archived, project personnel continue to review the data for higher levels of data validation.
The University of Texas at Austin Section B10Comprehensive Flare Study ProjectQuality Assurance Project Plan
Revision No. 1 Page 3 of 3 8/10
B10.7Acceptability of the Hardware/Software Configuration
Each project participant will determine the process and equipment they require to producequality data.
B10.8 Data to Users
Data will be provided to users through the issuance of the final project report within 30 daysafter the last test.
The University of Texas at Austin Section C1Comprehensive Flare Study ProjectQuality Assurance Project Plan
Revision No. 1 Page 1 of 3 8/10
C1 ASSESSMENTS AND RESPONSE ACTIONS
Review of process performance is done on a continuous basis. This section addresses theassessment and response actions for this project.
C1.1 Technical Systems Audit
Due to limitations in the project funds, technical systems audits are not scheduled to beperformed. If funds become available, technical systems audits may be performed by UT Austinor a subcontractor to UT Austin during the project field campaign.
C1.1.1 Field Technical Systems Audit
Due to limitations in the project funds, field technical systems audits are not scheduled to beperformed. If funds become available, field technical systems audits may be performed by UTAustin or a subcontractor to UT Austin during the project field campaign.
C1.1.2 Field Inspections
UT Austin will work with each contractor to develop a company specific field inspectionchecklist. See Appendix I for an example of a field inspection check list.
C1.2 Performance Evaluations
Due to limitations in the project funds, performance evaluations are not scheduled to beperformed. If funds become available, performance evaluations may be performed by UT Austinor a subcontractor to UT Austin during the project field campaign.
C1.2.1 Field Assessment
Due to limitations in the project funds, field assessments are not scheduled to be performed.If funds become available, field assessments may be performed by UT Austin or a subcontractorto UT Austin during the project field campaign.
C1.3 Assessment of Data Quality Indicators
Assessment of data quality indicators consists of (1) performance evaluations to establishdata accuracy; (2) repeatability checks and collocated samplers to establish data precision; and(3) valid data return calculations to determine data completeness.
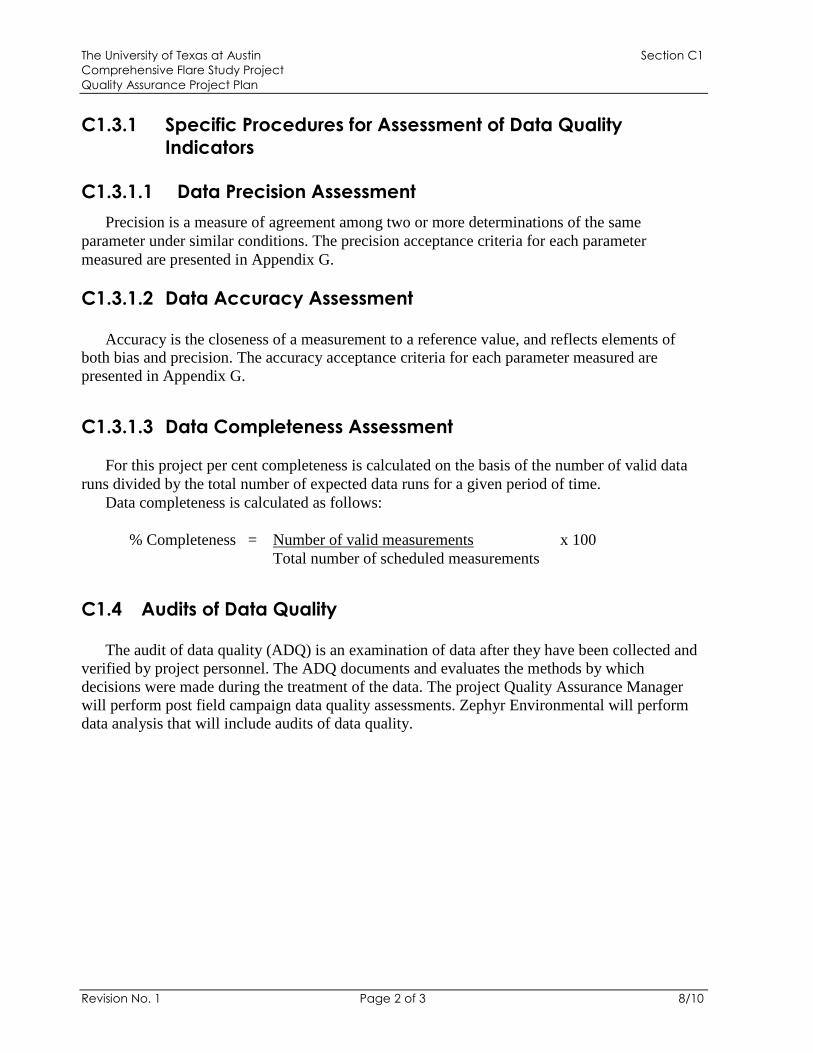
The University of Texas at Austin Section C1Comprehensive Flare Study ProjectQuality Assurance Project Plan
Revision No. 1 Page 2 of 3 8/10
C1.3.1 Specific Procedures for Assessment of Data QualityIndicators
C1.3.1.1 Data Precision Assessment
Precision is a measure of agreement among two or more determinations of the sameparameter under similar conditions. The precision acceptance criteria for each parametermeasured are presented in Appendix G.
C1.3.1.2 Data Accuracy Assessment
Accuracy is the closeness of a measurement to a reference value, and reflects elements ofboth bias and precision. The accuracy acceptance criteria for each parameter measured arepresented in Appendix G.
C1.3.1.3 Data Completeness Assessment
For this project per cent completeness is calculated on the basis of the number of valid dataruns divided by the total number of expected data runs for a given period of time.
Data completeness is calculated as follows:
% Completeness = Number of valid measurements x 100Total number of scheduled measurements
C1.4 Audits of Data Quality
The audit of data quality (ADQ) is an examination of data after they have been collected andverified by project personnel. The ADQ documents and evaluates the methods by whichdecisions were made during the treatment of the data. The project Quality Assurance Managerwill perform post field campaign data quality assessments. Zephyr Environmental will performdata analysis that will include audits of data quality.
The University of Texas at Austin Section C1Comprehensive Flare Study ProjectQuality Assurance Project Plan
Revision No. 1 Page 3 of 3 8/10
C1.5 Corrective Actions
Corrective action is an essential part of any quality system and involves those procedures andactions taken to correct situations causing data quality to fall below established expectations. Theneed for corrective actions will be minimized by the implementation of the Comprehensive FlareProject Quality Assurance Project Plan, project standard operating procedures (SOPs), and theapplication of statistical quality control to establish appropriate data quality limits formeasurement activities. Refer to Appendix H for the list of corrective action documentation foreach parameter measured during this project. Corrective action can be initiated by any projectparticipant by contacting the UT project manager.
The UT project manager will make a determination on how to proceed to implement thecorrective action on a case by case basis.
The University of Texas at Austin Section C2Comprehensive Flare Study ProjectQuality Assurance Project Plan
Revision No. 1 Page 1 of 1 8/10
C2 REPORTS TO MANAGEMENT
C2.1 Quality Assurance (QA) Audit Reports
Due to funding limitations, performance evaluations and technical systems audits are notplanned.
C2.2 Annual Project QA Report
This type of report will not be required by this project.
C2.3 Data Reports
Each of the subcontractors is responsible for preparing a preliminary and final data report tothe Project Manager daily and 15 days after completion of the field campaign.
C2.3.1 Field Activity Reports
Daily field reports for technologies that generate 10 minute averages will consist of all 10minute averages of each parameter collected during the field campaign.
Daily field reports for technologies that generate continuous data will consist of all datapoints collected for each parameter measured during the field campaign.
C2.3.2 Quality Assurance Reports
Daily instrument quality assurance reports will be provided by the project participants.
Final instrument quality assurance reports will be provided by the project participants.
C2.4 Reporting Schedule
Each subcontractor will be required to report their data on an as needed basis during eachtest, at the end of each test before the daily debriefing and within 15 days after completion of thefield campaign to the UT Austin Project Manager.
The University of Texas at Austin Section D1Comprehensive Flare Study ProjectQuality Assurance Project Plan
Revision No. 1 Page 1 of 3 8/10
D1 DATA REVIEW, VALIDATION, ANDVERIFICATION
D1.1 Data Validation
Data validation is an integral part of quality management. All data and the conditions underwhich they were recorded shall be reviewed closely by the subcontractor’s data validators to determine the validity of the data and whether individual measurements can be included forstatistical analysis. The criteria for validity of each measurement made during the project will bea combination of the Measurement Quality Control objectives contained in Appendix G and theData Quality Activities contained in Appendix H.
When a subcontractor determines that data are invalid, these data will not be reported to theproject. If one subcontractor’s data set is integral to another subcontractors set of data, neither setof data will be reported to the project.
D1.1.1 John Zink Company LLC
Initial data review and validation is performed by the test system control operator. If aproblem is noticed, according to the measurement quality control objectives contained inAppendix G or the data quality objectives contained in Appendix H, the operator contacts the UTAustin project manager to discuss the next step. If determined, corrective action will beimplemented by ZINK before any more tests begin.
D1.1.2 TRC
Initial data review and validation are performed by the test measurement equipment operator.If a problem is noticed, according to the measurement quality control objectives contained inAppendix G or the data quality objectives contained in Appendix H, the operator contacts the UTAustin project manager to discuss the next step. If determined, corrective action will beimplemented by TRC before any more tests begin.
D1.1.3 Aerodyne Research, Inc.
Initial data review and validation are performed by the test measurement equipment operator.If a problem is noticed, according to the measurement quality control objectives contained inAppendix G or the data quality objectives contained in Appendix H, the operator contacts the UTAustin project manager lead to discuss the next step. If determined, corrective action will beimplemented by Aerodyne before any more test begin.
The University of Texas at Austin Section D1Comprehensive Flare Study ProjectQuality Assurance Project Plan
Revision No. 1 Page 2 of 3 8/10
D1.1.4 Telops
Initial data review and validation are performed by the test measurement equipment operator.If a problem is noticed, according to the Measurement Quality Control Objectives contained inAppendix G or the Data Quality Objectives contained in Appendix H, the operator contacts theUT Austin project manager to discuss the next step. If determined, corrective action will beimplemented by Telops before any more tests begin.
D1.1.5 Industrial Monitor And Control Corporation
Initial data review and validation are performed by the test measurement equipment operator.If a problem is noticed, according to the Measurement Quality Control Objectives contained inAppendix G or the Data Quality Objectives contained in Appendix H, the operator contacts theUT Austin project manager to discuss the next step. If determined, corrective action will beimplemented by IMACC before any more tests begin.
D1.1.6 Leak Surveys, Inc.
Initial data review and validation are performed by the test measurement equipment operator.If a problem is noticed, according to the Measurement Quality Control Objectives contained inAppendix G or the data quality objectives contained in Appendix H, the operator contacts the UTAustin project manager to discuss the next step. If determined, corrective action will beimplemented by LSI before any more tests begin.
D1.2 Data Custody
Custody of data is maintained by each subcontractor. All data submitted to the projectmanager will be archived at UT for at least 3 years after the project terminates.
D1.2.1 John Zink Company LLC
Data custody of all measurement data generated by the John Zink Company, Inc. ismaintained and managed by the John Zink Company LLC for at least 3 years after completion oftesting. After all the John Zink Company LLC data have been reported to UT, UT will archivethe data for at least 3 years after termination of the project.
D1.2.2 TRC
Data custody of all measurement data generated by TRC is maintained and managed byTRC. After all the TRC data have been reported to UT, UT will archive the data for at least 3years after termination of the project.
D1.2.3 Aerodyne Research, Inc.
Data custody of all measurement data generated by Aerodyne Research, Inc. is maintainedand managed by Aerodyne Research, Inc.. Once all the Aerodyne Research, Inc. data have beenreported to UT, UT will archive the data for at least 3 years after termination of the project.
The University of Texas at Austin Section D1Comprehensive Flare Study ProjectQuality Assurance Project Plan
Revision No. 1 Page 3 of 3 8/10
D1.2.4 Telops
Data custody of all measurement data generated by Telops is maintained and managed byTelops. After all the Telops data have been reported to UT, UT will archive the data for at least 3years after termination of the project.
D1.2.5 Industrial Monitor And Control Corporation
Data custody of all measurement data generated by Industrial Monitor And ControlCorporation is maintained and managed by Industrial Monitor And Control Corporation. Afterall the Industrial Monitor and Control Corporation. data have been reported to UT, UT willarchive the data for at least 3 years after termination of the project.
D1.2.6 Leak Surveys, Inc.
Data custody of all measurement data generated by Leak Surveys, Inc. is maintained andmanaged by Leak Surveys, Inc. After all the Leak Surveys, Inc. data have been reported to UT,UT will archive the data for at least 3 years after termination of the project.
The University of Texas at Austin Section D2Comprehensive Flare Study ProjectQuality Assurance Project Plan
Revision No. 1 Page 1 of 2 8/10
D2 VALIDATION AND VERIFICATION METHODS
The objective of the data processing and validation effort is to obtain quality assureddatabases containing the monitoring data in a consistent format. The procedures that will beimplemented for data processing and validation will ensure that reported data are valid andcomparable to those collected by other programs contributing data to this effort.
After the validated data have been archived, data analysts continue to review the data forhigher levels of data validation. If there is clear evidence that a problem exists that was notdetected by earlier stages of data validation, then the Quality Assurance Officer may choose toinvalidate the data.
D2.1 John Zink Company LLC
The acceptance criteria for the measurement methods conducted by the John Zink Company,Inc. are presented in Appendix H. The John Zink Company LLC will provide validated data toUT in an Excel spread sheet in their final report 15 days after the end of the field campaign.
D2.2 TRC
The acceptance criteria for the measurement methods conducted by TRC are presented inAppendix H. TRC will provide validated data to UT in an Excel spread sheet in their final report15 days after the end of the field campaign.
D2.3 Aerodyne Research, Inc.
The acceptance criteria for the measurement methods conducted by Aerodyne Research, Inc.are presented in Appendix H. Aerodyne Research, Inc. will provide validated data to UT in anExcel spread sheet in their final report 15 days after the end of the field campaign.
D2.4 Telops
The acceptance criteria for the measurement methods conducted by Telops are presented inAppendix H. Telops will provide validated data to UT in an Excel spread sheet in their finalreport 15 days after the end of the field campaign.
.
D2.5 Industrial Monitor And Control Corporation
The acceptance criteria for the measurement methods conducted by Industrial Monitor AndControl Corporation are presented in Appendix H. Industrial Monitor And Control Corporationwill provide validated data to UT in an Excel spread sheet in their final report 15 days after theend of the field campaign.
.
The University of Texas at Austin Section D2Comprehensive Flare Study ProjectQuality Assurance Project Plan
Revision No. 1 Page 2 of 2 8/10
D2.6 Leak Surveys, Inc.
The acceptance criteria for the measurement methods conducted by Leak Surveys, Inc. arepresented in Appendix H. Leak Surveys, Inc. will be provided validated data to UT in a PDFformat in their final report 15 days after the end of the field campaign.
D2.7 Data Review
If any contractor’s equipment operator notes any unusual or nonstandard conditions duringthe collection of the data, the operator enters the information in the contractor site activity log,which may be reviewed by thecontractor‘s data validator during the data validation process. Ifduring the data validation process the contractor’s data validator determines that these conditionsimpact the data in a negative manner, and then the contractor’s data validator may reject the databased on entries in the contractor site activity log on a case-by-case basis. If, during a review ofthe test data, the data validator discovers abnormal concentrations as compared to expectedvalues based on knowledge of past data, meteorology, and other conditions, the data validatorchecks logs, and quality control records to determine if there is a reason to invalidate the data inquestion.
The Project Quality Assurance Officer (or their designee) reviews all data for anomalies andasks contractor’s staff to investigate the value for an assignable cause. Any findings aredocumented as to the reason for invalidation and limitations on use of the data, if appropriate.
The University of Texas at Austin Section D3Comprehensive Flare Study ProjectQuality Assurance Project Plan
Revision No. 1 Page 1 of 3 8/10
D3 RECONCILIATION WITH USER REQUIREMENTS
Problems with potential limitations of the data are handled at two different levels: (1) by thecontractors’data validators communicating with the monitoring technician by telephone, e-mail;and (2) by users of data, who may question or want to verify the data quality objectives with acontractor data validator at a later date after data are processed. Issues are reconciled at thelowest level and earliest time possible. The mechanisms for communication between theproducers and users of data are the telephone, the contractor site activity log, and electronicsystems.
The QA officers, validators, analysts, and data managers are empowered to review andquestion any part of the measurement process and may initiate data reviews and correctiveactions to bring the process back into compliance.
D3.1 Detection Limits
Instrument method detection limits for each measurement are provided by each contractor.They are presented in Appendix G. The methods contained in this project are experimental;method detection limits have not been developed.
D3.2 Precision
Precision for each instrument method will be determined using the procedures developed byeach study participant. If precision is reported, it is presented in Appendix G. Precision betweenin situ instruments measurements will be presented in the project final report. Precision betweenremote sensing technologies will not be possible since these experimental measurements do nothave a precision metric reported in any literature.
D3.2.1 John Zink Company LLC
Precision for all device measurements made by the John Zink Company LLC is presented inAppendix G.
D3.2.2 TRC
Precision for all instrument measurements made by TRC are presented in Appendix G.
D3.2.3 Aerodyne Research, Inc.
The Precision for all instrument measurements made by Aerodyne Research, Inc. is presentedin Appendix G.
D3.2.4 Telops
Precision for all instrument measurements made by Telops is presented in Appendix G.
The University of Texas at Austin Section D3Comprehensive Flare Study ProjectQuality Assurance Project Plan
Revision No. 1 Page 2 of 3 8/10
D3.2.5 Industrial Monitor And Control Corporation
Precision is not a metric reported by Industrial Monitor And Control Corporation sincetheir measurement is made with an experimental instrument.
D3.2.6 Leak Surveys, Inc.
Precision is not a metric reported by Leak Surveys, Inc. since their measurement is made with avideo instrument.
.
D3.3 Accuracy
Accuracy is the closeness of a measurement to a reference value, and reflects elements ofboth bias and precision.
D3.3.1 John Zink Company LLC
Accuracy for all device measurements made by the John Zink Company LLC is presented inAppendix G.
D3.3.2 TRC
Accuracy for all instrument measurements for all measurements made by TRC is presentedin Appendix G.
D3.3.3 Aerodyne Research, Inc.
Accuracy for all instrument measurements made by Aerodyne Research, Inc., is presented inAppendix G.
D3.3.4 Telops
Accuracy for all instrument measurements made by Telops is presented in Appendix G.
D3.3.5 Industrial Monitor And Control Corporation
Accuracy is not a metric reported by Industrial Monitor And Control Corporation since theirmeasurement is made with an experimental instrument.
The University of Texas at Austin Section D3Comprehensive Flare Study ProjectQuality Assurance Project Plan
Revision No. 1 Page 3 of 3 8/10
D3.3.6 Leak Surveys, Inc.
Accuracy is not a metric reported by Leak Surveys, Inc. since their measurement is madewith a video instrument.
D3.4 Completeness
For all data completeness calculations, see Sections A7.2.5 and C1.3.1.3.