Embed Size (px)
Citation preview

©2015 Catalina
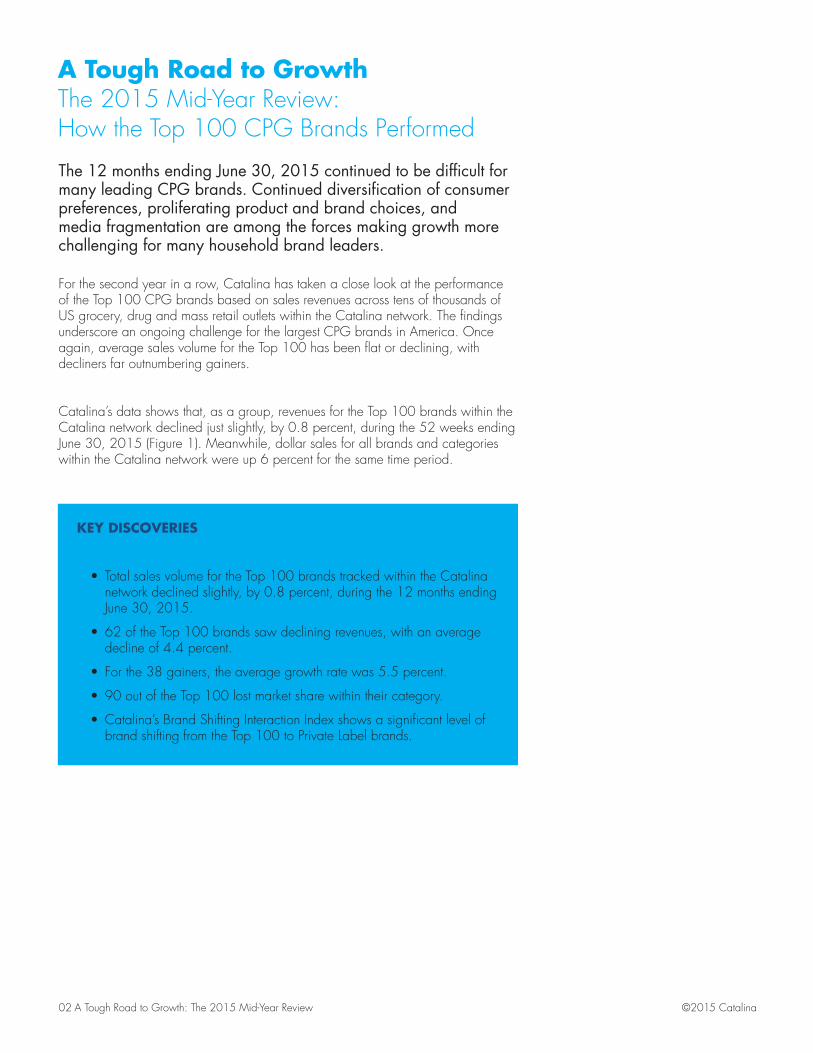
The 2015 Mid-Year Review:How the Top 100 CPG Brands Performed
A TOUGHROAD TO GROWTH
02 A Tough Road to Growth: The 2015 Mid-Year Review ©2015 Catalina
For the second year in a row, Catalina has taken a close look at the performance of the Top 100 CPG brands based on sales revenues across tens of thousands of US grocery, drug and mass retail outlets within the Catalina network. The findings underscore an ongoing challenge for the largest CPG brands in America. Once again, average sales volume for the Top 100 has been flat or declining, with decliners far outnumbering gainers.
Catalina’s data shows that, as a group, revenues for the Top 100 brands within the Catalina network declined just slightly, by 0.8 percent, during the 52 weeks ending June 30, 2015 (Figure 1). Meanwhile, dollar sales for all brands and categories within the Catalina network were up 6 percent for the same time period.
The 12 months ending June 30, 2015 continued to be difficult for many leading CPG brands. Continued diversification of consumer preferences, proliferating product and brand choices, and media fragmentation are among the forces making growth more challenging for many household brand leaders.
A Tough Road to Growth The 2015 Mid-Year Review: How the Top 100 CPG Brands Performed
KEY DISCOVERIES
• Total sales volume for the Top 100 brands tracked within the Catalina network declined slightly, by 0.8 percent, during the 12 months ending June 30, 2015.
• 62 of the Top 100 brands saw declining revenues, with an average decline of 4.4 percent.
• For the 38 gainers, the average growth rate was 5.5 percent.
• 90 out of the Top 100 lost market share within their category.
• Catalina’s Brand Shifting Interaction Index shows a significant level of brand shifting from the Top 100 to Private Label brands.
03 A Tough Road to Growth: The 2015 Mid-Year Review©2015 Catalina ©2015 Catalina
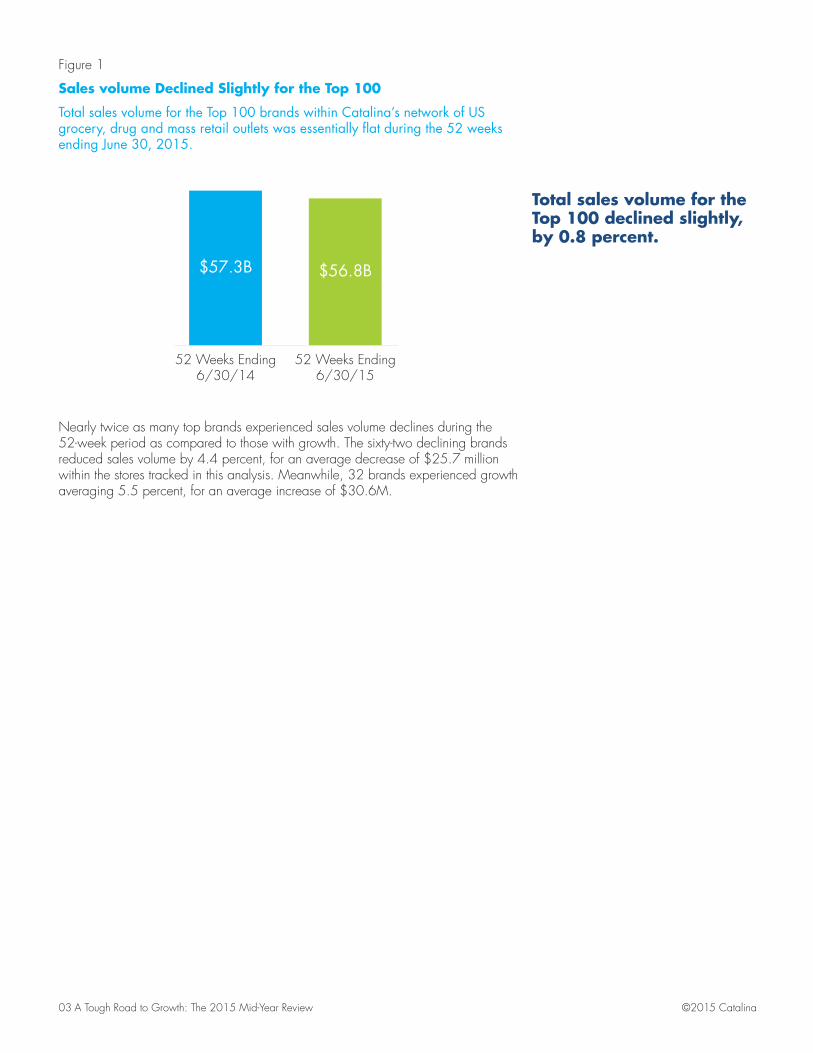
Nearly twice as many top brands experienced sales volume declines during the 52-week period as compared to those with growth. The sixty-two declining brands reduced sales volume by 4.4 percent, for an average decrease of $25.7 million within the stores tracked in this analysis. Meanwhile, 32 brands experienced growth averaging 5.5 percent, for an average increase of $30.6M.
Total sales volume for the Top 100 brands within Catalina’s network of US grocery, drug and mass retail outlets was essentially flat during the 52 weeks ending June 30, 2015.
Figure 1
Sales volume Declined Slightly for the Top 100
52 Weeks Ending6/30/14
52 Weeks Ending6/30/15
$57.3B $56.8B
Total sales volume for the Top 100 declined slightly, by 0.8 percent.
04 A Tough Road to Growth: The 2015 Mid-Year Review ©2015 Catalina
Figure 3
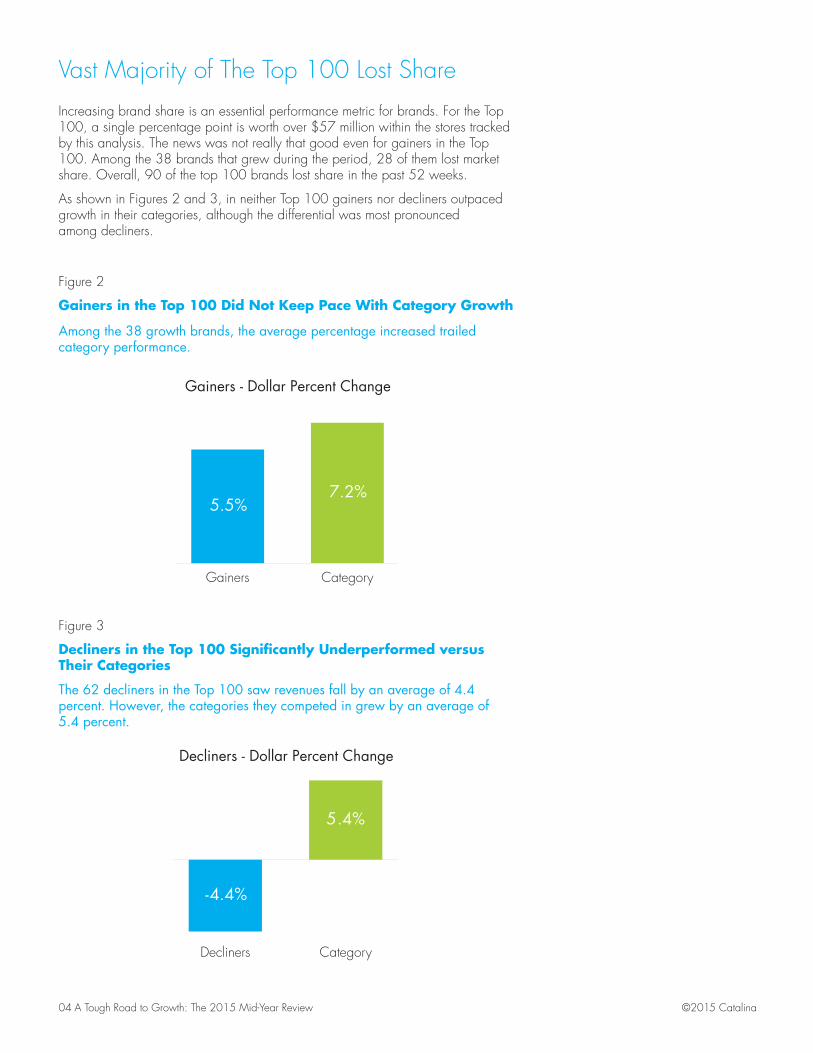
Decliners in the Top 100 Significantly Underperformed versus Their Categories
Decliners Category
-4.4%
5.4%
Decliners - Dollar Percent Change
Among the 38 growth brands, the average percentage increased trailed category performance.
The 62 decliners in the Top 100 saw revenues fall by an average of 4.4 percent. However, the categories they competed in grew by an average of 5.4 percent.
Figure 2
Gainers in the Top 100 Did Not Keep Pace With Category Growth
Gainers Category
5.5%7.2%
Gainers - Dollar Percent Change
Vast Majority of The Top 100 Lost Share Increasing brand share is an essential performance metric for brands. For the Top 100, a single percentage point is worth over $57 million within the stores tracked by this analysis. The news was not really that good even for gainers in the Top 100. Among the 38 brands that grew during the period, 28 of them lost market share. Overall, 90 of the top 100 brands lost share in the past 52 weeks.
As shown in Figures 2 and 3, in neither Top 100 gainers nor decliners outpaced growth in their categories, although the differential was most pronounced among decliners.

05 A Tough Road to Growth: The 2015 Mid-Year Review©2015 Catalina ©2015 Catalina
ABOUT THIS REPORT
Catalina has developed this report to help our industry understand the forces and factors impacting brand performance today. It contains a variety of charts and graphs that summarize the key measures of the Top 100 Brands, including:
Top 100 sales volume growth versus their categories
• How did the Top 100 perform versus the categories in which they compete?
Dollar volume change by category segment
• How did the fourteen mega categories perform?
Brand share changes
• How many of the Top 100 lost brand share … even if they showed dollar sales growth?
Buyer dynamics of volume change
• What were the key drivers for volume changes in the past year: alignment, new/lost buyers, and/or brand shifting?
New category buyer attraction
• Are the Top 100 attracting their fair share of new buyers in the category?
Impact of reduced loyalty and defection
• What percent of total sales volume is lost due to changes in brand loyalty?

06 A Tough Road to Growth: The 2015 Mid-Year Review ©2015 Catalina
Across 14 mega-category segments, Top 100 brands were outperformed by the overall category. Top brands declined in 9 or the 14 categories. How did your brand compare with its category?
Figure 4
Categories Outperforming Top 100 Brands
Top 100 brands were outperformed by the mega-categories in which they compete.
Baby5 brands6% of Top 100 $-1.6% declineCategory: +5.0%
Candy/Snacks8 brands8% of Top 100 $-0.3% declineCategory: +5.9%
Cereal4 brands4% of Top 100 $-5.5% declineCategory: +2.4%
Coffee4 brands5% of Top 100 $+0.1% increaseCategory: +9.4%
Crackers, Cookies, Bread11 brands9% of Top 100 $-1.4% declineCategory: +4.3%
Frozen8 brands6% of Top 100 $-7.8% declineCategory: +3.5%
Dairy12 brands13% of Top 100 $+1.5% increaseCategory: +7.3%
Grocery10 brands10% of Top 100 $+2.3% increaseCategory: +5.2%
HBC10 brands3% of Top 100 $+0.7% increaseCategory: +8.1%
Household3 brands4% of Top 100 $-2.9% declineCategory: +2.5%
Paper7 brands7% of Top 100 $-1.2% declineCategory: +5.1%
Pet4 brands3% of Top 100 $-5.5% declineCategory: +5.7%
Refrigerated Meats6 brands7% of Top 100 $-0.4% declineCategory: +11.0%
Soft Drinks/Water8 brands11% of Top 100 $+1.3% increaseCategory: +7.4%
07 A Tough Road to Growth: The 2015 Mid-Year Review©2015 Catalina ©2015 Catalina
Catalina looked at the key buyer dynamics impacting brand performance.
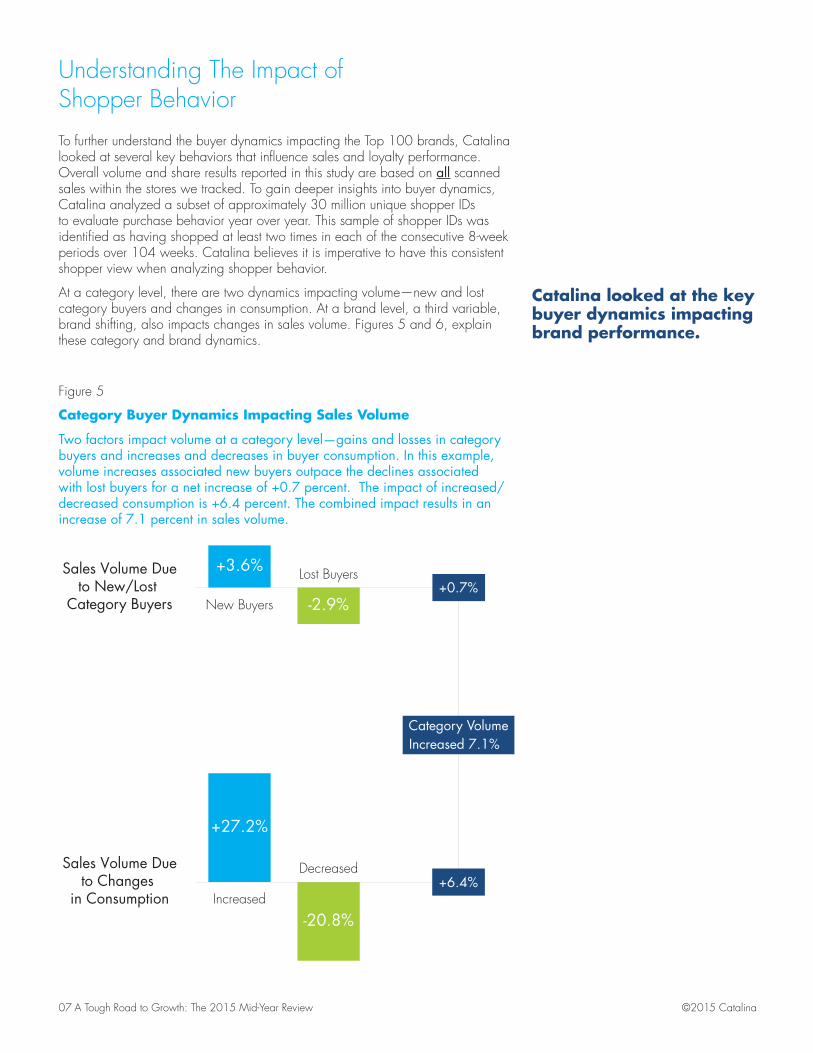
Understanding The Impact of Shopper BehaviorTo further understand the buyer dynamics impacting the Top 100 brands, Catalina looked at several key behaviors that influence sales and loyalty performance. Overall volume and share results reported in this study are based on all scanned sales within the stores we tracked. To gain deeper insights into buyer dynamics, Catalina analyzed a subset of approximately 30 million unique shopper IDs to evaluate purchase behavior year over year. This sample of shopper IDs was identified as having shopped at least two times in each of the consecutive 8-week periods over 104 weeks. Catalina believes it is imperative to have this consistent shopper view when analyzing shopper behavior.
At a category level, there are two dynamics impacting volume—new and lost category buyers and changes in consumption. At a brand level, a third variable, brand shifting, also impacts changes in sales volume. Figures 5 and 6, explain these category and brand dynamics.
Two factors impact volume at a category level—gains and losses in category buyers and increases and decreases in buyer consumption. In this example, volume increases associated new buyers outpace the declines associated with lost buyers for a net increase of +0.7 percent. The impact of increased/decreased consumption is +6.4 percent. The combined impact results in an increase of 7.1 percent in sales volume.
Figure 5
Category Buyer Dynamics Impacting Sales Volume
to New/Lost Sales Volume Due
Category Buyers
to Changes Sales Volume Due
in Consumption
New Buyers
Lost Buyers+3.6%
-2.9%
Increased
Decreased
+27.2%
-20.8%
Category VolumeIncreased 7.1%
+0.7%
+6.4%

08 A Tough Road to Growth: The 2015 Mid-Year Review ©2015 Catalina
Brand shifting had the greatest negative impact on declining brands in the Top 100.
New/Lost Category
Consumption Changes
BrandShifting
NEW
Brand volume is impacted by the same dynamics that affect category performance—changes in consumption and brand buyers who are new or lost to the category. It is also impacted by a third dynamic, brand shifting within the category.
Each factor of buyer dynamics has a major influence on sales volume growth or decline. The example in Figure 7 shows a brand with solid growth among brand buyers who are new to the brand and strong growth in consumption. However, the brand’s performance is severely impacted to the downside by brand shifting, as far more net sales volume switched to other brands. Figure 8 shows how these buyer dynamics impacted gainers and decliners in aggregate during the 52-week period ending June 30. Increased consumption was the major force for growth among gainers, while brand shifting had the greatest negative impact on decliners. Understanding buyer dynamics on a brand level is a critical step in designing a strategy for improved brand performance.
Figure 6
Three Factors Impacting Brand Sales Volume

09 A Tough Road to Growth: The 2015 Mid-Year Review©2015 Catalina ©2015 Catalina
Below is an example of a gainer brand that increased sales volume by 0.9 percent in a 12- month period. New category buyers to the brand increased sales by 2.6 percent during the period and consumption per shopper grew sales by 5.2 percent. However, the brand declined by 6.9 percent due to shoppers who shifted to other brands in the category.
This chart shows the impact of buyer dynamics on gainers and decliners within the Top 100 during the 12 months ending June 30, 2015. In aggregate, gainers grew sales volume by 5.5 percent with the biggest factor being increased consumption per shopper. Decliners lost an average of 4.4 percent; brand shifting was by far the leading cause of the decline.
Figure 7
How Buyer Dynamics Impact Brands Percent Change vs. Year Ago
Figure 8
Buyer Dynamics Impacting Sales Volume for Gainers and Decliners
Net Sales Volume Change: +0.9%Percent Change VS Year Ago
New Buyers
Brand Shifting
Category Growth
2.6%
-6.9%
5.2%
Gainers Decliners
New/Lost BuyersConsumptionBrand Shifting
+5.5%
+0.7%
+5.0%
-0.2%
+0.1%
-4.4%
-0.1%
-4.4%

10 A Tough Road to Growth: The 2015 Mid-Year Review ©2015 Catalina
Brand Shifting to Private Label
Who’s Getting Their Fair Share of New Category Buyers
An analysis of brand shifting indicates that Private Labels is getting more than their fair share of brand shifting from Top 100 brands. Catalina has developed a Brand Shifting Interaction Index that compares the dollar sales volume associated with switching to another brand to the normalized share of that other brand. When the index is greater than 120, that brand is considered to be highly substitutable. In 12 of the 14 mega-category segments discussed in the table on page 6, the index for Private Label is a very high 158. This means that the Top 100 brands exchange volume with Private Label 58 percent more than would be expected based on fair share.
Over the course of a year, categories will gain or lose approximately 36 percent of their shoppers. With that much fluctuation in buying behavior, it is important to understand whether your brand is getting its fair share of new category buyers.
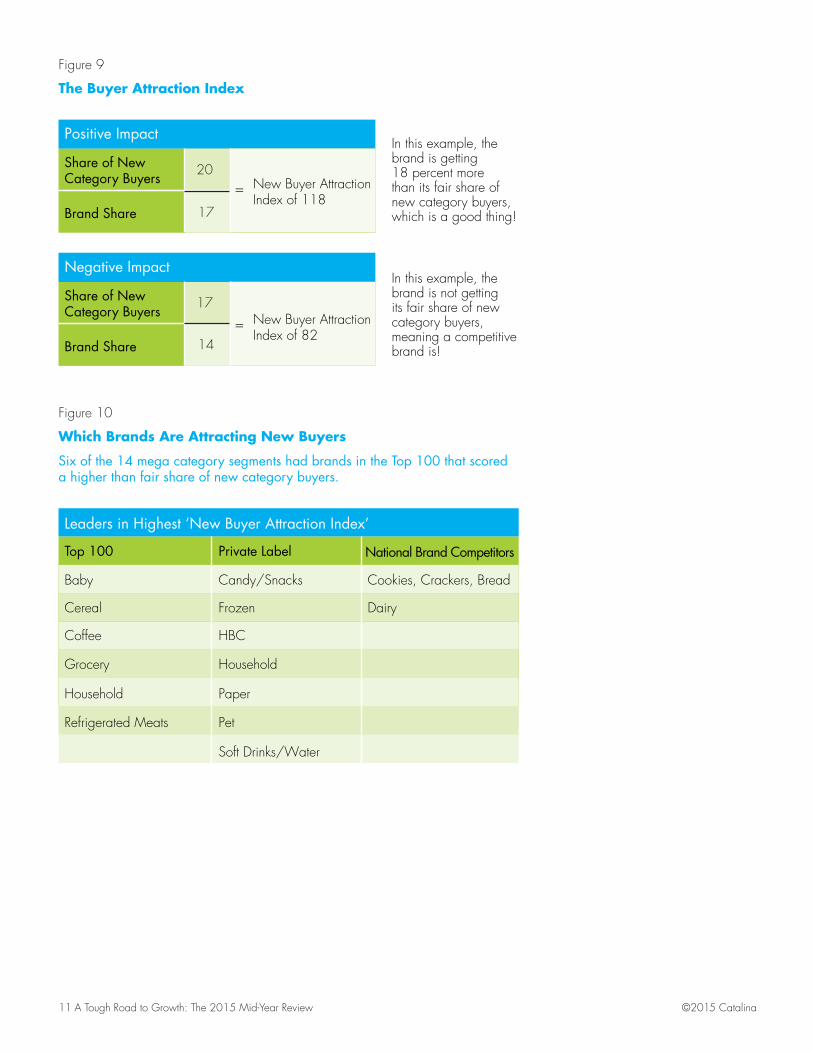
Catalina developed a ‘New Buyer Attraction Index’ to determine if a brand is securing a share of new category buyers equivalent to its share of category volume. Figure 9 shows how the index is calculated. As shown in Figure 10, there were Top 100 brands in six of the 14 mega-category segments that had New Buyer Attraction scores exceeding their fair share. In seven categories, Private Label brands exceeded their fair share within the index.
Catalina’s Brand Shifting Interaction Index shows a significant shift to Private Label brands.
11 A Tough Road to Growth: The 2015 Mid-Year Review©2015 Catalina ©2015 Catalina
Six of the 14 mega category segments had brands in the Top 100 that scored a higher than fair share of new category buyers.
Share of New Category Buyers
Share of New Category Buyers
Brand Share
Brand Share
In this example, the brand is getting 18 percent more than its fair share of new category buyers, which is a good thing!
In this example, the brand is not getting its fair share of new category buyers, meaning a competitive brand is!
New Buyer Attraction Index of 118
New Buyer Attraction Index of 82
Positive Impact
Negative Impact
20
17
17
14
=
=
Leaders in Highest ‘New Buyer Attraction Index’
Top 100 Private Label National Brand Competitors
Baby Candy/Snacks Cookies, Crackers, Bread
Cereal Frozen Dairy
Coffee HBC
Grocery
Household
Refrigerated Meats
Household
Paper
Pet
Soft Drinks/Water
Figure 9
The Buyer Attraction Index
Figure 10
Which Brands Are Attracting New Buyers

12 A Tough Road to Growth: The 2015 Mid-Year Review ©2015 Catalina
The Loyalty EffectBrand loyalty is a major challenge for all brands, including the Top 100. The capacity to hold on to loyal shoppers has a major impact on brand volume. To measure the effects of defection and reduced loyalty, Catalina looked at the category and brand purchase behavior of consistent shoppers in both the 52-week study period and the previous 52 weeks. The analysis looked at highly loyal brand buyers in Year One and whether they defected from the brand or reduced their loyalty in Year Two. Highly loyal was defined as shoppers who made 70 percent or more of their category purchases with one of the Top 100 brands. To be included, shoppers needed to continue to buy in the category in Year Two.
As shown in Figure 11, the average Top 100 brand retained less than half of it is highly loyal shoppers. Some 45 percent of high loyals were retained, versus 32 percent that reduced loyalty and 23 percent that completely defected to other brands in the category. The average lost opportunity equaled over 4 percent of highly loyal sales volume.
More than half of shoppers who were highly loyal to a Top 100 brand in 12 months prior to the study period did not remain loyal in the subsequent 52-week period that ended June 30, 2015.
Figure 11
Loyalty and Defection
45% 23%32%DefectorsReduced
LoyaltyRemaining High
Loyals From Year 1
Fifty-five percent of highly loyal shoppers either reduced loyalty or completely defected.

13 A Tough Road to Growth: The 2015 Mid-Year Review©2015 Catalina ©2015 Catalina
Protecting Your TurfAs shown in this study, as with all brands, the performance of Top 100 brands is being impacted by numerous factors related to buyer behavior. The challenge for leading brands has grown even more acute in a world in which consumer preferences have grown more diverse and selective across a growing proliferation of product and brand choices. With increasing media fragmentation, it is becoming more challenging than ever to reach the consumers that are most important to your brand.
Catalina’s experience with leading brands has demonstrated that campaigns concentrating on the highest-value brand consumers and addressing specific brand objectives can deliver significant financial efficiencies and brand-building gains. Only Catalina can find, understand and reach these important brand buyers at scale to dramatically reduce churn rates, maximize brand share and sales volume, and protect brand loyalty. Catalina then reaches those shoppers with relevant, personalized messages and offers to keep them returning to your brand.
Methodology
The 2015 Mid-Year Top 100 Brands Performance Review looks at the sales and loyalty performance of the Top 100 Brands from a sample of the Catalina network that spans across 26,000 food, drug, and mass retailers. Although this does not include all retailers within the Catalina network, the conclusions in this report are generally in line with national network results.
The study examines sales volume and loyalty changes between the 52-week periods ending June 30th. Highly loyal consumers were defined as those who made 70 percent or more of all category purchases with a single brand during the first 52-week period. Loyalty reductions and total brand defections were tracked among those same consumers during the second 52-week period. Shoppers must have purchased the category in both periods to be included in loyalty calculations. Total sales volume was calculated on all transactions within the sample.
If you’re interested in learning more about how Catalina can help you acquire, maximize, and retain loyal, high-value consumers, call 1-877-210-1917.
About Catalina
Catalina’s personalized digital media drives lift and loyalty for the world’s leading CPG retailers and brands. Catalina personalizes the consumer’s path to purchase through mobile, online and in-store networks powered by the world’s largest shopper history database. Catalina is based in St. Petersburg, FL, with operations in the United States, Europe and Japan. To learn more, please visit www.catalinamarketing.com or follow us on Twitter @Catalina.
If you would like to understand how your brand compared to the Top 100, email us at [email protected] and we’ll prepare a comparison for you.
If you’re interested in learning more about how Catalina can help you drive the success of new products, please call 1-877-210-1917.