Embed Size (px)
Citation preview
1
A Survey on Broadband Internet
Usage in Taiwan
A Summary Report
July 2017
Taiwan Network Information Center
2
Figure 1 Estimated Population of Internet Users.......................................... 5
Figure 2 Internet Users.......................................................................................... 5
Figure 3 Internet Users in the Past Six Months............................................ 6
Figure 4 Devices Used to Access Internet........................................................ 6
Figure 5 Locations accessing Internet.............................................................. 7
Figure 6 Types of Internet Connection.............................................................. 7
Figure 7 Usage of Social Networking Services................................................ 8
Figure 8 Usage of Instant Messaging Services................................................ 8
Figure 9 Change of Interactions after using Internet Community and Instant
Communication Software............................................................................................ 9
Figure 10 Encounter Things about Internet Security and Type of things
about Internet Security........................................................................................ 10
Figure 11 Years of Internet Access.................................................................. 11
Figure 12 Reasons for not Using Internet...................................................... 12
Figure 13 Use of Wearing Device and Type of Device used........................ 13
Figure 14 Usage of Bus Inquiry System and Accuracy of Prediction of Bus
Arrival Time.............................................................................................................. 13
Figure 15 Use of Wearing Device and Type of Device used........................ 14
Figure 16 Usage of Live Broadcast Service.................................................... 14
Figure 17 Platforms of Live Broadcast Service............................................ 15
Figure 18 Types of Live Broadcast Service.................................................... 15
Figure 19 Usage of Paid Online Audio/Video Service.................................. 16
Figure 20 Platforms of Paid Online Video Service...................................... 16
Figure 21 Usage of Internet Banking and Type of Internet Banking Services
Used.............................................................................................................................. 17
Figure 22 Things that Worried about when Using Mobile Banking............ 18
Figure 23 After Using Internet Bank, Going to the Bank Less Often or not
...................................................................................................................................... 18
Figure 24 Usage of Mobile Internet.................................................................. 19
Figure 25 Connection Method for Accessing Internet.................................. 19
Figure 26 Mobile Internet Service Satisfaction.......................................... 20
Figure 27 Usage of Mobile Payment.................................................................... 20
Figure 28 Types of Mobile Payment.................................................................... 21
Figure 29 Fees Paid with Mobile Payment........................................................ 21
Figure 30 Usage of Wi-Fi in Public Area........................................................ 22
Figure 31 Agreement of “Usage of Internet improve your Living Quality”
...................................................................................................................................... 22
Figure 32 Agreement of “Usage of Internet increase your degree of society
3
believing”................................................................................................................ 23
Figure 33 Agreement of “Usage of Internet improve your social life”
...................................................................................................................................... 24
Figure 34 Household Internet Access and Devices Used to Access Internet
at Home........................................................................................................................ 25
Figure 35 Household Internet Connection by Type........................................ 26
4
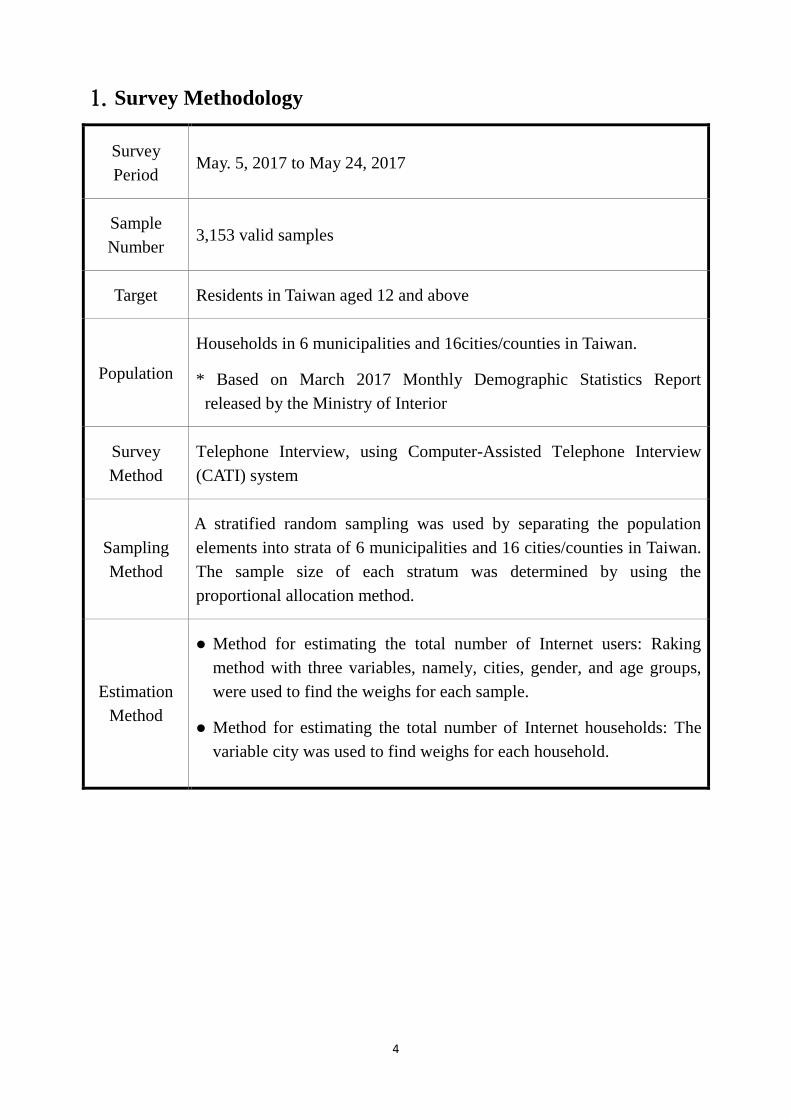
1. Survey Methodology
Survey
Period May. 5, 2017 to May 24, 2017
Sample
Number 3,153 valid samples
Target Residents in Taiwan aged 12 and above
Population
Households in 6 municipalities and 16cities/counties in Taiwan.
* Based on March 2017 Monthly Demographic Statistics Report
released by the Ministry of Interior
Survey
Method
Telephone Interview, using Computer-Assisted Telephone Interview
(CATI) system
Sampling
Method
A stratified random sampling was used by separating the population
elements into strata of 6 municipalities and 16 cities/counties in Taiwan.
The sample size of each stratum was determined by using the
proportional allocation method.
Estimation
Method
Method for estimating the total number of Internet users: Raking
method with three variables, namely, cities, gender, and age groups,
were used to find the weighs for each sample.
Method for estimating the total number of Internet households: The
variable city was used to find weighs for each household.
5
2. Individual Internet Use
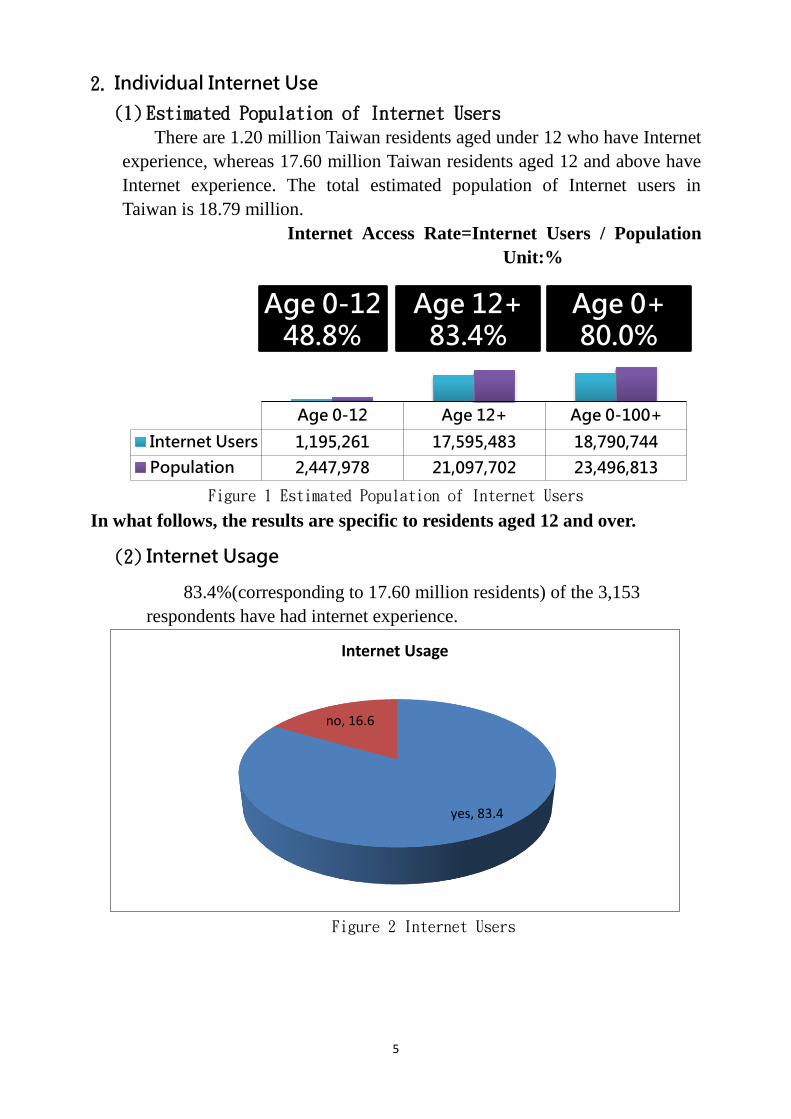
(1) Estimated Population of Internet Users
There are 1.20 million Taiwan residents aged under 12 who have Internet
experience, whereas 17.60 million Taiwan residents aged 12 and above have
Internet experience. The total estimated population of Internet users in
Taiwan is 18.79 million.
Internet Access Rate=Internet Users / Population
Unit:%
Figure 1 Estimated Population of Internet Users
In what follows, the results are specific to residents aged 12 and over.
(2) Internet Usage
83.4%(corresponding to 17.60 million residents) of the 3,153
respondents have had internet experience.
Figure 2 Internet Users
Age 0-12 Age 12+ Age 0-100+
Internet Users 1,195,261 17,595,483 18,790,744
Population 2,447,978 21,097,702 23,496,813
yes, 83.4
no, 16.6
Internet Usage
Age 0-12 48.8%
51.2%
1,261,322
Age 12+ 83.4%
17,568,798
Age 0+ 80.0%
18,830,120
6
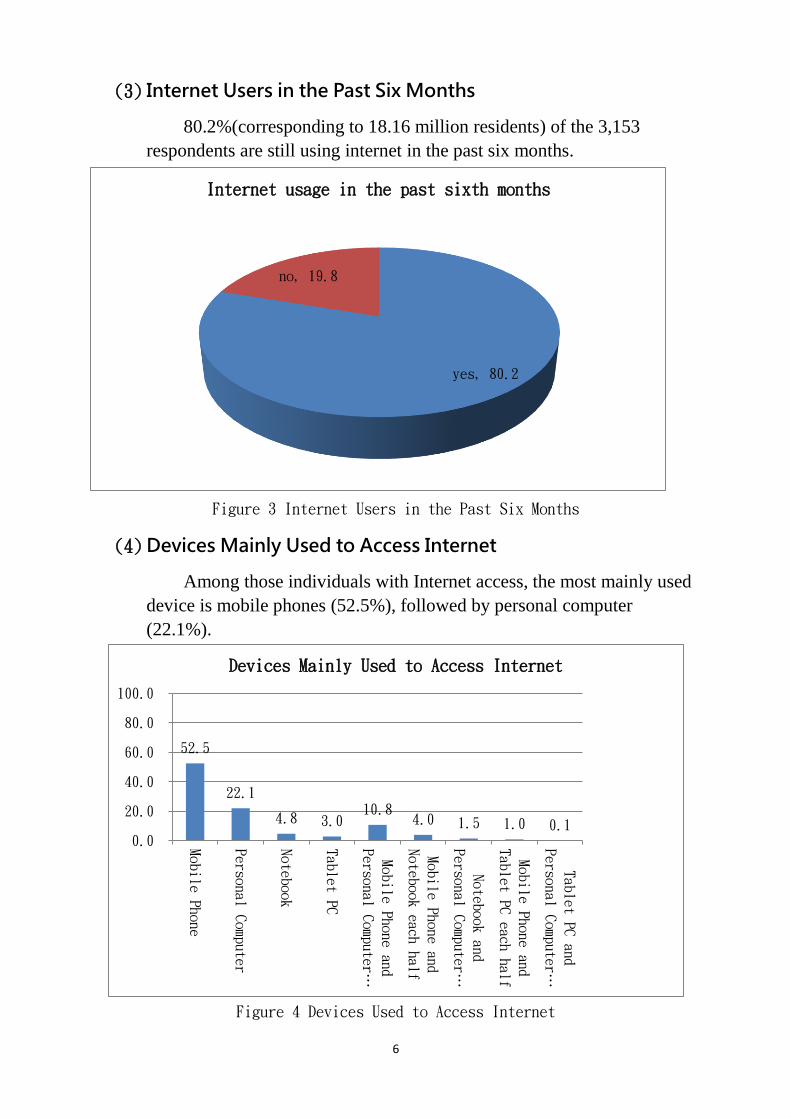
(3) Internet Users in the Past Six Months
80.2%(corresponding to 18.16 million residents) of the 3,153
respondents are still using internet in the past six months.
Figure 3 Internet Users in the Past Six Months
(4) Devices Mainly Used to Access Internet
Among those individuals with Internet access, the most mainly used
device is mobile phones (52.5%), followed by personal computer
(22.1%).
Figure 4 Devices Used to Access Internet
yes, 80.2
no, 19.8
Internet usage in the past sixth months
52.5
22.1
4.8 3.0 10.8
4.0 1.5 1.0 0.1 0.0
20.0
40.0
60.0
80.0
100.0
Mobile Phone
Personal Computer
Notebook
Tablet PC
Mobile Phone and
Personal Computer …
Mobile Phone and
Notebook each half
Notebook and
Personal Computer …
Mobile Phone and
Tablet PC each half
Tablet PC and
Personal Computer …
Devices Mainly Used to Access Internet
7
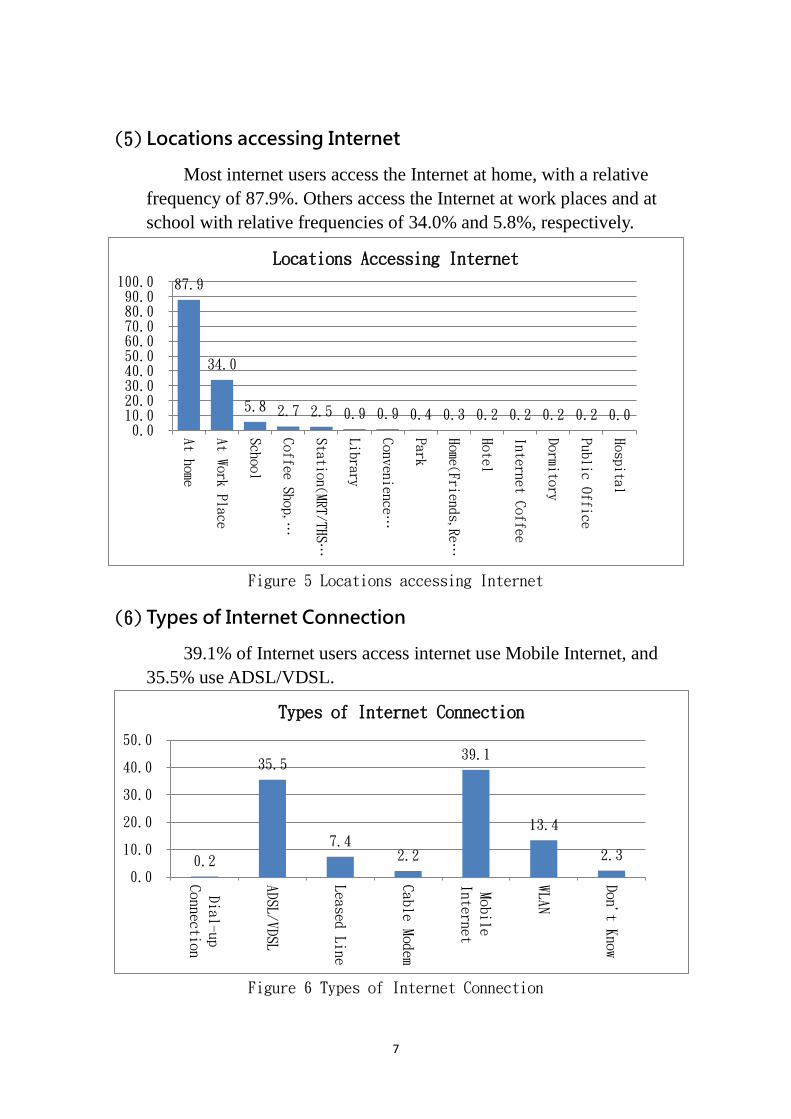
(5) Locations accessing Internet
Most internet users access the Internet at home, with a relative
frequency of 87.9%. Others access the Internet at work places and at
school with relative frequencies of 34.0% and 5.8%, respectively.
Figure 5 Locations accessing Internet
(6) Types of Internet Connection
39.1% of Internet users access internet use Mobile Internet, and
35.5% use ADSL/VDSL.
Figure 6 Types of Internet Connection
87.9
34.0
5.8 2.7 2.5 0.9 0.9 0.4 0.3 0.2 0.2 0.2 0.2 0.0 0.010.020.030.040.050.060.070.080.090.0100.0
At home
At Work Place
School
Coffee Shop, …
Station(MRT/THS…
Library
Convenience …
Park
Home(Friends,Re…
Hotel
Internet Coffee
Dormitory
Public Office
Hospital
Locations Accessing Internet
0.2
35.5
7.4 2.2
39.1
13.4
2.3
0.0
10.0
20.0
30.0
40.0
50.0
Dial-up
Connection
ADSL/VDSL
Leased Line
Cable Modem
Mobile
Internet
WLAN
Don't Know
Types of Internet Connection
8
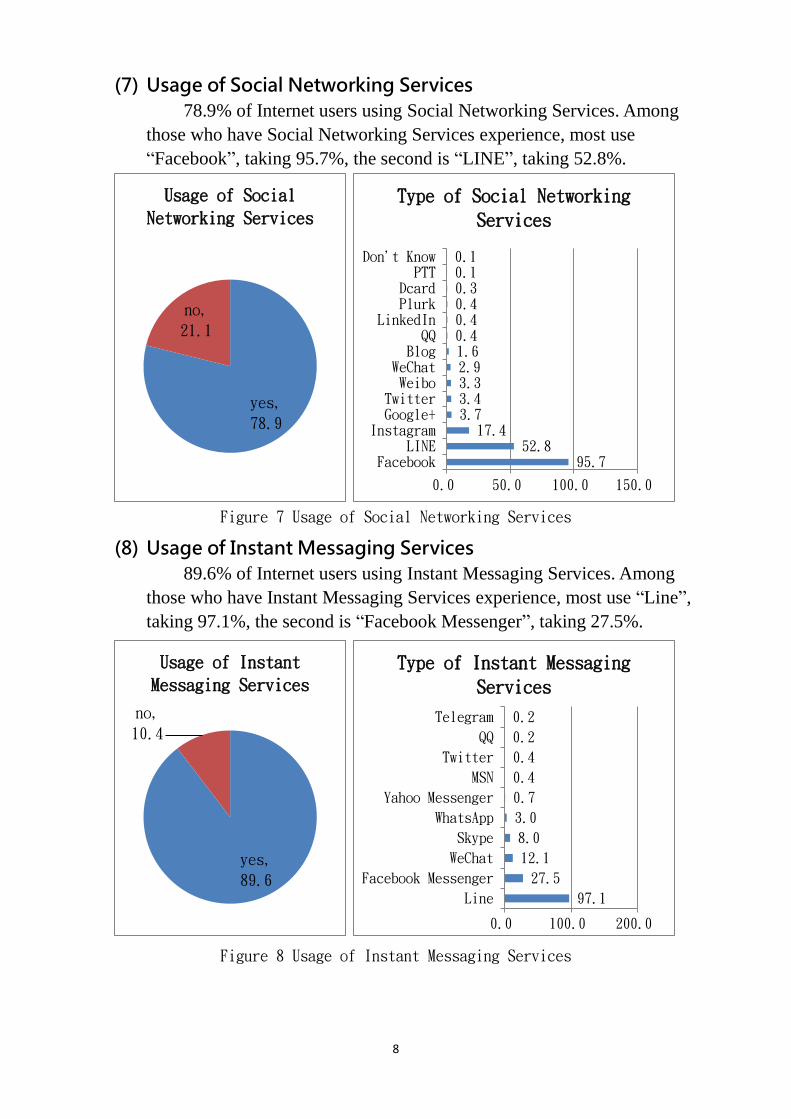
(7) Usage of Social Networking Services
78.9% of Internet users using Social Networking Services. Among
those who have Social Networking Services experience, most use
“Facebook”, taking 95.7%, the second is “LINE”, taking 52.8%.
Figure 7 Usage of Social Networking Services
(8) Usage of Instant Messaging Services
89.6% of Internet users using Instant Messaging Services. Among
those who have Instant Messaging Services experience, most use “Line”,
taking 97.1%, the second is “Facebook Messenger”, taking 27.5%.
Figure 8 Usage of Instant Messaging Services
yes,
78.9
no,
21.1
Usage of Social
Networking Services
95.7 52.8
17.4 3.7 3.4 3.3 2.9 1.6 0.4 0.4 0.4 0.3 0.1 0.1
0.0 50.0 100.0 150.0
FacebookLINE
InstagramGoogle+TwitterWeiboWeChatBlogQQ
LinkedInPlurkDcardPTT
Don't Know
Type of Social Networking
Services
yes,
89.6
no,
10.4
Usage of Instant
Messaging Services
97.1
27.5
12.1
8.0
3.0
0.7
0.4
0.4
0.2
0.2
0.0 100.0 200.0
Line
Facebook Messenger
Skype
Yahoo Messenger
MSN
Telegram
Type of Instant Messaging
Services
9
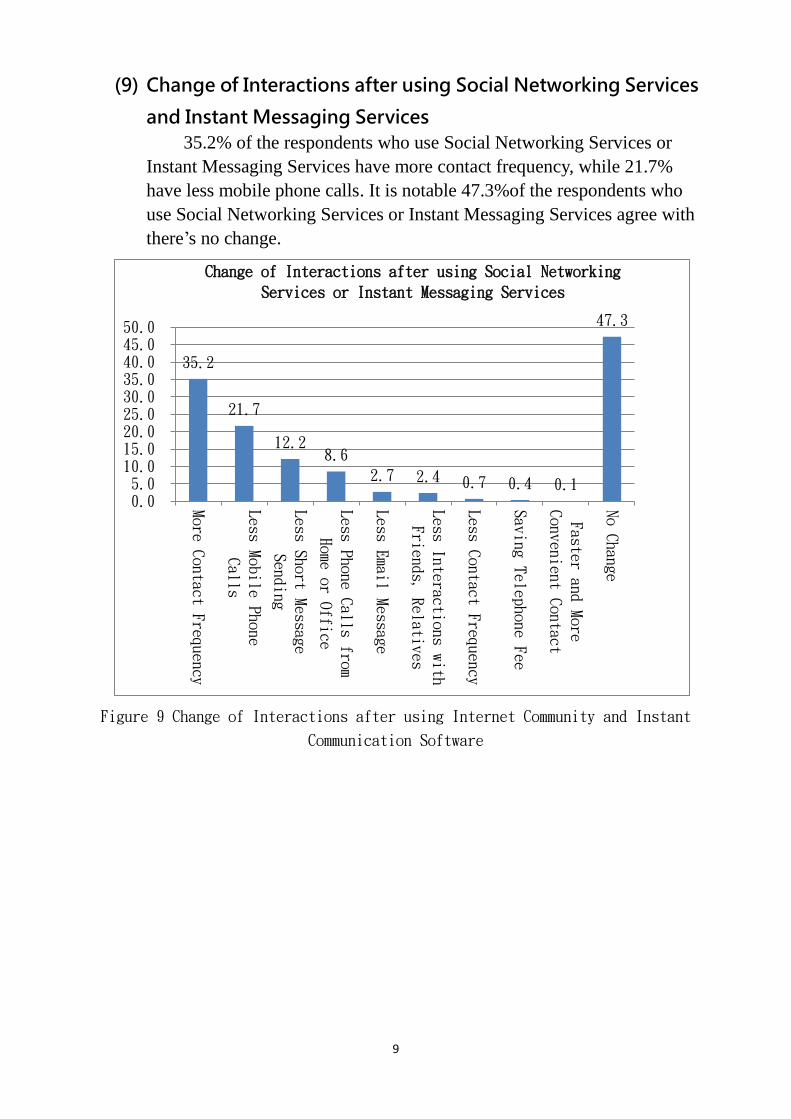
(9) Change of Interactions after using Social Networking Services
and Instant Messaging Services
35.2% of the respondents who use Social Networking Services or
Instant Messaging Services have more contact frequency, while 21.7%
have less mobile phone calls. It is notable 47.3%of the respondents who
use Social Networking Services or Instant Messaging Services agree with
there’s no change.
Figure 9 Change of Interactions after using Internet Community and Instant
Communication Software
35.2
21.7
12.2 8.6
2.7 2.4 0.7 0.4 0.1
47.3
0.05.010.015.020.025.030.035.040.045.050.0
More Contact Frequency
Less Mobile Phone
Calls
Less Short Message
Sending
Less Phone Calls from
Home or Office
Less Email Message
Less Interactions with
Friends, Relatives
Less Contact Frequency
Saving Telephone Fee
Faster and More
Convenient Contact
No Change
Change of Interactions after using Social Networking
Services or Instant Messaging Services
10
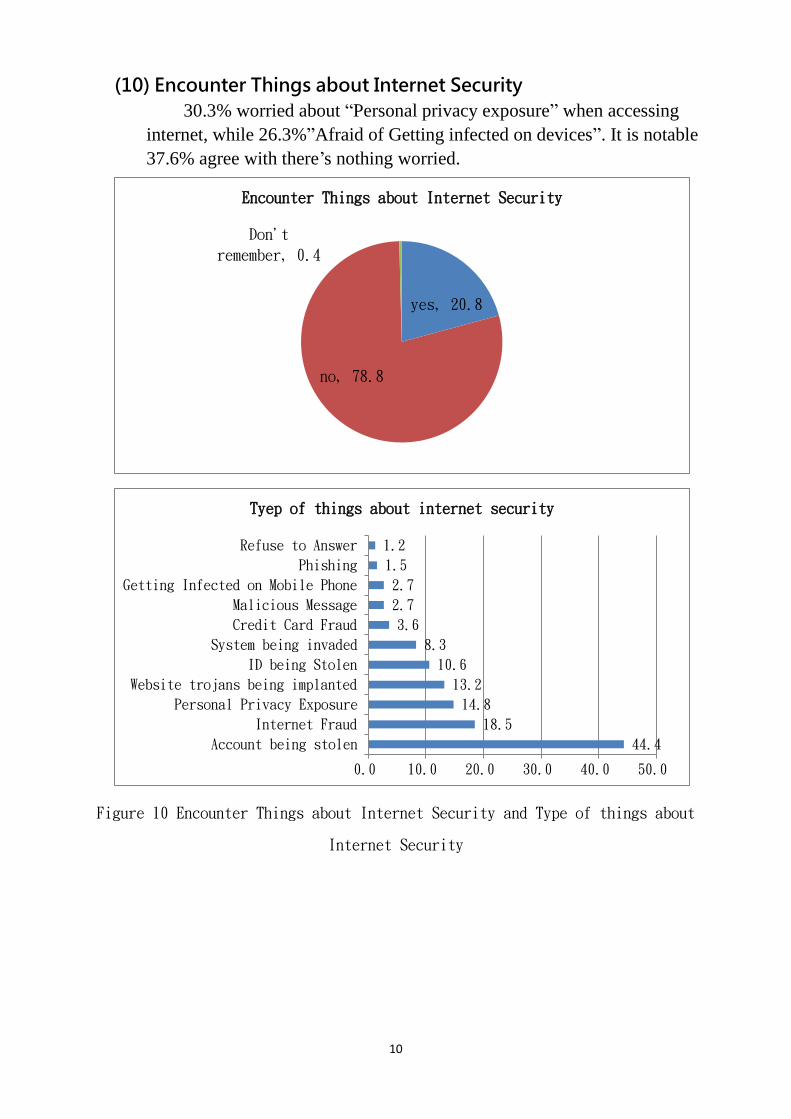
(10) Encounter Things about Internet Security
30.3% worried about “Personal privacy exposure” when accessing
internet, while 26.3%”Afraid of Getting infected on devices”. It is notable
37.6% agree with there’s nothing worried.
Figure 10 Encounter Things about Internet Security and Type of things about
Internet Security
yes, 20.8
no, 78.8
Don't
remember, 0.4
Encounter Things about Internet Security
44.4
18.5
14.8
13.2
10.6
8.3
3.6
2.7
2.7
1.5
1.2
0.0 10.0 20.0 30.0 40.0 50.0
Account being stolen
Internet Fraud
Personal Privacy Exposure
Website trojans being implanted
ID being Stolen
System being invaded
Credit Card Fraud
Malicious Message
Getting Infected on Mobile Phone
Phishing
Refuse to Answer
Tyep of things about internet security
11
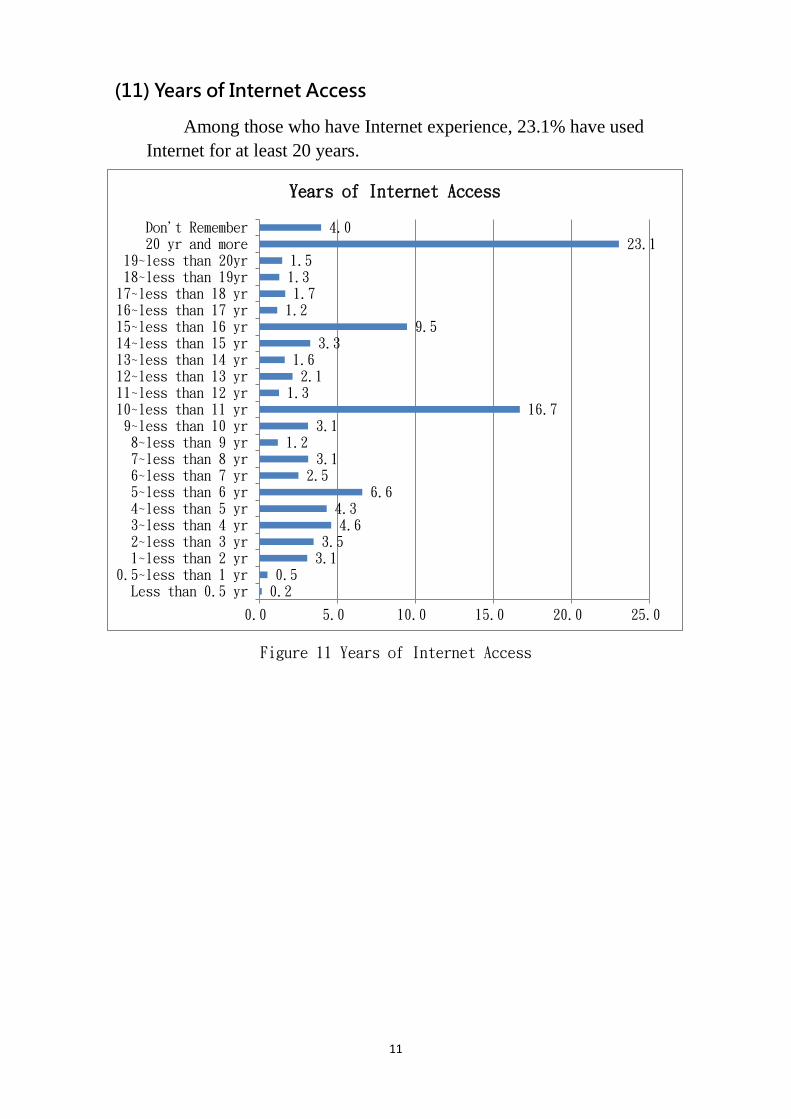
(11) Years of Internet Access
Among those who have Internet experience, 23.1% have used
Internet for at least 20 years.
Figure 11 Years of Internet Access
0.2 0.5
3.1 3.5
4.6 4.3
6.6 2.5 3.1
1.2 3.1
16.7 1.3 2.1
1.6 3.3
9.5 1.2 1.7 1.3 1.5
23.1 4.0
0.0 5.0 10.0 15.0 20.0 25.0
Less than 0.5 yr0.5~less than 1 yr1~less than 2 yr2~less than 3 yr3~less than 4 yr4~less than 5 yr5~less than 6 yr6~less than 7 yr7~less than 8 yr8~less than 9 yr9~less than 10 yr
10~less than 11 yr11~less than 12 yr12~less than 13 yr13~less than 14 yr14~less than 15 yr15~less than 16 yr16~less than 17 yr17~less than 18 yr18~less than 19yr19~less than 20yr
20 yr and moreDon't Remember
Years of Internet Access
12
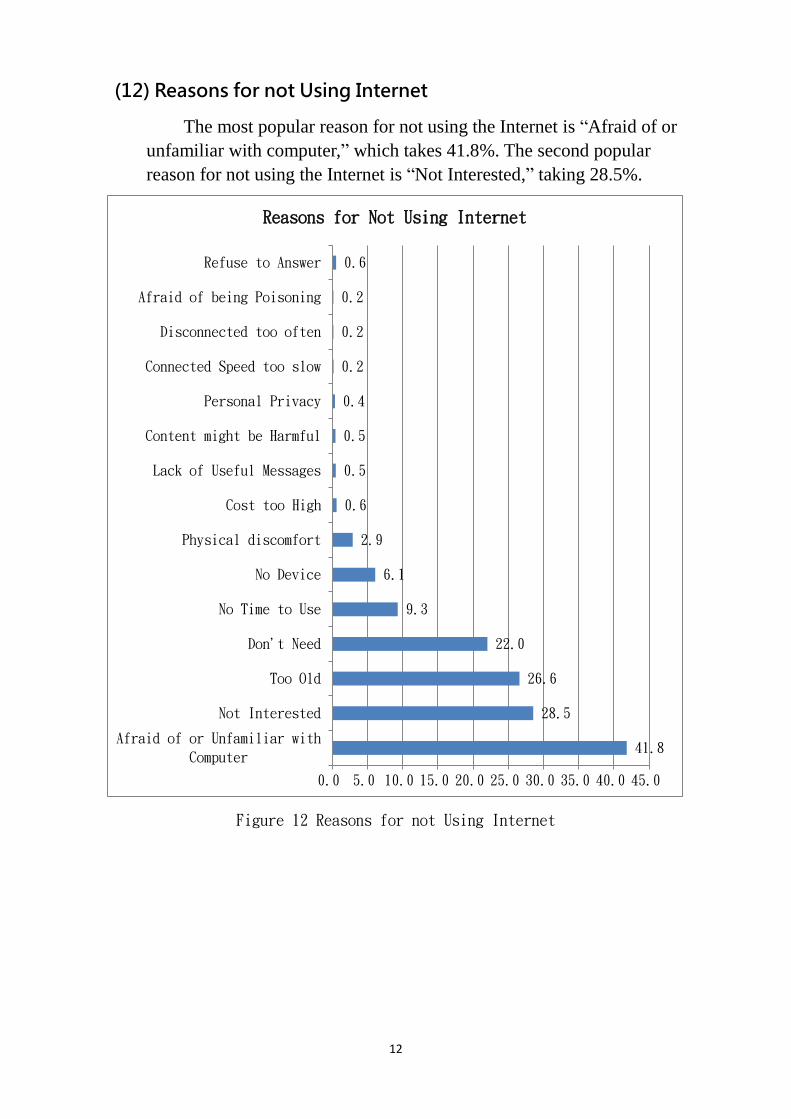
(12) Reasons for not Using Internet
The most popular reason for not using the Internet is “Afraid of or
unfamiliar with computer,” which takes 41.8%. The second popular
reason for not using the Internet is “Not Interested,” taking 28.5%.
Figure 12 Reasons for not Using Internet
41.8
28.5
26.6
22.0
9.3
6.1
2.9
0.6
0.5
0.5
0.4
0.2
0.2
0.2
0.6
0.0 5.0 10.0 15.0 20.0 25.0 30.0 35.0 40.0 45.0
Afraid of or Unfamiliar with
Computer
Not Interested
Too Old
Don't Need
No Time to Use
No Device
Physical discomfort
Cost too High
Lack of Useful Messages
Content might be Harmful
Personal Privacy
Connected Speed too slow
Disconnected too often
Afraid of being Poisoning
Refuse to Answer
Reasons for Not Using Internet
13
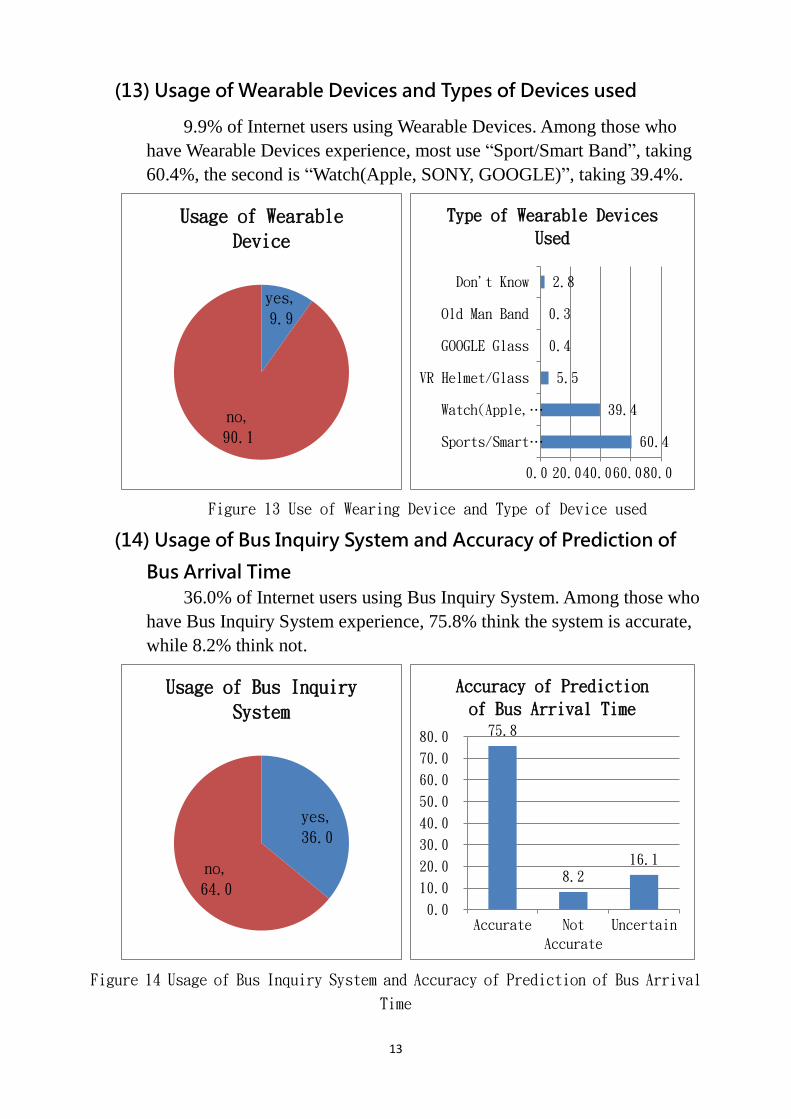
(13) Usage of Wearable Devices and Types of Devices used
9.9% of Internet users using Wearable Devices. Among those who
have Wearable Devices experience, most use “Sport/Smart Band”, taking
60.4%, the second is “Watch(Apple, SONY, GOOGLE)”, taking 39.4%.
Figure 13 Use of Wearing Device and Type of Device used
(14) Usage of Bus Inquiry System and Accuracy of Prediction of
Bus Arrival Time
36.0% of Internet users using Bus Inquiry System. Among those who
have Bus Inquiry System experience, 75.8% think the system is accurate,
while 8.2% think not.
Figure 14 Usage of Bus Inquiry System and Accuracy of Prediction of Bus Arrival
Time
yes,
9.9
no,
90.1
Usage of Wearable
Device
60.4
39.4
5.5
0.4
0.3
2.8
0.0 20.040.060.080.0
Sports/Smart…
Watch(Apple,…
VR Helmet/Glass
GOOGLE Glass
Old Man Band
Don't Know
Type of Wearable Devices
Used
yes,
36.0
no,
64.0
Usage of Bus Inquiry
System 75.8
8.2 16.1
0.0
10.0
20.0
30.0
40.0
50.0
60.0
70.0
80.0
Accurate Not
Accurate
Uncertain
Accuracy of Prediction
of Bus Arrival Time
14
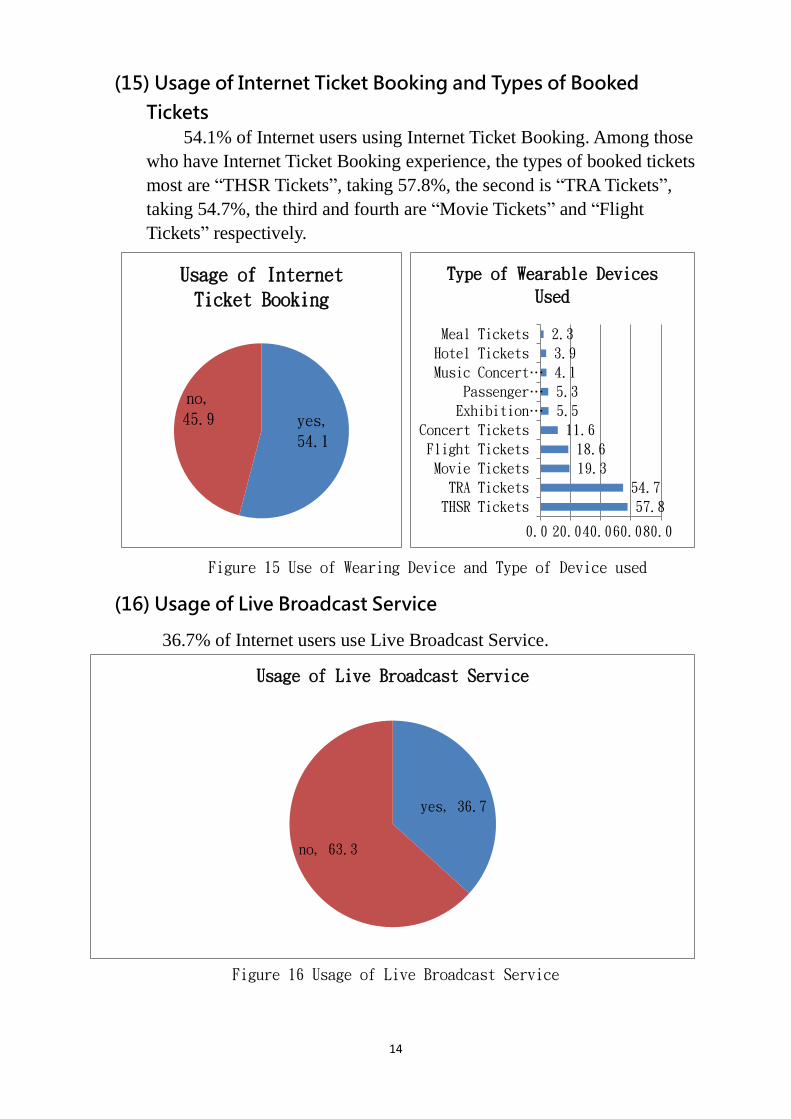
(15) Usage of Internet Ticket Booking and Types of Booked
Tickets
54.1% of Internet users using Internet Ticket Booking. Among those
who have Internet Ticket Booking experience, the types of booked tickets
most are “THSR Tickets”, taking 57.8%, the second is “TRA Tickets”,
taking 54.7%, the third and fourth are “Movie Tickets” and “Flight
Tickets” respectively.
Figure 15 Use of Wearing Device and Type of Device used
(16) Usage of Live Broadcast Service
36.7% of Internet users use Live Broadcast Service.
Figure 16 Usage of Live Broadcast Service
yes,
54.1
no,
45.9
Usage of Internet
Ticket Booking
57.8
54.7
19.3
18.6
11.6
5.5
5.3
4.1
3.9
2.3
0.0 20.040.060.080.0
THSR Tickets
TRA Tickets
Movie Tickets
Flight Tickets
Concert Tickets
Exhibition…
Passenger…
Music Concert…
Hotel Tickets
Meal Tickets
Type of Wearable Devices
Used
yes, 36.7
no, 63.3
Usage of Live Broadcast Service
15
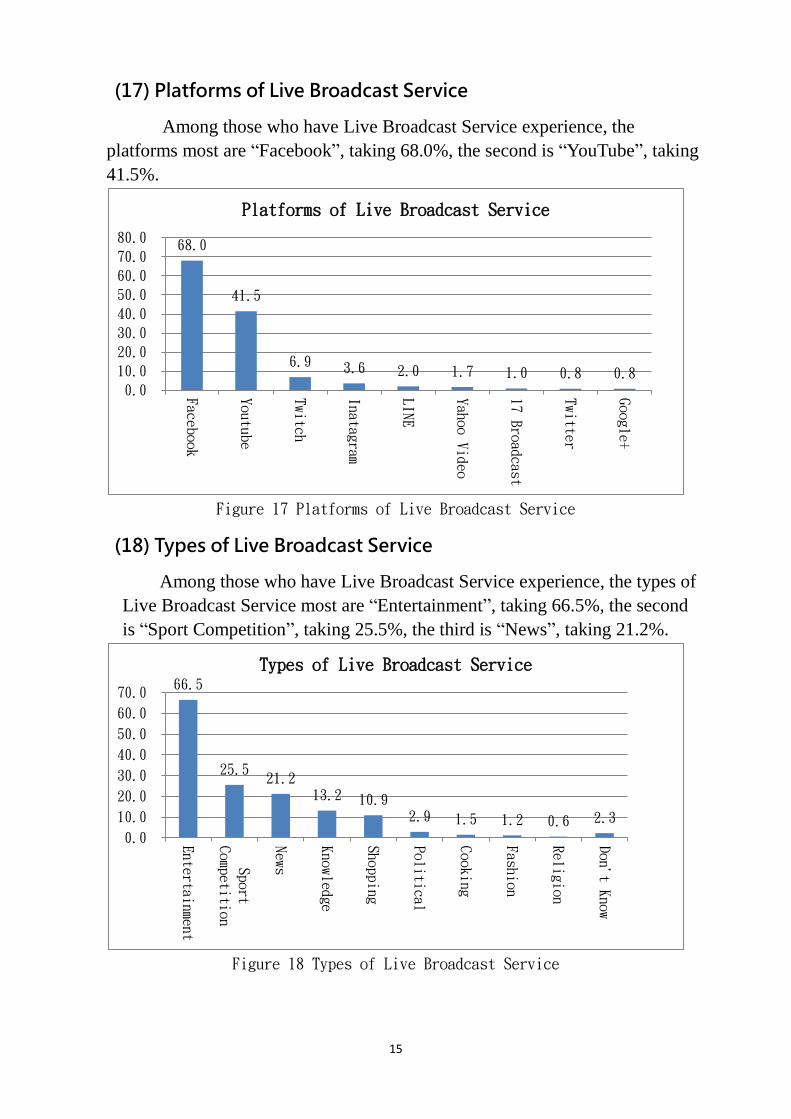
(17) Platforms of Live Broadcast Service
Among those who have Live Broadcast Service experience, the
platforms most are “Facebook”, taking 68.0%, the second is “YouTube”, taking
41.5%.
Figure 17 Platforms of Live Broadcast Service
(18) Types of Live Broadcast Service
Among those who have Live Broadcast Service experience, the types of
Live Broadcast Service most are “Entertainment”, taking 66.5%, the second
is “Sport Competition”, taking 25.5%, the third is “News”, taking 21.2%.
Figure 18 Types of Live Broadcast Service
68.0
41.5
6.9 3.6 2.0 1.7 1.0 0.8 0.8 0.0
10.0
20.0
30.0
40.0
50.0
60.0
70.0
80.0
Youtube
Twitch
Inatagram
LINE
Yahoo Video
17 Broadcast
Google+
Platforms of Live Broadcast Service
66.5
25.5 21.2
13.2 10.9 2.9 1.5 1.2 0.6 2.3
0.0
10.0
20.0
30.0
40.0
50.0
60.0
70.0
Entertainment
Sport
Competition
News
Knowledge
Shopping
Political
Cooking
Fashion
Religion
Don't Know
Types of Live Broadcast Service
16
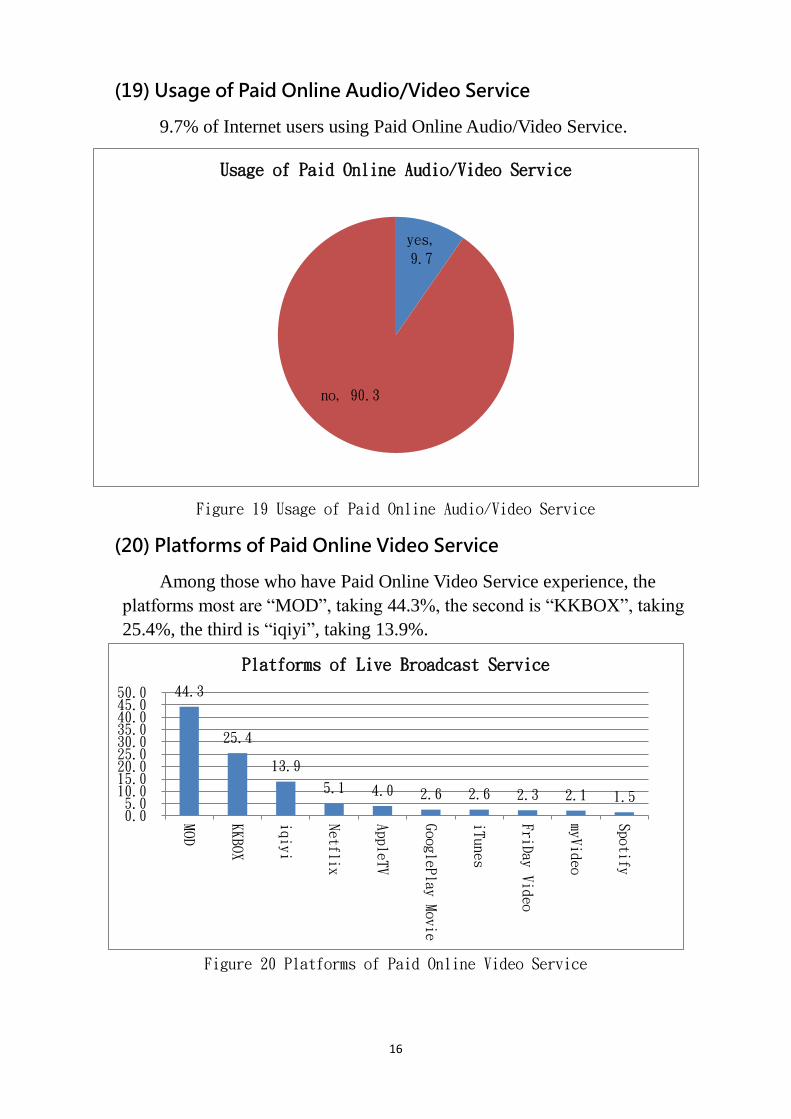
(19) Usage of Paid Online Audio/Video Service
9.7% of Internet users using Paid Online Audio/Video Service.
Figure 19 Usage of Paid Online Audio/Video Service
(20) Platforms of Paid Online Video Service
Among those who have Paid Online Video Service experience, the
platforms most are “MOD”, taking 44.3%, the second is “KKBOX”, taking
25.4%, the third is “iqiyi”, taking 13.9%.
Figure 20 Platforms of Paid Online Video Service
yes,
9.7
no, 90.3
Usage of Paid Online Audio/Video Service
44.3
25.4
13.9
5.1 4.0 2.6 2.6 2.3 2.1 1.5
0.05.010.015.020.025.030.035.040.045.050.0
MOD
KKBOX
iqiyi
Netflix
AppleTV
GooglePlay Movie
iTunes
FriDay Video
myVideo
Spotify
Platforms of Live Broadcast Service
17
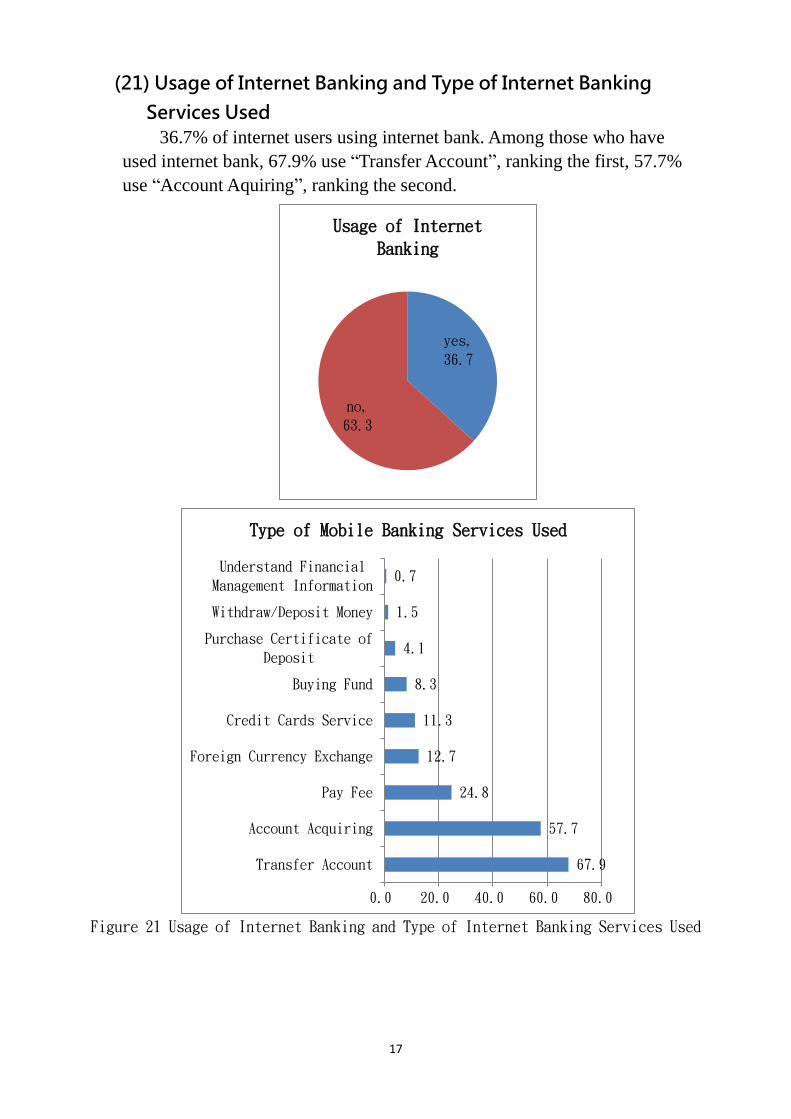
(21) Usage of Internet Banking and Type of Internet Banking
Services Used
36.7% of internet users using internet bank. Among those who have
used internet bank, 67.9% use “Transfer Account”, ranking the first, 57.7%
use “Account Aquiring”, ranking the second.
Figure 21 Usage of Internet Banking and Type of Internet Banking Services Used
yes,
36.7
no,
63.3
Usage of Internet
Banking
67.9
57.7
24.8
12.7
11.3
8.3
4.1
1.5
0.7
0.0 20.0 40.0 60.0 80.0
Transfer Account
Account Acquiring
Pay Fee
Foreign Currency Exchange
Credit Cards Service
Buying Fund
Purchase Certificate of
Deposit
Withdraw/Deposit Money
Understand Financial
Management Information
Type of Mobile Banking Services Used
18
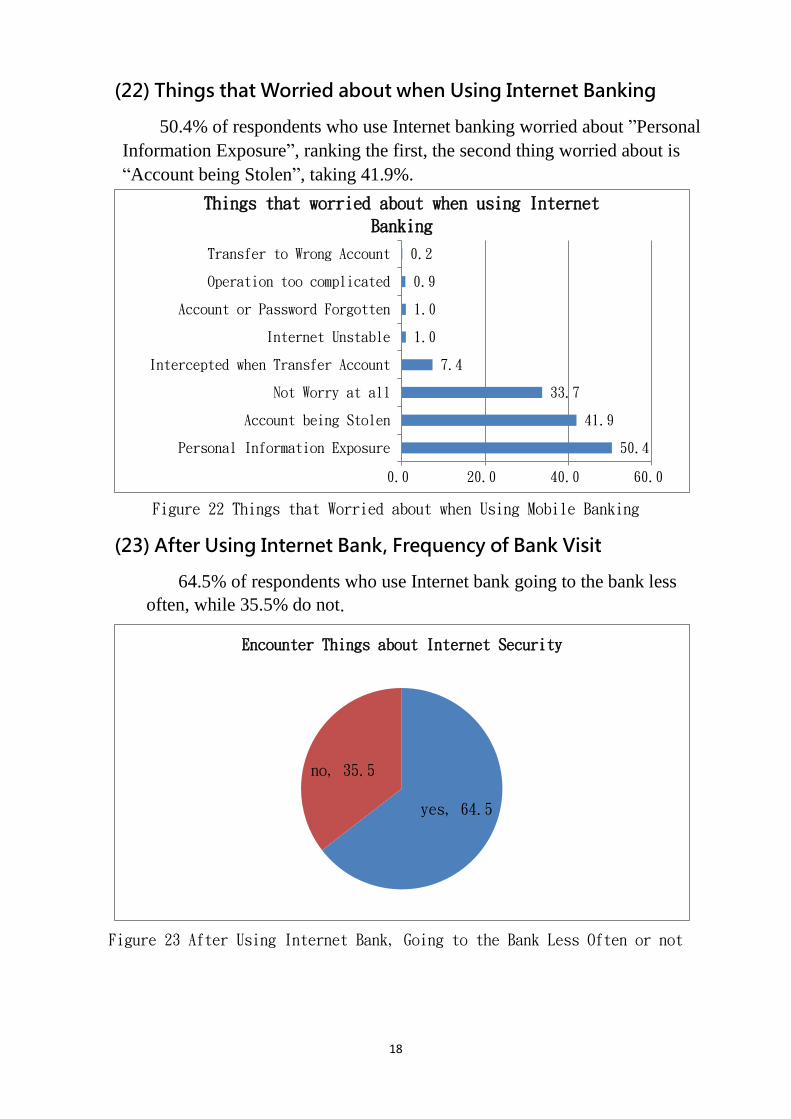
(22) Things that Worried about when Using Internet Banking
50.4% of respondents who use Internet banking worried about ”Personal
Information Exposure”, ranking the first, the second thing worried about is
“Account being Stolen”, taking 41.9%.
Figure 22 Things that Worried about when Using Mobile Banking
(23) After Using Internet Bank, Frequency of Bank Visit
64.5% of respondents who use Internet bank going to the bank less
often, while 35.5% do not.
Figure 23 After Using Internet Bank, Going to the Bank Less Often or not
50.4
41.9
33.7
7.4
1.0
1.0
0.9
0.2
0.0 20.0 40.0 60.0
Personal Information Exposure
Account being Stolen
Not Worry at all
Intercepted when Transfer Account
Internet Unstable
Account or Password Forgotten
Operation too complicated
Transfer to Wrong Account
Things that worried about when using Internet
Banking
yes, 64.5
no, 35.5
Encounter Things about Internet Security
19
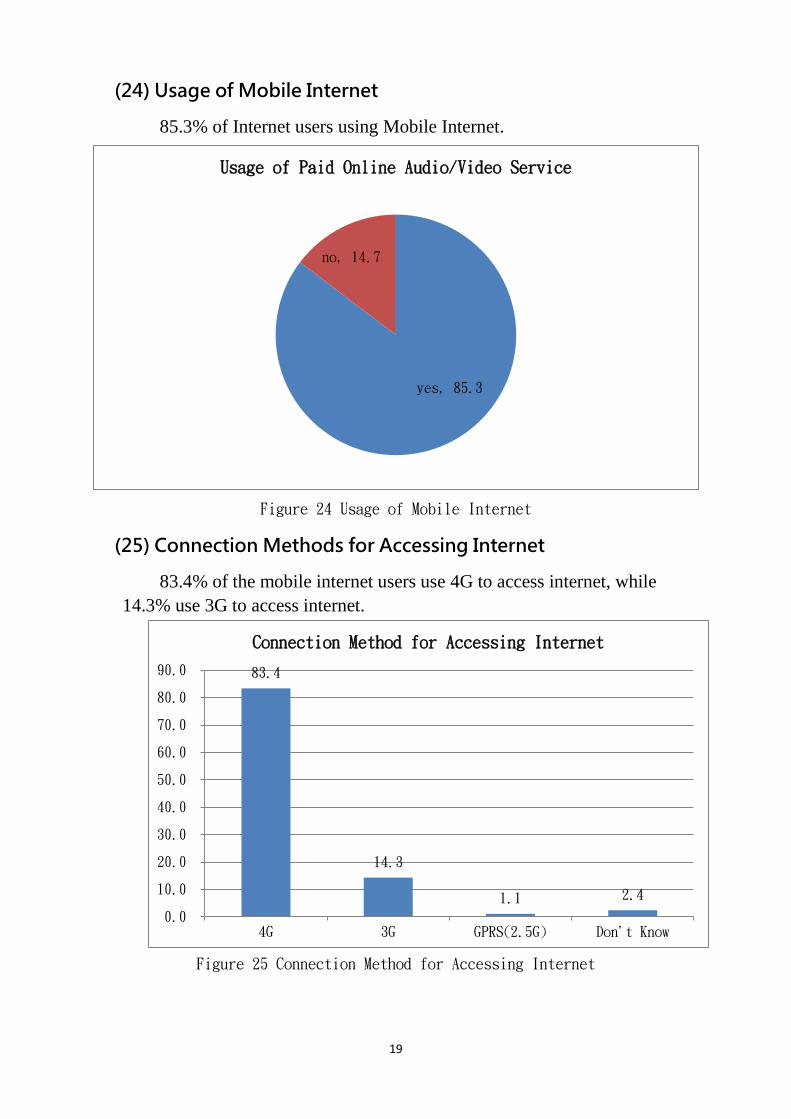
(24) Usage of Mobile Internet
85.3% of Internet users using Mobile Internet.
Figure 24 Usage of Mobile Internet
(25) Connection Methods for Accessing Internet
83.4% of the mobile internet users use 4G to access internet, while
14.3% use 3G to access internet.
Figure 25 Connection Method for Accessing Internet
yes, 85.3
no, 14.7
Usage of Paid Online Audio/Video Service
83.4
14.3
1.1 2.4
0.0
10.0
20.0
30.0
40.0
50.0
60.0
70.0
80.0
90.0
4G 3G GPRS(2.5G) Don't Know
Connection Method for Accessing Internet
20
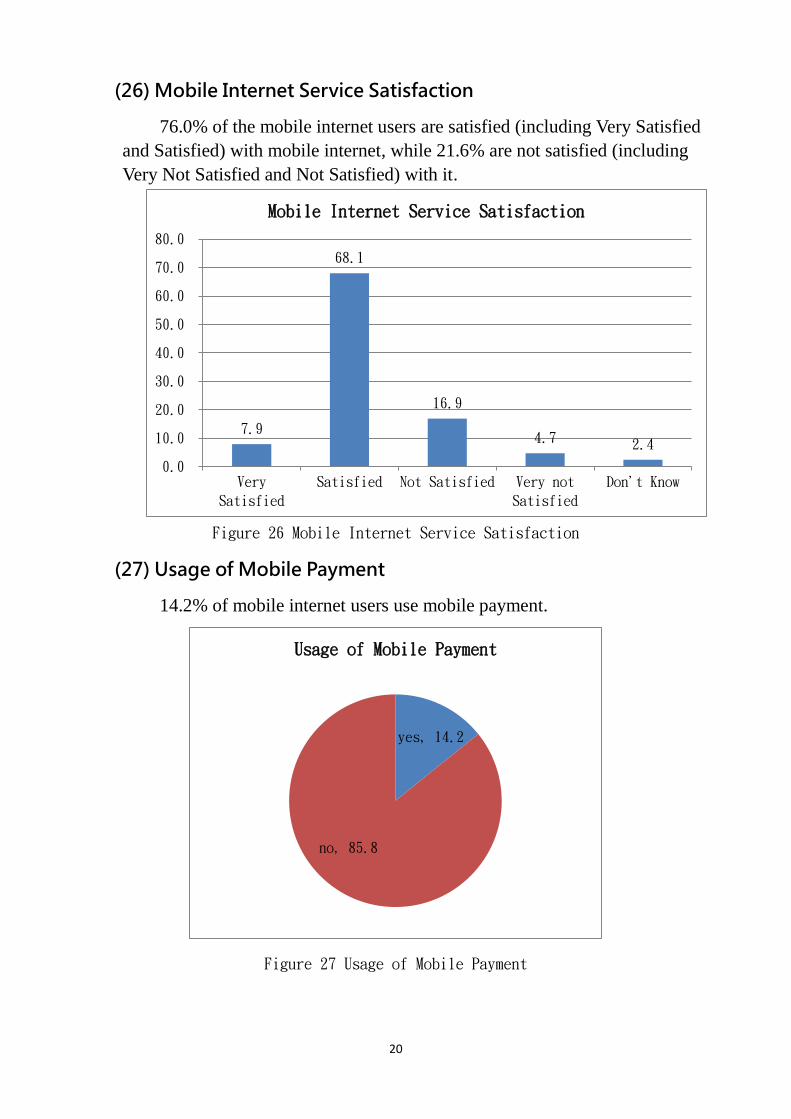
(26) Mobile Internet Service Satisfaction
76.0% of the mobile internet users are satisfied (including Very Satisfied
and Satisfied) with mobile internet, while 21.6% are not satisfied (including
Very Not Satisfied and Not Satisfied) with it.
Figure 26 Mobile Internet Service Satisfaction
(27) Usage of Mobile Payment
14.2% of mobile internet users use mobile payment.
Figure 27 Usage of Mobile Payment
7.9
68.1
16.9
4.7 2.4
0.0
10.0
20.0
30.0
40.0
50.0
60.0
70.0
80.0
Very
Satisfied
Satisfied Not Satisfied Very not
Satisfied
Don't Know
Mobile Internet Service Satisfaction
yes, 14.2
no, 85.8
Usage of Mobile Payment
21
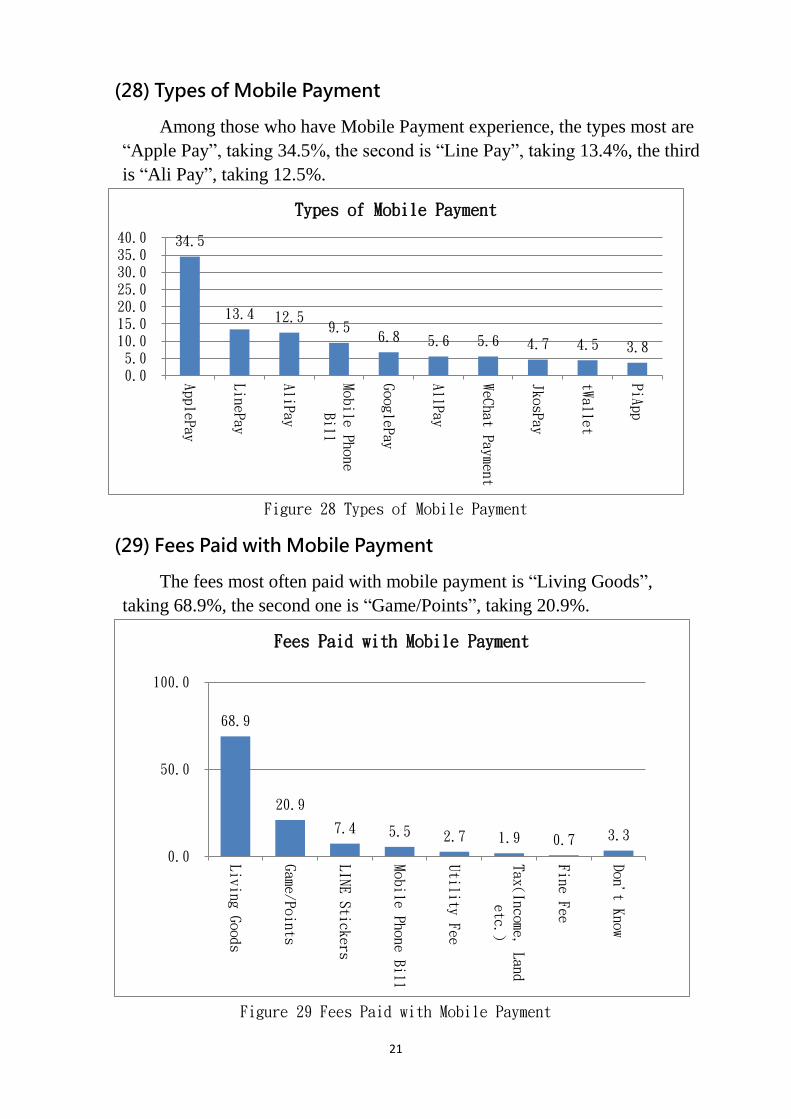
(28) Types of Mobile Payment
Among those who have Mobile Payment experience, the types most are
“Apple Pay”, taking 34.5%, the second is “Line Pay”, taking 13.4%, the third
is “Ali Pay”, taking 12.5%.
Figure 28 Types of Mobile Payment
(29) Fees Paid with Mobile Payment
The fees most often paid with mobile payment is “Living Goods”,
taking 68.9%, the second one is “Game/Points”, taking 20.9%.
Figure 29 Fees Paid with Mobile Payment
34.5
13.4 12.5 9.5
6.8 5.6 5.6 4.7 4.5 3.8
0.05.010.015.020.025.030.035.040.0
ApplePay
LinePay
AliPay
Mobile Phone
Bill
GooglePay
AllPay
WeChat Payment
JkosPay
tWallet
PiApp
Types of Mobile Payment
68.9
20.9
7.4 5.5 2.7 1.9 0.7 3.3
0.0
50.0
100.0
Living Goods
Game/Points
LINE Stickers
Mobile Phone Bill
Utility Fee
Tax(Income, Land
etc.)
Fine Fee
Don't Know
Fees Paid with Mobile Payment
22
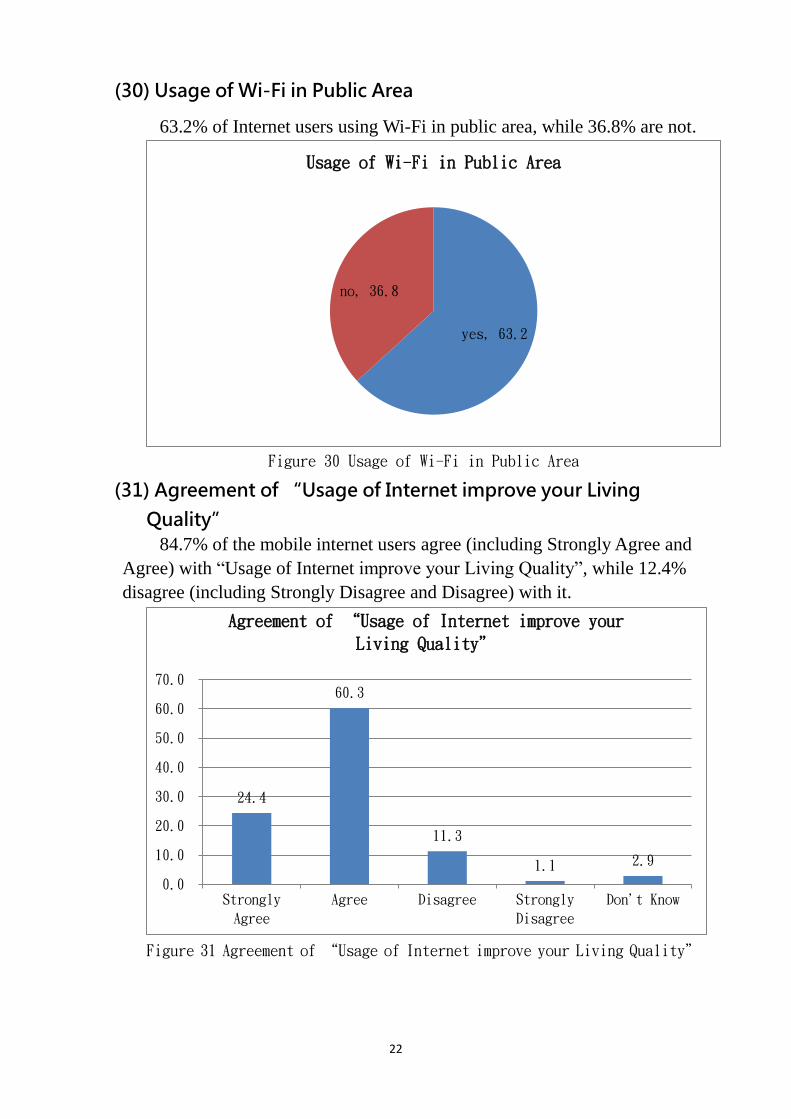
(30) Usage of Wi-Fi in Public Area
63.2% of Internet users using Wi-Fi in public area, while 36.8% are not.
Figure 30 Usage of Wi-Fi in Public Area
(31) Agreement of “Usage of Internet improve your Living
Quality”
84.7% of the mobile internet users agree (including Strongly Agree and
Agree) with “Usage of Internet improve your Living Quality”, while 12.4%
disagree (including Strongly Disagree and Disagree) with it.
Figure 31 Agreement of “Usage of Internet improve your Living Quality”
yes, 63.2
no, 36.8
Usage of Wi-Fi in Public Area
24.4
60.3
11.3
1.1 2.9
0.0
10.0
20.0
30.0
40.0
50.0
60.0
70.0
Strongly
Agree
Agree Disagree Strongly
Disagree
Don't Know
Agreement of “Usage of Internet improve your
Living Quality”
23
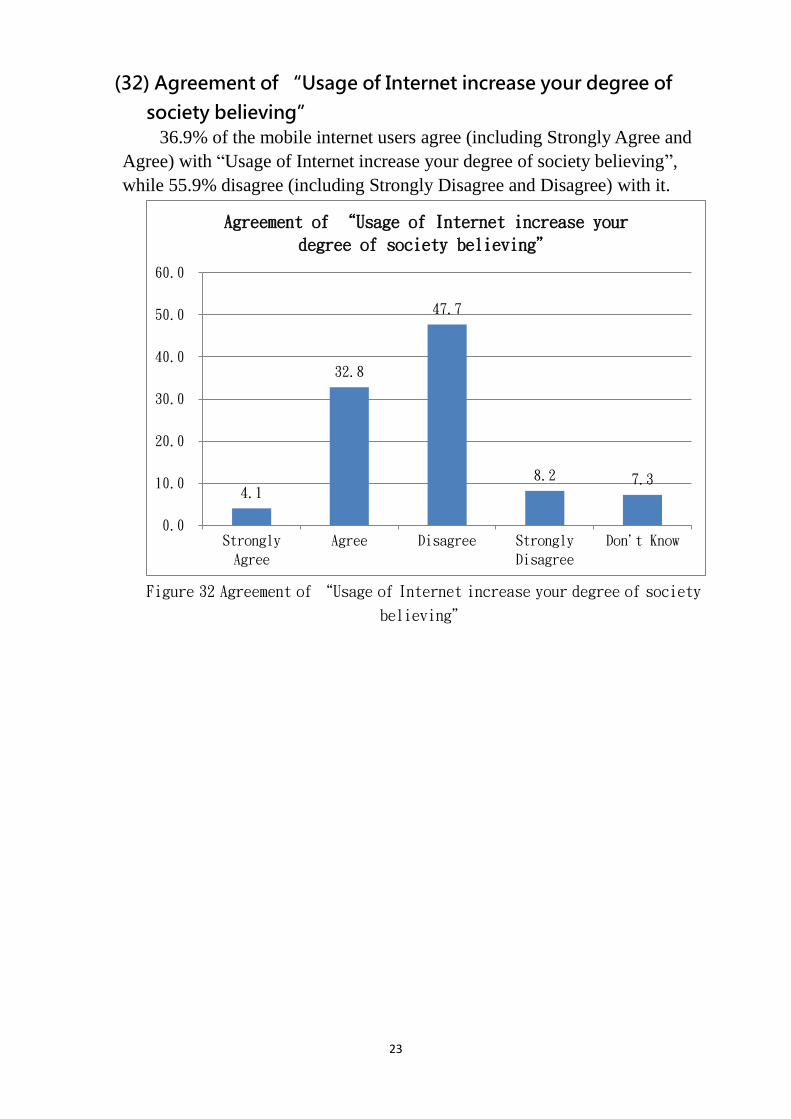
(32) Agreement of “Usage of Internet increase your degree of
society believing”
36.9% of the mobile internet users agree (including Strongly Agree and
Agree) with “Usage of Internet increase your degree of society believing”,
while 55.9% disagree (including Strongly Disagree and Disagree) with it.
Figure 32 Agreement of “Usage of Internet increase your degree of society
believing”
4.1
32.8
47.7
8.2 7.3
0.0
10.0
20.0
30.0
40.0
50.0
60.0
Strongly
Agree
Agree Disagree Strongly
Disagree
Don't Know
Agreement of “Usage of Internet increase your
degree of society believing”
24
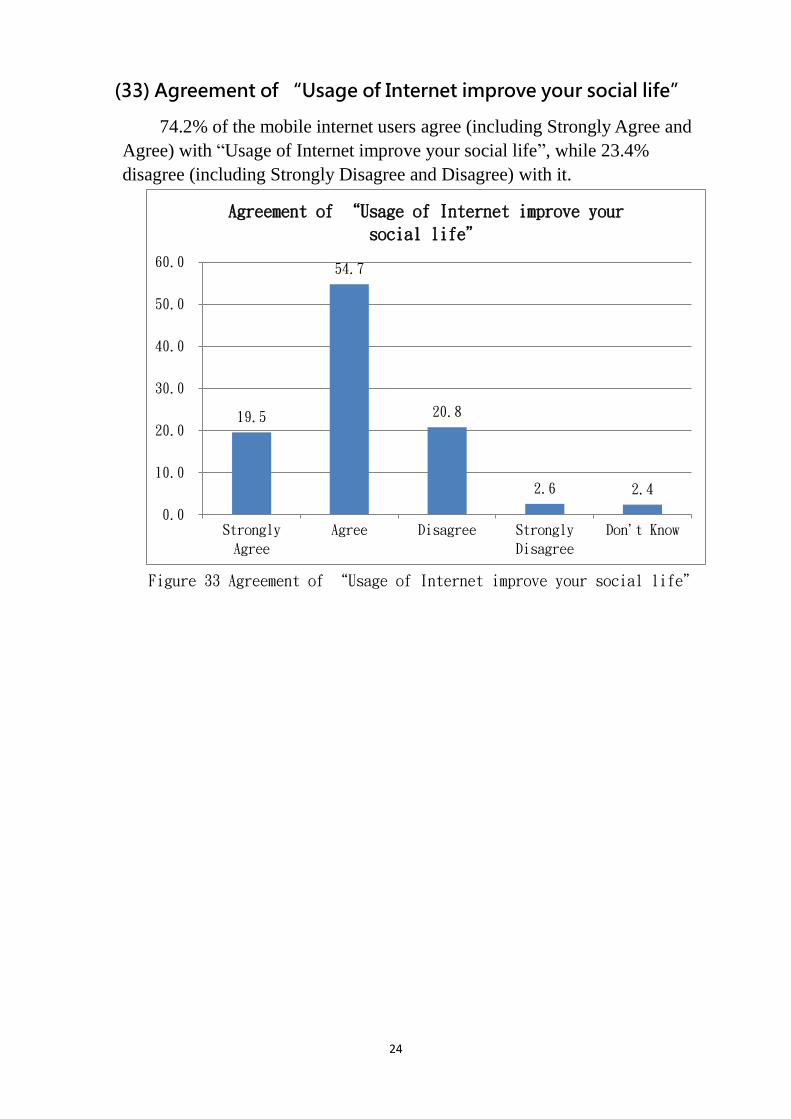
(33) Agreement of “Usage of Internet improve your social life”
74.2% of the mobile internet users agree (including Strongly Agree and
Agree) with “Usage of Internet improve your social life”, while 23.4%
disagree (including Strongly Disagree and Disagree) with it.
Figure 33 Agreement of “Usage of Internet improve your social life”
19.5
54.7
20.8
2.6 2.4
0.0
10.0
20.0
30.0
40.0
50.0
60.0
Strongly
Agree
Agree Disagree Strongly
Disagree
Don't Know
Agreement of “Usage of Internet improve your
social life”
25
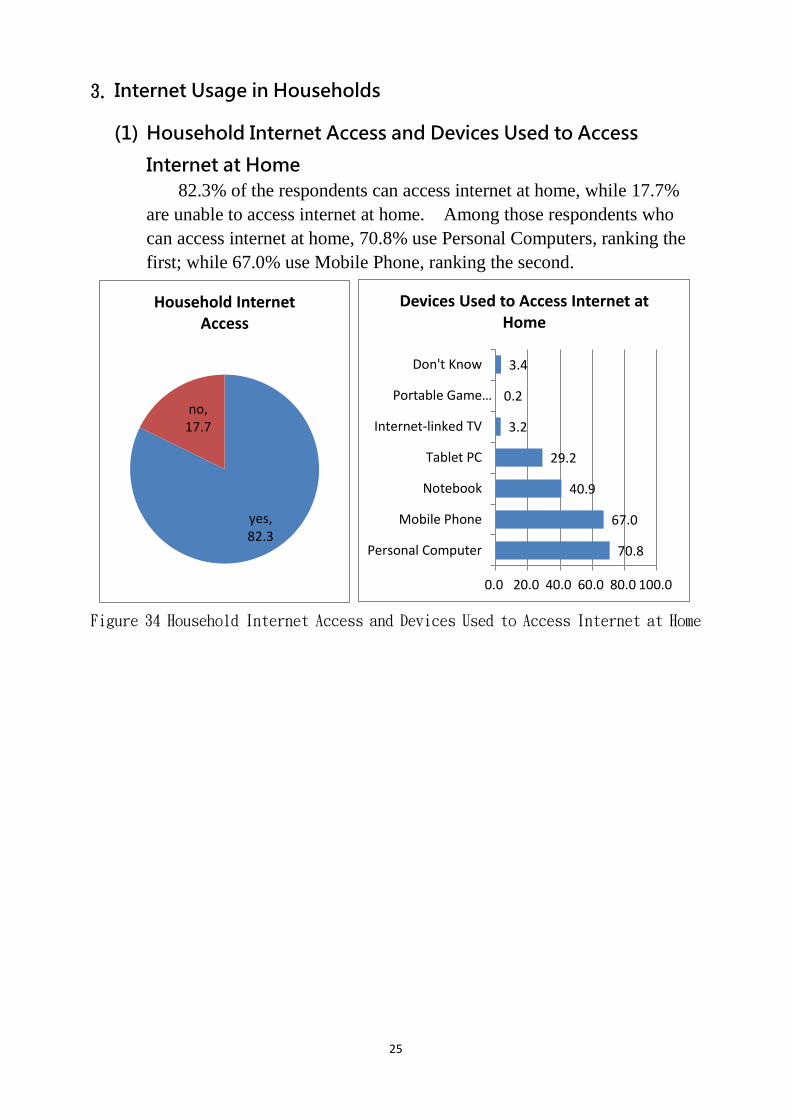
3. Internet Usage in Households
(1) Household Internet Access and Devices Used to Access
Internet at Home
82.3% of the respondents can access internet at home, while 17.7%
are unable to access internet at home. Among those respondents who
can access internet at home, 70.8% use Personal Computers, ranking the
first; while 67.0% use Mobile Phone, ranking the second.
Figure 34 Household Internet Access and Devices Used to Access Internet at Home
yes, 82.3
no, 17.7
Household Internet Access
70.8
67.0
40.9
29.2
3.2
0.2
3.4
0.0 20.0 40.0 60.0 80.0 100.0
Personal Computer
Mobile Phone
Notebook
Tablet PC
Internet-linked TV
Portable Game…
Don't Know
Devices Used to Access Internet at Home
26
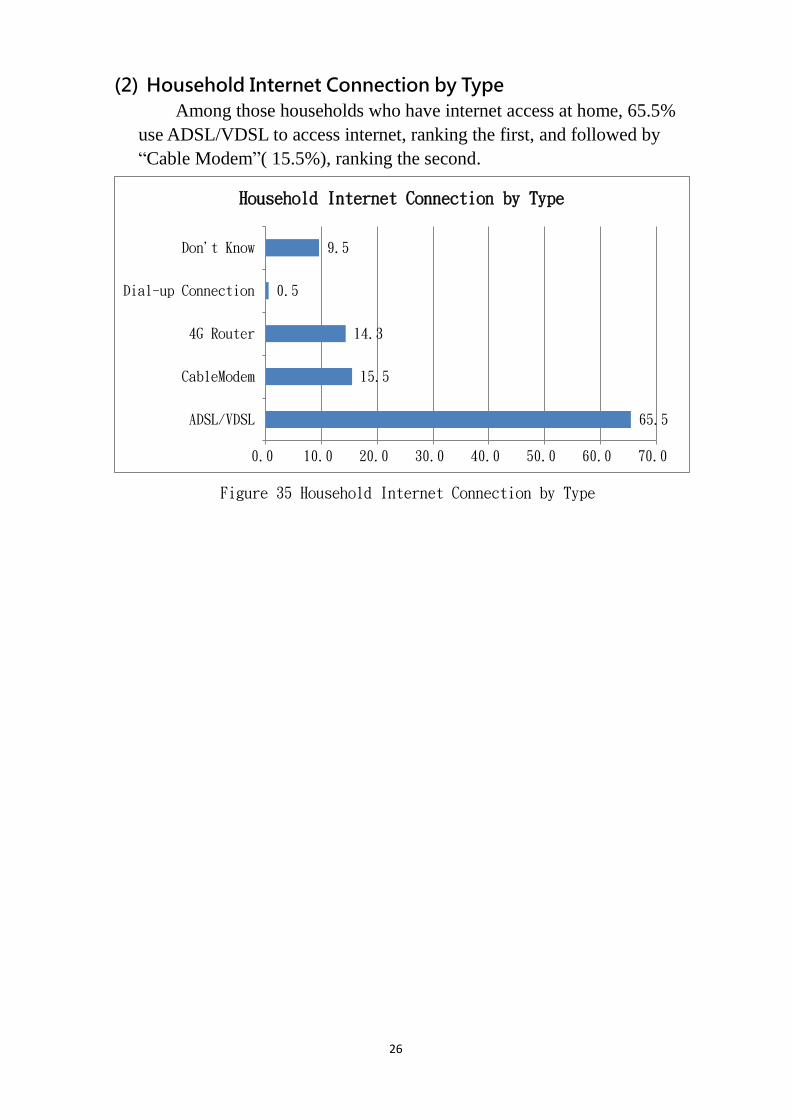
(2) Household Internet Connection by Type
Among those households who have internet access at home, 65.5%
use ADSL/VDSL to access internet, ranking the first, and followed by
“Cable Modem”( 15.5%), ranking the second.
Figure 35 Household Internet Connection by Type
65.5
15.5
14.3
0.5
9.5
0.0 10.0 20.0 30.0 40.0 50.0 60.0 70.0
ADSL/VDSL
CableModem
4G Router
Dial-up Connection
Don't Know
Household Internet Connection by Type