Embed Size (px)
Citation preview

BATS and
Broadband Seismology in Taiwan
Honn KaoPacific Geoscience Centre, Geological Survey of Canada
“A decade+ of research on earthquake science at Taiwan Earthquake Research Center: Now and Beyond”
Taipei, Taiwan, September 19, 2019
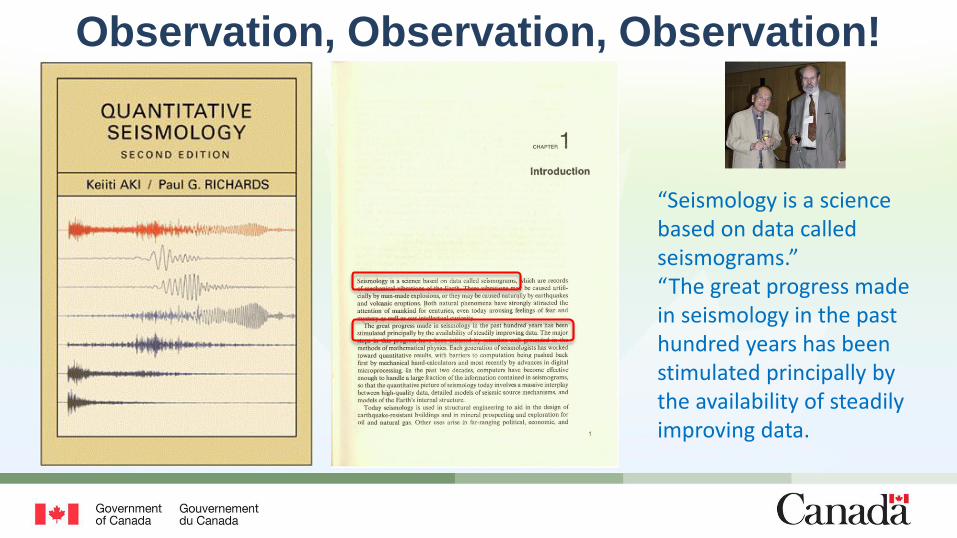
Observation, Observation, Observation!
“Seismology is a science based on data called seismograms.” “The great progress made in seismology in the past hundred years has been stimulated principally by the availability of steadily improving data.

It all started in the 1992 IRIS/SSA meeting…
• Prof. Wang-Ping Chen, Francis T. Wu, and Ta-Liang Teng started the discussion of establishing a broadband seismograph network in Taiwan.
• Prof. Wang-Ping Chen took the main responsibility of preparing a document that was formally approved by the IES’s Advisory Committee Meeting in June 1992.
• Dr. Honn Kao joined IES in 1993, and headed a group of technicians to begin the construction of a broadband seismograph network in Taiwan, later known as the Broadband Array in Taiwan for Seismology (BATS).
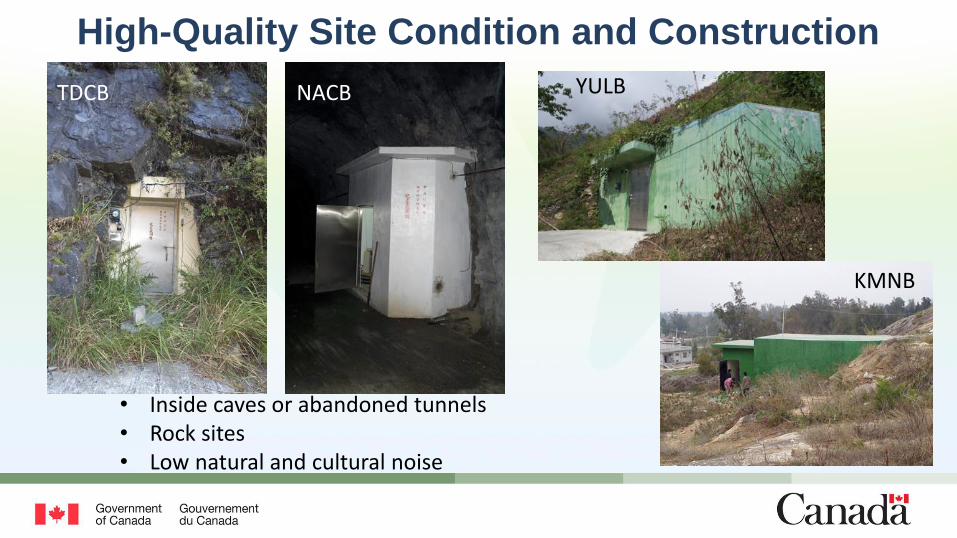
High-Quality Site Condition and Construction
KMNB
YULBNACBTDCB
• Inside caves or abandoned tunnels• Rock sites• Low natural and cultural noise
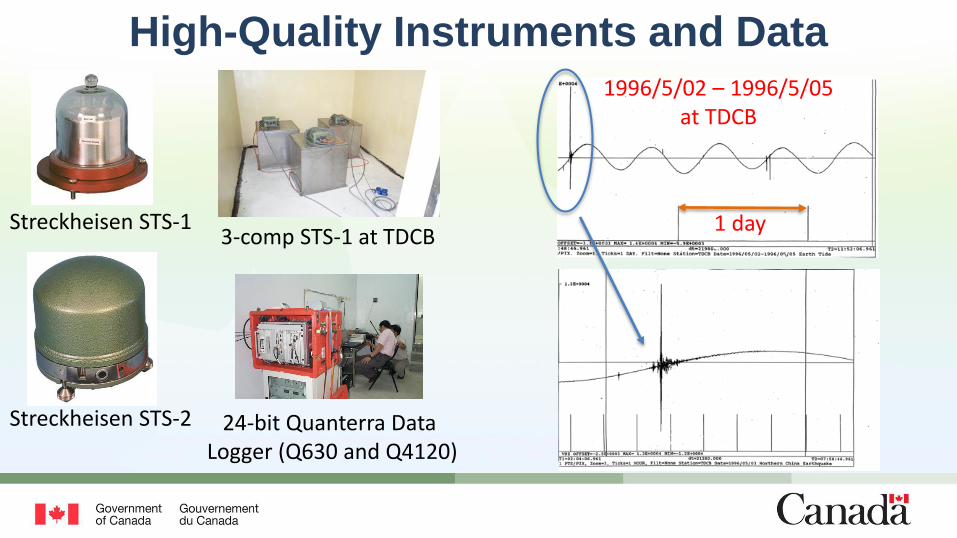
High-Quality Instruments and Data
Streckheisen STS-2
3-comp STS-1 at TDCBStreckheisen STS-1
24-bit Quanterra Data Logger (Q630 and Q4120)
1 day
1996/5/02 – 1996/5/05at TDCB
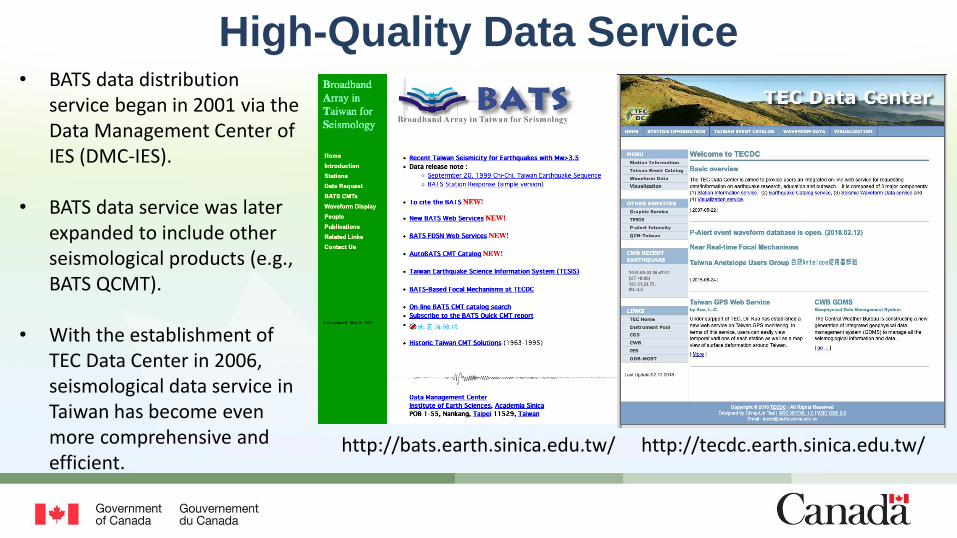
High-Quality Data Service• BATS data distribution
service began in 2001 via the Data Management Center of IES (DMC-IES).
• BATS data service was later expanded to include other seismological products (e.g., BATS QCMT).
• With the establishment of TEC Data Center in 2006, seismological data service in Taiwan has become even more comprehensive and efficient.
http://tecdc.earth.sinica.edu.tw/http://bats.earth.sinica.edu.tw/
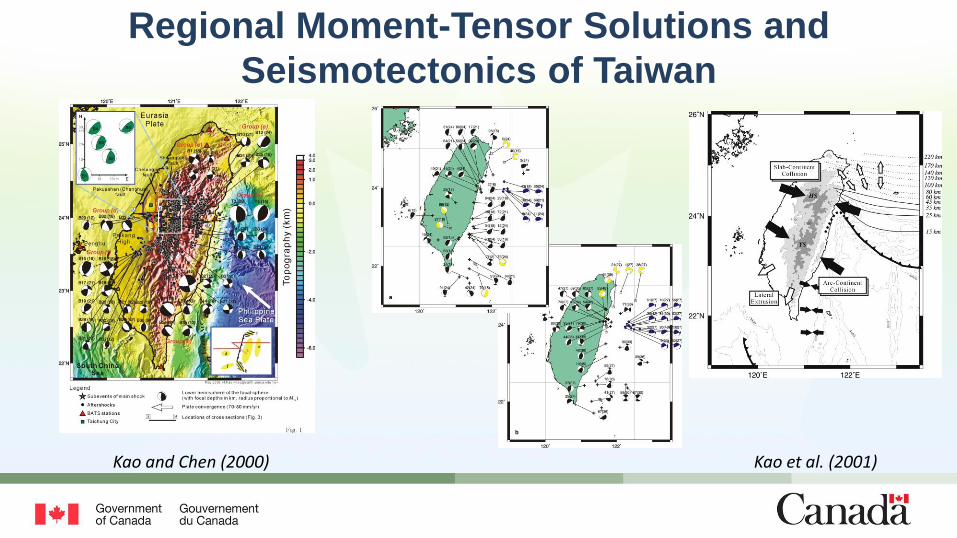
Regional Moment-Tensor Solutions and
Seismotectonics of Taiwan
Kao and Chen (2000) Kao et al. (2001)
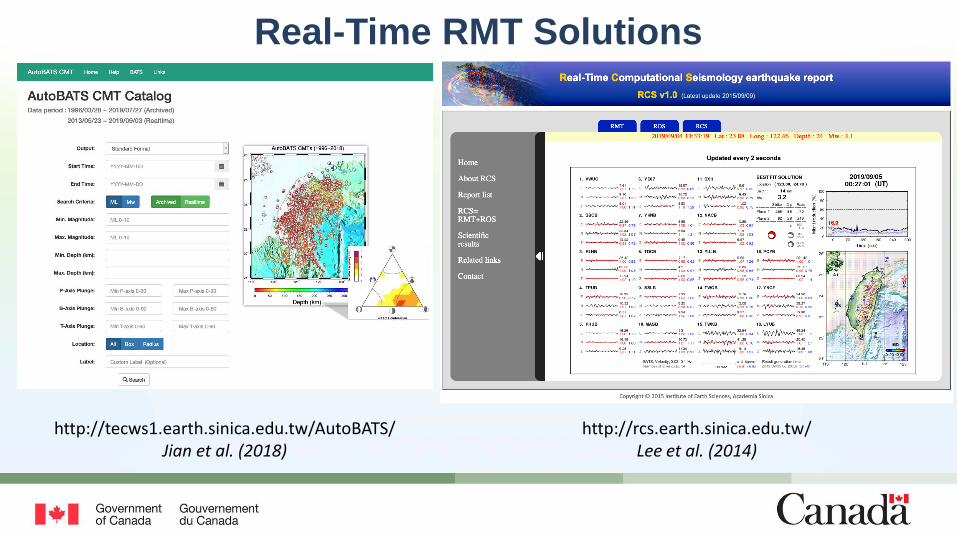
Real-Time RMT Solutions
http://tecws1.earth.sinica.edu.tw/AutoBATS/Jian et al. (2018)
http://rcs.earth.sinica.edu.tw/Lee et al. (2014)
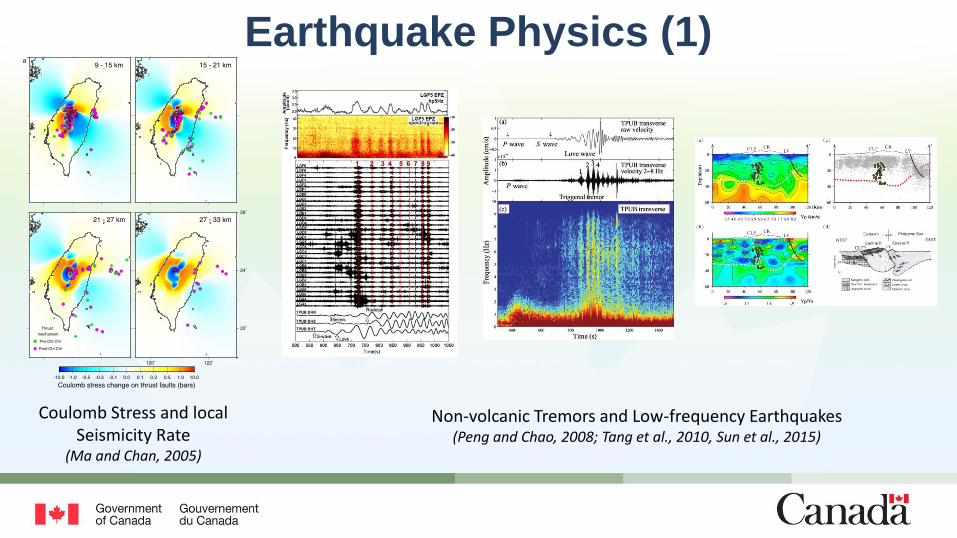
Earthquake Physics (1)
Coulomb Stress and local Seismicity Rate
(Ma and Chan, 2005)
Non-volcanic Tremors and Low-frequency Earthquakes(Peng and Chao, 2008; Tang et al., 2010, Sun et al., 2015)
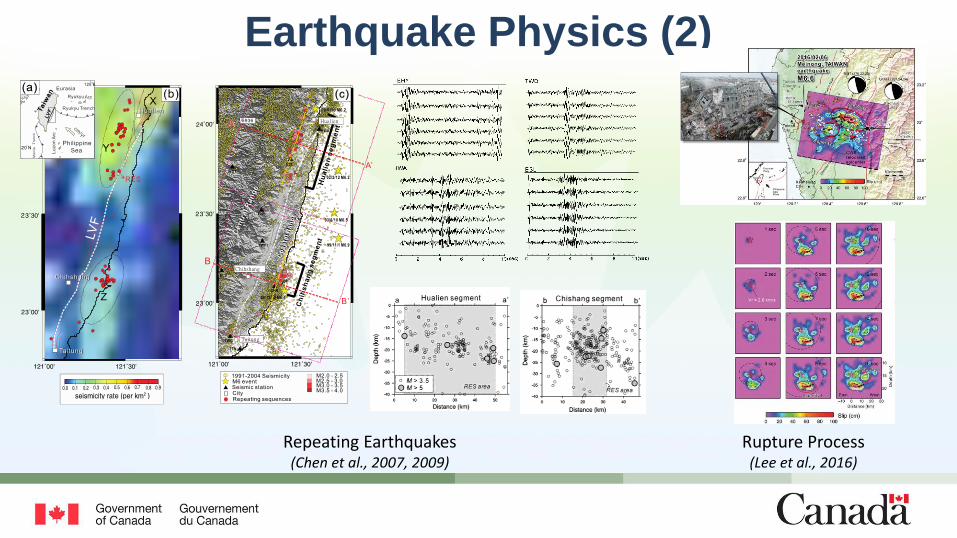
Earthquake Physics (2)
Repeating Earthquakes(Chen et al., 2007, 2009)
Rupture Process(Lee et al., 2016)
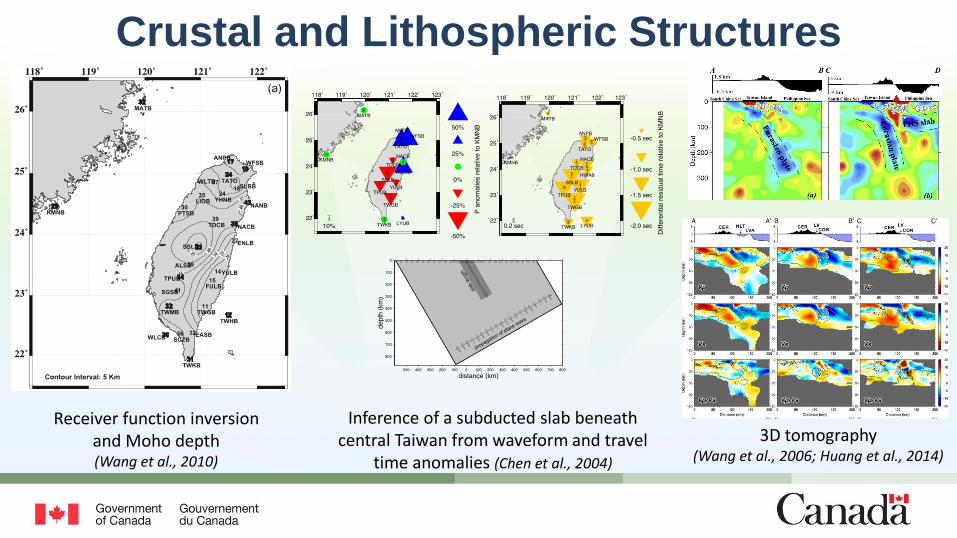
Crustal and Lithospheric Structures
3D tomography(Wang et al., 2006; Huang et al., 2014)
Receiver function inversion and Moho depth(Wang et al., 2010)
Inference of a subducted slab beneath central Taiwan from waveform and travel
time anomalies (Chen et al., 2004)
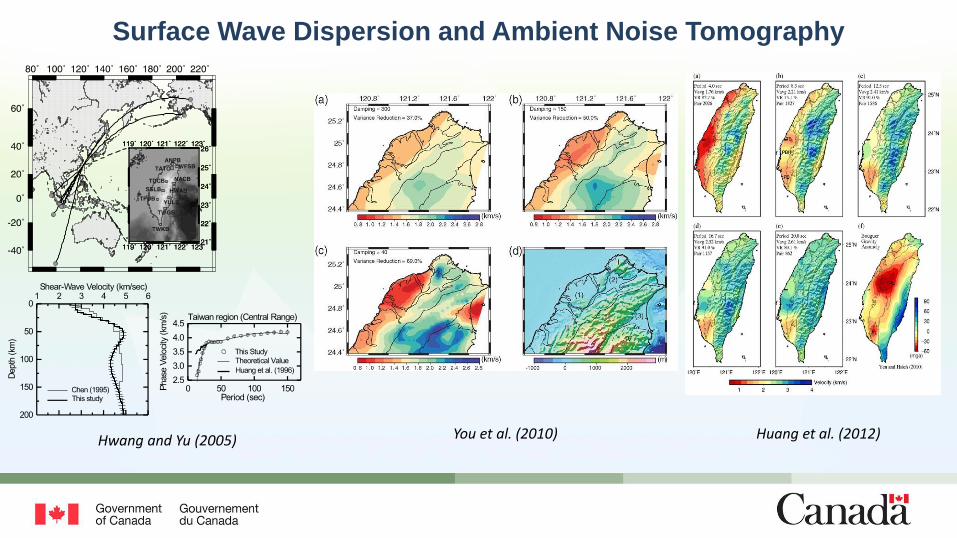
Surface Wave Dispersion and Ambient Noise Tomography
Huang et al. (2012)You et al. (2010)Hwang and Yu (2005)
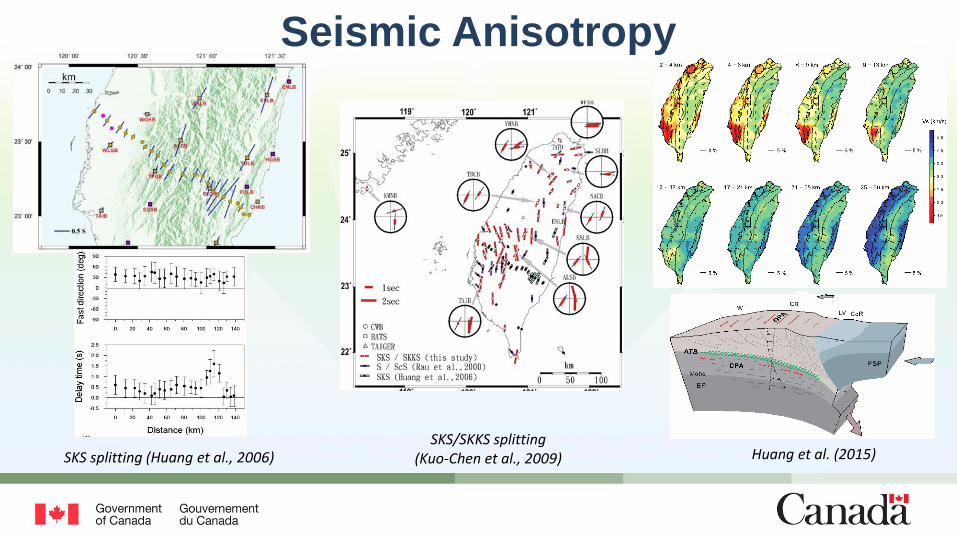
Seismic Anisotropy
Huang et al. (2015)SKS/SKKS splitting
(Kuo-Chen et al., 2009)SKS splitting (Huang et al., 2006)
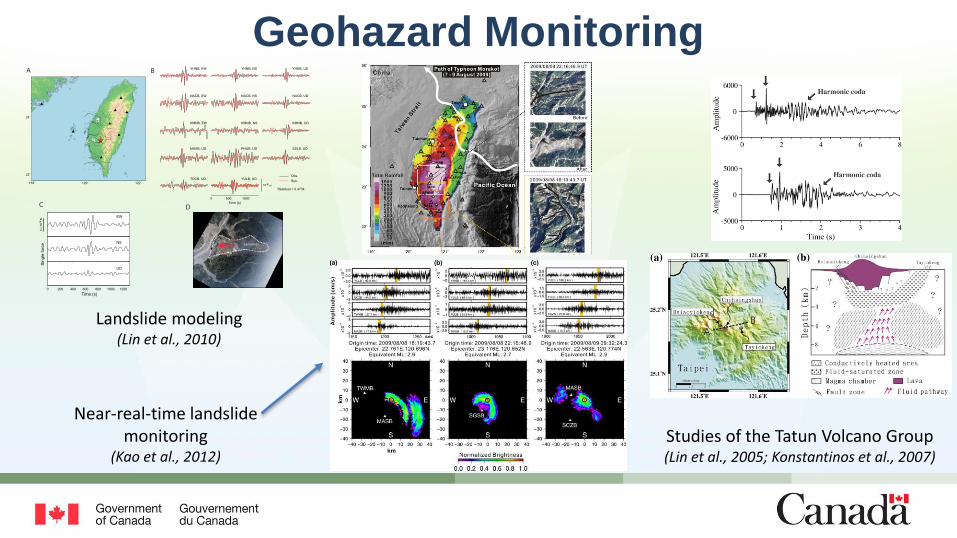
Geohazard Monitoringfiner grids and time steps are adopted to obtain the optimal time-
location combination (4-km interval at 1-s time step in the second
stage and 1 km at 0.1 s in the third). Because the fine scanning is
limited to the vicinity of the best solution(s) obtained in the previous
stage, the required processing time can be greatly reduced to satisfy
the criterion of near-real-time monitoring.
Representative examples
The SSA analysis of the tremor-like waveforms recorded during the
passage of typhoon Morakot pinpoints the source locations to within
a few km from the places where large-scale LMDF are later identified
on satellite images (Figs. 1 and 5). The determined origin times of
these events are also consistent with the accounts of LMDF survivors,
as reported by the local news media. For all LMDF we have studied,
final solutions were obtained within 2 min from the start of SSA
calculation. Based on the determined source parameters and the
observed maximum amplitudes measured from individual seismo-
grams, the equivalent seismic magnitudes of the LMDF events were
estimated to range from ML of ∼2.2 to 2.9.
Three representative examples of locating LMDF using SSA are
shown in Fig. 5. For each event, a snapshot of the normalized
brightness function at the estimated origin time is plotted in the
lower panel to illuminate the source distribution. The brightest spot,
marked by a star, is deemed to be the most likely location (i.e., the
centroid) of each LMDF event because it best matches the arrivals of
large bursts of seismic energy at multiple stations (upper panel,
Fig. 5). It is important to realize that the observed multiple bursts
in LMDF waveforms may be associated with sources scattered over a
finite time and space. While theoretically it is possible to delineate a
complete spatiotemporal distribution of all sources (Kao and Shan
2007), in reality smaller sources can be difficult to identify, and their
solutions often have large uncertainties due to imperfect station
coverage and poor waveform quality (i.e., insufficient signal-to-noise
ratios). Our results indicate that the brightest spot of an SSA image
can reasonably represent the bulk location of a LMDF event where
subsequent rescue operations, if needed, should be given top
priority.
Discussion and conclusion
Since SSA is a mapping process that translates the observed seismic
amplitudes from the time-space domain at stations to the time-space
domain at the source (Kao and Shan 2004), each seismic burst can
correspond to an infinite number of sources as long as the observed
arrival time is consistent with the assumed combinations of origin
time and epicenter. Only the assumed origin time and epicenter that
correspond to the true source can, however, correctly predict the
arrival of large amplitudes at multiple stations. In other words, the
accuracy of SSA solutions can be rapidly improved in a near-real-
time system as additional waveforms from nearby stations are in-
crementally added to the analysis.
While the brightest spots on the SSA images (Fig. 5) are inter-
preted as the centroid locations of the corresponding LMDF, isolated
Fig. 5 Representative examples of LMDFepicenters located from real-time seismic observations using SSA: a one of the earliest induced LMDF, b that responsible for themost casualties, and c that with the largest equivalent seismic magnitude. Source scanning is done in three stages with increasing time and space resolution to maximizecalculation efficiency. Orange bars mark the predicted arrival times at selected stations from the determined origin times and epicenters. Snapshots of the normalizedbrightness functions at the corresponding origin times are shown in the lower panel. The most likely locations of LMDF sources are illuminated as the brightest spots(encircled). Triangles mark the locations of nearby broadband seismic stations
Technical Note
Landslides 9 &(2012)562
Author's personal copy
(presumably corresponding to primary waves, blue traces,
Fig. 2) and to the horizontal plane (presumably shear waves,
red traces, Fig. 2), respectively.
Our results suggest that the most characteristic feature of
LMDF waveforms is the frequent switch between high and low
dip angles of the particle motions (light blue and pink strips,
respectively; Fig. 2). This is in sharp contrast to the pattern of
an ordinary local earthquake whose P and S wave trains can
be easily recognized (Fig. 2c). In some cases, the LMDF wave-
forms appear to have equal amounts of P and S energies
(yellow stripes, Fig. 2), but most such occasions are observed
in the middle portion of LMDF signals where the amplitudes
are relatively large.
The intermitten t bursts of P and S phases are obviously
related to the dynamic history of individual LMDF events. As
an LMDF event is initiated, the downward-sliding mass interacts
Fig. 1 Map showing the path of typhoon Morakot across Taiwan in Aug 2009. Stars mark epicenters of typhoon-induced large-scale LMDFas determined by this study.Satellite images before and after Morakot for three representative cases (white stars) are shown with dashed white lines marking the approximate perimeters of thecorresponding LMDF. Thick lines with arrows indicate the general directions of mass flow. Large rectangles on the map correspond to the boundaries of sourceimages shown in Fig. 5. Open triangles mark the station locations of the BATS. Major cities in Taiwan are marked by white squares
Technical Note
Landslides 9 &(2012)558
Author's personal copy
Landslide modeling(Lin et al., 2010)
Near-real-time landslide monitoring
(Kao et al., 2012)Studies of the Tatun Volcano Group(Lin et al., 2005; Konstantinos et al., 2007)

Some Final Remarks• Innovation has nothing to do with how many R & D dollars you
have. When Apple came up with the Mac, IBM was spending at least 100 times more on R & D. It's not about money. It's about the people you have, how you're led, and how much you get it. -- Steve Jobs
• As scientists, we step on the shoulders of science, building on the work that has come before us - aiming to inspire a new generation of young scientists to continue once we are gone. -- Stephen Hawking
• Good luck is when opportunity meets preparation, while bad luck is when lack of preparation meets reality. -- Eliyahu Goldratt
ReferencesChen, K. H., Nadeau, R. M., & Rau, R.-J. (2007). Towards a universal rule on the recurrence interval scaling of repeating earthquakes? Geophysical Research Letters, 34(16). doi:10.1029/2007GL030554.Chen, K. H., Rau, R. J., & Hu, J. C. (2009). Variability of repeating earthquake behavior along the Longitudinal Valley fault zone of eastern Taiwan. Journal of Geophysical Research: Solid Earth, 114 B05306.
doi:10.1029/2007JB005518.Chen, P.-F., Huang, B.-S., & Liang, W.-T. (2004). Evidence of a slab of subducted lithosphere beneath central Taiwan from seismic waveforms and travel times. Earth Planet. Sci. Lett., 229,
doi:10.1016/j.epsl.2004.1010.1031.Huang, B.-S., Huang, W.-G., Liang, W.-T., Rau, R.-J., & Hirata, N. (2006). Anisotropy beneath an active collision orogen of Taiwan: Results from across islands array observations. Geophys. Res. Lett., 33, L24302,
doi:24310.21029/22006GL027844.Huang, T.-Y., Gung, Y., Liang, W.-T., Chiao, L.-Y., & Teng, L. S. (2012). Broad-band Rayleigh wave tomography of Taiwan and its implications on gravity anomalies. Geophysical Research Letters, 39(5).
doi:10.1029/2011GL050727.Huang, H.-H., Wu, Y.-M., Song, X., Chang, C.-H., Lee, S.-J., Chang, T.-M., & Hsieh, H.-H. (2014). Joint Vp and Vs tomography of Taiwan: Implications for subduction-collision orogeny. Earth and Planetary Science
Letters, 392, 177-191. doi:10.1016/j.epsl.2014.02.026.Huang, T. Y., Gung, Y., Kuo, B. Y., Chiao, L. Y., & Chen, Y. N. (2015). Layered deformation in the Taiwan orogen. Science, 349(6249), 720. doi:10.1126/science.aab1879.Hwang, R.-D., & Yu, G.-K. (2005). Shear-wave velocity structure of upper mantle under Taiwan from the array analysis of surface waves. Geophysical Research Letters, 32(7). doi:10.1029/2004GL021868.Jian, P. R., Tseng, T. L., Liang, W. T., & Huang, P. H. (2018). A New automatic full‐waveform regional moment tensor inversion algorithm and its applications in the Taiwan area. Bulletin of the Seismological Society of
America, 108(2), 573-587. doi:10.1785/0120170231.Kao, H., & Chen, W.-P. (2000). The Chi-Chi earthquake sequence: Active, out-of-sequence thrust faulting in Taiwan. Science, 30, 2346-2349.Kao, H., & Jian, P.-R. (2001). Seismogenic patterns in the Taiwan region; insights from source parameter inversion of BATS data. Tectonophysics, 333(1-2), 179-198.Kao, H., Kan, C.-W., Chen, R.-Y., Chang, C.-H., Rosenberger, A., Shin, T.-C., . . . Liang, W.-T. (2012). Locating, monitoring, and characterizing typhoon-induced landslides with real-time seismic signals. Landslides, 9,
557-563. doi:10.1007/s10346-012-0322-z.Konstantinou, K. I., Lin, C.-H., & Liang, W.-T. (2007). Seismicity characteristics of a potentially active Quaternary volcano: The Tatun Volcano Group, northern Taiwan. Journal of Volcanology and Geothermal
Research, 160(3), 300-318. doi:10.1016/j.jvolgeores.2006.09.009.Kuo-Chen, H., Wu, F. T., Okaya, D., Huang, B.-S., & Liang, W.-T. (2009). SKS/SKKS splitting and Taiwan orogeny. Geophysical Research Letters, 36(12). doi:10.1029/2009GL038148.Lee, S.-J., Liang, W.-T., Cheng, H.-W., Tu, F.-S., Ma, K.-F., Tsuruoka, H., . . . Liu, C.-C. (2014). Towards real-time regional earthquake simulation I: real-time moment tensor monitoring (RMT) for regional events in
Taiwan. Geophysical Journal International, 196(1), 432-446. doi:10.1093/gji/ggt371.Lee, S. J., Yeh, T. Y., & Lin, Y. Y. (2016). Anomalously Large Ground Motion in the 2016 ML 6.6 Meinong, Taiwan, Earthquake: A Synergy Effect of Source Rupture and Site Amplification. Seismological Research
Letters, 87(6), 1319-1326. doi:10.1785/0220160082.Lin, C.-H., Konstantinou, K. I., Pu, H.-C., Hsu, C.-C., Lin, Y.-M., You, S.-H., & Huang, Y.-P. (2005). Preliminary results from seismic monitoring at the Tatun Volcanic Area of Northern Tanwan. Terr. Atmos. Ocean. Sci.,
16(3), 563-577.Lin, C. H., Kumagai, H., Ando, M., & Shin, T. C. (2010). Detection of landslides and submarine slumps using broadband seismic networks. Geophysical Research Letters, 37(22). doi:10.1029/2010GL044685.Ma, K.-F., Chan, C.-H., & Stein, R. S. (2005). Response of seismicity to Coulomb stress triggers and shadows of the 1999 Mw=7.6 Chi-Chi, Taiwan, earthquake. Journal of Geophysical Research: Solid Earth, 110(B05),
B05S19, doi:10.1029/2004JB003389.Peng, Z., & Chao, K. (2008). Non-volcanic tremor beneath the Central Range in Taiwan triggered by the 2001 Mw 7.8 Kunlun earthquake. Geophys. J. Int., 175(2), doi:10.1111/j.1365-1246X.2008.03886.x.Sun, W. F., Peng, Z., Lin, C. H., & Chao, K. (2015). Detecting Deep Tectonic Tremor in Taiwan with a Dense ArrayDetecting Deep Tectonic Tremor in Taiwan with a Dense Array. Bulletin of the Seismological Society of
America, 105(3), 1349-1358. doi:10.1785/0120140258.Tang, C.-C., Peng, Z., Chao, K., Chen, C.-H., & Lin, C.-H. (2010). Detecting low-frequency earthquakes within non-volcanic tremor in southern Taiwan triggered by the 2005 Mw8.6 Nias earthquake. Geophysical
Research Letters, 37(16), L16307. doi:10.1029/2010gl043918.Wang, H.-L., Zhu, L., & Chen, H.-W. (2010). Moho depth variation in Taiwan from teleseismic receiver functions. Journal of Asian Earth Sciences, 37(3), 286-291. doi:10.1016/j.jseaes.2009.08.015.Wang, Z., Zhao, D., Wang, J., & Kao, H. (2006). Tomographic evidence for the Eurasian lithosphere subducting beneath south Taiwan. Geophys. Res. Lett., 33, L18306, doi:18310.11029/12006GL027166.You, S.-H., Gung, Y., Chiao, L.-Y., Chen, Y.-N., Lin, C.-H., Liang, W.-T., & Chen, Y.-L. (2010). Multiscale Ambient Noise Tomography of Short-Period Rayleigh Waves across Northern Taiwan. Bulletin of the Seismological
Society of America, 100(6), 3165-3173. doi:10.1785/0120090394