Embed Size (px)
Citation preview

1
A survey-based choice experiment on the local elite’s demand for development
Baris Karapinar, Arbinda Lal Bhomi, Nicola Cantore, Ali Carkoglu, Paulo Cunha, Prem Misir
Working draft (to be submitted to the Journal of Development Economics). Please do not quote.
Abstract
Little rigorous evidence exists about the properties of local demand for development measured
against various international goals propagated by the United Nations and other donor agencies.
This paper uses an elite survey including a choice experiment to evaluate the income and price
elasticity of stated demand for 14 development areas in Guyana, Malawi, Nepal, Sierra Leone and
Turkey. The Almost Ideal Demand System (AIDS) models for primary and secondary areas of
development are estimated. While the primary set, including education, HIV/AIDS and power
infrastructure, is inelastic to increases in income, the secondary set, including biodiversity, clean
air and forest protection, is mostly income elastic. In addition, non-monetary factors such as the
elite’s professional affiliation, education and gender, are found to exhibit stronger influence on
their demand for the secondary set than the primary set. These findings suggest that, despite the
recent efforts to widen the scope of international development goals, the local elite’s demand
priorities will continue to lie with the primary areas of development, which may lead to important
policy implications.
1. Introduction
Development goals, most notably exemplified by the “Millennium Development Goals (MDGs)”
and the recent “Sustainable Development Goals (SDGs),” have been a dominant feature of the
policy discourse of international development since the early 2000s. How these goals are defined
and formulated, their effectiveness as performance measures, and whether they influence the
actual allocation decisions by donors or governments have been extensively studied (e.g. Saith,
2006; Collier, 2007; Easterly, 2009; Vandemoortele, 2009). Similarly, the lack of local participation
in the goal setting process and of “local ownership” in implementation have been pointed as a
major weakness of the institutional arrangement around these goals. On the supply side this
might be due to the hierarchical setting of the international agencies involved. On the demand
side, however, there is little rigorous evidence about the local demand for development as
framed by these goals.
The objective of this paper is to study the income and cost elasticity of the local elite’s demand for
development by using an electronic survey including a choice experiment. We use a unique
individual level data on the elite of five developing countries, which was gathered from a
hypothetical choice experiment on 14 development goals. In repeated choice sets, the
respondents were asked to allocate a budget on a list of development goals where the relative
2
costs of achieving the goals – calculated based on the estimation of actual costs in each country –
and the relative income changed in each set. By using the Almost Ideal Demand System (AIDS),
we can identify the effect of cost and income on stated demand for development, controlling for
non-monetary factors.
We have estimated the AIDS models for two set of development goals. The first set of seven
goals, i.e. the MDGs, covered primary education, child health, HIV/AIDS treatment, clean water,
electricity, and communication infrastructure. The second set of seven goals, i.e. the SDGs,
related to forest protection, clean water, clean air, biodiversity conservation, renewable energy,
disaster preparedness, and adaptation to climate change in agriculture. A goal related to access
to clean water and sanitation was included in both sets in order to be able to compare the
demand systems for the primary and secondary sets.
Our sample of countries included five developing countries, namely Guyana, Malawi, Nepal, Sierra
Leone and Turkey, which were identified through structural sampling based on country rankings
in the United Nations’ Human Development Index (HDI) (UNDP, 2014).1 In each country, our
respondent sample, the local elite, included a wide range of policy-makers, including Members of
Parliament, ministers, a Prime Minister, executives of domestic and international NGOs, donor
agencies, mass media, private sector, and academic institutions. Given that it was an elite survey,
the majority of respondents had high levels of educational attainment and they had executive
positions. As much as 96% of respondents had either graduate or post-graduate education and
almost 90% of them supervised other people at work.
We acknowledge that there might be non-systematic selection biases in our sample, and there
could be inevitable discrepancies between the respondents’ actual and stated preferences. Our
choice experiment measured only the latter. We employed a number of consistency tests and
filtered responses that were identified as inconsistent. The interactive nature of the user interface
of the electronic survey allowed for dynamic randomisation of choice sets and ranking questions.
We believe that our findings could serve as a good indicative of the local elite’s demand for
development in the selected countries. It might also offer a complement to other studies on
actual behaviour of decision makers.
This paper is organized as follows. Section 2 describes the survey. Section 3 briefly explains the
econometric model that was used to analyse the results of the choice experiment. Section 4
offers descriptive and econometric analysis of the results. Section 5 discusses some policy
implications. Section 6 concludes.
1 The structural sampling was undertaken following this procedure: the two countries on the top and the
bottom of the developing country category of the 2008 HDI index (the latest ranking available at the outset of this research), namely Turkey and Sierra Leone, were first selected. Then the ranking range between the two countries was divided into equal 6 pieces, which produced a list of 7 countries. In addition to the five countries listed above Georgia and the Sao Tome and Principe were originally included in the sample. However Georgia was later removed from the survey, given that it had rapidly moved from the 96
th place in
2008 (indicating Medium Level of Human development) to 75th place in 2011 (indicating High Level of Human Development) on the HDI index (which could be due to the impact of the Russia-Georgia war in 2008). Since the sampling of the countries was based on the initial ranking of the countries on the HDI index, the rapid shift in Georgia’s ranking created a bias in the distribution of countries. Sao Tome and Principe was also dropped out of the survey due to the difficulties associated with the small island’s poor internet infrastructure. A pilot study in the country with a questionnaire that had been translated to Portuguese, proved that it would not be feasible to conduct the online survey in the country.

3
2. Econometric model
In one stage budgeting procedure, the respondents allocated their budget to two sets of seven
developing goals. For each set, they perform 4 allocation tasks, each starting with a hypothetical
budget of US$ 10.000. Accordingly the demand for each development goal is determined by the
cost of achieving individual goals and the total budget allocable. We use the almost ideal demand
system (AIDS) (Deaton and Muellbauer, 1980), which is a widely used model in estimating
consumer demand. The model allows for the parametric imposition of conditions such as
homogeneity and symmetry which ensure the consistency of the model with consumer theory.
The AIDS model generates demand equations which are then used to estimate price and income
elasticities.
The AIDS in budget share is as follows:
(
) ∑
where is the i’th budget share estimated as the share of the amount allocated to the i’th goal
by respondents, are normalized prices, in this study the estimated unit cost of the j’th goal,
are expenditure coefficients, are price (cost) coefficients and M is the total expenditure
on all goals, US$10.000 in this case. P is an aggregate price index. We use the Stone Geometric
Price Index which can be formulated as:
∑
The adding up restriction requires that the budget share of demand functions add up to unity:
∑
Since the budget shares of the seven goals in the choice experiment sum up to unity, it is automatically satisfied in our study.
The homogeneity condition requires that the quantity demanded remains unchanged if all prices
and income increase by the same proportion, expressed as:
∑
and the symmetry condition requires that cross price (cost) elasticities are equal :
∑
∑

4
Both the homogeneity and symmetry conditions are parametrically imposed.
Upon the estimation of income and price coefficients, uncompensated (Marshallian) and
compensated (Hicksian) expenditure elasticities and price elasticities for all development goals
are calculated by using the following formulas:
(
)
(
) (
)
(
)
where is the Kronecker delta ( = 1 for i = j and = 0 if i =j). The Hicksian elasticities for
good i with respect to j are calculated from the Marshallian price elasticities using the Slutsky
equation as:
=
Although the AIDS model is applied to estimate consumption behaviour of a rational agent mainly
in relation to consumer goods, there are also examples whereby it has been used to estimate
allocation patterns in government budgets and voting behaviour (Blanciforti and Green, 1983;
Tridimas, 2001; Deacon, 1978; Nzumaa and Sarkerb, 2010; Verbeke and Ward 2001; Srivastava
and Harris, 2011). Nevertheless, to our knowledge, this is the first time it is applied to estimate
political preferences obtained through a choice experiment.
3. The survey
We used an electronic survey-based choice experiment to measure the elite’s stated cost and
income elasticity of demand for development. The questionnaire included four parts: the first part
contained general statements about the challenges of development, where the respondents were
asked to rank various development goals according to their perceived importance and priority;
the second part consisted of a budget allocation exercise, where they were asked to allocate a
budget on different development goals; the third part included a number of questions and
ranking exercises on donor agencies and related development activities, and the fourth part
included a number of socio-economic questions about the respondents.
The sample of respondents was selected, stratified by institutional affiliation, according to
predetermined objective criteria . For seven stakeholder groups in each country, namely public
sector (Members of Parliament, executives in development-related ministries), executives
working for major domestic and international NGOs, main donors operating in the country, mass

5
media, private sector, and academics from universities and research institutions were listed. Local
experts were also involved in extending our sample list in each country. Since this was a limited
scope elite survey, our sample was not representative, albeit covering a wide array of important
stakeholders in the selected countries.
Potential respondents’ personal email addresses were identified through invitation letters and
phone calls. The electronic survey was sent only to individuals with personal email accounts. After
a pilot study conducted in Nepal and Turkey, the electronic questionnaires in English for Malawi
and Sierra Leone, in Preeti for Nepal, and in Turkish for Turkey were sent out in June 2012 (for the
questionnaire, see Appendix B). The respondents were informed about the academic nature of
the study, its objectives and the source of its funding. They were reminded that the opinions
expressed in the questionnaire did not have to correspond with the official opinion of the
institution they worked for and that all responses would remain anonymous and confidential.
They were informed that the data collected during the study would be stored on a secure server
and would only be accessed by the researchers of the study.
The choice experiment
In the survey-based choice experiment, the respondents were asked to allocate a budget on
different development areas. In total, 8 allocation tasks were performed: 4 tasks for the first set
of 7 development goals, and 4 tasks for the second set of 7 development gaols. The allocation
exercise was described to respondents as though they were in a position to allocate financial
resources to 4 different hypothetical “communities” with different development needs. Assuming
that these communities have a population of 1000 each, the respondents would allocate US
$10,000 available to a list of 7 development goals in each community.
Before the allocation exercise, the respondents were informed about the pre-determined goal
levels which were in line with the official goals as defined by the United Nations’ MDGs and SDGs
(see table below). In order to make the choice situations (i.e. the four communities) more
realistic, the respondents were reminded to assume that these communities were located in the
country of the survey. Hence, for each goal, information about the actual current situation in the
country was provided. Basic illustration of how the respondents would use the online survey, and
how they allocate and monitor the budget was also given before the each set of allocation
exercise (see Appendix A).
By using the interactive interface of the electronic choice experiment, the respondents allocated
funding to each development goal by clicking on the arrows or by typing in the designated boxes
on their computer screen. By allocating funding to a particular goal, they would visually see that
the gap between 0 and the 100% target would close in that particular goal for a given community.
While they perform the allocation exercise, they were able to monitor, at all times, the current
budget they have left, the amount they had already spent, what percentage of the goals has been
achieved, and the amount further needed to achieve the goals fully (100%).
In each task, the respondents started over the exercise with a fresh budget of US$ 10.000. They
would decide on their allocation based on two attributes, namely relative costs and relative
income. The cost attribute levels were estimated with the aim of representing the actual current
situation in each country. Extensive literature reviews were undertaken in order to estimate the

6
actual cost levels in relation to the 14 development goals.2 A consistent procedure and the
objective criteria are used to estimate the costs across the sample countries (see Table 1 for the
cost estimation criteria, and the procedure and the literature used). For each country separately,
the cost of achieving each goal for 1000 people were estimated, and 4 attribute levels were
generated, namely the “low cost” (50% of the estimated cost), “medium low cost” (83% of the
estimated cost), “medium high cost”, (116% of the estimated cost), “high cost” (150% of the
estimated cost) levels, respectively.3
As the respondents spent more on a goal, they would get closer to the 100% target based on the
pre-determined cost assigned to that goal in that particular choice set (for example allocating $US
2000 to poverty would result in 40% achievement of the target in poverty alleviation in one
community, 60% achievement of the target in another community etc.). Once the respondent has
reached 100% in one goal, he/she would not be able to allocate further funding to that particular
goal.
By design, the amount of the total budget needed to achieve all the goals was different in each of
the 4 choice tasks (i.e. each communities) as the relative cost of achieving the goals varied. Given
the budget limit of US $10.000, it would not be possible to achieve the %100 target in all the 7
goals. In each allocation task, the proportion of US$ 10.000 to the total amount needed to
achieve %100 in all goals (total need gap) would vary, ranging from 34% to 52% on average. In
order to create a relatively realistic set up, the respondents in poorer countries had stronger
budgetary constraints as compared to higher income countries in the sample.4 Nevertheless, the
four choice tasks were such that the respondents had “low”, “medium low”, “medium high”,
“high” income respectively. This allowed for the measurement of the effect of change in income
on demand. As both the relative prices and hence the income change in each task, the respondent
would have to consider a different set of budgetary trade-offs.
2 They were estimated by using a “need gap” approach with two components: (i) the proportion of people
in need relative to the goal (e.g. proportion of people below a poverty line), and the unit cost of the provision of the relevant service/good. For each goal set, total costs were normalized to US$ 10000 and the relative costs were calculated for each country to feed the choice experiment. 3. The attributes were incorporated into the choice experiment, using a matrix where respondents in a given
country faced the same choice set, which allowed for the more effective measurement of the effect of socioeconomic variables on choice patterns. In each allocation task, the order of the development areas was randomly shifted to avoid selection bias due to the potential variation of the respondent’s attention to the different segments of the allocation exercise. 4 The maximum proportion of the budget to the total need gap was highest for Turkey at 78% and lowest
for Nepal at 40%. Malawi, Sierra Leone and Guyana had their maximums around 43%, 46% and 51% respectively. The allocation exercise was concentrated in relatively low budget/need gap tasks, at 40% on average.

7
Table 1. Definition of primary goals
Expense category Goal Definition Cost Estimation Method
Poverty alleviation Halve poverty by providing direct cash income support to households whose income is less than US$ 300per household per month5
The World Bank’s poverty gap measure was used. For each country, the number of people under the poverty gap (US$ 1 for Malawi, Nepal and Sierra Leone, US$ 2 for Guyana, US$ 3 for Turkey) and the direct cash income needed to fill the gap was calculated (World Bank, 2014)
Primary education Achieve primary education for all school-aged children
UNESCO’s primary school enrolment and the “expenditure per student” data was used. (UNESCO, 2014)
Child health Reduce by two thirds, the death rate among children under the age of five
Word Bank’s per capita incremental cost by disease and health system block estimates were used (World Bank, 2014)
HIV/AIDS treatment
Provide all HIV/AIDS patients with access to life prolonging medication
WHO’s Number of people (all ages) living with HIV and WHO’s Global Price Reporting Mechanism report was used to estimate the costs (WHO, 2014)
Clean water Provide all population with access to clean water and basic sanitation
Based on regional cost provided in World Bank 2011, “Water and Sanitation to Reduce Child Mortality The Impact and Cost of Water and Sanitation Infrastructure" study. Gaps were calculated based on country data on "Improved water source (% of population with access). Cost of providing access and cost of service and maintenance were taken into account. WB- MDGs data on the proportion of the population using improved drinking water sources, and investment and maintenance costs were estimated from regional averages (accounted for 10 years investment period) (Günther, I, Fink G. (2011))
Electricity Provide all population with access to electricity International Energy Agency, International Energy Agency, World Energy Outlook 2011 is used for number of people in need. Cost of additional investment, cost of maintenance and cost of depreciation were taken into account, while accounting for increasing marginal cost of investment as one moves from low to high proportion of households with access to electricity (Word Bank 2010 Background Paper for the World Bank Group Energy Sector Strategy)
Telephone and internet
Provide all population with telephone and internet coverage
International Telecommunications Unions’ “Measuring the Information Society – The ICT Development Index” was used to estimate the need gaps.
5 The monthly amount was set as US$ 150 for Malawi, Nepal and Sierra Leone, and US$ 450 for Turkey.

8
Expense category Goal Definition
Forest protection Protect all forests, and eliminate deforestation We take the average of the maximum and minimum values of the costs to avoid deforestation per hectare in 8 countries from a study published by IIED (2006). We take % of land covered by forests from UNSTAT data. We take land surface data from the World Development Indicators and calculate the area covered by forests in the sample countries, we calculate a baseline of forests coverage for the five countries on the basis of the historical trend extended to 2020. For four countries we notice a decreasing trend. As target and alternative scenario for these four countries we assume that countries stabilize the surface devoted to forests at 2010 levels. We calculate the difference between the hectares of forests in the baseline and hectares of forests in the alternative scenario and calculate the total costs to achieved the target on the basis of the cost to avoid deforestation obtained above.
Clean water Provide all population with access to clean water and basic sanitation
Based on regional cost provided in World Bank 2011, “Water and Sanitation to Reduce Child Mortality The Impact and Cost of Water and Sanitation Infrastructure" study. Gaps were calculated based on country data on "Improved water source (% of population with access). Cost of providing access and cost of service and maintenance were taken into account.
Clean air Reduce, by one fifth, air pollutants and greenhouse gas emissions
Necessary abatement (moving base from previous year) per year was calculated by deducting business as usual scenario minus missions trajectory based on 20% reduction scenario for 2020 . The unit cost of CO2 is assumed to be 60$ per ton.
Biodiversity conservation Reserve and protect one fifth of the total land area for preservation of plant and animal biodiversity
Unit cost of protection for each country was estimated as the territorial gap in each country was multiplied by the unit cost. In addition, 40% financial investment gap was added based on the unit cost for territorial area under current protection.
Disaster preparedness Strengthen disaster preparedness and resilience against floods, earthquakes and droughts
Based on the past 20 years data, average annual cost of disasters per capita was calculated. It was assumed that 1/4 of this would be required to make an investment to avoid disaster damage, See International Red Cross and Red Crescent "World Disasters Report 2009. The cost–benefit ratio of disaster risk reduction ranges from 1:2 to 1:4, we took the optimistic 1:4.
Adaptation to climate change in agriculture
Invest in agricultural research, technology and infrastructure for adaptation to the impacts of climate change
Regionally differentiated approach (Nelson et al, 2009) - additional annual investment expenditure needed to counteract the effects of climate change on nutrition (0.33% agricultural GDP investment to avoid damage and 1% agricultural GDP & Climate damage 1% of agricultural GDP )
Renewable energy Produce one third of energy from renewable sources, including wind, solar, biomass and geothermal (excluding hydroelectric)
Based on the Renewable Energy Outlook 2030 Energy Watch Group Global Renewable Energy Scenarios study, the difference between “Low variant” scenario and “high variant” scenario for 2010 and 2020 was taken. Per capita investment requirements were calculated after incorporating “basic” investments that accounted 30%.

9
Table 2. Choice sets, cost attribute levels
Poverty Primary education
Child health
HIV/AIDS treatment
Clean Water
Electricity Telephone and internet
Task 1 4 4 4 2 1 3 2
Task 2 1 1 1 3 2 4 3
Task 3 2 2 2 4 3 1 4
Task 4 3 3 3 1 4 2 1
4. Result
In total, 465 respondents completed and returned the questionnaires. Among 465 respondents,
65 completed questionnaires have been collected from Guyana (14 %), 125 from Malawi (41 %),
109 from Nepal (23 %), 57 from Sierra Leone (12 %) and 109 from Turkey (23 %), respectively. As
shown in Figure I, the sample included 85 respondents from Political Organizations (including 74
Members of Parliament), which accounted for 18% of the total. Domestic and Foreign NGO
representatives constituted 31% of the total. Respondents from Academic Institutions, Public
Sector, Private Sector , Donors, and Media constituted 16% , 15%, 9%, % and %5 of the total,
respectively (see table 3 below). The relatively high shares of respondents from non-
governmental organizations, and political organizations (mainly parliamentarians) participating in
the survey reflect their active role in public and policy debates.
Table 3. Number of respondents by institutional affiliation and country
Guyana Malawi Nepal Sierra Leone
Turkey Total
Political Org. 28 35 14 2 6 85 18%
43% 28% 13% 4% 6% 18%
Public sector 7 15 24 8 18 72 15%
11% 12% 22% 14% 17% 15%
NGOs (Domestic 8 51 44 15 26 144 31%
& Foreign) 12% 41% 40% 26% 24% 31%
Academia 13 9 11 11 32 76 16%
20% 7% 10% 19% 29% 16%
Donors 1 6 6 8 3 24 5%
2% 5% 6% 14% 3% 5%
Media 2 5 4 6 5 22 5%
3% 4% 4% 11% 5% 5%
Private sector 6 4 6 7 19 42 9%
9% 3% 6% 12% 17% 9%
Total 65 125 109 57 109 465 100%
100% 100% 100% 100% 100% 100%
Country percentages in total 14% 27% 23% 12% 23% 100%

10
4.1. Descriptive statistics
In the first part of the questionnaire, the respondents were given a list of nine general political
goals that their country should aim to achieve in the next ten years.6 They were asked to select six
out of nine, and to rank them in descending order of importance (see table 4 below). The goal of
“Achieving a high level of economic growth and creating employment (growth)” was ranked as
first priority by 44% of all participants. In Malawi and Nepal, there was even a stronger agreement
– as in both countries, 57% of all participants ranked economic growth as top priority. The
cumulative frequencies showed that “growth”, “good governance” and “education” entered the
top three ranks most frequently. These are followed by other goals relating to equality, health,
democracy, environment, gender and defence.
Table 4. General goals ranked in top three, cumulative frequencies (if ranked in top three)
Political Goals Percentage Achieving a high level of economic growth and creating employment 24% Building good government institutions and fighting corruption 17% More investment in all levels of education 16% Promoting income equality among various segments of the society 11% More investment in all health services 9% Giving people more say in important government decisions 9% Promoting environmental sustainability and addressing climate change 7% Achieving gender equality for girls and women in education and in work place 6% Making sure this country has strong defence forces against external threats 1%
After control questions identifying whether the respondent have heard about the MDGs, they
were specifically asked to rank the MDGs (listed below). The resulting ranking reflected the
respondent’s priorities in general development issues discussed above. Accordingly, “reduce
poverty and hunger” was by far the most frequently ranked goal as being “the most important”.
Almost 57% of all respondents ranked it as first priority. This proportion went up to 67% and 63%
in Malawi and Nepal, respectively. Second highest rated goal was to “achieve primary education
for all” – as 15% of all respondents ranked it as first priority. “Tackle climate change through
mitigation and adaptation” was ranked as first priority by 6% of all participants. The goals that
entered the top three ranks most frequently were, in descending order, “poverty and hunger”,
“primary education” and “drinking water and basic sanitation”. This is followed by goals relating
to “gender equality,” “climate change” and “child mortality”.
6 Our electronic questionnaire design allowed for all ranking questions to be executed easily through an
interactive interface. By just clicking on their computer screen, the respondents could easily move an item on the list (order of which was automatically randomized), to boxes marked by the order of importance.

11
Table 5. MDGs ranked in top three, cumulative frequencies (if ranked in top three)
MDGs Percentage
Reduce poverty and hunger 26% Achieve primary education for all 18% Improve people’s access to clean drinking water and basic sanitation 12% Achieve gender equality and empowering women 9% Tackle climate change through mitigation and adaptation 9% Reduce the death rate among children under the age of five 8% Reduce the spread of HIV/AIDS, malaria and tuberculosis 8% Reduce the number of women dying during childbirth 7% Improve people’s access to telephone and internet 2%
Then the respondents were asked to rank a second set of 9 development gaols (i.e. the SDCs) (see
table 6 below) where we observe a significantly weaker sense of agreement among the
respondents on top priorities as compared to the primary set of goals above. “Invest in
agricultural technology and infrastructure for adaptation to climate change” was ranked as the
most important goal. Almost 30% of all participants ranked it as the top priority among the
secondary set. At the country level in Malawi there was even a stronger emphasis on this goal– as
52% of participants ranked it as top priority.7 However, in Guyana and Turkey only 8% and 10% of
participants ranked it as first priority, respectively.
“Improve people's access to safe drinking water and basic sanitation” was rated top priority by
24% of all participants. This goal was seen to be particularly important for Nepal and Sierra Leone
where it was rated as first priority by 34% and 42% of respondents, respectively. “Invest in
renewable energy sources (solar, wind, biomass and geothermal energy)” was ranked as first
priority by 18% of all participants. There was a stronger emphasis on renewables in Turkey and
Guyana, where 38% and 31% of respondents ranked it as first priority, respectively. Only 5% of
respondents from Malawi perceive renewables to be the first priority. Among the sample
countries, particularly high proportion respondents from Turkey, namely 42%, ranked ““improve
disaster preparedness and resilience (against floods, earthquakes and droughts)” as either top or
second most important priority.
Looking at the cumulative frequencies of the top three rankings, the goals that were most
frequently ranked as the 1st,2nd or 3rd important were more evenly distributed as compared to the
MDGs.
7 This reflects the fact that Malawi is highly exposed to the impacts of climate change - as 84% of its
population live in rural areas and agriculture accounted for 30% of its GDP in 2011 (World Bank, 2013).World Bank Data, http://data.worldbank.org/indicator/NV.AGR.TOTL.ZS/countries (accessed 19.08.2013)

12
Table 6. SDGs ranked in top three, cumulative frequencies (if ranked in top three)
SDGs Percentage
Invest in agricultural technology and infrastructure for adaptation to climate change 21% Invest in renewable energy sources (solar, wind, biomass and geothermal energy) 19% Improve people’s access to clean drinking water and basic sanitation 18% Protect land and soil resources 12% Improve disaster preparedness and resilience ( floods, earthquakes and droughts) 11% Protect forests 9% Improve waste management 6% Reduce air pollution 2% Protect threatened animal and plant species 2% Total 100%
Table 7. Top three rankings of the MDGs and SDGs by cumulative frequencies
Rank
Total
Guyana Malawi Nepal
Sierra Leone
Turkey
MDGs MDGs MDGs MDGs MDGs MDGs
1 Poverty Poverty Poverty Poverty Poverty Poverty
2 Primary education
Primary education
Fighting diseases
Primary education
Drinking Water
Primary education
3 Drinking Water
Fighting diseases
Primary education
Drinking Water
Primary education
Climate change
SDGs SDGs SDGs SDGs SDGs SDGs
1 Climate adaptation
Renewable energy
Climate adaptation
Drinking Water
Drinking Water
Renewable energy
2 Renewable energy
Climate adaptation
Drinking Water
Climate adaptation
Climate adaptation
Disaster preparedness
3 Drinking Water
Drinking Water
Renewable energy
Renewable energy
Renewable energy
Soil protection

13
4.2. Descriptive results of the choice experiment
The respondents were asked to complete 8 allocation tasks (4 tasks for the primary goal set and 4
tasks for the secondary goal set). In total, 465 respondents provided 2969 allocation observations
– as 80% of the respondents completed the choice experiment. In order to improve the quality of
the results, the respondents were asked to (self)evaluate how they performed the choice
experiment. Among those who completed the choice experiment, 83 % marked the option that
they had understood the budget allocation exercise either fully or largely. The proportion of this
group ranged between 78% in Malawi to 88% in Guyana. However, 16% of all respondents
completing the allocation tasks stated that they had made random allocations (see table 8). In the
following sections of this paper, we report on the data gathered from the former group only.
Table 8. Respondents’ self-evaluation of the choice experiment
Self-evaluation question Percent
I understood the budget allocation exercise fully. I made my allocation decisions carefully throughout the exercise
39.4%
I understood the exercise largely. I completed the task to my best ability 43.3% I made my allocations decisions carefully in some parts, but randomly in others
15.3%
I made random allocations throughout the exercise 1.2% None of the above 0.9% Total 100%
The respondents’ allocation decisions were reported regarding both the first and second set of
goals. On the first set, the respondents allocated on average 21% of their budget to poverty, 17%
to access to electricity, 17% to drinking water and 15% to primary education, 14% to child health,
11 % to HIV-related life prolonging medication, and 5% to providing access to telephone and
internet (see Table 9 below). While the share of their spending on Communication (mobile and
internet) was consistently low across the countries, the proportion of their spending on other
areas varied. Standard deviation of budget shares in areas such as electricity and HIV/AIDS were
higher than in those such as clean water and child health where the respondents’ budget shares
were relatively similar across countries (see figure 1 below).
Table 9. Average budget allocated to the primary goals (%),
Variable Obs Mean Std. Dev.
Min Max
Poverty 1142 0.21 0.12 0 0.84 Electricity 1142 0.17 0.13 0 0.85 Drinking water 1142 0.17 0.10 0 0.80 Primary education 1142 0.15 0.12 0 0.70 Child health 1142 0.14 0.09 0 0.72 HIV/AIDS 1142 0.11 0.13 0 0.76 Communication (mobile and internet)
1142 0.05 0.04 0 0.21

14
Figure 1. Respondents’ budget shares on the primary goals
On the second set of goals, the respondents allocated 22% of their budget to forest protection,
20% to clean water, 17% to climate adaptation and 15% to renewable energy, 13% to disaster
preparedness 7% to biodiversity, 6% clean air on average (see Table 10 below). Other than
biodiversity and clean air where budget shares were consistently low across the countries, the
standard deviation of the budget shares for second set of goals was higher than those of the first
set. The respondents allocated the biggest share of their budget on different items, such as on
climate adaptation in Malawi, on disaster preparedness in Turkey, clean water in Sierra Leone,
and forest protection in Nepal (see figure 2 below). While these results are descriptively
indicative of the demand for these development areas, the following section provides a detailed
econometric analysis of the income and cost elasticity of such demand.
0%
5%
10%
15%
20%
25%
30%
35%
primaryeducation
HIV/AIDStreatment
child health
waterelectricity
telephoneand internet
poverty
GUYANA
MALAWI
NEPAL
SIERRA LEONE
TURKEY

15
Table 10. Average budget allocated to the secondary goals (%), (aweigted)
Variable Obs Mean Std. Dev.
Min Max
Forest protection 1143 0.22 0.14 0 0.96
Clean water 1143 0.20 0.13 0 0.88
Climate adaptation 1143 0.17 0.12 0 0.85
Renewable energy 1143 0.15 0.11 0 0.81
Disaster preparedness 1143 0.13 0.14 0 0.84
Biodiversity 1143 0.07 0.06 0 0.44
Clean air 1143 0.06 0.07 0 0.50
Figure 2. Respondents’ budget shares on the secondary goals
0%
5%
10%
15%
20%
25%
30%
clean air
biodiversity
climateadaptati
on
disasterprepared
ness
forestprotectio
n
renewable energy
water
GUYANA
MALAWI
NEPAL
SIERRA LEONE
TURKEY

16
4.3. Econometric results
The AIDS for the primary and secondary set of development goals are estimated using an iterated
seemingly unrelated regression procedure in STATA econometrics software version 11.0. In the
first stage, only unit costs and expenditures are used as predictor variables (see tables 11-12
below). The AIDS was estimated with the parametric imposition of symmetry and homogeneity,
through constraints imposed on the regression procedure. Then the estimated coefficients are
used to compute expenditure and price elasticities. In a second stage a set of demographic
variables were added to the model.
Table 11. Variables used in the first stage of demand estimation, the first set of 7 goals
Dependent variables Explanatory variables
S1 Budget share of clean air lnPm1 Log unit cost clean air
S2 Budget share of biodiversity lnPm2 Log unit cost biodiversity
S3 Budget share of climate adaptation lnPm3 Log unit cost climate adaptation
S4 Budget share of disaster preparedness lnPm4 Log unit cost disaster preparedness
S5 Budget share of forest protection lnPm5Log unit cost forest protection
S6 Budget share of renewable energy lnPm6 Log unit cost renewable energy
S7 Budget share of clean water lnPm7 Log unit cost clean water
lnM Log of total expenditure
Table 12. Variables used in the first stage of demand estimation, the second set of 7 goals
Dependent variables Explanatory variables
S1 Budget share of Primary Education lnPm1 Log unit cost Primary Education
S2 Budget share of HIV/AIDS treatment lnPm2 Log unit cost HIV/AIDS treatment
S3 Budget share of Child health lnPm3 Log unit cost Child health
S4 Budget share of Clean water lnPm4 Log unit cost Clean water
S5 Budget share of Electricity lnPm5 Log unit cost Electricity
S6 Budget share of Telephone and internet lnPm6 Log unit cost Telephone and internet
S7 Budget share of Poverty alleviation lnPm7 Log unit cost Poverty alleviation
lnM Log of total expenditure
The parameters that we estimated for both set of goals satisfy the monotonicity and the concavity
conditions of the underlying cost function. Monotonicity was ensured given that all budget shares
were strictly positive, by design of the choice experiment. Similarly, concavity was satisfied - as all
compensated own-price elasticities were estimated to be negative. The expenditure coefficients
(β), which measure the change in the particular goal’s budget share with respect to a change in
respondents’ budget, and cross cost coefficients ( ), which indicates the sensitivity of the budget
share of a goal to the change in the cost of other goals, were estimated.
All the expenditure coefficients (β) for the first set of goals were statistically significant at least at
the 1% level (Table 13). The estimated β’s indicate whether a given development goal is a
necessity (β < 0) or a luxury (β > 0). According to our results, all expenditure coefficients for the
primary set of goals with the exception of “child health” and “telephone and internet” are
negative. This suggests that most of the first set of goals are necessary or primary goods, those
relating to “telephone and internet” and to some extent “child health” are, expenditure elastic,
and hence luxury goods. Among the seven goals, “electricity” and “HIV/AIDS” exhibit the lowest
income elasticities, indicating that they were assessed to be the most primary goals in the list.

17
A vast majority of cross cost ( ) coefficients were estimated to be significantly different from
zero; forty-two out of forty-nine have t-values absolutely larger than 2 (see Table 13). Table 14
below presents the estimated the Marshallian and Hicksian elasticities of demand for the primary
set of goals. As expected, all own price elasticities are negative, meaning that the underlying
demand curve is downward sloping, hence satisfying the law of demand. Both compensated and
uncompensated own price elasticity for all goals are inelastic. The compensated (Hicksian) own-
price elasticities of demand are smaller in absolute magnitudes than their uncompensated
(Marshallian) counterparts. While child health has the lowest own price elasticity, “telephone and
internet” has the highest own price elasticity among other goals.
Our estimates of cross Marshallian elasticities indicate that the respondents’ demand for any
particular goal exhibit more sensitivity to changes in its own cost than to the changes in the cost
of any other goal (see Tables 15-16). Only “electricity” and “primary education” appear to act as
net substitutes for “telephone and internet” (with low elasticity magnitudes). The Hicksian
elasticities estimates, which capture only the substitution effect, show that “poverty alleviation”
act as net substitute for “HIV/AIDS treatment”, yet the elasticity magnitudes are still relatively
small. As such, most of the primary goals appear to act as net compliments for each other.

18
Table 13: Parameter estimates for the MDGs (t values under each raw)
Table 14. Expenditure and own-price elasticities for the MDGs
Expenditure Elasticity
Uncompensated own price elasticity
Compensated own price elasticity
Primary Education 0.762 -0.307 -0.190
HIV/AIDS treatment 0.627 -0.323 -0.255
Child health 1.084 -0.268 -0.121
Clean water 0.849 -0.477 -0.336
Electricity 0.681 -0.299 -0.181
Telephone and internet 1.268 -0.677 -0.616
Poverty alleviation 0.859 -0.482 -0.303
Cons
Primary Education -0.03679 0.101309 -0.01111 -0.02924 -0.01486 -0.02943 0.002387 -0.01906 0.410592
-6.9 30.9 -4.3 -10.7 -5.2 -10.5 1.3 -5.8 14.0
HIV/AIDS treatment -0.04034 -0.01111 0.068812 -0.01745 -0.00918 -0.02487 -0.00295 -0.00325 0.360662
-6.9 -4.3 21.9 -6.7 -3.6 -8.3 -1.5 -0.9 11.1
Child health 0.011299 -0.02924 -0.01745 0.100626 -0.01665 -0.01639 -0.00695 -0.01394 0.084148
2.2 -10.7 -6.7 22.7 -5.5 -5.1 -3.3 -4.0 3.0
Clean water -0.02515 -0.01486 -0.00918 -0.01665 0.08286 -0.00986 -0.00556 -0.02675 0.289971
-4.0 -5.2 -3.6 -5.5 19.2 -2.9 -3.1 -7.9 8.4
Electricity -0.05496 -0.02943 -0.02487 -0.01639 -0.00986 0.11149 0.002329 -0.03327 0.39172
-7.0 -10.5 -8.3 -5.1 -2.9 21.1 1.3 -9.1 9.0
Telephone&internet 0.012883 0.002387 -0.00295 -0.00695 -0.00556 0.002329 0.016127 -0.00538 -0.01312
4.7 1.3 -1.5 -3.3 -3.1 1.3 6.6 -2.3 -0.9
Poverty alleviation -0.02942 -0.01906 -0.00325 -0.01394 -0.02675 -0.03327 -0.00538 0.10165 0.364519
-4.4 -5.8 -0.9 -4.0 -7.9 -9.1 -2.3 19.6 9.7

19
Table 15. Marshallian elasticities for the MDGs
Primary Education
HIV/AIDS treatment
Child health
Clean water
Electricity Telephone &internet
Poverty alleviation
Primary Education -0.307 -0.046 -0.157 -0.057 -0.149 0.027 -0.074 HIV/AIDS treatment -0.045 -0.323 -0.111 -0.023 -0.166 -0.009 0.048 Child health -0.229 -0.138 -0.268 -0.137 -0.136 -0.055 -0.120 Clean water -0.066 -0.039 -0.080 -0.477 -0.033 -0.026 -0.129 Electricity -0.121 -0.110 -0.052 -0.004 -0.299 0.029 -0.127 Telephone&internet 0.008 -0.091 -0.181 -0.161 0.002 -0.677 -0.168 Poverty alleviation -0.070 0.000 -0.048 -0.105 -0.136 -0.019 -0.482
Table 16 Hicksian elasticities of demand for MDGs
Primary Education
HIV/AIDS treatment
Child health
Clean water
Electricity Telephone& internet
Poverty alleviation
Primary Education -0.190 0.036 -0.054 0.070 -0.018 0.063 0.085
HIV/AIDS treatment 0.052 -0.255 -0.026 0.081 -0.058 0.021 0.178
Child health -0.062 -0.021 -0.121 0.043 0.051 -0.003 0.105
Clean water 0.065 0.053 0.035 -0.335 0.113 0.015 0.047
Electricity -0.016 -0.036 0.040 0.109 -0.181 0.061 0.015
Telephone&internet 0.204 0.047 -0.009 0.050 0.221 -0.616 0.096
Poverty alleviation 0.063 0.092 0.068 0.038 0.013 0.022 -0.303

20
Table 17. Parameter estimates for the SDGs (t values under each raw)
Cons
Clean air 0.003 0.049 0.002 -0.016 -0.013 -0.006 -0.001 -0.016 0.107
1.5 18.5 1.1 -7.2 -3.3 -2.1 -0.2 -9.1 31.9
Biodiversity 0.001 0.002 0.030 -0.010 0.007 -0.014 -0.010 -0.005 0.101
0.6 1.1 11.3 -4.8 2.1 -5.5 -4.4 -2.6 31.9
Climateadaptation -0.010 -0.016 -0.010 0.103 -0.024 -0.016 -0.019 -0.017 0.155
-2.8 -7.2 -4.8 24.0 -5.8 -4.7 -6.0 -7.2 30.6
Water -0.015 -0.013 0.007 -0.024 0.089 -0.001 -0.024 -0.035 0.168
-3.6 -3.3 2.1 -5.8 9.9 -0.1 -5.5 -10.8 27.6
Forests -0.041 -0.006 -0.014 -0.016 -0.001 0.064 -0.019 -0.007 0.193
-9.2 -2.1 -5.5 -4.7 -0.1 11.4 -5.3 -2.7 30.3
Renewable -0.010 -0.001 -0.010 -0.019 -0.024 -0.019 0.082 -0.009 0.170
-3.0 -0.2 -4.4 -6.0 -5.5 -5.3 18.3 -3.6 34.3
Disaster -0.032 -0.016 -0.005 -0.017 -0.035 -0.007 -0.009 0.089 0.192
-8.6 -9.1 -2.6 -7.2 -10.8 -2.7 -3.6 33.1 38.2
Table 18. Expenditure and own-price elasticities for the SDGs
Expenditure Elasticity
Uncompensated own price elasticity
Compensated own price elasticity
Clean air 1.058 -0.146 -0.086
Biodiversity 1.016 -0.581 -0.509
Climate adaptation 0.941 -0.383 -0.224
Water 0.926 -0.535 -0.352
Forests 0.810 -0.664 -0.489
Renewable 0.929 -0.433 -0.296
Disaster 0.764 -0.308 -0.206

21
Table 19. Marshallian elasticities for the SDGs
Clean air
Biodiversity Climate adaptation
Water Forests Renewable Disaster
Clean air -0.146 0.034 -0.283 -0.234 -0.119 -0.018 -0.291
Biodiversity 0.029 -0.581 -0.147 0.103 -0.205 -0.149 -0.066
Climate adaptation -0.088 -0.056 -0.383 -0.131 -0.084 -0.106 -0.093
Water -0.060 0.043 -0.109 -0.535 0.011 -0.111 -0.166
Forests -0.017 -0.053 -0.044 0.033 -0.664 -0.058 -0.009
Renewable 0.001 -0.066 -0.120 -0.150 -0.111 -0.433 -0.050
Disaster -0.107 -0.017 -0.087 -0.212 -0.004 -0.030 -0.308
Table 20. Hicksian elasticities of demand for SDGs
Clean air
Biodiversity Climate adaptation
Water Forests Renewable Disaster
Clean air -0.086 0.109 -0.104 -0.025 0.110 0.138 -0.149
Biodiversity 0.087 -0.509 0.025 0.303 0.014 0.000 0.071
Climate adaptation -0.035 0.011 -0.224 0.055 0.119 0.032 0.033
Water -0.007 0.109 0.047 -0.351 0.211 0.025 -0.041
Forests 0.029 0.005 0.094 0.194 -0.489 0.061 0.100
Renewable 0.053 0.000 0.037 0.033 0.089 -0.296 0.075
Disaster -0.063 0.037 0.042 -0.061 0.161 0.082 -0.206
22
As for the secondary set of goals, all expenditure coefficients (β), except for “clean air” and
“biodiversity”, are statistically significant at least at the 1% level (Table 17). However, other than
“forest protection” and “disaster preparedness”,, expenditure elasticities were close to or above
1 (ranging from 0.92 – 1.05). This indicates the majority of the second set of goals were
considered to be closer to luxury. Only the demand for disaster preparedness and forest
protection exhibit the property of normal goods.
Table 17 presents the estimated income elasticities, Marshallian and Hicksian elasticities. Forty-
five out of forty-nine coefficients for the secondary set have t-values absolutely larger than 2.
The majority of estimated expenditure elasticities were inelastic. Similar to the first set of goals,
our estimates of cross Marshallian elasticities indicate that the respondents’ demand for any
particular goal exhibit more sensitivity to changes in its own need gap (price) than to the changes
in the need gap of any other goal (see table 18-19). Nevertheless, most of the goals seem to act as
compliments for each other. Yet there are more cases of substitution in the second set than
those with the first set. In particular, “forests protection,” “renewables” and “biodiversity”
appear to act as substitute for “clean air”. “Forest protection” also appears to substitute for
“clean water”, “disasters” and “climate adaptation”. In addition “disasters preparedness”
appears to be act as substitute for “forests protection”, yet the Hicksian elasticities are low.
In sum, our econometric estimates show that there are substantial differences in the properties of
demand for the first and the second set of development goals. The second set of goals (SDGs) are
more income elastic than the first set of goals (MDGs). As such the SDGs are generally luxury
goods while the MDGs are necessary goods. The only exceptions are the goals related to “disaster
preparedness” in the second set which appear to be necessary, and “access to
telecommunication” in the first set of goals which exhibit the properties of a luxury good. While
“HIV/AIDS treatment” seems to be the most primary good of the first group, “clean air” appears
to be the most luxury good in the second group. On the other hand, while the SDGs can act as
substitutes for each other, the MDGs by and large act as net complements.
4.3.1 Socioeconomic factors
The effect of the respondents’ socioeconomic characteristics on their demand for development
was also estimated by adding a set of demographic factors, such as the elite’s professional
affiliation, education and gender, to the regression model. We do not consider endogeneity
between total expenditure and demographic variables given the design of the choice experiment.
Total expenditure and the set of demographic variables specified below cannot be endogenous
given that both the expenditure (i.e. US$10000) and price levels are independently determined.
Table 21 below presents the marginal effects of socio-economic variables on expenditure shares
of the goals. The inclusion of the demographic factors increases the predictive power of the
demand model for both the first and the second set of goals, but more strongly with the latter.
The resulting R squared increases ranged from 0.02 for electricity to 0.08 in air pollution and 0.09
for communication. There were 30 cases where the demographic variables had a significant
effect (at 5% level) on the budget share of the first set of goals, as compared to 51 cases where

23
the same set of goals had significant effect in relation to the second set of goals (see Tables 22-
23).8 As such non-monetary factors are found to exhibit stronger influence on the local elite’s
demand for the secondary set than the primary set.
Table 21. Predictive power of the model, with and without demographic variables (R-Squared
comparison)
First set of goals Cost/expenditure
model only
Model with
demographic
variables
Second set of goals Cost/expenditure model only
Model with
demographic
variables Primary Education 0.66 0.69 Clean air 0.35 0.43
HIV/AIDS treatment 0.60 0.64 Biodiversity 0.25 0.32
Child health 0.37 0.42 Climate adaptation 0.40 0.47
Clean water 0.34 0.38 Water 0.33 0.39
Electricity 0.34 0.36 Forests 0.36 0.40
Telephone&internet 0.12 0.21 Renewable 0.33 0.37
Poverty alleviation 0.44 0.49 Disaster 0.53 0.59
Respondents working for institutions that operate in the field of environment tend to spend more
on air pollution as expected, whereas those working in the real economic sectors (food,
agriculture, forestry, fishing, manufacturing and energy) spend less, which might be due to the
latter’s perception that limiting air pollution may curtail economic growth in the real sectors. On
the other hand they (in addition to those working in the field of poverty alleviation) spend more
on climate change adaptation in agriculture. Respondents from the “services sector” (banking,
finance, tourism, trade) and health spend less on adaptation. It seems that respondents from the
real economic sectors prioritise climate adaptation more than mitigation, as compared to other
respondents.
Respondents from institutions working in the field of poverty alleviation and emergency relief and
those having postgraduate education tend to demand more poverty alleviation. Yet African
respondents and those who work in the health sector demand less. With our elasticity estimates,
it is noticeable that poverty alleviation in the form of income support had relative higher income
elasticity as compared to HIV/AIDS treatment, primary education, electricity and clean water.
This is unexpected given that poverty alleviation was ranked by far as the most important goal in
the first part of the questionnaire across the sample countries. This seeming anomaly may be due
to the consideration that the elite might be prioritising investment in areas that are related to the
causes of poverty (like HIV/AIDS, lack of access to electricity etc) – that they might think would in
turn help alleviate poverty – rather than direct interventions in the form of income transfer as
simulated in our choice experiment.
African respondents demand significantly more HIV/AIDS treatment as expected. Especially in
Malawi, where HIV prevalence rate is high, respondents spent the biggest share of their budget
8 2 cases of age were removed from SDGs (otherwise 53), as age is not considered in MDGs.

24
on this area. It had the lowest income elasticity among other development areas, implying that it
is seen as the most necessary good. However, males, and interestingly respondents working for
donor institutions and for the private sector demand less HIV/AIDS treatment, all other things
being equal. Respondents from donor organisations (and those working in the field of education)
tend to demand more child health.
Respondents who have a postgraduate degree and those working for environmental institutions
tend to spend more on biodiversity as expected, whereas respondents from government
institutions (mainly Parliamentarians), academia and donors spend less. While the demand for
biodiversity is estimated to be income elastic, biodiversity had also the lowest frequency in the
top three rankings in importance when it was presented along with other eight goals in the first
part of the questionnaire. The fact that biodiversity preservation is seen as “luxury” and not as a
priority by policy makers, academics and donors alike is unexpected, given that our sample
includes countries such as Guyana, Nepal and Malawi, which are notably rich in plant and animal
biodiversity. On the other hand, the same group of respondents seem to be more responsive to
forest protection and the elimination of deforestation.
Ethnically African respondents and those working for donor agencies and for institutions
operating in the field of health services tend to spend more on clean water and sanitation. Access
to clean drinking water and basic sanitation had been ranked as the third most frequently
prioritised (among the top three) areas in the first part of the questionnaire. The demand for
clean water was estimated to be income inelastic, as expected. It appears to be prioritised by
donors, those working in health related sectors particularly in Sierra Leone, Malawi and Nepal.
Respondents from the private sector, government institutions and academia tend to demand
more electrification. Males spend significantly more on both electrification and renewables.
Income elasticity of demand for access to electricity was estimated to be one of the lowest
(following HIV/AIDS treatment) and hence it is perceived to be a primary good. As expected the
respondents from the private sector place high priority on it. Investing in renewable energy,
which exhibit higher income elasticity according to our estimates, had been ranked as the most
important area among the list of secondary development areas in Turkey and Guyana, which are
relatively higher income countries in the sample.
Respondents working in the health sector tend to spend more on disaster preparedness, whereas
being male, working for NGOs, political organisations, government and donor institutions has
negative effects on the budget allocated to disaster preparedness . This goal had the lowest
income elasticity among the second set of goals. Hence it is considered to be a primary good. Yet
the fact that it is not seen as a priority by policy makers, NGO executives and donor
representatives alike is unexpected, given that our sample includes countries such as Guyana and
Turkey where disasters in the form of landslides and flooding in the former, and earthquakes in
the later lead to substantial losses fairly frequently.

25
Table 22: Budget effect of selected demographic factors, first set of goals (t values under each
raw)
Primary education
HIV/AIDS treatment
Child health
Clean water
Electri city
Telep& internet
Poverty
Gender:male 0.004 -0.033 0.003 0.003 0.025 0.011 0.006
0.73 -5.043 0.46 0.42 2.69* 3.58* 0.77
Edu:postgraduate -0.002 -0.010 -0.007 0.007 -0.011 -0.003 0.014
-0.41 -1.61 -1.31 1.1 -1.31 -1.06 2
Incomepercentile -0.003 0.002 -0.001 0.003 -0.001 -0.002 0.002
-1.91 1.03 -1.02 1.57 -0.65 -2.7* 1.27
Academia -0.004 -0.035 -0.004 -0.029 0.061 -0.005 0.006
-0.28 -2.15* -0.26 -1.59 2.65* -0.63 0.3
NGOs -0.023 -0.030 -0.003 -0.003 0.039 -0.003 0.020
-1.62 -1.95 -0.2 -0.17 1.81 -0.37 1.14
Political org. -0.036 -0.008 -0.009 -0.024 0.078 -0.003 -0.018
-2.43* -0.52 -0.63 -1.4 3.54* -0.41 -0.96
Government -0.025 -0.028 -0.006 -0.017 0.059 0.004 0.012
-1.7 -1.74 -0.42 -0.98 2.68* 0.51 0.65
Donor agencies -0.007 -0.111 0.041 0.044 0.053 -0.006 0.009
-0.36 -5.52* 2.32* 1.98* 1.9 -0.65 0.37
Private Sector -0.017 -0.044 0.010 -0.039 0.077 -0.007 0.024
-1.09 -2.65* 0.67 -2.17* 3.35* -0.89 1.24
Sector health 0.011 0.009 0.008 -0.004 0.003 -0.004 -0.030
1.83 1.37 1.32 -0.57 0.36 -1.47 -3.91*
Sector education 0.004 0.004 0.013 -0.003 -0.010 0.005 -0.005
0.77 0.62 2.36 -0.49 -1.22 1.65 -0.66
Sectorhumanrights -0.003 -0.019 -0.004 -0.002 0.012 0.003 0.012
-0.61 -3.13* -0.7 -0.22 1.35 1.17 1.64
Real sector -0.004 0.005 -0.007 0.007 0.004 -0.003 -0.012
-0.73 0.9 -1.37 1.05 0.45 -1.13 -1.66
Service sector 0.023 -0.003 -0.019 -0.012 0.010 -0.007 -0.008
3.59* -0.43 -3.16* -1.53 1.01 -2.08* -1.04
Sector poverty -0.003 0.012 -0.009 -0.015 -0.013 -0.005 0.025
-0.44 1.78 -1.59 -1.98* -1.37 -1.5 3.15*
SectorEnvironment -0.018 0.001 0.004 0.017 0.007 0.008 -0.009
-3.16* 0.13 0.78 2.46* 0.78 2.87* -1.29
Ethnic African 0.006 0.038 -0.011 0.000 -0.016 -0.002 -0.019
0.93 5.6* -1.81 0.04 -1.74 -0.68 -2.35*
*significant at 5% level, t values under each raw

26
Table 23: Budget effect of selected demographic factors, second set of goals (t values under each
raw)
Clean air
Biodiver-sity
Climate adap
tation
Clean water
Forest protect
tion
Renew-able
energy
Disaster prepard
ness
Gender:male -0.002 0.009 -0.004 0.016 0.003 0.025 -0.037
-0.37 2.12* -0.49 1.79 0.34 3.39* -4.69*
Edu: postgraduate -0.012 0.009 0.011 0.006 -0.004 -0.012 -0.004
-2.82* 2.19* 1.53 0.72 -0.43 -1.84 -0.61
Income percentile 0.001 -0.003 0.003 0.004 -0.005 -0.001 0.002 1.21 -3.24* 1.4 1.69 -2.16* -0.59 1.11
ODA sceptic -0.002 0.001 0.000 -0.008 0.016 0.009 -0.019
-0.72 0.4 -0.07 -1.25 2.3* 1.63 -3.36*
Academia -0.034 -0.039 -0.016 0.006 0.066 -0.003 -0.003
-3.02* -3.62* -0.82 0.26 2.71* -0.16 -0.13
NGOs -0.030 -0.021 0.016 0.029 0.043 0.018 -0.074
-2.83* -2.05* 0.89 1.4 1.89 1.06 -4.03
Political org. -0.024 -0.027 0.011 0.011 0.048 -0.005 -0.040
-2.21* -2.59* 0.58 0.52 2.07 -0.28 -2.1
Government -0.008 -0.029 0.004 0.016 0.058 0.010 -0.067
-0.77 -2.75* 0.23 0.76 2.46* 0.56 -3.55
Donor agencies -0.032 -0.040 -0.012 0.085 0.035 0.042 -0.085
-2.32* -3.03* -0.51 3.17 1.17 1.85 -3.55*
Private Sector -0.032 -0.031 -0.009 0.000 0.060 0.033 -0.036
-2.82* -2.83* -0.47 0.02 2.47* 1.8 -1.83
Sector health -0.006 -0.005 -0.030 0.040 -0.011 -0.018 0.023
-1.34 -1.15 -4.03* 4.69* -1.13 -2.51 2.94
Sector education 0.004 0.008 -0.001 -0.006 0.000 0.013 -0.014
0.9 1.89 -0.09 -0.77 0 1.85 -1.94
Sectorhumanrights 0.009 0.001 -0.036 0.015 0.020 -0.003 -0.005
2.06* 0.35 -4.96* 1.87 2.15* -0.45 -0.67
Real sector -0.022 -0.006 0.034 -0.022 0.020 -0.005 -0.008
-5.19* -1.62 4.88* -2.75* 2.26* -0.67 -1.16
Service sector -0.018 0.006 -0.023 -0.016 0.035 0.002 0.006
-3.81* 1.21 -2.79* -1.76 3.38* 0.22 0.73
Sector poverty -0.014 0.002 0.036 -0.017 0.003 -0.020 0.006
-3.04* 0.37 4.61* -1.87 0.31 -2.61* 0.74
SectorEnvironment 0.020 0.011 -0.008 0.000 0.013 -0.003 -0.026
4.58* 2.62* -1.16 0 1.42 -0.38 -3.52
Ethnic African -0.002 -0.007 0.010 0.018 -0.005 -0.025 0.005
-0.38 -1.69 1.41 2.1* -0.62 -3.49* 0.7
*significant at 5% level, t values under each raw

27
5. Policy implications for Overseas Development Aid
Our results reveal that the local elite’s stated demand for both primary and secondary areas of
development vary substantially across countries which would lead to some policy implications.
While the first set of goals, including education, HIV/AIDS and electrification are inelastic to
increases in income, the secondary set, including biodiversity, climate change adaptation, clean
air, forest protection – income elastic. As such the goals related to the environment, most
particularly “clean air” and “biodiversity” are perceived to be luxury goods while the primary set,
in particular, “HIV/AIDS treatment” and “access to electricity” are seen necessary goods. The
local elite appears to consider most of the first set of goals to be net compliments for each other.
Yet there are more cases of substitution in the secondary set than those with the primary set. For
example, “forests protection” and “renewables” appear to act as substitute for “clean air”. This
elasticity estimates can inform policy discussions in relation to the allocation of government
budgets and overseas development aid (ODA).
In certain areas ODA commitments seem to follow the local elite’s demand priorities as observed
in this study. In primary areas “HIV/AIDS treatment” is an area where donor commitments have
been substantial. Slightly more than 5% of the total aid that was provided by developed country
donors to developing countries has been allocated to HIV/AIDS (2007-2012 average) (OECD,
2014). This is more than what donors allocated to basic health and basic education services, which
amounted to 3.3% and 2.4%, respectively. As such HIV/AIDS is also a primary area of investment
for donors, which is in line with the local elite’s demand priorities.
Energy infrastructure is another area where ODA commitments and the local elite’s priorities
seem to match, yet with certain caveats. Access to electricity has been estimated as the second
most primary good in our choice experiment with low income elasticity. Renewable energy has
been identified by the elite as a major priority in most of the sample countries too. Donors’
allocation levels to energy infrastructure seem to reflect what is observed in our study. Around
4.3% of donors annual allocation commitments is made on energy infrastructure in developing
countries (2007-2012 average) (OECD, 2014). This share has been increasing in recent years too. A
similar trend is also observed with the shift of ODA’s energy focus from non-renewable power
generation to renewable power generation in recent years. According to the OECD data, while the
share of non-renewable investments in total energy investments dropped form 17.4% in 2007 to
6.6% to 2012, the share of renewables increased from 2.9% to 17.7% in the same period.
However, the share of electrical transmission/ distribution in total energy investment went down
from 27.8% to 16.8% in the same period, which may be due to increasing reliance on local
production and consumption of energy (OECD, 2014). Yet given that access to electricity is still a
major problem in vast areas in the developing world, electrical transmission/ distribution seems
to be an area of underinvestment.
ODA commitments on telecommunication, including telephone and internet which appeared to
be a luxury good in our survey, seems to be low and decreasing as compared to other
infrastructure areas. Only 0.4% of donors’ aid is allocated to communications on between 2007-
2012 on average (OECD, 2014). Even this small share seems to be decreasing in recent years.
Given that this trend is similar to the weak demand by the local elite, as we observed, it is likely
that both the local elite and donors might have left this area to private investment.

28
As for environmental goods, there are significant variations in donors’ involvement among
different areas of development. General environment protection is an area which gets only 3.3%
of ODA allocation (2007-2012 average). Biodiversity gets only 0.5% of the total ODA (OECD, 2014).
There does not seem to be a significant ODA commitment on clean air and climate mitigation in
developing countries. Given that these areas are not identified as primary/priority areas by the
local elite, and that they cannot be left to the private sector, there seems to be major
underinvestment in environmental protection. The forestry, on the other hand, was estimated to
have the second lowest income elasticity, indicating that it is one of the primary areas for the
elite. Yet the sector gets only 0.6% of total ODA allocation (OECD, 2014), hence the ODA allocation
patterns do not seem to reflect the elite’s demand for development in this field.
Water supply and sanitation which was estimated to be necessary good in both set of goals, is
also an area where there is significant ODA commitment. More than 4% of donor’s aid was
allocated to the water sector in 2012. Similarly agricultural investments were prioritized by the
local elite, which receive approximately 4% of all ODA commitments (OECD, 2014). However, both
areas exhibit substantial need gap, given the number of countries and people in need of help and
the amount of investment necessary. It is highly likely that the ODA commitments on these areas
do not match the demand by the local elite.
In sum, it is expected that governments ‘allocation priorities will continue to lie with primary
development areas. Donors should reflect on the properties of local demand for development in
their allocation of official development assistance. One implication of this might be that ODA
allocations should act as compliment for government allocations in the primary areas of
development while they could substitute for government allocation in secondary areas, where
there seems to be significant underinvestment. Hence, ODA priorities might need to be shifted to
the secondary areas of development, such as biodiversity and forest protection that pertain global
public good attributes.
6. Discussion
This paper contributes to the literature in international development and public choice by
estimating the properties of the local elite’s demand for development by using a choice
experiment. We used a unique individual level data on the elite of five developing countries from
a hypothetical choice experiment on 14 development goals. In repeated choice sets, the
respondents were asked to allocate a budget on a list of development goals where the relative
costs of achieving the goals – calculated based on the estimation of actual costs in each country –
and the relative income changed in each set. By using the Almost Ideal Demand System (AIDS),
for the first time in eliciting political preferences obtained through a choice experiment, we
identified the effect of cost and income on stated demand for development.
The expenditure coefficients (β), which measure the change in the particular goal’s budget share
with respect to a change in respondents’ budget, and cross cost coefficients ( ), which indicates
the sensitivity of the budget share of a goal to the change in the cost of other goals, were
estimated. A vast majority of the coefficients were significantly different from zero, which gives us
confidence on the validity of our results. We estimate that all expenditure coefficients for the

29
primary set of goals with the exception of “child health” and “telephone and internet” are
negative. This suggests that most of the primary goals are necessary goods, those relating to
“telephone and internet” and to some extent “child health” are, expenditure elastic, and hence
luxury goods. Among the seven goals, “electricity” and “HIV/AIDS” exhibit the lowest income
elasticities, indicating that they were assessed to be the most primary goals in the list.
While African respondents demand significantly more HIV/AIDS treatment as expected, male
respondents and respondents working for donor institutions and for the private sector tend to
demand less HIV/AIDS treatment, all other things being equal. Respondents from donor
organisations (and those working in the field of education) tend to demand more child health.
Respondents from the private sector, government institutions and academia tend to demand
more electrification. Investing in renewable energy, which exhibit higher income elasticity
according to our estimates, was ranked as the most important area among the list of secondary
development areas in relatively higher income countries in the sample. The local elite’s demand
for these areas is reflected in overseas development aid allocations.
It is noticeable that poverty alleviation in the form of income support had relative higher income
elasticity as compared to HIV/AIDS treatment, primary education, electricity and clean water.
This is unexpected given that poverty alleviation was ranked by far as the most important goal in
the first part of the questionnaire across the sample countries. This seeming anomaly may be due
to the consideration that the elite might be prioritising investment in areas that are related to the
causes of poverty (like HIV/AIDS, lack of access to electricity etc.) – that they might think would in
turn help alleviate it – rather than direct interventions in the form of income transfer as simulated
in our choice experiment.
As for the secondary set of goals, most expenditure elasticities are closer to luxury. Only the
demand for disaster preparedness and forest protection exhibit the property of normal goods.
Demographics factors such as the elite’s professional affiliation, education and gender, are found
to exhibit stronger influence on their demand for the secondary set than the primary set.
Respondents who have a postgraduate degree and those working for environmental institutions
tend to demand more biodiversity as expected, whereas respondents from government
institutions (mainly Parliamentarians), academia and donors spend less. The fact that
biodiversity preservation is seen as “luxury” and not as a priority by policy makers, academics and
donors alike is unexpected, given that our sample includes countries such as Guyana, Nepal and
Malawi, which are notably rich in plant and animal biodiversity. In addition, biodiversity gets only
0.5% of total ODA allocation, and thus there seems to be major underinvestment by donors in
environmental protection.
Ethnically African respondents and those working for donor agencies and for institutions
operating in the field of health services tend to spend more on clean water and sanitation. Access
to clean drinking water and basic sanitation had been ranked as the third most frequently
prioritised (among the top three) areas in the first part of the questionnaire. The demand for
clean water was estimated to be income inelastic, as expected. It appears to be prioritised by
donors, those working in health related sectors particularly in Sierra Leone, Malawi and Nepal. It
is also noticeable that respondents from the real economic sectors prioritise climate adaptation
more than mitigation, as compared to other respondents.

30
These findings suggest that, despite the recent efforts to widen the scope of international
development goals, the local elite’s demand priorities will continue to lie with the primary areas
of development, which may lead to important policy implications. Further research on actual
allocation behaviour of policy makers and donors would improve our understanding of how public
goals are set and allocation decisions are made, which would contribute to the literature in public
economics and policy.
References
Blanciforti; L., Green, R. (1983) "An Almost Ideal Demand System Incorporating Habits: An Analysis of Expenditures on Food and Aggregate Commodity Groups"The Review of Economics and Statistics, Vol. 65, No. 3, pp. 511-515
Collier, P. 2007. The Bottom Billion: Why the Poorest Countries are Failing and What Can Be Done About It. Oxford: Oxford University Press.
Deacon, Robert T. (1978) "A Demand Model for the Local Public Sector", The Review of Economics and Statistics, Vol. 60, No. 2 (Apr., 1978), pp. 184-192
Deaton A, Muellbauer J., "Almost Ideal Demand System", The American Economic Review, Vol. 70, No. 3 (Jun., 1980), pp. 312-326
Easterly, W. 2009. How the Millennium Development Goals are Unfair to Africa. World Development 37 (1):26-35.
Food and Agriculture Organization of the United Nations (FAO). 2009. FAOSTAT Food Security Statistics. FAO.
Grieg-Gran, Maryanne (2006)"The Cost of Avoiding Deforestation Report prepared for the Stern Review of the Economics of Climate Change International Institute for Environment and Development
Günther, I, Fink G. (2011), Water and Sanitation to Reduce Child Mortality: The Impact and Cost of Water and Sanitation Infrastructure, Policy Research Working Paper 5618

31
International Red Cross and Red Crescent, (2009), World Disasters Report 2009, http://www.ifrc.org/wdr
International Telecommunications Unions’ “Measuring the Information Society – The ICT Development Index”http://www.itu.int/ITU-D/ict/publications/idi/
Karapinar, B. 2010. Food Crises and the WTO. In Food Crises and the WTO, edited by B. Karapinar and C. Haberli. Cambridge, New York: Cambridge University Press.
Nelson et al. (2009) Climate Change Impact on Agriculture and Costs of Adaptation International Food Policy Research Institute Washington, D.C.
Nzumaa, Jonathan M., Sarkerb, Rakhal (2010) "An error corrected almost ideal demand system for major cereals in Kenya", Agricultural Economics 41, pp 43–50
Organisation for Economic Co-operation and Development (OECD) (2014), Aid Statistics, available at < http://www.oecd.org/dac/stats/>
Peter S., Lehmann, H. (2008) Renewable Energy Outlook 2030, Energy Watch Group Global Renewable Energy Scenarios, http://isusi.de/downloads/REO_2030_EE_fullText_en.pdf
Srivastava P., Harris, A. (2011) "The Allocation of Public Health Expenditure in Australia: A Demand System Approach", Centre for Health Economics Monash University Research Paper (62)
Sachs, J. 2005. The End of Poverty: How We Can Make It Happen In Our Life Time. London: Penguin Books.
Saith, A. 2006. From universal values to Millennium Development Goals: Lost in translation. Development and Change 37 (6):1167-1199.
Tridimas, G. (2001), "The economics and politics of the structure of public expenditure" Public Choice 106: 299–316.
UN Millennium Project. 2005. Investing in Development: A Practical Plan to Achieve the Millennium Development Goals. edited by J. Sachs. New York: United Nations.
United Nations Development Programme (UNDP). 2014, Human Development Index, www.undp.org.
United Nations Development Programme (UNDP). 2009. The Millennium Development Goals Report: 2009. UNDP.
United Nations Educational, Scientific and Cultural Organization (UNESCO), 2014, Institute for Statistics (UIS), http://www.uis.unesco.org/Pages/default.aspx
World Health Organisation, 2014, available at <www.who.org>
World Bank 2014, World Bank Database, available at <http://data.worldbank.org/>
Vandemoortele, J. 2009. The MDG Conundrum: Meeting the Targets Without Missing the Point. Development Policy Review 27 (4):355-371.
Verbeke,W., Ward, R W. (2001) "A fresh meat almost ideal demand system incorporating negative TV press and advertising impact Agricultural Economics 25 (2001) 359-374

32
Appendix A: allocation task example

33
Appendix B: Questionnaire
Stakeholders’ Perceptions and Policy Choices on Development: 2012 Survey
University of Bern, Switzerland
Please select your language to start the survey
English Nepali (नेपाली)

34
1. Introduction
Purpose of the Research
Developing countries around the world face numerous challenges ranging from economic development and poverty alleviation to combating diseases and climate change. While each country has its own needs and policy targets, there are also global targets for addressing these challenges.
The aim of this research project is to investigate national priorities in seven developing
countries, namely Georgia, Guyana, Malawi, Nepal, São Tomé and Príncipe, Sierra Leone
and Turkey (selected based on a scientific criteria). In each selected country, we have
identified major stakeholders that represent public institutions, non-governmental
organizations (NGOs), donor agencies, academia, media and the private sector. We aim to
shed light on how these stakeholders perceive development challenges, and how they
identify their own policy priorities and goals.
This survey is funded by the Swiss Network for International Studies (SNIS) (www.snis.ch). Under the coordination of the University of Bern in Switzerland, our project brings together nine leading universities from around the world. In implementing the research in Nepal, our partner is Tribhuvan University.
Questionnaire
This survey contains a questionnaire which is designed for the major stakeholders
involved in the public debate on development in Nepal. Since you were identified as an
important stakeholder, we would very much appreciate your participation in this survey.
The first part of the questionnaire contains statements about the challenges of development in Nepal; the second part consists of a budget allocation exercise where we would like to learn more about your preferences. The third part includes general statements on development policies. In the fourth part, you will also be asked a few personal background questions.
Duration of Participation
The survey should take approximately 20-30 minutes for you to complete.
Confidentiality
The opinions expressed in the questionnaire do not have to correspond with the official
opinion of your respective institution and all responses will remain anonymous and
confidential. Responses will be used only in combination with those provided by other
participants. All of the data collected during the study will be stored on a secure server

35
and will only be accessed by the researchers of the study. The data will be used for the
preparation of research reports related to this study.
Benefits to the Individual
We are grateful for your participation in this important and comprehensive study.
Although you will experience no direct benefit from completing this survey, you will,
however, have the chance to contribute to an important and comprehensive study that
aims to inform domestic and international policy debates to accelerate progress in
achieving development goals in the coming years. The results obtained from this survey
will be shared with all the participants in the form of a final report. The participants will
also be invited to a workshop in Nepal in 2012 to discuss the outcome of the study.
If you need clarification or have any questions about the study, please do not hesitate to
contact us through the correspondence details below. We thank you again for your
participation in this survey.
Warm Regards,
Dr. Baris Karapinar, University of Bern, Bern, Switzerland
e-mail: [email protected], Tel. +41 31 631 36 89
Prof. Arbinda Lal Bhomi, Tribhuvan University, Kathmandu, Nepal
e-mail: [email protected], Tel. 427 45 27
Mr. Paulo Cunha, Columbia University, New York, USA
e-mail: paulo.cunha1 gmail.com, Tel. +1 646 884 74 22

36
2. Part I
Here is a list of some development problems facing many countries. Please, indicate how serious you consider each one to be here in Nepal. Is it very serious (1), somewhat serious (2), not very serious (3) or not serious at all (4)?
Very serious Somewhat serious Not very serious Not serious at all
Poverty
Inadequate
access to
primary
education
Inadequate
access to higher
education
High rates of
population
growth
Inadequate
access to clean
water
Discrimination
against girls and
women
Unemployment
Corruption in
public
institutions
Political
instability
Human rights
violations
High crime rates
Climate change
Environmental
pollution
People sometimes talk about what the aims of this country should be for the
next ten years. Here is a list of some goals which different people would give
top priority. Could you please rank these goals in order of importance for
you as an individual? Please select the goals from the table below, drag and
drop them into the boxes marked with the rankings (from the 1st to the 6th.)
Start selecting the one you consider the most important and place it into the
box marked as the 1st, and then rank the rest up to the 6th most important.
Question 1
Question 2

37
Achieving a high level of economic growth and creating employment
More investment in all levels of education
Making sure this country has strong defence forces against external threats
More investment in all health services
Promoting environmental sustainability and addressing climate change
Promoting income equality among various segments of the society
Giving people more say in important government decisions
Building good government institutions and fighting corruption
Achieving gender equality for girls and women in education and in the work place
Have you heard of the Millennium Development Goals?
1 Yes 2 No
(If the answer is YES go to question 3b, if “no” go to question 4)
3b1. Are you regularly informed
about the MDGs monitoring in
the world?
1 Yes 2 No
3b2. Are you regularly informed about the Millennium Development Goals (MDGs)
monitoring in Nepal?
1 Yes 2 No
3b3. Are you regularly informed about development targets set nationally by Nepal?
1 Yes 2 No
1st most important
2nd most important
3rd most important
4th most important
5th most important
6th most important
Question 3
Question 3b (following questions on the same page)
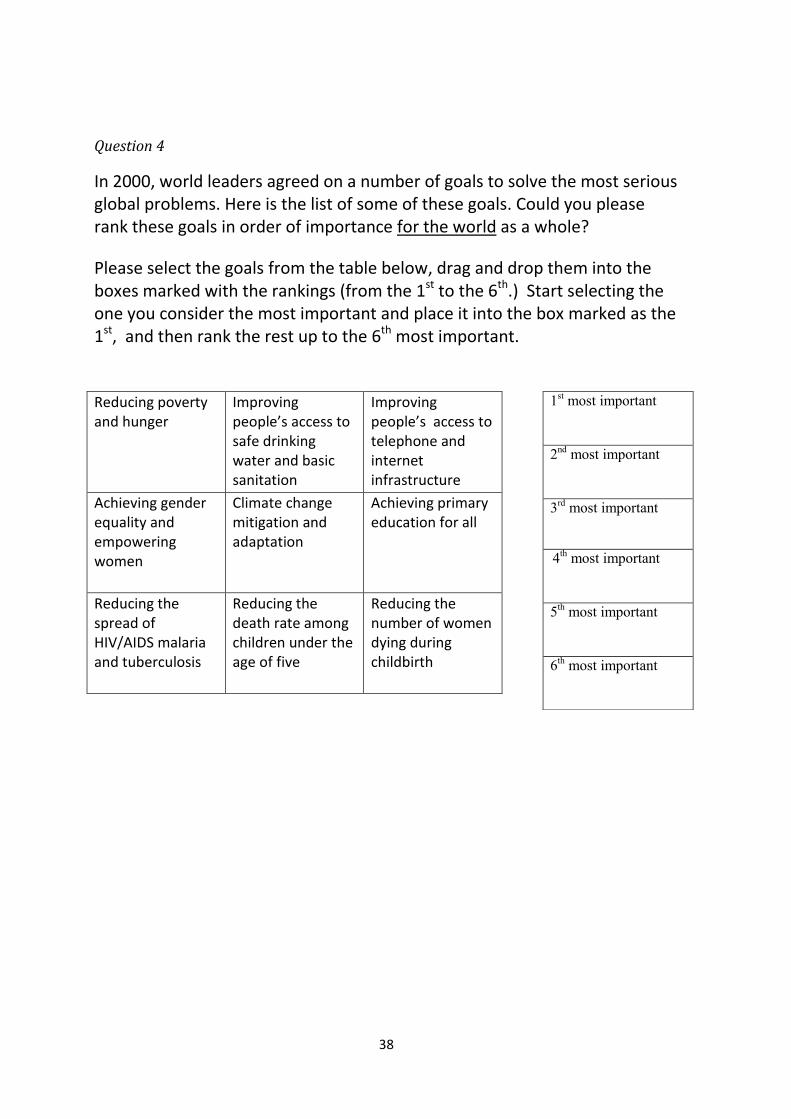
38
In 2000, world leaders agreed on a number of goals to solve the most serious global problems. Here is the list of some of these goals. Could you please rank these goals in order of importance for the world as a whole?
Please select the goals from the table below, drag and drop them into the boxes marked with the rankings (from the 1st to the 6th.) Start selecting the one you consider the most important and place it into the box marked as the 1st, and then rank the rest up to the 6th most important.
Question 4
Reducing poverty and hunger
Improving people’s access to safe drinking water and basic sanitation
Improving people’s access to telephone and internet infrastructure
Achieving gender equality and empowering women
Climate change mitigation and adaptation
Achieving primary education for all
Reducing the spread of HIV/AIDS malaria and tuberculosis
Reducing the death rate among children under the age of five
Reducing the number of women dying during childbirth
1st most important
2nd
most important
3rd
most important
4
th most important
5th most important
6th most important
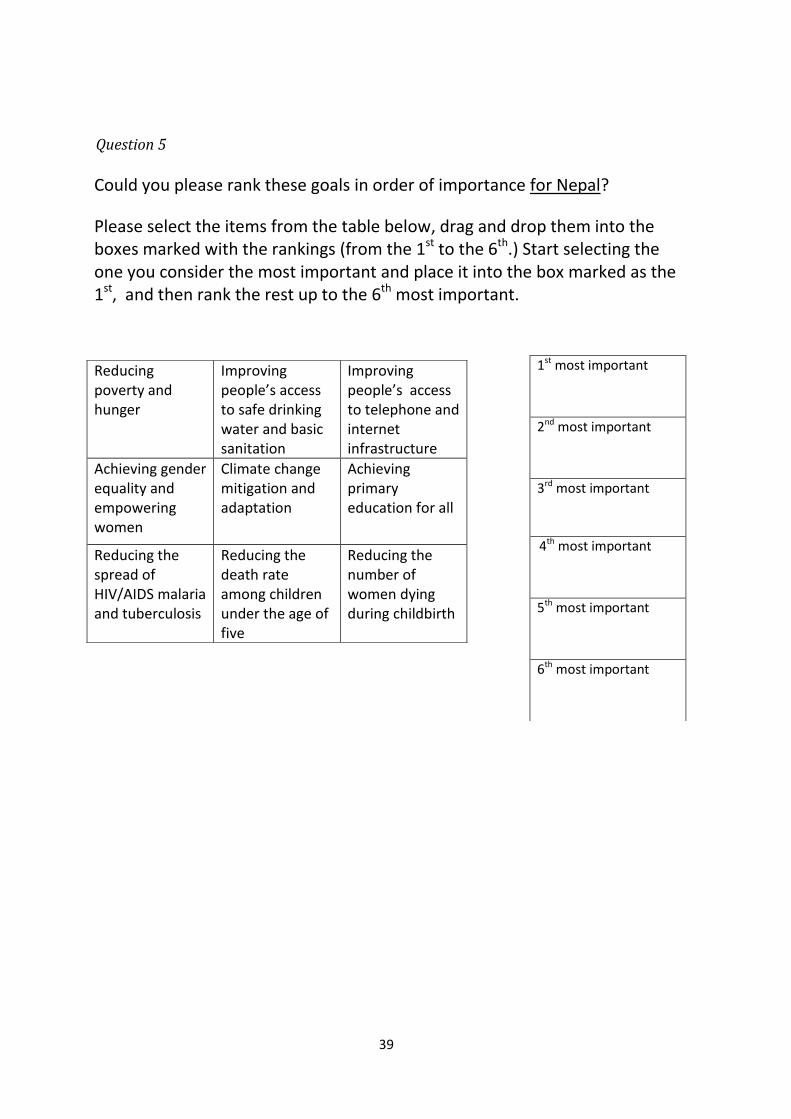
39
Could you please rank these goals in order of importance for Nepal?
Please select the items from the table below, drag and drop them into the boxes marked with the rankings (from the 1st to the 6th.) Start selecting the one you consider the most important and place it into the box marked as the 1st, and then rank the rest up to the 6th most important.
Question 5
Reducing poverty and hunger
Improving people’s access to safe drinking water and basic sanitation
Improving people’s access to telephone and internet infrastructure
Achieving gender equality and empowering women
Climate change mitigation and adaptation
Achieving primary education for all
Reducing the spread of HIV/AIDS malaria and tuberculosis
Reducing the death rate among children under the age of five
Reducing the number of women dying during childbirth
1st most important
2nd most important
3rd most important
4th most important
5th most important
6th most important

40
3. Part III
Some people believe that certain kinds of problems could be better handled by aid agencies or civil society organisations or the private sector rather than by each national government separately. Others think that these problems should be left entirely to the national governments. Some may also believe that public-private partnerships could be effective in dealing with these problems.
Here is a list of some goals addressing certain development problems. For each one, please indicate whether you think that services in this area should be provided primarily by the national governments, by bilateral and multilateral aid agencies, by civil society and charity organisations, by the private sector, or by public-private partnerships.
National
governments
Bilateral and
multilateral aid
agencies
Civil society and
charity
organisations
Private sector Public-private
partnerships
Poverty and
hunger
Primary
education
Health
services to
children and
women
Fighting
HIV/AIDS,
Malaria and
Tuberculosis
Telephone
and internet
infrastructure
Promoting
gender
equality
Water and
sanitation
facilities
Climate
change
mitigation
and
adaptation
Higher
education
Please state to which extent you agree the following statements:
Question 6
Question 7

41
7.1 Achieving progress in development goals in my country is not feasible without foreign aid
I strongly agree I agree Neither agree nor disagree I disagree I strongly disagree
7.2 The contribution of foreign aid to development efforts in my country has been insignificant or
minimal
I strongly agree I agree Neither agree nor disagree I disagree I strongly disagree
7.3 Foreign aid is counterproductive - as it hinders endogenous development.
I strongly agree I agree Neither agree nor disagree I disagree I strongly disagree
Please select what should be the foreign aid agencies’ top 6 priorities in your
country. Please select the areas from the table below, drag and drop them
into the boxes marked with the rankings (from the 1st to the 6th.)
Start selecting the one which you think should be the first priority area, and
place it into the box marked as the 1st, and then rank the rest up to the 6th
priority areas.
Question 8.

42
Higher education Climate change mitigation and adaptation
Water and sanitation facilities
Primary education Poverty and hunger
Telephone and internet infrastructure
Fighting HIV/AIDS, Malaria and Tuberculosis
Health services to children and women
Achieving gender equality for girls and women in education and in the work place
Business development in production sectors
Technology transfers Energy and transport infrastructure
Public institutional capacity building and policy advice
Development of civil society
Population and reproductive health
Here is the list of bilateral and multilateral donors operating in your country.
Which ones do you think are most successful in contributing to your
country's development?
Please mark the top 5 successful bilateral and multilateral donors.
Please select the donors from the table below, drag and drop them into the
boxes marked with the rankings (from the 1st to the 5th.) Start selecting the
one you consider the most successful and place it into the box marked as the
1st, and then rank the rest up to the 5th most important. If you think that
none of these donors are successful in contributing to your country's
development, please mark the 6th box below.
1st
priority for foreign aid
2nd
priority for foreign aid
3rd priority for foreign aid
4th priority for foreign aid
5th priority for foreign aid
6th priority for foreign aid
Question 9.

43
4. Part IV
A. What is your gender?
Male Female
B. In what year were you born? 19
C. Have you had any children?
No children
One child
Two children
Three children
Four children
Five children more children
D. What is the highest educational level that you have attained?
No formal education
Primary school
United Kingdom Asian Development
Bank United States of
America
Germany World Bank Japan
Norway Denmark European Union
Institutions
Switzerland Finland International
Monetary Fund (IMF)
Most successful
2nd most successful
3rd most successful
4th most successful
5th most successful
None of these donors
are successful
Question 10.

44
Secondary school
University degree
Post-graduate degree
A. In which profession/occupation are you doing most of your work? What is your job title there?
B. Which one of the following best describes the nature of the institution that you work for?
Government
Private industry
Media
Academia
Domestic non-profit organization
Foreign non-profit organization
International donor agency
Political association
C. How many years have you been working in your current post?
years
D. How many years have you been working in this sector?
years
E. Do you supervise other people at work?
Yes No
F. If yes, how many people do you supervise?
1-5
5-20
20-100
100+
A. Approximately how many permanent employees does your institution employ in total?
Question 11
Question 12

45
B. What is/are the main sector(s) that your organisation operate in (chose up to 5 sectors)?
D. What is the major source of funding for your organisation? (Mark more than one if
appropriate)
Commercial activities
State budget
Member fees
Donations from bilateral and multilateral aid agencies
Donations from foreign non-profit organisations
Others (please specify)please spe
On this card is a scale of incomes on which 1 indicates the "lowest income decile" and 10 the
"highest income decile" in your country. We would like to know in what group your household is.
Please, specify the appropriate number, counting all wages, salaries, pensions and other incomes
that come in.
Child and maternal health
Disease control
Primary and secondary education
Higher education
Human rights
Public sector governance
Banking and financial services
Food, agriculture, forestry, fishing
Manufacturing industry
Transport, communication and energy infrastructure
Trade
Tourism
Poverty and food security
Environment
Gender
Humanitarian aid
Question 13

46
Lowest
decile
1
2 3 4 5 6 7 8 9
Highest
decile
10
A. Which ethnic group you belong to?
Caucasian/white
Black
South Asian Indian, Pakistani, etc.
East Asian Chinese, Japanese, etc.
Arabic, Central Asian
Other
B. Who filled in the questionnaire (optional)?
Respondent's Name:
Comments
Question 14