Embed Size (px)
Citation preview
1 SIT Journal of Management
Vol. 3. No. 1. June 2013. Pp 83-108.
Gupta ISSN: 2278-9111
A Study on Performance Evaluation of Mutual Funds Based on Investors
preference
Bratati Gupta*
Abstract
Financial markets are offering more promising solutions & becoming more exhaustive with
financial products requiring new innovations. As a part of financial markets mutual funds
industry is responding very fast by understanding the dynamics of investor’s perception towards
rewards, they are continuously trying to differentiate their products and this is also visible in
designing mutual funds portfolio but these changes should met the investor’s expectations. With
the decline in the bank interest rates, frequent fluctuations in the secondary market and the
inherent attitude of Indian small investors to avoid risk, it is important on the part of fund
managers and mutual fund product designers to combine various elements of liquidity, return
and security in making mutual fund products the best possible alternative for the small investors
in Indian market. Thus, it is high time to understand the key factors that rules the investor’s
mind, their expectations, and unveil some extremely valuable information to support financial
decision making of mutual funds.The present study aims to analyse the factors which play a key
role in investors mind while taking investment decision. as well as to measure the performance of
selected mutual fund based on investors preference.
Keywords: Mutual fund, Risk-return, Sharp ratio, Beta
* Bratati Gupta, Assistant Professor, Institute of Business Management, Affiliated to Jadavpur
University, India, email : [email protected], M : +91(0) 9830503930.
2 SIT Journal of Management
Vol. 3. No. 1. June 2013. Pp 83-108.
Gupta ISSN: 2278-9111
Introduction
A Mutual Fund is a trust that pools the savings of a number of investors who share a common
financial goal or in other words we can say that it is a mechanism of pooling together the
investment of unsophisticated investors and turn in the hands of professionally managed fund
managers for consistent return along-with capital appreciation. The money collected& invested
by the fund manager in different types of securities depending upon the objective of the scheme.
These could range from shares to debentures to money market instruments collected in this
process are then invested in capital market instrument such as shares, debentures and other
securities. The income earned through these investments and its unit holders in proportion to the
number of units owned by them (pro rata) shares the capital appreciation realized by the scheme.
Mutual funds put forward a way out to investors to approach most schemes and get well-
diversified portfolio because investors with small savings neither have sufficient expertise nor
have access to required diversification. Anybody with an investible surplus of as little as a few
thousand rupees can invest in Mutual Funds. Each Mutual Fund scheme has a defined investment
objective and strategy.
Intensified competition and involvement of private players in the race of mutual funds have
forced professional managers to bring innovation in mutual funds. It has already entered into a
world of exciting innovative products. These products are now tailor made to suit specific needs
of investors. Thus, mutual funds industry has moved from offering a handful of schemes like
equity, debt or balanced funds to liquid, money market, sector specific funds, index funds and
giltedged funds. Beside this recently mutual funds have also introduced some special specific
funds like children plans, education plans, insurance linked plans, and exchange traded funds.
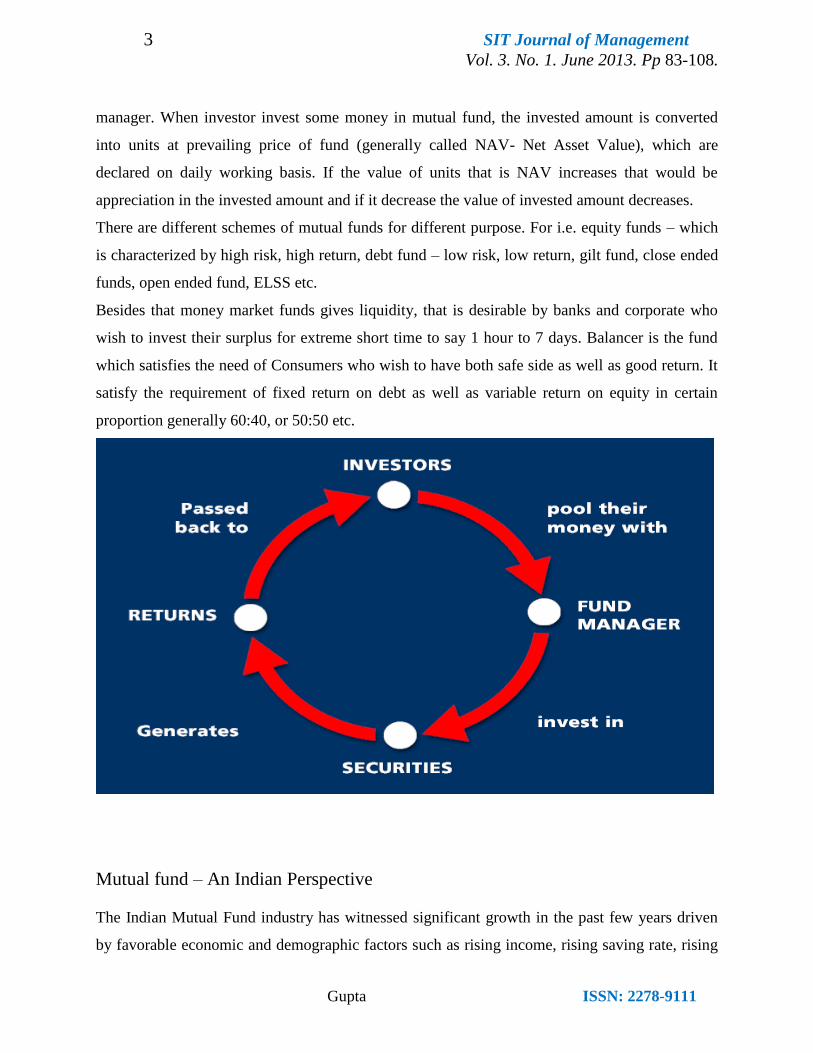
How mutual fund works – A Brief Idea
Mutual fund works on the concept “Small drops of water make a big ocean” i.e., Small investors
can also invest in mutual fund and earned a fair rate of return with less risk compare to shares..
Consumers invest their money into mutual fund through Asset Management Company (AMC).
There are experts available in the market, which are in constant touch with micro and macro
aggregates of the economy viz. share market, consumer preference; trend, fashion etc. act as fund
3 SIT Journal of Management
Vol. 3. No. 1. June 2013. Pp 83-108.
Gupta ISSN: 2278-9111
manager. When investor invest some money in mutual fund, the invested amount is converted
into units at prevailing price of fund (generally called NAV- Net Asset Value), which are
declared on daily working basis. If the value of units that is NAV increases that would be
appreciation in the invested amount and if it decrease the value of invested amount decreases.
There are different schemes of mutual funds for different purpose. For i.e. equity funds – which
is characterized by high risk, high return, debt fund – low risk, low return, gilt fund, close ended
funds, open ended fund, ELSS etc.
Besides that money market funds gives liquidity, that is desirable by banks and corporate who
wish to invest their surplus for extreme short time to say 1 hour to 7 days. Balancer is the fund
which satisfies the need of Consumers who wish to have both safe side as well as good return. It
satisfy the requirement of fixed return on debt as well as variable return on equity in certain
proportion generally 60:40, or 50:50 etc.
Mutual fund – An Indian Perspective
The Indian Mutual Fund industry has witnessed significant growth in the past few years driven
by favorable economic and demographic factors such as rising income, rising saving rate, rising
4 SIT Journal of Management
Vol. 3. No. 1. June 2013. Pp 83-108.
Gupta ISSN: 2278-9111
income earning-spending activity etc. Mutual funds in India was firstly launched in July 1964 by
UTI, with the objective of employment of individual savings into gigantic capital formation by
investing it in capital market, besides that there was strong need for channelizing household
savings for circulation and making it available for corporate for their productive use. At the same
time it was felt that UTI could be an effective option to bridge the gap between individual saving
and capital formation. UTI enjoyed the monopoly for almost two decades. In early nineties the
following players entered into the market. They are SBI (1987), Can Bank (1987), LIC (1989),
Indian Bank (1990), Bank of India (1990), PNB (1990), GIC (1991) etc. Presently the concept of
mutual fund has become very familiar to almost all retail Consumers.
Benefits
Diversification
One rule of investing, for both large and small investors, is asset diversification. Diversification
involves the mixing of investments within a portfolio and is used to manage risk By purchasing
mutual funds, investors are provided with the immediate benefit of instant diversification and
asset allocation without the large amounts of cash needed to create individual portfolios.
Economies of Scale
Mutual funds are able to take advantage of their buying and selling size and thereby reduce
transaction costs for investors. When you buy a mutual fund, you are able to diversify without
the numerous commission charges. With mutual funds, you can make transactions on a much
larger scale for less money.
Divisibility
Smaller denominations of mutual funds provide mutual fund investors the ability to make
periodic investments through monthly purchase plans. So, rather than having to wait until you
have enough money to buy higher-cost investments, investor can get in right away with mutual
funds. This provides an additional advantage - liquidity.

5 SIT Journal of Management
Vol. 3. No. 1. June 2013. Pp 83-108.
Gupta ISSN: 2278-9111
Liquidity
Another advantage of mutual funds is the ability to get in and out with relative ease. In general,
investors are able to sell mutual funds in a short period of time without there being much
difference between the sale price and the most current market value. However, it is important to
watch out for any fees associated with selling, including back-end load fees. Also, unlike stocks
and exchange-traded funds (ETFs), which trade any time during market hours, mutual funds
transact only once per day after the fund's net asset value (NAV) is calculated.
Professional Management
When an investor buys a mutual fund, they are also choosing a professional money manager.
This manager will invest the money where he or she has carefully researched. Therefore, rather
than having to thoroughly research every investment before investing , a mutual fund's money
manager is there to handle it for investors.
Potential of Returns
Returns in the mutual funds are generally better than any other option in any other avenue over a
reasonable period. People can pick their investment horizon and stay put in the chosen fund for
the duration. Equity funds can outperform most other investments over long periods by placing
long-term calls on fundamentally good stocks (2). The debt funds too will outperform other
options such as banks, though they are affected by the interest rate risk in general.
The Bottom Line
As with any investment, there are risks involved in buying mutual funds. These investment
vehicles can experience market fluctuations and sometimes provide returns below the overall
market. Also, the advantages gained from mutual funds are not free: many of them carry loads,
annual expense fees and penalties for early withdrawal.
6 SIT Journal of Management
Vol. 3. No. 1. June 2013. Pp 83-108.
Gupta ISSN: 2278-9111
Literature Review
A large number of studies on the growth and financial performance of mutual funds have been
carried out during the past, in the developed and developing countries.The pioneering work on
the mutual funds in U.S.A. was done by Friend, et al., (1962) made an extensive and systematic
study of 52 mutual funds found that mutual fund schemes earned an average annual return
Overall results did not suggest widespread inefficiency in the industry. Comparison of fund
returns with turnover and expense categories did not reveal a strong relationship.
Treynor (1965) coined a fund performance measure taking investment risk into account. Further,
to deal with a portfolio, „portfolio-possibility line‟ was used torelate expected return to the
portfolio owner‟s risk preference. The most prominent study by Sharpe, William F (1966)
developed a composite measure of return and risk. He evaluated 34 open-end mutual funds for
the period 1944-63. The results depicted that good performance was associated with low expense
ratio and not with the size. Sample schemes showed consistency in risk measure.
Treynor and Mazuy (1966) evaluated the performance of 57 fund managers in terms of their
market timing abilities and for the study adopted Treynor‟s (1965) methodology for reviewing
the performance of mutual funds.Jensen (1968) developed a composite portfolio evaluation
technique concerning risk-adjusted returns. He evaluated the ability of 115 fund managers in
selecting securities during the period 1945-66.Jensen concluded that, there was very little
evidence that funds were able to perform significantly better than expected as fund managers
were not able to forecast securities price movements.
McDonald and John (1974) examined 123 mutual funds and identified the existence of positive
relationship between objectives and risk. The study identified the existence of positive
relationship between return and risk. Gupta (1974) evaluated the performance of mutual fund
industry for the period 1962-71 using Sharpe, Treynor, and Jensen models. All the funds covered
under the study outperformed the market irrespective of the choice of market index. The results
indicated that all the three models provided identical results. Return per unit of risk varied with
7 SIT Journal of Management
Vol. 3. No. 1. June 2013. Pp 83-108.
Gupta ISSN: 2278-9111
the level of volatility assumed and he concluded that, funds with higher volatility exhibited
superior performance.
Meyer‟s (1977) findings based on stochastic dominance model revalidated Sharpe‟s findings
with the caution that it was relevant for mutual funds in the designated past rather than for the
future period.Gupta Ramesh (1989) evaluated fund performance in India comparing the returns
earned by schemes of similar risk and similar constraints. Mutual fund return due to selectivity
was decomposed into return due to selection of securities and timing of Investment in a
particular class of securities. Sarkar A K (1991) critically examined mutual fund evaluation
methodology and pointed out that Sharpe and Treynor performance measures ranked mutual
funds alike inspite of their differences in terms. Sahu R K (1992) identified mutual funds as a
suitable investment vehicle to strengthen capital market, as the total assets were around
Rs.30,000 crores while the total resources in equity was less than 15 percent of market
capitalization.
Objectives of the Study
The buying intent of a mutual fund product by a investor can be of multiple reasons depending
upon the investors risk return trade off.. Due to the constant reduction in bank FD rates &
extreme volatility in stock market investors are looking for a safe avenue for their small time
investment, which will provide them a higher return. So Mutual fund offers the best alternative
to the Indian investors. So the study attempts to achieve the following objectives.
• To analyse factors that influence most while investing in mutual funds.
• To evaluate performance of mutual fund schemes preferred by investors on the basis of return
parameters.
Research Methodology
Research is divided into two different studies:
Research 1:
Primary Research to know the Factors which play a key role while investing in mutual funds.
The survey is conducted with the help of a structured questionnaire based on different parameter
8 SIT Journal of Management
Vol. 3. No. 1. June 2013. Pp 83-108.
Gupta ISSN: 2278-9111
of investors preference on a sample of 80 respondents. Out of which 57 completed responses are
considered for the purpose of the study Apart from the primary survey on the different
parameters a chi-square test is conducted on the respondent to judge the key factors & to find
their preferences.
Research 2:
Secondary Research to evaluate the performance of Mutual funds which are preferred by most of
the investors .Three mutual fund sectors viz. tax funds, equity diversified funds and balanced
funds are selected and top 5 schemes based on their performance from each segment is selected
for further analysis.
Demographic profile of the Respondents
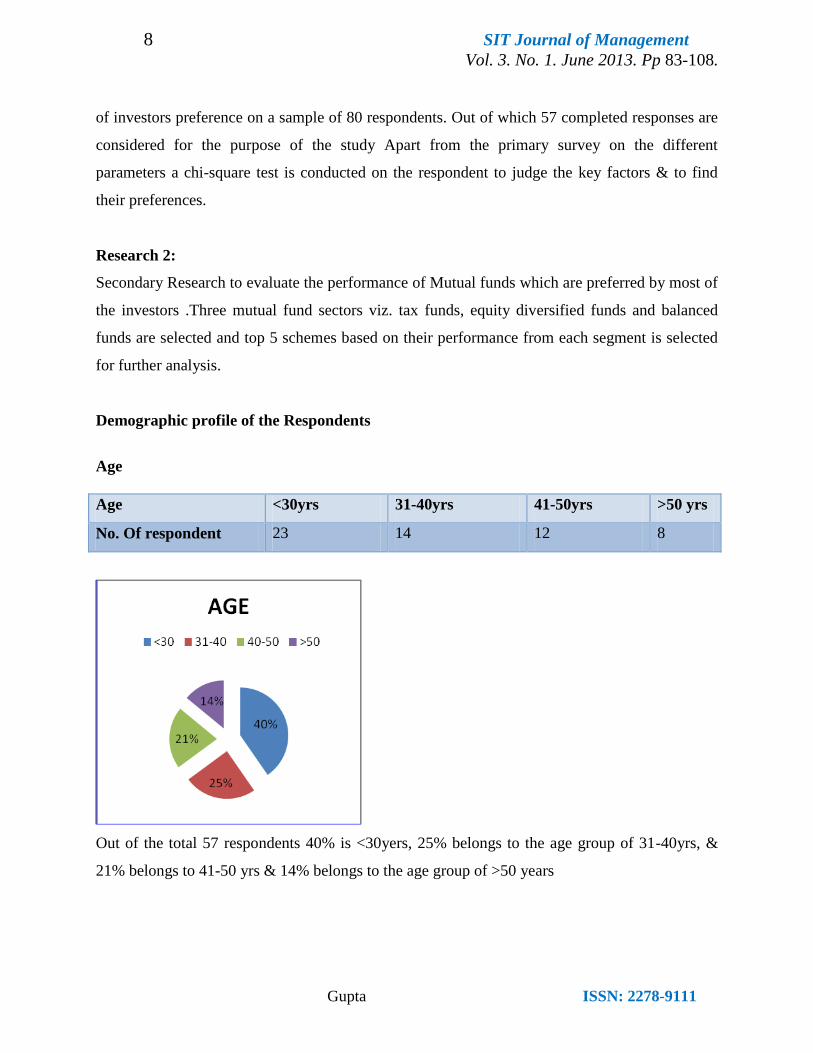
Age
Age <30yrs 31-40yrs 41-50yrs >50 yrs
No. Of respondent 23 14 12 8
Out of the total 57 respondents 40% is <30yers, 25% belongs to the age group of 31-40yrs, &
21% belongs to 41-50 yrs & 14% belongs to the age group of >50 years

9 SIT Journal of Management
Vol. 3. No. 1. June 2013. Pp 83-108.
Gupta ISSN: 2278-9111
Qualification
Qualification Under graduate Graduates Post Graduate Professionals
No. Of respondent 2 25 20 10
Among the 57 respondents 3% are undegraduate,44% are graduate &35% ,18% are post graduate
& professionals respectively.
Occupation
Occupation - Professional Business Salaried Retired
No. Of respondent 10 8 35 4
10 SIT Journal of Management
Vol. 3. No. 1. June 2013. Pp 83-108.
Gupta ISSN: 2278-9111
Among the total respondents 61% are salaried people, 7% retired, 18% professionals & 14%
belongs to business class.
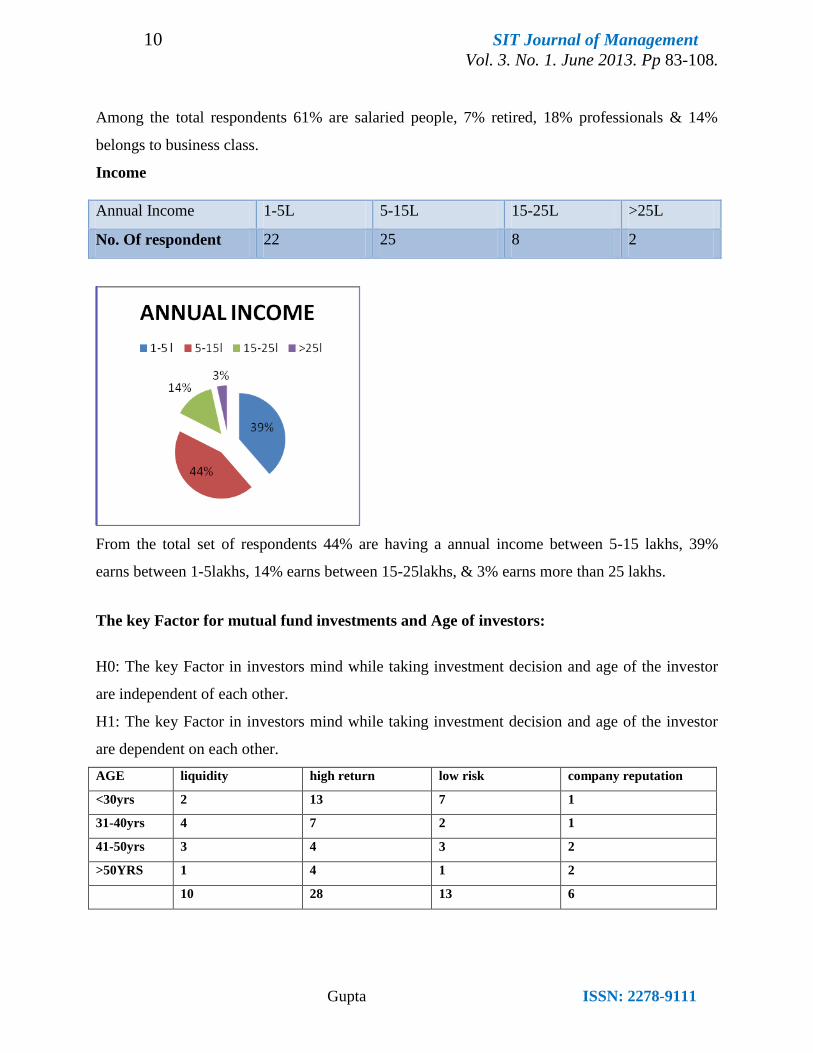
Income
Annual Income 1-5L 5-15L 15-25L >25L
No. Of respondent 22 25 8 2
From the total set of respondents 44% are having a annual income between 5-15 lakhs, 39%
earns between 1-5lakhs, 14% earns between 15-25lakhs, & 3% earns more than 25 lakhs.
The key Factor for mutual fund investments and Age of investors:
H0: The key Factor in investors mind while taking investment decision and age of the investor
are independent of each other.
H1: The key Factor in investors mind while taking investment decision and age of the investor
are dependent on each other.
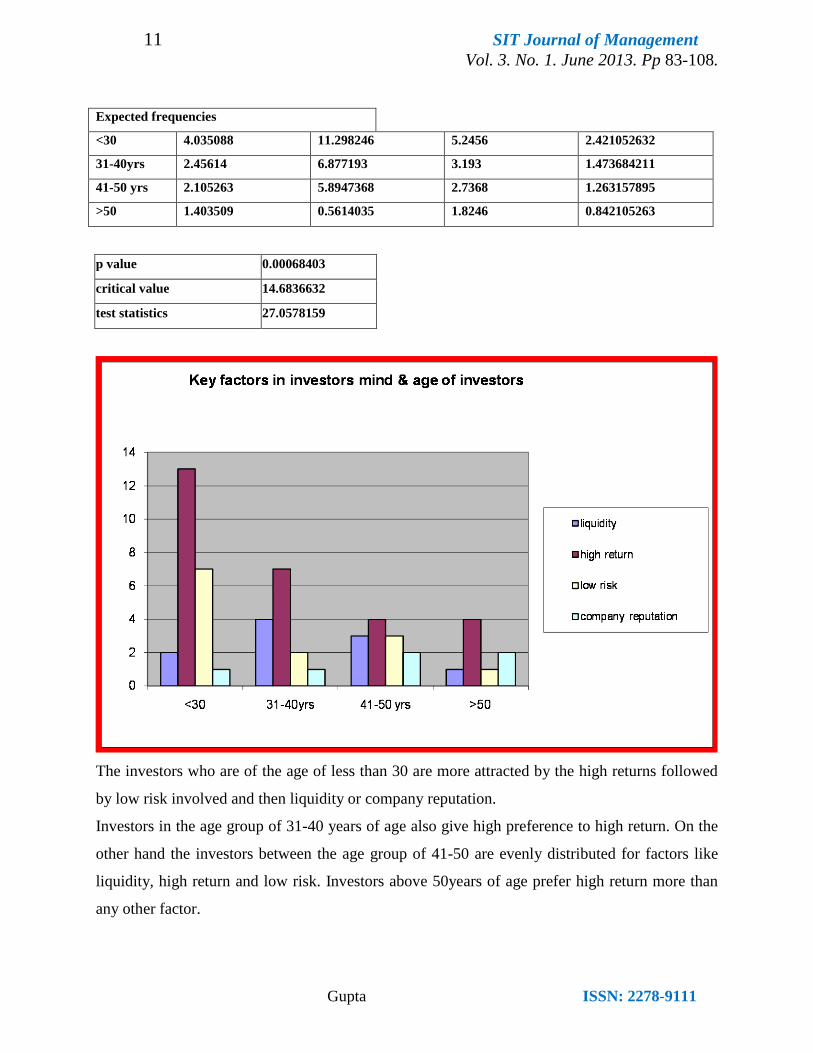
AGE liquidity high return low risk company reputation
<30yrs 2 13 7 1
31-40yrs 4 7 2 1
41-50yrs 3 4 3 2
>50YRS 1 4 1 2
10 28 13 6
11 SIT Journal of Management
Vol. 3. No. 1. June 2013. Pp 83-108.
Gupta ISSN: 2278-9111
Expected frequencies
<30 4.035088 11.298246 5.2456 2.421052632
31-40yrs 2.45614 6.877193 3.193 1.473684211
41-50 yrs 2.105263 5.8947368 2.7368 1.263157895
>50 1.403509 0.5614035 1.8246 0.842105263
p value 0.00068403
critical value 14.6836632
test statistics 27.0578159
The investors who are of the age of less than 30 are more attracted by the high returns followed
by low risk involved and then liquidity or company reputation.
Investors in the age group of 31-40 years of age also give high preference to high return. On the
other hand the investors between the age group of 41-50 are evenly distributed for factors like
liquidity, high return and low risk. Investors above 50years of age prefer high return more than
any other factor.
12 SIT Journal of Management
Vol. 3. No. 1. June 2013. Pp 83-108.
Gupta ISSN: 2278-9111
Chi square calculated value is 27.0578 and critical value for the same at 10% level of significance is
14.68. as calculated value is more than tabulated value Ho is rejected. thus there is significant
relationship between two variables.) .This means that age of the investor and the key factors in
investors while taking investment decisions are dependent on each other.
Annual Income of the Respondent and % Investment of Mutual Fund in Total
Investments.
H0: Annual income of the individual investor and annual investment in mutual fund are
Independent of each other
H1: Annual income of the individual investor and annual investment in mutual fund are
Dependent on each other.
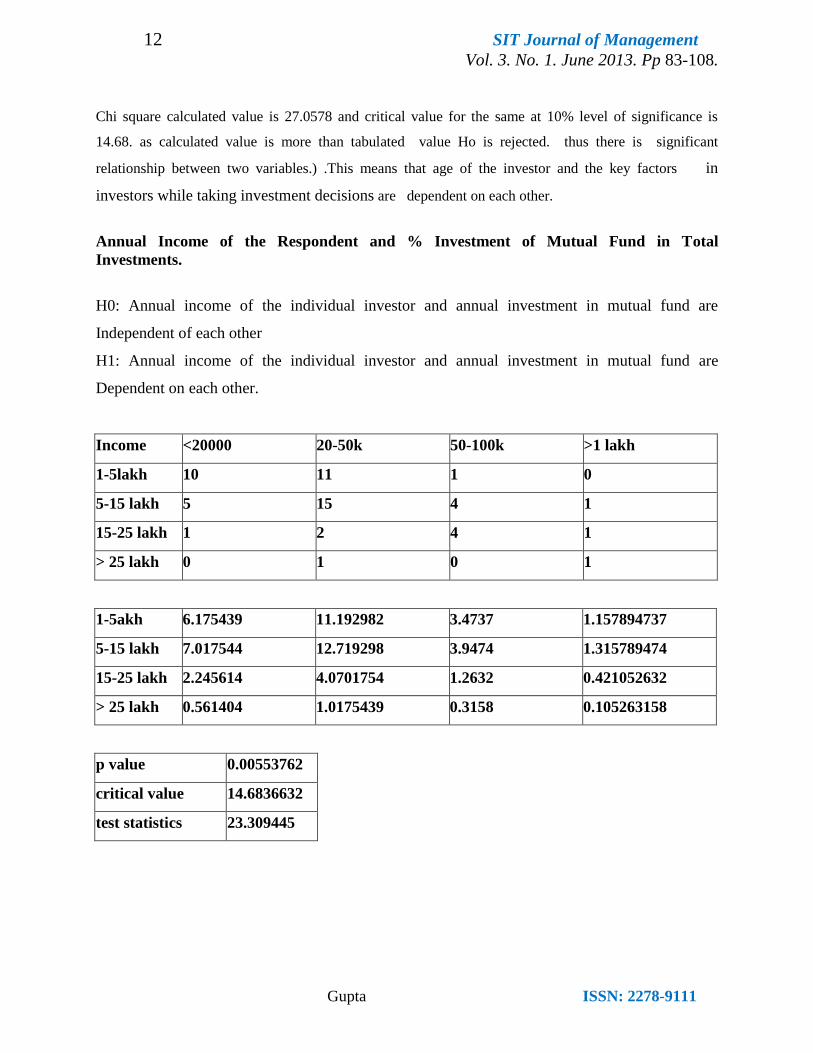
Income <20000 20-50k 50-100k >1 lakh
1-5lakh 10 11 1 0
5-15 lakh 5 15 4 1
15-25 lakh 1 2 4 1
> 25 lakh 0 1 0 1
1-5akh 6.175439 11.192982 3.4737 1.157894737
5-15 lakh 7.017544 12.719298 3.9474 1.315789474
15-25 lakh 2.245614 4.0701754 1.2632 0.421052632
> 25 lakh 0.561404 1.0175439 0.3158 0.105263158
p value 0.00553762
critical value 14.6836632
test statistics 23.309445
13 SIT Journal of Management
Vol. 3. No. 1. June 2013. Pp 83-108.
Gupta ISSN: 2278-9111
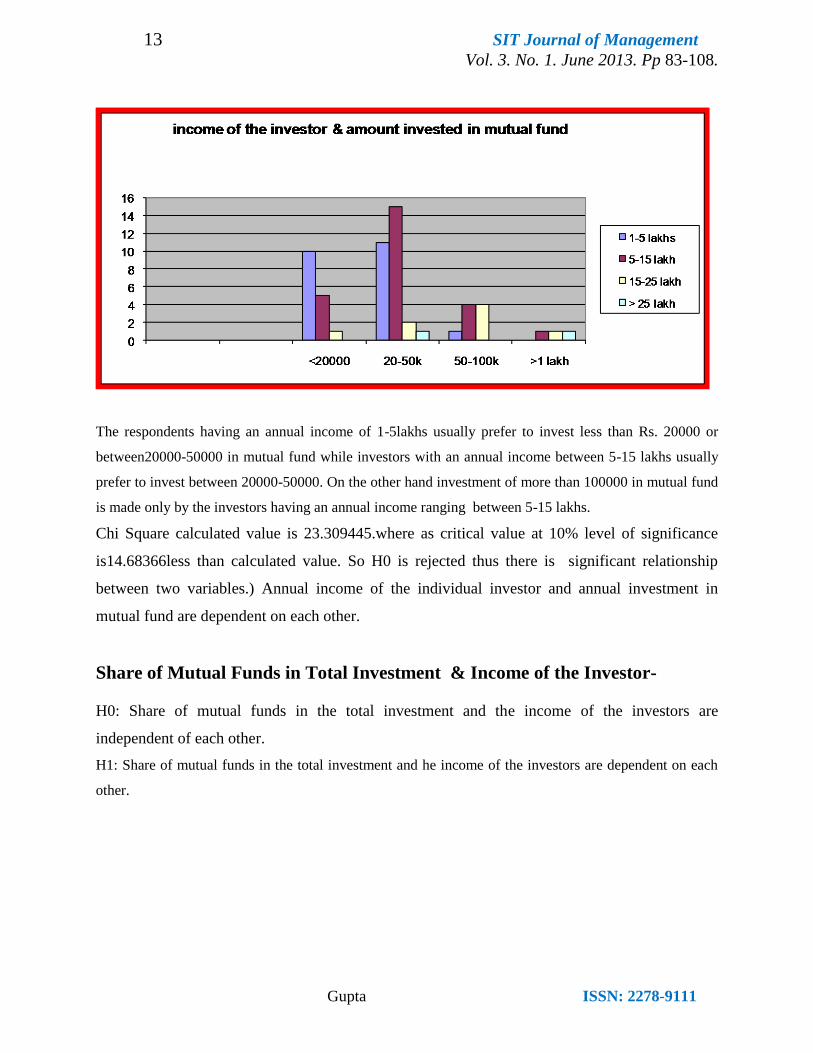
The respondents having an annual income of 1-5lakhs usually prefer to invest less than Rs. 20000 or
between20000-50000 in mutual fund while investors with an annual income between 5-15 lakhs usually
prefer to invest between 20000-50000. On the other hand investment of more than 100000 in mutual fund
is made only by the investors having an annual income ranging between 5-15 lakhs.
Chi Square calculated value is 23.309445.where as critical value at 10% level of significance
is14.68366less than calculated value. So H0 is rejected thus there is significant relationship
between two variables.) Annual income of the individual investor and annual investment in
mutual fund are dependent on each other.
Share of Mutual Funds in Total Investment & Income of the Investor-
H0: Share of mutual funds in the total investment and the income of the investors are
independent of each other.
H1: Share of mutual funds in the total investment and he income of the investors are dependent on each
other.
14 SIT Journal of Management
Vol. 3. No. 1. June 2013. Pp 83-108.
Gupta ISSN: 2278-9111
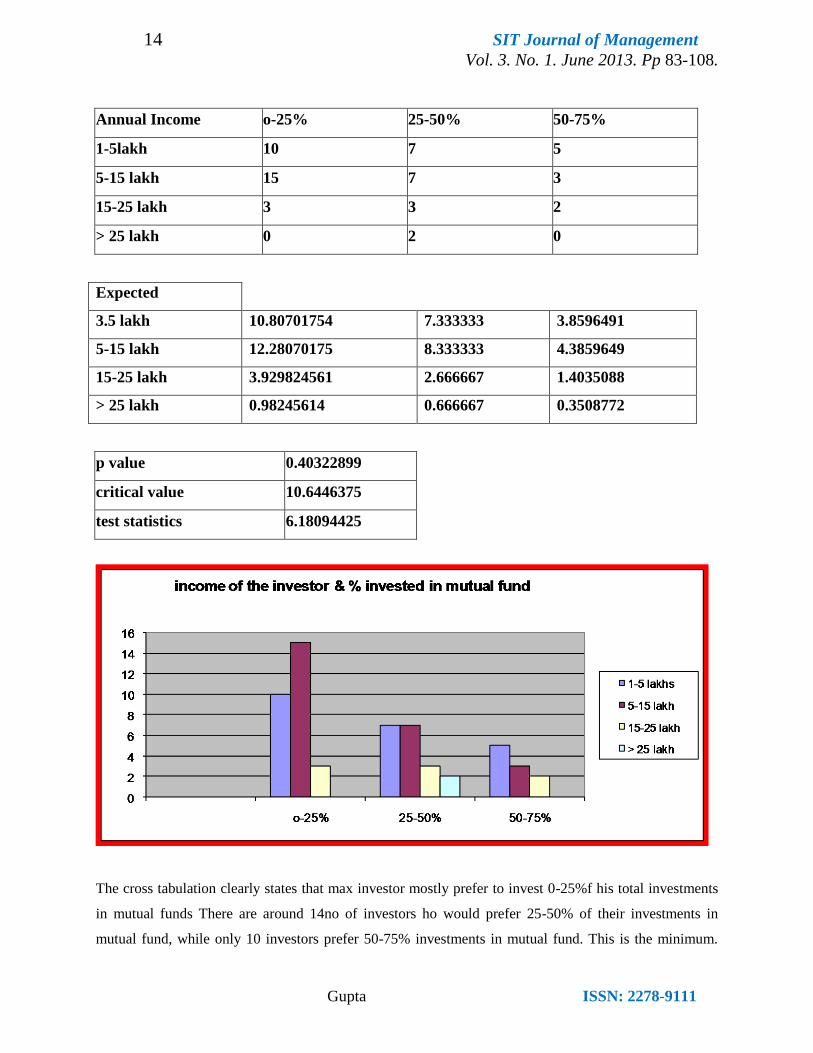
Annual Income o-25% 25-50% 50-75%
1-5lakh 10 7 5
5-15 lakh 15 7 3
15-25 lakh 3 3 2
> 25 lakh 0 2 0
Expected
3.5 lakh 10.80701754 7.333333 3.8596491
5-15 lakh 12.28070175 8.333333 4.3859649
15-25 lakh 3.929824561 2.666667 1.4035088
> 25 lakh 0.98245614 0.666667 0.3508772
p value 0.40322899
critical value 10.6446375
test statistics 6.18094425
The cross tabulation clearly states that max investor mostly prefer to invest 0-25%f his total investments
in mutual funds There are around 14no of investors ho would prefer 25-50% of their investments in
mutual fund, while only 10 investors prefer 50-75% investments in mutual fund. This is the minimum.
15 SIT Journal of Management
Vol. 3. No. 1. June 2013. Pp 83-108.
Gupta ISSN: 2278-9111
Moreover the above table also states that annual income does not have any impact on % investment of
mutual fund out of total investment and a high income does not mean that his investment in mutual fund
would also be high.
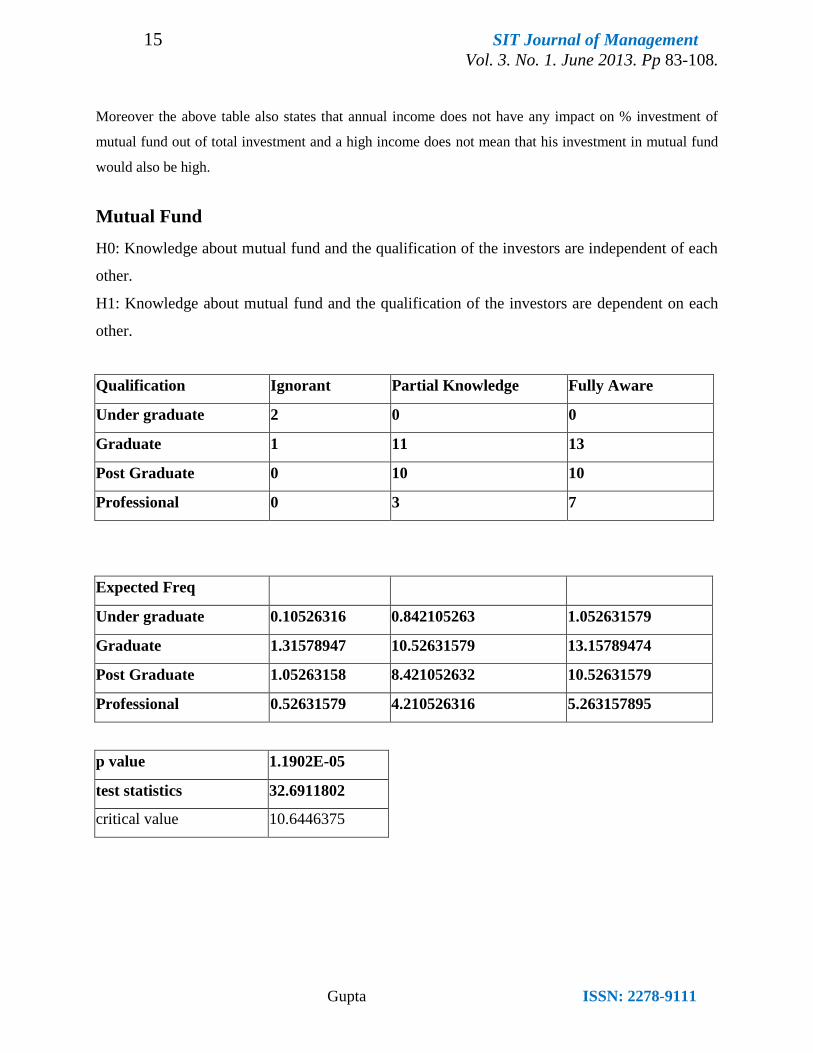
Mutual Fund
H0: Knowledge about mutual fund and the qualification of the investors are independent of each
other.
H1: Knowledge about mutual fund and the qualification of the investors are dependent on each
other.
Qualification Ignorant Partial Knowledge Fully Aware
Under graduate 2 0 0
Graduate 1 11 13
Post Graduate 0 10 10
Professional 0 3 7
Expected Freq
Under graduate 0.10526316 0.842105263 1.052631579
Graduate 1.31578947 10.52631579 13.15789474
Post Graduate 1.05263158 8.421052632 10.52631579
Professional 0.52631579 4.210526316 5.263157895
p value 1.1902E-05
test statistics 32.6911802
critical value 10.6446375
16 SIT Journal of Management
Vol. 3. No. 1. June 2013. Pp 83-108.
Gupta ISSN: 2278-9111
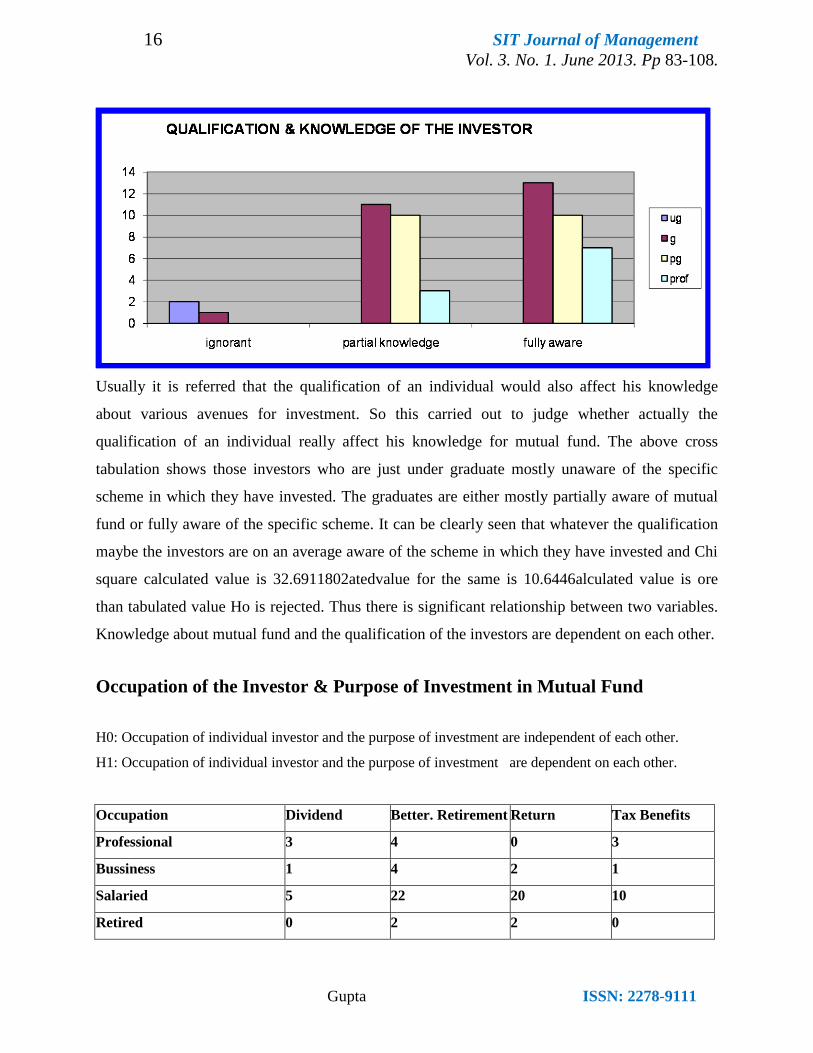
Usually it is referred that the qualification of an individual would also affect his knowledge
about various avenues for investment. So this carried out to judge whether actually the
qualification of an individual really affect his knowledge for mutual fund. The above cross
tabulation shows those investors who are just under graduate mostly unaware of the specific
scheme in which they have invested. The graduates are either mostly partially aware of mutual
fund or fully aware of the specific scheme. It can be clearly seen that whatever the qualification
maybe the investors are on an average aware of the scheme in which they have invested and Chi
square calculated value is 32.6911802atedvalue for the same is 10.6446alculated value is ore
than tabulated value Ho is rejected. Thus there is significant relationship between two variables.
Knowledge about mutual fund and the qualification of the investors are dependent on each other.
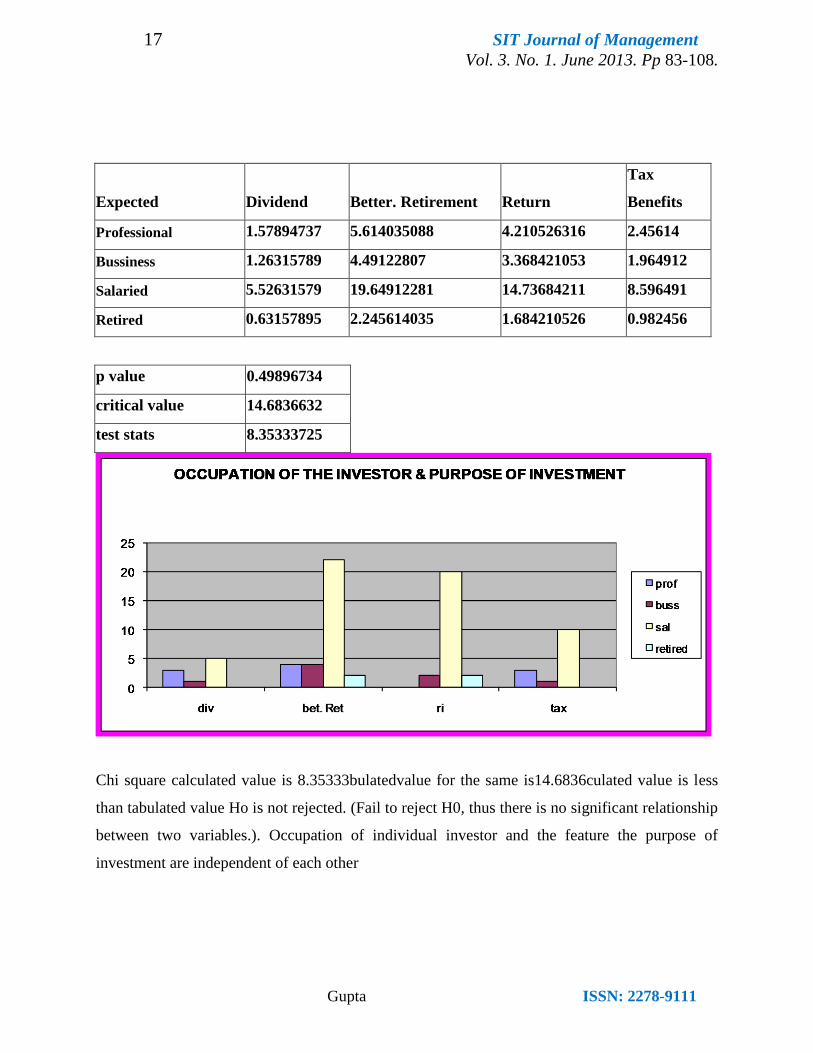
Occupation of the Investor & Purpose of Investment in Mutual Fund
H0: Occupation of individual investor and the purpose of investment are independent of each other.
H1: Occupation of individual investor and the purpose of investment are dependent on each other.
Occupation Dividend Better. Retirement Return Tax Benefits
Professional 3 4 0 3
Bussiness 1 4 2 1
Salaried 5 22 20 10
Retired 0 2 2 0
17 SIT Journal of Management
Vol. 3. No. 1. June 2013. Pp 83-108.
Gupta ISSN: 2278-9111
Expected Dividend Better. Retirement Return
Tax
Benefits
Professional 1.57894737 5.614035088 4.210526316 2.45614
Bussiness 1.26315789 4.49122807 3.368421053 1.964912
Salaried 5.52631579 19.64912281 14.73684211 8.596491
Retired 0.63157895 2.245614035 1.684210526 0.982456
p value 0.49896734
critical value 14.6836632
test stats 8.35333725
Chi square calculated value is 8.35333bulatedvalue for the same is14.6836culated value is less
than tabulated value Ho is not rejected. (Fail to reject H0, thus there is no significant relationship
between two variables.). Occupation of individual investor and the feature the purpose of
investment are independent of each other
18 SIT Journal of Management
Vol. 3. No. 1. June 2013. Pp 83-108.
Gupta ISSN: 2278-9111
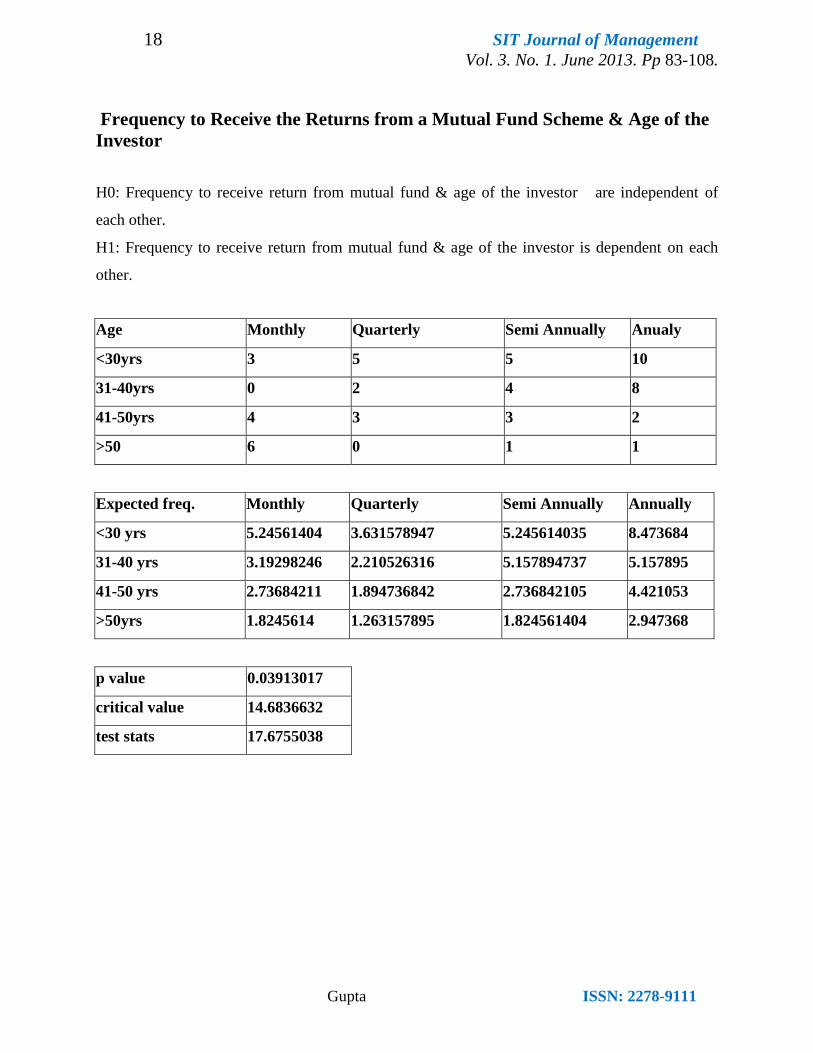
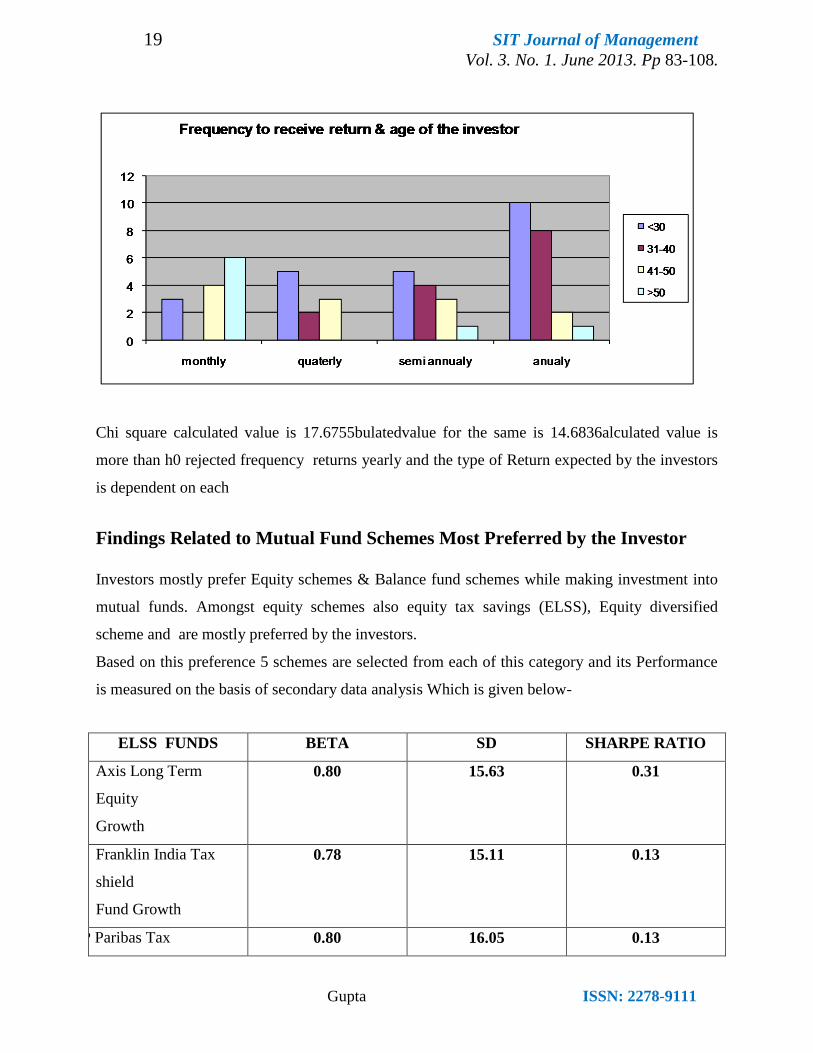
Frequency to Receive the Returns from a Mutual Fund Scheme & Age of the
Investor
H0: Frequency to receive return from mutual fund & age of the investor are independent of
each other.
H1: Frequency to receive return from mutual fund & age of the investor is dependent on each
other.
Age Monthly Quarterly Semi Annually Anualy
<30yrs 3 5 5 10
31-40yrs 0 2 4 8
41-50yrs 4 3 3 2
>50 6 0 1 1
Expected freq. Monthly Quarterly Semi Annually Annually
<30 yrs 5.24561404 3.631578947 5.245614035 8.473684
31-40 yrs 3.19298246 2.210526316 5.157894737 5.157895
41-50 yrs 2.73684211 1.894736842 2.736842105 4.421053
>50yrs 1.8245614 1.263157895 1.824561404 2.947368
p value 0.03913017
critical value 14.6836632
test stats 17.6755038
19 SIT Journal of Management
Vol. 3. No. 1. June 2013. Pp 83-108.
Gupta ISSN: 2278-9111
Chi square calculated value is 17.6755bulatedvalue for the same is 14.6836alculated value is
more than h0 rejected frequency returns yearly and the type of Return expected by the investors
is dependent on each
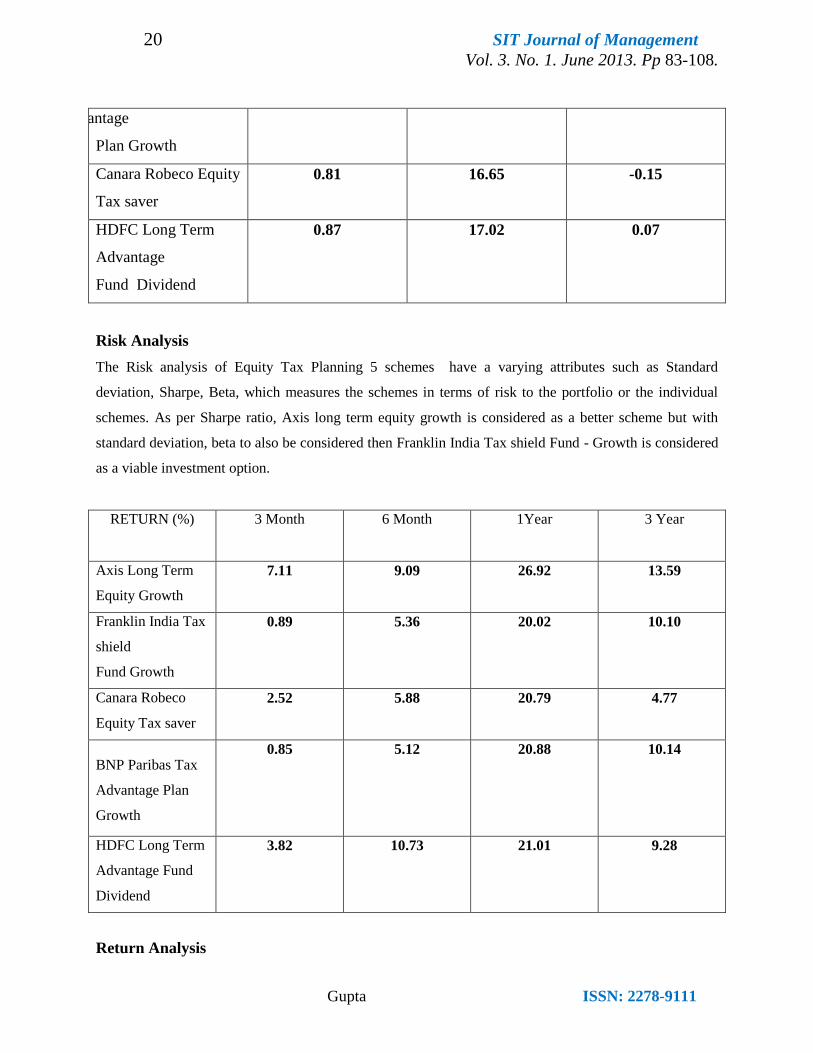
Findings Related to Mutual Fund Schemes Most Preferred by the Investor
Investors mostly prefer Equity schemes & Balance fund schemes while making investment into
mutual funds. Amongst equity schemes also equity tax savings (ELSS), Equity diversified
scheme and are mostly preferred by the investors.
Based on this preference 5 schemes are selected from each of this category and its Performance
is measured on the basis of secondary data analysis Which is given below-
ELSS FUNDS BETA SD SHARPE RATIO
Axis Long Term
Equity
Growth
0.80 15.63 0.31
Franklin India Tax
shield
Fund Growth
0.78 15.11 0.13
BNP Paribas Tax 0.80 16.05 0.13
20 SIT Journal of Management
Vol. 3. No. 1. June 2013. Pp 83-108.
Gupta ISSN: 2278-9111
Advantage
Plan Growth
Canara Robeco Equity
Tax saver
0.81 16.65 -0.15
HDFC Long Term
Advantage
Fund Dividend
0.87 17.02 0.07
Risk Analysis
The Risk analysis of Equity Tax Planning 5 schemes have a varying attributes such as Standard
deviation, Sharpe, Beta, which measures the schemes in terms of risk to the portfolio or the individual
schemes. As per Sharpe ratio, Axis long term equity growth is considered as a better scheme but with
standard deviation, beta to also be considered then Franklin India Tax shield Fund - Growth is considered
as a viable investment option.
RETURN (%) 3 Month 6 Month 1Year 3 Year
Axis Long Term
Equity Growth
7.11 9.09 26.92 13.59
Franklin India Tax
shield
Fund Growth
0.89 5.36 20.02 10.10
Canara Robeco
Equity Tax saver
2.52 5.88 20.79 4.77
BNP Paribas Tax
Advantage Plan
Growth
0.85 5.12 20.88 10.14
HDFC Long Term
Advantage Fund
Dividend
3.82 10.73 21.01 9.28
Return Analysis
21 SIT Journal of Management
Vol. 3. No. 1. June 2013. Pp 83-108.
Gupta ISSN: 2278-9111
For the return analysis of Equity Tax Planning 5 schemes it can be seen that all the returns of all the
schemes is maximized in 1 year rather than 3 year returns so here investor should have to invest for a
year. As per 1 year return Axis long term equity growth shows the highest return of 26.92% followed by
HDFC long Term Fund advantage dividend giving a return of 21.01%. while the schemes such as BNP
Paribas Tax Advantage Plan – Franklin India tax shield fund growth Canara Robeco Equity Tax saver
gave a average return of 20.88% to 20.02%. So considering both the risk & return aspect Axis Long
Term Equity Growth found to be a viable option for the investors.
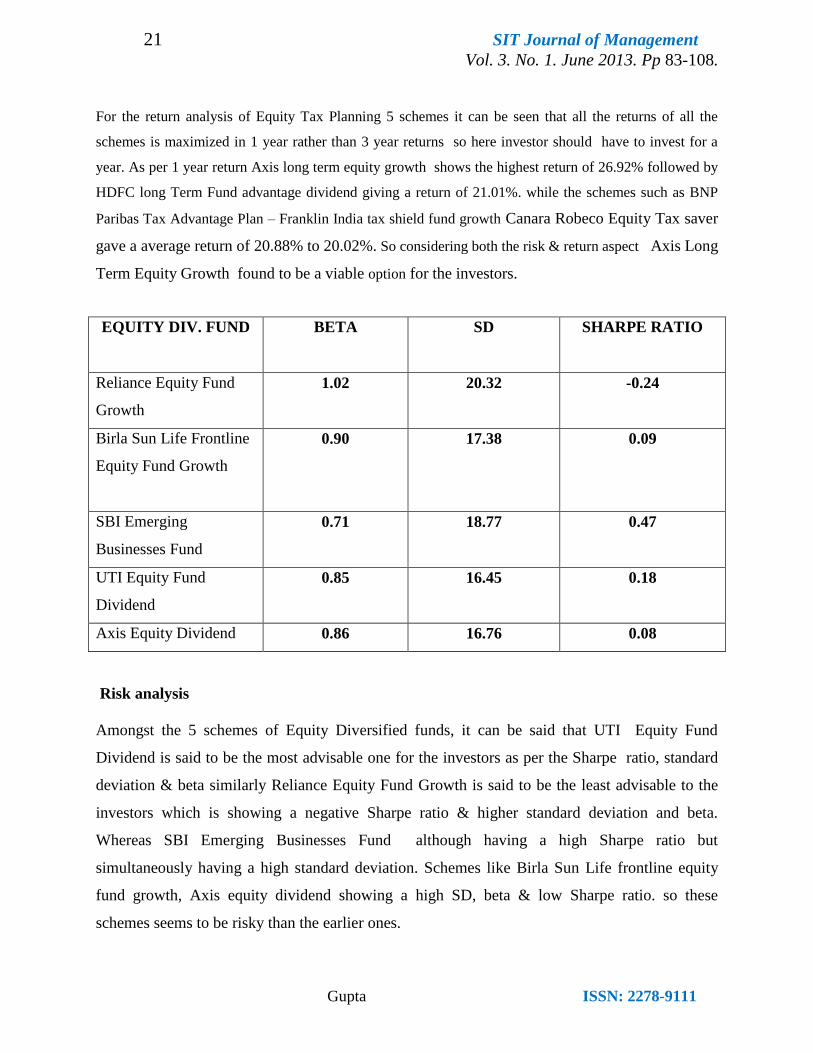
EQUITY DIV. FUND BETA SD SHARPE RATIO
Reliance Equity Fund
Growth
1.02 20.32 -0.24
Birla Sun Life Frontline
Equity Fund Growth
0.90 17.38 0.09
SBI Emerging
Businesses Fund
0.71 18.77 0.47
UTI Equity Fund
Dividend
0.85 16.45 0.18
Axis Equity Dividend 0.86 16.76 0.08
Risk analysis
Amongst the 5 schemes of Equity Diversified funds, it can be said that UTI Equity Fund
Dividend is said to be the most advisable one for the investors as per the Sharpe ratio, standard
deviation & beta similarly Reliance Equity Fund Growth is said to be the least advisable to the
investors which is showing a negative Sharpe ratio & higher standard deviation and beta.
Whereas SBI Emerging Businesses Fund although having a high Sharpe ratio but
simultaneously having a high standard deviation. Schemes like Birla Sun Life frontline equity
fund growth, Axis equity dividend showing a high SD, beta & low Sharpe ratio. so these
schemes seems to be risky than the earlier ones.
22 SIT Journal of Management
Vol. 3. No. 1. June 2013. Pp 83-108.
Gupta ISSN: 2278-9111
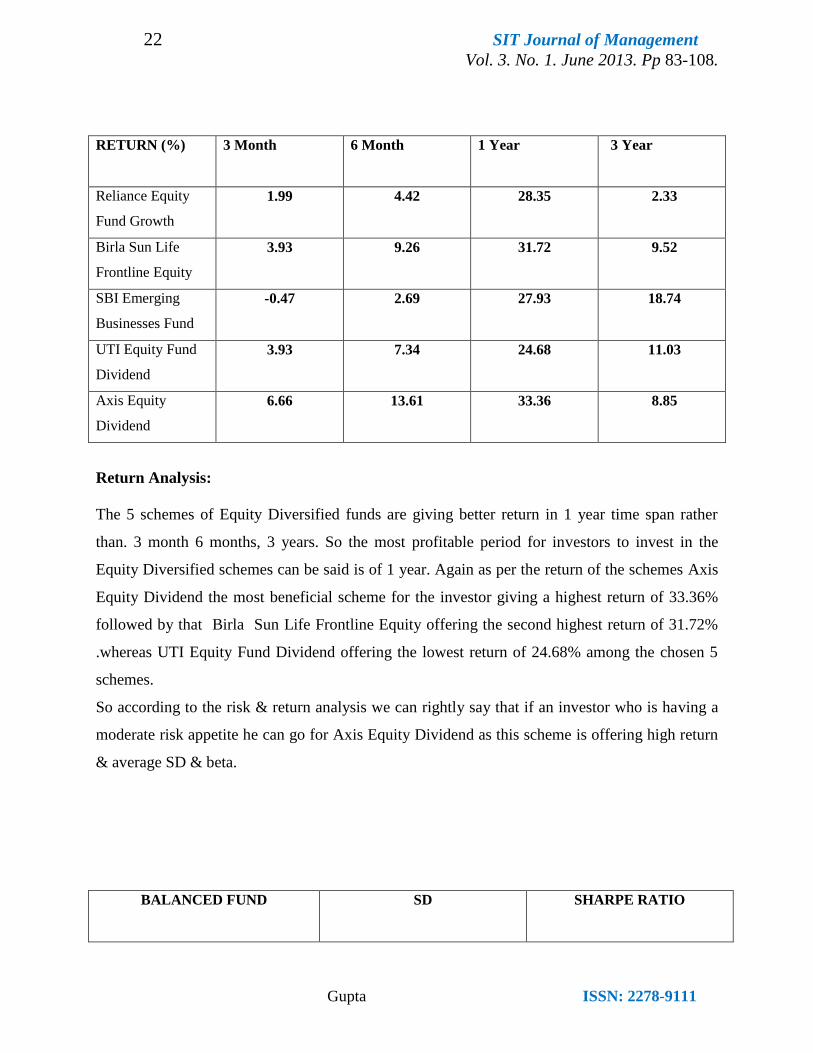
RETURN (%) 3 Month 6 Month 1 Year 3 Year
Reliance Equity
Fund Growth
1.99 4.42 28.35 2.33
Birla Sun Life
Frontline Equity
3.93 9.26 31.72 9.52
SBI Emerging
Businesses Fund
-0.47 2.69 27.93 18.74
UTI Equity Fund
Dividend
3.93 7.34 24.68 11.03
Axis Equity
Dividend
6.66 13.61 33.36 8.85
Return Analysis:
The 5 schemes of Equity Diversified funds are giving better return in 1 year time span rather
than. 3 month 6 months, 3 years. So the most profitable period for investors to invest in the
Equity Diversified schemes can be said is of 1 year. Again as per the return of the schemes Axis
Equity Dividend the most beneficial scheme for the investor giving a highest return of 33.36%
followed by that Birla Sun Life Frontline Equity offering the second highest return of 31.72%
.whereas UTI Equity Fund Dividend offering the lowest return of 24.68% among the chosen 5
schemes.
So according to the risk & return analysis we can rightly say that if an investor who is having a
moderate risk appetite he can go for Axis Equity Dividend as this scheme is offering high return
& average SD & beta.
BALANCED FUND SD SHARPE RATIO
23 SIT Journal of Management
Vol. 3. No. 1. June 2013. Pp 83-108.
Gupta ISSN: 2278-9111
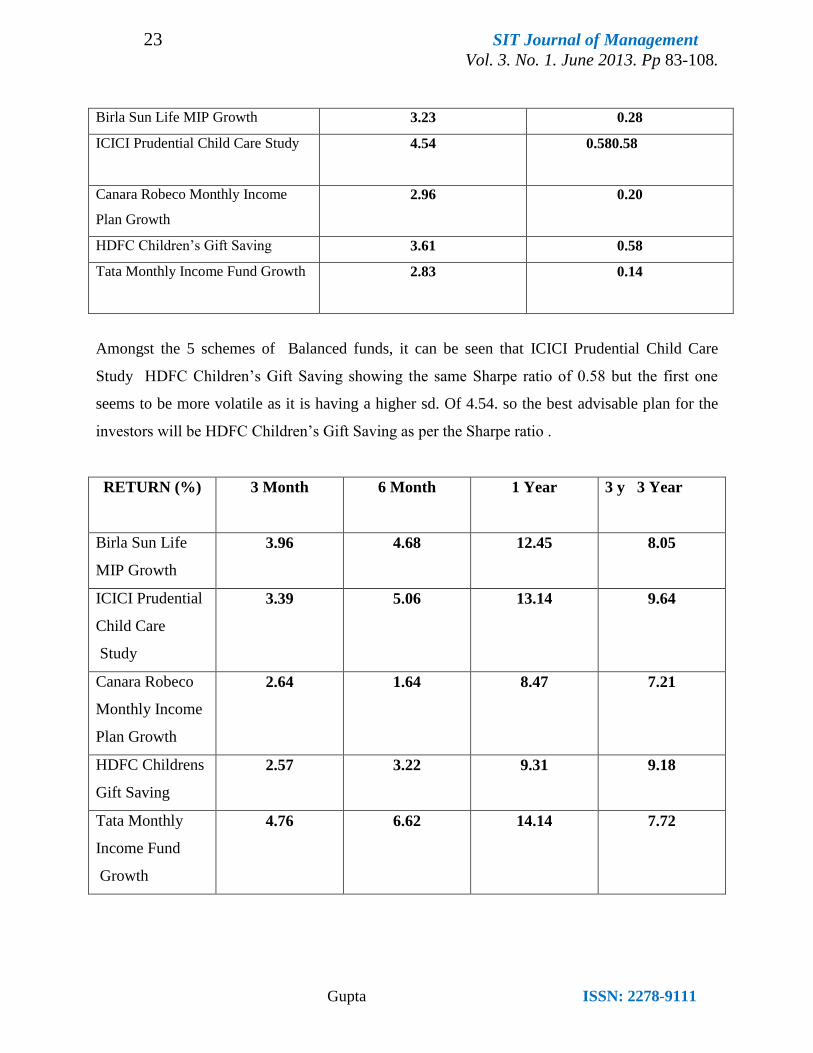
Birla Sun Life MIP Growth 3.23 0.28
ICICI Prudential Child Care Study 4.54 0.580.58
Canara Robeco Monthly Income
Plan Growth
2.96 0.20
HDFC Children‟s Gift Saving 3.61 0.58
Tata Monthly Income Fund Growth 2.83 0.14
Amongst the 5 schemes of Balanced funds, it can be seen that ICICI Prudential Child Care
Study HDFC Children‟s Gift Saving showing the same Sharpe ratio of 0.58 but the first one
seems to be more volatile as it is having a higher sd. Of 4.54. so the best advisable plan for the
investors will be HDFC Children‟s Gift Saving as per the Sharpe ratio .
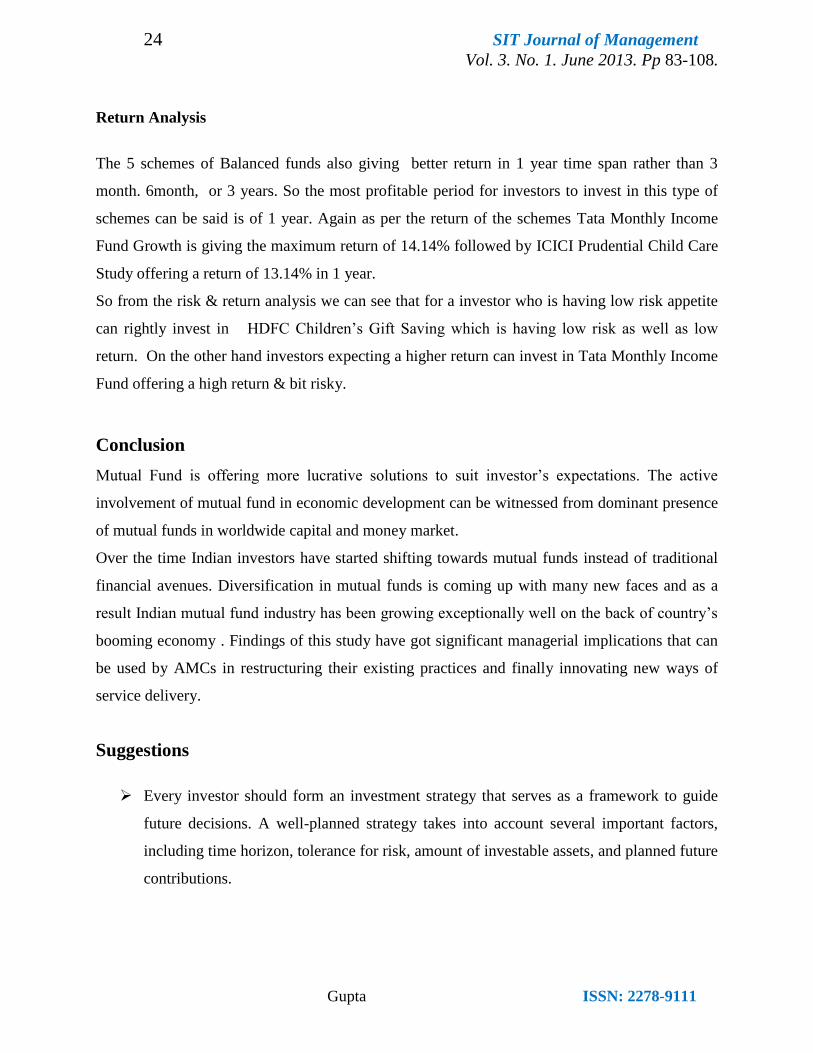
RETURN (%) 3 Month 6 Month 1 Year 3 y 3 Year
Birla Sun Life
MIP Growth
3.96 4.68 12.45 8.05
ICICI Prudential
Child Care
Study
3.39 5.06 13.14 9.64
Canara Robeco
Monthly Income
Plan Growth
2.64 1.64 8.47 7.21
HDFC Childrens
Gift Saving
2.57 3.22 9.31 9.18
Tata Monthly
Income Fund
Growth
4.76 6.62 14.14 7.72
24 SIT Journal of Management
Vol. 3. No. 1. June 2013. Pp 83-108.
Gupta ISSN: 2278-9111
Return Analysis
The 5 schemes of Balanced funds also giving better return in 1 year time span rather than 3
month. 6month, or 3 years. So the most profitable period for investors to invest in this type of
schemes can be said is of 1 year. Again as per the return of the schemes Tata Monthly Income
Fund Growth is giving the maximum return of 14.14% followed by ICICI Prudential Child Care
Study offering a return of 13.14% in 1 year.
So from the risk & return analysis we can see that for a investor who is having low risk appetite
can rightly invest in HDFC Children‟s Gift Saving which is having low risk as well as low
return. On the other hand investors expecting a higher return can invest in Tata Monthly Income
Fund offering a high return & bit risky.
Conclusion
Mutual Fund is offering more lucrative solutions to suit investor‟s expectations. The active
involvement of mutual fund in economic development can be witnessed from dominant presence
of mutual funds in worldwide capital and money market.
Over the time Indian investors have started shifting towards mutual funds instead of traditional
financial avenues. Diversification in mutual funds is coming up with many new faces and as a
result Indian mutual fund industry has been growing exceptionally well on the back of country‟s
booming economy . Findings of this study have got significant managerial implications that can
be used by AMCs in restructuring their existing practices and finally innovating new ways of
service delivery.
Suggestions
Every investor should form an investment strategy that serves as a framework to guide
future decisions. A well-planned strategy takes into account several important factors,
including time horizon, tolerance for risk, amount of investable assets, and planned future
contributions.
25 SIT Journal of Management
Vol. 3. No. 1. June 2013. Pp 83-108.
Gupta ISSN: 2278-9111
Investors should maintain a broadly diversified portfolio incorporating different asset
classes and investment styles. Failing to diversify leaves individuals vulnerable to
fluctuations in a particular security or sector. Also, One should diversify the investments
between a few funds (the actual number depends entirely on the amount of
investment)Investing in an individual stock increases risk versus investing in an already-
diversified mutual fund or index fund
Keeping in mind that there is no such thing as risk-free investing, In general, individuals
planning for long-term goals should be willing to assume more risk in exchange for the
possibility of greater rewards.
Although breaking news and “insider tips” may seem like a promising way to give the
portfolio a quick boost, the investor should always remember that they are investing
against professionals who have access to teams of research analysts.
Investors are often hard-pressed to cite specifics on the fee structure employed by their
investment service provider, including management fees and transactions costs. Investors
should, as a precondition to opening an account, make sure they are fully informed as to
the associated expenses that accompany every potential investment decision,
Never judge a fund on the basis of its NAV. Also have a look at the Standard Deviation,
Sharpe ratio, Treynor Ratio, Beta, Correlation, P/E Ratio, P/B Ratio and Expense Ratio &
also its performance in the bear and the bull phase, and then invest in it. Only judging a
fund by its NAV, is irrelevant while selecting the fund as it is the percentage gain or loss
that matters.
The Investors should also look for past returns, dividend etc. the mutual fund has
declared. If the investor has chosen equity or stock market related mutual fund, then he
may go for SIP (Systematic Investment Plan) method. Similarly a risk adverse investor
should avoid investing in the Sectoral funds.
26 SIT Journal of Management
Vol. 3. No. 1. June 2013. Pp 83-108.
Gupta ISSN: 2278-9111
AMC's use NFOs to create excitement and push their funds. These schemes are launched
because they are easy avenues to capture management fees and increase the fund house's
asset base. These schemes are usually just clones of existing schemes, but with new
peppy names flaunted to attract investors.It is important for investors to understand that
NFOs are merely marketing devices. Rather they should opt for such funds which have a
proven track record.
References
Grinblatt, Mark and Sheridan Titman, 1989. "Mutual Fund Performance: An Analysis of Quarterly
Portfolio Holdings." Journal of Business, Vol. 62, No. 3, pp. 393-416
Anjan Chakrabarti and Harsh Rungta, 2000, "Mutual Funds Industry in India : An in depth look into the
problems of credibility, Risk and Brand", The ICFAI Journal of Applied Finance, Vol.6, No.2, April,
27-45
Dr S Narayan Rao, M Ravindran, Manager (2003), Performance Evaluation of Indian Mutual Funds,
SSRNsearch library.
Sharad Panwar and R. Madhumathi ,(2006), Characteristics and Performance Evaluation of
Selected Mutual Funds in India , Indian Institute of Capital Markets 9th Capital Markets Conferenc
Vidya Shankar, S., "Mutual Funds - Emerging Trends in India", Chartered Secretary, Vol.20, No.8, 1990,
639-640.
Soumya Guha Deb , Ashok Banerjee and B. B. Chakrabarti (2007), Indian Institute of Management,
Kolkata, Performance of Indian Equity Mutual Funds vis-a vis Their Style