Embed Size (px)
Citation preview
68
An Evaluation on Risk and Return of Mutual Funds in India
P BHUVANESWARIGuest Lecturer, PG & Research Department of Commerce,
Bharathidasan University College for Women,Orathanadu, Thanjavur (DT), Tamil Nadu, India
W R P K FERNANDOSenior Lecturer, Department of Business Management,Rajarata University of Sri Lanka, Mhintale, Sri Lanka.
AbstractThe Indian capital market has witnessed unprecedented developments andinnovations particularly during the decades of 1980s and 1990s. The reviewstudies have analyzed different types of mutual funds by using various measures.Hence, the present study analyzed the risk and return of mutual funds performanceof top performing funds for the last three years (2008- 2010). The study concludedthat beta values of top six schemes were significantly related to their marketindex values. The sample of schemes namely Reliance Banking Fund-Growth Plan-Growth Option and UTI Transportation and Logistics Fund - Growth are significantlyrelated to their market value in 2010 only. All sample schemes except RelianceBanking Fund-Growth Plan-Growth Option earned negative returns in the year2008. Results of the study indicate that the all sample schemes earned positivereturn in the year 2010.
Key words: Indian Mutual Funds, Net Asset Value, Risk and Return, SystematicRisk, Standard Deviation.
Introduction
The Indian capital market has witnessed unprecedented developments andinnovations particularly during the decades of 1980s and 1990s. Theseinnovations, inter-alia, relate to new financial instruments, new financial institutionssuch as mutual funds, and a variety of financial services like merchant bankingcredit rating, factoring etc. In the changed environment the mutual funds areplaying a vital role in financial intermediation development of capital markets
69
An Evaluation on Risk and Return of Mutual Funds in India
and the growth of the corporate sector. Conceptually, a mutual fund is a singlelarge professionally managed investment organisation that combines the moneyof many individual investors having similar investment objectives. It invests thismoney in a wide variety of securities and individual investors share its incomeand expenses, its profits and losses, its capital appreciation and growth inproportion to their shareholdings.
Mutual fund institutions are dynamic financial institutions, which play a crucialrole in an economy by mobilizing savings and investing them in the capitalmarket. Once the objectives of investment and the associated constraints havebeen identified, the fund managers have to select an efficient portfolio. Thefund managers must also consider the appropriate risk and return of mutualfunds. The present study is aimed to analyse the performance of mutual fundsduring the period of 2008 to 2010. It is also proposed to examine the topperforming mutual funds during the period. Market indices were selected toanalyse how the index influences the returns of the mutual funds.
Review of Literature
Verma (2007) investigated the concept of Investment Style Analysis of MutualFunds. The author conducted a survey among various financial advisors andfund managers from various Asset Management Companies and found thatmajority of the Mutual Funds managers adopt the security specific investmentstyle and prefer the Bottom-Up Approach while selecting stocks. Greene, Hodgesand Ranowski (2007) examined open ended Mutual Funds for the period of2000 to 2003. The study analyzed the short term trading of fund shares, asmanifested in daily fund flows and found that the redemption fee was aneffective tool in controlling the volatility of fund managers. The study onanalyzing the financial reports with special focus on earning of Mutual Fundsby Bodhanwala (2006) empirically evaluated the portfolio formation of fundmanagers. Further, Begam (2006) analyzed the private sector Mutual Fundsgaining prominence in India and the study concluded that the private sectorhas achieved emergence and rapid growth of Mutual Funds in India.Furthermore, Fama and French (2006); Busse and Irvine (2006) and Chander(2006) have investigated gaining prominence of Mutual Funds in India.

70
Kelaniya Journal of Management - Volume: 01 Number: 01
Jiang, Yao and Yu (2007), implemented new measures of market timing basedon mutual fund holdings and concluded that actively managed U.S. domesticequity funds had positive timing ability uring their study period. Deb, Banerjee,and Chakrabarti (2007) examined the market timing and stock selection abilityof the Indian Mutual Funds managers with a sample of 96 Indian equity MutualFunds schemes. Results of the study indicated that the Indian mutual fundmanagers had a lack of market timing ability and presence of stock selectionability in both models during the study period. Bodla and Bishnoi (2008),attempted to find out the recent trends in mutual fund industry in India andexplained that both open-end and close-end schemes registered excellentgrowth in fund mobilization. The study found that UTI's share in total assetsunder management had came down to 11.8 percent in 2006 from 82.5 percentin 1998. As a whole, Mutual Funds were adding a lot to the India Shining Storyby ensuring a significant growth.
The review of literature revealed that the performance of mutual funds hasbeen analyzed by using various measures. Hence an attempt has been madein the present study to analyze the risk and return of mutual funds performanceof top performing funds for the last three years (2008- 2010).
Research Design
Statement of the Problem
The mutual funds industry is one of the fast growing sectors in India since theinitiation of economic reforms in 1991. However, growth of mutual funds haveposed difficulties to investors in making a selection of suitable schemes aspresently there are more than 600 schemes as at December 2008. It is evidentthat even a single wrong decision of fund manager may put the investors infinancial crisis, sometimes leading to their bankruptcy. Therefore, a properperformance evaluation measure is required as it will remove such confusionsand help the small investors in selecting suitable mutual fund schemes forinvestment.
71
An Evaluation on Risk and Return of Mutual Funds in India
Objectives of the Study
The study is undertaken with the following objectives,
1. To evaluate the performance of sample equity mutual funds schemes basedon risk and return relationship,
2. To compare the sample mutual fund returns with their respective marketreturns,
Methodology of the StudySample selection
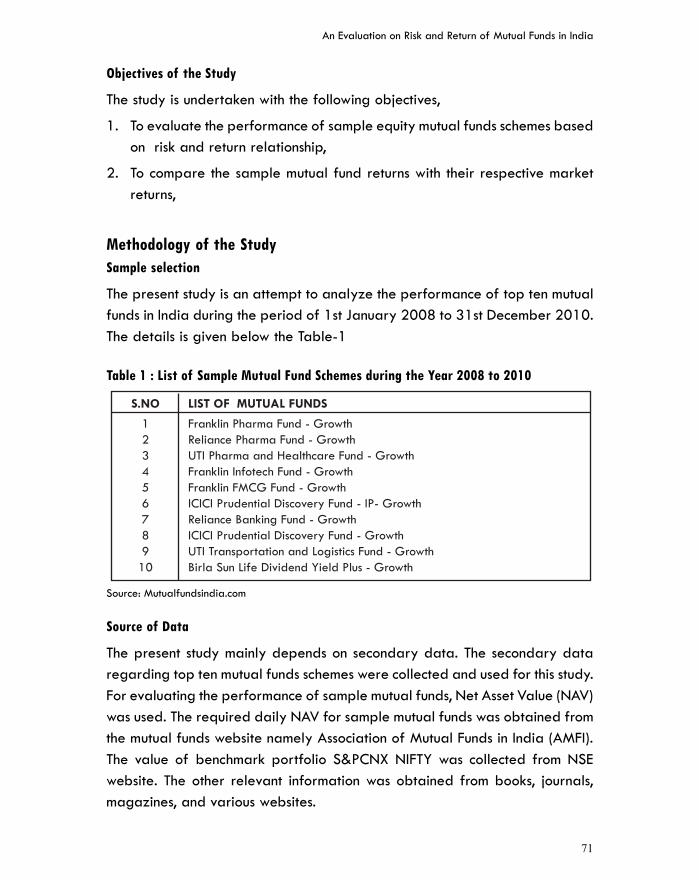
The present study is an attempt to analyze the performance of top ten mutualfunds in India during the period of 1st January 2008 to 31st December 2010.The details is given below the Table-1
Table 1 : List of Sample Mutual Fund Schemes during the Year 2008 to 2010
Source of Data
The present study mainly depends on secondary data. The secondary dataregarding top ten mutual funds schemes were collected and used for this study.For evaluating the performance of sample mutual funds, Net Asset Value (NAV)was used. The required daily NAV for sample mutual funds was obtained fromthe mutual funds website namely Association of Mutual Funds in India (AMFI).The value of benchmark portfolio S&PCNX NIFTY was collected from NSEwebsite. The other relevant information was obtained from books, journals,magazines, and various websites.
Source: Mutualfundsindia.com
Kelaniya Journal of Management - Volume: 01 Number: 01
72
Tools used for Analysis
The study analyzed the performance of mutual funds during the study period.Hence the following tools were used to examine the performance of mutualfunds,
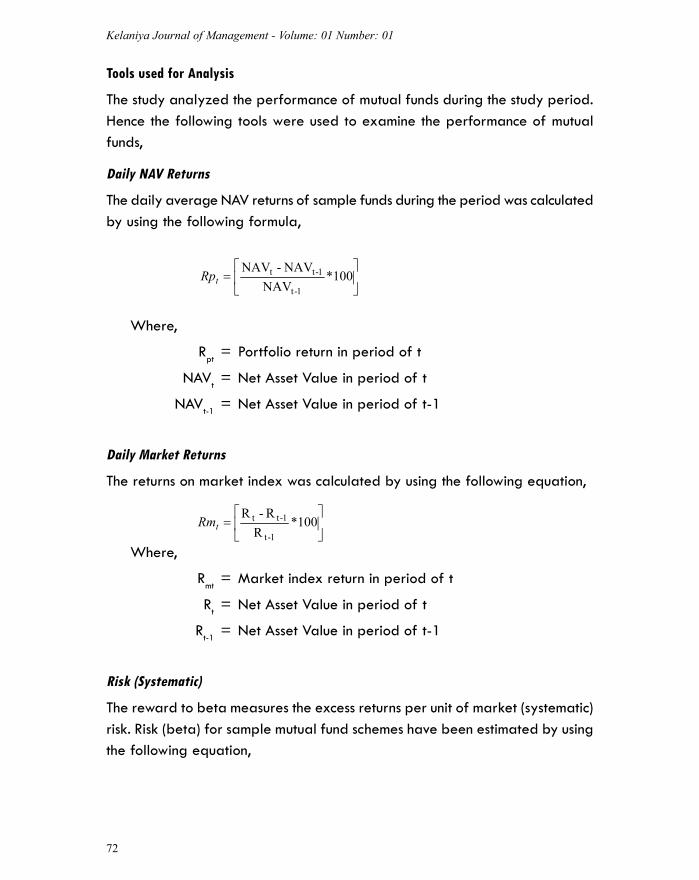
Daily NAV Returns
The daily average NAV returns of sample funds during the period was calculatedby using the following formula,
Where,
Rpt = Portfolio return in period of t
NAVt = Net Asset Value in period of t
NAVt-1 = Net Asset Value in period of t-1
Daily Market Returns
The returns on market index was calculated by using the following equation,
Where,
Rmt = Market index return in period of t
Rt = Net Asset Value in period of t
Rt-1 = Net Asset Value in period of t-1
Risk (Systematic)
The reward to beta measures the excess returns per unit of market (systematic)risk. Risk (beta) for sample mutual fund schemes have been estimated by usingthe following equation,
= 100*
NAVNAV - NAV
1-t
1-tttRp
= 100*
RR - R
1-t
1-tttRm
An Evaluation on Risk and Return of Mutual Funds in India
73
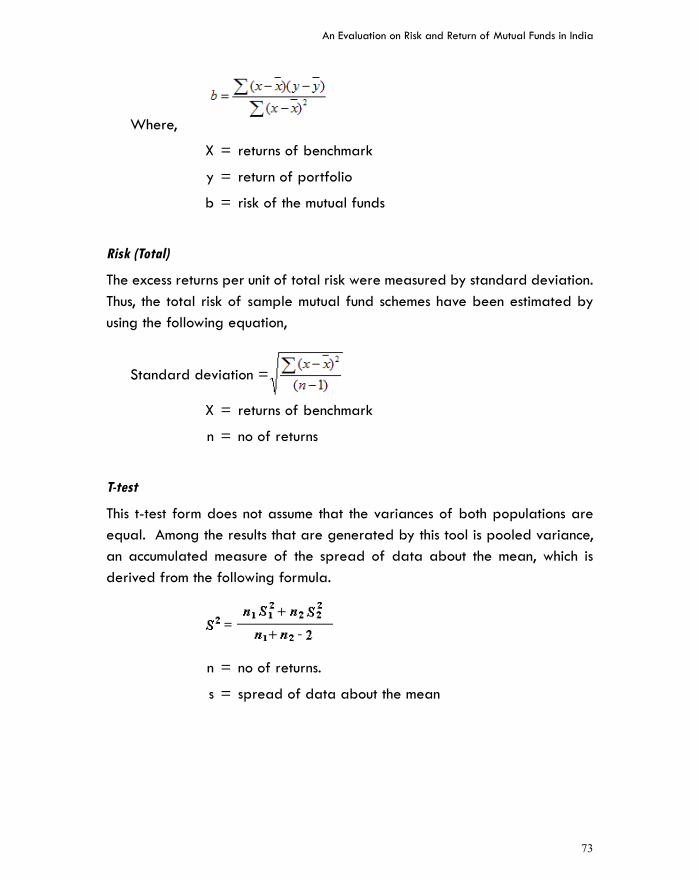
Where,
X = returns of benchmark
y = return of portfolio
b = risk of the mutual funds
Risk (Total)
The excess returns per unit of total risk were measured by standard deviation.Thus, the total risk of sample mutual fund schemes have been estimated byusing the following equation,
Standard deviation =
X = returns of benchmark
n = no of returns
T-test
This t-test form does not assume that the variances of both populations areequal. Among the results that are generated by this tool is pooled variance,an accumulated measure of the spread of data about the mean, which isderived from the following formula.
n = no of returns.
s = spread of data about the mean
Kelaniya Journal of Management - Volume: 01 Number: 01
74
Empirical Results
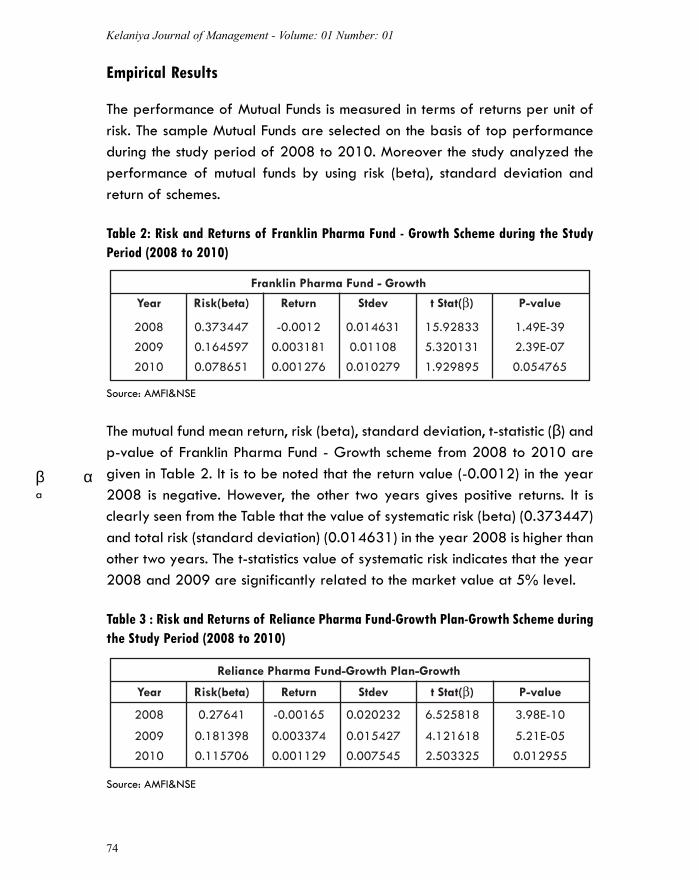
The performance of Mutual Funds is measured in terms of returns per unit ofrisk. The sample Mutual Funds are selected on the basis of top performanceduring the study period of 2008 to 2010. Moreover the study analyzed theperformance of mutual funds by using risk (beta), standard deviation andreturn of schemes.
Table 2: Risk and Returns of Franklin Pharma Fund - Growth Scheme during the StudyPeriod (2008 to 2010)
The mutual fund mean return, risk (beta), standard deviation, t-statistic (β) andp-value of Franklin Pharma Fund - Growth scheme from 2008 to 2010 aregiven in Table 2. It is to be noted that the return value (-0.0012) in the year2008 is negative. However, the other two years gives positive returns. It isclearly seen from the Table that the value of systematic risk (beta) (0.373447)and total risk (standard deviation) (0.014631) in the year 2008 is higher thanother two years. The t-statistics value of systematic risk indicates that the year2008 and 2009 are significantly related to the market value at 5% level.
Table 3 : Risk and Returns of Reliance Pharma Fund-Growth Plan-Growth Scheme duringthe Study Period (2008 to 2010)
Source: AMFI&NSE
Source: AMFI&NSE
β αa
An Evaluation on Risk and Return of Mutual Funds in India
75
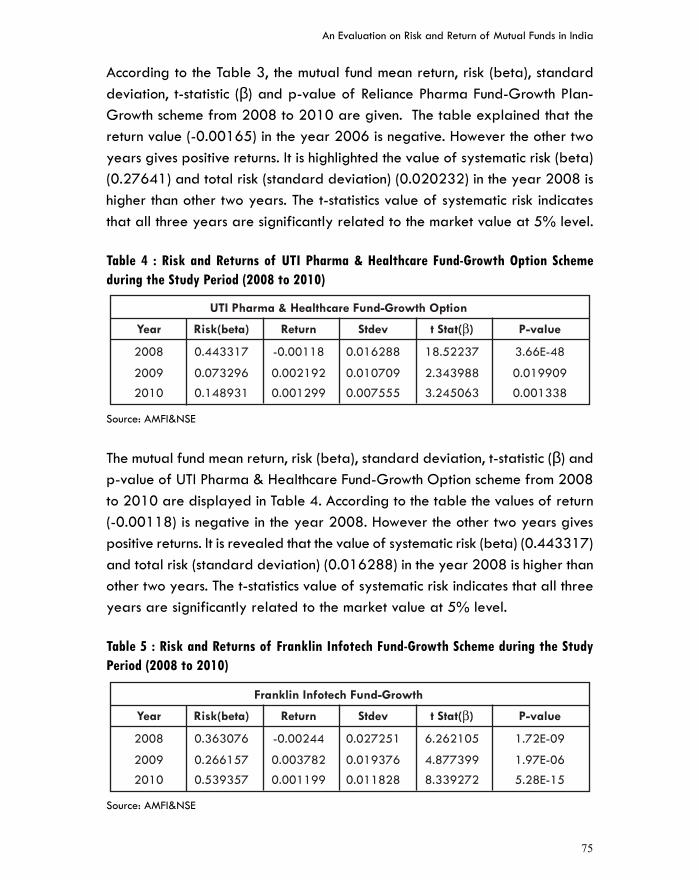
According to the Table 3, the mutual fund mean return, risk (beta), standarddeviation, t-statistic (β) and p-value of Reliance Pharma Fund-Growth Plan-Growth scheme from 2008 to 2010 are given. The table explained that thereturn value (-0.00165) in the year 2006 is negative. However the other twoyears gives positive returns. It is highlighted the value of systematic risk (beta)(0.27641) and total risk (standard deviation) (0.020232) in the year 2008 ishigher than other two years. The t-statistics value of systematic risk indicatesthat all three years are significantly related to the market value at 5% level.
Table 4 : Risk and Returns of UTI Pharma & Healthcare Fund-Growth Option Schemeduring the Study Period (2008 to 2010)
The mutual fund mean return, risk (beta), standard deviation, t-statistic (β) andp-value of UTI Pharma & Healthcare Fund-Growth Option scheme from 2008to 2010 are displayed in Table 4. According to the table the values of return(-0.00118) is negative in the year 2008. However the other two years givespositive returns. It is revealed that the value of systematic risk (beta) (0.443317)and total risk (standard deviation) (0.016288) in the year 2008 is higher thanother two years. The t-statistics value of systematic risk indicates that all threeyears are significantly related to the market value at 5% level.
Table 5 : Risk and Returns of Franklin Infotech Fund-Growth Scheme during the StudyPeriod (2008 to 2010)
Source: AMFI&NSE
Source: AMFI&NSE
Kelaniya Journal of Management - Volume: 01 Number: 01
76
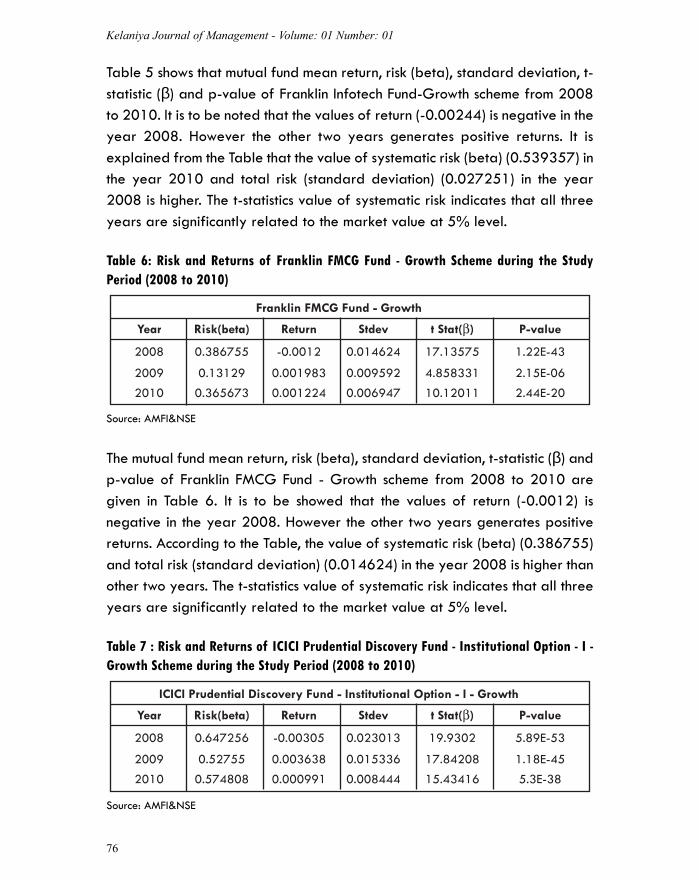
Table 5 shows that mutual fund mean return, risk (beta), standard deviation, t-statistic (β) and p-value of Franklin Infotech Fund-Growth scheme from 2008to 2010. It is to be noted that the values of return (-0.00244) is negative in theyear 2008. However the other two years generates positive returns. It isexplained from the Table that the value of systematic risk (beta) (0.539357) inthe year 2010 and total risk (standard deviation) (0.027251) in the year2008 is higher. The t-statistics value of systematic risk indicates that all threeyears are significantly related to the market value at 5% level.
Table 6: Risk and Returns of Franklin FMCG Fund - Growth Scheme during the StudyPeriod (2008 to 2010)
The mutual fund mean return, risk (beta), standard deviation, t-statistic (β) andp-value of Franklin FMCG Fund - Growth scheme from 2008 to 2010 aregiven in Table 6. It is to be showed that the values of return (-0.0012) isnegative in the year 2008. However the other two years generates positivereturns. According to the Table, the value of systematic risk (beta) (0.386755)and total risk (standard deviation) (0.014624) in the year 2008 is higher thanother two years. The t-statistics value of systematic risk indicates that all threeyears are significantly related to the market value at 5% level.
Table 7 : Risk and Returns of ICICI Prudential Discovery Fund - Institutional Option - I -Growth Scheme during the Study Period (2008 to 2010)
Source: AMFI&NSE
Source: AMFI&NSE
An Evaluation on Risk and Return of Mutual Funds in India
77
The mutual fund mean return, risk (beta), standard deviation, t-statistic (β) andp-value of ICICI Prudential Discovery Fund - Institutional Option - I - Growthscheme from 2008 to 2010 are explained in Table 7. It is to be noted that thevalues of return (-0.00305) is negative in the year 2008. However the othertwo years generates positive returns. It is clearly seen from the Table that thevalue of systematic risk (beta) (0.647256) and total risk (standard deviation)(0.023013) in the year 2008 is higher than other two years. The t-statisticsvalue of systematic risk indicates that all three years are significantly relatedto the market value at 5% level.
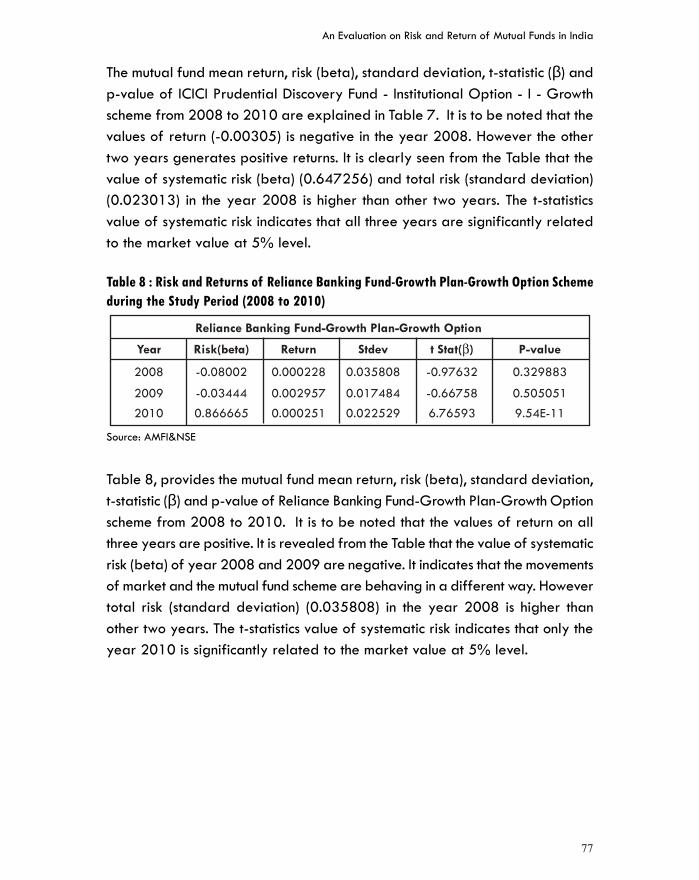
Table 8 : Risk and Returns of Reliance Banking Fund-Growth Plan-Growth Option Schemeduring the Study Period (2008 to 2010)
Table 8, provides the mutual fund mean return, risk (beta), standard deviation,t-statistic (β) and p-value of Reliance Banking Fund-Growth Plan-Growth Optionscheme from 2008 to 2010. It is to be noted that the values of return on allthree years are positive. It is revealed from the Table that the value of systematicrisk (beta) of year 2008 and 2009 are negative. It indicates that the movementsof market and the mutual fund scheme are behaving in a different way. Howevertotal risk (standard deviation) (0.035808) in the year 2008 is higher thanother two years. The t-statistics value of systematic risk indicates that only theyear 2010 is significantly related to the market value at 5% level.
Source: AMFI&NSE
Kelaniya Journal of Management - Volume: 01 Number: 01
78
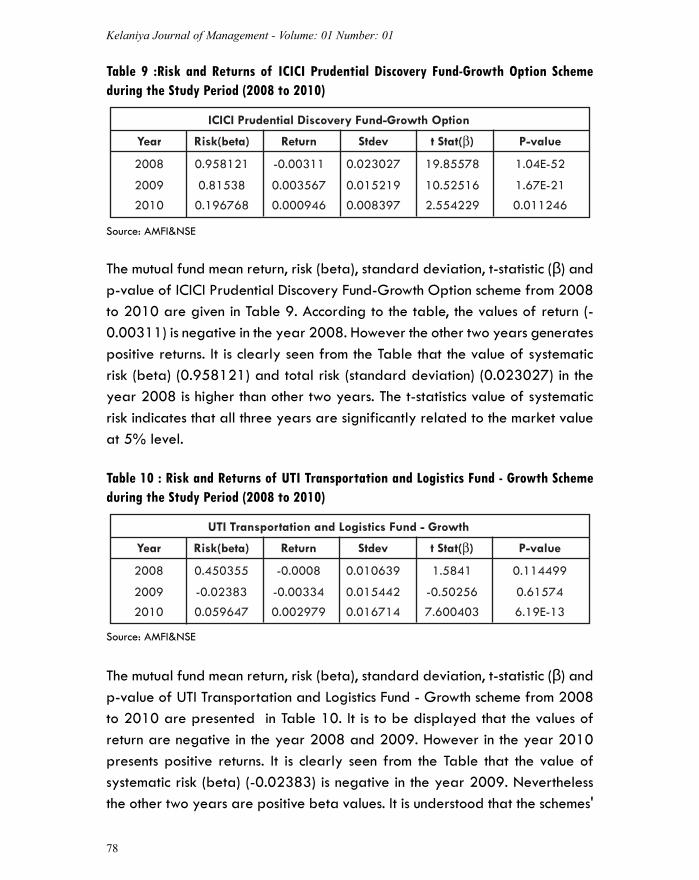
Table 9 :Risk and Returns of ICICI Prudential Discovery Fund-Growth Option Schemeduring the Study Period (2008 to 2010)
The mutual fund mean return, risk (beta), standard deviation, t-statistic (β) andp-value of ICICI Prudential Discovery Fund-Growth Option scheme from 2008to 2010 are given in Table 9. According to the table, the values of return (-0.00311) is negative in the year 2008. However the other two years generatespositive returns. It is clearly seen from the Table that the value of systematicrisk (beta) (0.958121) and total risk (standard deviation) (0.023027) in theyear 2008 is higher than other two years. The t-statistics value of systematicrisk indicates that all three years are significantly related to the market valueat 5% level.
Table 10 : Risk and Returns of UTI Transportation and Logistics Fund - Growth Schemeduring the Study Period (2008 to 2010)
The mutual fund mean return, risk (beta), standard deviation, t-statistic (β) andp-value of UTI Transportation and Logistics Fund - Growth scheme from 2008to 2010 are presented in Table 10. It is to be displayed that the values ofreturn are negative in the year 2008 and 2009. However in the year 2010presents positive returns. It is clearly seen from the Table that the value ofsystematic risk (beta) (-0.02383) is negative in the year 2009. Neverthelessthe other two years are positive beta values. It is understood that the schemes'
Source: AMFI&NSE
Source: AMFI&NSE
An Evaluation on Risk and Return of Mutual Funds in India
79
movement are directly related to market index. The total risk (standarddeviation) (0.016714) in the year 2010 is higher than other two years. The t-statistics value of systematic risk indicates that only the year 2010 is significantlyrelated to the market value at 5% level.
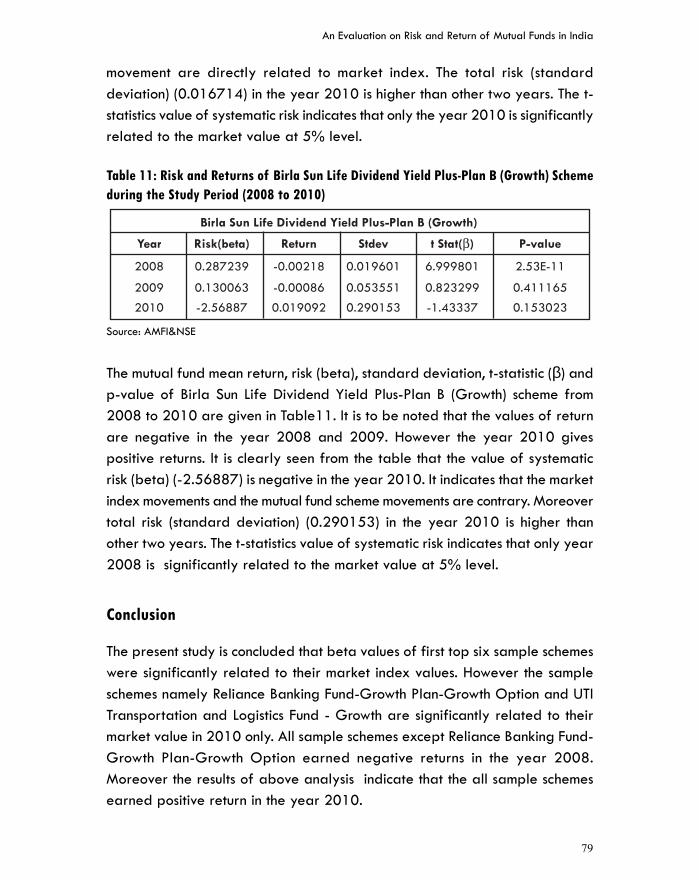
Table 11: Risk and Returns of Birla Sun Life Dividend Yield Plus-Plan B (Growth) Schemeduring the Study Period (2008 to 2010)
The mutual fund mean return, risk (beta), standard deviation, t-statistic (β) andp-value of Birla Sun Life Dividend Yield Plus-Plan B (Growth) scheme from2008 to 2010 are given in Table11. It is to be noted that the values of returnare negative in the year 2008 and 2009. However the year 2010 givespositive returns. It is clearly seen from the table that the value of systematicrisk (beta) (-2.56887) is negative in the year 2010. It indicates that the marketindex movements and the mutual fund scheme movements are contrary. Moreovertotal risk (standard deviation) (0.290153) in the year 2010 is higher thanother two years. The t-statistics value of systematic risk indicates that only year2008 is significantly related to the market value at 5% level.
Conclusion
The present study is concluded that beta values of first top six sample schemeswere significantly related to their market index values. However the sampleschemes namely Reliance Banking Fund-Growth Plan-Growth Option and UTITransportation and Logistics Fund - Growth are significantly related to theirmarket value in 2010 only. All sample schemes except Reliance Banking Fund-Growth Plan-Growth Option earned negative returns in the year 2008.Moreover the results of above analysis indicate that the all sample schemesearned positive return in the year 2010.
Source: AMFI&NSE
Kelaniya Journal of Management - Volume: 01 Number: 01
80
Indian Mutual Funds have emerged as strong financial intermediaries and theyplay a significant role in bringing stability into the financial system and efficiencyin resource allocation. The present article encompasses an analysis of theperformance of selected sample Mutual Fund Schemes. The results of this studyfound that the performances of majority of the sample Equity Schemes weresignificantly related to their market movements during the study period. Howeversome of the schemes are not significantly related to market movements.
ReferenceBeegam R (2006). Private Sector Mutual Funds Gaining Prominence in India.
Southern Economist. Vol.44(18): 23-25.
Bodla S.B, Bishnoi S. (2008). Emerging Trends of Mutual Funds in India: AStudy across Category and Type of Schemes. JIMS 8M.Jan-Mar:15-27.
Bobhanwala R.J (2006). An Empirical Study on Analyzing How Fund Managersin India Analyze Financial Reports with Special Focus on Quality of ReportedEarning. Applied Finance. Vol.12(9): 5-38.
Busse J.A, and Irvine P.J (2006). Bayesian Alphas and Mutual Fund Persistenace.J. Finance. Vol. 61(5): 2251-2288.
Chander R (2006). Investment Managers' Market Timing Abilities: EmpiricalEvidence from the Indian Capital Market. IIMB Management Review.Vol.18(4):315-326.
Deb S.J, Banerjee A, Chakrabarti B.B. (2007). Market Timing and Stock SelectionAbility of Mutual Funds in India: An Empirical Investigation. Vikalpa.Vol.32(2):39-51.
Fama,E .F and French, K.R (2006). The Value Premium and the CAPM. J. Finance.Vol. 61(5): 2163-2185.
Greene J.T., Hodges W.C, and Rakowski, R.A (2007): Daily Mutual Fund Flowsand Redemption Policies. J. Banking and Finance, Vol.31: 3822-3842.
Jiang G.J., Yao T. and Yu, T (2007). Do Mutual Funds Time the Market? Evidencefrom Portfolio Holdings. J. Financial Economics Vol.86(3): 724- 758.
Verma, M (2007). Style Analysis of Mutual Funds. Portfolio Organizer. Vol.8(5):34-46.