Embed Size (px)
Citation preview
S U P E R V I S O R : M I C H A E L C H R I S T E N S E N P ERFORMANCE EVALUAT ION O F 6 0 DAN I SH
MUTUAL FUNDS
MICHAELVILLADSEN(286274)
U13BSC
AarhusSchoolofBusinessandSocialSciences
Spring11
AbstractIn2011themarketvalueoftheDanishmutualfundsexceededDKK1200billion,investedby
more than 835.000 people. Therefore, the performance by the mutual funds is of great
interest toa largeproportionof theDanishpopulation, andalongwith thehugeamountof
moneymanagedbytheDanishmutualfunds,itisveryimportanttoshedlightonthereturns
thatthemutualfundsareabletoobtain.
Thepurposeofthisthesisisthereforetoprovideaperformanceanalysisof60Danishmutual
funds in the period from 2001‐2009. The analysis will cover three investment categories:
Danishstocks,Europeanstocks,andGlobalstocks.
Thetheoreticalframeworkofthethesisisbuildaroundthetheoryofefficientmarketsandthe
Capital Asset Pricing Model. Consequently, the performance measurements used in the
analysiswillfollowthesetheoriesaswell.Inordertoanalysetheperformanceofthemutual
funds,relevantbenchmarkshavebeenchosen,andthepurposeofthethesisistoseewhether
themutual funds are able to outperform those benchmarks or not. The analysiswill begin
withtheJensenindex,howeverthisisasingleindexmodel,andthereforeitmightnotbeable
toexplainallofthevariationinthereturnsofthemutualfunds.Therefore,theJensenindexis
followedbyamulti‐indexmodel,where4 to7benchmarksare included,dependenton the
investment category of the mutual funds. However, the Jensen index and the multi‐index
modelonlyfocusesontheselectionabilityofthefunds,andthereforeitisdesiredtoseparate
theselectionandtimingabilitiesofthemutualfundsusingtheTreynor&Mazuymodel.
The results from the analysiswere that in the Jensen index, 23 funds underperformed the
index,31fundsperformedneutrally,and6fundsoutperformedtheindex.Inthemulti‐index
model,thesenumberschangedto31,27,and2,respectively,therebyshowinganevenweaker
performancebythemutualfunds.
Takinganaverageofthesetwoanalyseswouldrevealthatclosetohalfof themutual funds
haveperformedsobadthattheyarenotabletocovertheirownexpenses.Thisshouldraise
someconcernregardingtheworkdonebytheDanishmutualfunds.
However,positiveaspectswerealsofoundintheanalysis,sincetwofundsshowedsignificant
positiveperformanceinbothofthemodels.Thosefundsbeing“SEBinvestDanskeaktier”and
“Valueinvest Danmark, Blue Chip” showing a monthly over performance of 0,3271% and

0,3376%, respectively. Itmust thereforebe concluded that these fundshavedone their job
reallywell.
Finally,theTreynorandMazuymodelwasusedtoseparatetheselectionandtimingabilities
ofthemutualfunds.Surprisingly,itwasdiscovedupthat8mutualfundsinvestinginDanish
stocks showed significant timingabilities.However, for the remainingmutual funds, timing
abilities were not present. None of the funds showing timing abilities showed significant
positive selection abilities, and the result of that was that the α values where decreased
comparedtotheJensenindex. Itshouldfinallybenoted,thatnoneofthetwopreviousbest
performingfundsshowedsignificanttimingabilities.
The overall conclusion on the thesis is that one should be careful when selecting mutual
funds. The reason of that is that the returns obtained by the mutual funds compared to
relevantbenchmarksdifferalot,andonewouldthereforeearnsignificantlymoremoneyby
choosingthebestfunds.Finally,itshouldbementionedthathighreturnsofamutualfundin
one period does not guarantee high returns in the following period, and therefore the
selectionofmutualfundsshouldnotsolelybebasedonpreviousreturns.
Tableofcontents
1.INTRODUCTION 1
1.1.PROBLEMSTATEMENT 21.2.DELIMITATION 31.3.THEORETICALFRAMEWORK 3
2.INVESTMENTFUNDSINDENMARK 4
2.1GENERALLYABOUTTHEINVESTMENTFUNDS 42.2LEGISLATION 52.3COSTS 6
3.THEORY 8
3.1EFFICIENTMARKETS 83.2CAPITALASSETSPRICINGMODEL(CAPM) 103.2.1CRITIQUEOFTHECAPITALASSETPRICINGMODEL(CAPM) 123.3RISKMEASUREMENTS 143.3.1SYSTEMATICRISK 143.3.2UNSYSTEMATICRISK 153.4PERFORMANCEMEASUREMENTS 163.4.1JENSEN’SALPHA 183.4.2CRITIQUEOFJENSEN’SALPHA 193.4.3MULTI‐INDEXMODEL 213.4.5MARKETTIMING 23
4.DATA 28
4.1CHOICEOFMUTUALFUNDS 284.2CHOICEOFBENCHMARKS 294.2.1INDEXMETHODOLOGY 304.2.2BENCHMARKFORTHEJENSENINDEX 314.2.3BENCHMARKFORTHEMULTI‐INDEXMODEL 344.3CHOICEOFRISKFREERATE 374.4SURVIVORSHIPBIAS 374.5ASSUMPTIONSFORTHETESTS 39

5.PERFORMANCEANALYSIS 45
5.1JENSEN’SALPHA 455.1.1DANISHSTOCKS 465.1.2EUROPEANSTOCKS 475.1.3GLOBALSTOCKS 485.1.4CONCLUSIONONJENSEN’SALPHA 505.2MULTIINDEXMODEL 515.2.1DANISHSTOCKS 515.2.2EUROPEANSTOCKS 525.2.3GLOBALSTOCKS 545.2.4CONCLUSIONONTHEMULTI‐INDEXMODEL 565.3MARKETTIMING 575.3.1DANISHSTOCKS 575.3.2EUROPEANANDGLOBALSTOCKS 585.3.2CONCLUSIONONTHETREYNORANDMAZUYMODEL 595.4CONCLUSIONONTHEPERFORMANCEANALYSIS 60
6.DISCUSSIONANDREFLECTIONS 61
7.CONCLUSION 66
8.BIBLIOGRAPHY 68
APPENDIX1:JENSEN’SALPHA 70
DANISHSTOCKS 70RESULTS 70ASSUMPTIONS 70EUROPEANSTOCKS 71RESULTS 71ASSUMPTIONS 71GLOBALSTOCKS 72RESULTS 72ASSUMPTIONS 72
APPENDIX2:MULTIINDEXMODEL 73
DANISHSTOCKS 73

SIGNIFICANTBENCHMARKS 73ASSUMPTIONS 73RESULTS 74EUROPEANSTOCKS 75SIGNIFICANTBENCHMARKS 75ASSUMPTIONS 75RESULTS 76GLOBALSTOCKS 77SIGNIFICANTBENCHMARKS 77ASSUMPTIONS 77RESULTS 78
APPENDIX3:MARKETTIMING 79
DANISHSTOCKS 79RESULTS 79ASSUMPTIONS 79EUROPEANSTOCKS 80RESULTS 80ASSUMPTIONS 80GLOBALSTOCKS 81RESULTS 81ASSUMPTIONS 81
APPENDIX4:BENCHMARKSOFTHEINVESTMENTFUNDS 82
Page1
1.IntroductionTheamountofmoneyinvestedintheDanishmutualfundshasexperiencedalargeincreasein
the period from 2001 to 2010, increasing fromDKK 250 billion to DKK 1.200 billion. The
majordevelopmentintheamountofmoneyinvestedputsalargefocusonthereturnsthatthe
mutualfundsareabletoobtain.
Asawiseinvestor,oneshouldbeinterestedinselectingthebestmutualfundstotakecareof
one’smoney.However,thenumberofmutualfundshasalsoincreasedalongwiththeamount
ofmoneyinvested,causingittobecomeevenmoredifficultforaninvestortodecidewhereto
placehismoney.Inordertohelpdecideuponwhichmutualfundstochoosemanydifferent
performance analyses of the mutual funds have been made, some more valid than other.
However, as a general rule proper performance evaluation ofmutual funds should rest on
risk‐adjusted returns, as the investorsmust be considered risk‐averse, therebywanting to
obtainthelargestpossiblereturnwiththesmallestamountofrisk.Inaddition,investorsmust
alsobeinterestedinthereturnthemutualfundhasobtainedcomparedtoarelevantmarket
indexfollowingthereasoning,thatoneshouldnotbesatisfiedwithobtaininga10%returnin
amutualfundifthereturnofthemarketwithasimilarriskhasbeen20%.
Nevertheless, the mutual funds are facing a hard time, following the efficient market
hypothesisbyFama(1970).Theefficientmarkethypothesisstatesthatifamarketisefficient
in it strongest form, then the stock prices would follow a random walk, thereby making
predictionsof futurestockpricesworthless. Ifmarketsareefficient, thetheorystatesthata
passive investment strategy would be the best choice. Still, most mutual funds choose an
activeinvestmentstrategyinthebeliefthattheyareabletomakevaluablepredictionsabout
futurestockpricesenablingthemtooutperformtheirbenchmark.
However, Christensen (2001) argues thatmutual funds can use different strategies, which
maketheirinvestmentslookbettercomparedtotheirbenchmarks.Oneofthembeingthatthe
mutual fund uses a benchmark where dividends are excluded and afterwards including
dividendsinthecalculationoftheirownreturn.AccordingtoChristensen(2001)thiswould
givethemutualfundsaheadstartof2‐3%comparedtotheirbenchmark.
Page2
Another interesting aspects in performance analysis of mutual funds is performance
persistency. Christensen (2004) analysed whether performance persistency exists on the
market forDanishmutual funds.Hereachedtheconclusionthatperformancepersistencyis
non‐existentontheDanishmarket,meaningthatonecannotpredictwhichmutualfundswill
perform thebest in the followingperiodbasedonhow themutual fundsperformed in the
previousperiod.
Consequently, it could be argued that the previous returns are of no relevance to new
investors,sincetheonlyonesbenefitingfromthosearetheinvestorsofthattime.However,
many private investors are still interested in the how mutual funds have performed
previously,sincegoodpreviousperformancecangiveinvestorssomekindof“false”security,
even though this is conflicting with the results reached in the literature regarding
performancepersistency.
Thepurposeofthisthesisistofindthebestperformingmutualfundsintheperiod2001to
2010inthethreemostcommoninvestmentcategoriesfortheDanishmutualfunds,namely
Danish stocks, European stocks, and Global stocks. The evaluation will be based on risk
adjustedreturnsandrelevantbenchmarksincludingdividends.
Thethesiswillshowaninformativepictureoftheperformanceofthemutualfunds,whichcan
beusedinevaluationofwhethertheirobtainedresultsaresatisfactoryornot.Ifonebeliefs
that the performance ofDanishmutual funds is persistent one can also use the analysis to
choosewheretoplaceyourfutureinvestment.
1.1.Problemstatement
Basedontheintroduction,theaimofthethesisistoanalyse60Danishequitymutualfunds
investing in Danish stocks, European stocks, or Global stocks. The period of analysis is 10
yearsrangingfrom2001‐2010.
Thespecificquestions,whichareanalysed,areasfollows:
‐ HowhastheDanishmutualfundsperformedcomparedtorelevantpassivebenchmarks?
‐ DoestheDanishmutualfundspossesstimingabilities?
Page3
1.2.Delimitation
Inordertogetamorethoroughanalysis,certainlimitationshavebeenmadeintheselection
ofthemutualfundsfortheanalysis.
Firstofall,ithasbeendecidedtokeepthefocusinthisthesisonDanishequitymutualfunds.
Thereasonforthischoiceis,thatismustbeexpectedthatthestockmarketsaremorevolatile
compared to the bonds market, and therefore it is found more interesting to analyse the
mutualfundsinvestinginstocks.
Inaddition,ithasbeendecidedtolimittheinvestmentcategoriestoonlythree;thosebeing;
Danishstocks,Europeanstocks,andGlobalstocks.Thereasonforthesespecificchoicesisthat
these three investment categories are themost common for the Danishmutual funds, and
thereforerelativelylargesamplesofmutualfundscanbegatheredineachofthecategories.
The classification of the mutual funds in the three categories will follow the classification
madebytheFederationofDanishInvestmentAssociates(IFR).
Intermsoftheselectionofthemutualfundsforthethesis,ithasbeendecidedonlytoanalyse
mutualfunds,whichhavebeenrunningfortheentireperiodofanalysisfrom2001to2010.
However, this raises the problemof survivorship bias,whichwill be discussed later in the
thesis.Thoughitshouldbenoted,thatthethesishasbeenlimited,sothatsurvivorshipbiasis
notdealtwithintheanalysis.
1.3.Theoreticalframework
The theoriesandanalyses chosen for the thesisareallbuildupon theCapitalAssetPricing
Model (CAPM). Inorder toanalyse theperformanceof theDanishmutual funds, the Jensen
index will be used as a single index model, followed by a multi index model. In order to
separate the selection and timing abilities of themutual funds, the quadratic Treynor and
Mazuymodelwillbeusedaswell.A thoroughdiscussionandargumentation for theuseof
eachofthemodelswillbeincludedinthetheorysection.
Finally, the results thatwill be reached in the analysiswill be compared to similar results
obtainedintheliterature.
Page4
2.InvestmentfundsinDenmark
Thissectionisadescriptivesection,whichwillgiveabriefintroductiontotheDanishmutual
funds. It therefore serves the purpose of providing the reader with some very basic
knowledgeabouttheDanishmutualfunds.
2.1Generallyabouttheinvestmentfunds
TheFederationofDanishInvestmentAssociates(IFR)has30mutualfundsthataremembers
ofthefederation.InbroadtermthismeansthattheDanishinvestorhas30differentmutual
fundstochooseamong.Allofthesemutualfundsthenhavenumerousofdifferentinvestment
portfolios,whichaninvestorcouldchoosetoplacehis/hermoneyin.
TheamountofmoneyinvestedintheDanishmutualfundsisalsoofinterest.
Christensen(2005)concludesthattherehasbeenatremendousincreaseinthemarketvalue
ofthemutualfundsworldwide,butforDenmarkthedevelopmenthasbeenmuchbiggerthan
fortheEuropeanUnionasawhole.Heconcludes,thatthemarketvalueoftheDanishmutual
funds increased fromUSD3 billion in 1992 toUSD57 billion in 2002. This amounts to an
annual increase of 34%, which can be compared to an annual increase of 18% for the
EuropeanUnion.
However,thesenumbersareratherold,andthereforethebelowdiagramhasbeenmadeto
show how themarket value of the Danishmutual funds has developed over the period of
analysisfrom2001to2010.
Page5
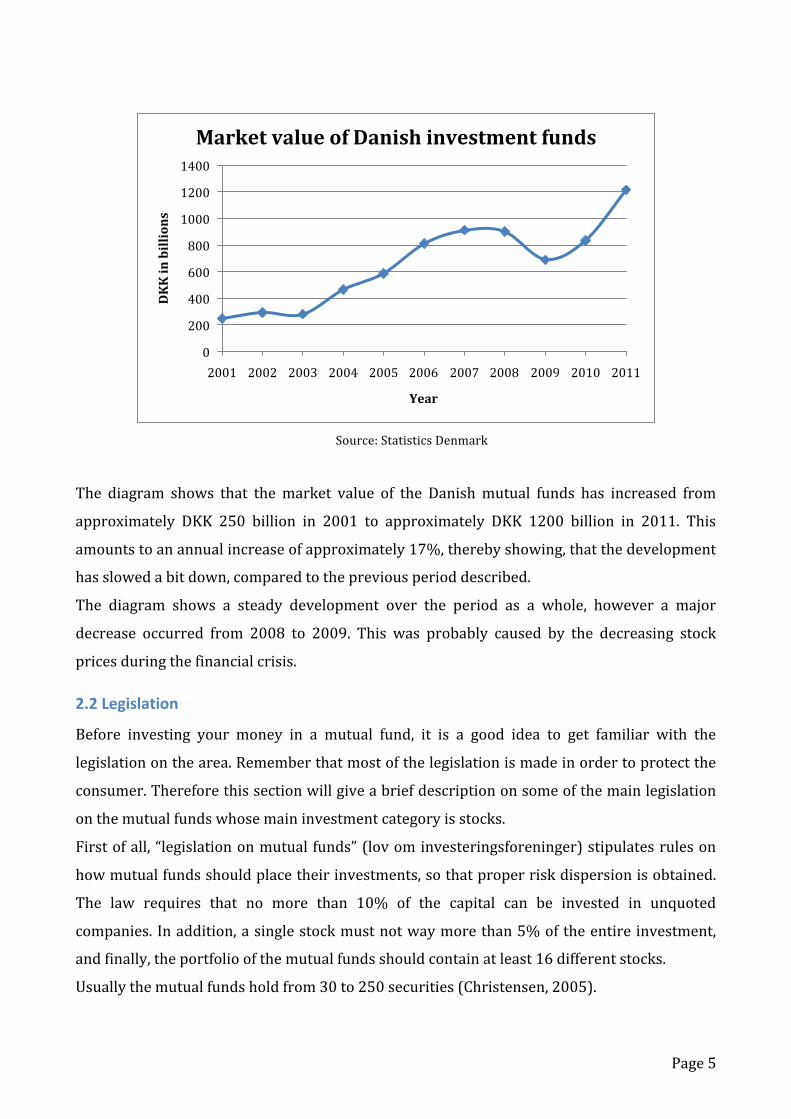
Source:StatisticsDenmark
The diagram shows that themarket value of the Danishmutual funds has increased from
approximately DKK 250 billion in 2001 to approximately DKK 1200 billion in 2011. This
amountstoanannualincreaseofapproximately17%,therebyshowing,thatthedevelopment
hasslowedabitdown,comparedtothepreviousperioddescribed.
The diagram shows a steady development over the period as a whole, however a major
decrease occurred from 2008 to 2009. This was probably caused by the decreasing stock
pricesduringthefinancialcrisis.
2.2Legislation
Before investing your money in a mutual fund, it is a good idea to get familiar with the
legislationonthearea.Rememberthatmostofthelegislationismadeinordertoprotectthe
consumer.Thereforethissectionwillgiveabriefdescriptiononsomeofthemainlegislation
onthemutualfundswhosemaininvestmentcategoryisstocks.
Firstofall, “legislationonmutual funds”(lovominvesteringsforeninger)stipulatesruleson
howmutualfundsshouldplacetheirinvestments,sothatproperriskdispersionisobtained.
The law requires that no more than 10% of the capital can be invested in unquoted
companies.Inaddition,asinglestockmustnotwaymorethan5%oftheentireinvestment,
andfinally,theportfolioofthemutualfundsshouldcontainatleast16differentstocks.
Usuallythemutualfundsholdfrom30to250securities(Christensen,2005).
0
200
400
600
800
1000
1200
1400
2001 2002 2003 2004 2005 2006 2007 2008 2009 2010 2011
DKKinbillions
Year
MarketvalueofDanishinvestmentfunds
Page6
In addition, the legislation states that the mutual funds should invest at least 75% of the
investmentinsecuritieswithintheirmaininvestmentcategory.However,thisalsomeansthat
themutual funds have the possibility to invest up to 25%of their investment in securities
outsidetheirmaininvestmentcategory.
2.3Costs
EachyeartheFederationofDanishInvestmentAssociates(IFR)publishesofcostanalysisof
theDanishmutualfunds.
The analysis states that 835.000 Danes own shares in themutual funds,meaning that the
costsofthefundsarerelevanttoalargeproportionoftheDanishpopulation.
Thegeneralresultsshowthattheadministrationcosts increasedforthestockdepartments,
whereas they decreased in the foreign bonds departments. In total the analysis showed a
decreaseintheaveragecostsforallfunds,decreasingfrom1,05%in2008to1,02in2009.
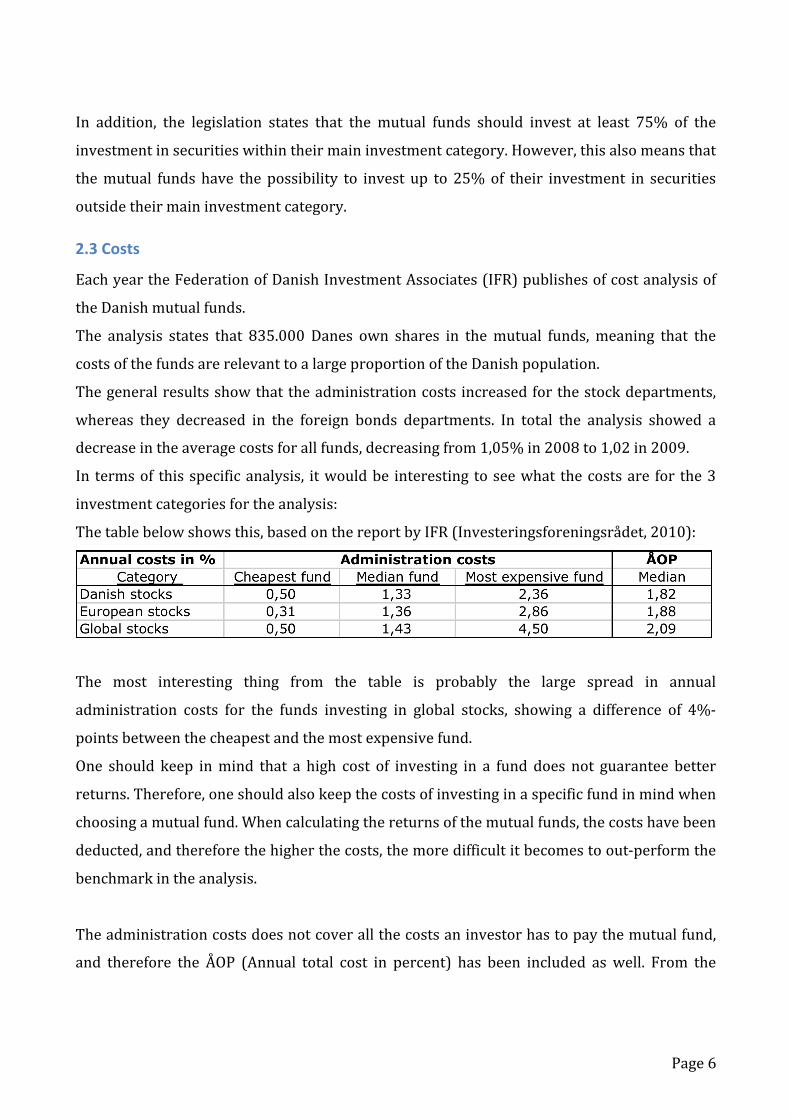
In termsof thisspecificanalysis, itwouldbe interesting toseewhat thecostsare for the3
investmentcategoriesfortheanalysis:
Thetablebelowshowsthis,basedonthereportbyIFR(Investeringsforeningsrådet,2010):
The most interesting thing from the table is probably the large spread in annual
administration costs for the funds investing in global stocks, showing a difference of 4%‐
pointsbetweenthecheapestandthemostexpensivefund.
One should keep inmind that a high cost of investing in a fund does not guarantee better
returns.Therefore,oneshouldalsokeepthecostsofinvestinginaspecificfundinmindwhen
choosingamutualfund.Whencalculatingthereturnsofthemutualfunds,thecostshavebeen
deducted,andthereforethehigherthecosts,themoredifficultitbecomestoout‐performthe
benchmarkintheanalysis.
Theadministrationcostsdoesnotcoverallthecostsaninvestorhastopaythemutualfund,
and therefore the ÅOP (Annual total cost in percent) has been included as well. From the

Page7
numbers it is seen that among the three, investments in Danish stocks are the cheapest,
whereasinvestmentsinglobalstocksarethemostexpensive.
It therefore implies that if one decides to invest in a category,which has higher costs, one
shouldalsoexpectthatthesewillgiveahigherreturn(Investeringsforeningsrådet,2010)
Page8
3.TheoryThis section will cover the theory, which will be used in the analysis. It is therefore an
extensionofthetheoreticalframework,explainingdifferenttheoriesandwhytheyhavebeen
chosen. The theory will start by going into the theory of the efficient market hypothesis
followed by a discussion of the Capital Asset PricingModel. The reason of that is that the
performancemeasurementsused intheanalysis isbuilduponthosetheories,andtherefore
theylaythefoundationforthelaterexplanationofthetheoriesusedintheanalysis.
3.1Efficientmarkets
Anefficientmarket isdefinedasamarketwhereall information iscontained inthecurrent
stock price. Therefore, if a market is efficient, it would not be possible to find misvalued
stocks. The reasoning behind this is supply and demand. If a stock is overvalued, then
investorswillsellthestock,whereasinvestorswillpurchaseundervaluedstocks.Therefore,
supply and demandwill quickly adjust the price to a correct level, thereby eliminating the
opportunityofearningsuperiorprofitsoveralongperiodoftime.Inotherwordsthiswould
alsomean,thatnotevenareallyhardworkingmanwouldbeabletoearnsuperiorprofits.If
thisisthecase,thentheefficientmarkethypothesisissaidtobefulfilled(Brealeyetal.,2007).
In1970EugeneF.Famafoundtheneedtofurtherdeveloptheefficientmarkethypothesis.
Hearguedthatwhenanefficientmarketisdefinedasamarketthatfullyreflectallavailable
information, then the null hypothesis would be rather extreme, and therefore one cannot
expectittobeliterallytrue.Therefore,hedividedtheefficientmarkethypothesisintothree
subcategories,whichcouldindividuallybetested.
Weakformefficiency:Thistypeofefficiencyischaracterizedbythefactthatpricesreflectall
theinformation,whichiscontainedinthehistoricprices.Changesinthestockpricesaresaid
to follow a random walk, and therefore analysis of patterns in previous stock prices are
valuelesswhentryingtopredictfuturestockprices.
Semistrong form efficiency: This type of efficiency is similar to the weak form efficiency,
however this also includes all public available information. This means, that one simply
Page9
cannotearnsuperiorprofitsjustbyreadingthefinancialpress,studyingfinancialstatements,
etc. In other words this implies, that in the moment new information about a company
becomespublic,thenthestockpricewillimmediatelyadjusttothat.
Strong formefficiency:The last formofefficiency is thestrong formefficiency,whereprices
includeallavailableinformation.Thismeansthatinformationsuchas“insider”informationis
alsocontainedinthestockprice,andtherefore,itisabsolutelyimpossibleforaninvestorto
earnsuperiorprofits.
The advantageof dividing the efficientmarkethypothesis into threewas, that if itwasnot
fulfilled, then one would be able to pinpoint exactly at which level of information the
hypothesisbreaksdown.
In Fama’s analysis he found that there was no important evidence against the weak and
semistrongformefficiency,andthattherewasonlylimitedevidenceagainstthestrongform
efficiency.Whenrelating this to theperformanceofmutual funds, thiswouldmeanthathis
analysispoints inthedirection, thatmutual fundsshouldnotbeabletooutperformpassive
marketindexes.Thesimplereasoningbehindthatis,thatifthestockmarketisfullyefficient,
noanalysisofanykindcouldhelppredictthefuturestockprices,therebyenablingthespecific
fundtoearnsuperiorprofitsoveralongerperiodoftime(Fama,1970).
In1991EugeneF. Famaconducteda similar analysisofmarket efficiency,however, in this
analysishenamedthethreetypesofmarketefficiencydifferently.Theywerecalled:
1.Testforreturnpredictability
2.Eventstudies
3.Testsforprivateinformation
Thesecondandthethirdcategoryhavethesamecoverageaspreviously,but justwithnew
names. Themain difference lies in the first category, which besides the forecasting power
basedonpastreturnsnowalso includethingsas forecastsbasedonvariables likedividend
yields,interestrates,seasonality,etc.
TheresultfromFama’sanalysiswas,thatheconcludedthatreturnswerepredictablebased
uponpastreturns,dividendyields,etc(Fama,1991).
Page10
Toconcludeonthemarketefficiency,onecansaythatifyoubelieveinmarketefficiencyinit
strongest form, then your best choice would simply be to choose a passive investment
strategy. The reasonof that is, that if themarket is efficient in its strongest form, then the
stockpriceswill followarandomwalk.Therefore, thebest thingyoucandoasan investor
wouldbetominimizeyourtradingcostsandinformationseekingcosts.
However,itdoesnotseemasifmutualfundsbelieveinmarketefficiencyinitsstrongestform,
since many of them choose an active investment strategy. Hence, they must believe that
through different kinds of analysis, they would be able to outperform the market. This is
identical totheresultsFamareached inhissecondanalysisofmarketefficiencyfrom1991,
whereheconcludesthatitwaspossibletopredictfuturestockreturns.
Inrelationtothisthesis,thisindicatesthatthereisapossibilitythatthemutualfundsareable
tooutperformthemarket.
3.2CapitalAssetsPricingModel(CAPM)
CAPM was among others developed by William F. Sharpe in 1964, and together with the
efficientmarkethypothesis,thecapitalassetpricingmodelformsthetheoreticalframework
formanyfinancialanalyses.
Asthenamesuggests,itisamodel,whichisusedtodeterminethepriceofcapitalassets.
Basically,themodelisbuildupontwothings;firstly,ariskpremiumbaseduponbetaandthe
marketriskpremiumandsecondly,therisk‐freerate(Brealeyetal.,2007).
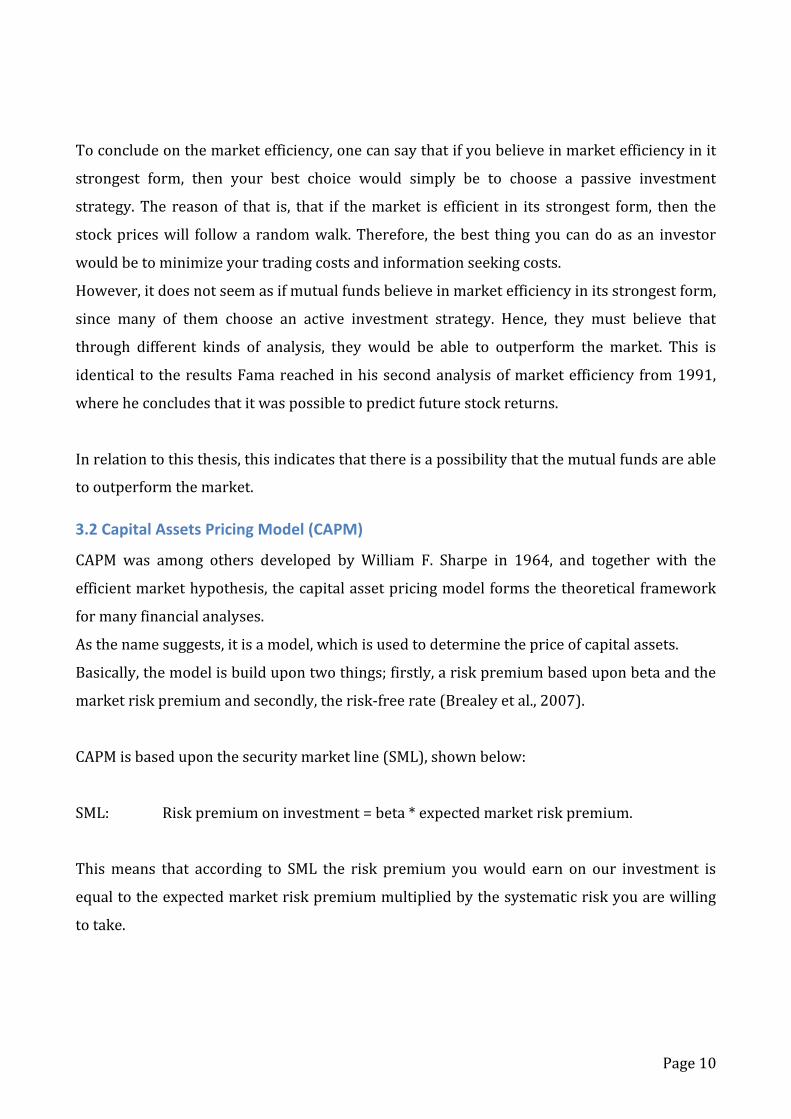
CAPMisbaseduponthesecuritymarketline(SML),shownbelow:
SML: Riskpremiumoninvestment=beta*expectedmarketriskpremium.
Thismeans that according to SML the risk premium youwould earn on our investment is
equaltotheexpectedmarketriskpremiummultipliedbythesystematicriskyouarewilling
totake.
Page11
The CAPM model works with returns instead of risk premiums, and therefore the CAPM
modellookslikethis:
CAPM: Expectedreturnonstock=Risk‐freeinterestrate+(beta*marketriskpremium)
r=rf+β(rm–rf)
Where:
r=Returnoninvestment
rf=Riskfreerate
β=Measureofthesystematicrisk
rm=Returnfromholdingmarketportfolio
BelowtheCAPMmodelhasbeenillustrated.
When looking at the abovediagram,one can see, that if you arenotwilling to takeon any
systematicrisk,thenyouwouldearntherisk‐freerate.Thiswouldbeequivalenttoinvesting
inrisk‐freetreasurebills,sincethisisthelessriskyassetyoucanhold.
Page12
Ontheotherhand,ifaninvestorinvestedeverythinginthemarketportfolio,thenhewould
haveabetaof1.AccordingtotheCAPMmodel,hewouldthenearnthemarketreturn.
TheessenceoftheCAPMisthatyouarerewardedbyareturnontheSMLlinedependonthe
risk(β)youarewillingtotake(Brealeyetal.,2007).
3.2.1CritiqueoftheCapitalAssetPricingModel(CAPM)
The CAPM has received a lot of critique for being based upon assumptions, which are so
theoretical,thattheyareunrealisticinapracticalsense.
TheCAPMassumptionsareasfollows(Mullins,1982)and(Jensen,1967):
1. Thesecuritymarketiscompetitiveandefficient.
2. Investorsarerationalandrisk‐averse,andthereforewanttomaximizereturnsbasedon
therisktheyaretaking.
3. Themarketisfrictionless,andthereforeitdoesnotincludetransactioncosts,taxes,and
restrictionsonborrowingandshortselling.
4. Allinvestorscanborrowandlendunlimitedamountsattheriskfreerate.
5. Investors agree on common expectations about performance and risk of all securities
(thereforeallinvestorshavethesameprobabilityofgettingcertainfuturereturns).
6. Allinvestorshavethesametimehorizonfortheirinvestments.
7. Thepriceofsecuritiesisnotaffectedbysalesandpurchasesofindividualinvestors.
8. Allinvestorshavethesameopportunitiesofinvestingindifferentstock.Inotherswords,
allinvestorshavethepossibilitytopurchaseeachandeverysecurityinthemarket.This
wouldalsorequirethesecuritiestobe infinitelydivisible,sothatsothatevery investor
hasthesameinvestmentopportunitiesindependentoftheparticularinvestor’sfortune.
When reading through theseassumptionsofCAPM,one caneasily see, that theyare rather
theoretical, and therefore, it is impossible to fully fulfil theseassumptions in reality. Just to
discuss a few, one can mention that it is doubtful whether all investors have the same
investmentopportunitiesindependentlyoffortune.Thereasonofthatis,thatsomesecurities
areveryexpensiveandnotdividable,meaningthatitrequiresaratherlargefortunetoinvest
in those securities. Thiswill limit the opportunities for the lesswealthy investors. If a less
wealthy investorwantstheopportunityof investing inallsecurities,hewouldhavetodo it
Page13
throughamutual fund.Therebyhewouldhavetopaysomecosts for investingthroughthe
fund.
Even foran investornotusingamutual fund, it isverydoubtful thathehasno transaction
costs. The reason of that is, that for private investors there is some sort of brokerage on
literallyeverytransaction.
InspiteofthecritiqueanddoubtfulassumptionsregardingCAPM,onemightwonderwhether
themodel isworthanything inreal life.Thesimpleanswer isyes. It isnotaperfectmodel,
howeveritisveryuseful.
In1982DavidW.Mullins,Jr.conductedananalysisofwhethertheCAPMworks.Theresults
fromhisanalysiswerethatCAPMwasnotperfect,however itwasaveryusefuladditionto
otheranalytical toolkits.He furtherargued thateven though theassumptionsofCAPMare
very theoretical and unrealistic, it is often necessary to simplify reality in that manner in
ordertodevelopusefulmodels.Inadditionhearguesthattheunderlyingassumptionsofthe
modelarenotnecessarilythemostimportantthings,andthatimportanceshouldbeattached
tothevalidityandusefulnessofthemodel’sprescription.
ResultsfromdifferentanalysesofCAPMhaveshownthatasameasureofrisk,betaseemsto
be related to past returns. In addition, the relationship between past returns and beta has
shown to be linear, and that the relationship between the two is positively sloped. Finally
research has shown, that CAPM overestimates returns for low beta securities and
underestimatereturns forhighbetasecurities.Thiswill cause that theempiricalSML tobe
lesssteeplyslopedthanthetheoreticalSML(Mullins,1982).
To briefly sumup on the empirical tests of CAPM, one can say that they do not absolutely
validatethemodel,howevertheysupportsomeofthemainimplicationsofCAPM.Firstofall,
theysaythatthesystematicrisk(beta)appearstoberelatedtopastreturns,secondly, that
thereisapositiverelationsbetweenriskandreturn,andfinally,thattherelationshipbetween
riskandreturnappearstobelinear.
Theperformancemeasurements thatwill beused in this thesis arebaseduponCAPM, and
thereforethevalidityofCAPMofimportanceforthisthesis.
Page14
3.3Riskmeasurements
Infinanceyouoftendistinguishbetweentwodifferenttypesofrisk,andthereforethesewill
brieflybeexplainedinordertoavoidconfusion.Theperformancemeasurementsusedinthis
analysis only focuses on the systematic risk, and therefore thedistinctionbetween them is
important.
3.3.1Systematicrisk
Thesystematicriskistherisk,whichliesinthemarket.Therefore,thisriskcannotbeavoided
regardless of how diversified your portfolio is. In other words it can be said that the
systematicriskisamacroeconomicrisk,simplybecausethatitisariskwhichtosomeextent
will affect the entire market. An example of this systematic risk, which affects the entire
market, could be the latest financial crisis, or simply just fluctuations of the market. The
degreetohowmuchasecurityisaffectedbythesystematicriskdependsonitsbeta(whichis
thenotationforsystematicrisk)(Brealey,2007).
Securitieswithlowbetaswillbelessaffectedbymacroeconomicchangesthansecuritieswith
highbetas.
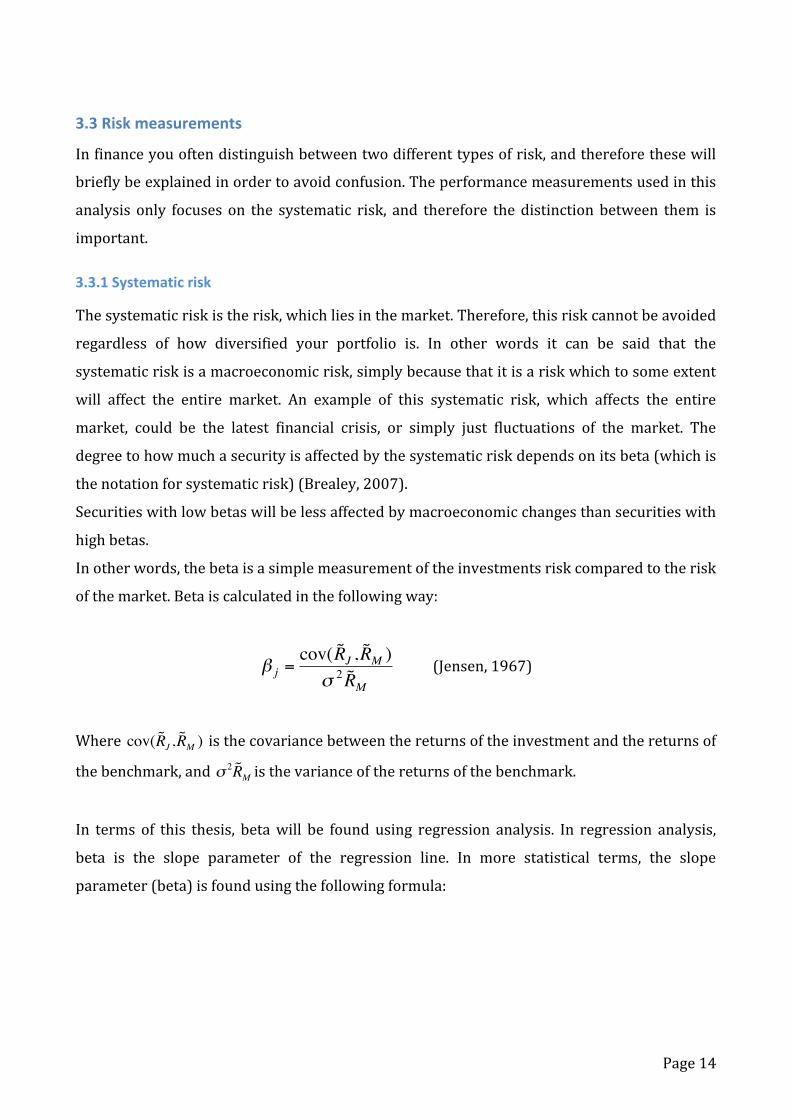
Inotherwords,thebetaisasimplemeasurementoftheinvestmentsriskcomparedtotherisk
ofthemarket.Betaiscalculatedinthefollowingway:
€
β j =cov( ˜ R J , ˜ R M )σ 2 ˜ R M
(Jensen,1967)
Where
€
cov( ˜ R J , ˜ R M ) isthecovariancebetweenthereturnsoftheinvestmentandthereturnsof
thebenchmark,and
€
σ 2 ˜ R M isthevarianceofthereturnsofthebenchmark.
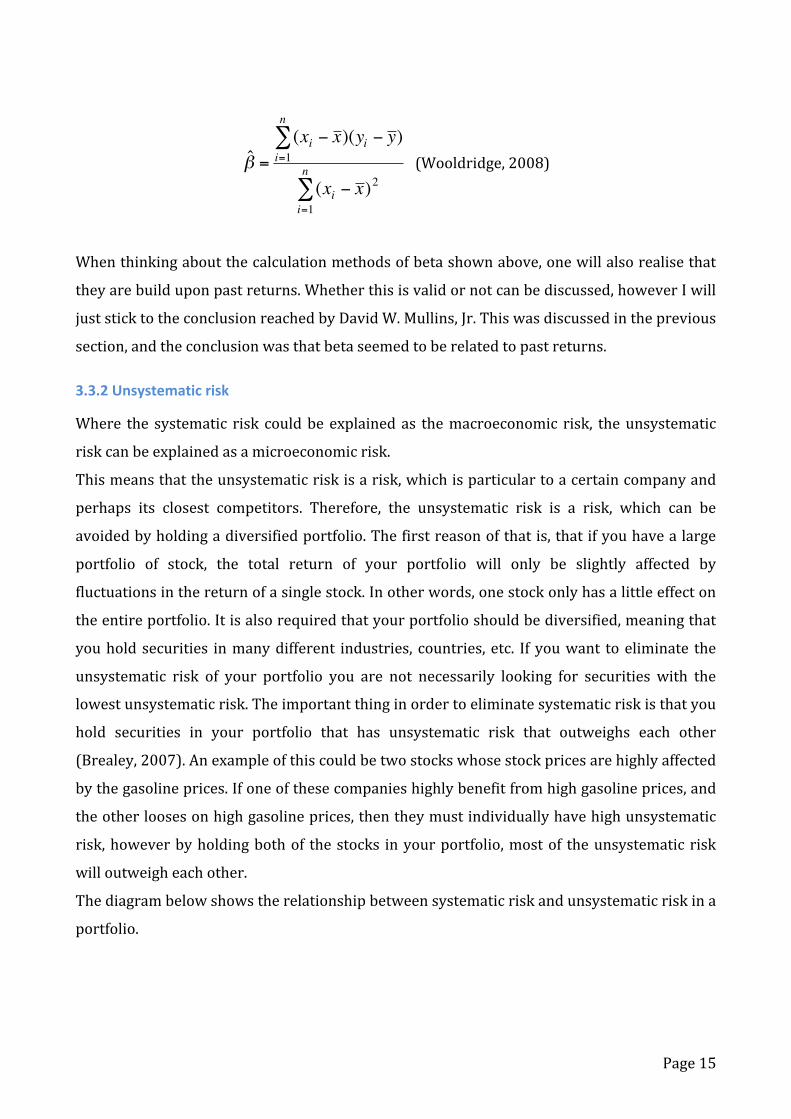
In terms of this thesis, betawill be found using regression analysis. In regression analysis,
beta is the slope parameter of the regression line. In more statistical terms, the slope
parameter(beta)isfoundusingthefollowingformula:
Page15
€
ˆ β =(xi − x
i=1
n
∑ )(yi − y )
(xi − x )2
i=1
n
∑ (Wooldridge,2008)
Whenthinkingaboutthecalculationmethodsofbetashownabove,onewillalsorealisethat
theyarebuilduponpastreturns.Whetherthisisvalidornotcanbediscussed,howeverIwill
juststicktotheconclusionreachedbyDavidW.Mullins,Jr.Thiswasdiscussedintheprevious
section,andtheconclusionwasthatbetaseemedtoberelatedtopastreturns.
3.3.2Unsystematicrisk
Where the systematic risk couldbeexplainedas themacroeconomic risk, theunsystematic
riskcanbeexplainedasamicroeconomicrisk.
Thismeansthattheunsystematicriskisarisk,whichisparticulartoacertaincompanyand
perhaps its closest competitors. Therefore, the unsystematic risk is a risk, which can be
avoidedbyholdingadiversifiedportfolio.Thefirstreasonofthatis,thatifyouhavealarge
portfolio of stock, the total return of your portfolio will only be slightly affected by
fluctuationsinthereturnofasinglestock.Inotherwords,onestockonlyhasalittleeffecton
theentireportfolio.Itisalsorequiredthatyourportfolioshouldbediversified,meaningthat
youholdsecurities inmanydifferent industries, countries, etc. If youwant toeliminate the
unsystematic risk of your portfolio you are not necessarily looking for securities with the
lowestunsystematicrisk.Theimportantthinginordertoeliminatesystematicriskisthatyou
hold securities in your portfolio that has unsystematic risk that outweighs each other
(Brealey,2007).Anexampleofthiscouldbetwostockswhosestockpricesarehighlyaffected
bythegasolineprices.Ifoneofthesecompanieshighlybenefitfromhighgasolineprices,and
theotherloosesonhighgasolineprices,thentheymustindividuallyhavehighunsystematic
risk,howeverbyholdingbothof thestocks inyourportfolio,mostof theunsystematicrisk
willoutweigheachother.
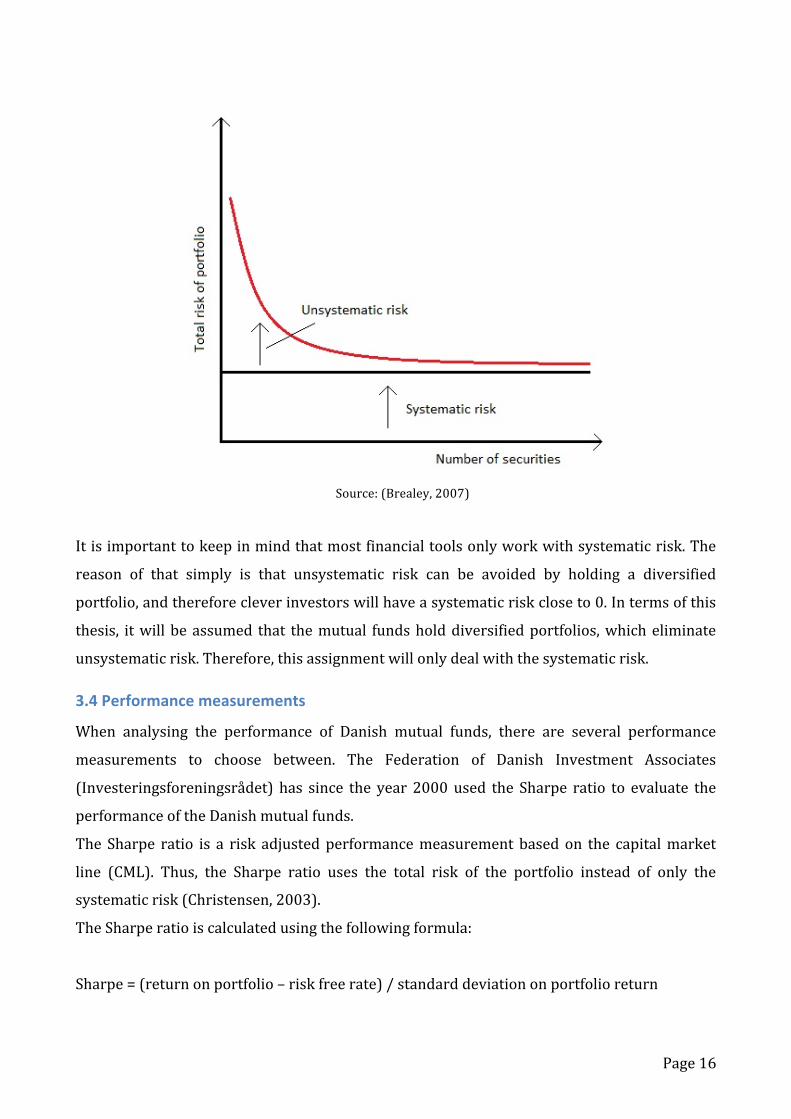
Thediagrambelowshowstherelationshipbetweensystematicriskandunsystematicriskina
portfolio.
Page16
Source:(Brealey,2007)
Itisimportanttokeepinmindthatmostfinancialtoolsonlyworkwithsystematicrisk.The
reason of that simply is that unsystematic risk can be avoided by holding a diversified
portfolio,andthereforecleverinvestorswillhaveasystematicriskcloseto0.Intermsofthis
thesis, itwillbeassumed that themutual fundsholddiversifiedportfolios,whicheliminate
unsystematicrisk.Therefore,thisassignmentwillonlydealwiththesystematicrisk.
3.4Performancemeasurements
When analysing the performance of Danish mutual funds, there are several performance
measurements to choose between. The Federation of Danish Investment Associates
(Investeringsforeningsrådet) has since the year 2000used the Sharpe ratio to evaluate the
performanceoftheDanishmutualfunds.
The Sharpe ratio is a risk adjustedperformancemeasurement basedon the capitalmarket
line (CML). Thus, the Sharpe ratio uses the total risk of the portfolio instead of only the
systematicrisk(Christensen,2003).
TheSharperatioiscalculatedusingthefollowingformula:
Sharpe=(returnonportfolio–riskfreerate)/standarddeviationonportfolioreturn
Page17
As discussed previously, it must be assumed that mutual funds hold diversified portfolio,
which eliminates the unsystematic risk, and therefore the Sharpe ratio is not the best
performancemeasurementinthiscase.
Instead, thisanalysiswilluse the Jensen index/Jensen’sAlpha tocalculate therisk‐adjusted
returnsofthemutualfunds,andthereareseveralreasonsofthat.
Firstofall,theinterpretationofJensen’salphaiseasier,asitshowsthepercentageexcessrisk
premiumthatamutualfundhasearnedcomparedtoitsbenchmark.HenceaJensenindexof
0,15%simplyjustmeansthatthemutualfundhasearnedanexcessreturnof0,15%pertime
unitcomparedtoitsbenchmark.Ontheotherhand,theSharperatiogivesyouriskpremium
per risk unit, and therefore it can be difficult for private investors to interpret whether a
Sharperatioof0,5isgoodorbad.
Secondly,Jensen’salphaiscalculatedusingregressionanalysis,meaningthatitcandirectlybe
seen from the output whether the results are statistically significant or not. If we again
compare to theSharperatio,wecannotdirectly interpretwhetheraSharperatioof0,25 is
significantlybetterthanoneof0,3withoutdoingadditionalcalculations.
Thirdly, Jensen’s alphamakesa relative comparison to abenchmarkwithin the calculation.
UsingtheSharperatio,onewouldhavetocalculatetheSharperatioforthebenchmark,and
thencompareittothatofthemutualfund.
Finally,Jensen’salphacanbeusedonbothefficientandinefficientportfolios,sinceitisbased
onthesecuritymarketline.Inotherwords,itcanbeusedforportfoliosthatlieonthesecurity
market line(theefficientones)andforportfoliosthatdonot lieonthesecuritymarket line
(theinefficientones).IfweagaincomparetotheSharperatio,thenthisisbasedonthecapital
marketline,andthereforeitcanonlybeusedforefficientportfolios(Christensen,2003).
In the analysis by Christensen (2003), he further concludes that the tradition in academic
literatureistouseJensen’salphaandthatmorethan100Americanresearchstudiesarebuild
uponthismethod.
Basedon theabove‐mentionedarguments, Jensen’sAlphawillbeused for theperformance
evaluationinthisthesis.
Page18
3.4.1Jensen’sAlpha
Jensen’s alphaor Jensen’s index is a riskadjustedperformancemeasurementdevelopedby
MichaelC.Jensenin1967.
ThemodelisbuilduponCAPM,andthereforeitassumesthatportfoliosarewelldiversified,
so that unsystematic risk is eliminated. Since the model is based upon CAPM, the same
assumptionsapplyforJensen’salphaasforCAPM(Jensen,1967).
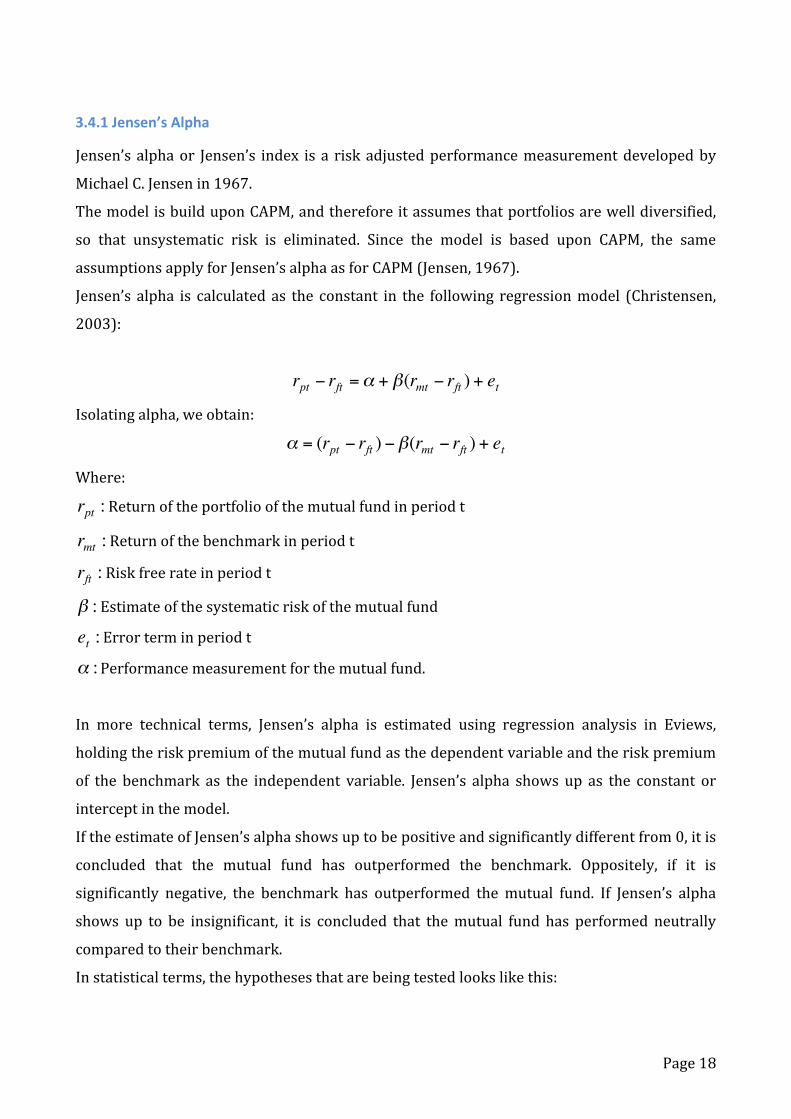
Jensen’s alpha is calculated as the constant in the following regressionmodel (Christensen,
2003):
€
rpt − rft =α + β(rmt − rft ) + et
Isolatingalpha,weobtain:
€
α = (rpt − rft ) − β(rmt − rft ) + et
Where:
€
rpt :Returnoftheportfolioofthemutualfundinperiodt
€
rmt :Returnofthebenchmarkinperiodt
€
rft :Riskfreerateinperiodt
€
β :Estimateofthesystematicriskofthemutualfund
€
et :Errorterminperiodt
€
α :Performancemeasurementforthemutualfund.
In more technical terms, Jensen’s alpha is estimated using regression analysis in Eviews,
holdingtheriskpremiumofthemutualfundasthedependentvariableandtheriskpremium
of the benchmark as the independent variable. Jensen’s alpha shows up as the constant or
interceptinthemodel.
IftheestimateofJensen’salphashowsuptobepositiveandsignificantlydifferentfrom0,itis
concluded that the mutual fund has outperformed the benchmark. Oppositely, if it is
significantly negative, the benchmark has outperformed themutual fund. If Jensen’s alpha
shows up to be insignificant, it is concluded that themutual fund has performed neutrally
comparedtotheirbenchmark.
Instatisticalterms,thehypothesesthatarebeingtestedlookslikethis:
Page19
€
H 0 :α = 0H1 :α ≠ 0
WhentestingthesignificanceofJensen’salpha,thep‐valueofthecoefficientwillbeused.The
significanceofJensen’salphawillbothbeevaluatedata5%anda10%significancelevel. If
thep‐valueisbelow10%,thenJensen’salphaissignificantata10%level,andif it isbelow
5%itissignificantata5%level.
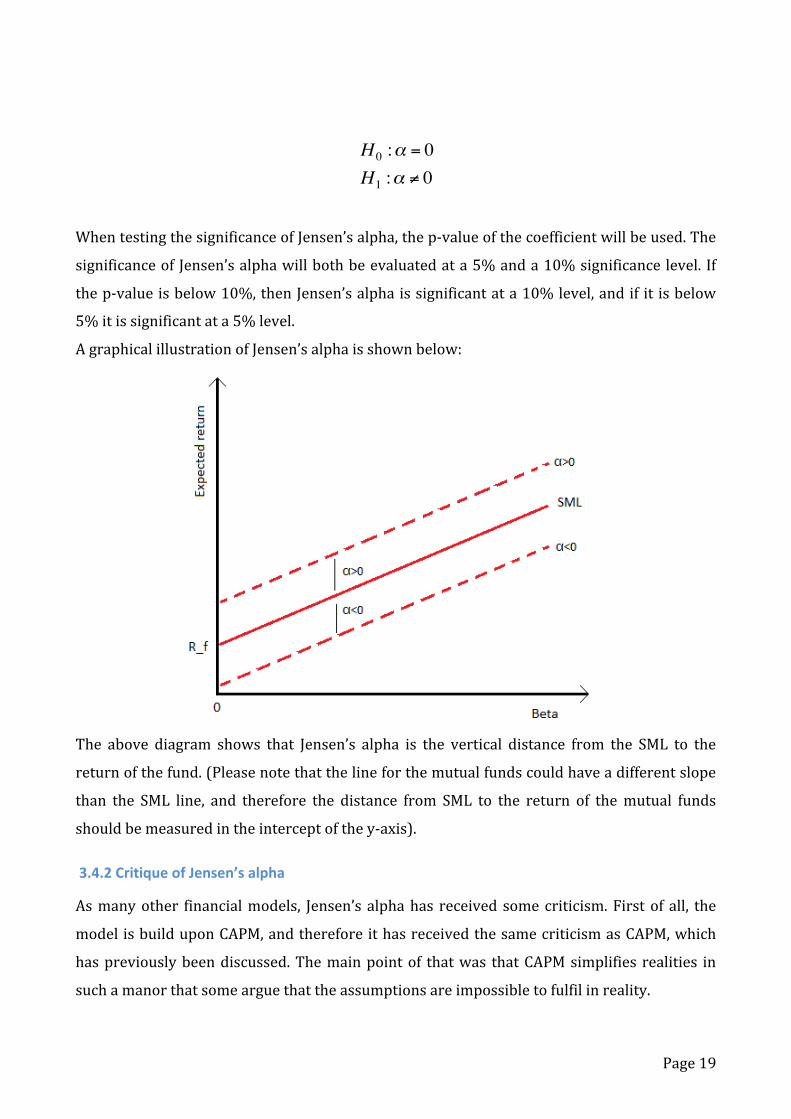
AgraphicalillustrationofJensen’salphaisshownbelow:
The above diagram shows that Jensen’s alpha is the vertical distance from the SML to the
returnofthefund.(Pleasenotethatthelineforthemutualfundscouldhaveadifferentslope
than the SML line, and therefore the distance from SML to the return of themutual funds
shouldbemeasuredintheinterceptofthey‐axis).
3.4.2CritiqueofJensen’salpha
Asmanyother financialmodels, Jensen’s alphahas received somecriticism.Firstof all, the
modelisbuilduponCAPM,andthereforeithasreceivedthesamecriticismasCAPM,which
haspreviouslybeendiscussed.Themainpointof thatwas thatCAPMsimplifies realities in
suchamanorthatsomearguethattheassumptionsareimpossibletofulfilinreality.
Page20
Roll (1977) further discusses the CAPM and the implications it has on performance
measurementsusingmodelsbuilduponCAPM.Mostofhisargumentationisconnectedtothe
choiceofbenchmark.
Firstofall,hearguesthatthechoiceofbenchmarkaffectsthesizeofthebetafortheportfolio.
In otherwords, thismeans that aportfoliowill havedifferent valuesof betadependenton
which benchmark is used as proxy for themarket portfolio. The reason of that is, that the
varianceofthemarkedportfolioisusedinthecalculationofthebetaofamutualfund.This
also implies that two investorswithexactly thesameriskprofilecanhavedifferentbetas if
theyusedifferentproxiesforthemarkedportfolio.
Thisthereforeimpliesthatbetaisnotanunambiguousmeasurementofthesystematicriskof
theportfolio.
Roll(1977)alsodiscussesthattherearetwodifficultieswhenusingaproxyforthemarked
portfolio.Firstofall, theproxycouldbeefficienteventhoughthe truemarket is inefficient,
therebyshowingan incorrectpictureof the truemarket.Secondly,heargues that it isvery
likely that there will be a high correlation between reasonable proxies for the marked
portfolio, and therefore it could seem as if the choice of either one of them is of less
importance.However, this is not the case according tohis analysis, becausehe argues that
eventhoughtheproxieshavehighcorrelation,theycanresultinquitedifferentinferencesin
theactualperformanceanalysis.
Theconclusiontothismustthereforebethatthechoiceofbenchmarkisofcrucialimportance
fortheresultsoftheperformanceanalysis.
TheimportanceofcorrectuseofbenchmarkswasshownbyIppolito(1989).Inthisanalysis,
Ippolito reached the opposite conclusion of most other analyses, namely that the mutual
funds had been able to outperform themarket. However, Elton et al. (1993) reviewed the
analysis, and reached the conclusion that Ippolito’s resultswere causedby incorrectuseof
benchmarks. Itshowedup,thatmanyofthemutual fundsIppolitohadanalysedinvestedin
“small” American stocks,whichwere not included in the S&P 500‐indexwhich he used as
benchmark.The“small”stockshadperformedbetterthantheS&P500‐indexintheperiodof
analysis,andthereforetheanalysisbyIppolitoshowedsuperiorperformancebythemutual
Page21
funds. However Elton et al. (1993) redid the analysis using appropriate benchmarks and
reached the same conclusionasother analysis, namely that themutual fundshadnotbeen
abletooutperformthemarket.
The example above shows, that reasonable use of benchmarks is crucial in order to reach
valid conclusions in the analysis. Therefore one should act carefully when choosing the
benchmarksforananalysis.
Inthediscussionofmarketefficiency,Roll(1977)alsodiscussesthatiftheproxyusedforthe
market portfolio is efficient, then none of the estimated Jensen’s alpha can be significantly
positive. The simple argumentation behind this is that if the marked is efficient, then all
informationisreflectedinthestockprice.Thus,itwouldbeimpossibleforamutualfundto
outperformtheindex,andthereforetheyshouldshowuptohaveinsignificantJensen’salpha.
As previously discussed, Fama (1991) showed that the stockmarkets where not perfectly
efficient,sothereforeitshould,atleastaccordingtoFama,bepossibleforthemutualfundsto
outperformthebenchmarks. Inrelationto this,Roll (1977)discusses that if theproxyused
forthemarketportfolioisnotefficient,thenhowcanitbejustifiedtouseitasabenchmarkin
aperformanceanalysis,whentheperformanceanalysis isbuilduponCAPMwhichrequires
efficientmarkets.
Itshouldfinallybenoted,thatthemulti‐indexmodelisbasedontheexactsametheoryasthe
Jensenindex,andthereforethecritiqueappliesforthemulti‐indexmodelaswell.
3.4.3Multi‐indexmodel
OnedrawbackofusingtheJensenindex,asdescribedabove,isthatitisasingleindexmodel.
It therefore requires that the investment objective of the mutual funds is well‐defined,
meaningthatitcanbeexplainedbasedononlyonebenchmark.
DanishlegislationrequiresthatDanishmutualfundsinvestatleast75%oftheirinvestment
withintheirmaininvestmentcategory.Thismeans,thattheDanishmutualfundsareallowed
toinvestupto25%ofitsvalueinanyotherinvestment.These25%canbeinvestedinboth
stocksaswellasbonds,howevermostmutualfundschoosetoinvestsolelyineitherstocksor
bonds.Thereasonofthatis,thatiftheychooseacombination,thefundwillbeclassifiedasa
mixedfund,whichchangesthetaxationofthefund(Christensen,2003).
Page22
The 25%‐rule could indicate that the performance of Danish mutual funds cannot be
evaluatedbasedononebenchmarkonly,andthereforeamulti‐indexmodelwillbeincluded
inordertoseewhetherthisisbetteratexplainingthereturnsofthemutualfunds.
Themulti‐indexmodelwillboth includestock indexesaswellasbonds indexes inorder to
coverallthepossibilitiesthemutualfundshave.
Differentmulti‐indexmodelswillbeuseddependentonwhatthemaininvestmentcategoryof
the investment funds. Therefore, the specificmodelswill be show in the section “choice of
benchmark”.
The purpose of using a multi‐index model is to increase the amount of variation in the
dependent variables explainedby independent variables in themodel. In order to evaluate
uponwhetherithasthedesiredeffect,oneshouldlookatadj.R2.Iftheadj.R2increaseswhen
includingotherbenchmarks,thismeans,thatthenewbenchmarkscapturesomething,which
thesinglebenchmarkwasnotabletocapturebefore.Thereasonofusingtheadj.R2insteadof
just the regular R2 simply is that the adj. R2 allows for comparisons betweenmodelswith
different numbers of independent variables. Adj. R2 has been corrected to allow this
comparison.
However, it is a requirement that the other benchmarks included in themulti‐indexmodel
havebeta‐coefficientsthataresignificantlydifferentfromzero.Ifthisisnotthecase,thenit
means that theyare insignificant, and therefore theydonothavea significanteffecton the
model,andshouldberemovedfromthemodel.
Thus,thereisachancethatthemulti‐indexmodelwillshowupwithexactlythesameresult
as thesingle index‐model.Thiswouldoccur ifall theadditionalbenchmarksshowup tobe
insignificant. If benchmarks show up to be insignificant, they should be removed from the
model onebyone, startingwith theonewith thehighestp‐value.Each timea variablehas
beenremoved,anewregressionmodelshouldbeestimated,andexactlythesameevaluation
shouldtakeplaceuntilthemodelconsistsofonlysignificantvariables.
Themulti‐indexmodelwillbeestimatedusingregressionanalysis,similarlytotheestimation
ofJensen’salphainthesingleindexmodel.Itwillbedonebyregressingtheriskpremiumof
the fundas thedependentvariableholdingtheriskpremiumof thedifferentbenchmarkas
theindependentvariables.
Page23
3.4.5Markettiming
TheJensenindexandthemulti‐indexmodelisonlyconcernedwiththeselectionabilityofthe
mutual funds to earn superior return. However, superior returns can also be obtained by
timingthemarket,andthereforeTreynor&Mazuy(1966)developedamodel,whichcanbe
used toanalyseboth theselectionand timingabilitiesofamutual fund. Inotherwords the
performanceanalysisisdividedintotwopieces,oneanalysingthemutualfundsabilitytofind
undervalued stocks (selectivity) and one analysing the mutual funds ability to predict the
directionthemarketwillbemovingin(timing).Thiswouldallowonetoseespecificallywhich
ofthesetwothingscausesagivenperformancebyaninvestmentfund.
Themodelwritesasfollows:
€
rpt − rft =α + β(rmt − rft ) + γ(rmt − rft )2 + et
Themodel is similar to the Jensen index, however in this themodel by Treynor &Mazuy
(1966)aquadratictermhasbeenincluded.
Inthemodel,αrepresentstheselectionabilityofthefund,whereasγrepresentsthetiming
abilityofthefund.TreynorandMazuy(1966)arguethatifγshowsupsignificantandpositive
intheregressionmodel,thisindicatesthatthemutualfundpossessedtheabilitytotimethe
market.
Thereasoningbehindthemodelisasfollows:
Ifmutual funds posses the ability to time themarket, they should adjust the beta of their
portfolio upwardswhen themarket is rising,whereas they should adjust the beta of their
portfolio downwards when the market is falling. The thoughts behind this is that mutual
funds should maximize their returns by having high betas when the market is moving
upwards,whereastheyshouldminimizetheirloosesbyhavinglowbetaswhenthemarketis
moving downwards. This would therefore also require the mutual funds to adjust their
systematicrisk,correspondingtotheirexpectationsaboutthemarket.
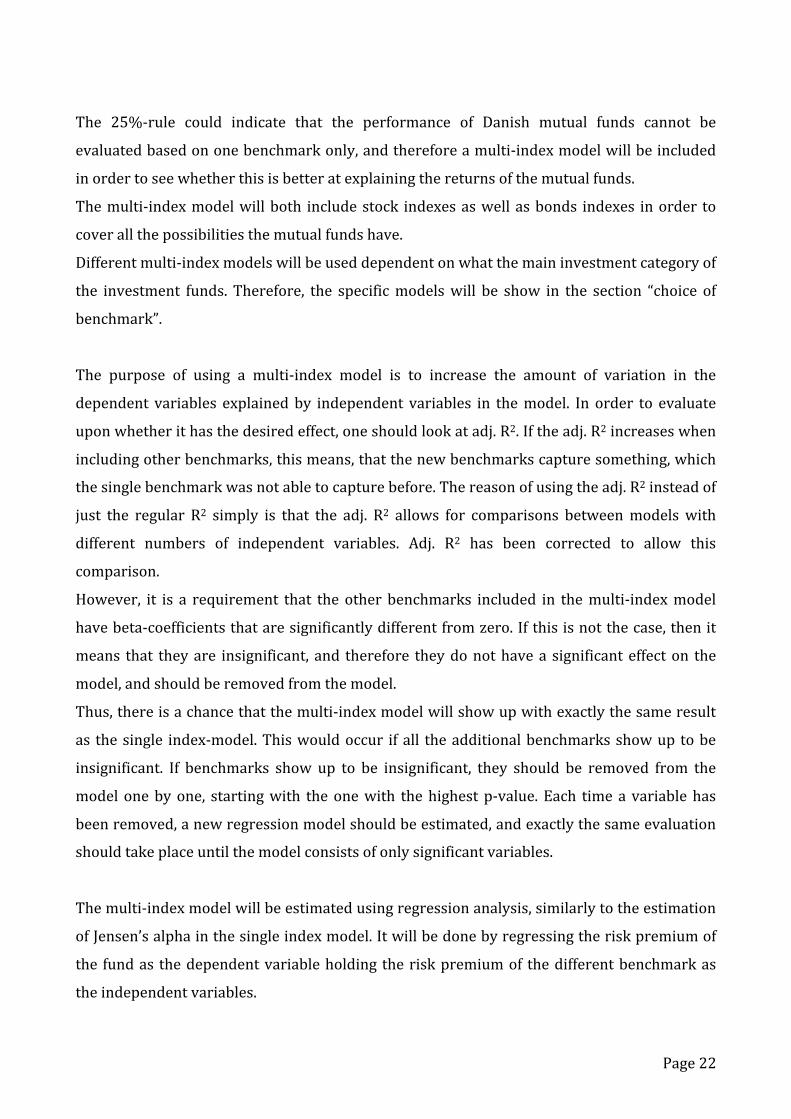
TreynorandMazuy(1966)usedthefollowingthreefigurestoexplainthedifferentscenarios
in the market timing analysis. The models are based on a “characteristic line”, which is
Page24
obtainedbyplottingthereturnofthemarketonthex‐axis,holdingthereturnofthemutual
fundonthey‐axis.
Thediagrambelowillustratesamutual fundholding itsbetaconstant, therebynotworking
withmarkettimingbyadjustingbetatotheexpectationsofthemarket.
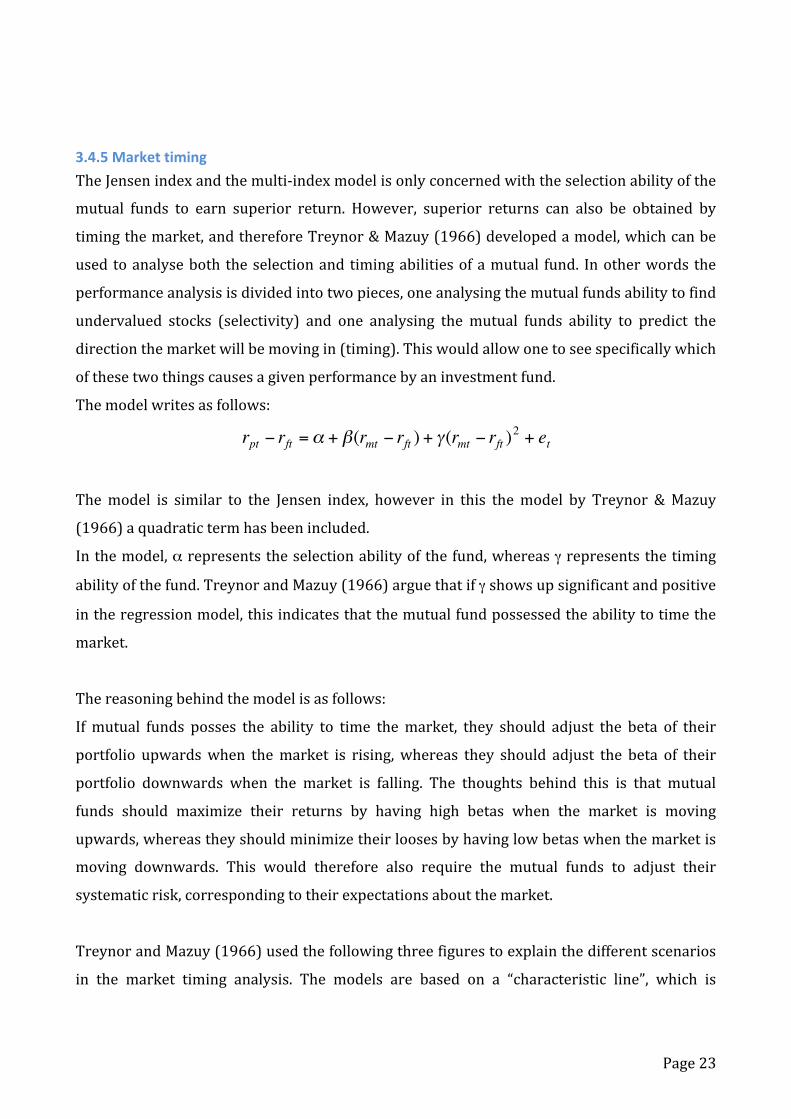
Thenextdiagramillustratesthemutualfundthatperfectlytimesthemarketineachsituation.
Thismutualfund(blackline)willholdaportfoliowithahighbetawhenthemarketyieldsa
highreturn,whereasitwouldholdaportfoliowithalowbetawhenthereturnofthemarket
isbad.Notethattheredlineisfortheinvestmentfund,whichhastimedthemarketincorrect,
byhavinglowbetainincreasingperiods‐,andhighbetaindecreasingperiods.
Page25
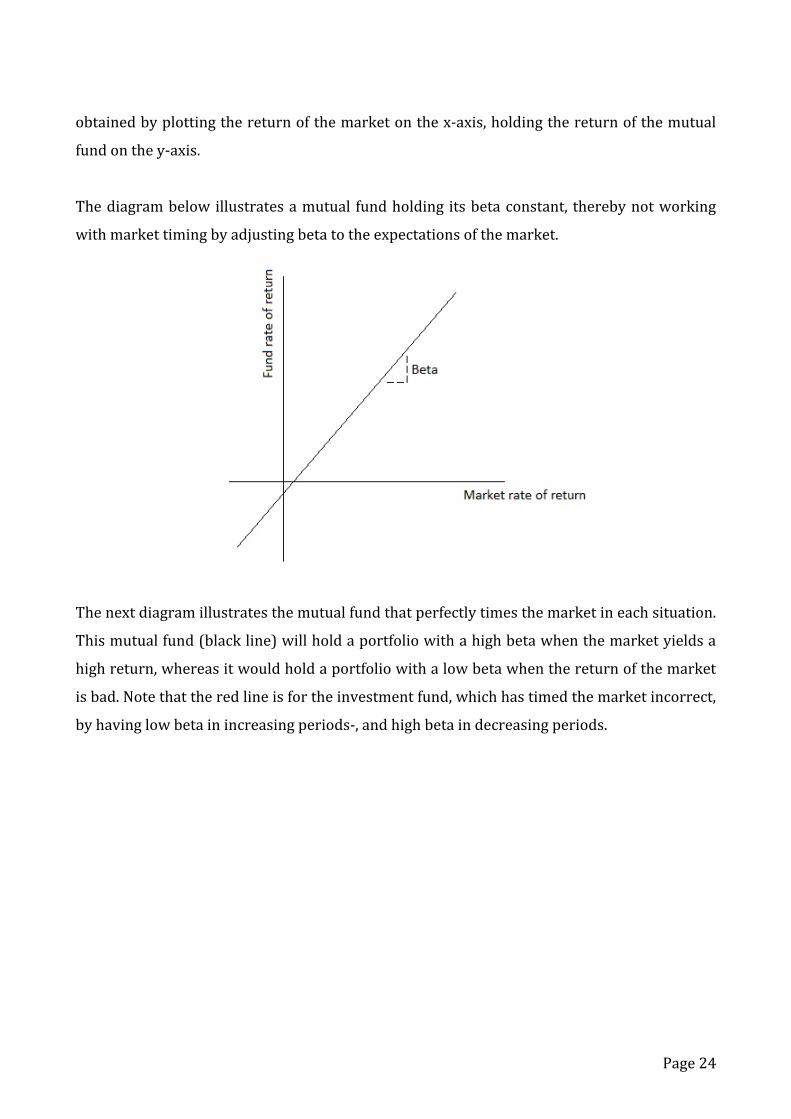
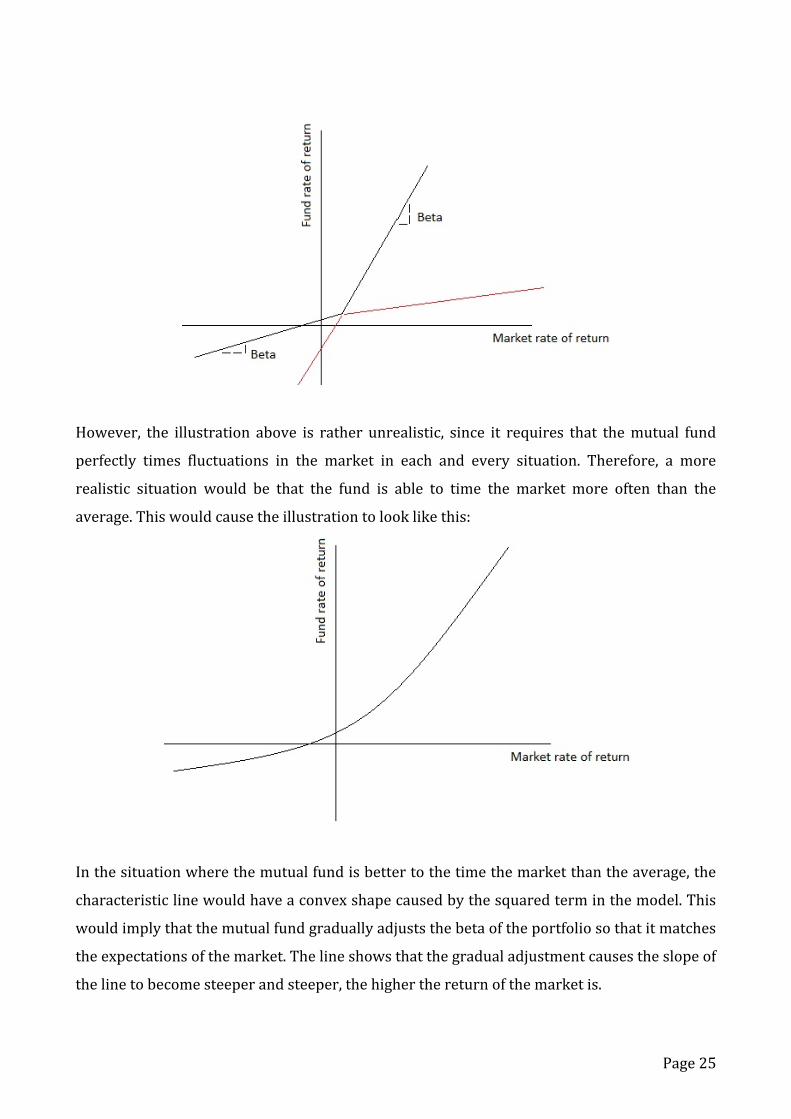
However, the illustration above is rather unrealistic, since it requires that themutual fund
perfectly times fluctuations in the market in each and every situation. Therefore, a more
realistic situation would be that the fund is able to time the market more often than the
average.Thiswouldcausetheillustrationtolooklikethis:
Inthesituationwherethemutualfundisbettertothetimethemarketthantheaverage,the
characteristiclinewouldhaveaconvexshapecausedbythesquaredterminthemodel.This
wouldimplythatthemutualfundgraduallyadjuststhebetaoftheportfoliosothatitmatches
theexpectationsofthemarket.Thelineshowsthatthegradualadjustmentcausestheslopeof
thelinetobecomesteeperandsteeper,thehigherthereturnofthemarketis.
Page26
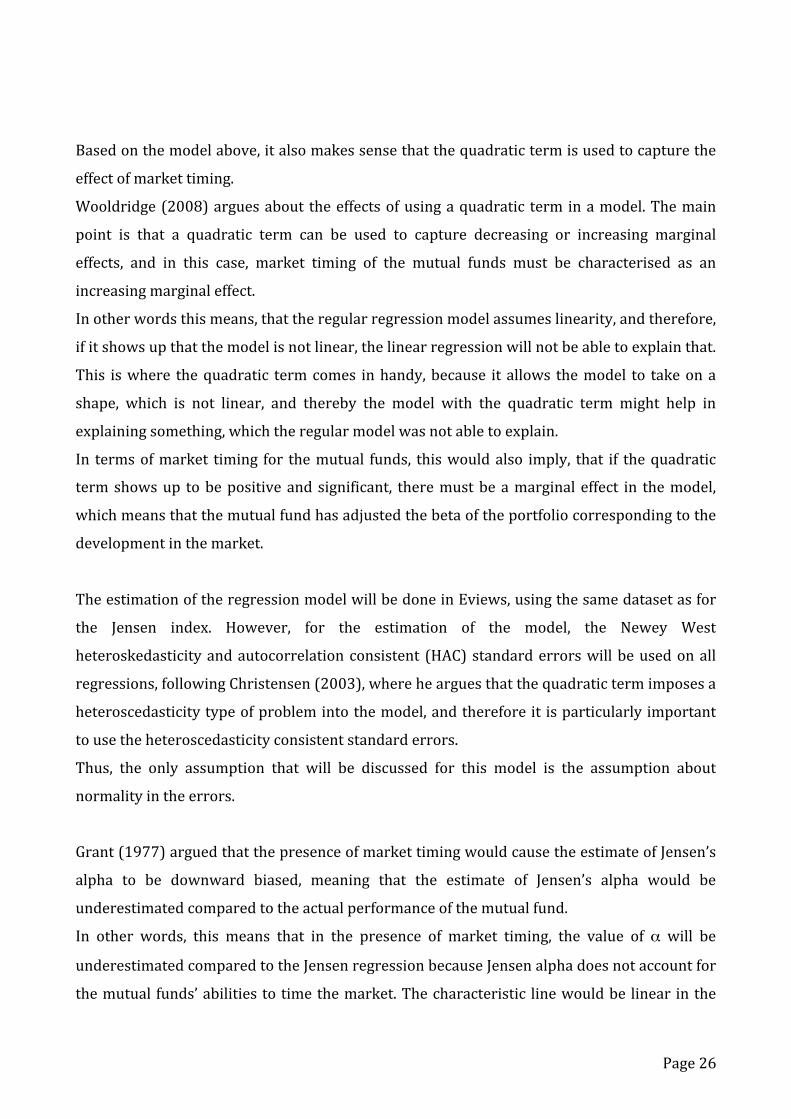
Basedonthemodelabove,italsomakessensethatthequadratictermisusedtocapturethe
effectofmarkettiming.
Wooldridge(2008)arguesabout theeffectsofusingaquadratic terminamodel.Themain
point is that a quadratic term can be used to capture decreasing or increasing marginal
effects, and in this case, market timing of the mutual funds must be characterised as an
increasingmarginaleffect.
Inotherwordsthismeans,thattheregularregressionmodelassumeslinearity,andtherefore,
ifitshowsupthatthemodelisnotlinear,thelinearregressionwillnotbeabletoexplainthat.
This iswhere thequadratic termcomes inhandy,because it allows themodel to takeona
shape, which is not linear, and thereby the model with the quadratic term might help in
explainingsomething,whichtheregularmodelwasnotabletoexplain.
In termsofmarket timing for themutual funds, thiswouldalso imply, that if thequadratic
termshowsup tobepositiveand significant, theremustbeamarginal effect in themodel,
whichmeansthatthemutualfundhasadjustedthebetaoftheportfoliocorrespondingtothe
developmentinthemarket.
TheestimationoftheregressionmodelwillbedoneinEviews,usingthesamedatasetasfor
the Jensen index. However, for the estimation of the model, the Newey West
heteroskedasticityandautocorrelationconsistent (HAC)standarderrorswillbeusedonall
regressions,followingChristensen(2003),wherehearguesthatthequadratictermimposesa
heteroscedasticitytypeofproblemintothemodel,andthereforeit isparticularlyimportant
tousetheheteroscedasticityconsistentstandarderrors.
Thus, the only assumption that will be discussed for this model is the assumption about
normalityintheerrors.
Grant(1977)arguedthatthepresenceofmarkettimingwouldcausetheestimateofJensen’s
alpha to be downward biased, meaning that the estimate of Jensen’s alpha would be
underestimatedcomparedtotheactualperformanceofthemutualfund.
In other words, this means that in the presence of market timing, the value of α will be
underestimatedcomparedtotheJensenregressionbecauseJensenalphadoesnotaccountfor
themutual funds’abilitiestotimethemarket.Thecharacteristic linewouldbe linear inthe
Page27
Jensenindex,whereasinthepresenceofmarkettimingitwouldbeconcavelyshapedinthe
TreynorandMazuyregression,therebypushingtheinterceptfurtherdowntheY‐axisinthe
TreynorandMazuyregressioncomparedtotheJensenindex.
Finally, itshouldbenoted,thatit is likelythattheestimateofαwillchangewhenincluding
the quadratic term in the model, independently of whether the quadratic term shows up
significantornot.Itshouldthereforebementioned,thataccordingtoregularregressionrules,
thequadratic termshouldbe removed fromthemodel, if it showsup insignificant, thereby
leavingbehindtheJensenregression.
Thereasonofthatis,thatifavariableshowsupinsignificant,itdoesnothaveanysignificant
effectonthemodel.Therefore, itwouldonlycausedisturbanceoftheothervariablesinthe
model,ifthequadratictermisleftinthemodel.
Page28
4.DataThechoiceofdataisofgreatimportancefortheanalysis.Ifwrongchoicesaremade,itisvery
likely that the analysis will be biased, and therefore the results and conclusions will be
misleading.Thus,thissectionwillcoverthethoughtsbehindthechoicesthathavebeenmade
whenchoosingthedatafortheanalysis.Inaddition,certainassumptionsarerequiredtobe
fulfilled in order for the results of the analysis to be valid. Therefore, this sectionwill also
coveratheoreticaldiscussionoftheassumptionsandhowtheywillbetestedintheanalysis.
4.1Choiceofmutualfunds
IthasbeendecidedthatthisanalysisshouldcoverDanishmutualfundsinvestinginstocksin
thefollowingthreeareas:
1. Danishstocks
2. Europeanstocks
3. Globalstocks
Thesethreeareasofinvestmenthavebeenchosen,sincetheyarethemostcommonareasof
investmentfortheDanishmutualfunds.Inotherwords,thesethreecategoriesaretheones
thatcangatherthelargestsamplesizes.
Whenselectingthespecificfundsfortheanalysis,certaincriteriahastobemet:
• Themutualfundshouldexistfortheentireperiodfrom2001‐2010
• Themutualfundshouldonlyinvestinstocks
• Themutualfundshouldfitintooneofthethreecategories(inordertodecide
upon that, the categorization made by IFR has been used, as well as
descriptionsonthehomepagesoftheindividualfunds).
Intotal,60mutualfundshavebeenabletomeettherequirementsforthisanalysis.Theyare
dividedintothethreecategoriesasfollows:
1. Danishstocks(16mutualfunds)
2. Europeanstocks(21mutualfunds)
3. Globalstocks(23mutualfunds)
Page29
Thereturnsof themutual fundsaredeterminedas logreturnsusingmonthlyobservations,
whichtotallyamountsto120observationsforeachfund.
4.2Choiceofbenchmarks
The purpose of a benchmark is to show the general development in specific area of
investment. A benchmark should therefore be an expression of “best practice”. In other
words,thismeansthatthebenchmarkyouchooseshouldbeconsistentwithyourinvestment
strategy.This is themost important criterion for choosingabenchmark,however thingsas
investmenthorizon,restrictions,etc.,shouldalsobetakenintoconsideration.Inotherwords,
thismeans that the perfect benchmark should perfectlymatch your investment criteria. In
realityit isoftendifficulttofindabenchmarkthatperfectlymatchesyourinvestmentonall
criteria.Therefore,apublicindexisoftenchosenasbenchmark,becauseitiseasytoaccess,
stilloneshould thoughkeep inmindthat thiswillonlybeanapproximation to theoptimal
benchmark(Christensen,2001)
Whenchoosingabenchmarktherearecertainpitfallsoneshouldbeawareof.
Firstofall,itisimportantthatyouhaveconsistencybetweenwhetherdividendsareincluded
in your calculations or not. The reason of that is that when calculating the returns of the
mutualfundsyoucorrectfordividend.Ifyouthenchooseabenchmarkwheredividendshave
been excluded, your investment portfolio will already have a head start of 2‐3%‐point
(Christensen,2001).
Somemutual fundsstill chooseabenchmarkwheredividendsarenot included.Thereason
fordoingsoisthatitbecomeseasierforthemutualfundtooutperformtheirbenchmark.One
shouldkeepinmind,thatwhencalculatingthereturnofthemutualfund,costsofrunningthe
mutualfundhasbeendeductedfromthereturn,andthereforeitisdifficultforamutualfund
tooutperformabenchmark,whichiscost less.Stilloneshouldbeawareofthefactthatthe
correctcomparisonistoincludedividendsinboththecalculationofthereturnofthefund,as
wellasforthereturnofthebenchmark(Christensen,2001).
Whencalculatingthereturnsofthemutualfundsforthisanalysis,correctionsfordividends
havebeenmade.Therefore,thebenchmarksfortheanalysisshouldincludedividendsaswell.

Page30
Therearedifferentsuppliersofthesebenchmarks,andoneofthemajoronesisMSCIBarra,
which is a company owned by Morgan Stanley. They supply many different relevant
benchmarks,whicharecommonlyusedamongtheDanishmutualfunds.However,beforeone
isabletochooseappropriatebenchmarks,oneshouldbefamiliarwiththemethodologyused
intheindexes.
4.2.1Indexmethodology
Inordertochoosethemostappropriatebenchmark,oneshouldbeawareofthemethodology
usedintheindexes.Therefore,thissectionwillgiveabriefdescriptionofthat.
TheNASDAQOMXgrouppublishesindexes,whicharerelevanttothisanalysis,andtherefore
abriefdescriptionoftheirmethodologywillbegivenhere.
Firstofall,theyhavethreedifferent“measurement”typesusedfortheindexes,whichcanbe
combinedinanyway.
Grossindex(GI):Asthenamesuggest,thisisagrossindex,andthereforedividendshavebeen
includedintheindex.Theindexassumesthatthedividendsarereinvestedthedayafterthey
havebeenpaidout.
Price index (PI): This index is a price index, and therefore the index does not include
dividends. The index only focuses on movements in the stock prices, and therefore the
differencebetweenthegrossindexandthepriceindexsimplyisattributabletothedividends.
Cappedindex(Cap):Acappedindexmeansthattheindexhasbeencorrected,sotheweightof
asinglestockhasanupperlimitintheindex.Incaseastockexceedsthemaximumweight,the
stockisweightedbythemaximumweight.
Toconcludeontheabovedescriptions,itisfirstofalldesiredthatdividendsareincludedin
thebenchmarks,basedonthepreviousdiscussion.Therefore,thechosenbenchmarkshould
beagrossindex(GI).Inadditionitisalsodesiredthattheindexiscapped,sothatnosingle
stockhastolargeaneffect.Thisisinaccordancewiththelegislationregardingtheinvestment
funds,whichrequiresthatasinglestockcannotwaymorethan5%intheportfolio.Therefore,
acappedindexismorelikelytoshow“bestpractice”.
Page31
Themainconclusionisthereforethatthechosenbenchmarksshouldbeacappedgrossindex.
Onefinalthingthatwouldbedesirableisthattheindexisadjustedforfreeflow.Afreeflow
adjustment means that index has been corrected, so that only the share capital, which is
availableonthemarket,isincludedintheindex.
4.2.2BenchmarkfortheJensenindex
This section will cover a discussion of why certain benchmarks have been chosen. When
choosingthebenchmarkforthemutualfundsinvestinginDanishstocks,severalothergood
alternativesexist.Therefore, adiscussionof thealternativebenchmarkwill be included for
theDanishstocks.However, fortheotherinvestmentcategoriesthemaindiscussionwillbe
regardingthebenchmark,whichhasbeenchosen.
The discussion of the benchmarks will be based upon what the different funds use as
benchmarks.Appendix4showsanoverviewofthebenchmarksusedbythedifferentmutual
funds.
Thedescriptionof thedifferent indexes isbasedonexplanationsfoundonthehomepageof
thesuppliersoftherespectiveindexes.
Danishstocks
Choice:
OMXCopenhagenCap_GI
This index is a total index, which includes all of the stocks that are registered on the
Copenhagen Stock Exchange, and therefore the purpose of the index is to show the actual
conditionaswellaschangesofthemarket.Theindexisbothagrossindexaswellasacapped
indexhowever it hasnot been adjusted for free flow.Despite this fact, this indexhasbeen
chosenasbestpracticefollowingthediscussionofthealternativesbelow.
ThedatafortheindexhasbeencollectedfromCopenhagenStockExchange,andthereforethe
indexismeasuredinDKK.
Alternatives:
OMXCopenhagen20
This index includes the 20 most traded stocks on the Copenhagen Stock Exchange. The
advantage of this index is that the stocks that are included are the most liquid stocks.
Page32
However,itonlyincludes20differentstocks(TheOMXC20stocks),andthereforeithasbeen
concluded that this is not enough to cover the possible investments made by the mutual
funds.Inaddition,theindexisapriceindex,meaningthatdividendshavenotbeenincluded
intheindex.Finally,theindexisneithercapped,meaningthatcompanieslikeNovoNordisk
andA.P.MøllerMærskwillhavealargeweightintheindex.Basedonthis,theindexhasbeen
foundinappropriatefortheanalysis.
OMXCopenhagenBenchmarkCap_GI
This index includes between 50 and 80 of the largest and most frequently traded stocks
representingmost of the different sectors on theDanish stockmarket. The index is both a
cappedindexaswellasagrossindex,andinadditionithasalsobeenadjustedforfreeflow.
Therefore, this would be themost appropriate benchmark to use for the analysis, since it
fulfilsalltherequirementspreviouslystated.However,itonlydatesbacktoOctober242005,
andthereforeitcannotbeusedforthisanalysis.Finally,itshouldbenoted,thatmanyofthe
mutualfundsincludedintheanalysisusesthisindexasbenchmarkontheirportfolios.
MSCIDenmark
ThefinalalternativecouldbetousetheMSCIDenmarkindex.Theadvantageofthisindexis
thatitcanbechosenasbothcapped,grossindexandfreeflowadjusted.Therefore,theindex
couldfulfiltherequirements,whichwerepreviouslystatedforthebenchmarks.However,the
disadvantageisthattheindexismeasureinUSD,sothereforeitshouldbetransformedinto
DKKusing the correspondingexchange rates foreachof theobservations in thedataset. In
addition,noneofthechosenmutualfundsusethisindexasabenchmark,whereasthechosen
oneshowsupasmuchmorefrequent.
However, this index is probably the best possible alternative to the chosen index, and
thereforeitisalsoverylikelythattheywillhavepositivecorrelationscloseto1.
Europeanstocks
Again,therearedifferentbenchmarkstochooseamongforthisinvestmentcategory,however
themain concern for this analysis is theMSCIBarra indexes.Here thereare three relevant
onestochoosebetween.
Page33
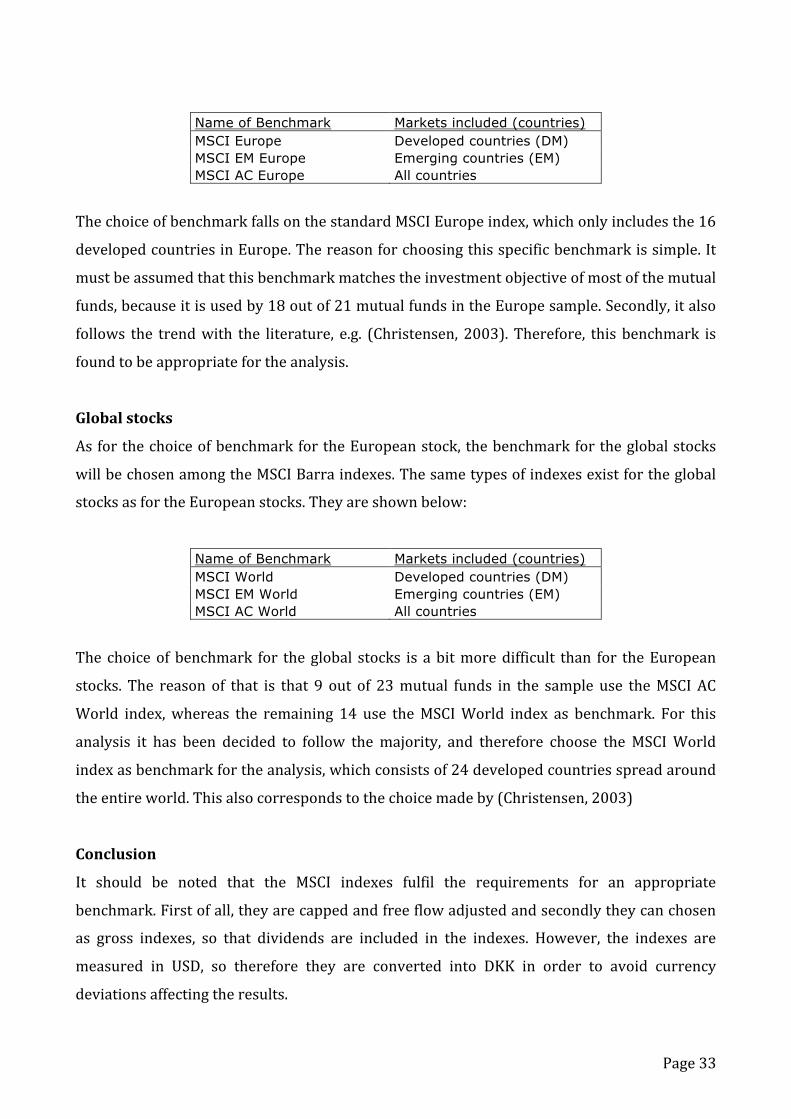
Name of Benchmark Markets included (countries) MSCI Europe Developed countries (DM) MSCI EM Europe Emerging countries (EM) MSCI AC Europe All countries
ThechoiceofbenchmarkfallsonthestandardMSCIEuropeindex,whichonlyincludesthe16
developedcountriesinEurope.Thereasonforchoosingthisspecificbenchmarkissimple.It
mustbeassumedthatthisbenchmarkmatchestheinvestmentobjectiveofmostofthemutual
funds,becauseitisusedby18outof21mutualfundsintheEuropesample.Secondly,italso
follows the trendwith the literature, e.g. (Christensen, 2003).Therefore, this benchmark is
foundtobeappropriatefortheanalysis.
Globalstocks
AsforthechoiceofbenchmarkfortheEuropeanstock,thebenchmarkfortheglobalstocks
willbechosenamongtheMSCIBarraindexes.Thesametypesofindexesexistfortheglobal
stocksasfortheEuropeanstocks.Theyareshownbelow:
Name of Benchmark Markets included (countries) MSCI World Developed countries (DM) MSCI EM World Emerging countries (EM) MSCI AC World All countries
The choiceofbenchmark for theglobal stocks is abitmoredifficult than for theEuropean
stocks. The reason of that is that 9 out of 23mutual funds in the sample use theMSCIAC
World index,whereas the remaining 14 use theMSCIWorld index as benchmark. For this
analysis it has been decided to follow themajority, and therefore choose the MSCIWorld
indexasbenchmarkfortheanalysis,whichconsistsof24developedcountriesspreadaround
theentireworld.Thisalsocorrespondstothechoicemadeby(Christensen,2003)
Conclusion
It should be noted that the MSCI indexes fulfil the requirements for an appropriate
benchmark.Firstofall,theyarecappedandfreeflowadjustedandsecondlytheycanchosen
as gross indexes, so that dividends are included in the indexes. However, the indexes are
measured in USD, so therefore they are converted into DKK in order to avoid currency
deviationsaffectingtheresults.
Page34
TheMSCI indexesareobtained fromMSCIBarra,andthechosen indexesaregross indexes,
followingthediscussionfromprevious.
Onefinalthingtonoteisthatthesamebenchmarkhasbeenchosenforallthemutualfundsin
eachcategory.However, itcanbeabitmisleading,sincesomemutual fundsholdportfolios
only investing in small cap stocks. Therefore, it could be discussed that it would bemore
appropriatetouseabenchmarkthattakesthisintoaccountforthesespecificfunds.Though,
the purpose of the analysis is to divide the mutual funds into these three investment
categories,andseeifanyofthemareabletooutperformthepassivebenchmarks.However,if
mutual funds show up to have significant Jensen’s index, an evaluation about appropriate
benchmarkwillbedone,inordertoavoidmakingthesamemistakeasIppolito(1989).
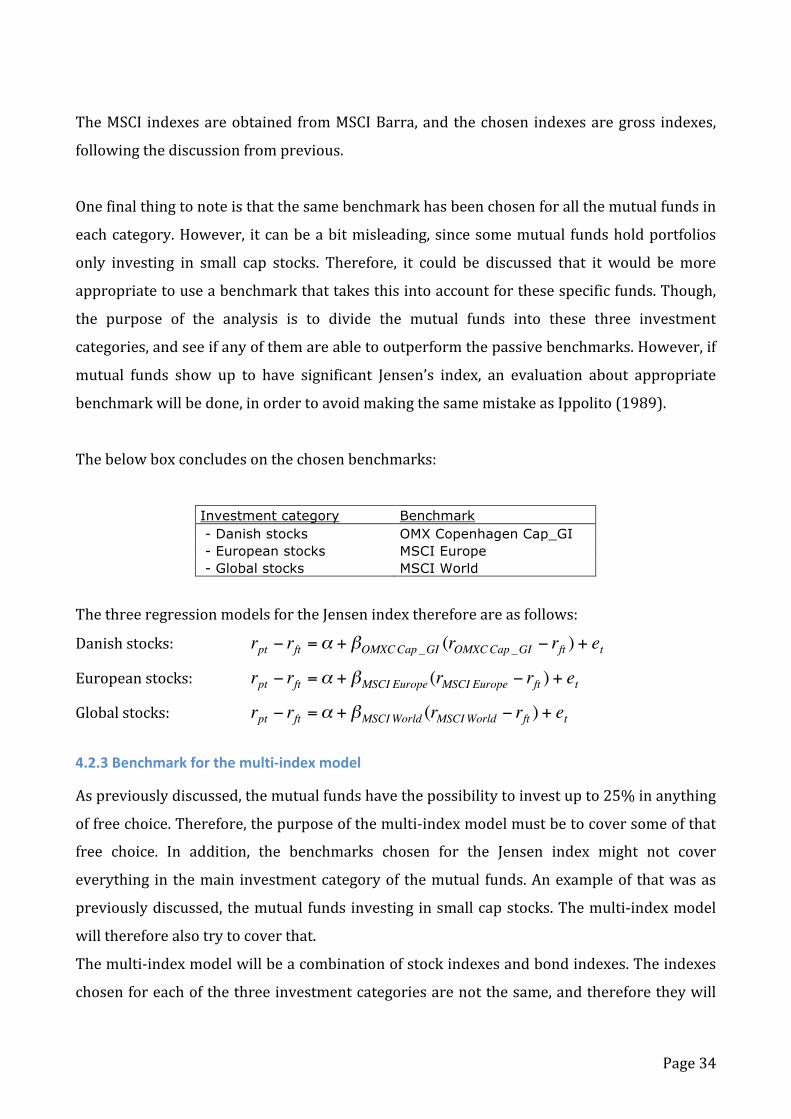
Thebelowboxconcludesonthechosenbenchmarks:
Investment category Benchmark - Danish stocks OMX Copenhagen Cap_GI - European stocks MSCI Europe - Global stocks MSCI World
ThethreeregressionmodelsfortheJensenindexthereforeareasfollows:
Danishstocks:
€
rpt − rft =α + βOMXCCap _GI (rOMXCCap _GI − rft ) + et
Europeanstocks:
€
rpt − rft =α + βMSCI Europe (rMSCI Europe − rft ) + et
Globalstocks:
€
rpt − rft =α + βMSCIWorld (rMSCIWorld − rft ) + et
4.2.3Benchmarkforthemulti‐indexmodel
Aspreviouslydiscussed,themutualfundshavethepossibilitytoinvestupto25%inanything
offreechoice.Therefore,thepurposeofthemulti‐indexmodelmustbetocoversomeofthat
free choice. In addition, the benchmarks chosen for the Jensen index might not cover
everything in themain investmentcategoryof themutual funds.Anexampleof thatwasas
previouslydiscussed,themutualfundsinvestinginsmallcapstocks.Themulti‐indexmodel
willthereforealsotrytocoverthat.
Themulti‐indexmodelwillbeacombinationofstockindexesandbondindexes.Theindexes
chosenforeachofthethreeinvestmentcategoriesarenotthesame,andthereforetheywill
Page35
bediscussedindividually.However,thebondindexeswillbethesameforallthreeinvestment
categories.
Thebondindexesareasfollow:
• J.PMorganDenmarkGovernmentBondIndex(JPMGBIDenmark)
• J.P.MorganGlobalBroadex.Denmarkindex(JPMGBIGlobal)
ThedataforthosetwoindexesareobtainedthroughDatastream.
The choice of bond indices follows Christensen (2003). He concludes that the EFFAS bond
indexes could just as well be chosen, however it has been decided to use the J.P: Morgan
indexesinthisthesisaswell.
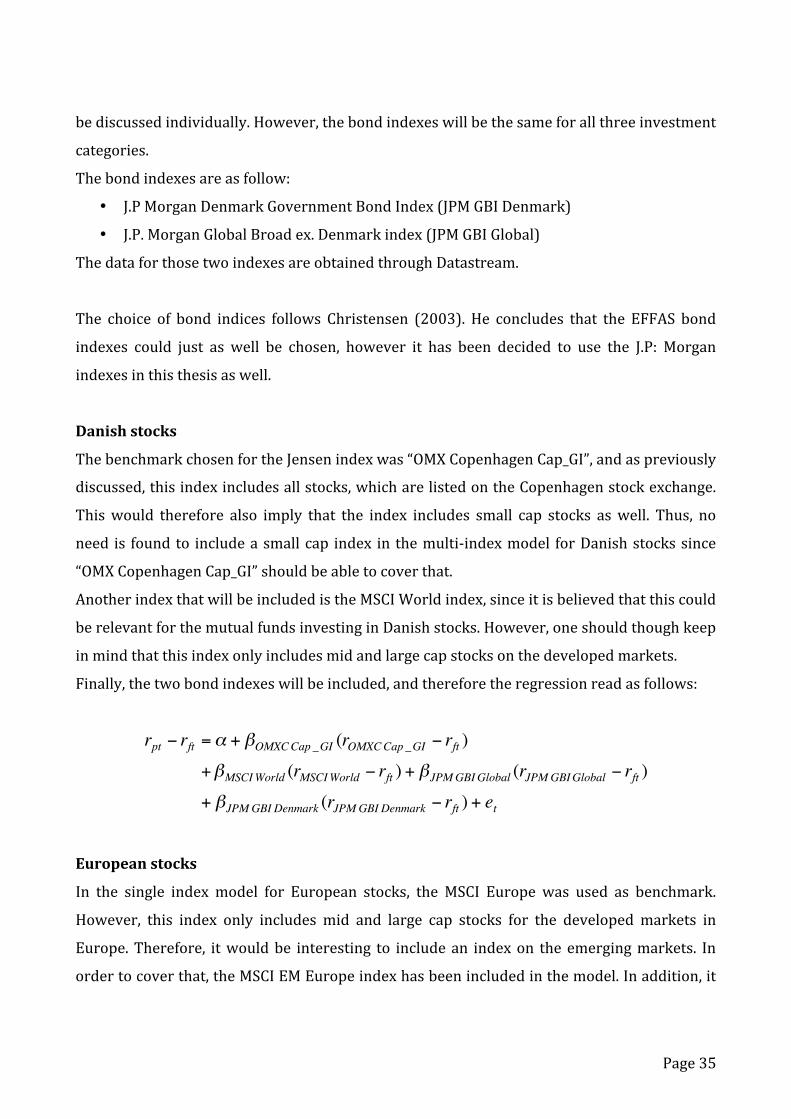
Danishstocks
ThebenchmarkchosenfortheJensenindexwas“OMXCopenhagenCap_GI”,andaspreviously
discussed,thisindexincludesallstocks,whicharelistedontheCopenhagenstockexchange.
Thiswould therefore also imply that the index includes small cap stocks aswell. Thus, no
need is foundto includeasmallcap index in themulti‐indexmodel forDanishstockssince
“OMXCopenhagenCap_GI”shouldbeabletocoverthat.
AnotherindexthatwillbeincludedistheMSCIWorldindex,sinceitisbelievedthatthiscould
berelevantforthemutualfundsinvestinginDanishstocks.However,oneshouldthoughkeep
inmindthatthisindexonlyincludesmidandlargecapstocksonthedevelopedmarkets.
Finally,thetwobondindexeswillbeincluded,andthereforetheregressionreadasfollows:
€
rpt − rft =α + βOMXCCap _GI (rOMXCCap _GI − rft )+βMSCIWorld (rMSCIWorld − rft ) + βJPMGBIGlobal (rJPM GBIGlobal − rft )+ βJPM GBI Denmark (rJPM GBI Denmark − rft ) + et
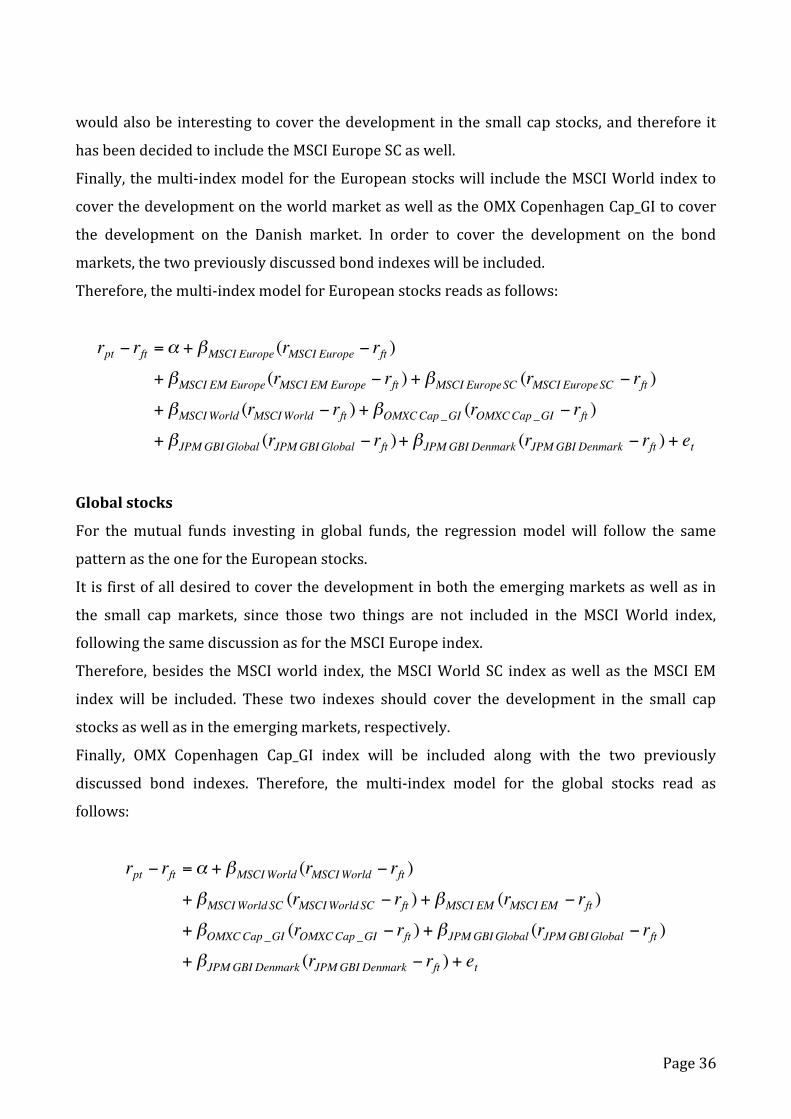
Europeanstocks
In the single index model for European stocks, the MSCI Europe was used as benchmark.
However, this index only includes mid and large cap stocks for the developed markets in
Europe.Therefore, itwouldbe interesting to includean indexon theemergingmarkets. In
ordertocoverthat,theMSCIEMEuropeindexhasbeenincludedinthemodel.Inaddition,it
Page36
wouldalsobeinterestingtocoverthedevelopmentinthesmallcapstocks,andthereforeit
hasbeendecidedtoincludetheMSCIEuropeSCaswell.
Finally,themulti‐indexmodelfortheEuropeanstockswill includetheMSCIWorldindexto
coverthedevelopmentontheworldmarketaswellastheOMXCopenhagenCap_GItocover
the development on the Danish market. In order to cover the development on the bond
markets,thetwopreviouslydiscussedbondindexeswillbeincluded.
Therefore,themulti‐indexmodelforEuropeanstocksreadsasfollows:
€
rpt − rft =α + βMSCI Europe (rMSCI Europe − rft )+ βMSCI EM Europe (rMSCI EM Europe − rft ) + βMSCI EuropeSC (rMSCI EuropeSC − rft )+ βMSCIWorld (rMSCIWorld − rft ) + βOMXCCap _GI (rOMXCCap _GI − rft )+ βJPM GBIGlobal (rJPMGBIGlobal − rft )+ βJPM GBI Denmark (rJPM GBI Denmark − rft ) + et
Globalstocks
For themutual funds investing in global funds, the regressionmodel will follow the same
patternastheonefortheEuropeanstocks.
It isfirstofalldesiredtocoverthedevelopmentinboththeemergingmarketsaswellasin
the small cap markets, since those two things are not included in the MSCI World index,
followingthesamediscussionasfortheMSCIEuropeindex.
Therefore,besides theMSCIworld index, theMSCIWorldSC indexaswell as theMSCIEM
index will be included. These two indexes should cover the development in the small cap
stocksaswellasintheemergingmarkets,respectively.
Finally, OMX Copenhagen Cap_GI index will be included along with the two previously
discussed bond indexes. Therefore, the multi‐index model for the global stocks read as
follows:
€
rpt − rft =α + βMSCIWorld (rMSCIWorld − rft )+ βMSCIWorld SC (rMSCIWorld SC − rft ) + βMSCI EM (rMSCI EM − rft )+ βOMXCCap _GI (rOMXCCap _GI − rft ) + βJPMGBIGlobal (rJPM GBIGlobal − rft )+ βJPM GBI Denmark (rJPM GBI Denmark − rft ) + et
Page37
4.3Choiceofriskfreerate
Therisk freerateshouldrepresent the interest ratean investorcouldobtain in themarket
withouttakinganyriskatall.Intheliteraturedifferentproxiesoftheriskfreerateareused,
suchas“1‐monthT‐bill”,“1‐monthCIBOR”,etc.
This analysis will follow the analysis by Christensen (2003),where he uses the 1‐month
CIBORasaproxyfortheriskfreerate.
The CIBOR (Copenhagen Interbank Offered Rate) is the interest rate, which the Danish
NationalBankdeterminesonadailybasis,basedonreportsfromseveralDanishbanks.
In practical terms, the CIBOR rate is the reference interest rate, which is used for lending
moneyontheinterbankmarket.TheCIBORratesdifferdependentontheperiod,whichgoes
fromoneweekupto12months.
Another argument for using the1‐monthCIBOR rate is, that it is a good representative for
whatthemutualfundscouldhaveearnedontheinterbankmarketinthespecificmonthofan
investment. It shouldalsobenoted, that it isveryunlikely thatother reasonablechoicesof
proxyfortheriskfreeratewouldchangetheconclusionsoftheanalysis.Thereasonofthatis,
thattheriskfreerateisdeductedfromboththereturnofthemutualfunds,aswellasfrom
thereturnofthebenchmark.
Thedataforthe1‐monthCIBORhasbeenobtainedfromthehomepageoftheDanishNational
Bank.Theinterestratesaremeasuredonanannualbasis,andthereforethefollowingformula
hasbeenusedinordertoobtaincontinuousinterestrates:
Monthlyinterestrate=
€
(1+ annual int erest rate)1/12 −1
4.4Survivorshipbias
Survivorshipbiasisdefinedasthebiasthatoccursinyourdatasetifnon‐survivingfundsare
systematicallyignoredintheperformanceanalysis.Theresultofthatwilloftenbethatyour
analysiswouldsignificantlyoverstatethereturns,simplybecausethattheworstperforming
funds(andthereforenon‐surviving)areleftoutoftheanalysis(Christensen,2005)
Eltonet al. (1996) argues that thedisappearanceofmutual fundsoccur eitherdue topoor
performanceorduetoasufficientlysmallmarketvalueofthefund.Inaddition,theyconclude
that lowmarketvaluesareoftencausedbypoorperformance. Theyfurtherarguethat it is
Page38
rarethatfundstotallydisappear,butinsteadtheyareoftenmergedintofundsthatoftenfall
intothesamefamilyoffundsandhaveperformedbetter.Theadvantageforthemutualfunds
ofdoingsois,thattheycontinuetoearnfeesontheinvestmentintheoriginalfund,whilethe
recordofthefund’spoorperformancebecomesdifficulttotrack.
Malkiel (1995) furtheradds to thediscussionofsurvivorshipbias thatmutual funds,which
acceptveryhighriskhaveveryhighprobabilitiesoffailureaswell.Therefore,survivingfunds
doingsoarecomparedtotakingalargebetandhavingwon.Thisclearlyshows,thatifonly
survivingfundsareincluded,thentheywillpositivelybiastheaveragereturnofthemutual
funds.
Asimplified,yetextremeexamplecouldbe10mutual fundsthatallhave invested inhighly
risky securities in a specific area over a 10‐year period. One of these funds has earned a
returnof200%overtheperiod,whereastheother9fundshavenotsurvivedtheperioddue
to poor performance. If a performance analysis was carried out at the end of the 10‐year
period, only including the surviving funds, then the conclusion would be that the average
return within this specific area of investment had been 20%. However, this result is very
misleading,sincetheother9fundsearningnegativereturnwherenotincludedduetolackof
datafortheentireperiod.Theactualaveragereturnwithinthisareaofinvestmentislikelyto
behighlynegative.Thisistheessenceofsurvivorshipbias.
Malkiel (1995) also analysed the effect of survivorship bias. The conclusion was, that the
largertheperiodofanalysis,thelargertheeffectofsurvivorshipbiaswouldbe.Theanalysis
showed that over a 10‐year period, the average annual return of only surviving fundswas
1,5%‐points higher than the average annual return for all funds including non‐surviving
funds.Theanalysiswasalsoconductedona15‐yearperiod,andtheresultswereevenmore
surprising here. The results were that the average annual return of surviving funds was
18,7%, while it was only 14,5% including the non‐surviving funds. This amounts to a
differenceof4,2%‐points,whichmustbeconsideredquitealot.
However, most of the analyses regarding survivorship bias has been conducted on the
Americanmarket.IntheanalysisbyChristensen(2005),heconcludesthattheDanishmutual
fundsarealmostfreeofsurvivorshipbias,becausenofundshavedefaultedduringhisperiod
Page39
ofanalysis.Itshouldthoughbenoted,thattheperiodofhisanalysiswas1996‐2003,whereas
theperiodofthisthesisis2001‐2010.
Itshouldfinallybenoted,thatthisthesisonlydealswithfundsthathaveexistedfortheentire
periodofanalysis.Therefore,fundsthathavedefaultedormergedintheperiodarenottaken
into consideration. In other words, survivorship bias is ignored, and therefore one should
keepthatinmind,wheninterpretingtheresultsoftheanalysis.
4.5Assumptionsforthetests
Thedataused for theanalysis isclassifiedas timeseriesdata, since theanalysisdealswith
observationsovertime.Timeseriesdataisoftenmoredifficulttoanalysethanregularcross‐
sectionaldata, as it is rare that timeseriesdata is independentacross time.Therefore,one
shouldstronglyconsideranddiscusstheassumptionsrequiredforthetesttobevalidbefore
onedraws conclusionsupon them. In case the assumptions arenot fulfilled, one shouldbe
carefullywheninterpretingtheresults.Ifassumptionsshowupnottobefulfilled,comments
willbemadeintheanalysis.
The discussion of assumptions for time series regression will follow the Gauss‐Markov
assumptionsfromWooldridge(2008).
1.Linearinparameters
The assumption states that there should be a linear relationship between the dependent
variable and the independent variables in the model. Eviews will therefore estimate the
modelasifitwaslinear,whetherornotthisisactuallythecaseornot.However,aspreviously
discussed,researchuponCAPMhasshownthat itseemsas if therelationshipbetweenpast
return and beta is linear. This analysiswill also estimate beta based on past returns, and
thereforeitisexpectedthattherelationshipwillbelinearinthiscaseaswell.Inaddition,the
performance measurements used in this analysis are built upon CAPM, which requires
linearity.Therefore,itisassumedthatthisassumptionisfulfilled.
2.Noperfectcollinearity
This assumption states that none of the independent variables can be constant or a linear
combination of the others. If two independent variables show up to be a perfect linear
Page40
combinationofeachother,itissaidthattheyareperfectlycorrelatedwitheachother.Thisis
aproblem,becauseonecannotestimateamodel,whichhasperfectlycorrelatedvariables.If
onefacestheproblemofperfectcollinearity,oneshouldeitherreformulatetheentiremodel,
orleaveoneofthevariablesoutofthemodel.
Itisimportanttokeepinmindthattheassumptionallowsforhighcorrelationsbetweenthe
variables,howevertheyarejustnotallowedtobeperfectlycorrelated.
Intermsofthisanalysis, itmustbeexpectedthatindependentvariables(benchmarks)have
ratherhighcorrelations,astheytosomeextentsufferfromthesamesystematicrisk.Stillitis
notexpectedthatanyofthemsufferfromperfectcollinearity.
Thereisnoreasontotestforthisassumption,asEviewscannotestimateregressions,which
sufferfromperfectcollinearity.Inotherwords,Eviewsautomaticallydoesthetestforyou.If
opposedtoallexpectations,somemodelsshowuptobesufferfromperfectcollinearity,the
modelwillbereformulated,andcommentsregardingthatwillbemade.
3.Zeroconditionalmean
Thisassumptionrequiresthattheexpectedvalueoftheerrortermiszerogivenanyperiodof
theexplanatoryvariable.
Instatisticalterms,theassumptionrequiresthatE(u)=0.Iftheerrortermisindependentof
theobservationsoftheexplanatoryvariablesinthemodel,thisassumptionwillhold.
Tobemorespecific,theassumptiondoesnotputanyrestrictiononthecorrelationbetween
theindependentvariablesinthemodelorintheerrortermacrosstime.Theassumptiononly
states, that the average value of the error term should be unrelated to the independent
variablesinalltimeperiods.
The two most common causes of breaches of this assumption are omitted variables and
measurementerrorsinsomeoftheregressors.
Thisassumption ismuchrelated to the lastassumptionaboutnormality, so the test for the
assumptionwillberelatedtothat.
4.Homoskedasticity
The assumption abouthomoskedasticity requires that the varianceof the error term is the
sameforallvaluesintheperiod.Ifhomoskedasticityisnotpresent,itissaidthatthemodel
suffers for heteroskadasticity. A more graphical illustration would show that if
Page41
heteroskadasticity is present in themodel, a scatterplot with the residuals (errors) would
showa funnel shapecompared to theactual regression line.The funnel shapewouldcause
thatthevarianceiseitherincreasedordecreasedovertime,whichisaproblemforthemodel.
Theassumptionabouthomoskedasticityplaysnoroleinshowingthatthemodelisunbiased,
howevertheassumptionisstillimportant.Ifamodelsuffersfromheteroskadasticityitisvery
likelythattheestimatesofthestandarderrorsarewrong.Thisisofgreatimportanceforthe
conclusionof themodel, as the standarderrorsareused in the calculationsofwhether the
variablesinthemodelaresignificantornot.
Thetestonbetacoefficientslooksasfollows:
€
H 0 :β = 0H1 :β ≠ 0
€
ˆ β x − β x 0
se( ˆ β x )Tn−k−1
The illustration above shows that the standard error of the beta coefficient is used in
calculatingtheteststatisticinthetestonthesignificanceofthebetacoefficient.Aspreviously
discussed,ifheteroskedasticityispresent,theestimateofthestandarderrorsareunreliable,
andtherefore thesignificanceof thecoefficientswillbeunreliableaswell.This isofcrucial
importance for the assignment, since it is the significance of the beta coefficients, which
determineswhetherthefundshaveperformedneutrallyornot.
The assumption about homoskedasticity will therefore be dealt with carefully in the
assignment.
Thespecifichypothesiswhicharetestedlooksasfollows:
H0:Var(ux)=σ2(Homoskedasticity)
H1:Var(ux)≠σ2(Heteroskadasticity)
Therearevariousteststhatcanbeusedtotestthehypothesis,howeverthemostcommonly
usedare theBreusch‐Pagan test and theWhite test.The two tests are rather similar, since
theybothusethesquaredresidualsasdependentvariablesinaregressionmodel,wherethey
try to determine whether these can be explained using different forms of the original
independent variables. It does notmattermuch,which one is used, since they should both
Page42
yield the same result. Therefore this analysis will use the Breusch‐Pagan test to test for
variancehomogeneity.
Theevaluationofthehypothesiswillsolelybebasedonthep‐valuefromtheBreusch‐pagan
test.Asignificancelevelof5%ischosen,andifthep‐valueisbelow5%,thenull‐hypothesisis
rejected,meaningthatheteroskedasticityispresent.
Ifheteroskedasticityshowsuptobepresentinthemodel,oneshouldcorrectforthatbyusing
White’sheteroskedasticity‐robuststandarderrors.
5.Noserialcorrelation
Thisassumptionstatesthattheerrorsshouldbeuncorrelatedinthetimeseriesregression.In
statisticaltermsthemodelstatesthat:Corr(ut,usX)=0,forallt≠s.
Inordertotestwhetherthisassumptionholds,thefollowinghypothesisshouldbetested:
H0:Noserialcorrelation
H1:Serialcorrelation(autocorrelation)
If the null hypothesis is rejected, the model is said to suffer from serial correlation or
autocorrelation,whichmeansthattheerrorsarecorrelatedovertime.
There are several tests to choose between in order to test for serial correlation. Themost
commonly used are the Durbin‐Watson test and the Breusch‐Godfrey test. However, the
DurbinWatson test is primarily used to test for first order serial correlation,whereas the
Breusch‐Godfrey test is used to test for higher order serial correlation. In terms of this
analysis, it isdesired to test for12thorder serial correlation.Thereasonof that is that this
thesisisworkingwithmonthlyobservations,andthereforeitwouldbeappropriatetotestfor
12thorderserialcorrelationinordertoavoidanyseasonality.Thus,inordertotestforserial
correlation, the Breusch‐Godfrey test for serial correlation is used, which is a Lagrange
multipliertestforserialcorrelation.
TheBreusch‐Godfreytestworksbymakinganauxiliaryregressionusingtheresiduals from
theoriginalregressionregressedonasetoflaggedresidualsaswellasthevariablesusedin
theoriginalmodel.What thetestdoes, is that it testswhether thecoefficientsof the lagged
regressionintheauxiliaryregressionareallequaltozero.Thetestwillgiveaχ2‐teststatistic.
If the p‐value of that test statistic is below the significance level of 5%, then the null
Page43
hypothesis is rejected, meaning that the model suffers from serial correlation. In case the
model suffers from serial correlation, this should be corrected by using the Newey West
heteroskedasticityandautocorrelationconsistent(HAC)standarderrors.
The consequences of serial correlation are that the estimates of the standard errorwill be
unreliable, which again causes the significance of the coefficient to be unreliable as well,
following the discussion fromprevious. In addition, it is said that in the presence of serial
correlation,OLSisnolongerBLUE(bestlinearunbiasedestimator).
Ithasshownthatpositiveserialcorrelationcausesthestandarderrorstobeunderestimated
thereby causing the t‐statistic to be biased upwards. In other words this means, that if
positiveserialcorrelation ispresent, it ismore likelythatthecoefficientwillshowuptobe
significantduetoahighert‐statistic.Positiveserialcorrelationwillalsocausethevarianceof
theerrortermtobeunderestimated,therebyexaggeratingR2.
Again,theabovediscussionshowswhyitisimportanttotakethisassumptionundercareful
consideration.
6.Normality
ThefinalassumptionisthattheerrorsareindependentofXandthattheyareindependently
andidenticallydistributed.Instatisticaltermsitwouldlooklikethis:X∼normaldistribution
(0,σ2),meaningthatitisrequiredthattheerrorsshouldfollowanormaldistributionwitha
meanof0andavarianceofσ2.
Thislastassumptionissaidtobethestrongestofthesix.Somearguethatbecausetheerroris
thesumofmanydifferentthingsaffectingthedependentvariable, theargumentationofthe
centrallimittheoremcanbeused,whichstatesthatifthesamplesizeissufficientlylarge,it
canbeassumedthatthevariableinquestionisapproximatelynormallydistributed.
Inordertotestfornormalityoftheerrors,theJarque‐Beratestfornormalitywillbeused.
Thehypothesiswhicharebeingtestedare:
H0:Theerrorsarenormallydistributed
H1:Theerrorsarenotnormallydistributed.
Again,ifthep‐valueoftheteststatisticisbelow5%,thenthenullhypothesisisrejected.

Page44
The consequences of non‐normality are that the errors terms will be either left or right
skewed, and thereby it is like that the results are affected by extreme values. This would
thereforealsocausethatoneshouldbecarefulwheninterpretingtheresults if itshowsup,
thattheerrorsarenotnormallydistributed.
Ifitshowsupthatvariableshaveerrorsthatarenotnormallydistributed,onewaytocorrect
foritistouselogarithmicfunctiononsomeoftheindependentvariables.Thiswouldnarrow
inthetailsofthedistribution,sothatitbecomesclosertothenormaldistribution.Howeverin
termsofthisanalysis,nocorrectionwillbemade,howevercommentswillbemadeinstead.
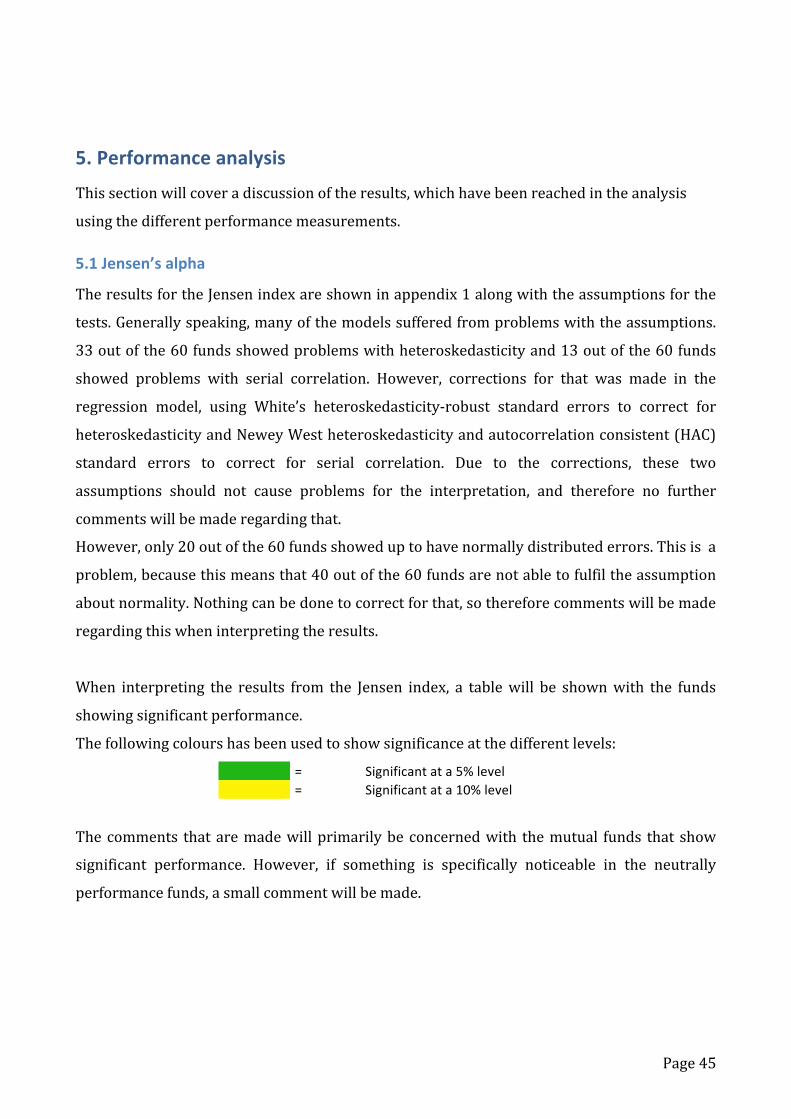
Page45
5.Performanceanalysis
Thissectionwillcoveradiscussionoftheresults,whichhavebeenreachedintheanalysis
usingthedifferentperformancemeasurements.
5.1Jensen’salpha
TheresultsfortheJensenindexareshowninappendix1alongwiththeassumptionsforthe
tests.Generallyspeaking,manyofthemodelssufferedfromproblemswiththeassumptions.
33outofthe60fundsshowedproblemswithheteroskedasticityand13outofthe60funds
showed problems with serial correlation. However, corrections for that was made in the
regression model, using White’s heteroskedasticity‐robust standard errors to correct for
heteroskedasticityandNeweyWestheteroskedasticityandautocorrelationconsistent(HAC)
standard errors to correct for serial correlation. Due to the corrections, these two
assumptions should not cause problems for the interpretation, and therefore no further
commentswillbemaderegardingthat.
However,only20outofthe60fundsshoweduptohavenormallydistributederrors.Thisisa
problem,becausethismeansthat40outofthe60fundsarenotabletofulfiltheassumption
aboutnormality.Nothingcanbedonetocorrectforthat,sothereforecommentswillbemade
regardingthiswheninterpretingtheresults.
When interpreting the results from the Jensen index, a tablewill be shownwith the funds
showingsignificantperformance.
Thefollowingcolourshasbeenusedtoshowsignificanceatthedifferentlevels:
= Significantata5%level = Significantata10%level
Thecomments thataremadewillprimarilybeconcernedwith themutual funds that show
significant performance. However, if something is specifically noticeable in the neutrally
performancefunds,asmallcommentwillbemade.
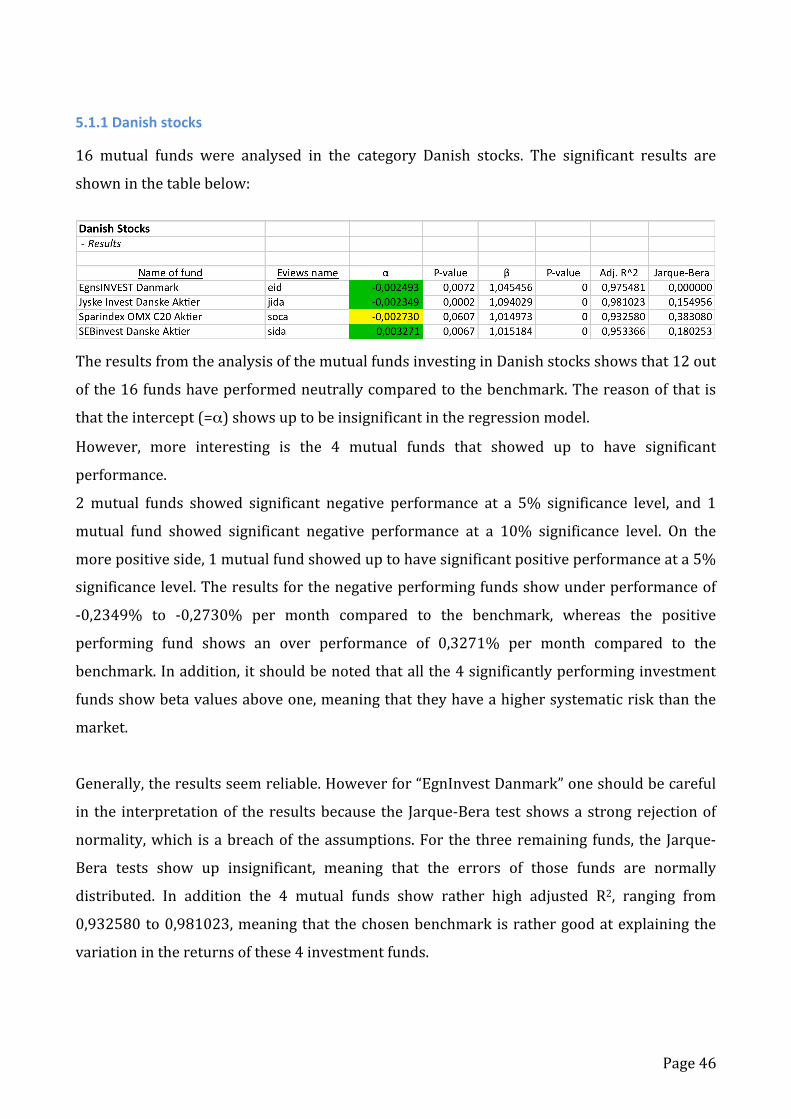
Page46
5.1.1Danishstocks
16 mutual funds were analysed in the category Danish stocks. The significant results are
showninthetablebelow:
TheresultsfromtheanalysisofthemutualfundsinvestinginDanishstocksshowsthat12out
ofthe16fundshaveperformedneutrallycomparedtothebenchmark.Thereasonofthatis
thattheintercept(=α)showsuptobeinsignificantintheregressionmodel.
However, more interesting is the 4 mutual funds that showed up to have significant
performance.
2mutual funds showed significant negative performance at a 5% significance level, and 1
mutual fund showed significant negative performance at a 10% significance level. On the
morepositiveside,1mutualfundshoweduptohavesignificantpositiveperformanceata5%
significancelevel.Theresultsforthenegativeperformingfundsshowunderperformanceof
‐0,2349% to ‐0,2730% per month compared to the benchmark, whereas the positive
performing fund shows an over performance of 0,3271% per month compared to the
benchmark.Inaddition,itshouldbenotedthatallthe4significantlyperforminginvestment
fundsshowbetavaluesaboveone,meaningthattheyhaveahighersystematicriskthanthe
market.
Generally,theresultsseemreliable.Howeverfor“EgnInvestDanmark”oneshouldbecareful
in the interpretationof theresultsbecause the Jarque‐Bera testshowsastrongrejectionof
normality,which isabreachof theassumptions.For the threeremaining funds, the Jarque‐
Bera tests show up insignificant, meaning that the errors of those funds are normally
distributed. In addition the 4 mutual funds show rather high adjusted R2, ranging from
0,932580to0,981023,meaningthatthechosenbenchmarkisrathergoodatexplainingthe
variationinthereturnsofthese4investmentfunds.
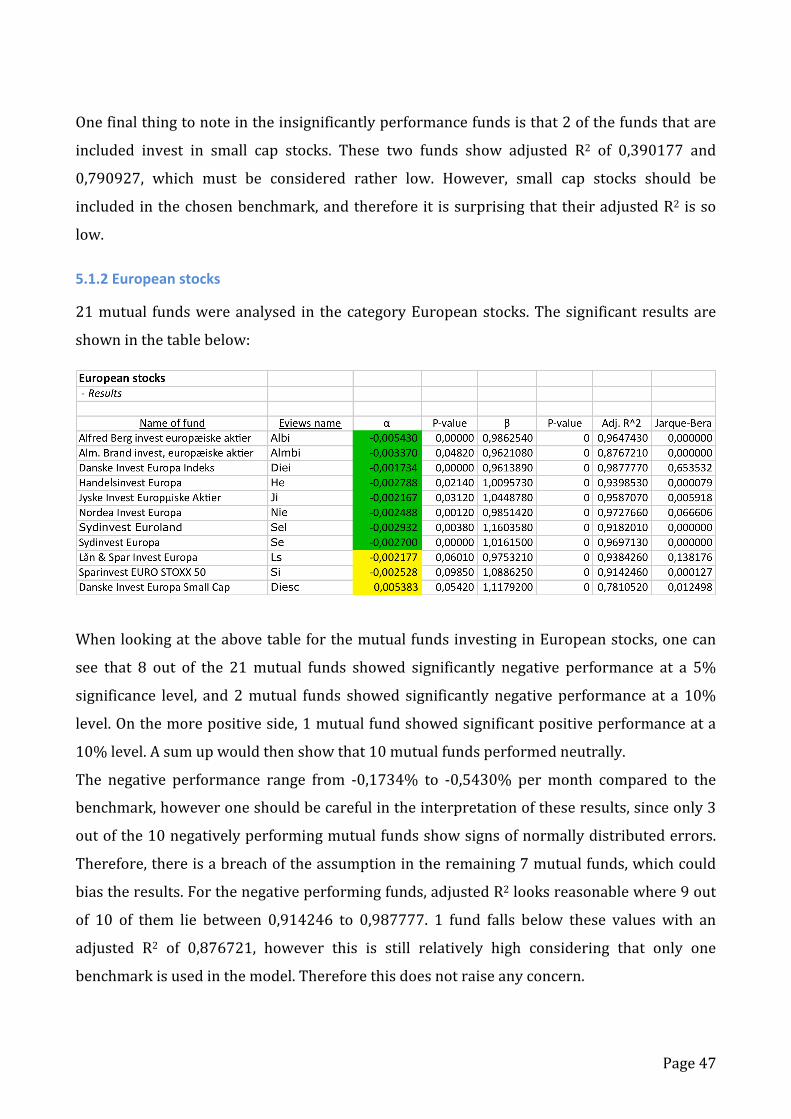
Page47
Onefinalthingtonoteintheinsignificantlyperformancefundsisthat2ofthefundsthatare
included invest in small cap stocks. These two funds show adjusted R2 of 0,390177 and
0,790927, which must be considered rather low. However, small cap stocks should be
includedinthechosenbenchmark,andtherefore it issurprisingthattheiradjustedR2 isso
low.
5.1.2Europeanstocks
21mutual fundswereanalysed in thecategoryEuropeanstocks.Thesignificant resultsare
showninthetablebelow:
WhenlookingattheabovetableforthemutualfundsinvestinginEuropeanstocks,onecan
see that 8 out of the 21mutual funds showed significantly negative performance at a 5%
significance level, and2mutual funds showed significantly negative performance at a 10%
level.Onthemorepositiveside,1mutualfundshowedsignificantpositiveperformanceata
10%level.Asumupwouldthenshowthat10mutualfundsperformedneutrally.
The negative performance range from ‐0,1734% to ‐0,5430% per month compared to the
benchmark,howeveroneshouldbecarefulintheinterpretationoftheseresults,sinceonly3
outofthe10negativelyperformingmutualfundsshowsignsofnormallydistributederrors.
Therefore,thereisabreachoftheassumptionintheremaining7mutualfunds,whichcould
biastheresults.Forthenegativeperformingfunds,adjustedR2looksreasonablewhere9out
of 10 of them lie between 0,914246 to 0,987777. 1 fund falls below these values with an
adjusted R2 of 0,876721, however this is still relatively high considering that only one
benchmarkisusedinthemodel.Thereforethisdoesnotraiseanyconcern.
Page48
“Danske Invest Europa Small Cap” shows significant positive performance at a 10%
significance level. The result shows an over performance of 0,5383% compared to the
benchmark, however one should be careful when interpreting this result. First of all, the
Jarque‐Beratestshowsupsignificantmeaningthatthehypothesisregardingnormalityinthe
errorsisrejected.Secondly,theadjustedR2isratherlowat0,781052,meaningthatthereis
roomforimprovementinthebenchmark’sabilitytoexplainthevariationinthereturnofthe
mutualfunds.Thisisprobablyconnectedtothefact,thatthefundinvestsinsmallcapstocks,
andthereforethechosenbenchmark ispossiblynotthebest inthiscase. Itmustthoughbe
expected that the multi‐index model will correct for that, since a small cap index will be
includedasbenchmarkhere.
Itcouldalsobenotedthatonly3outofthe21investmentfundsinvestinginEuropeanstocks
show up to have normally distributed errors. This is of course a problem for the
interpretationoftheresults.Lastly, itcouldbenotedthat3of themutual funds includedin
thissampleinvest insmallcapstocks.These3mutualfundsalsoshowupwithsomeofthe
highestbetavalues,rangingfrom1,11792to1,254541,howeverthisisnotsurprising,sinceit
must be assumed that the small cap stocks are more volatile than the larger and more
establishedcompanies.Generally,theadjustedR2isratherlowforthese3fundscomparedto
theothers,howeveraspreviouslydiscussed,itmustbeexpectedthatthiswillchangeinthe
multi‐indexmodel.
5.1.3Globalstocks
23 mutual funds were analysed in the category Global stocks. The significant results are
showninthetablebelow:
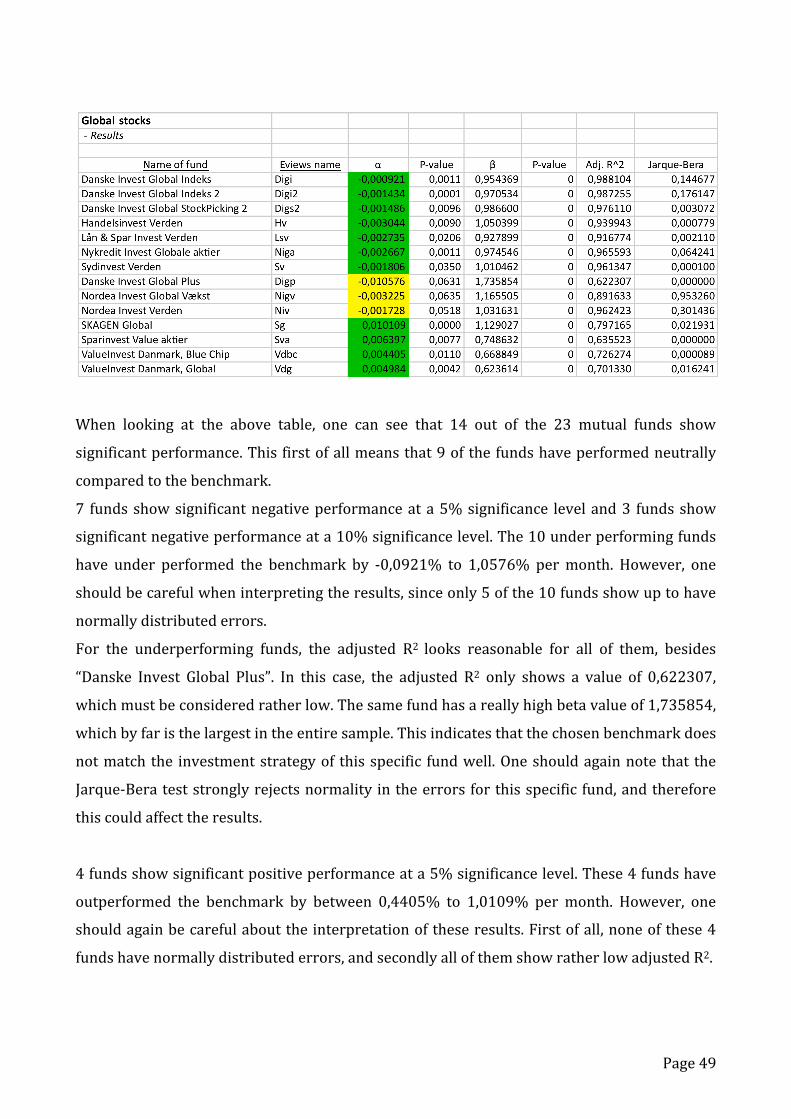
Page49
When looking at the above table, one can see that 14 out of the 23 mutual funds show
significantperformance.Thisfirstofallmeansthat9ofthefundshaveperformedneutrally
comparedtothebenchmark.
7 fundsshowsignificantnegativeperformanceata5%significance leveland3 fundsshow
significantnegativeperformanceata10%significancelevel.The10underperformingfunds
have under performed the benchmark by ‐0,0921% to 1,0576% permonth. However, one
shouldbecarefulwheninterpretingtheresults,sinceonly5ofthe10fundsshowuptohave
normallydistributederrors.
For the underperforming funds, the adjusted R2 looks reasonable for all of them, besides
“Danske Invest Global Plus”. In this case, the adjusted R2 only shows a value of 0,622307,
whichmustbeconsideredratherlow.Thesamefundhasareallyhighbetavalueof1,735854,
whichbyfaristhelargestintheentiresample.Thisindicatesthatthechosenbenchmarkdoes
notmatchthe investmentstrategyof thisspecific fundwell.Oneshouldagainnote that the
Jarque‐Berateststronglyrejectsnormality intheerrorsforthisspecific fund,andtherefore
thiscouldaffecttheresults.
4fundsshowsignificantpositiveperformanceata5%significancelevel.These4fundshave
outperformed the benchmark by between 0,4405% to 1,0109% per month. However, one
shouldagainbecarefulabouttheinterpretationoftheseresults.Firstofall,noneofthese4
fundshavenormallydistributederrors,andsecondlyallofthemshowratherlowadjustedR2.
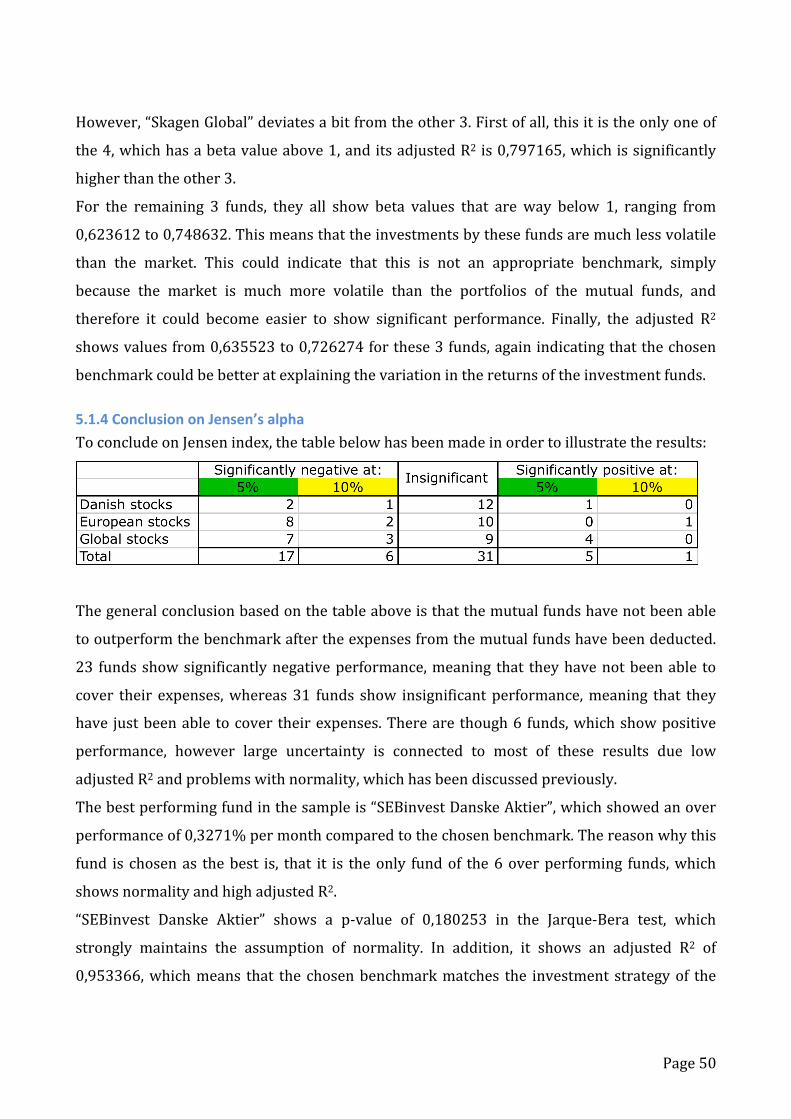
Page50
However,“SkagenGlobal”deviatesabitfromtheother3.Firstofall,thisitistheonlyoneof
the4,whichhasabetavalueabove1,anditsadjustedR2is0,797165,whichissignificantly
higherthantheother3.
For the remaining 3 funds, they all show beta values that are way below 1, ranging from
0,623612to0,748632.Thismeansthattheinvestmentsbythesefundsaremuchlessvolatile
than the market. This could indicate that this is not an appropriate benchmark, simply
because the market is much more volatile than the portfolios of the mutual funds, and
therefore it could become easier to show significant performance. Finally, the adjusted R2
showsvaluesfrom0,635523to0,726274forthese3funds,againindicatingthatthechosen
benchmarkcouldbebetteratexplainingthevariationinthereturnsoftheinvestmentfunds.
5.1.4ConclusiononJensen’salpha
ToconcludeonJensenindex,thetablebelowhasbeenmadeinordertoillustratetheresults:
Thegeneralconclusionbasedonthetableaboveisthatthemutualfundshavenotbeenable
tooutperformthebenchmarkaftertheexpensesfromthemutualfundshavebeendeducted.
23 fundsshowsignificantlynegativeperformance,meaning that theyhavenotbeenable to
cover their expenses,whereas31 funds show insignificantperformance,meaning that they
have justbeenable tocover theirexpenses.Therearethough6 funds,whichshowpositive
performance, however large uncertainty is connected to most of these results due low
adjustedR2andproblemswithnormality,whichhasbeendiscussedpreviously.
Thebestperformingfundinthesampleis“SEBinvestDanskeAktier”,whichshowedanover
performanceof0,3271%permonthcomparedtothechosenbenchmark.Thereasonwhythis
fund is chosenas thebest is, that it is theonly fundof the6overperforming funds,which
showsnormalityandhighadjustedR2.
“SEBinvest Danske Aktier” shows a p‐value of 0,180253 in the Jarque‐Bera test, which
strongly maintains the assumption of normality. In addition, it shows an adjusted R2 of
0,953366,whichmeans that the chosenbenchmarkmatches the investment strategyof the
Page51
fundratherwell.Therefore, itmustbeconcluded that theresults for thisspecific fundsare
reliable,andbasedonthatitisclassifiedasthebestperformingfundintheJensenindex.
In otherwords, this simplymeans that thismutual fund has shown superior performance
evenafteritsexpenseshasbeendeducted.
5.2Multi‐indexmodel
Whenestimatingtheregressionmodelforthemulti‐indexmodel,insignificantvariableshave
beenremovedonebyone,startingwiththeonewiththehighestp‐value.Eachtimeavariable
hasbeenremoved,anewregressionmodelhasbeenestimated.
IfalladditionalbenchmarksbesidestheonefromtheJensenindexshowupinsignificant,then
themulti‐indexmodelwillendupwithexactlythesameresultsastheJensenindex.
ThisespeciallyoccurredforthemutualfundsinvestinginDanishstocks.
In appendix 2, tables have beenmade, showingwhich benchmarks showup significant for
eachofthemutualfunds.Appendix2alsoincludestablesfortheassumptionsaswellasfor
theresults.
The results for each of the three investment categorieswill now be discussed individually
followedbyaoverallconclusiononthemulti‐indexmodel.
5.2.1Danishstocks
Aspreviouslydiscussed,themulti‐indexmodeldidnotseemtodomuchgoodforthemutual
funds investing in Danish stocks. For 8 out of the 16 mutual funds, all of the additional
benchmarksshowedupinsignificant.For3fundstheMSCIworldindexshowedupsignificant,
and for5 funds, the “JPMGBIBroadex.Denmark” showedupsignificant.However for2of
these,itwasonlysignificantata10%level,indicatingthatitseffectonthemodelisrelatively
uncertain.
TheJPMGBIDenmarkdidnotshowupsignificantatall,therebyshowingthatthisindexhas
noabilitytoexplainthereturnsoftheinvestmentfundsatall.
Generally, itmustbeconcluded that theOMXCopenhagenCap_GI indexdoesratherwell in
explainingthereturnsoftheinvestmentfundsinvestinginDanishstocks,sinceinhalfofthe
cases,themulti‐indexmodeldoesnotaddanythingadditionalcomparedtotheJensenindex.
In addition, for the mutual funds, which have more than one significant benchmark, the
adjustedR2hasonlyincreasedslightly.TheadjustedR2hasincreasedbylessthan1%forall
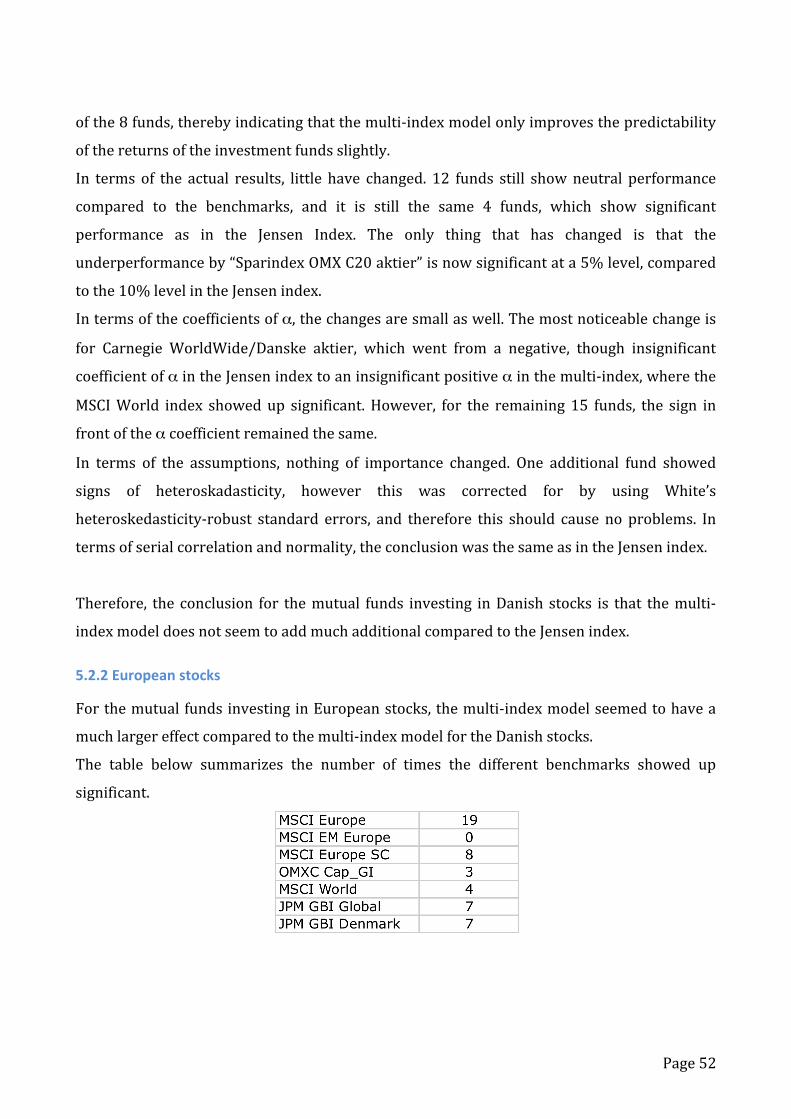
Page52
ofthe8funds,therebyindicatingthatthemulti‐indexmodelonlyimprovesthepredictability
ofthereturnsoftheinvestmentfundsslightly.
In terms of the actual results, little have changed. 12 funds still showneutral performance
compared to the benchmarks, and it is still the same 4 funds, which show significant
performance as in the Jensen Index. The only thing that has changed is that the
underperformanceby“SparindexOMXC20aktier”isnowsignificantata5%level,compared
tothe10%levelintheJensenindex.
Intermsofthecoefficientsofα,thechangesaresmallaswell.Themostnoticeablechangeis
for Carnegie WorldWide/Danske aktier, which went from a negative, though insignificant
coefficientofαintheJensenindextoaninsignificantpositiveαinthemulti‐index,wherethe
MSCIWorld index showedup significant.However, for the remaining 15 funds, the sign in
frontoftheαcoefficientremainedthesame.
In terms of the assumptions, nothing of importance changed. One additional fund showed
signs of heteroskadasticity, however this was corrected for by using White’s
heteroskedasticity‐robust standard errors, and therefore this should cause no problems. In
termsofserialcorrelationandnormality,theconclusionwasthesameasintheJensenindex.
Therefore, the conclusion for themutual funds investing inDanish stocks is that themulti‐
indexmodeldoesnotseemtoaddmuchadditionalcomparedtotheJensenindex.
5.2.2Europeanstocks
ForthemutualfundsinvestinginEuropeanstocks,themulti‐indexmodelseemedtohavea
muchlargereffectcomparedtothemulti‐indexmodelfortheDanishstocks.
The table below summarizes the number of times the different benchmarks showed up
significant.
Page53
One thing,which isnoticeable is that theMSCIEurope index,whichwasused in the Jensen
indexshowedupinsignificanttwotimes.However,thisdoesnotcomeasthebiggestsurprise,
sincethese2fundsinvestinsmallcapstocks,andthereforeitmustbeassumedthatthesmall
cap indexwould be the primary source in explaining the variation in the returns of these
mutual funds. This was probably also the reason why these funds showed relatively low
adjustedR2intheJensenindexmodel.
ItshouldprobablyalsobenotedthattheMSCIEMEuropeshowedupinsignificantinallofthe
models,therebyindicatingthattheemergingmarketsinEuropearenotrelevantinexplaining
thereturnsoftheseinvestmentfunds.
Intermsoftheactualresults,relevantchangesoccurredinthemulti‐indexmodelcompared
totheJensenindex.
11 funds showed negative performance at a 5% significance level, and 3 funds showed
negativeperformanceata10%level.ComparedtotheJensenindex,thisisanincreaseof3at
the5%levelandanincreaseof1atthe10%level.
However, none of the funds showed significant positive performance in the multi‐index
model, and therefore it must be concluded, that the multi‐index model strengthens the
negative performance of the mutual funds, since it indicates significantly negative
performancefor4additionalfunds.
Whenlookingatthecoefficientforα,onecanseethatthedirectionofthechangediffersfrom
fundtofund,howeverthemostcommonchangeisadecreaseinα,meaningthemulti‐index
modelgenerallyshowsamorenegativeperformancethantheJensenindex.
The increase intheadjustedR2wasalso larger fortheEuropeanstocksthanfortheDanish
stocks.Thegeneralpictureshowedincreasesof1‐2%‐pointwithsomedeviations.Especially,
the mutual funds investing in small cap stocks showed large increases in the adjusted R2
showing increases between 10‐12%‐point. However, again this does not come as a big
surprise,sincethesmallcapindexisamoreappropriatebenchmarkforthesefunds.
Thetestfortheassumptionlookedrathersimilarforthemulti‐indexmodelasfortheJensen
index.IntheJensenIndex,13fundsshowedsignsofheteroskedasticity,5fundsshowedsign
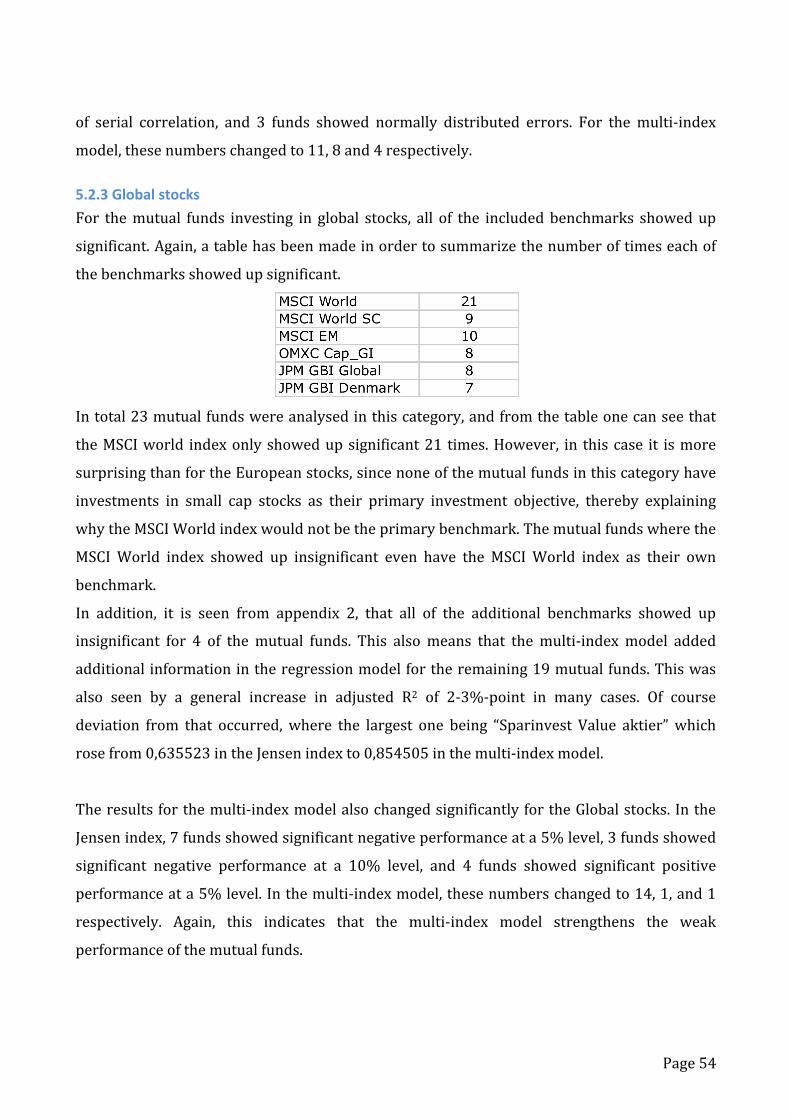
Page54
of serial correlation, and 3 funds showed normally distributed errors. For themulti‐index
model,thesenumberschangedto11,8and4respectively.
5.2.3Globalstocks
For themutual funds investing in global stocks, all of the includedbenchmarks showedup
significant.Again,atablehasbeenmadeinordertosummarizethenumberoftimeseachof
thebenchmarksshowedupsignificant.
Intotal23mutualfundswereanalysedinthiscategory,andfromthetableonecanseethat
theMSCIworld indexonlyshowedupsignificant21 times.However, in thiscase it ismore
surprisingthanfortheEuropeanstocks,sincenoneofthemutualfundsinthiscategoryhave
investments in small cap stocks as their primary investment objective, thereby explaining
whytheMSCIWorldindexwouldnotbetheprimarybenchmark.Themutualfundswherethe
MSCIWorld index showed up insignificant even have the MSCIWorld index as their own
benchmark.
In addition, it is seen from appendix 2, that all of the additional benchmarks showed up
insignificant for 4 of themutual funds. This alsomeans that themulti‐indexmodel added
additionalinformationintheregressionmodelfortheremaining19mutualfunds.Thiswas
also seen by a general increase in adjusted R2 of 2‐3%‐point in many cases. Of course
deviation from that occurred,where the largest one being “Sparinvest Value aktier”which
rosefrom0,635523intheJensenindexto0,854505inthemulti‐indexmodel.
Theresultsforthemulti‐indexmodelalsochangedsignificantlyfortheGlobalstocks.Inthe
Jensenindex,7fundsshowedsignificantnegativeperformanceata5%level,3fundsshowed
significant negative performance at a 10% level, and 4 funds showed significant positive
performanceata5%level.Inthemulti‐indexmodel,thesenumberschangedto14,1,and1
respectively. Again, this indicates that the multi‐index model strengthens the weak
performanceofthemutualfunds.
Page55
In the Jensen index, 4 funds showed significant positive performance at a 5% level, and as
previouslymentioned, thisnumberdecreased to1 in themulti‐indexmodel.Theremaining
three funds showed neutral performance in the multi‐index model. The reason of that
probablyis,thatthese3fundsshowedratherlowadjustedR2intheJensenindex,andasthe
returnpredictabilityofthesemutualfundsroseinthemulti‐indexmodel,thefundsshowed
insignificant performance. An example of this increase in adjusted R2 is as previously
mentioned “Sparinvestvalueaktier” showingsignificantpositiveperformance in the Jensen
index,with a low adjusted R2, however in themulti‐indexmodel adjusted R2 increased by
approximately22%‐point, and theadditional returnpredictability in themulti‐indexmodel
resultedininsignificantperformanceinthemulti‐indexmodel.
It should thoughbenoted, that theα coefficient for these3 funds remainspositive, though
highlyinsignificantwithp‐valuesrangingfrom0,1492to0,9240.
“ValueInvestDanmark,BlueChip”showedsignificantpositiveperformanceinthemulti‐index
aswell,howevertheexcessreturndecreasedfrom0,4405%permonthintheJensenindexto
0,3376% in the multi‐index model. It should though be noted that this fund showed a
relativelylowadjustedR2inthemulti‐indexmodelaswell,withavalueof0,771921.
The overall picture of the multi‐index model for the Global stocks is that the sign on the
coefficients remain similar to the Jensen index. However, for the funds with negative α
coefficientsthemainconclusionisthatmorefundsshowsignificantnegativeperformancein
themulti‐indexmodel.
The tests for the assumptions looked better for themulti‐indexmodel than for the Jensen
index.3fewerfundsshowedsignsofheteroskedasticityand1lessfundshowedsignsofserial
correlation, however correctionswheremade for that. Butmore importantly, therewas an
increase in the number of investment funds showing normally distributed errors. This
number increased from9 in the Jensen index to14 in themulti‐indexmodel.This is still a
positive development, since the results become more valid when the assumption about
normally distributed errors is fulfilled. Therefore, the results from the multi‐index model
mustbeconsideredmorereliablethantheresultfortheJensenindex.
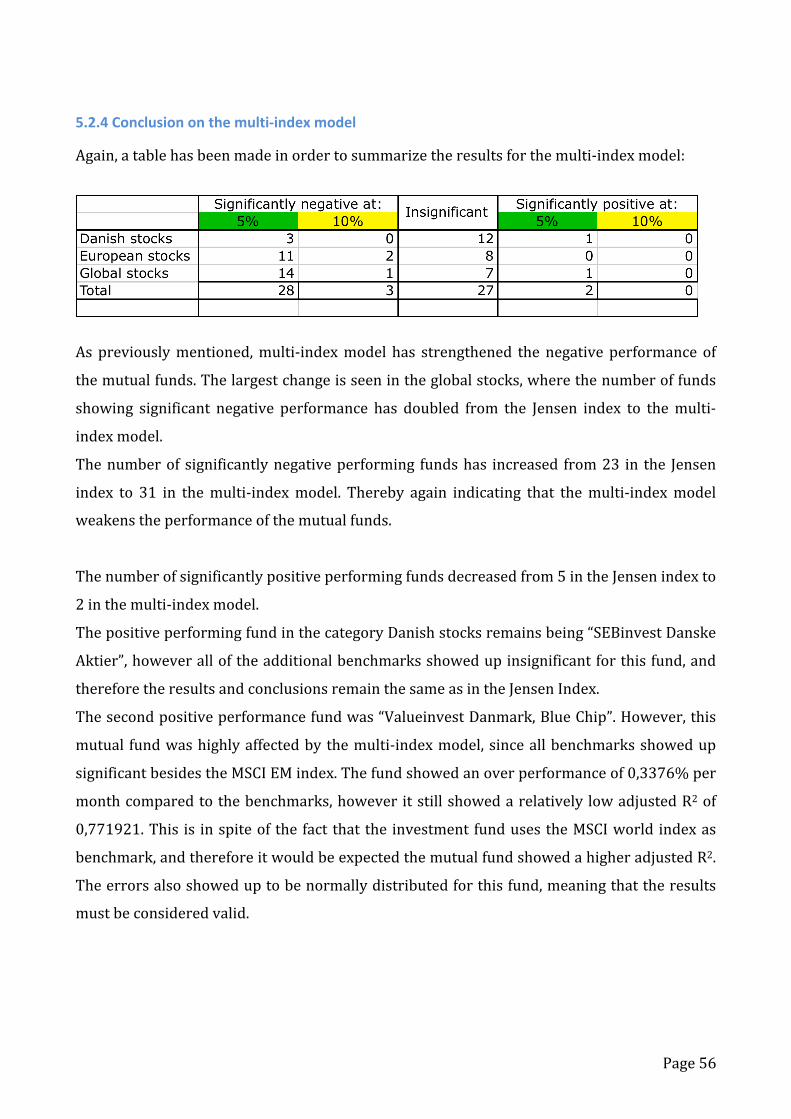
Page56
5.2.4Conclusiononthemulti‐indexmodel
Again,atablehasbeenmadeinordertosummarizetheresultsforthemulti‐indexmodel:
As previouslymentioned,multi‐indexmodel has strengthened thenegative performance of
themutualfunds.Thelargestchangeisseenintheglobalstocks,wherethenumberoffunds
showing significant negative performance has doubled from the Jensen index to themulti‐
indexmodel.
Thenumberof significantlynegativeperforming fundshas increased from23 in the Jensen
index to 31 in themulti‐indexmodel. Thereby again indicating that themulti‐indexmodel
weakenstheperformanceofthemutualfunds.
Thenumberofsignificantlypositiveperformingfundsdecreasedfrom5intheJensenindexto
2inthemulti‐indexmodel.
ThepositiveperformingfundinthecategoryDanishstocksremainsbeing“SEBinvestDanske
Aktier”,howeveralloftheadditionalbenchmarksshowedupinsignificantforthisfund,and
thereforetheresultsandconclusionsremainthesameasintheJensenIndex.
Thesecondpositiveperformancefundwas“ValueinvestDanmark,BlueChip”.However,this
mutual fundwashighlyaffectedbythemulti‐indexmodel,sinceallbenchmarksshowedup
significantbesidestheMSCIEMindex.Thefundshowedanoverperformanceof0,3376%per
monthcomparedtothebenchmarks,however itstillshowedarelatively lowadjustedR2of
0,771921.This is inspiteof the fact that the investment fundusestheMSCIworld indexas
benchmark,andthereforeitwouldbeexpectedthemutualfundshowedahigheradjustedR2.
Theerrorsalsoshoweduptobenormallydistributedforthisfund,meaningthattheresults
mustbeconsideredvalid.
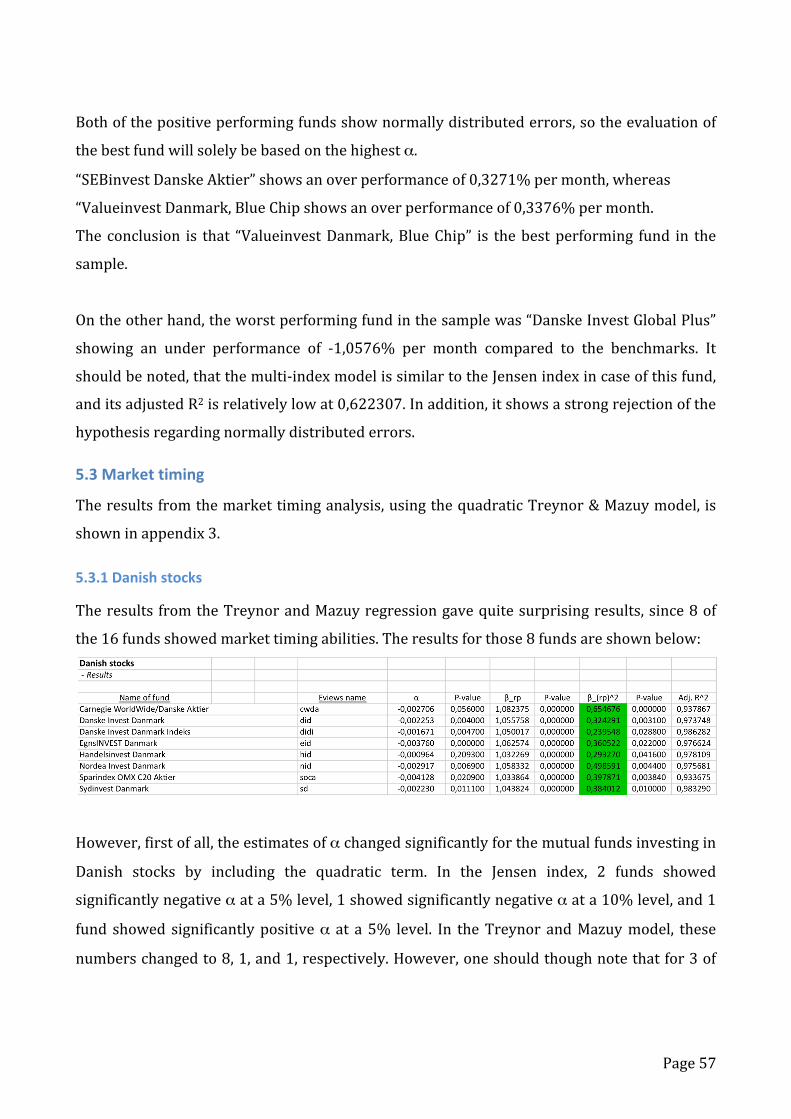
Page57
Bothofthepositiveperformingfundsshownormallydistributederrors,sotheevaluationof
thebestfundwillsolelybebasedonthehighestα.
“SEBinvestDanskeAktier”showsanoverperformanceof0,3271%permonth,whereas
“ValueinvestDanmark,BlueChipshowsanoverperformanceof0,3376%permonth.
The conclusion is that “ValueinvestDanmark,BlueChip” is thebestperforming fund in the
sample.
Ontheotherhand,theworstperformingfundinthesamplewas“DanskeInvestGlobalPlus”
showing an under performance of ‐1,0576% per month compared to the benchmarks. It
shouldbenoted,thatthemulti‐indexmodelissimilartotheJensenindexincaseofthisfund,
anditsadjustedR2isrelativelylowat0,622307.Inaddition,itshowsastrongrejectionofthe
hypothesisregardingnormallydistributederrors.
5.3Markettiming
Theresultsfromthemarkettiminganalysis,usingthequadraticTreynor&Mazuymodel, is
showninappendix3.
5.3.1Danishstocks
Theresults fromtheTreynorandMazuyregressiongavequitesurprisingresults,since8of
the16fundsshowedmarkettimingabilities.Theresultsforthose8fundsareshownbelow:
However,firstofall,theestimatesofαchangedsignificantlyforthemutualfundsinvestingin
Danish stocks by including the quadratic term. In the Jensen index, 2 funds showed
significantlynegativeαata5%level,1showedsignificantlynegativeαata10%level,and1
fund showed significantlypositiveα at a 5% level. In theTreynor andMazuymodel, these
numberschangedto8,1,and1,respectively.However,oneshouldthoughnotethatfor3of
Page58
these funds, the quadratic term shows up insignificant, and therefore the estimates are
affectedbysomething,whichhasnosignificanteffectonthemodel.
Whengenerallylookingattheestimatedα‐values,onecansee,thattheyaremuchlowerthan
for the Jensen index. This indicates weak selection ability by the mutual funds using the
Treynor&Mazuymodel,sinceonly1fundshowssignificantselectionabilities.
Aspreviouslymentioned,theresultsfortheinvestmentcategory“Danishstocks”werequite
surprising, since 14 out of the 16 analysed mutual funds showed up to have a positive
coefficient of the quadratic term. Of these 14, 8 of them showed up significant at a 5%
significancelevel.Inotherwords,halfofthemutualfundsinthiscategoryshowedsignificant
timingabilities.
TheconclusiontotheTreynorandMazuymodelis,thattheestimateofαismuchlowerthan
in the Jensen index. Thismust be caused by the fact that 8mutual funds show significant
timingabilities.
The Jensen index only focuses on selection abilities, and therefore better performance
attributabletotimingbecomessomewhatincludedintheselectionabilities.However,inthe
TreynorandMazuymodelseparationismadebetweenselectionandtimingabilities.
Generally, the selection abilities of the funds are verypure,which ismuch in linewith the
theoryofefficientmarkets.However,8fundspossesstimingabilities,whichpositivelyaffects
the results. This means that these 8 funds to some degree have managed to adjust their
systematicrisktothedevelopmentinthemarket.
5.3.2EuropeanandGlobalstocks
The results for the European andGlobal stocks are quite similar, so therefore theywill be
discussedjointly.
In total, 44 fundswere analysed in these two investment categories, and themain results
werethatnoneofthesefundsshowedanysignofmarkettiming.Only4outofthe44funds
showed a positive coefficient on the quadratic term, though all of them being highly
insignificant.For theremaining40 funds,almosthalfof themshowedasignificantnegative
coefficientonthequadraticterm,meaningthattheyhaveadjustedthesystematicriskonthe
Page59
portfoliooppositelyofthedirectionofthemarket.Thishasaffectedtheresultsofthefunds
negatively.
Since close tohalf of thequadratic terms showedup significant, it alsomeans that it has a
significanteffectonthereturnsofthemutualfunds.
Whenlookingattheαvalues,onecanseethattheyhave increasedcomparedtotheJensen
index. In the Treynor and Mazuy model, there are 8 funds showing significant selection
abilities at a 5% level, and 2 funds showing significant selection abilities at a 10% level.
Compared to the Jensen index, this means that there are funds, which show significant
positive selectionabilities,howeverdue toweak timingabilities, theyarenot able to show
significantpositiveperformanceintheJensenindex.
5.3.2ConclusionontheTreynorandMazuymodel
Theconclusionontheanalysisofmarkettimingisthat8outofthe60analysedfundsshow
significantmarkettimingabilities.Itshouldbenotedthatallofthe8fundsarefoundinthe
investmentcategory,Danishstocks.
The results, which has been reached does not match the general results reached in the
literature.E.g.TreynorandMazuy(1966)reachedtheconclusionthatonly1outof57mutual
fundshadbeenable to time themarket.A similaranalysisof theDanishmutual fundswas
conducted by Christensen (2004). He reached the conclusion that only 2 out of 47 Danish
mutualfundsshowedsignificanttimingabilities.
Therefore, the results reachedaboutDanishmutual funds investing inDanish stocks raises
some concern, since these results are opposite of the results reached in the literature. In
termsof theresults,only2of the8 fundsshownormallydistributederrors,and it is likely
thatthatcouldhaveaneffectontheresults,howeveritisveryunlikelythatthiswouldexplain
the entire effect. The results have thoughbeen checked, andnomistakeshavebeen found.
Thereforetheresultsmustberegardedasreliable,meaningthatthegeneraltendencyisthat
itispossibletotimethemarketforthemutualfundsinvestinginDanishstocks.
Forthemutualfundsshowingsignificanttimingabilities,theresultsconfirmstheresearchby
Grant(1977)sayingthatthetruevalueofαislikelytobeunderestimatedinthepresenceof
timingabilities.ThereasonofthatisthatintheTreynorandMazuymodel,thevaluesofαare
smallerinpresenceoftimingabilitiesthantherespectiveαvaluesfromtheJensenregression.

Page60
Finally,theresultsforthemutualfundsinvestinginEuropeanandGlobalstocksaresimilarto
theresultsreachedintheliterature.Theresultisthattimingabilitiesarenotpresentforany
ofthemutualfundsinthesetwocategories.
5.4ConclusionontheperformanceanalysisThegeneralconclusionontheperformanceanalysisisthatafewoftheanalysedfundshave
beenabletooutperformthemarketinboththesingle‐andmulti‐indexmodel.However,the
majority of the results show either that the investment funds are just able to cover their
expensesorthattheycannotcovertheirownexpenses.
Intermsofmarkettiming,8fundsinvestinginDanishstocksshowedmarkettimingabilities,
whereasallremainingfundsshowednosignsofmarkettiming.
Page61
6.Discussionandreflections
Thediscussionandreflectionswillbeusedtocomparetheresultsofthisthesistosimilar
analyses.Inaddition,itwillalsobediscussedwhichthingscouldhavebeeninterestingto
includeinthisthesis.
InApril 2011, “DanskAktionærforening” published an analysis of theDanishmutual funds
(Danskaktionærforening, 2011).Thepurposeof this analysiswasnot to seewhichmutual
fundsthatwereabletooutperformcertainbenchmarks,butinsteadtorankthemutualfunds
basedontheirperformanceandinvestmentcategory.Itwouldthereforebeinterestingtosee
how they ranked themutual funds that performedwell in this thesis. It should though be
notedthatthemethodofanalysisusedby“DanskAktionærforening”differssignificantlyfrom
theoneusedinthisanalyses,howeveracomparisonisstillfoundinteresting.
First of all, “Dansk Aktionærforening” divides the investment fund into three different risk
categories (low,medium, and high),where Global stocks belong to the low risk group and
DanishandEuropeanstocksbelongtothemediumriskgroup.
The best performing fund in the thesiswas “ValueInvest Danmark, Blue Chip” investing in
globalstocks.Intheanalysisby“DanskAktionærforening”,thisfundisrankednumber7out
of70fundsinthislowriskgroup.5outofthe6betterperformingfundsarenotincludedin
the sampleof this thesis,howeveronDAF’s4thplace comes “ValueInvestDanmark,Global”
whichwasalsoincludedinthesampleofthisthesis.Inthisthesis,thefundshowedsignificant
positive performance in the Jensen index, though with a low R2. The low R2 was though
improved in the mutual index model, and this caused that the fund performed neutrally
comparedtothebenchmark.Thedifference intheresults fromthisanalysisandtheoneby
“DanskAktionærforening”isprobablythattheirperiodofanalysisismuchshorter,sincethey
usereturnsona1‐,3‐,and5‐yearbasis,weightingthenewestreturnshighest.
Forthemutualfundsshowingsignificantnegativeperformanceinthisthesis,theresultsare
prettyconsistentwiththosereachedbyDAF,sincetheyplacethemajorityofthosefundsin
thelowerhalfoftheirranking.
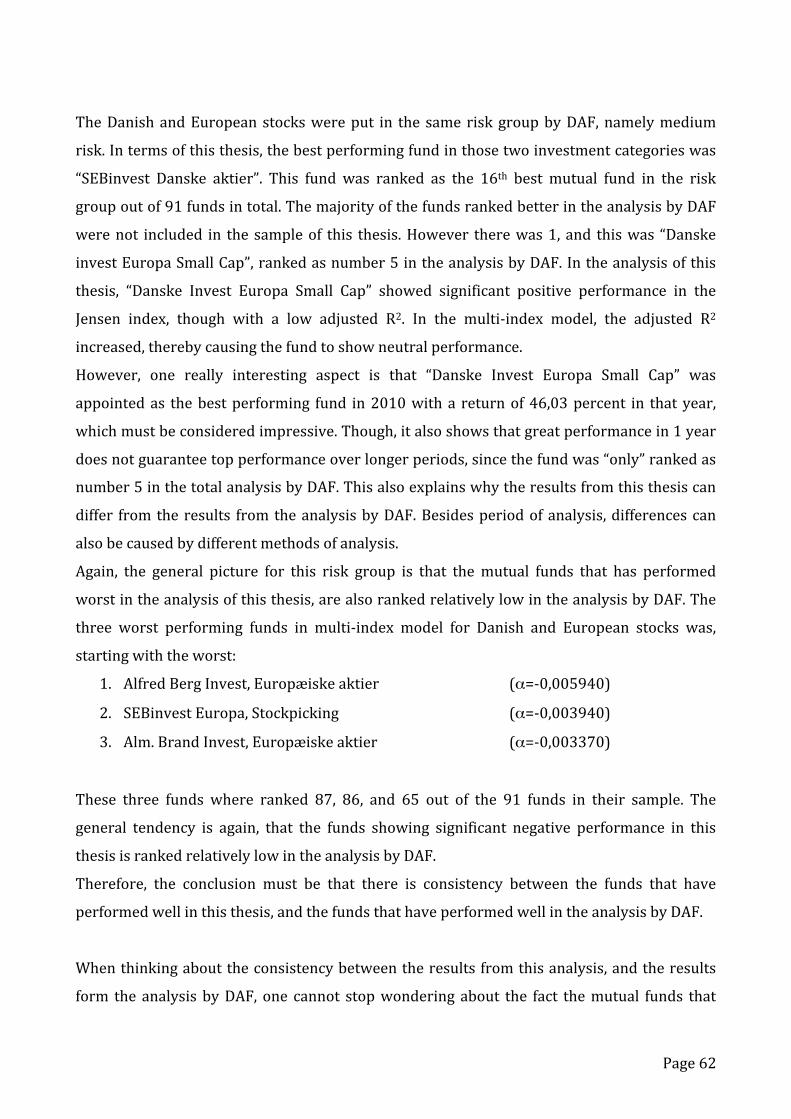
Page62
TheDanishandEuropeanstockswereput in the sameriskgroupbyDAF,namelymedium
risk.Intermsofthisthesis,thebestperformingfundinthosetwoinvestmentcategorieswas
“SEBinvest Danske aktier”. This fund was ranked as the 16th best mutual fund in the risk
groupoutof91fundsintotal.ThemajorityofthefundsrankedbetterintheanalysisbyDAF
werenot included in the sampleof this thesis.However therewas1, and thiswas “Danske
investEuropaSmallCap”,rankedasnumber5intheanalysisbyDAF.Intheanalysisofthis
thesis, “Danske Invest Europa Small Cap” showed significant positive performance in the
Jensen index, though with a low adjusted R2. In the multi‐index model, the adjusted R2
increased,therebycausingthefundtoshowneutralperformance.
However, one really interesting aspect is that “Danske Invest Europa Small Cap” was
appointedas thebestperforming fund in2010witha returnof46,03percent in thatyear,
whichmustbeconsideredimpressive.Though,italsoshowsthatgreatperformancein1year
doesnotguaranteetopperformanceoverlongerperiods,sincethefundwas“only”rankedas
number5inthetotalanalysisbyDAF.Thisalsoexplainswhytheresultsfromthisthesiscan
differ fromtheresults fromtheanalysisbyDAF.Besidesperiodofanalysis,differencescan
alsobecausedbydifferentmethodsofanalysis.
Again, the general picture for this risk group is that themutual funds that has performed
worstintheanalysisofthisthesis,arealsorankedrelativelylowintheanalysisbyDAF.The
three worst performing funds in multi‐index model for Danish and European stocks was,
startingwiththeworst:
1. AlfredBergInvest,Europæiskeaktier (α=‐0,005940)
2. SEBinvestEuropa,Stockpicking (α=‐0,003940)
3. Alm.BrandInvest,Europæiskeaktier (α=‐0,003370)
These three funds where ranked 87, 86, and 65 out of the 91 funds in their sample. The
general tendency is again, that the funds showing significant negative performance in this
thesisisrankedrelativelylowintheanalysisbyDAF.
Therefore, the conclusion must be that there is consistency between the funds that have
performedwellinthisthesis,andthefundsthathaveperformedwellintheanalysisbyDAF.
Whenthinkingabouttheconsistencybetweentheresultsfromthisanalysis,andtheresults
form the analysisbyDAF, one cannot stopwondering about the fact themutual funds that
Page63
haveperformedwellinthisthesiswithaperiodofanalysisfrom2001to2010alsoseemto
haveperformedwellinthe5yearperiodendingin2010byDAF.Someofthisconsistencyis
naturallycausedbythefactthattheentireperiodofanalysisbyDAFisincludedinthelonger
periodofanalysisinthisthesis,andthiswillofcoursecausesomeconsistency.Howeverone
cannotavoidrelatingthistoperformancepersistency,whichconcernswhetherperformance
ofamutualfundinafutureperiodcanbepredictedbaseduponpreviousperiods.Research
hasbeendonewithinthis field,oneof thosefortheDanishmutual fundsbeingChristensen
(2004). His conclusion is that performance persistency is not a general tendency for the
Danishmutual funds, and that it is only seen in a few and one‐off situations. His advice is
therefore that one should not select future mutual funds based on their previous
performance.However, theanalysisbyChristensen(2004) isrelativelyoldwithaperiodof
analysisrangingfrom1996to2003,anditwouldthereforehavebeenreallyinterestingtosee
whetherthesamepictureshowedupinthisperiodofanalysis.However,duetothelimitation
ofthethesis,thishasbeenleftout.
TheFederationofDanish InvestmentAssociates (IFR)publishes statisticson the returnsof
theinvestmentfundsontheirhomepage.Theresultsareshownasanaverageannualreturn
on different time periods of which the 10 year period is themost relevant for this thesis.
Along with the average annual return of the mutual fund, the average annual return of
relevantbenchmarksisgivenaswell.However,anactualperformanceanalysisisnotcarried
out on their homepage, and therefore one has to draw relative conclusions based on the
returnstatistics.
For the mutual funds investing in Danish stocks, the benchmark given by IFR is “OMX
KøbenhavnTotalindeksCap_GI”.Fromthereturnstatistics,itisseenthattheaveragereturn
forthisindexhasbeen8,72%peryearforthe10‐yearperiod.Theyalsohave16investment
funds included in the10yearperiod, and judging from theblinkof aneye, it seemsas if3
fundsshowsignificantlyhigherperformancethanthebenchmark.Thebestperformingfund
in their statistics is SEBinvestDanske aktier, yielding an average annual return of 13,74%.
The performance analysis in this thesis showed that SEBinvestDanske aktierwas the only
significantly positive performing fund for the investment category “Danish stocks”, so
thereforeconsistencyisfoundhere.However,forthetworemainfundsshowinghighannual
Page64
returns in theanalysisby IFR, the resultsdeviated in thisanalysis, since theyboth showed
neutralperformanceinthisthesis.However,oneshouldkeepinmindthatinthisanalysisan
actualperformanceanalysisiscarriedout,andthereforethemorevolatileaportfoliois,the
moredifficultitistoshowsignificantdifferencebetweentheportfolioandthebenchmark.
FortheEuropeanstocks,IFRusesMSCIEuropeGIindexasbenchmark.Thisindexshowsan
averageannualreturnof0,75%peryear.Mostofthereturnsforthemutualfundseemtofall
relatively close or below the return of the benchmark, which is fairly consistent with the
resultsreachedinthisanalysis.Theonlymutualfundwhichpositivelydeviateslargelyfrom
the benchmark is “Danske Invest Europa Small Cap” showing an average annual return of
7,97%whichismuchhigherthanthebenchmark.Thisfundshowedpositiveperformancein
theJensenindex,howeverneutralperformanceinthemulti‐index.Thereasonofthatisthat
theinthemulti‐indexmodel,asmallcapindexhasbeenincluded,whichismoreappropriate
asbenchmarkforthisfund.ItislikelythattheEuropeansmallcapstockhasyieldedamuch
higherreturn in theperiod than theMSCIEurope index,and therefore this fundstandsout
whenitiscomparedtotheMSCIEuropeindex.
However,thegeneralconclusionfortheEuropeanstocksisthattheresultsofthisanalysisare
relativelysimilartotheresultsbyIFR.
Finally, for the Global stocks, IFR shows MSCI World GI as benchmark. This indexes has
yieldedareturnof‐0,65%peryearforthe10‐yearperiod.Themutualfundsperformingwell
in this thesis also showed high returns compared to the benchmark. However, the most
noticeableaspectisprobablythetwo“Skagen”funds,whichshowedthehighestreturnsinthe
statisticsbyIFR.Inthisthesis,oneofthemwasincluded,anditshoweduptohavepositive
performanceintheJensenindex,thoughneutralperformanceinthemulti‐indexmodel.
However,asageneralconclusionitmustbeconcludedthattheresultsreachedinthisanalysis
arerelativelyconsistentwiththestatisticsbyIFR.Itdoesnotseemasifthisanalysisdraws
any significant conclusions, which cannot be supported by the statistics by IFR. However,
therearea few funds that showhighperformance in the statisticsby IFRand thenneutral
performanceinthisanalysis.Though,aspreviouslydiscussed,thiscanbeduetofactorsasthe
volatilityoftheportfolio,choiceofbenchmark,etc.
Page65
Duetothelimitationsofthethesis,therearecertainaspects,whichhavenotbeenanalysed.
Aspreviouslydiscussed, itwouldhavebeenreally interestingtoseewhetherthereturnsof
theinvestmentfundsarepersistentornot.
Inaddition,itcouldalsohavebeeninterestingtoseewhetherthereisapositiverelationship
between the costsof investing ina fundand the returns thismutual fund is able toobtain.
Thiscouldhavebeenobtainedbyregressingthecostsofthefundsagainstthereturnsofthe
funds. If apositive linear relationshipshowsup, itwould indicate thatmutual fundswitha
highcostareabletoearnhigherprofits.
In the thesis, market timing was analysed using the Treynor & Mazuy model, and as
previously discussed the results for the mutual funds showed quite surprising results. It
wouldthereforehavebeeninterestingtouseanothermethodtoanalyseformarkettiming.
OneinterestingmethodcouldhavebeentousetheHenriksson&Merton(1981)model,which
isanon‐parametricmodelandsee if thismodelwouldshowthesamesurprisingresultsas
the method used. However, Christensen (2005) analysed the timing abilities using both
methods,andhisconclusionwasthattheresultswerequitesimilarbetweenthetwomodels.
Page66
7.Conclusion
The theoretical framework of the thesis was based on the theory of efficientmarkets and
CAPM, and therefore the performance of the mutual funds were analysed using theories
withinthatfield.TheperformancemeasurementschosenwastheJensenindexfollowedbya
multi‐indexmodel.Finally,theperformanceofthemutualfundswasseparatedintoselection
andtimingabilitiesusingtheTreynorandMazuymodel.
The period of analysis was 2001‐2010, and the analysis was focused on 60 Danish equity
mutualfundsinvestinginDanishstocks,Europeanstocks,andGlobalstocks.Theresultsfor
eachoftheinvestmentcategorieswillbesummarizedindividually.Itshouldbenoted,thatin
theconclusionsignificantperformancecoversbothsignificanceata5%and10%significance
level.
The results for the mutual funds investing in Danish stocks were relatively similar in the
Jensenindexandthemulti‐indexmodel.Inbothmodels,12ofthe16analysedfundsshowed
neutralperformance,3 funds showed significantnegativeperformance, and1 fund showed
significant positive performance. The second best performing fund was found in this
investmentcategory,namely“SEBinvestDanskeaktier”showingamonthlyoverperformance
of0,3271%comparedtothebenchmark.
Secondly, the results for themutual funds investing inEuropeanstockswereanalysed,and
here therewasasmalldeviationbetweentheresults fromthe Jensen indexandtheresults
fromthemulti‐index.IntheJensenindex,10outofthe21analysedfundsshowedsignificant
negative performance, 10 showed neutral performance, and 1 showed significant positive
performance. However, in the multi‐index model, the number of significantly negative
performingfundsincreasedto13,andnofundsshowedsignificantpositiveperformance.The
increaseinthenumberofnegativeperformingfundswasprimarilycausedbyanincreasein
theadjustedR2.
Page67
Finally,themutualfundsinvestinginGlobalstockswereanalysed,andherelargerdeviation
betweentheJensenindexandthemulti‐indexmodeloccurred.Outofthe23analysedfunds,
10showedsignificantnegativeperformance,9 showedneutralperformance, and4 showed
significantpositiveperformance. Inthemulti‐indexmodel, thesenumberschangedto15,7,
and 1, again caused by a better ability of the benchmarks to explain the variation in the
returnsoftheinvestmentfunds.
Thebestperformingfundintheentiresamplewasfoundinthisinvestmentcategory,namely
“Valueinvest Danmark, Blue Chip” showing a monthly overperformance of 0,3376%
comparedtothebenchmarks.
The general conclusion on the twomodels is that the performance of themutual funds is
weakened in themulti‐indexmodel compared to the Jensen index.Aspreviouslydiscussed,
this is caused by the fact that more benchmarks are able to capture a larger part of the
variationinthereturnsoftheinvestmentfunds.
Totally,inthemulti‐indexmodel,31fundsshowedsignificantnegativeperformance,27funds
showed neutral performance, and only 2 showed significant positive performance. The
generalconclusionistherefore,thattheDanishmutualfundsinvestinginthose3investment
categorieshavenotbeenabletooutperformthemarket,whichismuchinlinewiththetheory
ofefficientmarkets.
Inthelastpartoftheanalysis,theTheynorandMazuymodelwasusedtoanalysewhetherthe
mutualfundspossessedtheabilitytotimethemarket.Theresultwasthat8mutualfundsall
investinginDanishstocksshowedsignificanttimingabilities,thoughthiscausedtheselection
abilityoftheseinvestmentfundstolookworse.Fortheremaining52fundsnosignsoftiming
abilitieswerefound.
Page68
8.BibliographyBrealey,R.A.,Myers,S.C.&Marcus,A.J.2007,Fundamentalsofcorporatefinance,International
ed.,5.ed.edn,McGraw‐HillIrwin,NewYork.
Brown,S.J.,Brown,S.J.,Goetzmann,W.,Goetzmann,W.,Ibbotson,R.G.,Ibbotson,R.G.,Ross,S.A.&Ross,S.A.1992,"Survivorshipbiasinperformancestudies",ReviewofFinancialStudies,vol.5,no.4.
Carhart,M.M.,Carpenter,J.N.,Lynch,A.W.&Musto,D.K.2002,"MutualFundSurvivorship",ReviewofFinancialStudies,vol.15,no.5,pp.1439.
Christensen,M.2003,EvaluatingDanishmutualfundperformance,DepartmentofFinance,FacultyofBusinessAdministration,TheAarhusSchoolofBusiness.
Christensen,M.2005,Danishmutualfundperformance:selectivity,markettimingandpersistence,AarhusSchoolofBusiness,DepartmentofAccounting,FinanceandLogistics,FinanceResearchGroup,Aarhus.
Christensen,M.2004,"Investeringsforeninger‐Erdersikrevindere?",Finans/Invest,vol.3,pp.11‐16.
Christensen,M.2003,"Investeringsforeninger‐Enanalyseafmarkettimingogselektion",Finans/Invest,vol.8,pp.11‐15.
Christensen,M.2003,"Performanceevalueringafdanskeinvesteringsforeninger",Finans/Invest,vol.4,pp.16‐21.
Christensen,M.(ed)2001,Benchmarking:påtværsaffaggrænser,Jurist‐ogØkonomforbundetsForlag,København.
Christensen,M.,f.1962&Pedersen,F.,f.19472009,Aktieinvestering:teoriogpraktiskanvendelse,3.udgaveedn,Jurist‐ogØkonomforbundet,Kbh.
DanskInvesteringsforening2011,"Åretsinvesteringsforeninger",Aktionæren,vol.April,pp.8‐12.
Elton,E.J.,Elton,E.J.,Gruber,M.J.,Gruber,M.J.,Blake,C.R.&Blake,C.R.1996,"Survivorbiasandmutualfundperformance",ReviewofFinancialStudies,vol.9,no.4.
Elton,E.J.,Elton,E.J.,Gruber,M.J.,Gruber,M.J.,Das,S.,Das,S.,Hlavka,M.&Hlavka,M.1993,"Efficiencywithcostlyinformation:areinterpretationofevidencefrommanagedportfolios",ReviewofFinancialStudies,vol.6,no.1.
Fama,E.F.1991,"EfficientCapitalMarkets:II",JournalofFinance,vol.46,no.5,pp.1575‐
Page69
1617.
Fama,E.F.1970,"EfficientCapitalMarkets:aReviewofTheoryandEmpiricalWork",JournalofFinance,vol.25,no.2,pp.383‐417.
GRANT,D.1977,"PortfolioPerformanceandthe"Cost"ofTimingDecisions",JournalofFinance,vol.32,no.3,pp.837‐846.
Grinblatt,M.&Titman,S.1993,"Performancemeasurementwithoutbenchmarks:Anexaminationofmutualfundreturns",JournalofBusiness,vol.66,no.1,pp.47.
Henriksson,R.D.&Merton,R.C.1981,"OnMarketTimingandInvestmentPerformance",JournalofBusiness,vol.54,no.4,pp.513‐533.
InvesteringsForeningsRådetApril2010,InvesteringsForeningsRådetsomkostningsanalyse2010,InvesteringsForeningsRådet,www.ifr.dk.
Ippolito,R.A.1989,"EfficiencywithCostlyInformation:aStudyofMutualFundPerformance,1965‐1984",QuarterlyJournalofEconomics,vol.104,no.1,pp.1‐23.
Jensen,M.C.1967,"ThePerformanceOfMutualFundsInThePeriod1945‐1964",JournalofFinance,vol.23,no.2,pp.389‐416.
Malkiel,B.G.1995,"ReturnsfromInvestinginEquityMutualFunds1971to1991",JournalofFinance,vol.50,no.2,pp.549‐572.
Moffett,M.H.,Stonehill,A.I.&Eiteman,D.K.2009‐2010,Fundamentalsofmultinationalfinance,3.ed.edn,Addison‐Wesley,Boston.
MullinsJr.,D.W.1982,"Doesthecapitalassetpricingmodelwork?",Harvardbusinessreview,vol.60,no.1,pp.105.
Roll,R.1977,"Acritiqueoftheassetpricingtheory'stestsPartI:Onpastandpotentialtestabilityofthetheory",JournalofFinancialEconomics,vol.4,no.2,pp.129‐176.
SHARPE,W.F.1964,"CapitalAssetPrices:aTheoryofMarketEquilibriumUnderConditionsofRisk",JournalofFinance,vol.19,no.3,pp.425‐442.
Treynor,J.L.&Mazuy,K.K.1966,"CanMutualFundsOutguesstheMarket?",Harvardbusinessreview,vol.44,no.4,pp.131‐136.
Wooldridge, J.M.,1960‐ 2008, Introductory econometrics : a modern approach, 4. ed. edn,
South‐Western,Mason,Ohio.
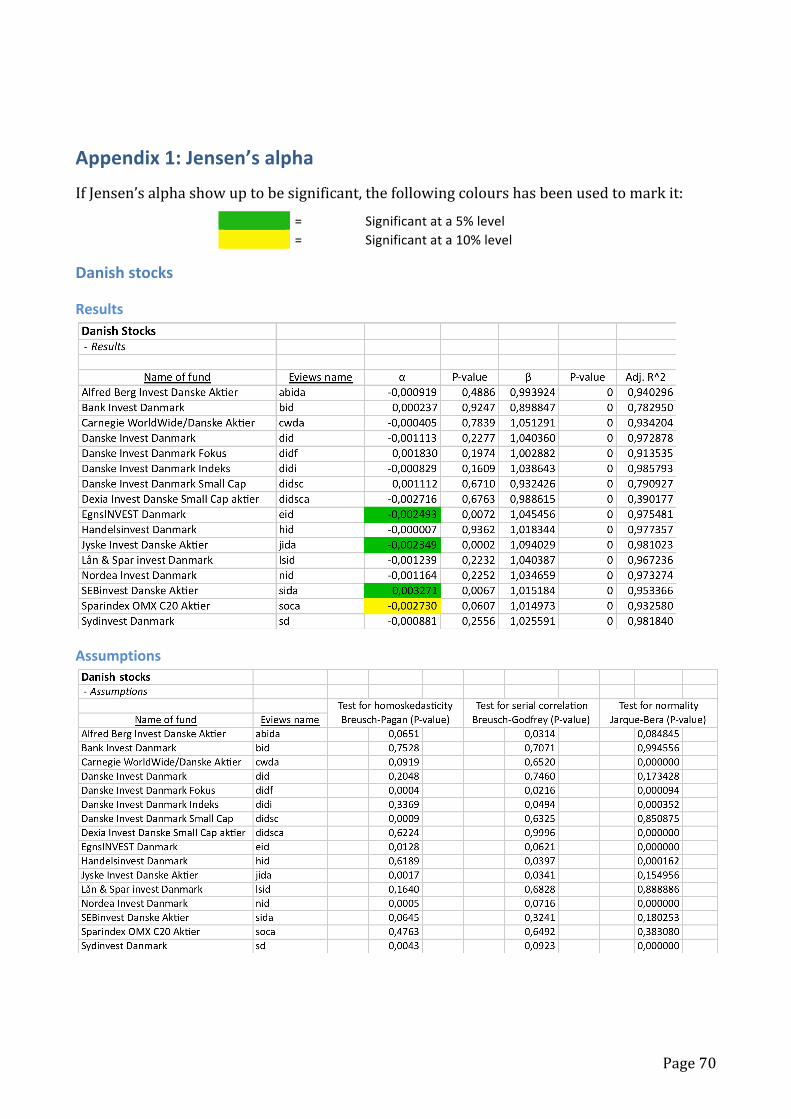
Page70
Appendix1:Jensen’salpha
IfJensen’salphashowuptobesignificant,thefollowingcolourshasbeenusedtomarkit:
= Significantata5%level = Significantata10%level
Danishstocks
Results
Assumptions
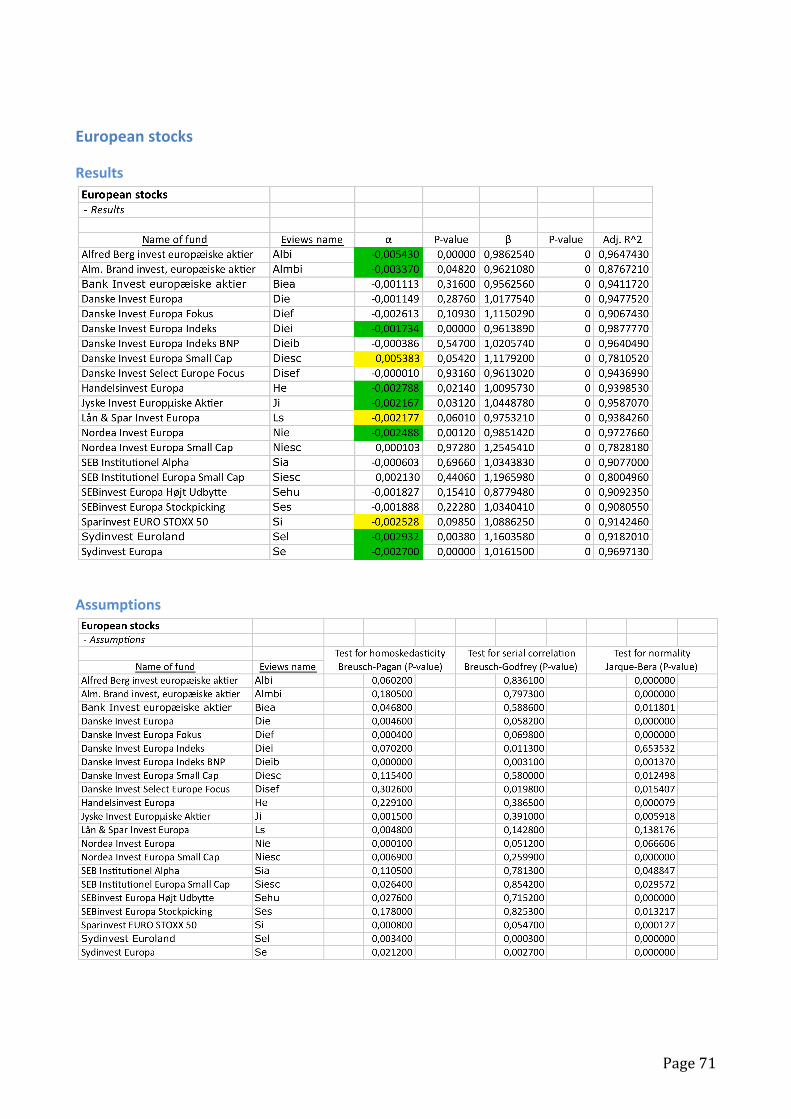
Page71
Europeanstocks
Results
Assumptions
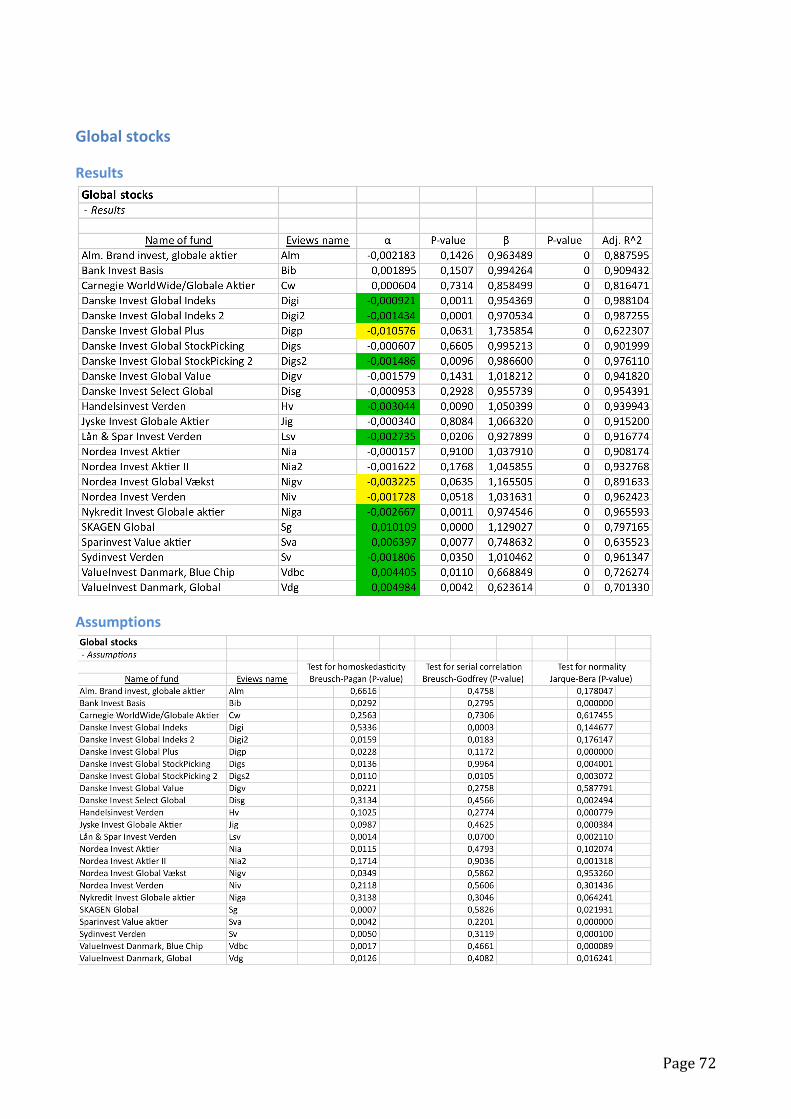
Page72
Globalstocks
Results
Assumptions
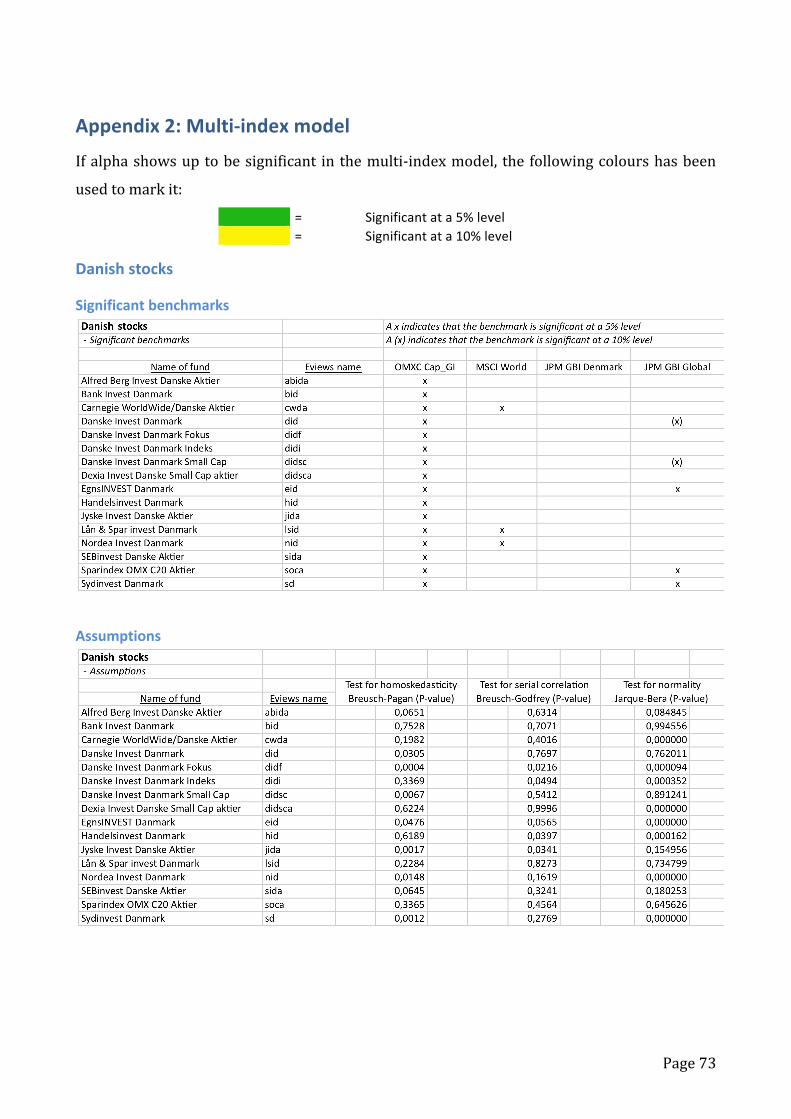
Page73
Appendix2:Multi‐indexmodel
Ifalphashowsuptobesignificant in themulti‐indexmodel, the followingcolourshasbeen
usedtomarkit:
= Significantata5%level = Significantata10%level
Danishstocks
Significantbenchmarks
Assumptions
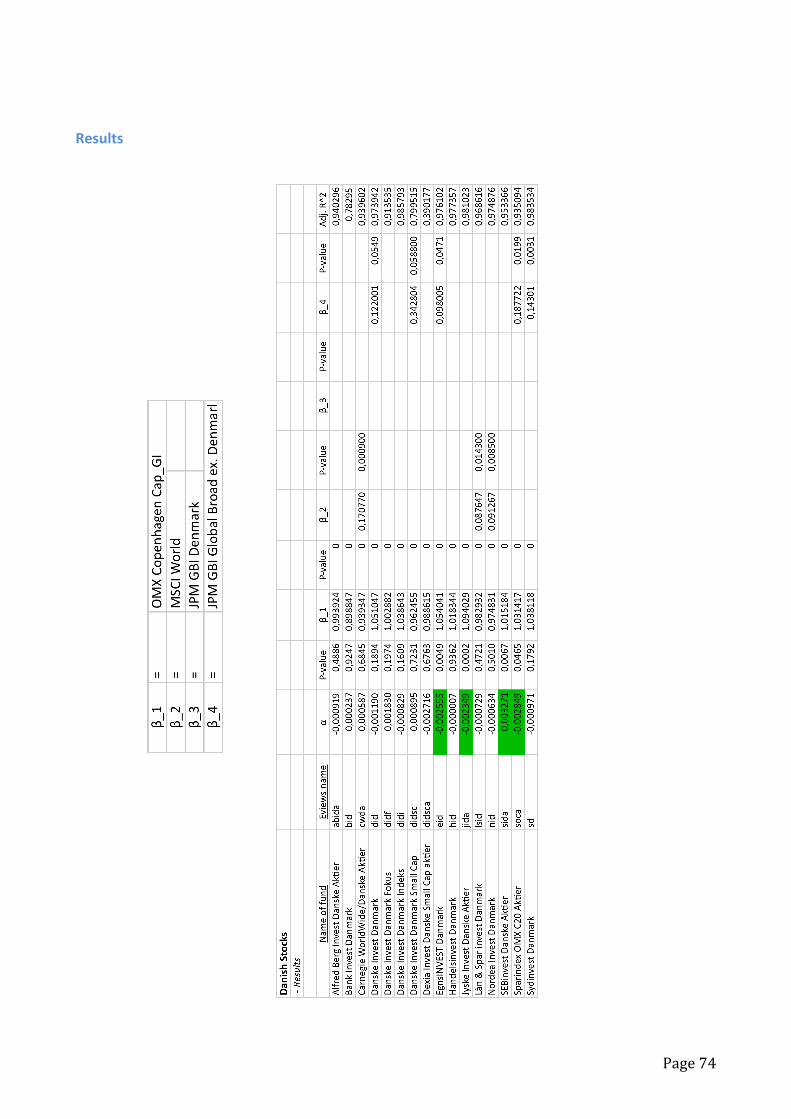
Page74
Results
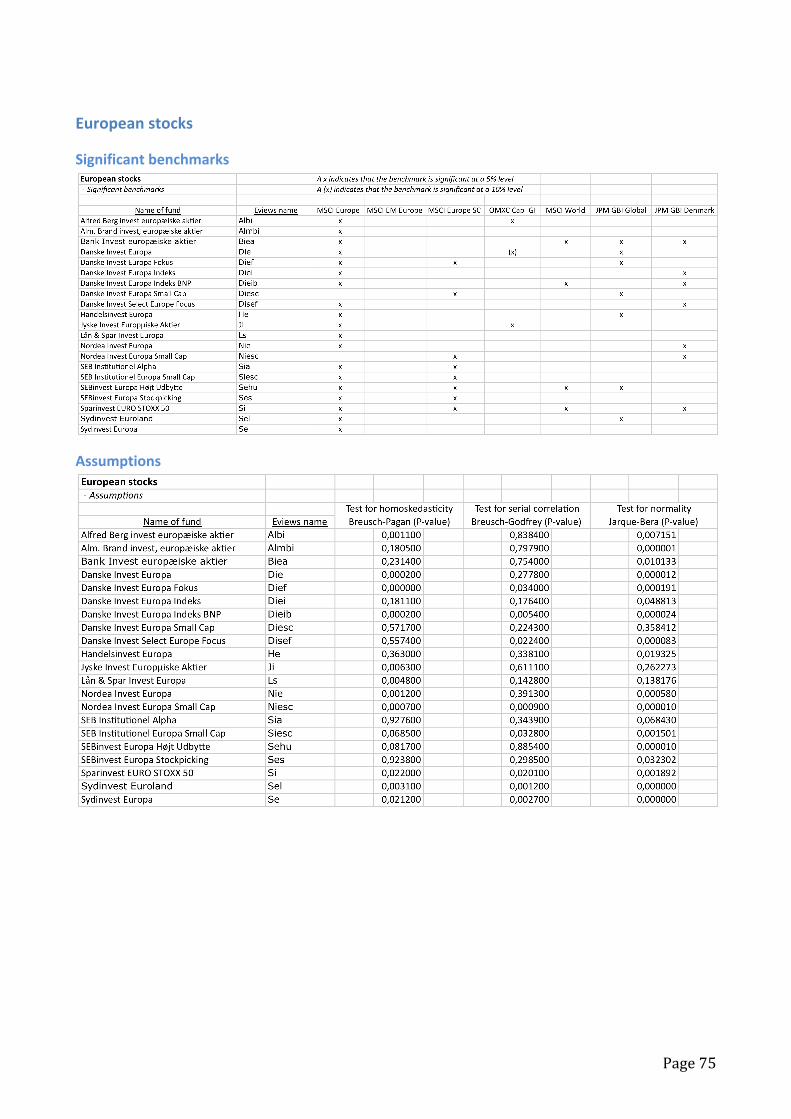
Page75
Europeanstocks
Significantbenchmarks
Assumptions
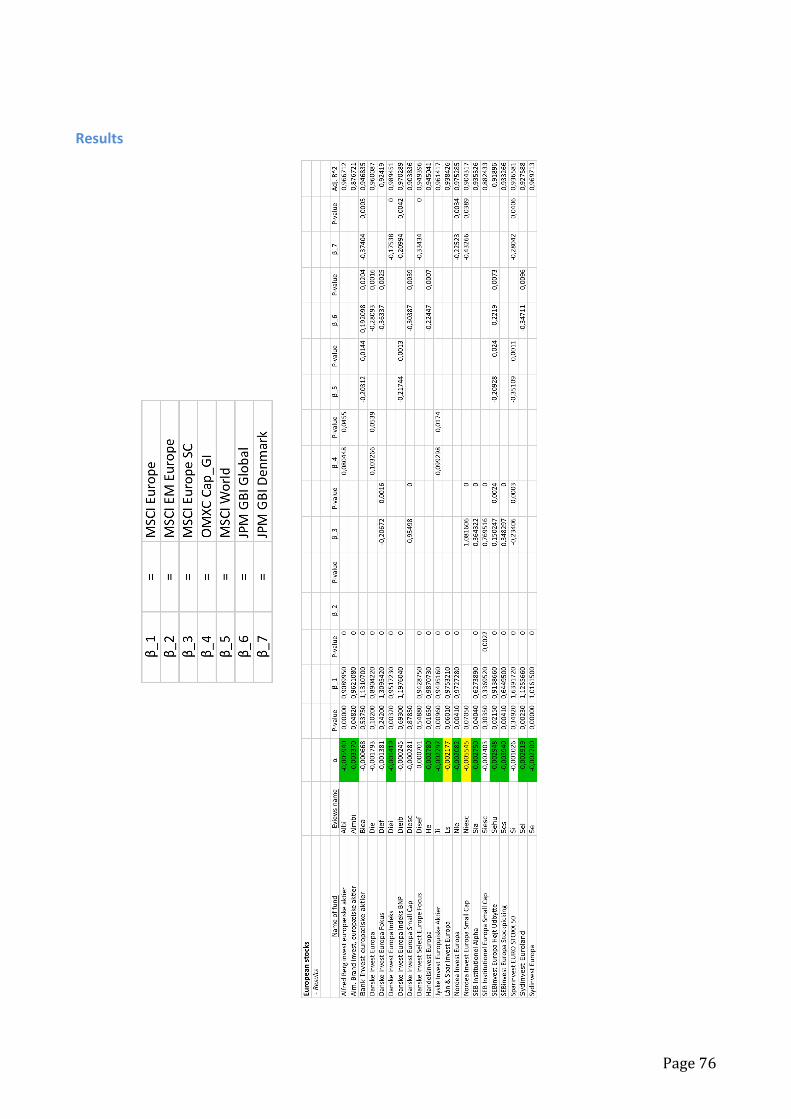
Page76
Results
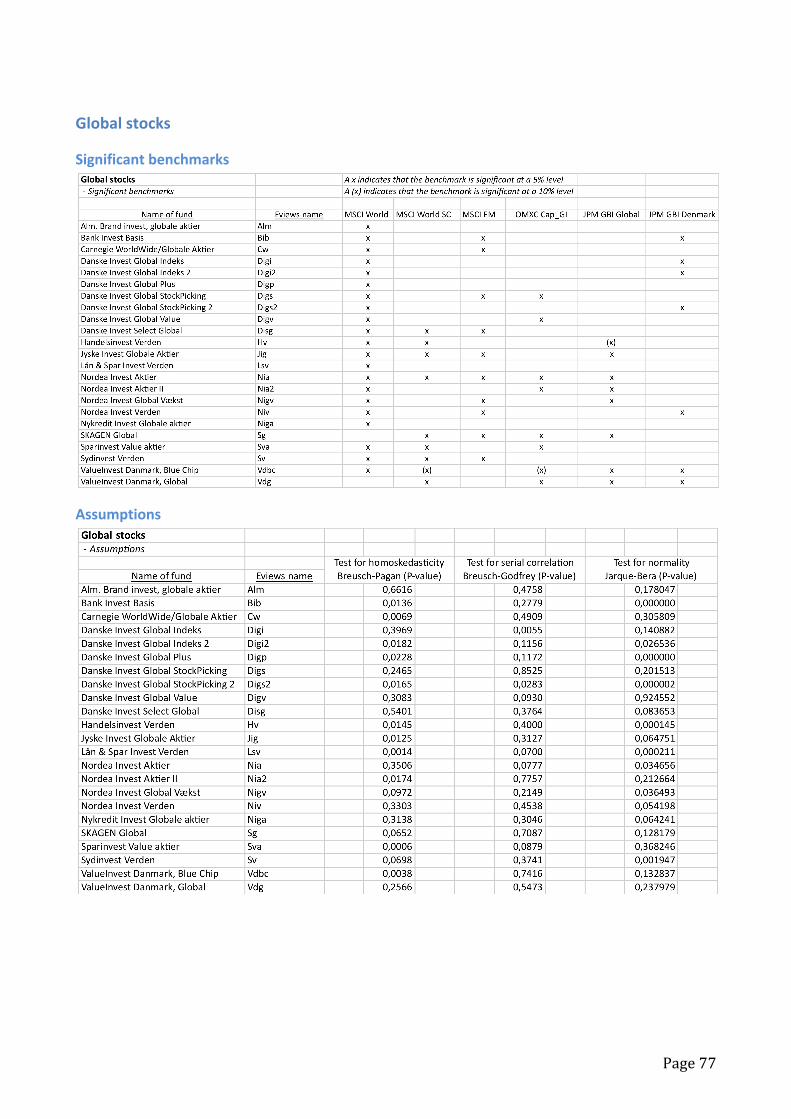
Page77
Globalstocks
Significantbenchmarks
Assumptions
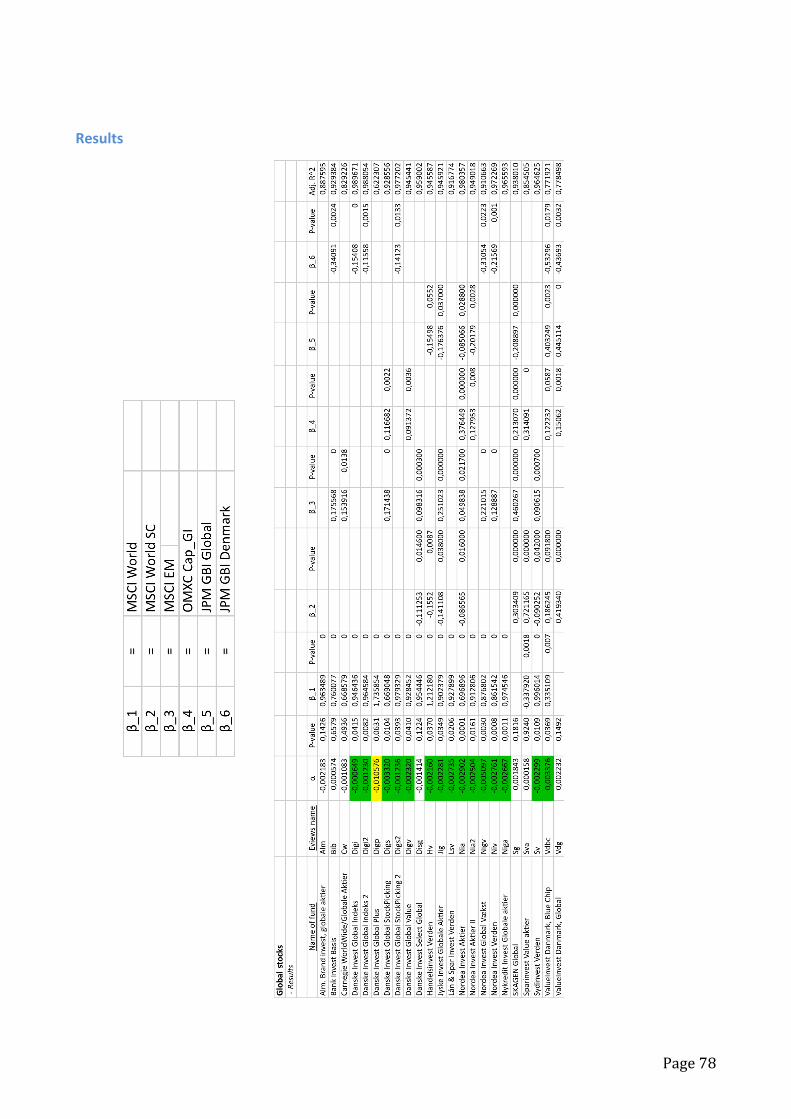
Page78
Results
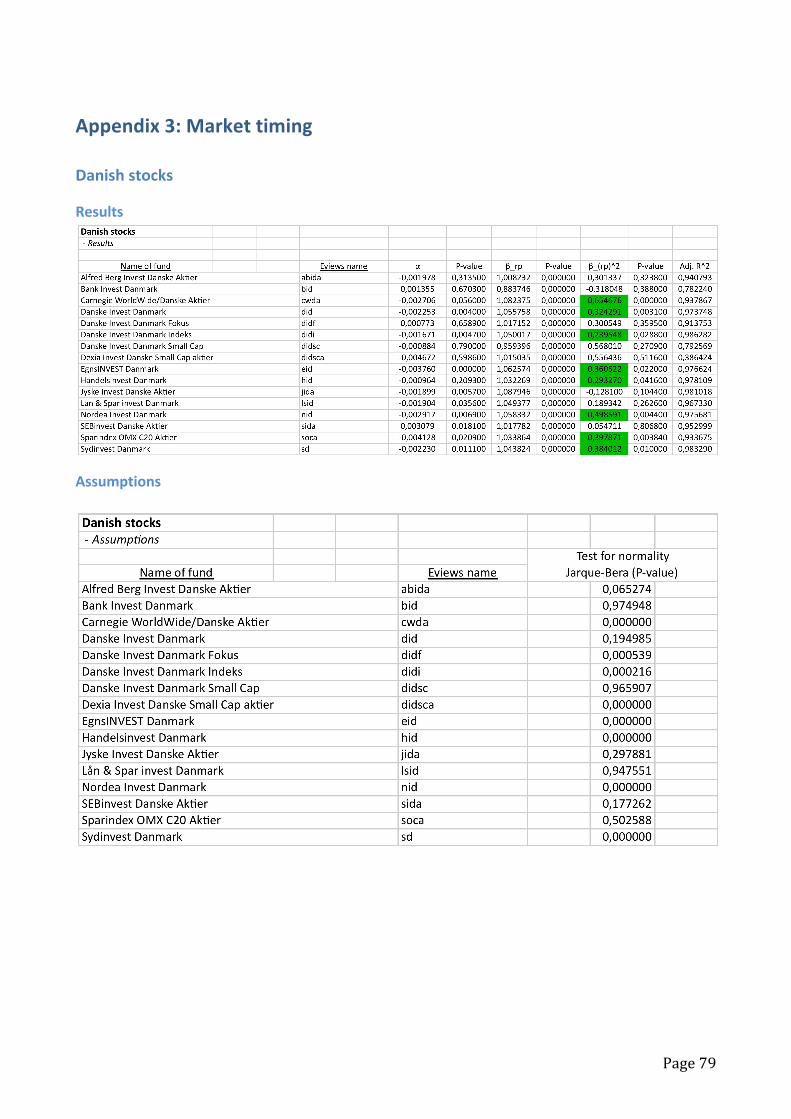
Page79
Appendix3:Markettiming
Danishstocks
Results
Assumptions
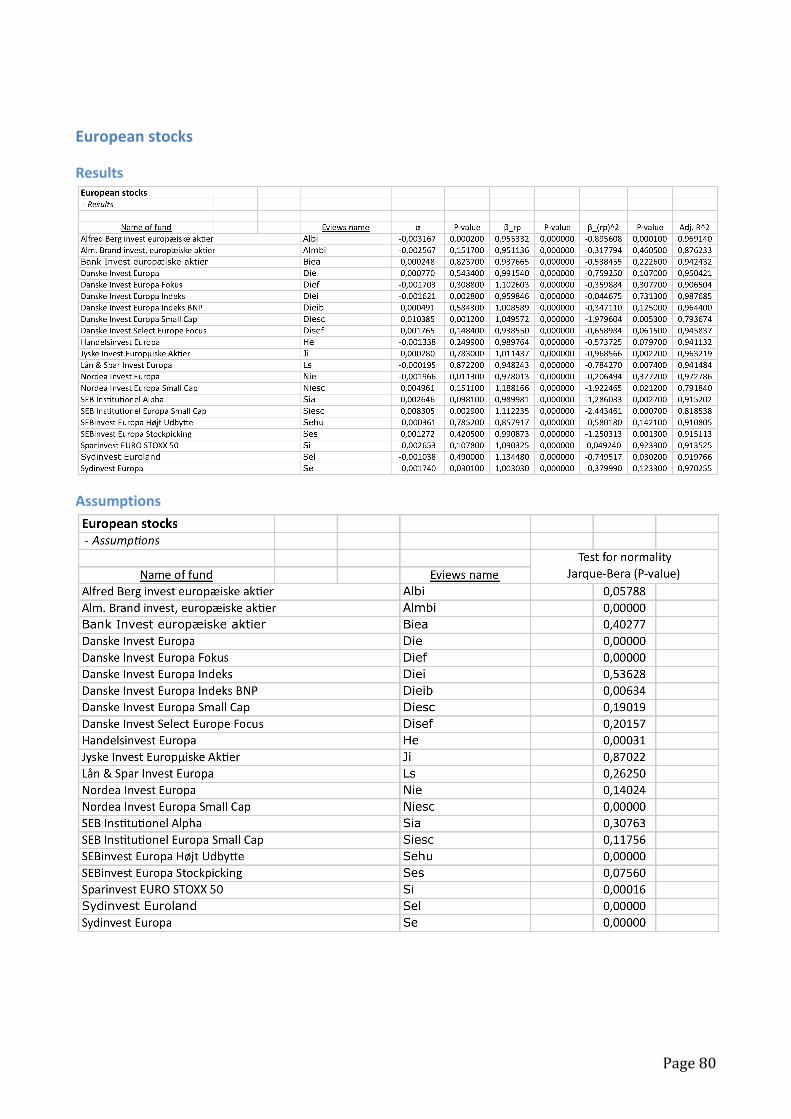
Page80
Europeanstocks
Results
Assumptions
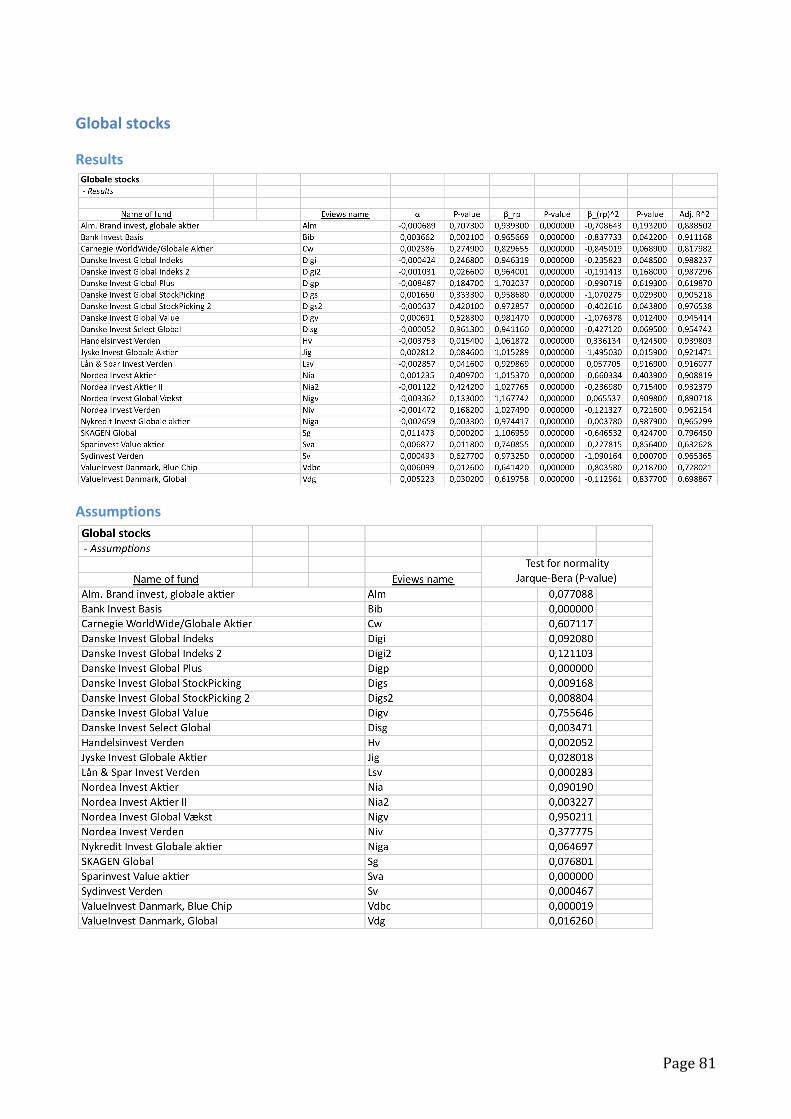
Page81
Globalstocks
Results
Assumptions
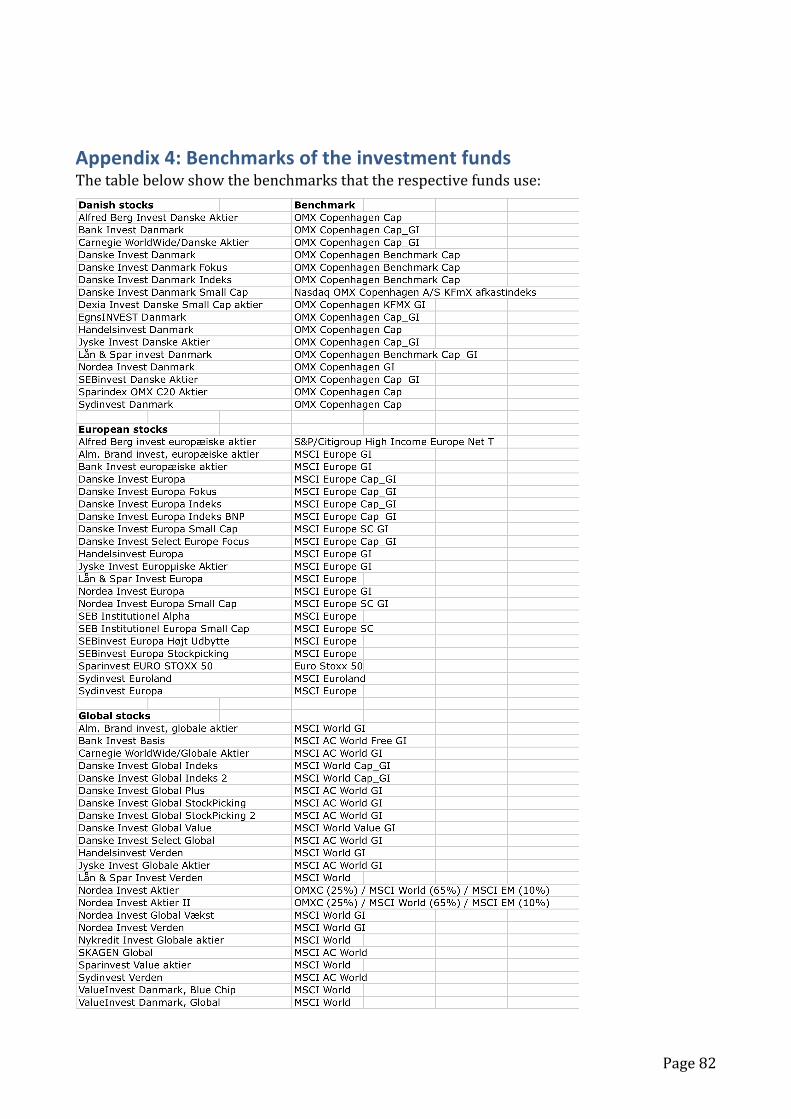
Page82
Appendix4:BenchmarksoftheinvestmentfundsThetablebelowshowthebenchmarksthattherespectivefundsuse: