Embed Size (px)
Citation preview
HAL Id: hal-00919880https://hal.archives-ouvertes.fr/hal-00919880
Submitted on 17 Dec 2013
HAL is a multi-disciplinary open accessarchive for the deposit and dissemination of sci-entific research documents, whether they are pub-lished or not. The documents may come fromteaching and research institutions in France orabroad, or from public or private research centers.
L’archive ouverte pluridisciplinaire HAL, estdestinée au dépôt et à la diffusion de documentsscientifiques de niveau recherche, publiés ou non,émanant des établissements d’enseignement et derecherche français ou étrangers, des laboratoirespublics ou privés.
A study on PDC drill bits qualityMalik Yahiaoui, Laurent Gerbaud, Jean-Yves Paris, Jean Denape, Alfazazi
Dourfaye
To cite this version:Malik Yahiaoui, Laurent Gerbaud, Jean-Yves Paris, Jean Denape, Alfazazi Dourfaye. A study onPDC drill bits quality. Wear, Elsevier, 2013, vol. 298-299, pp. 32-41. �10.1016/j.wear.2012.12.026�.�hal-00919880�
Open Archive TOULOUSE Archive Ouverte (OATAO) OATAO is an open access repository that collects the work of Toulouse researchers and
makes it freely available over the web where possible.
This is an author-deposited version published in : http://oatao.univ-toulouse.fr/
Eprints ID : 10546
To link to this article : DOI : 10.1016/j.wear.2012.12.026
URL : http://dx.doi.org/10.1016/j.wear.2012.12.026
To cite this version : Yahiaoui, Malik and Gerbaud, Laurent and
Paris, Jean-Yves and Denape, Jean and Dourfaye, Alfazazi A study
on PDC drill bits quality. (2013) Wear, vol. 298-299 . pp. 32-41.
ISSN 0043-1648Any correspondance concerning this service should
be sent to the repository administrator: [email protected]
toulouse.fr
A study on PDC drill bits quality
M. Yahiaoui a,n, L. Gerbaud b, J.-Y. Paris a, J. Denape a, A. Dourfaye c
a Laboratoire Genie de Production, Universite de Toulouse, Ecole Nationale d’Ingenieurs de Tarbes, 47 avenue d’Azereix 65016 Tarbes, Franceb Centre de Geosciences, Mines Paritech, Francec Varel Europe, France
Keywords:
PDC cutters
Wear rate
Quality factor
Cobalt carbide
Residual stresses
Leaching
a b s t r a c t
The quality of innovating PDC (Polycrystalline Diamond Compact) bits materials needs to be
determined with accuracy by measuring cutting efficiency and wear rate, both related to the overall
mechanical properties. An original approach is developed to encompass cutting efficiency and wear
contribution to the overall sample quality. Therefore, a lathe-type test device was used to abrade
specific samples from various manufacturers. Post-experiment analyzes are based on models establish-
ing coupled relationships between cutting and friction stresses related to the drag bits excavation
mechanism. These models are implemented in order to evaluate cutting efficiency and to estimate wear
of the diamond insert. Phase analysis by XRD and finite element simulations were performed to explain
the role of physicochemical parameters on the calculated quality factor values. Four main properties of
PDC material were studied to explain quality results obtained in this study: cobalt content in samples
that characterizes hardness/fracture toughness compromise, undesired phase as tungsten carbide
weakening diamond structure, diamond grains sizes and residual stresses distribution affecting
abrasion resistance.
1. Introduction
The main tools employed in the drilling industry are roller cone
and drag bits. Roller cone bits work by impact excavation and are
currently used in hard rock formations because of a convenient wear
resistance. Drag bits rather operate by shear mode in softer rock to
medium hard formations. Nevertheless, they suffer from thermal
abrasive wear and impact damage while drilling interbedded forma-
tions. As excavation rate is directly related to the overall cost, the
drag bits using PDC (Polycrystalline Diamond Compact) cutters are
really attractive compared to roller cone bits. In fact, PDC bits could
drill twice faster and longer than roller bits even in hard forma-
tions [1]. Petroleum and hydrothermal investigations in deep geolo-
gical formations lead to manufacturing new bits materials able to
drill at higher temperature, in more abrasive and harder geological
fields. Such innovating materials, sintering processes and design,
recently developed to improve drill bits hardness and fracture
toughness, also require new strategies in quality assessment. Drag
bits are mostly damaged by abrasion [2] and thus quality can be
defined by twomain parameters: materials wear rate and excavation
performance. Wear rate calculus by Archard’s model has been
commonly used in several works to describe PDC/rock behavior [3].
Excavation performance depends on cutting efficiency which is
initially determined by the sample depth of cut. During friction,
cutting efficiency evolves and the change is closely linked to wear
flat formation on PDC cutters. Because a long bit life could be related
to a poor cutting performance and vice versa, this paper proposes an
objective quality criterion to clearly classify PDC cutters. Drilling
mechanisms and material analyzes are taken into consideration to
interpret the grading of the testing bits.
2. PDC samples
Six cutters coming from various manufacturers (referred from A
to F) were selected to represent a large range of properties. Cutters
are made of a tungsten carbide cylinder surmounted by a diamond
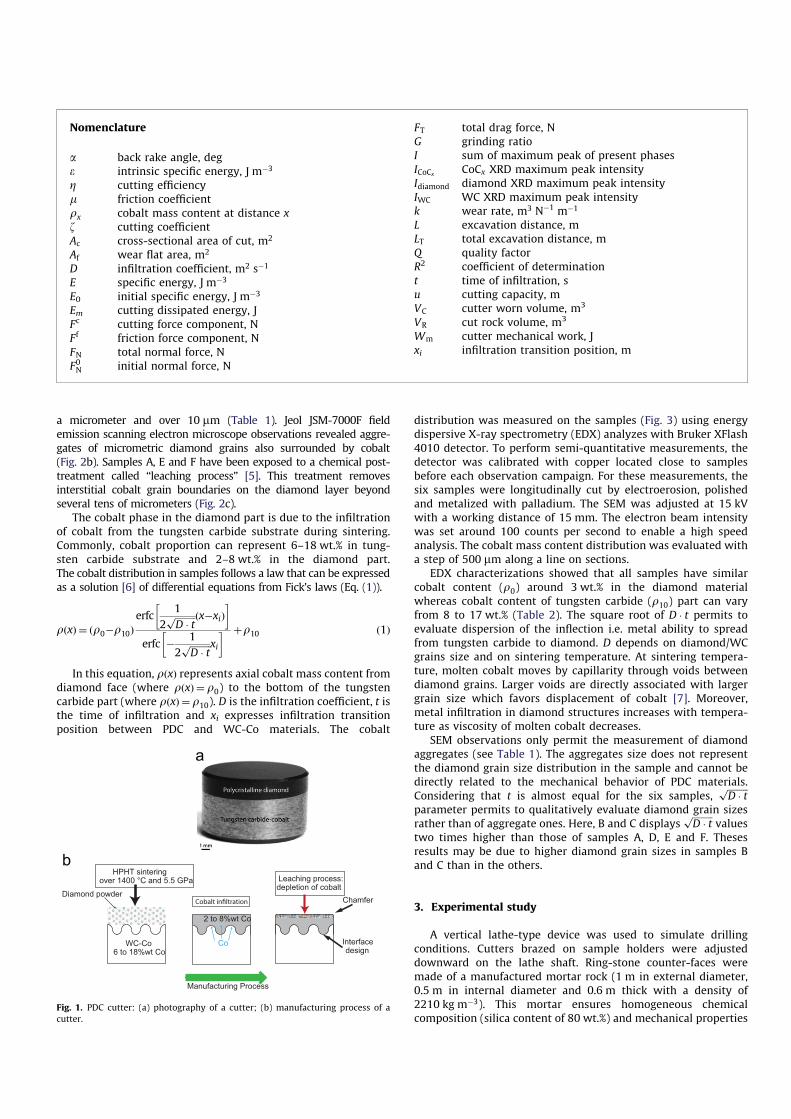
table (Fig. 1a). Material parts have a diameter of 13 mm: the
tungsten carbide cylinder has a height of 8 mm and the diamond
layer is around 2 mm thick. Diamond tables have a chamfer of
451�0.4 mm except for sample C where it is 451�0.7 mm. These
cutters were sintered by HPHT (i.e. High Temperature and High
Pressure) at a temperature over 1400 1C under a pressure close to
5.5 GPa (Fig. 1b) [4].
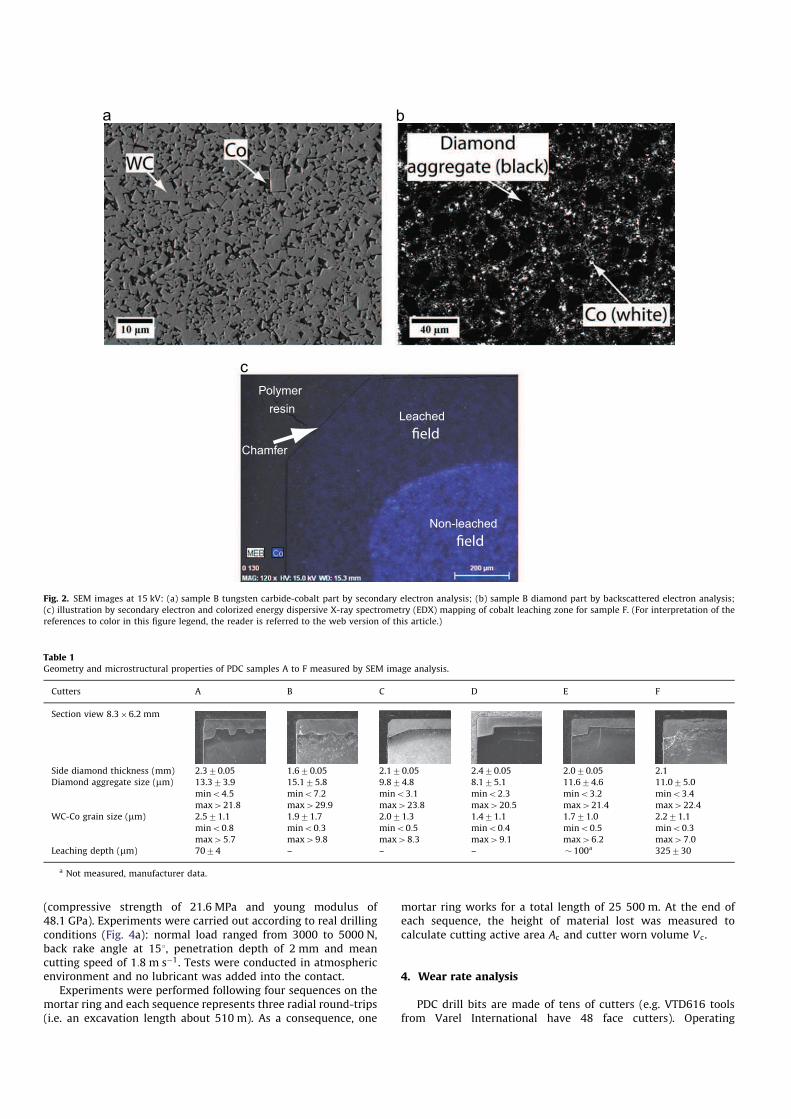
Tungsten carbide prismatic grains in a binder cobalt phase form
the substrate part (Fig. 2a). The mean grain size of tungsten carbide is
around 2 mm with minimum and maximum values observable under
http://dx.doi.org/10.1016/j.wear.2012.12.026
n Corresponding author. Tel.: þ33 5624 42700; fax: þ33 5624 42708.
E-mail addresses: [email protected],
[email protected] (M. Yahiaoui).
a micrometer and over 10 mm (Table 1). Jeol JSM-7000F field
emission scanning electron microscope observations revealed aggre-
gates of micrometric diamond grains also surrounded by cobalt
(Fig. 2b). Samples A, E and F have been exposed to a chemical post-
treatment called ‘‘leaching process’’ [5]. This treatment removes
interstitial cobalt grain boundaries on the diamond layer beyond
several tens of micrometers (Fig. 2c).
The cobalt phase in the diamond part is due to the infiltration
of cobalt from the tungsten carbide substrate during sintering.
Commonly, cobalt proportion can represent 6–18 wt.% in tung-
sten carbide substrate and 2–8 wt.% in the diamond part.
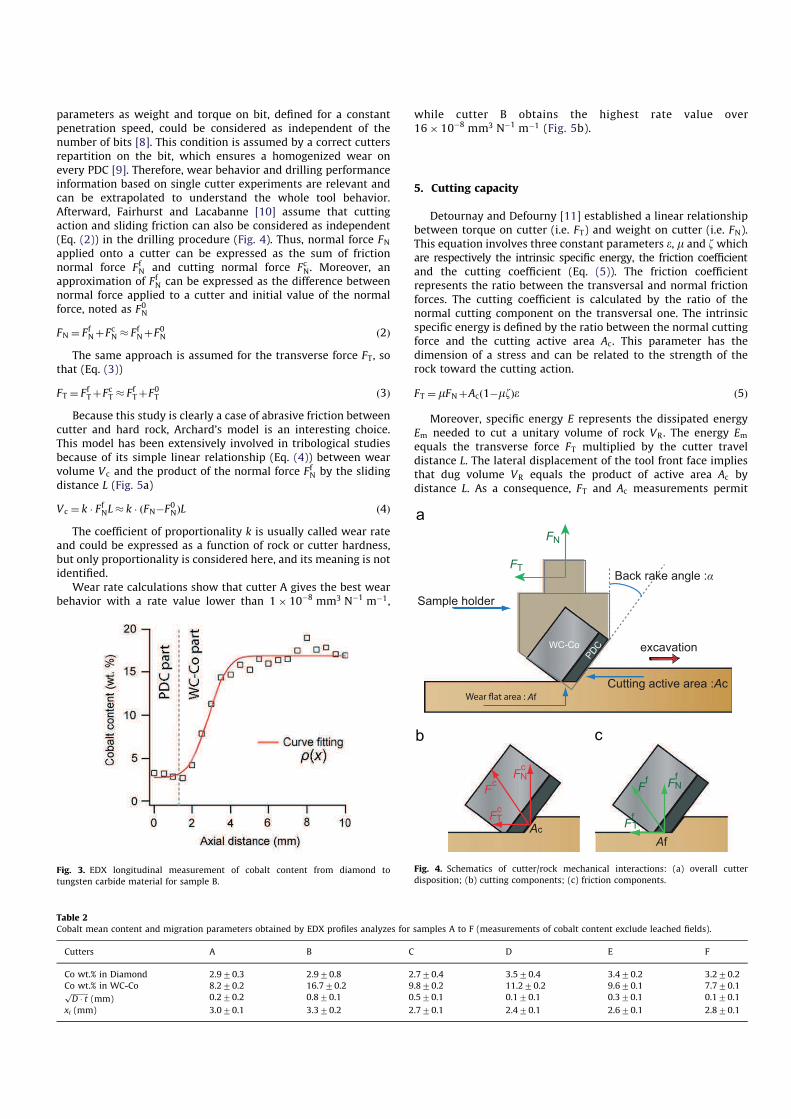
The cobalt distribution in samples follows a law that can be expressed
as a solution [6] of differential equations from Fick’s laws (Eq. (1)).
rðxÞ ¼ ðr0ÿr10Þerfc
1
2ffiffiffiffiffiffiffiffiffi
D � tp ðxÿxiÞ
� �
erfc ÿ 1
2ffiffiffiffiffiffiffiffiffi
D � tp xi
� � þr10 ð1Þ
In this equation, rðxÞ represents axial cobalt mass content from
diamond face (where rðxÞ ¼ r0) to the bottom of the tungsten
carbide part (where rðxÞ ¼ r10). D is the infiltration coefficient, t is
the time of infiltration and xi expresses infiltration transition
position between PDC and WC-Co materials. The cobalt
distribution was measured on the samples (Fig. 3) using energy
dispersive X-ray spectrometry (EDX) analyzes with Bruker XFlash
4010 detector. To perform semi-quantitative measurements, the
detector was calibrated with copper located close to samples
before each observation campaign. For these measurements, the
six samples were longitudinally cut by electroerosion, polished
and metalized with palladium. The SEM was adjusted at 15 kV
with a working distance of 15 mm. The electron beam intensity
was set around 100 counts per second to enable a high speed
analysis. The cobalt mass content distribution was evaluated with
a step of 500 mm along a line on sections.
EDX characterizations showed that all samples have similar
cobalt content (r0) around 3 wt.% in the diamond material
whereas cobalt content of tungsten carbide (r10) part can vary
from 8 to 17 wt.% (Table 2). The square root of D � t permits to
evaluate dispersion of the inflection i.e. metal ability to spread
from tungsten carbide to diamond. D depends on diamond/WC
grains size and on sintering temperature. At sintering tempera-
ture, molten cobalt moves by capillarity through voids between
diamond grains. Larger voids are directly associated with larger
grain size which favors displacement of cobalt [7]. Moreover,
metal infiltration in diamond structures increases with tempera-
ture as viscosity of molten cobalt decreases.
SEM observations only permit the measurement of diamond
aggregates (see Table 1). The aggregates size does not represent
the diamond grain size distribution in the sample and cannot be
directly related to the mechanical behavior of PDC materials.
Considering that t is almost equal for the six samples,ffiffiffiffiffiffiffiffiffi
D � tp
parameter permits to qualitatively evaluate diamond grain sizes
rather than of aggregate ones. Here, B and C displaysffiffiffiffiffiffiffiffiffi
D � tp
values
two times higher than those of samples A, D, E and F. Theses
results may be due to higher diamond grain sizes in samples B
and C than in the others.
3. Experimental study
A vertical lathe-type device was used to simulate drilling
conditions. Cutters brazed on sample holders were adjusted
downward on the lathe shaft. Ring-stone counter-faces were
made of a manufactured mortar rock (1 m in external diameter,
0.5 m in internal diameter and 0.6 m thick with a density of
2210 kg mÿ3). This mortar ensures homogeneous chemical
composition (silica content of 80 wt.%) and mechanical properties
Nomenclature
a back rake angle, deg
e intrinsic specific energy, J mÿ3
Z cutting efficiency
m friction coefficient
rx cobalt mass content at distance x
z cutting coefficient
Ac cross-sectional area of cut, m2
Af wear flat area, m2
D infiltration coefficient, m2 sÿ1
E specific energy, J mÿ3
E0 initial specific energy, J mÿ3
Em cutting dissipated energy, J
Fc cutting force component, N
Ff friction force component, N
FN total normal force, N
F0N initial normal force, N
FT total drag force, N
G grinding ratio
I sum of maximum peak of present phases
ICoCxCoCx XRD maximum peak intensity
Idiamond diamond XRD maximum peak intensity
IWC WC XRD maximum peak intensity
k wear rate, m3 Nÿ1 mÿ1
L excavation distance, m
LT total excavation distance, m
Q quality factor
R2 coefficient of determination
t time of infiltration, s
u cutting capacity, m
VC cutter worn volume, m3
VR cut rock volume, m3
Wm cutter mechanical work, J
xi infiltration transition position, m
Diamond powder
WC-Co6 to 18%wt Co
HPHT sintering over 1400 °C and 5.5 GPa
2 to 8%wt Co
Manufacturing Process
Chamfer
Leaching process:depletion of cobalt
Co Interfacedesign
Fig. 1. PDC cutter: (a) photography of a cutter; (b) manufacturing process of a
cutter.
(compressive strength of 21.6 MPa and young modulus of
48.1 GPa). Experiments were carried out according to real drilling
conditions (Fig. 4a): normal load ranged from 3000 to 5000 N,
back rake angle at 151, penetration depth of 2 mm and mean
cutting speed of 1:8 m sÿ1. Tests were conducted in atmospheric
environment and no lubricant was added into the contact.
Experiments were performed following four sequences on the
mortar ring and each sequence represents three radial round-trips
(i.e. an excavation length about 510 m). As a consequence, one
mortar ring works for a total length of 25 500 m. At the end of
each sequence, the height of material lost was measured to
calculate cutting active area Ac and cutter worn volume Vc.
4. Wear rate analysis
PDC drill bits are made of tens of cutters (e.g. VTD616 tools
from Varel International have 48 face cutters). Operating
Polymer
resin
Chamfer
Leached
Non-leached
Fig. 2. SEM images at 15 kV: (a) sample B tungsten carbide-cobalt part by secondary electron analysis; (b) sample B diamond part by backscattered electron analysis;
(c) illustration by secondary electron and colorized energy dispersive X-ray spectrometry (EDX) mapping of cobalt leaching zone for sample F. (For interpretation of the
references to color in this figure legend, the reader is referred to the web version of this article.)
Table 1
Geometry and microstructural properties of PDC samples A to F measured by SEM image analysis.
Cutters A B C D E F
Section view 8.3�6.2 mm
Side diamond thickness (mm) 2.370.05 1.670.05 2.170.05 2.470.05 2.070.05 2.1
Diamond aggregate size (mm) 13.373.9 15.175.8 9.874.8 8.175.1 11.674.6 11.075.0
mino4:5 mino7:2 mino3:1 mino2:3 mino3:2 mino3:4
max421:8 max429:9 max423:8 max420:5 max421:4 max422:4
WC-Co grain size (mm) 2.571.1 1.971.7 2.071.3 1.471.1 1.771.0 2.271.1
mino0:8 mino0:3 mino0:5 mino0:4 mino0:5 mino0:3
max45:7 max49:8 max48:3 max49:1 max46:2 max47:0
Leaching depth (mm) 7074 – – – � 100a 325730
a Not measured, manufacturer data.
parameters as weight and torque on bit, defined for a constant
penetration speed, could be considered as independent of the
number of bits [8]. This condition is assumed by a correct cutters
repartition on the bit, which ensures a homogenized wear on
every PDC [9]. Therefore, wear behavior and drilling performance
information based on single cutter experiments are relevant and
can be extrapolated to understand the whole tool behavior.
Afterward, Fairhurst and Lacabanne [10] assume that cutting
action and sliding friction can also be considered as independent
(Eq. (2)) in the drilling procedure (Fig. 4). Thus, normal force FNapplied onto a cutter can be expressed as the sum of friction
normal force FfN and cutting normal force FcN. Moreover, an
approximation of FfN can be expressed as the difference between
normal force applied to a cutter and initial value of the normal
force, noted as F0N
FN ¼ FfNþFcN � FfNþF0N ð2Þ
The same approach is assumed for the transverse force FT, so
that (Eq. (3))
FT ¼ FfTþFcT � FfTþF0T ð3Þ
Because this study is clearly a case of abrasive friction between
cutter and hard rock, Archard’s model is an interesting choice.
This model has been extensively involved in tribological studies
because of its simple linear relationship (Eq. (4)) between wear
volume Vc and the product of the normal force FfN by the sliding
distance L (Fig. 5a)
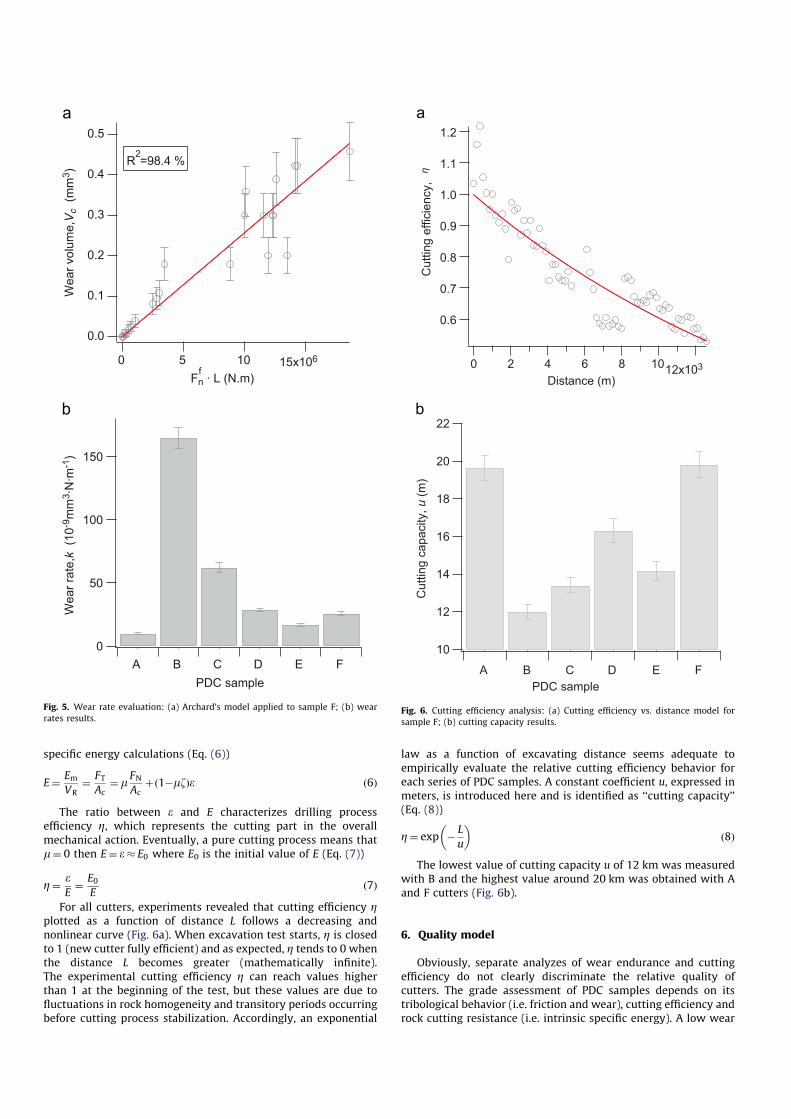
Vc ¼ k � FfNL� k � ðFNÿF0NÞL ð4Þ
The coefficient of proportionality k is usually called wear rate
and could be expressed as a function of rock or cutter hardness,
but only proportionality is considered here, and its meaning is not
identified.
Wear rate calculations show that cutter A gives the best wear
behavior with a rate value lower than 1� 10ÿ8 mm3 Nÿ1 mÿ1,
while cutter B obtains the highest rate value over
16� 10ÿ8 mm3 Nÿ1 mÿ1 (Fig. 5b).
5. Cutting capacity
Detournay and Defourny [11] established a linear relationship
between torque on cutter (i.e. FT) and weight on cutter (i.e. FN).
This equation involves three constant parameters e, m and zwhich
are respectively the intrinsic specific energy, the friction coefficient
and the cutting coefficient (Eq. (5)). The friction coefficient
represents the ratio between the transversal and normal friction
forces. The cutting coefficient is calculated by the ratio of the
normal cutting component on the transversal one. The intrinsic
specific energy is defined by the ratio between the normal cutting
force and the cutting active area Ac. This parameter has the
dimension of a stress and can be related to the strength of the
rock toward the cutting action.
FT ¼ mFNþAcð1ÿmzÞe ð5Þ
Moreover, specific energy E represents the dissipated energy
Em needed to cut a unitary volume of rock VR . The energy Emequals the transverse force FT multiplied by the cutter travel
distance L. The lateral displacement of the tool front face implies
that dug volume VR equals the product of active area Ac by
distance L. As a consequence, FT and Ac measurements permit
Fig. 3. EDX longitudinal measurement of cobalt content from diamond to
tungsten carbide material for sample B.
Table 2
Cobalt mean content and migration parameters obtained by EDX profiles analyzes for samples A to F (measurements of cobalt content exclude leached fields).
Cutters A B C D E F
Co wt.% in Diamond 2.970.3 2.970.8 2.770.4 3.570.4 3.470.2 3.270.2
Co wt.% in WC-Co 8.270.2 16.770.2 9.870.2 11.270.2 9.670.1 7.770.1ffiffiffiffiffiffiffiffiffi
D � tp
(mm) 0.270.2 0.870.1 0.570.1 0.170.1 0.370.1 0.170.1
xi (mm) 3.070.1 3.370.2 2.770.1 2.470.1 2.670.1 2.870.1
Sample holder
WC-Co
FN
FT
excavation
Cutting active area :Ac
Back rake angle :α PDC
Af
Fc
Ac
FcN
FcT
Ff
Af
FfN
FfT
Fig. 4. Schematics of cutter/rock mechanical interactions: (a) overall cutter
disposition; (b) cutting components; (c) friction components.
specific energy calculations (Eq. (6))
E¼ Em
VR¼ FT
Ac¼ m
FN
Acþð1ÿmzÞe ð6Þ
The ratio between e and E characterizes drilling process
efficiency Z, which represents the cutting part in the overall
mechanical action. Eventually, a pure cutting process means that
m¼ 0 then E¼ e� E0 where E0 is the initial value of E (Eq. (7))
Z¼ e
E¼ E0
Eð7Þ
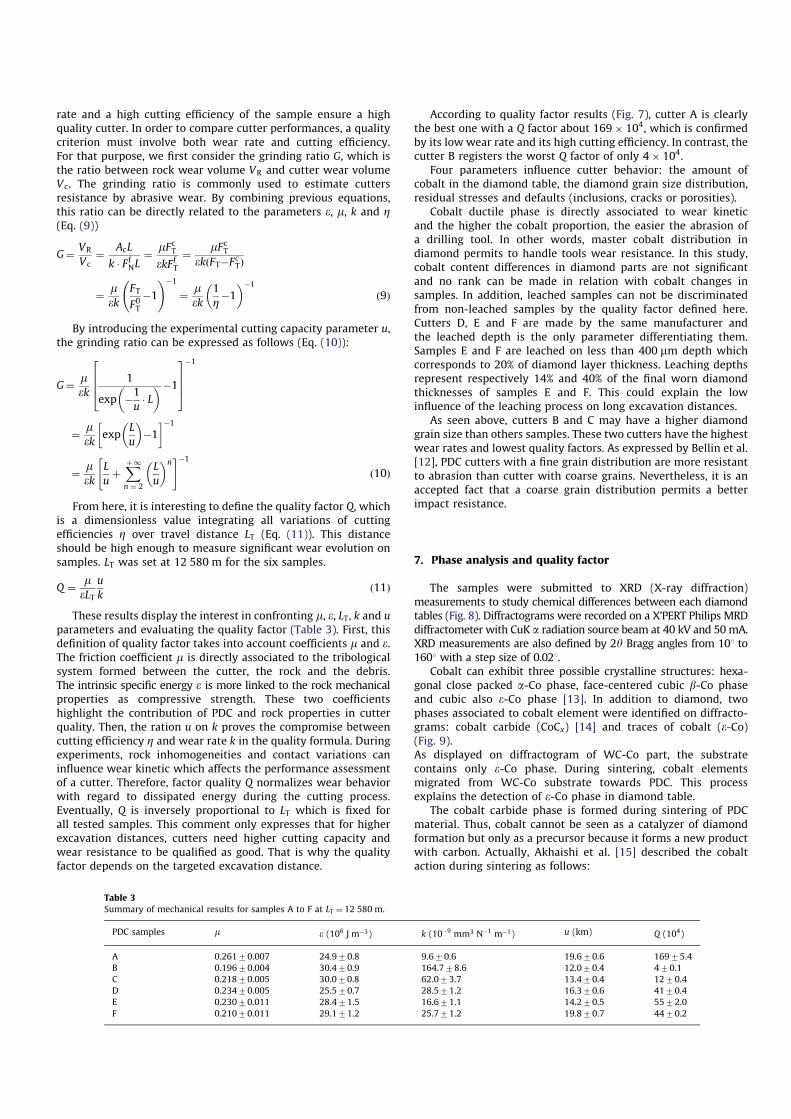
For all cutters, experiments revealed that cutting efficiency Zplotted as a function of distance L follows a decreasing and
nonlinear curve (Fig. 6a). When excavation test starts, Z is closed
to 1 (new cutter fully efficient) and as expected, Z tends to 0 when
the distance L becomes greater (mathematically infinite).
The experimental cutting efficiency Z can reach values higher
than 1 at the beginning of the test, but these values are due to
fluctuations in rock homogeneity and transitory periods occurring
before cutting process stabilization. Accordingly, an exponential
law as a function of excavating distance seems adequate to
empirically evaluate the relative cutting efficiency behavior for
each series of PDC samples. A constant coefficient u, expressed in
meters, is introduced here and is identified as ‘‘cutting capacity’’
(Eq. (8))
Z¼ exp ÿ L
u
� �
ð8Þ
The lowest value of cutting capacity u of 12 km was measured
with B and the highest value around 20 km was obtained with A
and F cutters (Fig. 6b).
6. Quality model
Obviously, separate analyzes of wear endurance and cutting
efficiency do not clearly discriminate the relative quality of
cutters. The grade assessment of PDC samples depends on its
tribological behavior (i.e. friction and wear), cutting efficiency and
rock cutting resistance (i.e. intrinsic specific energy). A low wear
0.5
0.4
0.3
0.2
0.1
0.0
We
ar
vo
lum
e,V
c
(mm
3)
15x1061050
Fn · L (N.m)f
R2=98.4 %
150
100
50
0
We
ar
rate
,k
(10
-9m
m3·N
·m-1
)
A B C D E F
PDC sample
Fig. 5. Wear rate evaluation: (a) Archard’s model applied to sample F; (b) wear
rates results.
1.2
1.1
1.0
0.9
0.8
0.7
0.6
12x1031086420
Distance (m)
Cu
ttin
g e
ffic
ien
cy,
22
20
18
16
14
12
10
Cu
ttin
g c
ap
acity,
u (
m)
A B C D E F
PDC sample
Fig. 6. Cutting efficiency analysis: (a) Cutting efficiency vs. distance model for
sample F; (b) cutting capacity results.
rate and a high cutting efficiency of the sample ensure a high
quality cutter. In order to compare cutter performances, a quality
criterion must involve both wear rate and cutting efficiency.
For that purpose, we first consider the grinding ratio G, which is
the ratio between rock wear volume VR and cutter wear volume
Vc. The grinding ratio is commonly used to estimate cutters
resistance by abrasive wear. By combining previous equations,
this ratio can be directly related to the parameters e, m, k and Z(Eq. (9))
G¼ VR
Vc¼ AcL
k � FfNL¼ mFcTekFfT
¼ mFcTekðFTÿFcTÞ
¼ m
ek
FT
F0Tÿ1
!ÿ1
¼ m
ek
1
Zÿ1
� �ÿ1
ð9Þ
By introducing the experimental cutting capacity parameter u,
the grinding ratio can be expressed as follows (Eq. (10)):
G¼ m
ek
1
exp ÿ1
u� L
� �ÿ1
2
6
6
4
3
7
7
5
ÿ1
¼ m
ekexp
L
u
� �
ÿ1
� �ÿ1
¼ m
ek
L
uþX
þ1
n ¼ 2
L
u
� �n" #ÿ1
ð10Þ
From here, it is interesting to define the quality factor Q, which
is a dimensionless value integrating all variations of cutting
efficiencies Z over travel distance LT (Eq. (11)). This distance
should be high enough to measure significant wear evolution on
samples. LT was set at 12 580 m for the six samples.
Q ¼ m
eLT
u
kð11Þ
These results display the interest in confronting m, e, LT, k and u
parameters and evaluating the quality factor (Table 3). First, this
definition of quality factor takes into account coefficients m and e.The friction coefficient m is directly associated to the tribological
system formed between the cutter, the rock and the debris.
The intrinsic specific energy e is more linked to the rock mechanical
properties as compressive strength. These two coefficients
highlight the contribution of PDC and rock properties in cutter
quality. Then, the ration u on k proves the compromise between
cutting efficiency Z and wear rate k in the quality formula. During
experiments, rock inhomogeneities and contact variations can
influence wear kinetic which affects the performance assessment
of a cutter. Therefore, factor quality Q normalizes wear behavior
with regard to dissipated energy during the cutting process.
Eventually, Q is inversely proportional to LT which is fixed for
all tested samples. This comment only expresses that for higher
excavation distances, cutters need higher cutting capacity and
wear resistance to be qualified as good. That is why the quality
factor depends on the targeted excavation distance.
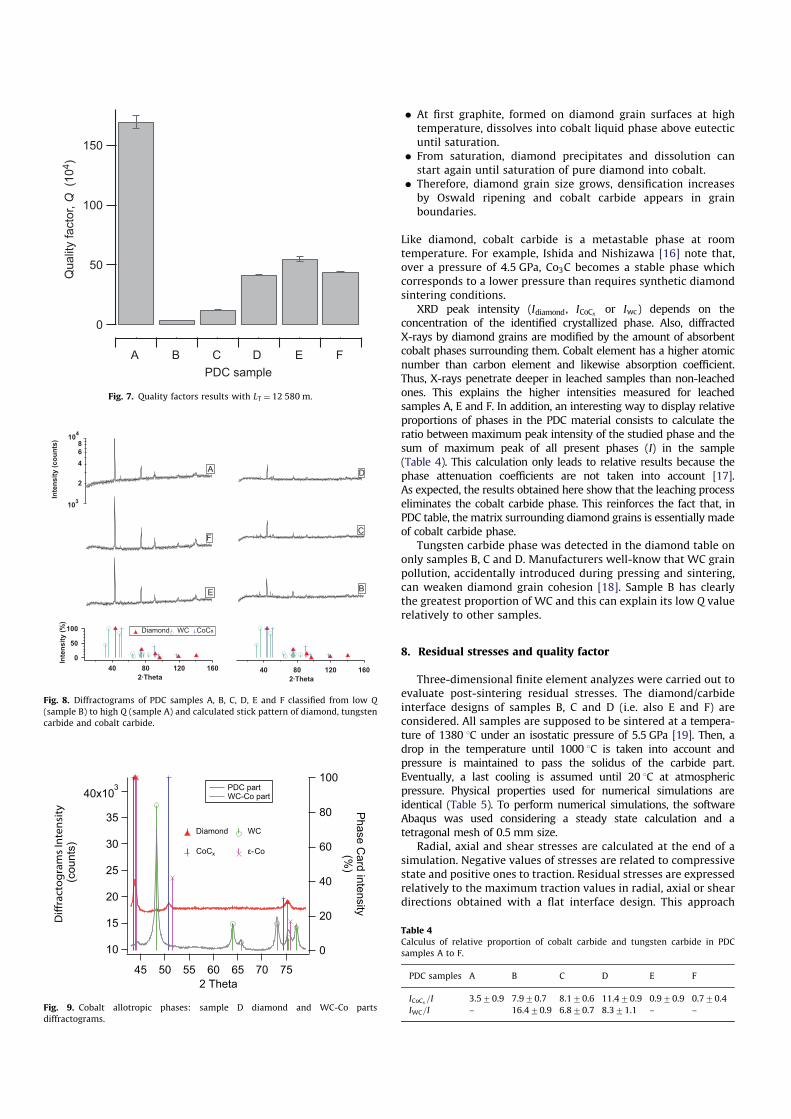
According to quality factor results (Fig. 7), cutter A is clearly
the best one with a Q factor about 169� 104, which is confirmed
by its low wear rate and its high cutting efficiency. In contrast, the
cutter B registers the worst Q factor of only 4� 104.
Four parameters influence cutter behavior: the amount of
cobalt in the diamond table, the diamond grain size distribution,
residual stresses and defaults (inclusions, cracks or porosities).
Cobalt ductile phase is directly associated to wear kinetic
and the higher the cobalt proportion, the easier the abrasion of
a drilling tool. In other words, master cobalt distribution in
diamond permits to handle tools wear resistance. In this study,
cobalt content differences in diamond parts are not significant
and no rank can be made in relation with cobalt changes in
samples. In addition, leached samples can not be discriminated
from non-leached samples by the quality factor defined here.
Cutters D, E and F are made by the same manufacturer and
the leached depth is the only parameter differentiating them.
Samples E and F are leached on less than 400 mm depth which
corresponds to 20% of diamond layer thickness. Leaching depths
represent respectively 14% and 40% of the final worn diamond
thicknesses of samples E and F. This could explain the low
influence of the leaching process on long excavation distances.
As seen above, cutters B and C may have a higher diamond
grain size than others samples. These two cutters have the highest
wear rates and lowest quality factors. As expressed by Bellin et al.
[12], PDC cutters with a fine grain distribution are more resistant
to abrasion than cutter with coarse grains. Nevertheless, it is an
accepted fact that a coarse grain distribution permits a better
impact resistance.
7. Phase analysis and quality factor
The samples were submitted to XRD (X-ray diffraction)
measurements to study chemical differences between each diamond
tables (Fig. 8). Diffractograms were recorded on a X’PERT Philips MRD
diffractometer with CuK a radiation source beam at 40 kV and 50mA.
XRD measurements are also defined by 2y Bragg angles from 101 to
1601 with a step size of 0.021.
Cobalt can exhibit three possible crystalline structures: hexa-
gonal close packed a-Co phase, face-centered cubic b-Co phase
and cubic also e-Co phase [13]. In addition to diamond, two
phases associated to cobalt element were identified on diffracto-
grams: cobalt carbide (CoCx) [14] and traces of cobalt (e-Co)(Fig. 9).
As displayed on diffractogram of WC-Co part, the substrate
contains only e-Co phase. During sintering, cobalt elements
migrated from WC-Co substrate towards PDC. This process
explains the detection of e-Co phase in diamond table.
The cobalt carbide phase is formed during sintering of PDC
material. Thus, cobalt cannot be seen as a catalyzer of diamond
formation but only as a precursor because it forms a new product
with carbon. Actually, Akhaishi et al. [15] described the cobalt
action during sintering as follows:
Table 3
Summary of mechanical results for samples A to F at LT ¼ 12 580 m.
PDC samples m e (106 J mÿ3) k (10ÿ9 mm3 Nÿ1 mÿ1) u (km) Q (104)
A 0.26170.007 24.970.8 9.670.6 19.670.6 16975.4
B 0.19670.004 30.470.9 164.778.6 12.070.4 470.1
C 0.21870.005 30.070.8 62.073.7 13.470.4 1270.4
D 0.23470.005 25.570.7 28.571.2 16.370.6 4170.4
E 0.23070.011 28.471.5 16.671.1 14.270.5 5572.0
F 0.21070.011 29.171.2 25.771.2 19.870.7 4470.2
� At first graphite, formed on diamond grain surfaces at high
temperature, dissolves into cobalt liquid phase above eutectic
until saturation.
� From saturation, diamond precipitates and dissolution can
start again until saturation of pure diamond into cobalt.
� Therefore, diamond grain size grows, densification increases
by Oswald ripening and cobalt carbide appears in grain
boundaries.
Like diamond, cobalt carbide is a metastable phase at room
temperature. For example, Ishida and Nishizawa [16] note that,
over a pressure of 4.5 GPa, Co3C becomes a stable phase which
corresponds to a lower pressure than requires synthetic diamond
sintering conditions.
XRD peak intensity (Idiamond, ICoCxor Iwc) depends on the
concentration of the identified crystallized phase. Also, diffracted
X-rays by diamond grains are modified by the amount of absorbent
cobalt phases surrounding them. Cobalt element has a higher atomic
number than carbon element and likewise absorption coefficient.
Thus, X-rays penetrate deeper in leached samples than non-leached
ones. This explains the higher intensities measured for leached
samples A, E and F. In addition, an interesting way to display relative
proportions of phases in the PDC material consists to calculate the
ratio between maximum peak intensity of the studied phase and the
sum of maximum peak of all present phases (I) in the sample
(Table 4). This calculation only leads to relative results because the
phase attenuation coefficients are not taken into account [17].
As expected, the results obtained here show that the leaching process
eliminates the cobalt carbide phase. This reinforces the fact that, in
PDC table, the matrix surrounding diamond grains is essentially made
of cobalt carbide phase.
Tungsten carbide phase was detected in the diamond table on
only samples B, C and D. Manufacturers well-know that WC grain
pollution, accidentally introduced during pressing and sintering,
can weaken diamond grain cohesion [18]. Sample B has clearly
the greatest proportion of WC and this can explain its low Q value
relatively to other samples.
8. Residual stresses and quality factor
Three-dimensional finite element analyzes were carried out to
evaluate post-sintering residual stresses. The diamond/carbide
interface designs of samples B, C and D (i.e. also E and F) are
considered. All samples are supposed to be sintered at a tempera-
ture of 1380 1C under an isostatic pressure of 5.5 GPa [19]. Then, a
drop in the temperature until 1000 1C is taken into account and
pressure is maintained to pass the solidus of the carbide part.
Eventually, a last cooling is assumed until 20 1C at atmospheric
pressure. Physical properties used for numerical simulations are
identical (Table 5). To perform numerical simulations, the software
Abaqus was used considering a steady state calculation and a
tetragonal mesh of 0.5 mm size.
Radial, axial and shear stresses are calculated at the end of a
simulation. Negative values of stresses are related to compressive
state and positive ones to traction. Residual stresses are expressed
relatively to the maximum traction values in radial, axial or shear
directions obtained with a flat interface design. This approach
E
C
B
1601208040
2·Theta
Inte
nsit
y (
co
un
ts)
103
2
4
68
104
A D
F
100
50
0Inte
nsit
y (
%)
1601208040
2·Theta
Diamond WC CoCx
Fig. 8. Diffractograms of PDC samples A, B, C, D, E and F classified from low Q
(sample B) to high Q (sample A) and calculated stick pattern of diamond, tungsten
carbide and cobalt carbide.
40x103
35
30
25
20
15
10
(counts
)
75706560555045
2 Theta
100
80
60
40
20
0
Phase C
ard
inte
nsity
(%)
PDC part WC-Co part
Diamond WC
CoCx ε-Co
Fig. 9. Cobalt allotropic phases: sample D diamond and WC-Co parts
diffractograms.
Table 4
Calculus of relative proportion of cobalt carbide and tungsten carbide in PDC
samples A to F.
PDC samples A B C D E F
ICoCx=I 3.570.9 7.970.7 8.170.6 11.470.9 0.970.9 0.770.4
IWC=I – 16.470.9 6.870.7 8.371.1 – –
150
100
50
0
Qu
alit
y f
acto
r, Q
(1
04)
A B C D E F
PDC sample
Fig. 7. Quality factors results with LT ¼ 12 580 m.
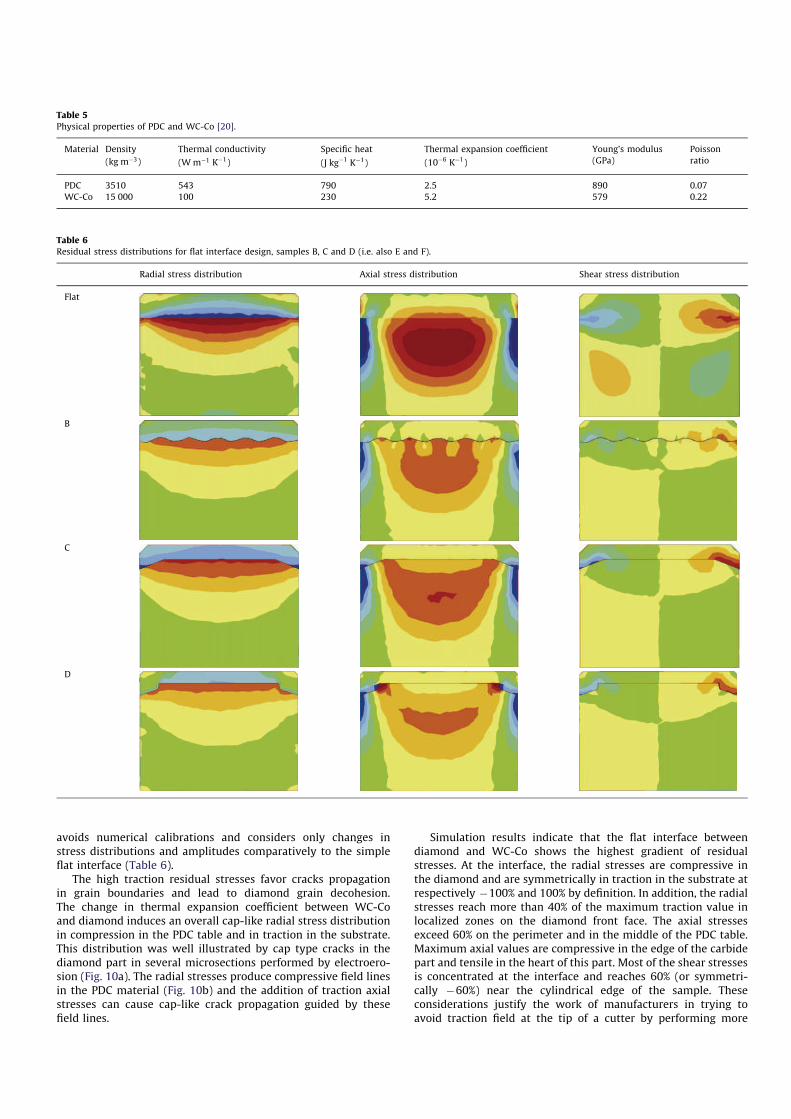
avoids numerical calibrations and considers only changes in
stress distributions and amplitudes comparatively to the simple
flat interface (Table 6).
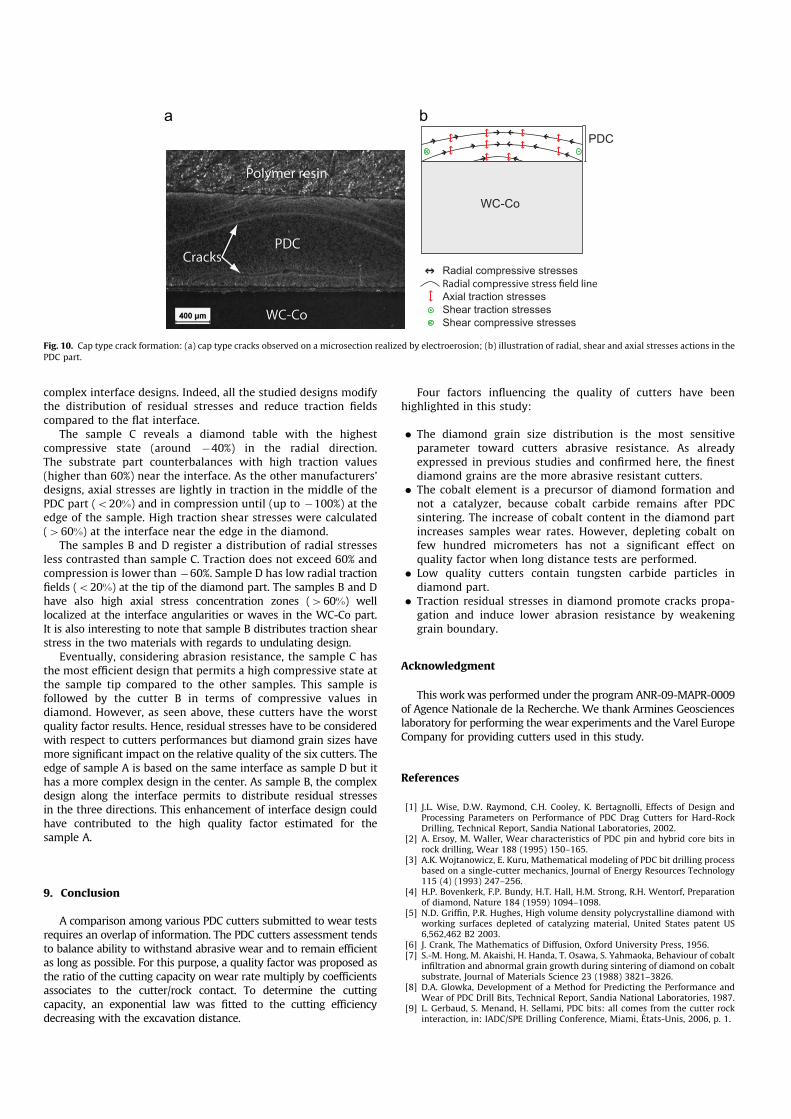
The high traction residual stresses favor cracks propagation
in grain boundaries and lead to diamond grain decohesion.
The change in thermal expansion coefficient between WC-Co
and diamond induces an overall cap-like radial stress distribution
in compression in the PDC table and in traction in the substrate.
This distribution was well illustrated by cap type cracks in the
diamond part in several microsections performed by electroero-
sion (Fig. 10a). The radial stresses produce compressive field lines
in the PDC material (Fig. 10b) and the addition of traction axial
stresses can cause cap-like crack propagation guided by these
field lines.
Simulation results indicate that the flat interface between
diamond and WC-Co shows the highest gradient of residual
stresses. At the interface, the radial stresses are compressive in
the diamond and are symmetrically in traction in the substrate at
respectively ÿ100% and 100% by definition. In addition, the radial
stresses reach more than 40% of the maximum traction value in
localized zones on the diamond front face. The axial stresses
exceed 60% on the perimeter and in the middle of the PDC table.
Maximum axial values are compressive in the edge of the carbide
part and tensile in the heart of this part. Most of the shear stresses
is concentrated at the interface and reaches 60% (or symmetri-
cally ÿ60%) near the cylindrical edge of the sample. These
considerations justify the work of manufacturers in trying to
avoid traction field at the tip of a cutter by performing more
Table 5
Physical properties of PDC and WC-Co [20].
Material Density
(kg mÿ3)
Thermal conductivity
(Wmÿ1 Kÿ1)
Specific heat
(J kgÿ1 Kÿ1)
Thermal expansion coefficient
(10ÿ6 Kÿ1)
Young’s modulus
(GPa)
Poisson
ratio
PDC 3510 543 790 2.5 890 0.07
WC-Co 15 000 100 230 5.2 579 0.22
Table 6
Residual stress distributions for flat interface design, samples B, C and D (i.e. also E and F).
Radial stress distribution Axial stress distribution Shear stress distribution
Flat
B
C
D
complex interface designs. Indeed, all the studied designs modify
the distribution of residual stresses and reduce traction fields
compared to the flat interface.
The sample C reveals a diamond table with the highest
compressive state (around ÿ40%) in the radial direction.
The substrate part counterbalances with high traction values
(higher than 60%) near the interface. As the other manufacturers’
designs, axial stresses are lightly in traction in the middle of the
PDC part (o20%) and in compression until (up to ÿ100%) at the
edge of the sample. High traction shear stresses were calculated
(460%) at the interface near the edge in the diamond.
The samples B and D register a distribution of radial stresses
less contrasted than sample C. Traction does not exceed 60% and
compression is lower than ÿ60%. Sample D has low radial traction
fields (o20%) at the tip of the diamond part. The samples B and D
have also high axial stress concentration zones (460%) well
localized at the interface angularities or waves in the WC-Co part.
It is also interesting to note that sample B distributes traction shear
stress in the two materials with regards to undulating design.
Eventually, considering abrasion resistance, the sample C has
the most efficient design that permits a high compressive state at
the sample tip compared to the other samples. This sample is
followed by the cutter B in terms of compressive values in
diamond. However, as seen above, these cutters have the worst
quality factor results. Hence, residual stresses have to be considered
with respect to cutters performances but diamond grain sizes have
more significant impact on the relative quality of the six cutters. The
edge of sample A is based on the same interface as sample D but it
has a more complex design in the center. As sample B, the complex
design along the interface permits to distribute residual stresses
in the three directions. This enhancement of interface design could
have contributed to the high quality factor estimated for the
sample A.
9. Conclusion
A comparison among various PDC cutters submitted to wear tests
requires an overlap of information. The PDC cutters assessment tends
to balance ability to withstand abrasive wear and to remain efficient
as long as possible. For this purpose, a quality factor was proposed as
the ratio of the cutting capacity on wear rate multiply by coefficients
associates to the cutter/rock contact. To determine the cutting
capacity, an exponential law was fitted to the cutting efficiency
decreasing with the excavation distance.
Four factors influencing the quality of cutters have been
highlighted in this study:
� The diamond grain size distribution is the most sensitive
parameter toward cutters abrasive resistance. As already
expressed in previous studies and confirmed here, the finest
diamond grains are the more abrasive resistant cutters.
� The cobalt element is a precursor of diamond formation and
not a catalyzer, because cobalt carbide remains after PDC
sintering. The increase of cobalt content in the diamond part
increases samples wear rates. However, depleting cobalt on
few hundred micrometers has not a significant effect on
quality factor when long distance tests are performed.
� Low quality cutters contain tungsten carbide particles in
diamond part.
� Traction residual stresses in diamond promote cracks propa-
gation and induce lower abrasion resistance by weakening
grain boundary.
Acknowledgment
This work was performed under the program ANR-09-MAPR-0009
of Agence Nationale de la Recherche. We thank Armines Geosciences
laboratory for performing the wear experiments and the Varel Europe
Company for providing cutters used in this study.
References
[1] J.L. Wise, D.W. Raymond, C.H. Cooley, K. Bertagnolli, Effects of Design andProcessing Parameters on Performance of PDC Drag Cutters for Hard-RockDrilling, Technical Report, Sandia National Laboratories, 2002.
[2] A. Ersoy, M. Waller, Wear characteristics of PDC pin and hybrid core bits inrock drilling, Wear 188 (1995) 150–165.
[3] A.K. Wojtanowicz, E. Kuru, Mathematical modeling of PDC bit drilling processbased on a single-cutter mechanics, Journal of Energy Resources Technology115 (4) (1993) 247–256.
[4] H.P. Bovenkerk, F.P. Bundy, H.T. Hall, H.M. Strong, R.H. Wentorf, Preparationof diamond, Nature 184 (1959) 1094–1098.
[5] N.D. Griffin, P.R. Hughes, High volume density polycrystalline diamond withworking surfaces depleted of catalyzing material, United States patent US6,562,462 B2 2003.
[6] J. Crank, The Mathematics of Diffusion, Oxford University Press, 1956.[7] S.-M. Hong, M. Akaishi, H. Handa, T. Osawa, S. Yahmaoka, Behaviour of cobalt
infiltration and abnormal grain growth during sintering of diamond on cobaltsubstrate, Journal of Materials Science 23 (1988) 3821–3826.
[8] D.A. Glowka, Development of a Method for Predicting the Performance andWear of PDC Drill Bits, Technical Report, Sandia National Laboratories, 1987.
[9] L. Gerbaud, S. Menand, H. Sellami, PDC bits: all comes from the cutter rockinteraction, in: IADC/SPE Drilling Conference, Miami, Etats-Unis, 2006, p. 1.
Radial compressive stresses
Axial traction stresses
Shear traction stresses
Shear compressive stresses
WC-Co
PDC
Fig. 10. Cap type crack formation: (a) cap type cracks observed on a microsection realized by electroerosion; (b) illustration of radial, shear and axial stresses actions in the
PDC part.

[10] C. Fairhurst, W. Lacabanne, Some principles and developments in hard rockdrilling techniques, in: Sixth Annual Drilling and Blasting Symposium, 1956,pp. 12–25.
[11] E. Detournay, P. Defourny, A phenomenological model for the drilling actionof drag bits, International Journal of Rock Mechanics & Mining Sciences andGeomechanics 29 (1992) 13–23.
[12] F. Bellin, A. Dourfaye, W. King, M. Thigpen, The current state of PDC bittechnology, World Oil (2010) 41–46.
[13] V.A. de la Pena O’Shea, I.P.R. de Moreira, A. Roldan, F. Illas, Electronic andmagnetic structure of bulk cobalt: the alpha, beta, and epsilon-phases fromdensity functional theory calculations, The Journal of Chemical Physics 133 (2)(2010) 024701.
[14] A. Badzian, A. Klokocki, JCPDS-ICDD XRD card CoCx 00-044-0962, 1981.[15] M. Akhaishi, H. Kanda, Y. Sato, N. Setaka, T. Ohsawa, O. Fukunaga, Sintering
behaviour of the diamond–cobalt system at high temperature and pressure,Journal of Materials Science 17 (1982) 193–198.
[16] K. Ishida, T. Nishizawa, The C–Co (carbon–cobalt) system, Journal of Phase
Equilibria 12 (1991) 417–424.[17] R.P. Goehner, M.C. Nichols, X-ray powder diffraction-quantitative analysis,
in: ASM Handbook, ASM International, 1986, pp. 693–695.[18] Z. Qi, The manufacture of PDC for cutting tools, Science and Technology of
New Diamond (1990) 415–416.[19] T.N. Butcher, R.M. Horton, S.R. Jurewicz, S.E. Scott, R.H. Smith, Polycrystalline
diamond cutters having modified residual stresses, United States patent US
6,220,375 B1, 2001.[20] F. Chen, G. Xu, C. Ma, G. Xu, Thermal residual stress of polycrystalline
diamond compacts, Transactions of Nonferrous Metals Society of China
(2010) 227–232.