Embed Size (px)
Citation preview
Volume 5, Number 1, January – March’ 2016
ISSN (Print): 2279-0977, (Online): 2279-0985
PEZZOTTAITE JOURNALS SJIF (2012): 3.23, SJIF (2013): 5.057, SJIF (2014): 5.871, SJIF (2015): 6.492
International Journal of Applied Services Marketing Perspectives© Pezzottaite Journals. 1953 |P a g e
IMPACT OF THE REFORM OF LIBERALIZATION ON EMPLOYEES' PRODUCTIVITY
OF ETHIOPIAN LEATHER INDUSTRY
Dr. Brehanu Borji1
ABSTRACT
Although the concept of productivity is a widely used subject by politicians, economists, engineers, and media, it is often
vaguely defined and poorly understood. In practice, this lack of knowledge results in productivity being ignored by those who
are preaching about it in order to influence production process. Thus, the objective of this study is to discuss the basic
meaning of the term “productivity” and its relation to employees’ motivation and performance. Moreover, the study attempted
to see whether a new reform has brought about any significant change on employees’ performance and resulted in higher
productivity than ever before. To this effect, the study employed secondary data collected from various sources as may be
shown under methodology. The collected data were substantiated using structured interview to officials at different posts
working in the industry. As the study used two matched samples pre- and post- liberalization periods, a paired t-test is used to
verify the set hypothesis using Microsoft Office Excel for computations. Finally, the study results indicated that a new
economic reform has brought about a significant change on productivity of employees of Ethiopian Leather Industry.
KEYWORDS
Productivity, Performance, Motivation, New Economic Reform, Leather Industry etc.
INTRODUCTION
The current global business arena has become highly competitive and competitiveness has become a major focus area of firms and
companies across the globe (Porter, 1990; IMD, 2006; WEF, 2007; Pillania, 2007; Pillania, 2008). Business organizations across
the world are under increasing pressure than ever before to stay dynamic and responsive in all their competitive frontiers because
of a new economic reform called ‘liberalization’. Organizations have to become efficient and effective in their operations in order
to survive, sustain and grow in the dynamic environment. They have to become more productive than their rivalries in the market
place. It has to design strategy to maintain a competitive advantage in a competitive market. According to Rastogi (1988),
productivity represents decreasing inefficiency and increasing effectiveness of the organization thereby honing a competitive
edge. Honing their edges make, the organizations perfect in all aspects of competition in the current dynamic environment. As
added by Rastogi, productive efficiency is of crucial importance for managing inflation by lowering costs of goods, services, and
commodities consumed by people. Productivity is the essential prerequisite for increasing exports, achieving export led growth,
attaining techno-economic development and generating wealth for investment, consumption and social welfare. This research
work is an attempt to study the impact of a new economic reform on productivity with special reference to Ethiopian Leather
Industry.
LITERATURE REVIEW
In this part, the study attempted to discuss the related literature review written on employment, motivation and productivity by
different authors. Motivation has been taken into consideration because to increase productivity, the employees have to be
committed and motivated to perform more than ever before.
Employment Related Literature
According to authors in personnel area when employment is considered, the following things must be fulfilled in advance before
the task of employment actually takes place: 1) there must be an organization with the objective of employment requirement, 2)
there should be personnel management department or section with the knowledge of how and under what conditions employment
or appointment should be undertaken. As stated by the British Institute of Personnel Management “Personnel Management is that
part of the management function which is concerned with people at work and with their relationship within an enterprise. Its aim
is to bring together and develop into an effective organization the men and women who make up an enterprise and, having regard
to the well-being of an individual and of working groups, to enable make their best contribution to its success.
According to P.C. Tripathi (1999: 4), the operative functions of personnel management include procurement, development,
compensation, integration, maintenance and records, research, and audit. According to him, procurement is mainly concerned with
1Associate Professor (Marketing Management), School of Management and Accounting, College of Business and Economics,
Hawassa University, Ethiopia, [email protected]
Volume 5, Number 1, January – March’ 2016
ISSN (Print): 2279-0977, (Online): 2279-0985
PEZZOTTAITE JOURNALS SJIF (2012): 3.23, SJIF (2013): 5.057, SJIF (2014): 5.871, SJIF (2015): 6.492
International Journal of Applied Services Marketing Perspectives© Pezzottaite Journals. 1954 |P a g e
the hiring of personnel – the right people, in the right place, at the right time. This function deals specifically with such subjects as
the determination of manpower requirement and their recruitment, selection and placement. Development pertains to the training
and education of the hired personnel, their morale building, effective communication network, promotion and transfer plans,
suggestions system and similar other plans. As he rightly puts, compensation deals with the methods and standards of
remuneration with emphasis upon such activities as job evaluation, wage system, monetary incentives and terms of employment.
On the other hand, integration is concerned with the attempt to bring about a reasonable reconciliation of individual and
organizational interests. Maintenance function aims at maintaining good working conditions in and favorable attitudes towards the
organization. Record keeping, as stated by Tripathi, is necessary for exercising control over personnel activities and for doing
research. Personnel audit helps to evaluate the effectiveness of various personnel policies and procedures and indicates a further
course of action.
According to National Institute of Personnel Management, there are three main concerns of industrial management, viz, machines,
material and men. The last one - men is very crucial, without which the first two are soul- less and cannot work. This shows the
importance of human element in any organization.
As far as the appointment of employees is concerned, the appointment of employees in Leather industry in Ethiopia is based on
permanent and casual basis. According to Debub Negarit Gazeta, when an organization wants to fill vacancies, they are, may be
filled through recruitment, promotion, or transfer based on human resource planning. Article 13 of the Debub Negarit Gazeta
states that: 1) there shall be no discrimination among job seekers or civil servants in filling vacancies because of their ethnic
origin, gender, religion, political outlook or any other ground, 2) a vacant position may be filled by a person who meets the
qualification required for the position and scores higher than other candidates, 3) without prejudice to the provisions of sub-
articles (1) and (2) of this article, preference shall be given to a) female candidates, and b) members of nationalities comparatively
less represented in the government offices.
When there are vacant positions in leather industry, they announce vacancies to attract prospective applicants who could meet the
minimum requirement and conduct official recruitment. Recruitment is the process of searching for and obtaining applications to
build a pool of job seekers from the right people for the right jobs may be selected. According to William B. Werther and Keith
Davis (1993: 195), recruitment is the process of finding and attracting capable applicants for employment. The process begins
when new recruits are sought and ends when their applications are submitted. The result is a pool of applicants from which new
employees are selected. Next to recruitment, the logical step in appointment process is selection of qualified and competent
people. According to Thomas H. Stone (1989: 173), selection is the process of differentiating between applicants in order to
identify (and hire) those with a greater likelihood of success in a job.
Based on selection, the required applicant has to be selected and hired. After an applicant has been hired, he or she must be
oriented and placed on the chosen job. The purpose of orientation is to introduce a newly hired member with other fellow workers,
working environment, and rules and principles pursued by the organization. According to Robert L. Mathis and John H. Jackson
(1982: 225), orientation is planned introduction of employees to their jobs, their co-workers and organization.
Successful candidates placed on jobs need training to perform their duties effectively. Workers must be trained to operate
machines, reduce scrap, and avoid accidents. According to Randall S. Schuler (1989:385), training and development is any
attempt to improve current or future employee performance by increasing an employee’s ability to perform through learning,
usually by changing the employee’s attitude or increasing his or her skills and knowledge to put in his maximum effort to increase
organizational productivity. The need for training and development is determined by employee’s performance deficiency,
computed as follows: Training and development need = standard performance – actual performance. Training is required when
actual performance is less than standard performance because of not knowing how to operate or not understanding the objective
the organization pursues to achieve as per plan.
After providing formal training and development, the next step is performance appraisal. In simple term, performance appraisal
may be understood as the assessment of an individual’s performance in a systematic way, the performance being measured against
such factors as job knowledge, quality and quantity of output, initiative, leadership ability, supervision, dependability, co-
operation, judgment, versatility, health and the like.
According to Randall S. Schuler (1981: 221), performance appraisal is a formal, structured system of measuring and evaluating an
employee’s job related behaviors and outcomes to discover how and why the employee is presently performing on the job and
how the employee can perform more effectively in the future so that the employee, organization and society all benefit. After
performance appraisal, the next step to follow is employee remuneration for his or her performance. As many writers on
remuneration do agree, remuneration is the compensation an employee receives in return for his/her contribution to the
organization. Remuneration occupies an important place in the life of an employee. His or her standard of living, status in society,
motivation, loyalty, and productivity depends upon the remuneration he or she receives. For the employer too, employee
remuneration is significant because of its contribution to the cost of production. Besides many battles (in the form of strikes and
Volume 5, Number 1, January – March’ 2016
ISSN (Print): 2279-0977, (Online): 2279-0985
PEZZOTTAITE JOURNALS SJIF (2012): 3.23, SJIF (2013): 5.057, SJIF (2014): 5.871, SJIF (2015): 6.492
International Journal of Applied Services Marketing Perspectives© Pezzottaite Journals. 1955 |P a g e
lockouts) are fought between the employer and employees on issues related to wages or bonus. Remuneration of an employee
comprises wages and salary, incentives, fringe benefits, perquisites, and non-monetary benefits.
Motivation Related Literature
According to Dubin (1974), “Motivation is the complex force starting and keeping a person at work in an organization.
Motivation is something that moves the person to action and continues him in the course of action already initiated.” As stated by
McFarland (1974), “Motivation refers to the way in which urges, drives, aspirations, strivings, or need direct, control, or explain
the behavior of human being. Motivation is a goal directed behavior and it has an influence on human behavior. It harnesses
human energy and effort to organizational requirements. Motivation is related to satisfaction. Satisfaction refers to the
contentment experiences of an individual, which he drives out, or need fulfillment. Thus, satisfaction is a consequence of reward
and punishment associated with experiences.
Motivation derives an individual for work. Motivation is based on motive, which is a feeling that an individual lacks something.
This feeling creates some sort of tension in his mind. To overcome this tension, he engages himself in goal-directed behavior,
which is taking those actions through which his needs are satisfied. Thus, motivation becomes a prime mover for efforts and better
work performance. An individual obtains a reward for his performance. Reward, because of individual’s performance affects his
level of motivation. If the reward is perceived to be of valence and equitable, it energizes the individual for still better
performance and this process goes on (Prasad, 2004). As many writers may agree to it, motivation urges and initiates individuals
to perform more and more up to their maximum effort, which in turn leads to productivity.
According to Rastogi (1988), productivity is strongly related to the culture of society and motivation of employees. A motivated
employee uses resources economically, efficiently, and effectively with great care for resources and processes. Culture also plays
a determinant role in directing workers to work- place and making them to use resources efficiently and effectively. Culture also
initiates and motivates society for a higher performance. “Productivity is the relationship between outputs of goods and services
and the inputs of the basic resources- labour, capital and natural resources” (Kendrick, 1980). Change in output per unit of
measured inputs is change in productivity (Dension, 1962).
Productivity Related Literature
The concept of productivity, generally defined as the relation between output and input, has been available for over two centuries
and applied in many different circumstances on various levels of aggregation in the economic system. It is argued that
productivity is one of the basic variables governing economic production activities, perhaps the most important one (H. Singh et
al, 2000). Productivity is an average measure of the efficiency of production. It can be expressed as the ratio of output to inputs
used in the production process, i.e. output per unit of input (Saari, 2006).
In fact, productivity is frequently discussed by managers but rarely defined, often misunderstood and confused with similar terms,
and seldom measured in an appropriate way, leading to productivity being disregarded to the extent that contra productive
decisions are taken. According to Koss and Lewis, remarkably many managers who everyday make decisions about improving
plant efficiency and effectiveness do not know how to answer the simple question: “what do we really mean by productivity?”
Nevertheless, if we do not fully understand what productivity is, how can we decide what productivity measures to use? How can
we interpret them correctly? How can we know what action to take to improve productivity? Evidently, the confusion surrounding
the subject makes it increasingly necessary to further investigate and emphasize the basic meaning of productivity (Forrester
1993).
According to Rastogi (1988), productivity is a multifaceted phenomenon. It denotes an increasingly efficient and effective use of
resources of land, labour, capital, and technology. It subsumes a number of diverse aspects like: i) optimum utilization of available
and potential resources, assets, and capacity, ii) effective management of projects without time and cost escalations iii) waste
avoidance in the use of materials, machines, energy, time and other inputs, iv) labour cost and/or higher quality goods and
services, v) modernization of plants, and machinery, vi) development of technology and pursuit of innovation, vii) dedicated
managerial leadership and viii) full utilization and exercise of human talents, creativity and skills. All these lead to the creation of
national wealth. Increasing national wealth can raise living standards because more real income improves people's ability to
purchase goods and services, enjoy leisure, improve housing and education and contribute to social and environmental programs.
Productivity growth also helps businesses to be more profitable. However, when there is productivity growth, even the existing
commitment of resources generates more output and income. Income generated per unit of input increases. Additional resources
are also attracted into production and can be profitably employed.
Productivity growth is a crucial source of growth in living standards. Productivity growth means more value is added in
production and this means more income is available to be distributed. At a firm or industry level, the benefits of productivity
growth can be distributed in a number of different ways (Abramovitz, 1956):
Volume 5, Number 1, January – March’ 2016
ISSN (Print): 2279-0977, (Online): 2279-0985
PEZZOTTAITE JOURNALS SJIF (2012): 3.23, SJIF (2013): 5.057, SJIF (2014): 5.871, SJIF (2015): 6.492
International Journal of Applied Services Marketing Perspectives© Pezzottaite Journals. 1956 |P a g e
To the workforce through better wages and conditions;
To shareholders and superannuation funds through increased profits and dividend distributions;
To customers through lower prices;
To the environment through more stringent environmental protection; and
To governments through increases in tax payments (which can be used to fund social and environmental programs).
Productivity growth is important to the firm because it means that it can meet its (perhaps growing) obligations to workers,
shareholders, and governments (taxes and regulation), and remain competitive or even improve its competitiveness in the market
place. He also added that if the business is more profitable, it pays more to better the living standards of its employees. After
having achieved, the living standard of the society, then it pays more attention for economic well-being in order to satisfy human
needs. Economic well-being is created in a production process, meaning all economic activities that aim directly or indirectly to
satisfy human needs. The degree to which the needs are satisfied is often accepted as a measure of economic well-being.
According to Rastogi, productivity and innovation are crucial for the socio-economic development of nations. As argued by him,
the grim pressures of unemployment, underdevelopment, inflation and poverty, and the resultant unrest and schisms within a
society are largely the consequences of its low and/or declining productivity. When productivity activities are managed
intelligently, diligently, and harmoniously, a nation prospers. The reverse is also true. If resources are not managed and utilized
properly and efficiently, the cost of using the resources will be high, which is the contradictory performance to productivity. Thus,
the poverty of nation is an outcome of weakness in the organization and management of their production resources (V. Mariappan
and K.Chidambaram 2003).
Productivity stands for composite efforts of all the factors contributing to production. Therefore, productivity indicates the overall
efficiency of the organization. The usefulness of productivity indices has been recognized in all industries around the world.
Michael Porter (1992) of Harvard University says the only meaningful concept of competitiveness at the national level is
productivity. Further, he states, “the principal goal of a nation is to produce a higher and rising standard of living for its citizens.
The ability to do so depends on the Productivity with which a nation’s labour and capital are employed. A nation’s standard of
living depends on the capacity of its companies to achieve higher levels of productivity, and to increase productivity over time.
Production, productivity, innovation, organization, management and employment are social processes required to manufacture
product. As stated by Rastogi, they involve the participation of social actors, viz, industrialists, businessmen, managers, engineers,
technicians, workers, farmers, political leaders, scientists, planners, policy makers, bureaucrats, administrators, accountants,
salesmen, clerks and so on.
STATEMENT OF THE PROBLEM
As many writers do agree to, productivity is the result of the performance of people. Performance of people depends on how they
are motivated to perform that specific type of work. Performance is determined by the amount of effort, ability and role perception
of the individual. If an individual is lacking ability and/or has wrong role perception, his performance is found to be unsatisfactory
in spite of his putting great efforts (Singh and Chhabra, 1996). Productivity signifies a continual striving towards the economically
most efficient mode of production of goods, commodities and services needed by a society. Productive efficiency is of crucial
importance for managing inflation by lowering the costs of goods, services and commodities consumed by people. Productivity is
the essential prerequisite for increasing exports, achieving export led growth, attaining techno-economic development and
generating wealth for investment, consumption and social welfare (Rastogi, 1988). This all can be achieved through growth in
productivity. Growth in productivity may be achieved in two ways: 1) improvement in efficiency, which leads to higher output
even with a given state of technological knowledge. Higher output results from superior organizational methods, improved
management practices, higher motivation and competence of workers, accumulation of gains from learning and experience, more
intelligent mechanisms for adaptive and anticipatory planning, and a better information base for policies and decisions, 2) higher
effectiveness of new production technologies resulting from innovation and technical advance. This leads to quantum jumps on
output levels, and/or new and better types of output. The given input level in relation to output may even decline in terms of cost
and quantity. The two kinds of productivity growth may interact with each other in a mutually supportive manner (Rastogi 1988).
As it can be seen from the definitions of productivity, productivity may be achieved by minimizing and/or eliminating such things
resulting in inefficiency. In leather industry, there are problems that hinder the organization from achieving the desired
productivity. According to Yibralem Abadi, the following are identified as problems and constraints for development of the
leather industry in Ethiopia:
Poor livestock management,
Poor quality raw material supply as a result of ante-mortem and post-mortem handling of hides and skins,
Higher cost of production because of poor production management,
High rejection rates of unsellable products
No economic growth,
Volume 5, Number 1, January – March’ 2016
ISSN (Print): 2279-0977, (Online): 2279-0985
PEZZOTTAITE JOURNALS SJIF (2012): 3.23, SJIF (2013): 5.057, SJIF (2014): 5.871, SJIF (2015): 6.492
International Journal of Applied Services Marketing Perspectives© Pezzottaite Journals. 1957 |P a g e
Low off-take and recovery rates,
Lack of skills, technology, intermediate inputs and processing equipment,
Stiff competition among the existing tanners and low selling price,
Low utilization of industry capacity,
Poor linkages among different organizations involved with hides and skins.
The relative lack of export support and/or promotion services,
Lack of hard currency to purchase spare parts and inputs,
Poor technology,
Outdated machineries,
Poor infrastructure and bureaucratic red-tape.
SIGNIFICANCE OF STUDY
Even though there were detrimental problems that could seriously affect the productivity of leather industry in the area, no
research was conduct to bring about solutions that minimize inefficiencies and increase productivity in the industry. This gap
initiated the researcher to undertake this study. The beneficiaries of the findings of this study are the government, the sector of
leather industry, ministry of trade and industry, libraries, researchers and scholars who would like to further investigate in the
area.
General Objectives
The general objective of this study is to assess the impact of the reform of liberalization on employment and productivity of
Ethiopian Leather Industry.
Specific Objectives
To assess the impact of liberalization on public and private sector employment in Ethiopian leather industry.
To examine whether liberalization has a significant impact on public and private sector establishments.
To assess factors affecting the productivity of Ethiopian Leather Industry.
To assess and give some policy options about future improvement of leather industry in Ethiopia.
HYPOTHESIS OF STUDY
Liberalization has no significant impact on both public and private sector employment in Ethiopian Leather Industry.
Liberalization has no significant impact on both public and private sector establishments in Ethiopian Leather Industry.
Liberalization has no significant impact on productivity of Ethiopian Leather industry.
RESEARCH METHODOLOGY
The study used both primary and secondary data. However, more focus was given to secondary data. The study used data before -
liberalization and after-liberalization. To this effect, it used the written information that includes the time between 1981 and 2004.
The data were collected from the following sources: Central Statistical Agency (CSA), Ministry of Trade and Industry, Ethiopian
Export Promotion Agency, Annual Government Reports on Industry, National Bank of Ethiopia, Institution of Ethiopian Studies
at Addis Ababa University and Ministry of Foreign Affairs. The data that were not sufficient from the secondary sources have
been substantiated supplemented from the primary sources by conducting structured interview to the pertinent officials at different
levels of posts in the industry. Therefore, the focus of study was on secondary data. This is comparative study, which made use of
Analytical as well as Empirical research. Analytical research because the study had to use facts or information already available
and analyzes it to arrive at sound conclusions. It also used empirical research because, in such a research, the researcher must
provide himself with working hypothesis and works to get enough facts (data) to prove or disprove the hypothesis. Such a
research is appropriate when proof is sought that certain variables affect other variables in some way (Kothari, 1985). The study
attempted to see whether liberalization as an economic reform has brought about any significant change on productivity of
Ethiopian Leather Industry, taking time pre- and post-liberalization. To this effect, the study covered the time between 1981 and
2004. This time was divided into two equal portions as pre- and post-liberalization periods. In assessing the impact of
liberalization, the study followed pre- and post-liberalization comparison, taking time period 12 years before liberalization and 12
years after liberalization. Through empirical analysis on the variables stated in hypothesis part, it is believed that it would be
possible to gauge the success or failure of the new economic reform launched since 1992 in Ethiopian Leather Industry. Various
statistical tools such as ratios, correlation analysis, percentages, and measures of central tendencies, graphs and charts are used to
evaluate the data as the study is based on time series data in order to test the impact of liberalization on productivity of Ethiopian
Leather industry. The study also used a paired t-test as two matched samples were used in the study.
Volume 5, Number 1, January – March’ 2016
ISSN (Print): 2279-0977, (Online): 2279-0985
PEZZOTTAITE JOURNALS SJIF (2012): 3.23, SJIF (2013): 5.057, SJIF (2014): 5.871, SJIF (2015): 6.492
International Journal of Applied Services Marketing Perspectives© Pezzottaite Journals. 1958 |P a g e
DATA ANALYSIS AND INTERPRETATION
Hypothesis Testing
a) Liberalization has no significant impact on both public and private sector employment in Ethiopian Leather Industry.
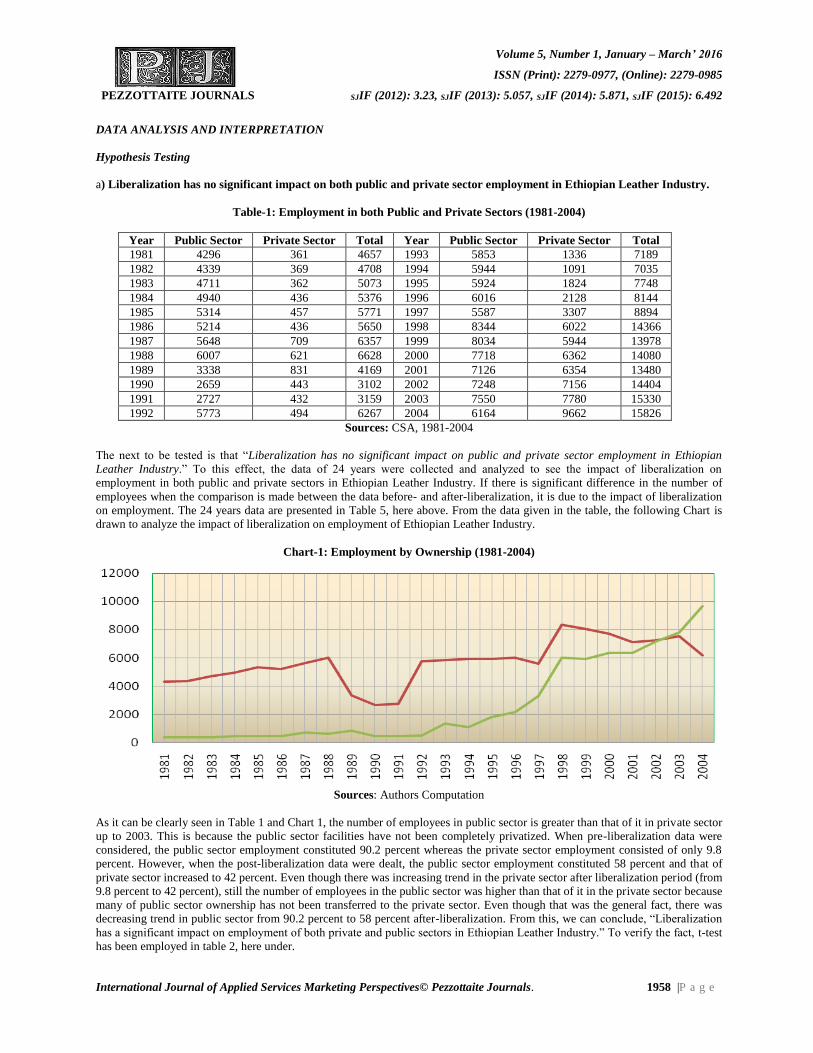
Table-1: Employment in both Public and Private Sectors (1981-2004)
Year Public Sector Private Sector Total Year Public Sector Private Sector Total
1981 4296 361 4657 1993 5853 1336 7189
1982 4339 369 4708 1994 5944 1091 7035
1983 4711 362 5073 1995 5924 1824 7748
1984 4940 436 5376 1996 6016 2128 8144
1985 5314 457 5771 1997 5587 3307 8894
1986 5214 436 5650 1998 8344 6022 14366
1987 5648 709 6357 1999 8034 5944 13978
1988 6007 621 6628 2000 7718 6362 14080
1989 3338 831 4169 2001 7126 6354 13480
1990 2659 443 3102 2002 7248 7156 14404
1991 2727 432 3159 2003 7550 7780 15330
1992 5773 494 6267 2004 6164 9662 15826
Sources: CSA, 1981-2004
The next to be tested is that “Liberalization has no significant impact on public and private sector employment in Ethiopian
Leather Industry.” To this effect, the data of 24 years were collected and analyzed to see the impact of liberalization on
employment in both public and private sectors in Ethiopian Leather Industry. If there is significant difference in the number of
employees when the comparison is made between the data before- and after-liberalization, it is due to the impact of liberalization
on employment. The 24 years data are presented in Table 5, here above. From the data given in the table, the following Chart is
drawn to analyze the impact of liberalization on employment of Ethiopian Leather Industry.
Chart-1: Employment by Ownership (1981-2004)
Sources: Authors Computation
As it can be clearly seen in Table 1 and Chart 1, the number of employees in public sector is greater than that of it in private sector
up to 2003. This is because the public sector facilities have not been completely privatized. When pre-liberalization data were
considered, the public sector employment constituted 90.2 percent whereas the private sector employment consisted of only 9.8
percent. However, when the post-liberalization data were dealt, the public sector employment constituted 58 percent and that of
private sector increased to 42 percent. Even though there was increasing trend in the private sector after liberalization period (from
9.8 percent to 42 percent), still the number of employees in the public sector was higher than that of it in the private sector because
many of public sector ownership has not been transferred to the private sector. Even though that was the general fact, there was
decreasing trend in public sector from 90.2 percent to 58 percent after-liberalization. From this, we can conclude, “Liberalization
has a significant impact on employment of both private and public sectors in Ethiopian Leather Industry.” To verify the fact, t-test
has been employed in table 2, here under.
Volume 5, Number 1, January – March’ 2016
ISSN (Print): 2279-0977, (Online): 2279-0985
PEZZOTTAITE JOURNALS SJIF (2012): 3.23, SJIF (2013): 5.057, SJIF (2014): 5.871, SJIF (2015): 6.492
International Journal of Applied Services Marketing Perspectives© Pezzottaite Journals. 1959 |P a g e
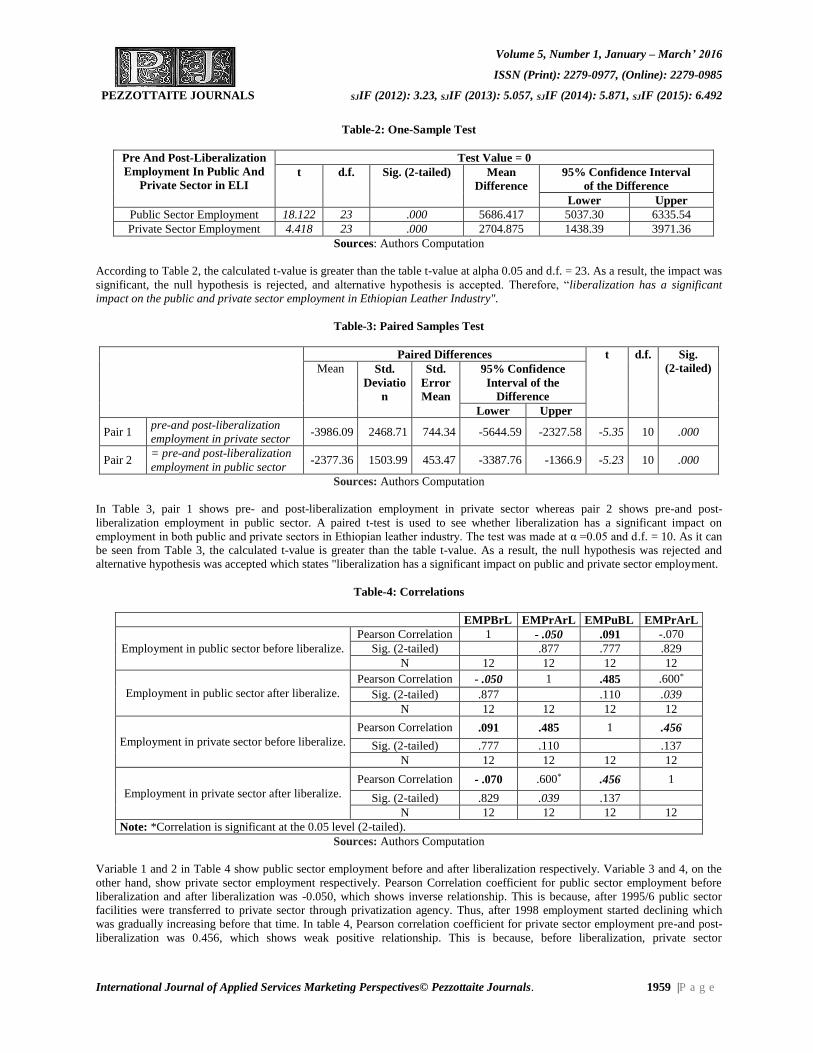
Table-2: One-Sample Test
Pre And Post-Liberalization
Employment In Public And
Private Sector in ELI
Test Value = 0
t d.f. Sig. (2-tailed) Mean
Difference
95% Confidence Interval
of the Difference
Lower Upper
Public Sector Employment 18.122 23 .000 5686.417 5037.30 6335.54
Private Sector Employment 4.418 23 .000 2704.875 1438.39 3971.36
Sources: Authors Computation
According to Table 2, the calculated t-value is greater than the table t-value at alpha 0.05 and d.f. = 23. As a result, the impact was
significant, the null hypothesis is rejected, and alternative hypothesis is accepted. Therefore, “liberalization has a significant
impact on the public and private sector employment in Ethiopian Leather Industry".
Table-3: Paired Samples Test
Paired Differences t d.f. Sig.
(2-tailed) Mean Std.
Deviatio
n
Std.
Error
Mean
95% Confidence
Interval of the
Difference
Lower Upper
Pair 1 pre-and post-liberalization
employment in private sector -3986.09 2468.71 744.34 -5644.59 -2327.58 -5.35 10 .000
Pair 2 = pre-and post-liberalization
employment in public sector -2377.36 1503.99 453.47 -3387.76 -1366.9 -5.23 10 .000
Sources: Authors Computation
In Table 3, pair 1 shows pre- and post-liberalization employment in private sector whereas pair 2 shows pre-and post-
liberalization employment in public sector. A paired t-test is used to see whether liberalization has a significant impact on
employment in both public and private sectors in Ethiopian leather industry. The test was made at α =0.05 and d.f. = 10. As it can
be seen from Table 3, the calculated t-value is greater than the table t-value. As a result, the null hypothesis was rejected and
alternative hypothesis was accepted which states "liberalization has a significant impact on public and private sector employment.
Table-4: Correlations
EMPBrL EMPrArL EMPuBL EMPrArL
Employment in public sector before liberalize.
Pearson Correlation 1 - .050 .091 -.070
Sig. (2-tailed) .877 .777 .829
N 12 12 12 12
Employment in public sector after liberalize.
Pearson Correlation - .050 1 .485 .600*
Sig. (2-tailed) .877 .110 .039
N 12 12 12 12
Employment in private sector before liberalize.
Pearson Correlation .091 .485 1 .456
Sig. (2-tailed) .777 .110 .137
N 12 12 12 12
Employment in private sector after liberalize.
Pearson Correlation - .070 .600* .456 1
Sig. (2-tailed) .829 .039 .137
N 12 12 12 12
Note: *Correlation is significant at the 0.05 level (2-tailed).
Sources: Authors Computation
Variable 1 and 2 in Table 4 show public sector employment before and after liberalization respectively. Variable 3 and 4, on the
other hand, show private sector employment respectively. Pearson Correlation coefficient for public sector employment before
liberalization and after liberalization was -0.050, which shows inverse relationship. This is because, after 1995/6 public sector
facilities were transferred to private sector through privatization agency. Thus, after 1998 employment started declining which
was gradually increasing before that time. In table 4, Pearson correlation coefficient for private sector employment pre-and post-
liberalization was 0.456, which shows weak positive relationship. This is because, before liberalization, private sector
Volume 5, Number 1, January – March’ 2016
ISSN (Print): 2279-0977, (Online): 2279-0985
PEZZOTTAITE JOURNALS SJIF (2012): 3.23, SJIF (2013): 5.057, SJIF (2014): 5.871, SJIF (2015): 6.492
International Journal of Applied Services Marketing Perspectives© Pezzottaite Journals. 1960 |P a g e
employment was very small and gradually increasing up to 1992. After 1992, it started increasing at increasing rate. Thus,
correlation was significant at the 0.05 level (2-tailed).
B) Liberalization has no significant impact on productivity of Ethiopian Leather industry
The last hypothesis to be tested is “Liberalization has no significant impact on productivity of Ethiopian Leather Industry.” To this
effect, value of output, labour and capital starting from 1981-2004 for 24 years were collected and presented in Table 4. To
evaluate the post-liberalization impact, the collected data were divided into two categories as pre-liberalization and post-
liberalization period.
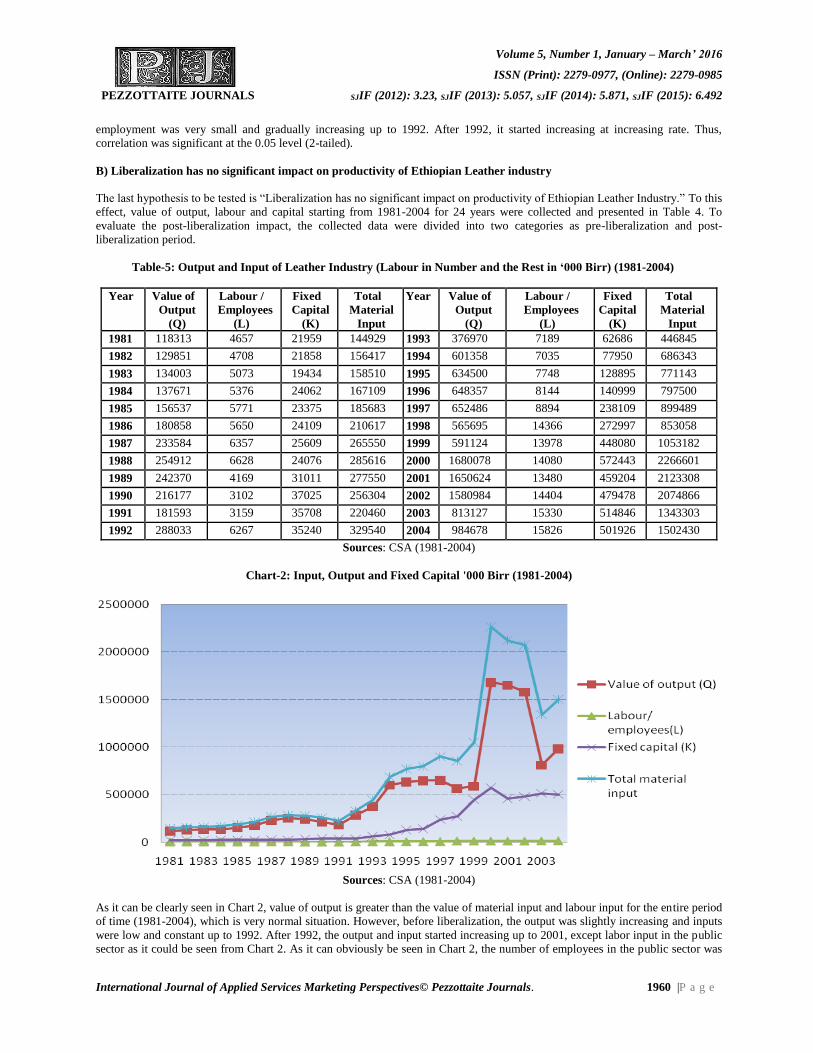
Table-5: Output and Input of Leather Industry (Labour in Number and the Rest in ‘000 Birr) (1981-2004)
Year Value of
Output
(Q)
Labour /
Employees
(L)
Fixed
Capital
(K)
Total
Material
Input
Year Value of
Output
(Q)
Labour /
Employees
(L)
Fixed
Capital
(K)
Total
Material
Input
1981 118313 4657 21959 144929 1993 376970 7189 62686 446845
1982 129851 4708 21858 156417 1994 601358 7035 77950 686343
1983 134003 5073 19434 158510 1995 634500 7748 128895 771143
1984 137671 5376 24062 167109 1996 648357 8144 140999 797500
1985 156537 5771 23375 185683 1997 652486 8894 238109 899489
1986 180858 5650 24109 210617 1998 565695 14366 272997 853058
1987 233584 6357 25609 265550 1999 591124 13978 448080 1053182
1988 254912 6628 24076 285616 2000 1680078 14080 572443 2266601
1989 242370 4169 31011 277550 2001 1650624 13480 459204 2123308
1990 216177 3102 37025 256304 2002 1580984 14404 479478 2074866
1991 181593 3159 35708 220460 2003 813127 15330 514846 1343303
1992 288033 6267 35240 329540 2004 984678 15826 501926 1502430
Sources: CSA (1981-2004)
Chart-2: Input, Output and Fixed Capital '000 Birr (1981-2004)
Sources: CSA (1981-2004)
As it can be clearly seen in Chart 2, value of output is greater than the value of material input and labour input for the entire period
of time (1981-2004), which is very normal situation. However, before liberalization, the output was slightly increasing and inputs
were low and constant up to 1992. After 1992, the output and input started increasing up to 2001, except labor input in the public
sector as it could be seen from Chart 2. As it can obviously be seen in Chart 2, the number of employees in the public sector was
Volume 5, Number 1, January – March’ 2016
ISSN (Print): 2279-0977, (Online): 2279-0985
PEZZOTTAITE JOURNALS SJIF (2012): 3.23, SJIF (2013): 5.057, SJIF (2014): 5.871, SJIF (2015): 6.492
International Journal of Applied Services Marketing Perspectives© Pezzottaite Journals. 1961 |P a g e
declining after 1996 because of privatization effect. Pearson correlation result also supports this fact showing inverse relation of
employment before and after liberalization. The number of employees in the public sector declined starting 1996 because a
number of public sector establishments were transferred to private sector. Because of this effect, starting 1998 number of
employees started declining in the public sector. Exploiting the same opportunity, the number of employees in the private sector
started increasing at increasing rate after the reform of liberalization. As a result, the number of employees decreased in the public
sector and increased in the private sector. However, the sum total of employees after liberalization was increasing because of
increase of employees in the private sector even though there was decrease in the public sector. Fixed capital has been gradually
increasing starting from the beginning up to 2004.
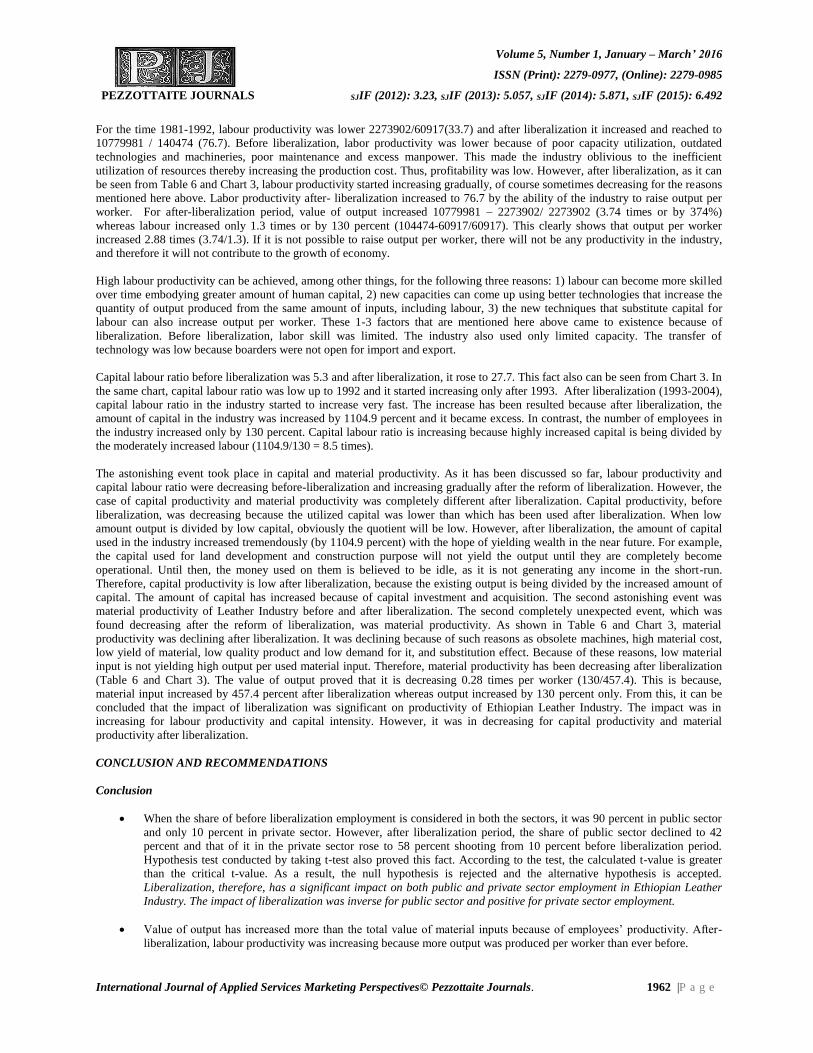
Table-6: Capital Intensity, Partial and Total Factor Productivity in Ethiopian Leather Industry (1981-2004)
Year
Labour
Productivity (Q/L)
Capital
Productivity (Q/K)
Output /
Material (Q/M)
Capital Labour
Ratio (K/L)
1981 25.40541121 5.387904732 0.816351455 4.715267339
1982 27.58092608 5.940662458 0.830159126 4.642735769
1983 26.41494185 6.895286611 0.845391458 3.830869308
1984 25.60844494 5.721511096 0.82383953 4.475818452
1985 27.12476174 6.696770053 0.843033557 4.050424536
1986 32.01026549 7.501679871 0.858705613 4.267079646
1987 36.74437628 9.121168339 0.879623423 4.02847255
1988 38.45986723 10.58780528 0.89249902 3.632468316
1989 58.1362437 7.815613814 0.873248063 7.438474454
1990 69.68955513 5.83867657 0.843439821 11.93584784
1991 57.48433048 5.085499048 0.823700445 11.30357708
1992 45.96026807 8.17346765 0.874045639 5.623105154
1993 52.43705661 6.013623457 0.843625866 8.719710669
1994 85.48088131 7.714663246 0.876177072 11.08031272
1995 81.89210119 4.922611428 0.82280459 16.63590604
1996 79.61161591 4.598309208 0.812986834 17.31323674
1997 73.36249157 2.740282812 0.725396308 26.77186868
1998 39.3773493 2.072165628 0.663137794 19.00299318
1999 42.28959794 1.319237636 0.56127431 32.05608814
2000 119.3237216 2.934926272 0.741232356 40.65646307
2001 122.4498516 3.594533149 0.777383215 34.06557864
2002 109.7600666 3.297302483 0.761969207 33.28783671
2003 53.04155251 1.579359653 0.605319128 33.58421396
2004 62.2190067 1.96179915 0.655390268 31.71527866
Sources: Authors Compilation
Chart-3: Capital Intensity, Partial and Total Factor Productivity in ELI (1981-2004)
Sources: Authors Compilation
Volume 5, Number 1, January – March’ 2016
ISSN (Print): 2279-0977, (Online): 2279-0985
PEZZOTTAITE JOURNALS SJIF (2012): 3.23, SJIF (2013): 5.057, SJIF (2014): 5.871, SJIF (2015): 6.492
International Journal of Applied Services Marketing Perspectives© Pezzottaite Journals. 1962 |P a g e
For the time 1981-1992, labour productivity was lower 2273902/60917(33.7) and after liberalization it increased and reached to
10779981 / 140474 (76.7). Before liberalization, labor productivity was lower because of poor capacity utilization, outdated
technologies and machineries, poor maintenance and excess manpower. This made the industry oblivious to the inefficient
utilization of resources thereby increasing the production cost. Thus, profitability was low. However, after liberalization, as it can
be seen from Table 6 and Chart 3, labour productivity started increasing gradually, of course sometimes decreasing for the reasons
mentioned here above. Labor productivity after- liberalization increased to 76.7 by the ability of the industry to raise output per
worker. For after-liberalization period, value of output increased 10779981 – 2273902/ 2273902 (3.74 times or by 374%)
whereas labour increased only 1.3 times or by 130 percent (104474-60917/60917). This clearly shows that output per worker
increased 2.88 times (3.74/1.3). If it is not possible to raise output per worker, there will not be any productivity in the industry,
and therefore it will not contribute to the growth of economy.
High labour productivity can be achieved, among other things, for the following three reasons: 1) labour can become more skilled
over time embodying greater amount of human capital, 2) new capacities can come up using better technologies that increase the
quantity of output produced from the same amount of inputs, including labour, 3) the new techniques that substitute capital for
labour can also increase output per worker. These 1-3 factors that are mentioned here above came to existence because of
liberalization. Before liberalization, labor skill was limited. The industry also used only limited capacity. The transfer of
technology was low because boarders were not open for import and export.
Capital labour ratio before liberalization was 5.3 and after liberalization, it rose to 27.7. This fact also can be seen from Chart 3. In
the same chart, capital labour ratio was low up to 1992 and it started increasing only after 1993. After liberalization (1993-2004),
capital labour ratio in the industry started to increase very fast. The increase has been resulted because after liberalization, the
amount of capital in the industry was increased by 1104.9 percent and it became excess. In contrast, the number of employees in
the industry increased only by 130 percent. Capital labour ratio is increasing because highly increased capital is being divided by
the moderately increased labour (1104.9/130 = 8.5 times).
The astonishing event took place in capital and material productivity. As it has been discussed so far, labour productivity and
capital labour ratio were decreasing before-liberalization and increasing gradually after the reform of liberalization. However, the
case of capital productivity and material productivity was completely different after liberalization. Capital productivity, before
liberalization, was decreasing because the utilized capital was lower than which has been used after liberalization. When low
amount output is divided by low capital, obviously the quotient will be low. However, after liberalization, the amount of capital
used in the industry increased tremendously (by 1104.9 percent) with the hope of yielding wealth in the near future. For example,
the capital used for land development and construction purpose will not yield the output until they are completely become
operational. Until then, the money used on them is believed to be idle, as it is not generating any income in the short-run.
Therefore, capital productivity is low after liberalization, because the existing output is being divided by the increased amount of
capital. The amount of capital has increased because of capital investment and acquisition. The second astonishing event was
material productivity of Leather Industry before and after liberalization. The second completely unexpected event, which was
found decreasing after the reform of liberalization, was material productivity. As shown in Table 6 and Chart 3, material
productivity was declining after liberalization. It was declining because of such reasons as obsolete machines, high material cost,
low yield of material, low quality product and low demand for it, and substitution effect. Because of these reasons, low material
input is not yielding high output per used material input. Therefore, material productivity has been decreasing after liberalization
(Table 6 and Chart 3). The value of output proved that it is decreasing 0.28 times per worker (130/457.4). This is because,
material input increased by 457.4 percent after liberalization whereas output increased by 130 percent only. From this, it can be
concluded that the impact of liberalization was significant on productivity of Ethiopian Leather Industry. The impact was in
increasing for labour productivity and capital intensity. However, it was in decreasing for capital productivity and material
productivity after liberalization.
CONCLUSION AND RECOMMENDATIONS
Conclusion
When the share of before liberalization employment is considered in both the sectors, it was 90 percent in public sector
and only 10 percent in private sector. However, after liberalization period, the share of public sector declined to 42
percent and that of it in the private sector rose to 58 percent shooting from 10 percent before liberalization period.
Hypothesis test conducted by taking t-test also proved this fact. According to the test, the calculated t-value is greater
than the critical t-value. As a result, the null hypothesis is rejected and the alternative hypothesis is accepted.
Liberalization, therefore, has a significant impact on both public and private sector employment in Ethiopian Leather
Industry. The impact of liberalization was inverse for public sector and positive for private sector employment.
Value of output has increased more than the total value of material inputs because of employees’ productivity. After-
liberalization, labour productivity was increasing because more output was produced per worker than ever before.
Volume 5, Number 1, January – March’ 2016
ISSN (Print): 2279-0977, (Online): 2279-0985
PEZZOTTAITE JOURNALS SJIF (2012): 3.23, SJIF (2013): 5.057, SJIF (2014): 5.871, SJIF (2015): 6.492
International Journal of Applied Services Marketing Perspectives© Pezzottaite Journals. 1963 |P a g e
Capital intensity / Capital-labour ratio / was also increased after-liberalization because more capital was employed in
expectation of generating or yielding more wealth in the near future.
Capital productivity was decreasing because more capital was used for capital investment and capital acquisition, which
could actually not yield any output in the gestation period in the short-run. Capital has been acquired beyond required
level and hence used inefficiently. Thus, idle capital is resulted in the decline of capital productivity after liberalization
in the short-run. However, in the end when capital investment starts yielding output, the situation may be reversed and
the graph, which was currently running downward, can run upward in the end. Until that point of time, the industry has
to arrest further capital acquisition and expand labor and material use.
Material productivity was also declining post-liberalization period because of inefficient utilization of material to
produce the required output. This came to happen because of poor capacity utilization, outdated technology and
machineries, poor maintenance of plants because of the shortage of spare parts, low skill of workers, high costs of
material inputs, low yield of raw materials, low quality of raw material and the like. Thus, these constraints require the
attention of the pertinent body.
A paired t-test used to examine the hypothesis proved that “liberalization has a significant impact on productivity of
Ethiopian Leather Industry.
According to Table 4, Pearson Correlation coefficient for public sector employment before liberalization and after
liberalization was -0.050, which shows inverse relationship. This is because, after 1996, public sector facilities were
transferred to private sector through privatization agency. Thus, after 1998 employment in public sector started
declining which was gradually increasing before that time. In the same table, Pearson correlation coefficient for private
sector employment pre-and post-liberalization was 0.456, which shows weak positive correlation. This is because,
before liberalization, private sector employment was very small and gradually increasing up to 1992. After 1992, it
started increasing very fast at increasing rate. Thus, correlation was significant at the 0.05 level (2-tailed).
To conclude based on all the discussions conducted on all the variables under consideration, the impact of liberalization was
significantly high on Ethiopian Leather Industry.
Recommendations
ELI has to train its workforce. The trained workers will have the potential of increased skill, knowledge and ability to
perform better and fast. Trained workers are supposed to minimize or avoid accidents and produce quality products,
which can attract the attention of users.
The process of liberalization should continue giving it due attention as overdose of liberalization can inflict severe
misery to the economy of the country in general and to the operation and market performance of ELI in particular.
These all changes are believed to have resulted due to economic liberalization. Thus, the concerned body should give
due attention to the processes of liberalization in all sectors of economy.
To increase the productivity of ELI, old machineries and plants have to be replaced by technologically advanced
machineries and plants.
The industry has to give due attention towards solving problems discussed under the statement of the problem. If the
problems are not addressed properly, it is impossible to bring about the productivity at the desired level.
The industry has to make hard effort to increase its production capacity. Currently, there are only 6 tanneries, which
could produce, and export finished products. The rest 18 tanneries produce semi-processed products. However,
currently ELI exports only finished products. The industry should modernize these 18 tanneries to produce and export
finished products. This effort can increase the price of raw hides and skins in the value chain and help suppliers to
benefit from the operation. Currently, the price of raw hides and skins have been seriously fallen and discouraging its
suppliers.
REFERENCES
1. Ahluwalia, I. J. (1992). Productivity and Growth in Indian Manufacturing Oxford: Oxford University Press, 1991,
(Second Impression in 1992).
Volume 5, Number 1, January – March’ 2016
ISSN (Print): 2279-0977, (Online): 2279-0985
PEZZOTTAITE JOURNALS SJIF (2012): 3.23, SJIF (2013): 5.057, SJIF (2014): 5.871, SJIF (2015): 6.492
International Journal of Applied Services Marketing Perspectives© Pezzottaite Journals. 1964 |P a g e
2. Vijayakumar, & M., Krishnaveni. (2005, May). Management and Labour Studies, 30(2), 150-151.
3. Brahmanada, P. R. (1982, November). Productivity in Indian Economy Rising Inputs for Falling Outputs, pp. 2.
Himalaya Publishing House.
4. Dalton, E. McFarland. (1974). Management Principles and Practices, pp. 537. New York: Macmillan.
5. Debub, Negarit Gazeta. (2002, August). Issued by the Southern Nations Nationalities and Peoples Regional State, No.
15, Awassa. This is the type of Gazeta in which different proclamations are made known officially or publicly.
6. Dension, E. (1962). The Source of Economic Growth in the United States and the Alternatives Before US. New York.
7. (2002, August). Federal Democratic Republic of Ethiopia. The Industrial Development Strategy, pp. 2-3.
8. Forrester, J. V. (1993). Low Productivity: It is a Problem or a Merely Symptom? [Handbook for Productivity
Measurement and Improvement]. Cambridge: Productivity Press.
9. Gitlow, H. S., & Hertz, P. T. (1983, September-October). Product defects and Productivity. Harvard Business Review,
(5).
10. Ibid, 9.
11. Kendrick, W. J. (1980). An Introduction to the Dynamics of Productivity Change. Johns Hopkins University Press.
12. Kendrick, W. J., & Beatrice, N. V. (1980). New Development in Productivity Measurement and Analysis. Chicago:
The University of Chicago Press.
13. Koss, E., & Lewis, D. A. (1993). “Productivity or Efficiency Measuring What We Really Want. National Productivity
Review, 12, 273–295.
14. Aswathappa, K. (1999). Human Resource and Personnel Management: Text and Cases (2nd Edition), pp. 266-292.
New Delhi: McGraw-Hill.
15. Michael, Porter. (1992, April-June). Quoted in G.S. Gokhale, Role of Productivity in Cotton Textile Mill Industry.
Productivity, 33(1).
16. Milton, L. Rock. Handbook of Wages and Salary Administration, pp. 74.
17. M., S. Gadel, & P., H. Krielt. Relationship of Aptitudes Interest, Performance and Job Satisfaction of IBM Operators.
Personnel Psychology, 5(4), 207-212-.
18. Tripathi, P. C. (1999). Personnel Management and Industrial Relations (Reprint). New Delhi: Sultan Chand and Sons.
19. Rastogi, P. N. (1988). Productivity, Innovation, Management and Development: A Study in the Productivity Cultures
of Nations and System Renewal, pp. 17. New Delhi: Sage Publications India Private Limited.
20. Randall, S. Schuler. (et. al.). (1989). Effective Personnel Management (3rd Edition), pp. 385. New York: West
Publishing.
21. Randall, S. Schuler. (1981). Personnel and Human Resource Management, pp. 221. New York: West Publishing.
22. Rastogi, P. N. (1988). Productivity, Innovation, Management and Development. New Delhi: Sagi Publications.
23. Robert, Dubin. (1974). Human Relations in Administration, pp. 53. New Delhi: Prentice-Hall of India.
24. Mathis, R. L., & Jackson, J. H. (1982). Personnel – Contemporary Perspectives and Applications, pp. 225. New York:
West Publishing.
25. Thomas, H. Stone. (1989). Understanding Personnel Management, pp. 173. CBS College Publishing.
Volume 5, Number 1, January – March’ 2016
ISSN (Print): 2279-0977, (Online): 2279-0985
PEZZOTTAITE JOURNALS SJIF (2012): 3.23, SJIF (2013): 5.057, SJIF (2014): 5.871, SJIF (2015): 6.492
International Journal of Applied Services Marketing Perspectives© Pezzottaite Journals. 1965 |P a g e
26. Vijayakumar, A., & Krishnaveni, M. (2005, May). Management and Labour Studies, 30(2), 150-151.
27. Mariappan, V., & Chidambaram, K. (2003, April 19). Public Sector Textile Mills. Economic and Political Weekly, pp.
1551.
28. William, B. Werther, & Keith, Davis. (1993). Human Resource and Personnel Management (4th Edition), pp. 159.
New York: McGraw-Hill.
29. Retrieved from http://www.articlesbase.com/corporate-articles/impact-of-liberalization-and-globalization-on-product...
30. Retrieved from https://en.wikipedia.org/wiki/Productivity_growth#Characteristics_of_production
31. Retrieved from https://en.wikipedia.org/wiki/Productivity_growth
32. Retrieved from
http://www.academia.edu/6794754/CHAPTER_1_Introduction_to_Human_Resource_Management_CHAPTER_OBJE
CTIV...
*****
CHECK PLAGIARISM SERVICE
Pezzottaite Journals charges nominal fees from Journal Managers, Editors, Section Editors, Copy Editors, Layout Editors,
Proof Readers, Subscription Managers, Reviewers, Readers (Subscribers and Individuals), and Authors to get their
manuscripts scanned for plagiarism.
Indian Users
One Manuscript / article = Rs. 350.00
Two Manuscripts / articles = Rs. 350.00 x 2 = Rs. 700.00 ………As so on...
Formulae = (Numbers of Manuscripts x Rs. 350.00) = Amount to be paid as ‘Online Bank Transfer’ before
availing the services.
International Users
One Manuscript = US$15.00
Two Manuscripts = US$15.00 x 2 = US$ 30 ………As so on...
Formulae = (Numbers of Manuscripts x US$15.00) = Amount to be paid as ‘Online Bank Transfer’ before
availing the services.
Note: Total amount if computed in US$ must be converted into Indian Rupees as per Currency Exchange Rates on the day of
placing the order; Computed amount (in Rupees) is to be transferred in Pezzottaite Journals Bank Account (s); In case, where
the transacted currency is not US$, then, purchaser must consider the exchange rate of domestic country’s currency against
'US$ / Rupees' and transfer the same.
Bank details are available at: http://pezzottaitejournals.net/pezzottaite/bank_accounts_detail.php
FOR ANY CLARIFICATION OR SUGGESTION, WRITE US:
Editor-In-Chief
Pezzottaite Journals,
24, Saraswati Lane, Bohri,
Near Modern Dewan Beverages,
Jammu Tawi – 180002,
Jammu and Kashmir, India.
(Mobile): +91-09419216270 – 71
Volume 5, Number 1, January – March’ 2016
ISSN (Print): 2279-0977, (Online): 2279-0985
PEZZOTTAITE JOURNALS SJIF (2012): 3.23, SJIF (2013): 5.057, SJIF (2014): 5.871, SJIF (2015): 6.492
International Journal of Applied Services Marketing Perspectives© Pezzottaite Journals. 1966 |P a g e
CHANGING ROLE OF MEDIA & OWNERSHIP THINKING IN INDIA:
A PRACTICE OF ETHICS OR BUSINESS
Dr. Tapesh Kiran2 Dr. A. V. N. Murty3
ABSTRACT
In recent times due to the industrialization of the press, the rising cost of production has become a barrier to new entrants.
The result was small businesses were driven out, leaving press ownership largely concentrated in the hands of large media
empires or chains. This has since grown to become a global phenomenon; very few companies control the majority of the
media globally. These trans-national media giants are increasingly expanding vertically and horizontally. Vertical integration
refers to the process by which one media owner acquires all aspects of production and distribution of a single type of media
product. This has further emphasized the role of the media as business. Further integration onto the market brings increased
pressure from the shareholders, directors and bankers to maximize profits. A symbiotic relationship exists between the media
and big business who in the final analysis will turn out to be the advertisers. After all, their products will be displayed in
newspapers. While the paper will discuss various issues revolving around the media and advertising, The modern day media’s
dependence on advertising for revenue has reached astronomical heights, although in different segments of the media, the use
of advertising revenue may vary. Most newspapers increasingly rely on advertising for over 60% of revenue. The bottom line
is that newspapers have to target a class of readers that is being chased by most advertisers - conventionally that is they have
to identify people with disposable income to buy the products of their advertisers. In order to attract advertisers to a
newspaper, its management must be able to show that they have that specific target market the advertisers need. This paper
will evolve a theoretical framework that examines the effects of media ownership and the impact of advertising.
KEYWORDS
Media, Ownership, Economics, Media Economics, Advertisers, Advertising, Effect of Media etc.
INTRODUCTION
The Role of Media Ownership
The newspaper industry has gone through several stages of development. The current 21st century newspaper model, which is
targeted at a mass audience, is quite recent. It developed between the mid – late nineteenth century. Before this, the media was
based on targeting specialized audiences. This was a small audience comprising of the social, political and economic elites. For
newspapers to be profitable during this period, they had to depend on copy sales. Since advertising was minimal or almost
nonexistent, the pricing structure or subscription. The business model of this period depended on circulation. The next business
model adopted was mainly affected by the increase in population, urbanization and the industrial revolution of the early nineteenth
century with its attendant social changes. Newspapers began to target and serve large audiences, consequently adding new
contents to meet the diverse needs of these markets. This new model focused on acquiring more consumers and papers were sold
at very low price. This new development led to the increased reliance on advertising. However due to massive copy sales’,
advertising was still not considered a major source of revenue. Change however, was inevitable; advertising became a very
important source of income. The mass media are first industrial and commercial organizations, which produce and distribute
commodities. The most important aspect of the operation of media as business is that, the production is geared toward the making
of profit. What sells most and realizes the greatest profit is the major determinant of what is produced. Thus, the starting point of
political economy is the economic and industrial organization of the media.
Focus On Media Ownership
In the 21st century, the press is developing on different paradigms, which have shifted away from small to medium privately
owned media. Earlier it was relatively easy to start a newspaper, but in recent times due to the industrialization of the press, the
rising cost of production has become a barrier to new entrants. The result was small businesses were driven out, leaving press
ownership largely concentrated in the hands of large media empires or chains. This has since grown to become a global
phenomenon; very few companies control the majority of the media globally. The effects of globalization worldwide and its effect
on the media. These trans-national media giants have a global agenda and they are increasingly expanding vertically and
horizontally. Vertical integration refers to the process by which one media owner acquires all aspects of production and
2 Assistant Professor, Institute of Mass Communication and Media Technology, Kurukshetra University, Haryana, India,
[email protected] 3Professor, Department of Management, K. L. U. Business School, Andhra Pradesh, India, [email protected]
Volume 5, Number 1, January – March’ 2016
ISSN (Print): 2279-0977, (Online): 2279-0985
PEZZOTTAITE JOURNALS SJIF (2012): 3.23, SJIF (2013): 5.057, SJIF (2014): 5.871, SJIF (2015): 6.492
International Journal of Applied Services Marketing Perspectives© Pezzottaite Journals. 1967 |P a g e
distribution of a single type of media product. Cross-media ownership has developed at a rapid pace in recent years. As the media
industries have become more profitable, non-media firms have started to buy up media properties. This has further emphasized the
role of the media as business. Further integration onto the market brings increased pressure from the shareholders, directors and
bankers to maximize profits. The major motivation for large media companies was growing capital requirements and shareholder
demands for larger profits and more efficiency. Cross media, ownerships, through a wave of mergers and acquisitions, have
quickly assembled empires with major players in the numerous different media sectors. Bottom-line driven cost cutting,
centralization of resources and the closure of media outlets that fail to contribute adequately to the profit bottom-line is also
common practice. As a result, the conglomerates look very attractive to advertisers. Although this development is claimed to
stimulate productivity and economic growth but disregard for broader social interest a narrowing of consumer choice and the
destruction of individual smaller enterprise. It becomes almost very impossible for start-up firms to have a chance to compete
successfully. The studies have shown that concentrated ownership in the press yields diminished editorial voice, the decline of
journalistic values, diminution of the press’ watchdog function, reduction in the diversity of ideas, and consequently, thwarts
democratic deliberation.
The Media Economics
Media economics combines the study of economics with the study of media. It is also the study of the changing market forces that
direct and constrain the choices of managers, practitioners and other decision makers across the media industry. A study of
economics could be carried out on two levels, namely: macroeconomics and microeconomics. Macroeconomics focuses on very
broad economic aggregates and averages. On this level of analysis, the general view of the economy is taken into consideration;
issues of total output, total employment, national incomes, economic growth for example. On the macroeconomic level, the
overall performance of the economy has serious implications for the way the media would perform; the growth of the national
economy could be directly or indirectly proportional to the growth of the media industry. As the advertisers, grow in profit, the
media industry that is largely dependent on advertising revenue, as income will also grow and profit. On the microeconomic level,
the performance of the individual markets, products and firms will be analyzed. Microeconomics is concerned with the individual
behavior of individual economic units, notably the firm and the household, the role of the relative prices in affecting behavior. The
economics and financing of media companies are the foundation upon which all media activities take place. Regardless of media’s
cultural, political, social roles and expectations, “media must cover their cost and show profit, just as any other business, or they
would wither and disappear. A contemporary business practice, which seems to affect most business entities, is the global trend of
expansion, diversification and ever-increasing concentration of media ownership amongst major players in the media and
communication industry. Increasing competition and the strategic advantage of consolidation and media concentration has led to
strategies to exploit new economic opportunities to keep ahead of competitor. Global competition is fierce competition, and firms
need to be fast on the uptake if they are to survive. Media industries operate in a business environment and are affected by the
same variety of economic and financial forces that affect normal business entities, their response to these forces must be in a
business-like manner. A major business imperative is growth and survival, the logic of economics of scale and scope is an
incentive to expand media products sales into secondary external or overseas markets. Media products are different from other
products we consume, what makes the media unique is that it deals in ‘dual products’. Selling content to the audience while also
selling the audience to the advertiser. All media firms are involved in the production and distribution of media products ‘one thing
they all have in common’. The print media, however, differs from the electronic media because of its reliance on advertising
revenue for at least 60% of its income; the electronic media depends on advertising revenue for almost 100% of its income if it is
not a public broadcaster. The print and electronic media also distribute their product differently. Another distinction between the
media and a normal firm is the basis for operation. The traditional assumption of every commercial firm is the drive to maximize
profit. The assumption that all firms seek to maximize profit is central to the economic theory of the firm. With the media, it is
often argued that the bottom-line is not primarily the reason for its establishment. While this could be contested, the media prides
itself as being motivated by other goals, public service, information, entertainment and the watch dog role, to mention a few.
Some media organization, the pursuit for profits is obvious, to other disguising the economic interest of the firm serves
management. The talk of moneymaking is likely to be rare in market driven newsrooms, the logic that drives news routines
nevertheless, is economic. It is reasonable for media owners to expect profit from their investments. After all, in setting up the
business, they had taken on a measure of risk. Profitability is crucial to all media companies because it allows firms to produce
their own financial resources and make them more attractive to lenders and other sources of capital when they require additional
financing to support their strategies and activities”.
A media firm has to consider certain economic factors if it were to succeed in the market. Picard acknowledges certain factors,
which include market forces, cost forces, regulatory forces, barriers to entry and mobility. Market forces are external forces based
on structures and choices in the market place. Cost forces are internal pressure based on the operating expenses of the firm. The
competitive market structure within which media operates will have an important bearing on how effectively media firms organize
their resources and business affairs. Market forces exert their influence on a media firm by trying to determine how it sources
capital for its establishment and operations. The forces also affect how media creates a sustainable demand for its product as well
as determine how competitive that product will be, depending on the market structure that exists. The amount of competition that
exists between media units would affect the development and success of those media firms. More competitors, however, would
Volume 5, Number 1, January – March’ 2016
ISSN (Print): 2279-0977, (Online): 2279-0985
PEZZOTTAITE JOURNALS SJIF (2012): 3.23, SJIF (2013): 5.057, SJIF (2014): 5.871, SJIF (2015): 6.492
International Journal of Applied Services Marketing Perspectives© Pezzottaite Journals. 1968 |P a g e
ensure a continuing struggle to improve or maintain their media share. A healthy competition could actually benefit the audience
and advertisers. Media firms must also have adequate strategies to manage the costs involved in staying operational. Most
important could be evolving strategies to manage the cost of production and distribution, the cost of acquiring content as well as
the cost implications of marketing the product. The cost implication for media firms will depend on the kinds of product or
content, they produce. The print media he argues, devotes a greater percentage of overall cost to the production and distribution of
their product, typically between 40 and 60 percent. This is due to the physical need to produce and distribute the product.
Newspapers (especially those with their own distribution network), have to weather a greater cost of distribution because cost
arises as the distance to the costumer increases. Distribution costs however, become more manageable due the density of
customers in a target area. Advertising or marketing media products become a necessity if the products exist in a competitive
market. However if the products exist as monopoly, there is little need for advertising or marketing.
FACTORS OF ENTRY BARRIER
Capital Requirements
A major barrier for a new entrepreneur could be the inability to access enough funds. These funds must cover startup costs as well
as projected cost for a certain period before the paper becomes profitable. It is common knowledge that most newspapers and
magazines may run at a loss for a long period before breaking even or declaring profit. It could take up to five years or more for a
newspaper to recover cost and declare profit. Most often, this is the length of time it takes for it to overcome most of the economic
factors listed here.
Economies of Scale and Scope
These can also play a major role in the survival of a new entrant. In a competitive market with already established products, it
becomes a difficult task to quickly achieve the high. Quality output and sales necessary to provide a chance of competing
effectively. It costs less to print 50,000 copies of a newspaper than to print 20,000 copies. An already established firm could also
purchase production material in bulk thereby reducing overall costs. Firms with economies of scale can thus sell products and
services at a lower price or retain greater profits than firms with lower economies of scale or diseconomies of scale. Economies of
scope enjoyed by multiple product firms may deter entry; this sometimes involves vertical integration, with the same company
involved in production, distribution and retailing of these products. If a product does not find a proper and effective distribution
channel, it is bound to suffer. He notes that major media companies enter into exclusivity contracts or joint distribution networks
that they could keep closed to a new competitor. While it is almost impossible for new entrants to overcome these barriers, except
they exist as part of a conglomerate, it is often possible for new entrants to reduce the barriers to entry. Introducing new
techniques and methods of operation that avoid traditional cost structures, new firms could sometimes overcome barriers to entry.
If their products come with innovations, the firms could also overcome these barriers. As a last resort, a new company might enter
into joint ventures with existing firms in the market or with firms that have the resources to overcome the barriers.
Features of Newspaper Firms
The newspaper as a source of information has certain features that make it different from other information sources such as books,
periodicals, radio, television and Internet. No other source can compete with a newspaper in the abundance and variety of
information. The huge volume of information in newspapers is usually timely and instant and much more closely related to social
reality and people's daily life, which gives newspapers superiority over books and periodicals. Newspapers can have a massive
readership and a huge circulation comparatively speaking, the information provided by newspapers is of higher authenticity, and
once it is issued, the information is recorded in a stable and unchangeable way, which gives newspapers an advantage over radio,
television and internet. Newspapers while sharing certain characteristics with other media have certain characteristics, which may
distinguish them from other media. These characteristics are on three levels namely; market characteristics, financial
characteristics, and operational characteristics.
Market Characteristics
A newspaper will have a strong link to a geographical location. It is often targeted at the market situated at its immediate
production environment, unlike the electronic media whose reach extends far beyond its geographic environment. Newspapers,
unlike books or magazines have a shorter product lifespan and the barriers to entry are higher as well. Newspapers often have a
stable circulation, but declining market penetration becomes a problem when there are a large number of competing products.
Advertisers will often go for newspapers with a larger circulation, meaning that newspapers with lower circulation, if not catering
to a niche market, will be starved of advertising. Newspapers are constantly facing new threats from new technologies escalating
the cost of production or upgrading existing facilities. A major threat to newspapers right now is the significant loss of advertising
revenue to the electronic media.
Volume 5, Number 1, January – March’ 2016
ISSN (Print): 2279-0977, (Online): 2279-0985
PEZZOTTAITE JOURNALS SJIF (2012): 3.23, SJIF (2013): 5.057, SJIF (2014): 5.871, SJIF (2015): 6.492
International Journal of Applied Services Marketing Perspectives© Pezzottaite Journals. 1969 |P a g e
Financial & Cost Characteristics
Newspaper production is expensive; its fixed cost and production costs are high. Newspapers therefore, must cover costs that
include content, staff remuneration, manufacturing and printing costs on a daily basis, because most newspaper costs are fixed, the
opportunity to make savings when circulation falls is relatively limited. It is expensive to distribute newspapers. The major
contributory factors include the physical bulk of newsprint and the logistics of distribution in a geographical location coupled with
the variables of time and space. Newspapers however, have low marketing costs, as each daily edition ensures continuity. While
the cost of first-copy is high, variable costs for newspapers are moderate due to the economies of scale. The higher the amount of
copies produced, the less expensive it becomes on the long run. Paper or newsprint typically accounts for some 20 percent of a
newspaper’s total costs.
Operational Characteristics
Most newspapers are small and Medium Enterprises (SMEs), but a few large firms own a number of them. However, concentrated
ownerships are on the increase. Newspaper production is labor and equipment intensive, complex logistics are involved in the
daily running of newspapers. Newspapers like the electronic media have a high dependence on advertising revenue, but
advertising revenue stabilizes with long-term contracts. Newspapers participate in what is called a ‘dual-product’ market;
newspaper content (news reports, features etc.) is produced by journalists and editors in order to attract readers. Access to readers
is then priced and sold to advertisers.
Newspapers and the Pricing Behavior
The newspaper like any other product must be acquired at a price. Newspapers occupy a unique position in the market because
they do not really depend on the price of its product to make profit. While the newspaper produces one kind of product, it however
markets its product to two different kinds of customers. The “pricing behaviors of newspapers are influenced by a variety of
factors- industry structure, the nature and amount of inter- and intra- media competition, circulation. However, this study must
quickly identify the fact that for pricing in newspapers, a distinction must be made about which market is buying what? This is
because newspapers set two kinds of prices, the price at which the newspaper is offered to the readership and the price of
advertising space to the advertiser. This creates two parallel markets for its product. However, the amount charged for advertising
is more dependent upon the sizes and the characteristics of the audiences than the sizes of the advertisement themselves. The kind
of market also affects the pricing of this dual product. If the newspaper is in a monopoly, it is obvious that it will not really be
challenged for its market share and can afford to price it products accordingly. A newspaper in a competitive environment will
consider the pricing structure of its rivals before setting its own price. The pricing behavior of newspapers in a small or
moderately sized market does not influence the advertiser, in a national market, that may be influential because, demand is
especially sensitive to price changes when there is another competing daily paper and its audience demographics are similar, and
the disparity in circulation between the two papers is not great. A newspaper will inherently have a cover price and an advertising
price, but will factor its profit margin into any transaction with its clients. The ratio of advertising to editorial space is what
determines the profitability of a newspaper.
This creates a puzzle whether, should profitability be left at the behest of the amount of advertising a newspaper gets? How
important is the pricing strategy to a newspaper? This question has been contested in many quarters. The pricing structure of a
newspaper is directly proportional to the amount of advertising it gets, or a paper that relies more on creating advertising space is
more concerned with its circulation. The more readers it gets, the more its advertising space is worth. That is why selling as many
copies as possible could lead to low prices. It is therefore not surprising that newspaper managements do not also take pricing
seriously, as the pricing issue has also been ignored in major newspaper management texts. The major contributors to media
economics overlook this important aspect as if copy price and advertisement rates play an important part in the newspaper. While
the effect of copy price on advertising is relative, the fact remains that advertising sales is influenced by circulation. Therefore, a
theory on the pricing structures in the newspaper should place an equal emphasis on both. The importance of both pricing
structures and the accustomed standard has generally been circulation; the business public is beginning to realize that something
more than paid subscribers determines the value of a newspaper as an advertising medium”. It is believed that what attracts
advertisers to a newspaper is its circulation, but newspaper readers could also be attracted to the newspaper because of the
advertising inserts it will be noted that the circulation is the link between the two products sold by the newspaper–printed matter
for readers and space for advertisers. The circulation is the quantity sold of one of the products and determines the quality of the
other. A link in the reverse direction is also possible. ...We shall assume the absence of this reverse link, as it is generally not
sufficiently important to justify the complexities with its introduction into the analysis would involve.
THE ROLE OF MEDIA ADVERTISER & ADVERTISING
A symbiotic relationship exists between the media and big business who in the final analysis will turn out to be the advertisers.
After all, their products will be displayed in newspapers. While this section will discuss various issues revolving around the media
Volume 5, Number 1, January – March’ 2016
ISSN (Print): 2279-0977, (Online): 2279-0985
PEZZOTTAITE JOURNALS SJIF (2012): 3.23, SJIF (2013): 5.057, SJIF (2014): 5.871, SJIF (2015): 6.492
International Journal of Applied Services Marketing Perspectives© Pezzottaite Journals. 1970 |P a g e
and advertising, advertising should be seen as unavoidable that has its merits. The media industry is in a constantly evolving
environment; as the economics of running a media entity become more defined, especially with threats of competition for media
revenue, the relationship between the press and advertisers might only blossom.
ECONOMIC REALITIES OF THE MODERN MEDIA
The reality of the market place makes the press increasingly dependent on sources of revenue that compromises its independence.
This is because the media has increasingly had to depend on other sources of revenue generation other than the sales of copy. The
press has rather become a business entity. Its public service role; a primary one being the provision of information only increases
its ratings for audiences, while the major aim seems to be selling the audience to the advertisers for profit. Investors and
shareholders whose main interest is the profit margin now control news corporations. The drive for profit has, encouraged the
entry of speculators and increased the pressure and temptation to focus more intensely on profitability. The owners view media
and journalism like any other industry, refuse to recognize any larger social or public interest in what their television, newspapers
and radio outlets do, with an interest only in the bottom line and in the share market’s demand for constant large-scale growth. A
growing number of newspaper journalists feel that management is embracing of a "market-driven" business strategy threatens
their professionalism and conflicts with the historical role of newspapers in the Indian democracy. These journalists believe
management is asking for fundamental changes in the practice of journalism. These changes - the journalist as a business agent,
smaller newsroom staffs, and less resources with which to work, increasingly show that management and journalists have
conflicting agendas. It is therefore important for a newspaper’s management to preserve the independence of the newsroom, as it
is equally important for journalists to recognize the changing environment, which calls for paying equal attention to the business
side of the running a newspaper of which advertising revenue plays a key role.
THE ROLE OF ADVERTISING IN THE MEDIA
The role of mass communications and advertising within the institutional structures of contemporary capitalist society has been
examined and questioned in substantial literature. However, most of the available literature examines the content and structure of
advertisements and note their ability to distort information or the ideological effect that advertisements have on the audience and
located them within the history of contemporary capitalism, examining their impact on the socio-political economic structures.
While the origins of the advertising industry has been located within the evolution of the global economy from an Industrial to a
Consumer society. Advertising has become a central institution of the market-industrial economy. Commercial linkages have
expanded as advertising and media firms come together through mergers, partnerships, joint ventures, strategic alliances, and the
other forms that structural transformation takes in this industry. The rising cost of news production and the realization by the
business sector on the relevance of displaying their products to a wider market, has played a major role in the growth of the
advertising industry and the dependence on advertising revenue by the press. Advertising can be seen as an important institution in
the consumer society because of its economic benefits; mainly in managing consumer demand and aiding capital accumulation.
The modern day media’s dependence on advertising for revenue has reached astronomical heights, although in different segments
of the media, the use of advertising revenue may vary. The press unlike the electronic media ‘which depends solely on
advertising’ depends on both advertising and the sale of copy. Most newspapers increasingly rely on advertising for over 60% of
revenue, and thus need to be sensitive to the needs of advertisers, and this impact on their readers. The bottom line is that
newspapers have to target a class of readers that is being chased by most advertisers - conventionally that is they have to identify
people with disposable income to buy the products of their advertisers. In order to attract advertisers to a newspaper, its
management must be able to show that they have that specific target market the advertisers need. This also means that the
circulation figures of the paper must be attractive to the advertisers. A quality newspaper targeted at the right audience, with a
high circulation figure is definitely a goldmine.
THE ADVERTISING EFFECT ON THE MEDIA
Advertising and its implications for the political economy of the media has been criticized and defended from many quarters.
Advertising is both attacked as a monopolistic and wasteful practice and defended as promoting competition and lowering cost
that consumers pay for goods. That advertising revenue is contributing to the global economy is not in dispute. Advertising
comprises roughly 2% of the GNP. Whatever the exact figure might be globally, the investment in advertising, marketing and
promotions in turn promotes the trends towards monopoly concentration, conglomerate mergers and takeovers, and an economy
dominated by giant corporations. A major advantage of advertising is that revenue generated empowers the media, consequently
providing funding for better facilities for the practice of journalism. While the benefits of advertising seem laudable, studies have
shown that this advantage seems to be minimal as the drive for profit often leads to downsizing of newsrooms, overworking of
journalists, lack of adequate training and poor remuneration what seems to be the impact of advertising on overall media content.
The negative impact of advertising includes the avoidance of controversial subjects, banal programme formats, stereotyping of
audience segments and ownership concentration in media industries. The concentration of media ownership with its links to
advertising has a profound impact on media content. The reliance on advertising, whether as a partial or total revenue source,
could affect its content, first as the advertisement being a substantial part of the content could affect its value and secondly as
Volume 5, Number 1, January – March’ 2016
ISSN (Print): 2279-0977, (Online): 2279-0985
PEZZOTTAITE JOURNALS SJIF (2012): 3.23, SJIF (2013): 5.057, SJIF (2014): 5.871, SJIF (2015): 6.492
International Journal of Applied Services Marketing Perspectives© Pezzottaite Journals. 1971 |P a g e
content is often aligned to promote or create a suitable environment for the advertiser. The media’s dependence on advertising
could result in their pandering to the demands of advertisers.
REFERENCES
1. Bampo, Mauro, Michael, T. Ewing, Dineli, R. Mather, David, Stewart, & Mark, Wallace. (2008). The Effects of the
Social Structure of Digital Networks on Viral Marketing Performance. Information Systems Research, 19, 273-290.
2. Bourlakis, Michael, Savvas, Papagiannidis, & Feng, Li. (2009). Retail Spatial Evolution: paving the way from
traditional to metaverse retailing. Electronic Consumer Research, 9,135-148.
3. Campbell, Colin, Leyland F. Pitt, Michael, Parent, & Pierre, R. Berthon. (2011). Understanding Consumer
Conversations around Ads in a Web 2.0 World. Journal of Advertising, 40, 87-102.
4. Casalo, Luis V., Flavian Carlos, & Miguel Guinaliu. (2008). Promoting Consumer’s Participation in Virtual Brand
Communities: A New Paradigm in Branding Strategy. Journal of Marketing Communications 14, 19-36.
5. Cha, Jiyoung. (2009). Shopping on Social Networking Websites: Attitudes towards real versus virtual items. Journal of
Interactive Advertising, 10, 77-93.
6. Cheong, Hyuk Jun, & Margaret, A. Morrison. (2008). Consumers’ Reliance on Product Information and
Recommendations Found in UGC. Journal of Interactive Advertising, 8, 38-49.
7. Chi, Hsu-Hsien. (2011). Interactive Digital Advertising VS. Virtual Brand Community: Exploratory Study of User
Motivation and Social Media Marketing Responses in Taiwan. Journal of Interactive Advertising, 12, 44-61.
8. Cox, Shirley A. (2010). Online Social Network Member Attitude toward Online Advertising Formats (MA Thesis).
The Rochester Institute of Technology.
9. Chu, Shu-Chuan. (2011). Viral Advertising in Social Media: Participation in Facebook Groups and Responses among
College-Aged Users. Journal of Interactive Advertising, 12, 30-43.
10. Curran, Kevin, Sarah Graham, & Christopher Temple. (2011). Advertising on Facebook. International Journal of E-
Business Development, 1, 26-33.
11. Di Pietro, Loredana, & Elenora, Pantano. (2012). An Empirical Investigation of Social Network Influence on Consumer
Purchasing Decision: The Case of Facebook. Journal of Direct Data and Digital Marketing Practice, 14, 18-29.
12. Ferguson, Rick. 2008. Word of Mouth and Viral Marketing: Taking the Temperature of the Hottest Trends in
Marketing. Journal of Consumer Marketing, 25, 178-182.
13. Georgi, Dominik, & Moritz, Mink. (2012). eCCIq: The quality of electronic customer-to customer interaction, Journal
of Retailing and Consumer Services. Retrieved from http://dx.doi.org/10.1016/j.jretconser.2012.08.002.
14. Golan, Guy J., & Lior, Zaidner. (2008). Creative Strategies in Viral Advertising: An Application of Taylor’s Six-
Segment Message Strategy Wheel. Journal of Computer –Mediated Communications, 13, 959-972.
15. Gonzalez, Cuitlahuac. (2010). Social Media Best Practices for Communication Professionals through the Lens of the
Fashion Industry (MA Thesis). The University of Southern California.
16. Harris, Lisa, & Charles, Dennis. (2011). Engaging customers on Facebook: Challenges for e-retailers. Journal of
Consumer Behavior, 10, 338-346.
17. Hassanein, Khaled, & Milena, Head. (2005-6). The Impact of Infusing Social Presence in the Web Interface: An
Investigation across Product Types. Interactive Journal of Electronic Commerce, 10, 31-55.
18. Heinonen, Kristina. (2011). Consumer Activity in Social Media: Managerial Approaches to Consumers’ Social Media
Behavior. Journal of Consumer Behavior, 10, 356-364.
Volume 5, Number 1, January – March’ 2016
ISSN (Print): 2279-0977, (Online): 2279-0985
PEZZOTTAITE JOURNALS SJIF (2012): 3.23, SJIF (2013): 5.057, SJIF (2014): 5.871, SJIF (2015): 6.492
International Journal of Applied Services Marketing Perspectives© Pezzottaite Journals. 1972 |P a g e
19. Hill, Shawndra, Foster, Provost, & Chirs, Volinsky. (2006). Network Based Marketing: Identifying Likely Adaptors via
Consumer Networks. Statistical Science, 21, 256-276.
20. Kaplan, Andreas M., & Michael, Haenlein. (2010). Users of the World, Unite! The Challenges and Opportunities of
Social Media. Business Horizons, 53, 59-68.
21. Kelly, Louis, Gayle, Kerr, & Judy, Drennan. (2010). Avoidance of Advertising in Social Networking Sites: The
Teenage Perspective. Journal of Interacting Advertising, 10, 16-27.
22. Mady, Tarek T. 2011. Sentiment Toward Marketing: Should We Care About Consumer Alienation And Readiness To
Use Technology? Journal of Consumer Behavior 10, 192-204.
23. Mangold, Glynn W., & David J. Faulds. 2009. Social Media: The New Hybrid Element of the Promotion Mix. Business
Horizons 52, 357-365.
24. Retrieved from http://wiredspace.wits.ac.za/bitstream/handle/10539/1549/Bassey_Chapter2.pdf?sequence=5
25. Retrieved from http://www.academia.edu/11414995/Social_Media_as_a_Marketing_Tool-_A_Literature_Review
26. Retrieved from
http://wiredspace.wits.ac.za/bitstream/handle/10539/1549/Bassey_Chapter6.pdf?sequence=9&isAllowe...
27. Retrieved from
http://www.researchgate.net/publication/264896673_BRAND_CONVERSATION_IN_FACEBOOK_LA_PERCEZIO
NE_DEGLI...
28. Retrieved from http://citeseerx.ist.psu.edu/viewdoc/summary?doi=10.1.1.167.5391
29. Retrieved from http://ir.inflibnet.ac.in/bitstream/1944/567/1/25(cal%2006).pdf
*****
CHECK PLAGIARISM SERVICE
Pezzottaite Journals charges nominal fees from Journal Managers, Editors, Section Editors, Copy Editors, Layout Editors,
Proof Readers, Subscription Managers, Reviewers, Readers (Subscribers and Individuals), and Authors to get their
manuscripts scanned for plagiarism.
Indian Users
One Manuscript / article = Rs. 350.00
Two Manuscripts / articles = Rs. 350.00 x 2 = Rs. 700.00 ………As so on...
Formulae = (Numbers of Manuscripts x Rs. 350.00) = Amount to be paid as ‘Online Bank Transfer’ before
availing the services.
International Users
One Manuscript = US$15.00
Two Manuscripts = US$15.00 x 2 = US$ 30 ………As so on...
Formulae = (Numbers of Manuscripts x US$15.00) = Amount to be paid as ‘Online Bank Transfer’ before
availing the services.
Note: Total amount if computed in US$ must be converted into Indian Rupees as per Currency Exchange Rates on the day of
placing the order; Computed amount (in Rupees) is to be transferred in Pezzottaite Journals Bank Account (s); In case, where
the transacted currency is not US$, then, purchaser must consider the exchange rate of domestic country’s currency against
'US$ / Rupees' and transfer the same.
Bank details are available at: http://pezzottaitejournals.net/pezzottaite/bank_accounts_detail.php
Volume 5, Number 1, January – March’ 2016
ISSN (Print): 2279-0977, (Online): 2279-0985
PEZZOTTAITE JOURNALS SJIF (2012): 3.23, SJIF (2013): 5.057, SJIF (2014): 5.871, SJIF (2015): 6.492
International Journal of Applied Services Marketing Perspectives© Pezzottaite Journals. 1973 |P a g e
SATISFACTION LEVEL OF EMPLOYEES OF PUBLIC SECTOR BANKS:
A STUDY WITH REFERENCE TO CHENNAI CITY
Dr. K. Shanthi4
ABSTRACT
Staff well-being and their level of satisfaction and engagement have been found to directly impact on organizational
performance and ultimately organizational success. It is an obvious statement but high employee satisfaction levels can
reduce employee turnover. Dissatisfied employees tend to perform below their capabilities, result in high turnover of staff and
leave their jobs relatively quickly, and are not very likely to recommend your company as an employer. Satisfied employees
tend to contribute more in terms of Organizational productivity and maintaining a commitment to customer satisfaction.
This study is based on an analysis of job satisfaction made on employees of 5 public sector banks located in Chennai. The
purpose of the study was to find whether there is any significant difference between the male and female employees of these
banks and their satisfaction levels, designation, qualification, experience of employees and their satisfaction levels. It was
found that there exists no significant difference among the above-mentioned demographic factors and their satisfaction levels.
The result of the Independent sample t test did not show any significant difference among the male and female groups.
KEYWORDS
Pay Package, Pension, Allowances, Retirement Benefits etc.
INTRODUCTION
Job satisfaction describes how content an individual is with his or her job. “Job satisfaction can be defined as acceptance of goals,
willingness to work hard and intention to stay with the organization.” Work has an economic aspect as well as mechanical aspect;
it has also a psychological aspect. The happier people are within their job, the more satisfied they are said to be. Job satisfaction
is not the same as motivation, although it is clearly linked. Job design aims to enhance job satisfaction and performance; methods
include job rotation, job enlargement and job enrichment. Other influences on satisfaction include the management style and
culture, employee involvement, empowerment and autonomous work groups. Job satisfaction is a very important attribute, which
is frequently measured by organizations.
The focus of the present study is to know the perception of employees working with Public sector banks with regard to their pay,
pension, allowances and other benefits offered to them. The extent of the satisfaction that is assessed through this study helps to
know about whether the present benefits are sufficient or whether there exists a need to further focus on certain areas which are
found to be unsatisfactory for the Job satisfaction can defined as the extent of positive feelings or attitudes that individuals
have towards their jobs. When a person says that he has high job satisfaction, it means that he really likes his job, feels good about
it and values his job dignity. Job satisfaction is important technique used to motivate the employees to work harder. It is often
said, “A happy employee is a productive employee.”
OBJECTIVES OF STUDY
To examine whether there exists any significant difference between the gender and satisfaction of employees with
special reference to the pay packages.
To find out whether there is any significant difference between the satisfaction and qualification, designation and
experience of employees and
RESEARCH METHODOLOGY
The methodology of the study is based on the primary data collected through a well-framed and structured questionnaire to elicit
the well-considered opinions of the respondents. The study is confined to only five Public Sector Banks in Chennai to assess the
perception of the employees with regard to their pay, pension, allowances etc. The sample has been considered a representative
sample for public sector banks. The following are the analyses made for the study.
4 Assistant Professor, P.G. & Research Department of Commerce, D. G. Vaishnav College, Tamil Nadu, India,
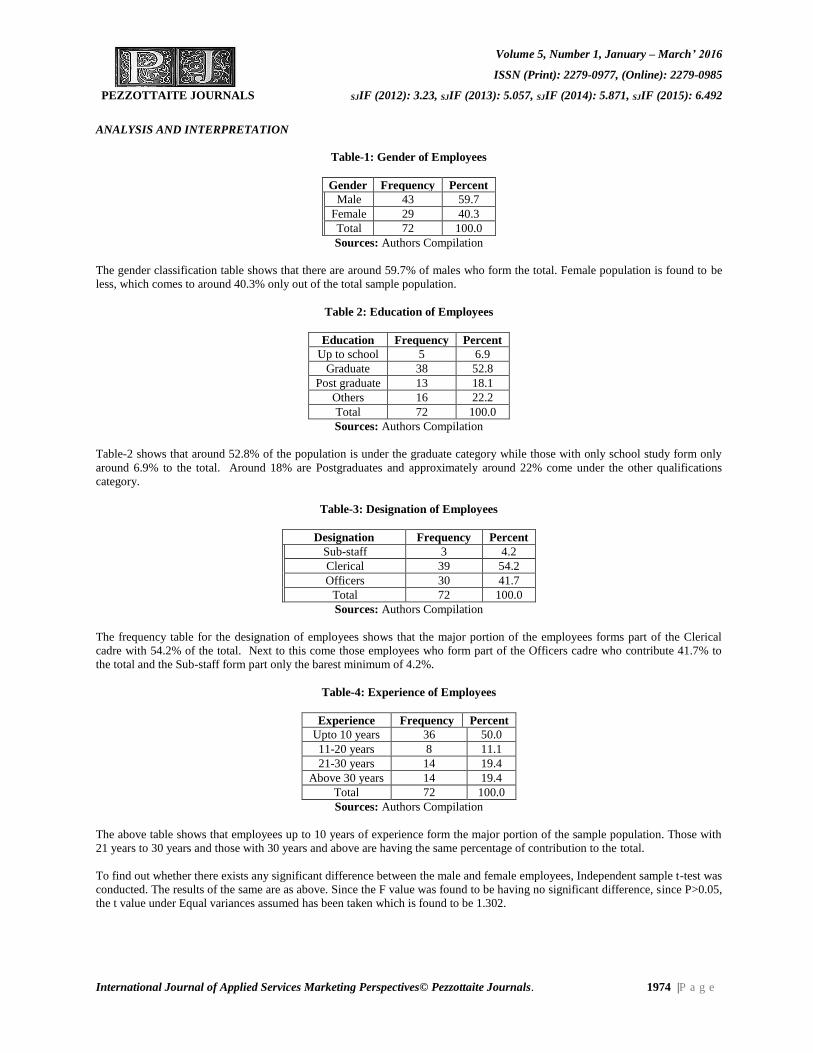
Volume 5, Number 1, January – March’ 2016
ISSN (Print): 2279-0977, (Online): 2279-0985
PEZZOTTAITE JOURNALS SJIF (2012): 3.23, SJIF (2013): 5.057, SJIF (2014): 5.871, SJIF (2015): 6.492
International Journal of Applied Services Marketing Perspectives© Pezzottaite Journals. 1974 |P a g e
ANALYSIS AND INTERPRETATION
Table-1: Gender of Employees
Gender Frequency Percent
Male 43 59.7
Female 29 40.3
Total 72 100.0
Sources: Authors Compilation
The gender classification table shows that there are around 59.7% of males who form the total. Female population is found to be
less, which comes to around 40.3% only out of the total sample population.
Table 2: Education of Employees
Education Frequency Percent
Up to school 5 6.9
Graduate 38 52.8
Post graduate 13 18.1
Others 16 22.2
Total 72 100.0
Sources: Authors Compilation
Table-2 shows that around 52.8% of the population is under the graduate category while those with only school study form only
around 6.9% to the total. Around 18% are Postgraduates and approximately around 22% come under the other qualifications
category.
Table-3: Designation of Employees
Sources: Authors Compilation
The frequency table for the designation of employees shows that the major portion of the employees forms part of the Clerical
cadre with 54.2% of the total. Next to this come those employees who form part of the Officers cadre who contribute 41.7% to
the total and the Sub-staff form part only the barest minimum of 4.2%.
Table-4: Experience of Employees
Sources: Authors Compilation
The above table shows that employees up to 10 years of experience form the major portion of the sample population. Those with
21 years to 30 years and those with 30 years and above are having the same percentage of contribution to the total.
To find out whether there exists any significant difference between the male and female employees, Independent sample t-test was
conducted. The results of the same are as above. Since the F value was found to be having no significant difference, since P>0.05,
the t value under Equal variances assumed has been taken which is found to be 1.302.
Designation Frequency Percent
Sub-staff 3 4.2
Clerical 39 54.2
Officers 30 41.7
Total 72 100.0
Experience Frequency Percent
Upto 10 years 36 50.0
11-20 years 8 11.1
21-30 years 14 19.4
Above 30 years 14 19.4
Total 72 100.0
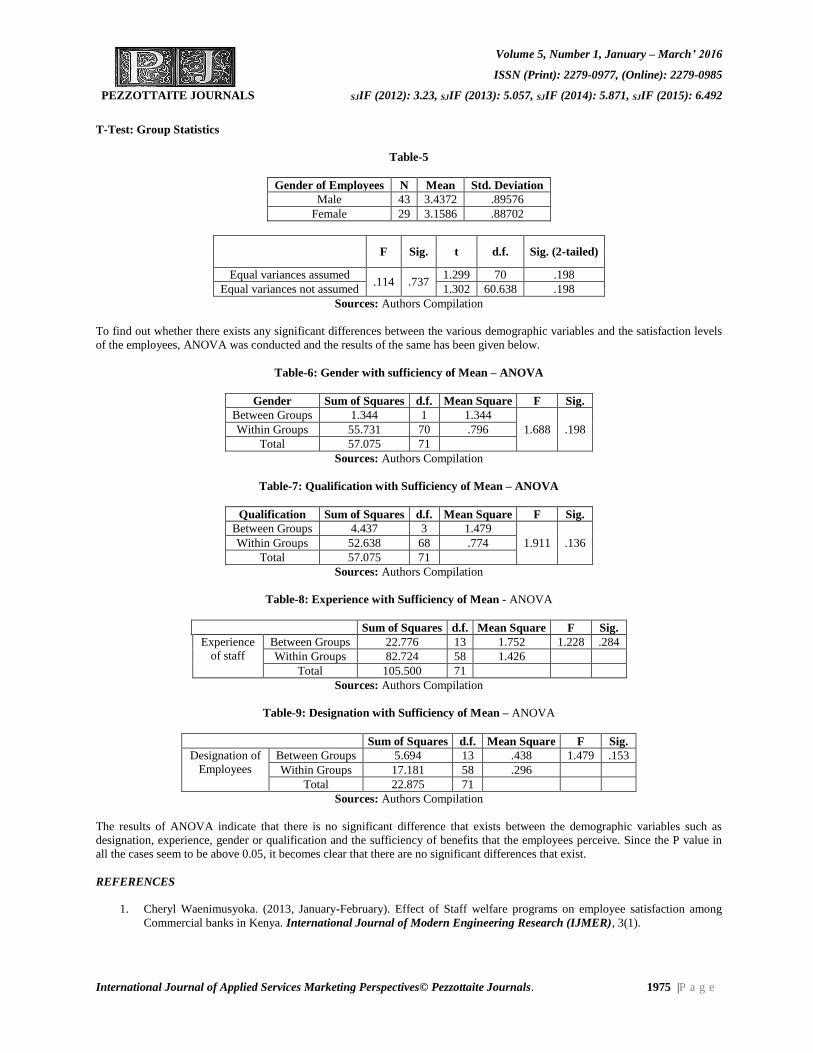
Volume 5, Number 1, January – March’ 2016
ISSN (Print): 2279-0977, (Online): 2279-0985
PEZZOTTAITE JOURNALS SJIF (2012): 3.23, SJIF (2013): 5.057, SJIF (2014): 5.871, SJIF (2015): 6.492
International Journal of Applied Services Marketing Perspectives© Pezzottaite Journals. 1975 |P a g e
T-Test: Group Statistics
Table-5
Gender of Employees N Mean Std. Deviation
Male 43 3.4372 .89576
Female 29 3.1586 .88702
F Sig. t d.f. Sig. (2-tailed)
Equal variances assumed .114 .737
1.299 70 .198
Equal variances not assumed 1.302 60.638 .198
Sources: Authors Compilation
To find out whether there exists any significant differences between the various demographic variables and the satisfaction levels
of the employees, ANOVA was conducted and the results of the same has been given below.
Table-6: Gender with sufficiency of Mean – ANOVA
Sources: Authors Compilation
Table-7: Qualification with Sufficiency of Mean – ANOVA
Qualification Sum of Squares d.f. Mean Square F Sig.
Between Groups 4.437 3 1.479
1.911 .136 Within Groups 52.638 68 .774
Total 57.075 71
Sources: Authors Compilation
Table-8: Experience with Sufficiency of Mean - ANOVA
Sum of Squares d.f. Mean Square F Sig.
Experience
of staff
Between Groups 22.776 13 1.752 1.228 .284
Within Groups 82.724 58 1.426
Total 105.500 71
Sources: Authors Compilation
Table-9: Designation with Sufficiency of Mean – ANOVA
Sources: Authors Compilation
The results of ANOVA indicate that there is no significant difference that exists between the demographic variables such as
designation, experience, gender or qualification and the sufficiency of benefits that the employees perceive. Since the P value in
all the cases seem to be above 0.05, it becomes clear that there are no significant differences that exist.
REFERENCES
1. Cheryl Waenimusyoka. (2013, January-February). Effect of Staff welfare programs on employee satisfaction among
Commercial banks in Kenya. International Journal of Modern Engineering Research (IJMER), 3(1).
Gender Sum of Squares d.f. Mean Square F Sig.
Between Groups 1.344 1 1.344
1.688 .198 Within Groups 55.731 70 .796
Total 57.075 71
Sum of Squares d.f. Mean Square F Sig.
Designation of
Employees
Between Groups 5.694 13 .438 1.479 .153
Within Groups 17.181 58 .296
Total 22.875 71
Volume 5, Number 1, January – March’ 2016
ISSN (Print): 2279-0977, (Online): 2279-0985
PEZZOTTAITE JOURNALS SJIF (2012): 3.23, SJIF (2013): 5.057, SJIF (2014): 5.871, SJIF (2015): 6.492
International Journal of Applied Services Marketing Perspectives© Pezzottaite Journals. 1976 |P a g e
2. Retrieved from
http://www.yourarticlelibrary.com/essay/human-resource-management/essay-on-job-satisfaction-motivati...
3. Retrieved from https://in.linkedin.com/in/abhishekkulkarni11
4. Retrieved from http://www.chegg.com/homework-help/questions-and-answers/source-sum-squares-df-mean-square-f-
treatme...
5. Retrieved from http://www.slideshare.net/hemanthcrpatna/a-study-on-budgetary-control-of-shimul
6. Retrieved from http://www.ijmer.com/papers/Vol3_Issue1/DL31523529.pdf
7. Retrieved from http://www.academia.edu/4066547/Research_Project_Employee_Job_Satisfaction
8. Retrieved from https://ml.scribd.com/doc/254150519/1340-2542-1-SM-1-pdf
9. Retrieved from http://www.cuhk.edu.hk/soc/socionexus/corskill/it/spss/ttest.htm
10. Retrieved from https://socionet.ru/publication.xml?h=repec:rom:econmn:v:16:y:2013:i:2:p:208-215&l=en
11. Retrieved from https://ideas.repec.org/a/rom/econmn/v16y2013i2p208-215.html
12. Retrieved from
http://www.researchgate.net/publication/275894372_Quality_of_Work_Life_Scale_Development_and_Validat...
13. Retrieved from http://www.ssn.edu.in/?page_id=1379
14. Retrieved from
http://www.dailymail.co.uk/news/article-2317542/Money-really-does-buy-happiness-Economists-discover-...
15. Retrieved from http://www.asmgroup.edu.in/incon/2015/HRM/INCN15_HR_006.pdf
*****
INFORMATION FOR AUTHORS
Pezzottaite Journals invite research to go for publication in other titles listed with us. The contributions should be original and
insightful, unpublished, indicating an understanding of the context, resources, structures, systems, processes, and performance
of organizations.
The contributions can be conceptual, theoretical and empirical in nature, review papers, case studies, conference reports,
relevant reports & news, book reviews and briefs; and must reflect the standards of academic rigour.
Invitations are for:
International Journal of Applied Services Marketing Perspectives.
International Journal of Entrepreneurship & Business Environment Perspectives.
International Journal of Organizational Behaviour & Management Perspectives.
International Journal of Retailing & Rural Business Perspectives.
International Journal of Applied Financial Management Perspectives.
International Journal of Information Technology & Computer Sciences Perspectives.
International Journal of Logistics & Supply Chain Management Perspectives.
International Journal of Trade & Global Business Perspectives.
All the titles are available in Print & Online Formats.
Volume 5, Number 1, January – March’ 2016
ISSN (Print): 2279-0977, (Online): 2279-0985
PEZZOTTAITE JOURNALS SJIF (2012): 3.23, SJIF (2013): 5.057, SJIF (2014): 5.871, SJIF (2015): 6.492
International Journal of Applied Services Marketing Perspectives© Pezzottaite Journals. 1977 |P a g e
TOURISM INDUSTRY IN KARNATAKA: PROSPECTS AND PROBLEMS
Nikshitha Shetty5
ABSTRACT
The state of Karnataka is one of the top ten domestic tourism destinations in India and was ranked 5th in 2010. The state has
various tourism assets such as beaches, hill stations, heritage monuments, national parks, wild life sanctuaries etc. Given the
variety of the tourism assets, the state is promoted under the tag line “One state, many worlds”. The major tourism
destinations in Karnataka can be classified under the following tourism themes described below: Heritage and culture -
Hampi, Badami, Pattadakal, Aihole, Mysore palace, Srirangapatana etc. Wildlife and forests like National parks at Bandipur,
BR Hills, Rajiv Gandhi National Park, Kudremukh National Park etc., and Beaches like – Mangalore, Karwar, Gokarna,
Malpe Dandeli in Uttara Kannada District etc. pilgrimage tourism - Mahabaleshwar temple, Shravanabelagola, Sringeri,
Kotilingeshwara, Jumma Masjid, Jama Masjid, Masjid-E-Ala.
Although the Karnataka have tremendous tourism potential, the tourism industry in the area is still miles to go to exploit the
proper potentialities. This is mainly due to lack of marketing, lack of infrastructure and lack of proper attention of the
government.
Tourism has the greatest potential for generating income and employment opportunities in the state because Karnataka is not
only diversity and the societal ethos of hosts; tourism holds high potential in the state. This paper attempts to explore the
potentiality of Karnataka, which will maintain a bright prospect of economic development in terms of tourism industry in near
future.
KEYWORDS
Economic Development, Infrastructure, Marketing, Promotion, Tourism Potential etc.
INTRODUCTION
Tourism in India is a large industry and it is emerged as a large service instrument of economic, cultural and social development.
Tourism is also a driving force for poverty alleviation, job creation and social Harmony. The country India, which have plenty
of natural beauty and resources like cultural heritage, archaeological remains, diversity, heritage site etc. enough scope for
the tourism promotions.
Where there are Challenges, there are Opportunities and vice versa. The emerging dimensions in Indian tourism and challenges
posed due to globalization and liberalization as well as new trends in the tourism markets compels all the destinations to develop
new products and strengthen or re-engineer the existing products for retaining, enhancing and capturing new markets. The
effective tourism development is the panacea for the success of the tourism industry.
Karnataka is bound by the Arabian Sea in the west, Andhra Pradesh States towards the east, Maharashtra and Goa state to the
North and North West, Kerala and Tamil Nadu States to the South-west and South-east respectively. Karnataka can be broadly
divided into 4 divisions, viz. i) Northern Karnataka ii) Southern Karnataka iii) Central Karnataka, and iv) Coastal Karnataka.
The state of Karnataka is best known for unique natural beauty with flora and fauna, historical monuments, pilgrim center, Coffee
plantations and its colorful cultural festivals Karnataka boasts of a diverse flora and fauna and a 320 km natural coastline, which
makes it a nature tourist’s paradise. Karnataka intends to project tourism industry with new brand identity “One state Many
Worlds.
Karnataka Tourism Scenario
Karnataka is situated in the southern part of India and the province of the same spreads over the Deccan Plateau. It is also the
eighth largest state in India in both in terms of area and population and it is formerly known as Mysore. The topography of
Karnataka is largely a reflection of the geology of the state. The Sahyadris are covered with evergreen forests. They drop abruptly
towards the Arabian Sea, thus forming a natural barrier between the plateau and the coastal regions.
There are four Ghats in Karnataka namely Subrahmanya Ghats, the Charmadi Ghats, the Shiradi Ghat, and the famous Agumbe
Ghat, which provide access to the coast. The Western Ghats slope gently towards the Bay of Bengal. Karnataka hold many
5Faculty, Department of Business Administration (MBA) (TA), Mangalore University, Karnataka, India, [email protected]
Volume 5, Number 1, January – March’ 2016
ISSN (Print): 2279-0977, (Online): 2279-0985
PEZZOTTAITE JOURNALS SJIF (2012): 3.23, SJIF (2013): 5.057, SJIF (2014): 5.871, SJIF (2015): 6.492
International Journal of Applied Services Marketing Perspectives© Pezzottaite Journals. 1978 |P a g e
attractions in terms of tourist interest such as wildlife sanctuaries, Hill stations, beaches, plantations, historical monuments &
monolithic statue and waterfalls.
The wild life sanctuaries at Bandipur, Nagarhole, Dandeli, and Ranganathittu Bird's Sanctuary. 5 Km. from Srirangapatna which
is itself a well-known tourist center, hill stations like Nandi Hills and Kemmannagundi and Mercara, beach resorts like Karwar,
Ullal, Malpe and Maravanthe, the world famous Brindavan Gardens at Krishnarajasagara, the monolithic statue of
Gommateshwara at Sharavanabelagola, Gol Gumbaz with its whispering gallery at Bijapur, the Jog falls and other water falls at
Shiva Samudram, Magod, Unchelli or Lushington near Siddapur, Lalguli at Yallapur and other places indicate the variety and
richness of the attractions that Karnataka State holds out to the visitors There are many places of historic and religious importance.
The great Acharyas, Shankara, Ramanuja and Madhwa, preached in this region. Great reformers like Sri Basaveshwara,
mathematicians like Baskaracharaya, commentators like Sayana, saint poets like Purandaradasa and Kanakadasa, great writers like
Pampa, Harihara and Kumara Vyasa have all enriched the heritage of Karnataka.
OBJECTIVES OF STUDY
To assess the existing & hidden potential for tourism in the study area.
To examine the available facilities and support infrastructure with regard to all forms of tourism.
To propose solutions towards accelerated development of tourism in Karnataka.
Prospects of Tourism in Karnataka
The whole tourism potentialities of the state can be grouped together under the following categories:
Pilgrim Tourism Eco Tourism Wildlife
Golf Tourism Adventure Tourism Medical Tourism
Agro Tourism Cultural Tourism Nature Tourism
Coffee Trial MICE Tourism Others.
UNESCO World Heritage Sites
Hampi
Pattadkal
Western Ghats (Natural Heritage)
The properties in Karnataka that the advisory committee for World Heritage was shortlisted for the UNESCO’s tentative list of
world Heritage properties are:
Hoysala Architecture series including Belur, Haleebeedu & Somannathpura,
Srirangapatna,
Deccan sultanate Architecture including Gulbarga, Bidar, Bijapur, Golconda.
Infrastructure Facilities
Karnataka is well connected by roads, railway, airway and waterway with all its neighbouring metros and within the state as well.
The Karnataka has five functional airports at Hubli, Mysore, Belgaum, Mangalore and Bangalore Besides the major airports the
Karnataka government proposes to establish domestic airports in district towns so as to provide better connectivity to tourist
hotspots Karnataka since 2003 and the railway track in Karnataka spans across 3089 kilometres.
A luxury train crowned Golden Chariot ply across Goa and Karnataka also known as Pride of South. Karnataka is connected by a
huge expanse of roadways via National Highway spanning .3973 kilometres and via a nexus of State Highways spanning 9829
kilometres.
Karnataka leads the race in offering advanced healthcare facilities due to which it is often considered a healthcare zone ready to
compete with the best medical facilities all over the world.
Both primary and private healthcare domain in Karnataka is in a better shape than other states in India. There are 2310 primary
healthcare centres and 180 community healthcare centres in Karnataka.
Volume 5, Number 1, January – March’ 2016
ISSN (Print): 2279-0977, (Online): 2279-0985
PEZZOTTAITE JOURNALS SJIF (2012): 3.23, SJIF (2013): 5.057, SJIF (2014): 5.871, SJIF (2015): 6.492
International Journal of Applied Services Marketing Perspectives© Pezzottaite Journals. 1979 |P a g e
Table-1: Foreign Tourist Arrivals (FTAs) in India, 1998-2014
Year FTAs in India (in Million) Percentage (%) Change Over the Previous year
1998 2.36 -0.7
1999 2.48 5.2
2000 2.65 6.7
2001 2.54 -4.2
2002 2.38 -6.0
2003 2.73 14.3
2004 3.46 26.8
2005 3.92 13.3
2006 4.45 13.5
2007 5.08 14.3
2008 5.28 4.0
2009 5.17 -2.2
2010 5.78 11.8
2011 6.31 9.2
2012 6.58 4.3
2013 6.97 5.9
2014 7.68 10.2
Jan-June 2015 (P) 5.13 3.7 @
Note: (P) Provisional, @ Growth rate over Jan-June, 2014
Sources: (i) Bureau of Immigration, Government of India, for 1998-2014
(ii) Ministry of Tourism, Government of India, for Jan-June, 2015
Table-2: Share of Top 10 States/UTs of India in Number of Foreign Tourist Visits in 2014
Rank State/UT Foreign Tourist Visits in 2014
Number Percentage Share (%)
1 Tamil Nadu 4657630 20.6
2 Maharashtra 4389098 19.4
3 Uttar Pradesh 2909735 12.9
4 Delhi 2319046 10.3
5 Rajasthan 1525574 6.8
6 West Bengal 1375740 6.1
7 Kerala 923366 4.1
8 Bihar 829508 3.7
9 Karnataka 561870 2.5
10 Haryana 547367 2.4
Sources: Authors Compilation
Tourist arrivals in the state increased from 25.2 million in 2005-06 to 111.8 million in 2014-15.
Although the Karnataka has tremendous tourism potential, the tourism industry in the area is still miles to go to exploit the proper
potentialities. Tourism in Karnataka is still in the infancy stage. In spite of immense tourist potential, Government of Karnataka
and Department of Tourism have not been able to match states like Gujarat and Kerala in attracting international tourists.
Problems for Tourism Development in Karnataka
Poor state of publicity,
Inadequate infrastructural facilities,
Lack of Coordinated Efforts,
Absence of trained Tourist Guide,
Lack of proper finance to entrepreneurs,
Absence of perspective plans and Sustainability in Tourism,
Lack of renovation of archaeological spots and monuments,
Lack of promotion of unique spots.
Volume 5, Number 1, January – March’ 2016
ISSN (Print): 2279-0977, (Online): 2279-0985
PEZZOTTAITE JOURNALS SJIF (2012): 3.23, SJIF (2013): 5.057, SJIF (2014): 5.871, SJIF (2015): 6.492
International Journal of Applied Services Marketing Perspectives© Pezzottaite Journals. 1980 |P a g e
Suggestions to Improve the Scenario
Well- Planned Publicity- Intensive campaign should be carried out by government and private agencies both at national
and international levels to project the resources of Karnataka.
Planned efforts should be made by the Government to build up the required tourism infrastructures such as
accommodation, markets, banking facilities, etc. of the region.
Special emphasis should be given on public and private partnership to tap the unexploited potential opportunities.
Government authority should implement some safety and security measures to regulate the tourists.
Adopting a framework of sustainable tourism - Linking environment, economy, and society
Involving the stakeholders in tourism planning
There should be an institutional arrangement to ensure effective participation of the people in promoting tourism and
sharing the benefits among the people and developing a tourism friendly environment
Promotion and renovation of major monuments and ruins
Promotional venture of potential tourism products
CONCLUSIONS
It is generally believed that tourists, both domestic and foreign, visit different places in search of specialities, which include a
variety of things, such as, beauties of nature, architecture, peace of mind and fulfilment in religious places, new and different
variety of food, culture of the people and uncommon adventure. In the midst of so many varieties, tourists make certain common
demands, and these are- clean, hygienic and comfortable living accommodation, good transport system to take them from one
place to another, decent shops particularly catering to ethnic art, entertainment representing cultural heritage of the place etc. so
tourism if well planned could be raised to an important income and employment generating sector and could also provide an
incentive for increasing cultural awareness and activity and therefore produce a wide range of social benefits too.
REFERENCES
1. Akhtar, J. (2009). Tourism Management in India. New Delhi: A P H Publishing Corporation.
2. Chandrashekara, B., & Nagaraju, L. G. (2014, June). Coastal Tourism in Karnataka. International Journal of Research
in Humanities, Arts and Literature, 57-72.
3. Kumar, A. (2008). Tourism Management. New Delhi, New Delhi, India: Commonwealth Publishers
4. Hamilpurkar, S. (July 2012). Agri Tourism in Karnataka-Issues Constraints and Possibilities. International Journal in
Commerce and Management, 23.
5. Retrieved from
http://eprints.manipal.edu/78123/1/F_P_%2D_CLUSTERING_VISITORS_TO_A_RELIGIOUS_PLACES_udupi_chan
ges_m...
6. Retrieved from
http://www.researchgate.net/publication/259568619_Problems_and_Prospects_of_Cultural_Tourism_A_Case_...
7. Retrieved from http://www.jiarm.com/Mar2014/paper9432.pdf
8. Retrieved from
http://www.academia.edu/6350130/Problems_and_Prospects_of_Cultural_Tourism_A_Case_study_of_Assam_Ind...
9. Retrieved from http://www.southindiatourtravel.com/karnataka/monuments-of-karnataka/bangalore-palace.html
10. Retrieved from http://www.travel2karnataka.com/tourism_in_karnataka.htm
11. Retrieved from http://planningcommission.nic.in/plans/stateplan/sdr_assam/sdr_assch8.doc
12. Retrieved from http://www.journalcra.com/article/problems-and-prospects-tourism-industry-manipur
13. Retrieved from http://www.kapiltravels.com/
Volume 5, Number 1, January – March’ 2016
ISSN (Print): 2279-0977, (Online): 2279-0985
PEZZOTTAITE JOURNALS SJIF (2012): 3.23, SJIF (2013): 5.057, SJIF (2014): 5.871, SJIF (2015): 6.492
International Journal of Applied Services Marketing Perspectives© Pezzottaite Journals. 1981 |P a g e
14. Retrieved from http://www.southtourism.org/Karnataka.html
15. Retrieved from http://www.rfbss.org/journal/index.php/IJBSS/article/download/4/8
16. Retrieved from http://www.studymode.com/essays/Tourism-In-Assam-Status-And-Prospects-39006619.html
17. Retrieved from http://www.webindia123.com/karnataka/land/land.htm
18. Retrieved from http://www.southindiaonline.com/karnataka/karnataka.htm
19. Retrieved from http://nrhm.gov.in/nrhm-in-state/state-wise-information/karnataka.html
20. Retrieved from http://www.garph.co.uk/IJARMSS/Sep2014/4.pdf
21. Retrieved from http://www.slideshare.net/SunilKumar148/various-tourism
22. Retrieved from http://www.99acres.com/articles/growth-story-of-serviced-apartments-in-india.html
23. Retrieved from http://www.rfbss.org/journal/index.php/IJBSS/article/view/4
24. Retrieved from http://www.oalib.com/paper/2558989
25. Retrieved from http://www.bharatonline.com/karnataka/travel-tips/airports.html
26. Retrieved from http://www.webindia123.com/karnataka/TOURISM/howto.htm
27. Retrieved from http://www.ibef.org/states/karnataka.aspx
28. Retrieved from http://i2iconsultants.blogspot.com/
29. Retrieved from http://wgbis.ces.iisc.ernet.in/biodiversity/pubs/ETR/ETR49/chapter5.htm
30. Retrieved from http://www.itineraryplanner.net/karnataka.html
31. Retrieved from http://www.tourism.gov.in/
32. Retrieved from http://www.tourism.nic.in/
33. Retrieved from https://en.wikipedia.org/wiki/Tourism_in_Karnataka
*****
FOR PAPER SUBMISSION & CLARIFICATION OR SUGGESTION, EMAIL US @:
Editor-In-Chief
Pezzottaite Journals,
24, Saraswati Lane, Bohri,
Near Modern Dewan Beverages,
Jammu Tawi – 180002,
Jammu and Kashmir, India.
(Mobile): +91-09419216270 – 71
Volume 5, Number 1, January – March’ 2016
ISSN (Print): 2279-0977, (Online): 2279-0985
PEZZOTTAITE JOURNALS SJIF (2012): 3.23, SJIF (2013): 5.057, SJIF (2014): 5.871, SJIF (2015): 6.492
International Journal of Applied Services Marketing Perspectives© Pezzottaite Journals. 1982 |P a g e
COMPARATIVE STUDY OF PUBLIC SECTOR AND PRIVATE SECTOR ELSS SCHEMES
Kavitha6 Dr. Kushalappa S.7
ABSTRACT
Indian Mutual Fund Industry has improved the stability of our financial system. Mutual Funds have opened new vistas to
investors and imported much needed liquidity to the system. Equity Linked Savings Scheme (ELSS) is a type of Mutual Fund
scheme. Going by its name ELSS invests a majority of its corpus in equity and equity related products. An investment in ELSS
comes with a lock in period and has tax benefits attached to it. It is suitable for investors having a high-risk profile as returns
in ELSS fluctuate depending upon the equity market and there are no fixed returns. ELSS schemes are open ended in nature,
that is, investors can subscribe to the fund at any day. NAV or the price of the fund is declared on every business day. The
current study is aimed to analyses the performance of ELSS Schemes offered by private and public sector undertakings in
India. Under each sector, the researchers have taken a sample of five schemes, selected randomly. The entire study is based
on secondary data. Various portfolio techniques are used to evaluate the performance of funds under study.
KEYWORDS
Mutual Funds, Sharpe Ratio, Treynor’s Ratio, Fama’s Ratio etc.
INTRODUCTION
Mutual Funds are essentially investment option where Asset Management Companies invest the funds invested by people with
common investment purpose in different growing sectors. An efficient team of portfolio managers manages investment in Mutual
funds. Indian Mutual Fund Industry has improved the stability of our financial system. Mutual Funds have opened new vistas to
investors and imported much needed liquidity to the system. Equity Linked Savings Scheme (ELSS) is a type of Mutual Fund
scheme. Going by its name ELSS invests a majority of its corpus in equity and equity related products. An investment in ELSS
comes with a lock in period and has tax benefits attached to it. It is suitable for investors having a high-risk profile as returns in
ELSS fluctuate depending upon the equity market and there are no fixed returns. ELSS schemes are open ended in nature, that is,
investors can subscribe to the fund at any day. NAV or the price of the fund is declared on every business day.
These funds are raised for providing tax relief to those investors whose income comes under taxable limits. ELSS is a good option
to save tax and generate long-term capital gains. Normal equity funds could be purchased today and disposed of tomorrow, but in
case of ELSS, there is a compulsory 3-year lock in period. The tax saving mutual fund industry grew at a rate of annual 67%
during 2006 to 2015 while mutual fund industry grew at a rate of 50% annually. With the introduction of a wide range of
products, the mutual fund industry nowadays has a lot to offer to its investors. The current study is aimed to analyse the
performance of ELSS Schemes offered by private and public sector undertakings in India. The researchers for comparative study
use various portfolio evaluation techniques.
LITERATURE REVIEW
Mittal Ajay and Agarwal K.V (2015) found in their study that there is no significant difference in growth rate of ELSS and mutual
fund industry. People are more interested in investing in ELLS due to low lock in period and good return. There is decreasing the
trend in ELLS when Indian economy witnessed global downward trend in the world.
Alekhya P (2012) found that various schemes of mutual funds provide the investors with a wide range of investments options
according to his risk bearing capacities and interest. Besides, they also give a handy return to the investors.
Kandpal Vinay and Kavidayal C.P (2014) in their study “A Comparative Study of Selected Public & Private Sector Equity
Diversified Mutual Fund Schemes in India” found that the Private Sector Mutual Funds have recorded much better performance as
compared to the Public sector Mutual Funds mainly due to better Funds allocation, better Management and efficient performance
of Portfolio Manager.
Muthusamy D (2015) in his study stated that the performance of private sector mutual funds has been superior to public sector
funds in almost the frames. Private sector mutual fund is found to be the more efficient allocator of investors’ resources than
public sector mutual fund.
6MBA Student, A.I.E.T., Karnataka, India, [email protected] 7Associate Professor, Department of MBA, A.I.E.T., Karnataka, India, [email protected]
Volume 5, Number 1, January – March’ 2016
ISSN (Print): 2279-0977, (Online): 2279-0985
PEZZOTTAITE JOURNALS SJIF (2012): 3.23, SJIF (2013): 5.057, SJIF (2014): 5.871, SJIF (2015): 6.492
International Journal of Applied Services Marketing Perspectives© Pezzottaite Journals. 1983 |P a g e
Krishna Rama Y and Raju R (2014) concluded in their study that majority of the schemes had positive monthly returns and
positive risk adjusted returns. Funds those reported highest returns in one month failed to repeat the same results in following
months. This shows the inefficiency of fund managers to time the market. We also found that funds that reported higher returns
were tend to have higher risk.
Kaur Rupeet (2012 in his study he found that the performance of growth schemes is better than the dividend schemes. The
empirical results show that based on total risk, the dividend schemes are more volatile than the growth schemes.
OBJECTIVES OF STUDY
To study the performance of Public sector ELSS schemes.
To analyze the performance of Private sector ELSS schemes.
To make a comparison between the performance of Public and Private sector ELSS schemes.
SCOPE OF STUDY
The present study comprises of 10 mutual fund schemes launched by different public sector, private sector AMCs. The study
period is from February 2014 to October 2015.
METHODOLOGY OF STUDY
The entire study is based on the secondary data, procured and extracted from various sources like e-source, books etc. The major
data is being collected from official website of NSE and Association of Mutual Funds in India. The sample five funds from each
private and public sector are selected randomly.
To evaluate the performance of the mutual funds, the following models have been used in this study:
Daily Return of the Fund: The daily return is calculated by using the NAVs of the funds under study. The model used for this
purpose is:
RPt = NAVt − NAVt−1
NAVt−1 X 100
Where, 𝑅𝑃𝑡 is the return from a fund at time t, 𝑁𝐴𝑉𝑡 and 𝑁𝐴𝑉𝑡−1 are net assets values for time period t and t-1 respectively.
Average Return of the Fund: Average return of the fund is calculated with the following equation:
Rp = ∑ Rpt/n
n
t=1
Where, n is the time of the study
Daily Index Return: Daily market return is calculated as follows:
Rmt = Pt − Pt−1
Pt−1 X 100
Where, P is the market price.
Average Index Return: The average market return is calculated by using the following equation:
Rm = ∑ Rmt/n
n
t=1
Sharpe’s Reward to Variability Ratio
SRp = Rp − Rf
σp
Where, SRp is the Sharpe’s Ratio for the portfolio, Rp is the mean return of the portfolio, Rf is the risk free rate of return and σp
is the standard deviation of the fund returns
Volume 5, Number 1, January – March’ 2016
ISSN (Print): 2279-0977, (Online): 2279-0985
PEZZOTTAITE JOURNALS SJIF (2012): 3.23, SJIF (2013): 5.057, SJIF (2014): 5.871, SJIF (2015): 6.492
International Journal of Applied Services Marketing Perspectives© Pezzottaite Journals. 1984 |P a g e
Treynor’s Reward to Volatility Ratio
TRp = Rp − Rf
βp
Where, TRp is the Treynor’s Ratio for the portfolio, Rp is the mean return of the portfolio, Rf is the risk free rate of return and βp
is the sensitivity of the fund returns to index returns.
Jensen’s Differential Return Ratio
αp = Rp − (Rf + (Rm − Rf)βp)
Where, αp is the Jensen’s alpha for the portfolio, Rm is the index return, Rf is the risk free rate of return and βp is the sensitivity
of the fund returns to index returns.
Fama’s Net Selectivity
𝐹𝑎𝑚𝑎′𝑠 𝑁𝑒𝑡 𝑆𝑒𝑙𝑒𝑐𝑡𝑖𝑣𝑖𝑡𝑦 = 𝑅𝑃 − [𝑅𝑓 + (𝜎𝑝
𝜎𝑚) (𝑅𝑚 − 𝑅𝑓)]
Where Rp = Actual return of the portfolio, 𝜎𝑝 is the standard deviation of the portfolio return, 𝜎𝑚 is the standard deviation of the
market return.
RESULTS AND DISCUSSION
Table-1: Actual Returns of Public Sector ELSS Schemes under Study
Funds
SBI Tax
Advantage
Sr-3- Direct (G)
SBI Tax
Advantage
Sr-3- Regular (G)
SBI Magnum Tax
Gain - Direct (G)
SBI Magnum
Tax Gain (G)
LIC NOMURA
Tax Plan (G)
15 days avg return 0.070532 0.070759 -0.06749 -0.06966 -0.11131
30 days avg return 0.117679 0.118093 0.047169 0.045101 -0.01904
45 days avg return 0.105043 0.103978 0.081155 0.079003 0.036425
60 days avg return -0.07158 -0.07201 -0.0706 -0.0727 -0.11257
75 days avg return -0.04021 -0.04048 -0.04551 -0.04775 -0.08175
90 days avg return 0.005756 0.005672 -0.01658 -0.01885 -0.0532
Sources: Authors Compilation
Actual return is what investors actually receive from their investment. The difference between the actual and expected return is
due to systematic and unsystematic risk. It is found in the Table-1 that among the various private sector ELSS funds, SBI Tax
Advantage Sr-3- Regular (G) fund has highest fifteen days average return, 30 days average return. SBI Tax Advantage Sr-3-
Direct (G) has highest 45 days average return, 75 days average return, and 90 days average return and SBI Tax Advantage Sr-3-
Regular (G) has highest average return in 60 days average return.
It is fact from Table-2 that Axis Long Term Equity-Direct (G) has received highest 15 days, 60days and 75 days average return,
Birla SL Tax Relief 96-Direct (G) has obtained highest average return in 45days and 90 days. In addition, Religare Invesco Tax
Plan-DP (G) has 30 days average return.
Table-2: Actual return of Private Sector ELSS Scheme under Study
Funds
BOI Axa advtg-
Eco(G)
Birla SL Tax
Relief 96-Direct
Kotak Tax
Saver-Direct (G)
Religare
Invesco Tax
Plan-DP(G)
Axis Long
Term Eq-
Direct (G)
15 days avg. return -0.08958 -0.00217 -0.12715 -0.01021 0.00454
30 days avg. return 0.030487 0.054139 0.012751 0.09558 0.07104
45 days avg. return 0.06297 0.085649 0.03601 0.070245 0.058976
60 days avg. return -0.06872 -0.06998 -0.10726 -0.06168 -0.01702
75 days avg. return -0.03572 -0.01525 -0.0502 -0.2021 -0.00116
90 days avg. return 0.001822 0.03445 -0.01562 0.0058430 0.021726
Sources: Authors Compilation
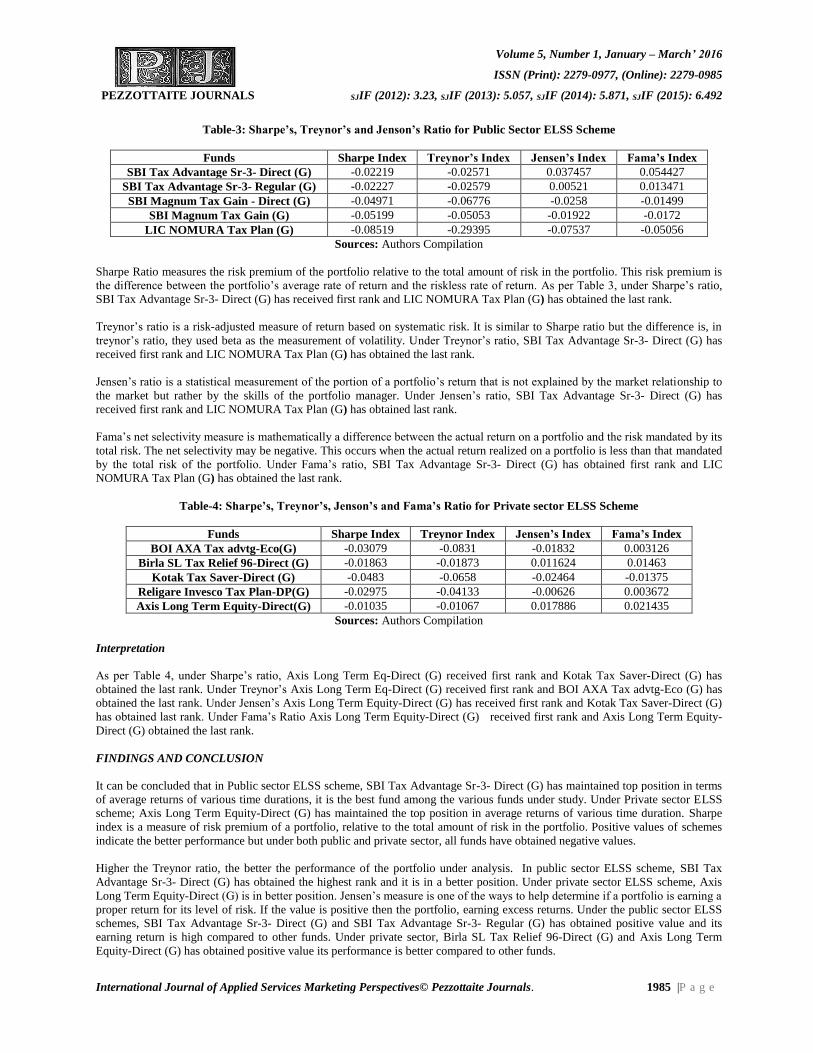
Volume 5, Number 1, January – March’ 2016
ISSN (Print): 2279-0977, (Online): 2279-0985
PEZZOTTAITE JOURNALS SJIF (2012): 3.23, SJIF (2013): 5.057, SJIF (2014): 5.871, SJIF (2015): 6.492
International Journal of Applied Services Marketing Perspectives© Pezzottaite Journals. 1985 |P a g e
Table-3: Sharpe’s, Treynor’s and Jenson’s Ratio for Public Sector ELSS Scheme
Funds Sharpe Index Treynor’s Index Jensen’s Index Fama’s Index
SBI Tax Advantage Sr-3- Direct (G) -0.02219 -0.02571 0.037457 0.054427
SBI Tax Advantage Sr-3- Regular (G) -0.02227 -0.02579 0.00521 0.013471
SBI Magnum Tax Gain - Direct (G) -0.04971 -0.06776 -0.0258 -0.01499
SBI Magnum Tax Gain (G) -0.05199 -0.05053 -0.01922 -0.0172
LIC NOMURA Tax Plan (G) -0.08519 -0.29395 -0.07537 -0.05056
Sources: Authors Compilation
Sharpe Ratio measures the risk premium of the portfolio relative to the total amount of risk in the portfolio. This risk premium is
the difference between the portfolio’s average rate of return and the riskless rate of return. As per Table 3, under Sharpe’s ratio,
SBI Tax Advantage Sr-3- Direct (G) has received first rank and LIC NOMURA Tax Plan (G) has obtained the last rank.
Treynor’s ratio is a risk-adjusted measure of return based on systematic risk. It is similar to Sharpe ratio but the difference is, in
treynor’s ratio, they used beta as the measurement of volatility. Under Treynor’s ratio, SBI Tax Advantage Sr-3- Direct (G) has
received first rank and LIC NOMURA Tax Plan (G) has obtained the last rank.
Jensen’s ratio is a statistical measurement of the portion of a portfolio’s return that is not explained by the market relationship to
the market but rather by the skills of the portfolio manager. Under Jensen’s ratio, SBI Tax Advantage Sr-3- Direct (G) has
received first rank and LIC NOMURA Tax Plan (G) has obtained last rank.
Fama’s net selectivity measure is mathematically a difference between the actual return on a portfolio and the risk mandated by its
total risk. The net selectivity may be negative. This occurs when the actual return realized on a portfolio is less than that mandated
by the total risk of the portfolio. Under Fama’s ratio, SBI Tax Advantage Sr-3- Direct (G) has obtained first rank and LIC
NOMURA Tax Plan (G) has obtained the last rank.
Table-4: Sharpe’s, Treynor’s, Jenson’s and Fama’s Ratio for Private sector ELSS Scheme
Funds Sharpe Index Treynor Index Jensen’s Index Fama’s Index
BOI AXA Tax advtg-Eco(G) -0.03079 -0.0831 -0.01832 0.003126
Birla SL Tax Relief 96-Direct (G) -0.01863 -0.01873 0.011624 0.01463
Kotak Tax Saver-Direct (G) -0.0483 -0.0658 -0.02464 -0.01375
Religare Invesco Tax Plan-DP(G) -0.02975 -0.04133 -0.00626 0.003672
Axis Long Term Equity-Direct(G) -0.01035 -0.01067 0.017886 0.021435
Sources: Authors Compilation
Interpretation
As per Table 4, under Sharpe’s ratio, Axis Long Term Eq-Direct (G) received first rank and Kotak Tax Saver-Direct (G) has
obtained the last rank. Under Treynor’s Axis Long Term Eq-Direct (G) received first rank and BOI AXA Tax advtg-Eco (G) has
obtained the last rank. Under Jensen’s Axis Long Term Equity-Direct (G) has received first rank and Kotak Tax Saver-Direct (G)
has obtained last rank. Under Fama’s Ratio Axis Long Term Equity-Direct (G) received first rank and Axis Long Term Equity-
Direct (G) obtained the last rank.
FINDINGS AND CONCLUSION
It can be concluded that in Public sector ELSS scheme, SBI Tax Advantage Sr-3- Direct (G) has maintained top position in terms
of average returns of various time durations, it is the best fund among the various funds under study. Under Private sector ELSS
scheme; Axis Long Term Equity-Direct (G) has maintained the top position in average returns of various time duration. Sharpe
index is a measure of risk premium of a portfolio, relative to the total amount of risk in the portfolio. Positive values of schemes
indicate the better performance but under both public and private sector, all funds have obtained negative values.
Higher the Treynor ratio, the better the performance of the portfolio under analysis. In public sector ELSS scheme, SBI Tax
Advantage Sr-3- Direct (G) has obtained the highest rank and it is in a better position. Under private sector ELSS scheme, Axis
Long Term Equity-Direct (G) is in better position. Jensen’s measure is one of the ways to help determine if a portfolio is earning a
proper return for its level of risk. If the value is positive then the portfolio, earning excess returns. Under the public sector ELSS
schemes, SBI Tax Advantage Sr-3- Direct (G) and SBI Tax Advantage Sr-3- Regular (G) has obtained positive value and its
earning return is high compared to other funds. Under private sector, Birla SL Tax Relief 96-Direct (G) and Axis Long Term
Equity-Direct (G) has obtained positive value its performance is better compared to other funds.
Volume 5, Number 1, January – March’ 2016
ISSN (Print): 2279-0977, (Online): 2279-0985
PEZZOTTAITE JOURNALS SJIF (2012): 3.23, SJIF (2013): 5.057, SJIF (2014): 5.871, SJIF (2015): 6.492
International Journal of Applied Services Marketing Perspectives© Pezzottaite Journals. 1986 |P a g e
The excess return arises from different factors such as risk bearing and stock selection. The portfolio managers who attempt to
earn a higher return than the market return assumes higher risk and it depends on stock selection activity. Under the public sector
ELSS schemes, SBI Tax Advantage Sr-3- Direct (G) and SBI Tax Advantage Sr-3- Regular (G) has positive value and under
private sector ELSS schemes except Kotak Tax Saver-Direct (G) all other are positive so their performance is better.
It can be concluded that the ELSS schemes under study have failed to beat the market. They all have earned negative excess
returns. One of the limitations of the ELSS schemes is that the lock in period of the ELSS schemes is three years. Even though
their provide tax benefits to the investors, the lock in period of three years does not attract investors on it. They can attract
investors on it by offering superior profit to the investors. Therefore, it is suggested in this study that the fund managers must be
efficient enough to earn superior returns in their schemes to attract investors on it.
REFERENCES
1. Avadhani, V. A. (2011). Security Analysis and Portfolio Management. Himalaya Publishing House.
2. Balla, V. K. (2002). Portfolio Analysis and Management. New Delhi: Sulthan Chand and Company Limited.
3. Bhat, Sudhindra. (2008), Security Analysis and Portfolio Management. New Delhi: Excel Books.
4. Booie, Zvi, Kane, Alex, (et. al.). (2006). Investments (6th Edition). New Delhi: Tata McGraw Hill.
5. Chandra, Prasanna. (2008). Investment Analysis and Portfolio Management (3rd Edition). New Delhi: Tata McGraw
Hill.
6. Fisher, E. Donald, & Jordan, J. Ronald. (2006), Security Analysis and Portfolio Management, Pearson Prentice Hall.
7. Kevin, S. (2008). Portfolio Management (2rd Edition). New Delhi: PHI Learning Private Limited.
8. Nagarajan, K., & Jayabal, G. (2011). Security Analysis and Portfolio Management. New Age International.
9. Pandian, Punithavathy. (2004). Security Analysis and Portfolio Management. New Delhi: Vikas Publishing House
Private Limited.
10. Ravindhar, Vadapalli. (2007). Mergers, Acquisitions and Business Valuation, Excel Books.
11. Reilly, K. Frank, & Brown, C. Keith. (2006). Investment Analysis and Portfolio Management (8rd Edition). New
Delhi: Cengage Learning India Private Limited.
12. Sudi, Sudarsanam. (2002). Value Creation from Mergers and Acquisitions. Pearson Education.
13. Weston, Mitchel, & Mulceril. (2003). Takeovers, Restructuring and Corporate Governance. Pearson Education.
14. Retrieved from http://indianresearchjournals.com/pdf/APJMMR/2012/October/12.pdf.
15. Retrieved from http://iosrjournals.org/isor-jbm/papers/Vo116-issue1/version-5/No16192101.pdf.
16. Retrieved from http://www.euroasiapub.hjournals.com/pdf/APJMMR/2012/December/3.pdf
17. Retrieved from http://www.licnomuramf.com/pdf/ELSS%20write%20up.pdf
18. Retrieved from http://www.starresearchjournal.com/docs/Vo13.6/paper3.pdf.
19. Retrieved from http://www.theijst.com/force-download.phd?file-path=wp-content/Uploads/2015/07/27-ST1506-111.pdf&id=1531
20. Retrieved from www.iujharkhand.edu.in/Article-by-Faculty/Article%203%20%20Dr%20B%20M%20singh.pdf
21. Retrieved from www.pbr.co.in/vol%205%20Iss%207/9.pdf
22. Retrieved from https://en.wikipedia.org/wiki/Mutual_funds_in_India
Volume 5, Number 1, January – March’ 2016
ISSN (Print): 2279-0977, (Online): 2279-0985
PEZZOTTAITE JOURNALS SJIF (2012): 3.23, SJIF (2013): 5.057, SJIF (2014): 5.871, SJIF (2015): 6.492
International Journal of Applied Services Marketing Perspectives© Pezzottaite Journals. 1987 |P a g e
23. Retrieved from http://profit.ndtv.com/news/your-money/article-top-five-tax-saving-mutual-fund-schemes-384148
24. Retrieved from https://www.motilaloswal.com/ELSSpage.html
25. Retrieved from http://hdfcfund.com/investor-education/save-tax-with-elss
26. Retrieved from http://www.licnomuramf.com/pdf/ELSS%20write%20up.pdf
27. Retrieved from
http://www.academia.edu/6857075/A_Comparative_Study_of_Selected_Public_and_Private_Sector_Equity_Div...
*****
CHECK PLAGIARISM SERVICE
Pezzottaite Journals charges nominal fees from Journal Managers, Editors, Section Editors, Copy Editors, Layout Editors,
Proof Readers, Subscription Managers, Reviewers, Readers (Subscribers and Individuals), and Authors to get their
manuscripts scanned for plagiarism.
Indian Users
One Manuscript / article = Rs. 350.00
Two Manuscripts / articles = Rs. 350.00 x 2 = Rs. 700.00 ………As so on...
Formulae = (Numbers of Manuscripts x Rs. 350.00) = Amount to be paid as ‘Online Bank Transfer’ before
availing the services.
International Users
One Manuscript = US$15.00
Two Manuscripts = US$15.00 x 2 = US$ 30 ………As so on...
Formulae = (Numbers of Manuscripts x US$15.00) = Amount to be paid as ‘Online Bank Transfer’ before
availing the services.
Note: Total amount if computed in US$ must be converted into Indian Rupees as per Currency Exchange Rates on the day of
placing the order; Computed amount (in Rupees) is to be transferred in Pezzottaite Journals Bank Account (s); In case, where
the transacted currency is not US$, then, purchaser must consider the exchange rate of domestic country’s currency against
'US$ / Rupees' and transfer the same.
Bank details are available at: http://pezzottaitejournals.net/pezzottaite/bank_accounts_detail.php
INFORMATION FOR AUTHORS
Pezzottaite Journals invite research to go for publication in other titles listed with us. The contributions should be original and
insightful, unpublished, indicating an understanding of the context, resources, structures, systems, processes, and performance
of organizations. The contributions can be conceptual, theoretical and empirical in nature, review papers, case studies,
conference reports, relevant reports & news, book reviews and briefs; and must reflect the standards of academic rigour.
Invitations are for:
International Journal of Applied Services Marketing Perspectives.
International Journal of Entrepreneurship & Business Environment Perspectives.
International Journal of Organizational Behaviour & Management Perspectives.
International Journal of Retailing & Rural Business Perspectives.
International Journal of Applied Financial Management Perspectives.
International Journal of Information Technology & Computer Sciences Perspectives.
International Journal of Logistics & Supply Chain Management Perspectives.
International Journal of Trade & Global Business Perspectives.
All the titles are available in Print & Online Formats.
Volume 5, Number 1, January – March’ 2016
ISSN (Print): 2279-0977, (Online): 2279-0985
PEZZOTTAITE JOURNALS SJIF (2012): 3.23, SJIF (2013): 5.057, SJIF (2014): 5.871, SJIF (2015): 6.492
International Journal of Applied Services Marketing Perspectives© Pezzottaite Journals. 1988 |P a g e
A CONTEXTUAL STUDY OF EMOTIONAL INTELLIGENCE (EI) WITH REFERENCE TO
GRADUATING AND CORPORATE BABES’ CONSUMER BEHAVIOUR:
LIVING IN PUNJAB AND HIMACHAL PRADESH OF INDIA
Dr. Gurdev Singh Thakur8
ABSTRACT
Emotional Intelligence (EI), Consumer Emotional Intelligence Scale (CEIS), Emotional Appeals applicability, High Impulsive
behaviour and brand loyalty etc., buzz words have been making big sounds across the marketing domains since 20 th century
and practitioners, academicians and professionals have also been attempting to invent pragmatic and prudent techniques to
establish their brands and create life time clientele. This study is also an attempt to validate whether emotional intelligence
plays an effective role or not, while youths across of Himachal Pradesh and Punjab carry out buying in the era of Information
Technology Enabled Services (ITES) and Smart Phones.
KEYWORDS
Emotional Intelligence, Consumer Emotional Intelligence Scale (CEIS), Information Technology Enabled Services
(ITES) etc.
INTRODUCTION
Conceptualization and Review of the Literature
Emotional Intelligence (EI) in conceptual framework has been defined and understood in various perceptual and pragmatic
frameworks since the inception of human beings on this mother earth. Not going so back, let us review its perspective and prolific
preview since 1920s; academicians, researchers and practitioners jotted down their research findings and shared across the globe
through literature dissemination platforms. In literary senses and essences, Emotions were discussed under the purview of
intelligence somewhat in early 1920s; Thorndike first identified Emotional Intelligence (EI) that he called it Social Intelligence
(Goleman, 1995).
Emotional Intelligence (EI) is considered as “the ability to perceive emotions, to access and generate emotions so as to assist
thought, to understand emotions and emotional knowledge, and to reflectively regulate emotions so as to promote emotional and
intellectual growth” (Mayer & Salovey, 1997) . Subsequently, Salovey and Mayer (1990) proposed a model that is a more pure,
ABILITY-BASED conceptualization of emotional intelligence where they identified four different factors of emotional
intelligence: (i) Appraisal of emotion in the self and others, (ii) Expression of emotion, (iii) Regulation of emotion in the self and
others, and (iv) Utilization of emotion in solving problems (Opengart, 2005). Simultaneously (Goleman, 1990), defined emotional
intelligence as TRAIT-BASED), others proposed a MIXED-MODEL APPROACH considering both ABILITIES & TRAITS
(Bar-On, 1997; Schutte, 2009). On the other hand, it was also seen that some have considered emotional intelligence (EI) as an
agent that helps in problem solving and workplace innovation (Jordan & Troth, 2004), interpersonal skills (Brown & Moshavi,
2005; Jordan & Troth, 2004; Prati, Douglas, Ferris, Ammeter & Buckley, 2003), and motivation and enthusiasm (Abraham, 2004;
Carmeli & Josman, 2006; Gardner & Stough, 2003).
The four emotional processing abilities of Emotional Intelligence (EI) are alike to cognitive processing abilities i.e. (i) attention,
(ii) perception, (iii) reasoning, and (iv) problem solving in that they are present across every domain but are likely to elicit
different magnitudes based on the unique context (Bettman, Payne, and Staelin, 1986). Needless, to say that in convinced
contexts, it may create unique needs to access and interpret emotional information, while others require more comprehension and
regulation of complex emotional information. For example, while perceiving emotion in product packaging may be highly
predictive of consumer preferences for products, the ability to manage emotion may not be. Likewise, while the ability to manage
emotion is likely to be predictive in situations where control over one’s emotion is necessary, perceiving emotions in objects is not
likely to be. Consequently, these emotional abilities should uniquely apply to distinct consumer outcomes, just as cognitive
processing applies to distinct cognitive tasks.
Going further into the literature review, it is enunciated that emotions on consumer behaviour; emotional intelligence might
regulate the effect of his/her emotions on purchasing behaviour. Researches across the globe revealed that emotions influences
consumer’s information processing (Lee & Sternthal, 1999), attitudes (Williams & Aaker, 2002), decision-making (Isen, 2001)
and purchasing behaviour (Kahn & Isen, 1993). Opengart & McCall, 2013 observed that emotionally calibrated consumers those
8Director & Principal, Saraswati College of Management & Computer Sciences, Chandigarh, India, [email protected]
Volume 5, Number 1, January – March’ 2016
ISSN (Print): 2279-0977, (Online): 2279-0985
PEZZOTTAITE JOURNALS SJIF (2012): 3.23, SJIF (2013): 5.057, SJIF (2014): 5.871, SJIF (2015): 6.492
International Journal of Applied Services Marketing Perspectives© Pezzottaite Journals. 1989 |P a g e
possessing greater ability as well as confidence in their emotional abilities, made better decisions and Kidwell, Hardesty, and
Childers (2008) found that consumer emotional ability predicted superior product selection. Marketers in the era of directing
marketing and more customized marketing; Kotler, Kartajaya, & Setiawan (2010) argue that marketing has moved beyond the era
of ‘messaging’ to ‘touching customers’ emotions.
There always had been contentions across academicians and researchers that what all constitute Emotional Intelligence (EI);
undoubtedly, it’s a accepted fact that human and other living creations being on the mother earth have different chemistry of their
brain sets that is basically constituted with basic programmed features by the nature but over a period of life having cohesion and
regular interface with its environment and other relative developments; the behavioural re-activity formation takes place that is
basically based on the place of the birth, genetics, family composition and societal status, society around, level of education and
training, friends circle at the time of education and training, workplace people and interaction with the external world etc. These
factors have strong connotations with Goleman’s model (1996) that broadly cover the level of competencies and skills through
following main constructs:
Self-Awareness: Ability to read emotions and recognize their impact,
Self-Management: Involves emotions and impulses control and adapting to changing circumstances,
Social Awareness: Ability to sense, understand and react to others emotions while comprehending,
social networks,
Relationship Management: Ability to inspire, influences, and develop others in the conflict management.
Mayer et al. model (2008) enunciated the following Emotional Abilities description in terms of conceptualizing emotions:
Perceiving emotions ability to detect and decipher emotions in faces, pictures, voices and cultural artifacts,
Using emotions ability to harness emotions to facilitate various cognitive activities, such as thinking and problem
solving,
Understanding emotions ability to comprehend emotion language and to appreciate complicated relationships among
emotions,
Managing emotions ability to regulate emotions in both ourselves and in others.
OBJECTIVES OF STUDY
In an abstract ideology, the objectivity of the study is to explore the possibility that strong emotional intelligence construct
personalities have least/less chances for buying behavioural changes and more chances of buying behavioural changes for those
who are weak in emotional intelligence construct. In the fast growing communication era, cross-culture work place interface, high
level exposure to the outer world, increasing parlance of personality competitiveness or complexion flair among Google-
Generation, high pricing/branded mind set direct proportionality to status symbol etc., are some of the underlying factors taken
into consideration to reach at point that High Level of Emotional Intelligence (HLEI) will have Lower Level of buying
Behavioural Changes (LLBC) and reversible in another way around.
Hypotheses
H0=High Level of Emotional Intelligence (HLEI): Less Chances of Behavioural Changes (LCBC).
H1=Low Level of Emotional Intelligence (LLEI): High Chances of Behavioural Changes (HCBC).
H3=Emotional Intelligence has no impact on behavioural changes.
RESEARCH METHODOLOGY
Research Frame and Design, Data Collection Instrument, Data Collection, compiling, and Drawing Inferences
The research designs is exploratory in nature and construct validity and the random sampling method was adopted for collecting
data from the proposed respondents who were graduating and corporate working people in the age group of 20-30 years belonging
to elite and upper middle class from the Punjab and Himachal Pradesh area with a sample size of 200 respondents. Well-structured
questionnaire was administered, data so collected was compiled, and inferences were drawn based on the co-relation analysis i.e.
established emotional intelligence as a major variable in relation to the buying behavioural perspective.
As such no previous model was adopted rather no model was queued; an attempt was made to come at a point whether strong
Emotionally Intelligence bearing consumers get affected by the emotional stimulus triggered by the marketers or otherwise to
measure the level of behavioural changes among the respondents who were weak in their emotional intelligence construct.
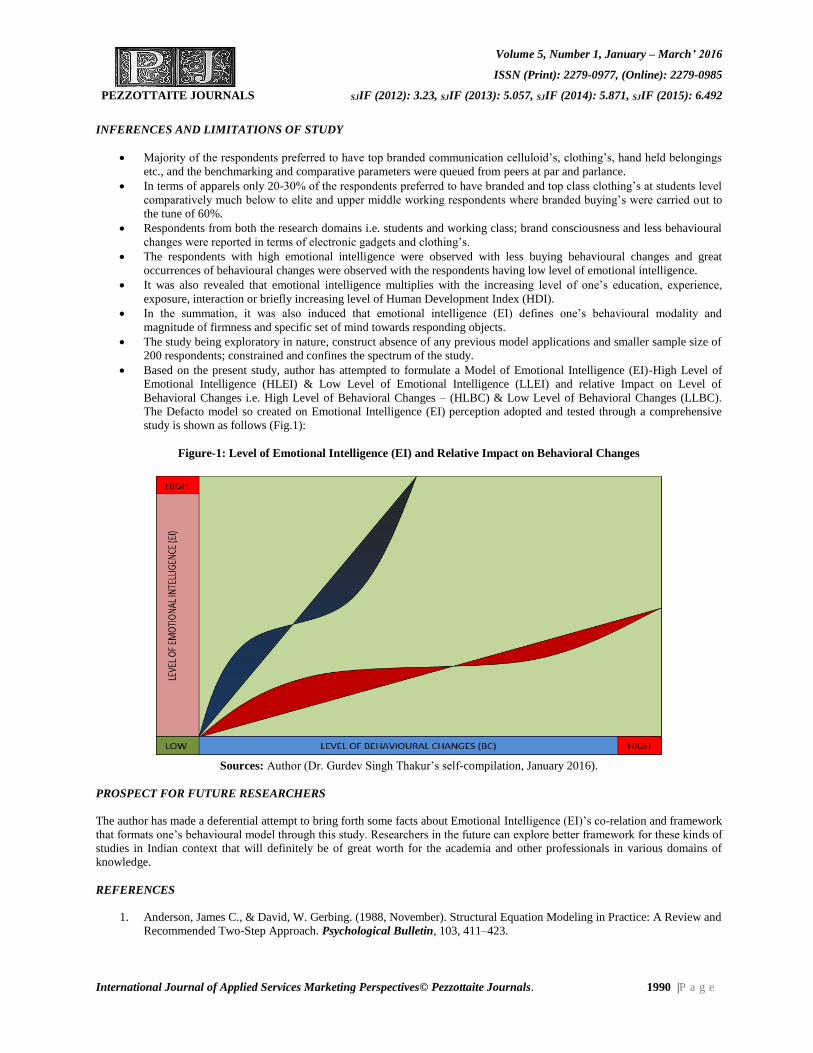
Volume 5, Number 1, January – March’ 2016
ISSN (Print): 2279-0977, (Online): 2279-0985
PEZZOTTAITE JOURNALS SJIF (2012): 3.23, SJIF (2013): 5.057, SJIF (2014): 5.871, SJIF (2015): 6.492
International Journal of Applied Services Marketing Perspectives© Pezzottaite Journals. 1990 |P a g e
INFERENCES AND LIMITATIONS OF STUDY
Majority of the respondents preferred to have top branded communication celluloid’s, clothing’s, hand held belongings
etc., and the benchmarking and comparative parameters were queued from peers at par and parlance.
In terms of apparels only 20-30% of the respondents preferred to have branded and top class clothing’s at students level
comparatively much below to elite and upper middle working respondents where branded buying’s were carried out to
the tune of 60%.
Respondents from both the research domains i.e. students and working class; brand consciousness and less behavioural
changes were reported in terms of electronic gadgets and clothing’s.
The respondents with high emotional intelligence were observed with less buying behavioural changes and great
occurrences of behavioural changes were observed with the respondents having low level of emotional intelligence.
It was also revealed that emotional intelligence multiplies with the increasing level of one’s education, experience,
exposure, interaction or briefly increasing level of Human Development Index (HDI).
In the summation, it was also induced that emotional intelligence (EI) defines one’s behavioural modality and
magnitude of firmness and specific set of mind towards responding objects.
The study being exploratory in nature, construct absence of any previous model applications and smaller sample size of
200 respondents; constrained and confines the spectrum of the study.
Based on the present study, author has attempted to formulate a Model of Emotional Intelligence (EI)-High Level of
Emotional Intelligence (HLEI) & Low Level of Emotional Intelligence (LLEI) and relative Impact on Level of
Behavioral Changes i.e. High Level of Behavioral Changes – (HLBC) & Low Level of Behavioral Changes (LLBC).
The Defacto model so created on Emotional Intelligence (EI) perception adopted and tested through a comprehensive
study is shown as follows (Fig.1):
Figure-1: Level of Emotional Intelligence (EI) and Relative Impact on Behavioral Changes
Sources: Author (Dr. Gurdev Singh Thakur’s self-compilation, January 2016).
PROSPECT FOR FUTURE RESEARCHERS
The author has made a deferential attempt to bring forth some facts about Emotional Intelligence (EI)’s co-relation and framework
that formats one’s behavioural model through this study. Researchers in the future can explore better framework for these kinds of
studies in Indian context that will definitely be of great worth for the academia and other professionals in various domains of
knowledge.
REFERENCES
1. Anderson, James C., & David, W. Gerbing. (1988, November). Structural Equation Modeling in Practice: A Review and
Recommended Two-Step Approach. Psychological Bulletin, 103, 411–423.
Volume 5, Number 1, January – March’ 2016
ISSN (Print): 2279-0977, (Online): 2279-0985
PEZZOTTAITE JOURNALS SJIF (2012): 3.23, SJIF (2013): 5.057, SJIF (2014): 5.871, SJIF (2015): 6.492
International Journal of Applied Services Marketing Perspectives© Pezzottaite Journals. 1991 |P a g e
2. Bearden, William O., Richard G. Netemeyer, & Jesse E. Teel. (1989, March). Measurement of Consumer Susceptibility
to Interpersonal Influence. Journal of Consumer Research, 15, 473–481.
3. Bearden, William O., Richard G. Netemeyer, & Mary F. Mobley. (1999). Handbook of Marketing Scales. Newbury
Park, CA: Sage.
4. Berry, M. W., & Castellanos (Ed.). (2007). Survey of Text Mining II: Clustering, Classification.
5. Blair, Kidwell, David, M. Hardesty, & Terry, L. Childers. (2008, June). Consumer Emotional Intelligence:
Conceptualization, Measurement, and the Prediction of Consumer Decision Making. Journal of Consumer Research.
6. Brackett, Marc A., Susan, E. Rivers, Sara, Shiffman, Nicole, Lerner, & Peter, Salovey. (2006). Relating Emotional
Abilities to Social Functioning: A Comparison of Self-Report and Performance.
7. Darwin, C. (1913). The Expression of the Emotions in Man and Animals. London: D. Appleton and Company.
8. De Silva L., Miyasato, T., & Nakatsu, R. (1997). Facial emotion recognition using multimodal information. In Proc.
IEEE Int. Conf. on Information, Communications and Signal Processing (ICICS), (pp. 397-401).
9. Ekman, P. (2007). Emotions Revealed Recognizing Faces and Feelings to Improve Communication and Emotional
Life. NY: OWL Books.
10. (2015). European Journal of Business and Management, 7(1), 165. ISSN 2222-1905 (Paper) ISSN 2222-2839
(Online). Retrieved from www.iiste.org
11. Goleman, D. (1996). Emotional Intelligence: Why It Can Matter More Than IQ? Bantam Books.
12. Hardesty, David M., William, O. Bearden, & Jay, P. Carlson. (2007). Persuasion Knowledge and Consumer Reactions
to Pricing Tactics. Journal of Retailing, 83(2), 199–210.
13. Haugtvedt, Curtis P., & Duane, T. Wegener. (1994, January). Message Order Effects in Persuasion: An Attitude
Strength Perspective. Journal of Consumer Research, 21, 205–218.
14. Johnson, Eric J., & J., Edward Russo. (1984, June). Product Familiarity and Learning New information. Journal of
Consumer Research, 11, 542–550.
15. Luce, Mary Frances. (1998, March). Choosing to Avoid: Coping with Negatively Emotion-Laden Consumer Decisions.
Journal of Consumer Research, 24, 409–433.
16. Luce, Mary Frances, John, W. Payne, & James, R. Bettman. (1999, May). Emotional Trade-Off Difficulty and Choice.
Journal of Marketing Research, 36, 143–159.
17. Mayer model, 2008 (adapted by author). Annales Universitatis Apulensis Series Oeconomica, 11(2), 2009.
18. Mayer, John D., & Peter, Salovey. (1997). What Is Emotional Intelligence? In Emotional Development and Emotional
Intelligence: Implications for Educators, ed. Peter Salovey and David Slusher, New York: Basic, 3–31.
19. Mayer, John D., David R. Caruso, & Peter, Salovey. (1999). Emotional Intelligence Meets Traditional Standards for an
Intelligence. Intelligence, 27(1), 267–298.
20. Mayer, John D., Peter, Salovey, & David, Caruso. (2000). Models of Emotional Intelligence. In the Handbook of
Intelligence, ed. Robert J. Sternberg, New York: Cambridge University Press, 396–420. In addition (2002), Mayer-
Salovey-Caruso Emotional Intelligence Test (MSCEIT) Item Booklet, Toronto: MHS.
21. Mayer, John D., Peter, Salovey, David, Caruso, & Gill, Sitarenios (2003). Measuring Emotional Intelligence with the
MSCEIT V2.0. Emotion, 3(1), 97–105.
22. Mayer, J. D., & Salovey, P. (1997). What Is Emotional Intelligence? In Salovey, P. & Sluyter, D. Emotional
Development And Emotional Intelligence: Educational Implications. New York: Basic Books.
Volume 5, Number 1, January – March’ 2016
ISSN (Print): 2279-0977, (Online): 2279-0985
PEZZOTTAITE JOURNALS SJIF (2012): 3.23, SJIF (2013): 5.057, SJIF (2014): 5.871, SJIF (2015): 6.492
International Journal of Applied Services Marketing Perspectives© Pezzottaite Journals. 1992 |P a g e
23. Measures of Emotional Intelligence. Journal of Personality and Social Psychology, 91(4), 780–795.
24. Thomson, Matthew, Deborah, J. MacInnis, & C., Whan Park. (2005). The Ties That Bind: Measuring the Strength of
Consumers’, Emotional Attachments to Brands. Journal of Consumer Psychology, 15(1), 77–91.
25. John Deighton served as editor and Laura Peracchio served as associate editor for this article. (2007, November 26).
Electronically Published. Retrieved from www.ceis-research.com
26. Zammuner, V. L. (1998). Concepts of emotion: ‘Emotionless’, and dimensional ratings of Italian emotion words.
Cognition and Emotion, 12, 243--272.
27. Retrieved from http://www.degruyter.com/view/j/gfkmir.2012.4.issue-1/gfkmir-2014-0038/gfkmir-2014-0038.xml
*****
BUSINESS PROPOSAL FOR CONFERENCES PUBLICATIONS IN JOURNALS / AS PROCEEDINGS
We are pleased to present this proposal to you as publisher of quality research findings in / as Journals / Special Issues, or
Conference Proceedings under Brand Name ‘Pezzottaite Journals’. We aims to provide the most complete and reliable
source of information on current developments in the different disciplines. The emphasis will be on publishing quality articles
rapidly and making them available to researchers worldwide. Pezzottaite Journals is dedicated to publish peer-reviewed
significant research work and delivering quality content through information sharing.
Pezzottaite Journals extends an opportunity to the ‘Organizers of Conferences & Seminars’ from around the world to
get ‘Plagiarism Free’ research work published in our Journals, submitted and presented by the participants within the
said events either organized by /at your Department / Institution / College or in collaboration.
As you know, the overall success of a refereed journal is highly dependent on the quality and timely reviews, keeping this in
mind, all our research journals are peer-reviewed to ensure and to bring the highest quality research to the widest possible
audience. The papers submitted with us, will follow a well-defined process of publication and on mutual consent. Publications
are made in accordance to policies and guidelines of Pezzottaite Journals. Moreover, our Journals are accessible worldwide as
‘Online’ and ‘Print’ volumes.
We strongly believe in our responsibility as stewards of a public trust. Therefore, we strictly avoid even the appearance of
conflicts-of-interest; we adhere to processes and policies that have been carefully developed to provide clear and objective
information, and it is mandate for collaborating members to follow them.
Success Stories:
We had successfully covered 4 International Conferences and received appreciation from all of them.
If you have any query, [email protected], [email protected]. We will respond to your
inquiry, shortly. If you have links / or are associated with other organizers, feel free to forward ‘Pezzottaite Journals’ to them.
It will indeed be a pleasure to get associated with an educational institution like yours.
(sd/-)
(Editor-In-Chief)
Editor-In-Chief
Pezzottaite Journals,
24, Saraswati Lane, Bohri, Near Modern Dewan Beverages,
Jammu Tawi – 180002, Jammu and Kashmir, India.
(Mobile): +91-09419216270 – 71
Volume 5, Number 1, January – March’ 2016
ISSN (Print): 2279-0977, (Online): 2279-0985
PEZZOTTAITE JOURNALS SJIF (2012): 3.23, SJIF (2013): 5.057, SJIF (2014): 5.871, SJIF (2015): 6.492
International Journal of Applied Services Marketing Perspectives© Pezzottaite Journals. 1993 |P a g e
IMPACT OF SOCIAL MEDIA ON STAKEHOLDERS AND CIVILIANS IN TIMES
OF NATURAL DISASTER MANAGEMENT IN INDIA: A QUANTITATIVE STUDY
Dr. B. P. Mahesh Chandra Guru9 Elham Abbasishahkouh10 Dr. R. Raghavendra11 S. G. Raghavendra12
ABSTRACT
The review of literature clearly indicates that adequate scientific investigations are not carried out in India on the uses of
social media in times of natural disaster management with reference to South India. The present investigation primarily dealt
with the impact of social media on stakeholders and civilians in times of natural disasters.
The present study approached the problem through a systematic survey method, which fits, into the context of the present
investigation. The study reveals that most of the stakeholders and civilians had the benefit of access to social media in times of
natural disasters. The study emphasized that social media had played a notable role in the process of natural disasters
management in South India. The strengths of social media include allowing for instant communication, the ability to reach a
broad audience, and direct communication between disaster management organizations and those affected by the disaster.
These strengths are compared to the its limitations, such as certain demographics not using social media, the speed with
which rumors can spread, and the unrealistic expectations people may have of social media during disasters. The social
media should be used to render locally relevant services to the affected persons. The best practices should be used to establish
a social media plan in case of a disaster or emergency. These practices should be used as guidelines because each disaster or
crisis varies greatly from any other and cannot be given simple standard. The present investigation emphasizes that social
media are indeed an invaluable tools in natural disaster management in South India.
PREAMBLE
The role of social media in disaster management became galvanized during the world response to the various natural disasters.
They have become the new forum for collective intelligence, social convergence, and community activism. The benefits of social
media for systematic natural disaster management are immense, according to empirical evidence. A good deal of interest has been
aroused in modern society on the role of social media as instruments of natural disaster management. The present study evaluated
the impact of social media on stakeholders and civilians in times of natural disasters with special reference to South India.
Social Media for Natural Disaster Management
The extensive reach of social networks allows people who are recovering from disasters to rapidly connect with needed resources.
There are all lot of groups in the most popular social networking sites, allowing individuals involved in various aspects of
emergency awareness and preparedness to connect, discuss, and share knowledge in specific fields. Online social networking
services and social media like Face book, Twitter, Google+, etc. can act and try to solve many problems during natural disasters.
Governments around the world are now making greater use of online and social media as a platform for communication and
engagement with their citizens, in order to deliver better services and enhance citizen participation in policy deliberation in times
of disasters. Disaster and emergency management has proven to be a field of communication where innovative uses of social
media have begun to have a substantial positive impact on the quality of disaster responses and the resilience of affected local
communities. Substantial interest in these questions is already evident among policymakers and government authorities, as well as
NGOs and the media.
Armour (2010:05) studied the role of social media in natural disaster management and cited several events like the September 11
terrorist attacks in 2001, Hurricane Katrina in 2005, and Virginia Tech shootings in 2007. The scholar emphasized that the people
should be aware of their surroundings, constant threat of natural and fabricated incidents for effective management of disasters.
Disaster responders can use social media during a disaster to track volunteers, to help reconnect families, and to disseminate
critical information. He also noted that in a disaster, social media could be used as an alternative to phones for calls for help.
9 Professor, Department of Studies in Communication and Journalism, University of Mysore, Karnataka, India,
[email protected] 10 Research Scholar, Department of Studies in Communication and Journalism, University of Mysore, Karnataka, India,
[email protected] 11 Guest Faculty, Department of Communication and Journalism, Government First Grade College, Karnataka, India,
[email protected] 12Assistant Professor and Head, Department of Communication and Journalism, Maharani’s Arts College, Karnataka, India,
Volume 5, Number 1, January – March’ 2016
ISSN (Print): 2279-0977, (Online): 2279-0985
PEZZOTTAITE JOURNALS SJIF (2012): 3.23, SJIF (2013): 5.057, SJIF (2014): 5.871, SJIF (2015): 6.492
International Journal of Applied Services Marketing Perspectives© Pezzottaite Journals. 1994 |P a g e
Li and Good Child (2010:15) note: “Social networks have become a promising data source in time-critical situations over a period
of time. The social networks can play a vital role in the crowd sourcing of geospatial information for emergency management,
data generation and dissemination of remedial measures. The social networks have proven critical during disaster situations,
because they are able to mobilize the necessary volunteers; to provide the means to share tools; and to facilitate the loose kinds of
dispersed organization that are needed to make the efforts of volunteers run smoothly”.
Kodrich and Laituri (2011:11) observe, “The impact of social media has been dramatic. Social media give victims a voice in times
of natural disasters. The social media also provide links to detailed maps and other geospatial technologies of outside disaster-
related agencies. The social media outlets have continued to increase levels of interactivity among givers because of their ability
to link the public directly to relief organizations’ websites. The technological advancements have allowed the public to feel more
comfortable contributing to relief organizations through secure websites. The social media revolution has made it increasingly
easy to get involved and help at a time of crisis. The social media have contributed greatly to the depth of information available,
offering users a more compelling narrative that enriches their emotional connection to a disaster and their willingness to open their
wallets to help out”.
The social media have played an integral role in disaster management and relief efforts for people affected by natural calamities.
The social media had become an integral part of disaster response, filling the void in areas that did not have any cell network.
Social media platforms like Google, Twitter and Face book promptly launched helpful services during the natural calamities in
India in the recent times. Rajashree (2013:17) pointed out that the convergence of social networks and mobile has thrown the old
response playbook out the window. The social media have emerged as very effective parallel media of natural disaster
management in India and rest of the world.
REVIEW OF LITERATURE
There are a good deal of scientific investigations dealing with sustainable development and natural disaster management at the
international level. Few researchers in India have also examined the role of social media in the process of natural disaster
management. Prominent among them include – Varda et al. (2009:20), Li and Good Child (2010:15), Armour (2010:05), Kodrich,
K and Laituri, M.N (2011:11), Ford (2011:09), Cheng and Hitoshi (2011:07), Kumar et al. (2011:14), Jayanthi et.al. (2012:10),
Roberts (2012:18), Wilson (2012:21), Rajashree (2013:17), Zin et al. (2013:23), Chan (2013:06), Annamalai et al. (2014:04),
Abedin et al. (2014:01), Mukherjee (2014:16), Kulkarni et al. (2014:13), Anand and Narayana (2014:03) and Shilpa (2015:19),
Yates and Partridge (2015:22), Albuquerque et al. (2015:02) and Fohringer et al. (2015:08).
SIGNIFICANCE OF STUDY
South India is known for rich cultural and historical legacy in the Indian sub-continent. It is also known as the land of
‘Dravidians’ which means the people of South India who share Dravidian culture. This region consists of Vishalandhra,
Telangana, Tamil Nadu, Karnataka and Kerala states. South India has not achieved progress on par with the people of North India
due to the prevalence of regionalism in the country. Despite certain disadvantages and limitations, South India has achieved
notable progress in all occupations. In particular, South India is affected by series of natural disasters, which have cost the lives of
the people and resources over a period.
The periodic occurrence of natural disasters needs to be addressed seriously by the stakeholders of natural disaster management in
the region. The review of literature clearly indicates that adequate scientific investigations are not carried out in India on the
impact of social media on the stakeholders and civilians in times of natural disasters with special reference to South India. Hence,
the study assumes profound academic and social significance.
STATEMENT OF PROBLEM
The role of social media in natural disaster management with special reference to South India was considered in the study,
because:
South India enjoys rich cultural, historical and political heritage in Indian sub-continent.
South India is affected by natural disasters periodically due to unforeseen reasons.
South Indian Governments have established institutions to manage natural disasters.
Social media intervention for natural disaster management assumes great significance in a developing region like South
India.
Tested and tried social media initiatives would go a long way in addressing the issue of natural disasters management in
South India.
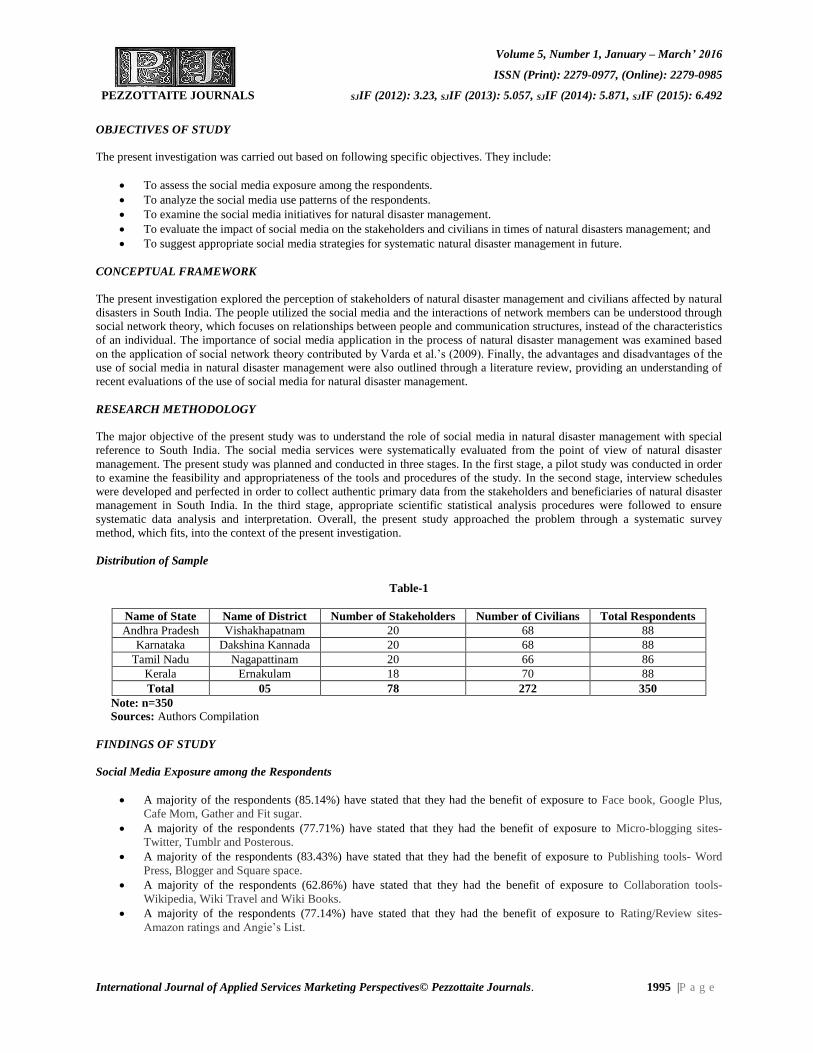
Volume 5, Number 1, January – March’ 2016
ISSN (Print): 2279-0977, (Online): 2279-0985
PEZZOTTAITE JOURNALS SJIF (2012): 3.23, SJIF (2013): 5.057, SJIF (2014): 5.871, SJIF (2015): 6.492
International Journal of Applied Services Marketing Perspectives© Pezzottaite Journals. 1995 |P a g e
OBJECTIVES OF STUDY
The present investigation was carried out based on following specific objectives. They include:
To assess the social media exposure among the respondents.
To analyze the social media use patterns of the respondents.
To examine the social media initiatives for natural disaster management.
To evaluate the impact of social media on the stakeholders and civilians in times of natural disasters management; and
To suggest appropriate social media strategies for systematic natural disaster management in future.
CONCEPTUAL FRAMEWORK
The present investigation explored the perception of stakeholders of natural disaster management and civilians affected by natural
disasters in South India. The people utilized the social media and the interactions of network members can be understood through
social network theory, which focuses on relationships between people and communication structures, instead of the characteristics
of an individual. The importance of social media application in the process of natural disaster management was examined based
on the application of social network theory contributed by Varda et al.’s (2009). Finally, the advantages and disadvantages of the
use of social media in natural disaster management were also outlined through a literature review, providing an understanding of
recent evaluations of the use of social media for natural disaster management.
RESEARCH METHODOLOGY
The major objective of the present study was to understand the role of social media in natural disaster management with special
reference to South India. The social media services were systematically evaluated from the point of view of natural disaster
management. The present study was planned and conducted in three stages. In the first stage, a pilot study was conducted in order
to examine the feasibility and appropriateness of the tools and procedures of the study. In the second stage, interview schedules
were developed and perfected in order to collect authentic primary data from the stakeholders and beneficiaries of natural disaster
management in South India. In the third stage, appropriate scientific statistical analysis procedures were followed to ensure
systematic data analysis and interpretation. Overall, the present study approached the problem through a systematic survey
method, which fits, into the context of the present investigation.
Distribution of Sample
Table-1
Name of State Name of District Number of Stakeholders Number of Civilians Total Respondents
Andhra Pradesh Vishakhapatnam 20 68 88
Karnataka Dakshina Kannada 20 68 88
Tamil Nadu Nagapattinam 20 66 86
Kerala Ernakulam 18 70 88
Total 05 78 272 350
Note: n=350
Sources: Authors Compilation
FINDINGS OF STUDY
Social Media Exposure among the Respondents
A majority of the respondents (85.14%) have stated that they had the benefit of exposure to Face book, Google Plus,
Cafe Mom, Gather and Fit sugar.
A majority of the respondents (77.71%) have stated that they had the benefit of exposure to Micro-blogging sites-
Twitter, Tumblr and Posterous.
A majority of the respondents (83.43%) have stated that they had the benefit of exposure to Publishing tools- Word
Press, Blogger and Square space.
A majority of the respondents (62.86%) have stated that they had the benefit of exposure to Collaboration tools-
Wikipedia, Wiki Travel and Wiki Books.
A majority of the respondents (77.14%) have stated that they had the benefit of exposure to Rating/Review sites-
Amazon ratings and Angie’s List.
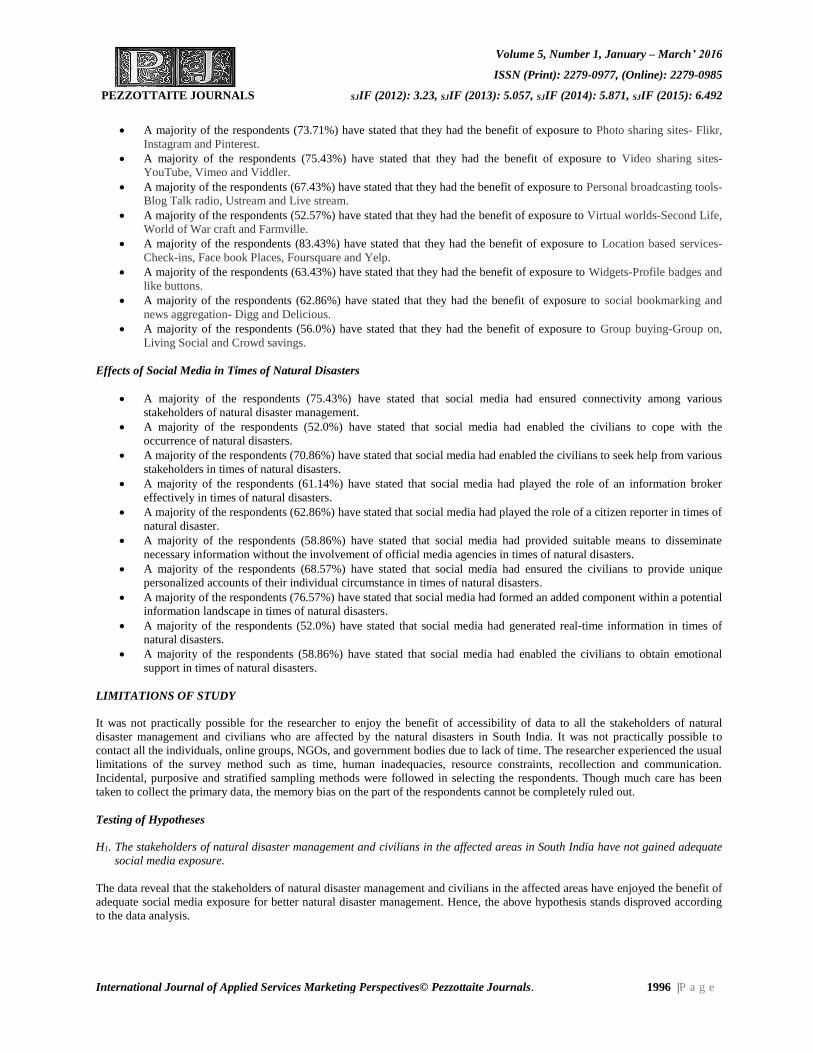
Volume 5, Number 1, January – March’ 2016
ISSN (Print): 2279-0977, (Online): 2279-0985
PEZZOTTAITE JOURNALS SJIF (2012): 3.23, SJIF (2013): 5.057, SJIF (2014): 5.871, SJIF (2015): 6.492
International Journal of Applied Services Marketing Perspectives© Pezzottaite Journals. 1996 |P a g e
A majority of the respondents (73.71%) have stated that they had the benefit of exposure to Photo sharing sites- Flikr,
Instagram and Pinterest.
A majority of the respondents (75.43%) have stated that they had the benefit of exposure to Video sharing sites-
YouTube, Vimeo and Viddler.
A majority of the respondents (67.43%) have stated that they had the benefit of exposure to Personal broadcasting tools-
Blog Talk radio, Ustream and Live stream.
A majority of the respondents (52.57%) have stated that they had the benefit of exposure to Virtual worlds-Second Life,
World of War craft and Farmville.
A majority of the respondents (83.43%) have stated that they had the benefit of exposure to Location based services-
Check-ins, Face book Places, Foursquare and Yelp.
A majority of the respondents (63.43%) have stated that they had the benefit of exposure to Widgets-Profile badges and
like buttons.
A majority of the respondents (62.86%) have stated that they had the benefit of exposure to social bookmarking and
news aggregation- Digg and Delicious.
A majority of the respondents (56.0%) have stated that they had the benefit of exposure to Group buying-Group on,
Living Social and Crowd savings.
Effects of Social Media in Times of Natural Disasters
A majority of the respondents (75.43%) have stated that social media had ensured connectivity among various
stakeholders of natural disaster management.
A majority of the respondents (52.0%) have stated that social media had enabled the civilians to cope with the
occurrence of natural disasters.
A majority of the respondents (70.86%) have stated that social media had enabled the civilians to seek help from various
stakeholders in times of natural disasters.
A majority of the respondents (61.14%) have stated that social media had played the role of an information broker
effectively in times of natural disasters.
A majority of the respondents (62.86%) have stated that social media had played the role of a citizen reporter in times of
natural disaster.
A majority of the respondents (58.86%) have stated that social media had provided suitable means to disseminate
necessary information without the involvement of official media agencies in times of natural disasters.
A majority of the respondents (68.57%) have stated that social media had ensured the civilians to provide unique
personalized accounts of their individual circumstance in times of natural disasters.
A majority of the respondents (76.57%) have stated that social media had formed an added component within a potential
information landscape in times of natural disasters.
A majority of the respondents (52.0%) have stated that social media had generated real-time information in times of
natural disasters.
A majority of the respondents (58.86%) have stated that social media had enabled the civilians to obtain emotional
support in times of natural disasters.
LIMITATIONS OF STUDY
It was not practically possible for the researcher to enjoy the benefit of accessibility of data to all the stakeholders of natural
disaster management and civilians who are affected by the natural disasters in South India. It was not practically possible to
contact all the individuals, online groups, NGOs, and government bodies due to lack of time. The researcher experienced the usual
limitations of the survey method such as time, human inadequacies, resource constraints, recollection and communication.
Incidental, purposive and stratified sampling methods were followed in selecting the respondents. Though much care has been
taken to collect the primary data, the memory bias on the part of the respondents cannot be completely ruled out.
Testing of Hypotheses
H1. The stakeholders of natural disaster management and civilians in the affected areas in South India have not gained adequate
social media exposure.
The data reveal that the stakeholders of natural disaster management and civilians in the affected areas have enjoyed the benefit of
adequate social media exposure for better natural disaster management. Hence, the above hypothesis stands disproved according
to the data analysis.
Volume 5, Number 1, January – March’ 2016
ISSN (Print): 2279-0977, (Online): 2279-0985
PEZZOTTAITE JOURNALS SJIF (2012): 3.23, SJIF (2013): 5.057, SJIF (2014): 5.871, SJIF (2015): 6.492
International Journal of Applied Services Marketing Perspectives© Pezzottaite Journals. 1997 |P a g e
H2. The stakeholders of natural disaster management and civilians in the affected areas in South India have not found the social
media initiatives as effective tools of management of natural disasters.
The data reveal that the stakeholders of natural disaster management and civilians in the affected areas have found several positive
effects of social media in times of natural disasters. Hence, the above hypothesis stands disproved according to the data analysis.
IMPLICATIONS OF STUDY
The social media plot forms are used in times of natural disaster management according to their popularity and access to the vast
number of users on each platform. The stakeholders of natural disaster management should use social media tools that contribute
to the success of their social media campaigns. By selecting the most popular and most utilized social media tools, stakeholders
stand to gain the most from the tool and achieve the highest degree of success. The government organizations have increased their
use of social media. These organizations should use the social media adequately during disaster relief efforts. The mobile phone
applications and e-mail also have great potentials in times of natural disaster management since they disseminate important and
critical information. The social media should be used to render locally relevant services to the affected persons. The best practices
should be used to establish a social media plan in case of a disaster or emergency. These practices should be used as guidelines
because each disaster or crisis varies greatly from any other and cannot be given simple standard.
The stakeholders of natural disasters management should plan social media tactics in advance and make other people within the
organization aware of the communication strategies in order to ensure that social media receives attention during a disaster. It is
important for stakeholders to use social media tools that will contribute to the success of their campaigns. This should be done
through reaching as many people as possible on popular social media platforms. The mapping tools are a new form of social
media, which could be utilized for rendering adequate disaster relief, centered services. It is essential for stakeholders involved in
disaster relief to understand the best ways they can use social media tools. The best practices of mapping tools could be researched
in detail, as its applications continue to expand in future.
CONCLUSION
The present study reveals that social media have the capacity to facilitate proper natural disaster management in modern times.
The social media have the potential to be powerful tools coordinating relief responses, connecting individuals to resources, and
engaging a wider community beyond those directly affected in times of natural disasters. The study has demonstrated that social
media were used to facilitate the sharing of vital information between the stakeholders and civilians affected by natural disasters.
The study also provided insight into how disaster responders can interact with different networks to enhance their responses. The
stakeholders of natural disaster management are using applications and mobile browsing for a dynamic experience. By tapping
into this population and drawing on their strengths and resources, disaster responders can enhance their efforts, and improve their
ability to act swiftly and effectively when disaster strikes. The strengths of social media include allowing for instant
communication, the ability to reach a broad audience, and direct communication between disaster management organizations and
those affected by the disaster. These strengths are compared to the its limitations, such as certain demographics not using social
media, the speed with which rumors can spread, and the unrealistic expectations people may have of social media during disasters.
The present investigation emphasizes that social media are indeed an invaluable tools in natural disaster management in South
India.
REFERENCES
1. Abedin, Babak, Abdul, Babar, & Alireza, Abbasi. (2014, December 3-4). Characterization of the Use of Social Media in
Natural Disasters: A Systematic Review. IEEE International Conference on Big Data and Cloud Computing. Sydney,
Australia.
2. Albuquerque, Joao Porto de., Benjamin Herfort., Alexander, Brenning, & Alexander, Zipf. (2015). A Geographic
Approach for Combining Social Media and Authoritative Data towards Identifying Useful Information for Disaster
Management. International Journal of Geographical Information Science. Retrieved from www.dx.doi.org
3. Anand, S., & Narayana, K. (2014). Earthquake Reporting System Development by Tweet Analysis. International
Journal of Emerging Engineering Research and Technology, 2(4), 96-106.
4. Annamalai, C., Koay, S. S., & Lee, S. M. (2014). Role of Social Networking in Disaster Management: An Empirical
Analysis. Journal of Computation in Biosciences and Engineering, 1(3), 1-5.
5. Armour, G. (2010). Communities Communicating with Formal and Informal Systems: Being More Resilient in Times
of Need. Bulletin of the American Society for Information Science & Technology, 36(5), 34-38.
Volume 5, Number 1, January – March’ 2016
ISSN (Print): 2279-0977, (Online): 2279-0985
PEZZOTTAITE JOURNALS SJIF (2012): 3.23, SJIF (2013): 5.057, SJIF (2014): 5.871, SJIF (2015): 6.492
International Journal of Applied Services Marketing Perspectives© Pezzottaite Journals. 1998 |P a g e
6. Chan, Jason Christopher. (2013). The Role of Social Media in Crisis Preparedness, Response and Recovery. Sowarga,
Paris, France.
7. Cheng, John William, & Mitomo, Hitoshi. (2011). Media Dependency, Usage and Trust in a Time of Crisis – A Case
Study of the Great East Japan Earthquake (Project Report). Waseda University, Japan: Institute of Asia-Pacific
Studies.
8. Fohringer, J., Dransch, D., Kreibich, H., & Schroter, K. (2015). Social media as an information source for rapid flood
inundation mapping. Nat. Hazards Earth Syst. Sci. Discuss., 3, 4231–4264.
9. Ford, Tegan. (2011). Social Media and Crisis Communication: Theories and Best Practices (Unpublished
Dissertation). Carleton University: School of Journalism and Communication. Ottawa, Ontari.
10. Jayanthi, Harikishan, Gregory, J. Husak, Chris, Funk, Tamuka, Magadzire, Adams, Chavula, & James, P. Verdin.
(2012). Modeling Rain-Fed Maze Vulnerability to Droughts Using the Standardized Precipitation Index from Satellite
Estimated Rainfall – Southern Malawi Case Study. International Journal of Disaster Risk Reduction, 4, 71-81.
11. Kodrich, K., & Laituri, M. N. (2011). Making a connection: Social media’s key role in the Haiti earthquake. Journal of
Communication and Computer, 8, 624-627.
12. Kulkarni, Swapnali V., Jayapal, P. C., & Priyanka, D. Navgire. (2014). Social Networking for Real Time Earthquake
Detection and Reporting System. International Journal of Advance Research in Computer Science and Management
Studies, 2(11), 291-296.
13. Kumar, Ashwani, Brahmanand, P. S., & Ashok, K. Nayak. (2014). Management of Cyclone Disaster in Agriculture
Sector in Coastal Areas. Directorate of Water Management, Bhubaneswar, Odisha, India. Retrieved from
www.dwm.res.in
14. Kumar, Shamanth, Geoffrey, Barbier, Mohammad, Ali Abbasi, & Huan, Liu. (2011). Tweet Tracker: An Analysis Tool
for Humanitarian and Disaster Relief. In Fifth International AAAI Conference on Weblogs and Social Media,
ICWSM.
15. Li, Linna, & Michael, F. Goodchild. (2010). The Role of Social Networks in Emergency Management: A Research
Agenda. International Journal of Information Systems for Crisis Response and Management, 2(4), 49-59.
16. Mukherjee, Soumen. (2014). The Use of Twitter, Facebook, LinkedIn etc. as Strategic Tools for Crisis Communication.
International Journal of Management and International Business Studies, 4(2), 175-180.
17. Rajashree. (2013, November 18). The Role of Social Media during a Natural Disaster. Social Media Monitoring.
Retrieved from http://simplify360.com/blog/the-role-of-social-media-during-a-natural-disaster/
18. Roberts, Holly Ann. (2012). Organizational Communication, Social Media and Sense Making during a Cascading
Crisis: Tokyo Disney and the 2011 Japan Earthquake/Tsunami/Nuclear Crisis (Unpublished Thesis). University of
Kentucky, UK.
19. Shilpa, J. (2015). New Media, Natural Disaster Management and Agricultural Development: A Case Study of
Karnataka State Natural Disaster Monitoring Centre (Unpublished Thesis). University of Mysore, Karnataka, India.
20. Varda, D., Forgette, R., Banks, D., & Contractor, N. (2009). Social Network Methodology in the Study of Disasters:
Issues and Insights Prompted by Post Katrina Research. Population Research and Policy Review, 28, 11-29.
21. Wilson, Jennifer. (2012). Responding to Natural Disasters with Social Media: A Case Study of the 2011 Earthquake
and Tsunami in Japan (Unpublished Dissertation). Simon Fraser University: School for International Studies, Faculty
of Arts and Social Sciences. British Columbia, Canada.
22. Yates, C., & Partridge, H. (2015). Citizens and social media in times of natural disaster: exploring information
experience. Information Research, 20(1), 659.
Volume 5, Number 1, January – March’ 2016
ISSN (Print): 2279-0977, (Online): 2279-0985
PEZZOTTAITE JOURNALS SJIF (2012): 3.23, SJIF (2013): 5.057, SJIF (2014): 5.871, SJIF (2015): 6.492
International Journal of Applied Services Marketing Perspectives© Pezzottaite Journals. 1999 |P a g e
23. Zin, Thi Thi, Pyke, Tin, Hiromitsu, Hama, & Takashi, Toriu. (2013, March 13-15). Knowledge based Social Network
Applications to Disaster Event Analysis. In Proceedings of the International Multi-Conference of Engineers and
Computer Scientists. Hong Kong.
24. Retrieved from
http://www.researchgate.net/profile/Plamena_Zlateva/publication/271585520_Use_of_Social_Media_in_Nat...
25. Retrieved from http://www.slideshare.net/klibel/kll4330-dr-rodiyah-s-pd-sh-msi
26. Retrieved from http://www.redorbit.com/news/technology/1821357/handling_emergencies_online/
27. Retrieved from
http://www.academia.edu/2619692/Social_network_methodology_in_the_study_of_disasters_Issues_and_insi...
28. Retrieved from http://www.publicengines.com/blog/2012/10/31/social-media-use-in-natural-disaster/
29. Retrieved from https://ideas.repec.org/a/kap/poprpr/v28y2009i1p11-29.html
30. Retrieved from http://chve.xyz/business-life/2016/02/01/1548248/communication-and-media-disaster-response
31. Retrieved from http://photogallery.indiatimes.com/celebs/celeb-themes/sexy-female-spies/articleshow/46957921.cms
32. Retrieved from http://www.ijeert.org/
33. Retrieved from http://www.youtube.com/watch?v=hG5J3d1d_fo
34. Retrieved from http://www.ijeert.org/contact-us
35. Retrieved from http://www.ijicic.org/elb-6(3).htm
36. Retrieved from https://in.linkedin.com/in/harshitha-prithviraj-b85330113.
*****
CHECK PLAGIARISM SERVICE
Pezzottaite Journals charges nominal fees from Journal Managers, Editors, Section Editors, Copy Editors, Layout Editors,
Proof Readers, Subscription Managers, Reviewers, Readers (Subscribers and Individuals), and Authors to get their
manuscripts scanned for plagiarism.
Indian Users
One Manuscript / article = Rs. 350.00
Two Manuscripts / articles = Rs. 350.00 x 2 = Rs. 700.00 ………As so on...
Formulae = (Numbers of Manuscripts x Rs. 350.00) = Amount to be paid as ‘Online Bank Transfer’ before
availing the services.
International Users
One Manuscript = US$15.00
Two Manuscripts = US$15.00 x 2 = US$ 30 ………As so on...
Formulae = (Numbers of Manuscripts x US$15.00) = Amount to be paid as ‘Online Bank Transfer’ before
availing the services.
Note: Total amount if computed in US$ must be converted into Indian Rupees as per Currency Exchange Rates on the day of
placing the order; Computed amount (in Rupees) is to be transferred in Pezzottaite Journals Bank Account (s); In case, where
the transacted currency is not US$, then, purchaser must consider the exchange rate of domestic country’s currency against
'US$ / Rupees' and transfer the same.
Bank details are available at: http://pezzottaitejournals.net/pezzottaite/bank_accounts_detail.php
Volume 5, Number 1, January – March’ 2016
ISSN (Print): 2279-0977, (Online): 2279-0985
PEZZOTTAITE JOURNALS SJIF (2012): 3.23, SJIF (2013): 5.057, SJIF (2014): 5.871, SJIF (2015): 6.492
International Journal of Applied Services Marketing Perspectives© Pezzottaite Journals. 2000 |P a g e
INDIA’S SERVICE SECTOR POST-LIBERALISATION: MULTI-DIMENSIONAL ANALYSIS
Dr. Mohd Saif Alam13
ABSTRACT
Service sector has emerged as the fastest growing sector not only on the national platform but also on the international
platform. Its share in GDP, trade, FDI, employment (negligible) has increased. GDP that was once dominated by the
agriculture and allied activities sector has now been taken over by the service sector. With the share of agriculture in GDP-
29.62% in 1990-91, it came down to 14.51% in 2010-11. As a result, the service sector share in GDP rose from 49.76% to
65.54% for the same period with slight change in the contribution of industry to GDP. On the trade front, the share of service
exports has increased from 17.54% to 26.90% for the same period.
In 2000, India’s share in service trade export was just 1.2% and import 1.4%, placed at twenty-two and nineteenth position.
As per the WTO-World trade report 2013, India’s share in service exports is 3.4% with sixth place and in terms of imports
3.0% with seventh place.
Unlike trade in goods, trade of services are not free from barriers especially to FDI and movement of natural person. Since
service, trade requires movement of provider/consumer there arises the regulatory framework. These barriers may be in form
of – quantitative restrictions, price based barriers, barriers related to certification, government procurement etc.
KEYWORDS
Liberalization, Employment, Trade, Foreign Investment etc.
INTRODUCTION
The role of services has changed dramatically in recent decades. Services represent the largest single sector in developed
economies and increasingly in developing economies as well, accounting for nearly two-thirds of value-added and employment in
the former and about half in the latter. Services are also the fastest-growing component of international trade. Since 1980, services
exports have grown more strongly than merchandise exports and now amount to about US$1.5 trillion annually, or about one-fifth
of total world exports.
Efficiency in the production of services has an important bearing on economic performance and development. Services like
transportation and distribution, education and health, and banking and finance are of critical importance in developing countries,
both for the emergence of a competitive manufacturing sector and, more broadly, for social development and poverty reduction. In
many poor countries, economic and social development is hampered by the lack of adequate basic infrastructure such as roads,
power supply, telecommunications, and public transport (World Bank, 2002). Openness to services trade may therefore entail
major benefits by helping the poorest countries to obtain infrastructure services at internationally competitive prices. The
liberalization of transportation and financial services, for example, is expected to significantly lower costs in merchandise trade.
Where countries have opened up to international services transactions, they have enhanced the efficiency of existing domestic
services industries by attracting fresh capital and providing incentives for restructuring inefficient companies.
Trade in services has important implications for the balance of payments. Many developing countries have benefited from exports
of construction, banking, and professional services or from services, transactions based on telecommunications networks (such as
data processing and entry, and software production). Remittances from nationals residing abroad and the compensation of
residents temporarily employed abroad represent important currency revenues, in some countries rivaling export receipts.
Furthermore, international services trade has important implications for capital flows. Recent estimates suggest that nearly 60
percent of international services transactions are conducted through foreign affiliates of multinational companies. Already, nearly
one-half of the total outward FDI stock of OECD economies is in services sectors.
LITERATURE REVIEW
While the expanding importance of services in the economy has certainly been noticed, services trade do not figure prominently in
research on economic growth and development. For example, growth theory accord no special role of services activities, with the
exception of financial services (Marchetti and Ray, 2008).
13Post Doctoral Fellow, Department of Commerce, University of Lucknow, Uttar Pradesh, India, [email protected]
Volume 5, Number 1, January – March’ 2016
ISSN (Print): 2279-0977, (Online): 2279-0985
PEZZOTTAITE JOURNALS SJIF (2012): 3.23, SJIF (2013): 5.057, SJIF (2014): 5.871, SJIF (2015): 6.492
International Journal of Applied Services Marketing Perspectives© Pezzottaite Journals. 2001 |P a g e
Trade theories have paid much greater attention to goods trade for the simple reason that most of the services were non-tradeables
for a long time (Mattoo et al., 2008). However, with the improvement in information and communication technology (ICT), trade
in services has become significantly easier in the last couple of decades. A number of theoretical models have come up, which use
the traditional comparative cost theories of either Ricardo or Heckscher-Ohlin to prove that liberalization of trade in services is
welfare improving for both the source as well the recipient countries.
One of the critical issues that have been discussed in the literature is the role played by services in the growth process. Though, a
forceful case is put forward that services can become the major driving force of economic growth, in case of India the
sustainability of a service-led growth has been questioned by many (e.g., Mitra 1988, Bhattacharya and Mitra 1990 and
Arunachalam and Kumar 2002). It has been argued that income from the service sector is growing much in excess of the demand
generated for services by the commodity sector and since income might grow faster than employment in the organised services.
To test the issue of sustainability of service-led growth in India, Gordon and Gupta (2004) attempts to find out whether India is an
outlier in this case by using cross-country data on sectoral shares in GDP and fitting a trend line. They find that the share of
service sector in GDP is associated positively with per capita income, i.e., the countries with higher per capita income also have a
larger share of services in GDP. In case of India, they find that in 1990, share of India’s service sector in GDP was very close to
the average share predicted by the linear relationship. However, because of rapid growth of services in 1990s, by 2001, India’s
share of services moved above the average share by as much as 5 percentage points. However, in spite of this, they do not find
India to be an outlier at present. However, they argue that if different sectors in India grow at the average growth rates
experienced in 1996-2000, then by 2010, the share of services would increase to 58 percent. This would bring size of India’s
services sector, relative to GDP, closer to that of an upper middle-income country, even though India would still belong to the
low-income group.
Hansda (2001) addresses the issue of sustainability of service-led growth of India in terms of inter-sectoral linkages as emanating
from input-output tables for 1993-94 for 115 activities at the disaggregated level. The results indicate that while services and
agriculture do not share much inter-dependence, industry is found to be most service-intensive with 70% of its activities being
direct services-intensive. The inter-sectoral linkages are explored further by estimating Rasmussen indices of backward and
forward linkages. The indices show that service sector is more growth inducing as compared to other sectors in terms of backward
and forward linkages. He therefore argues that growth in service sector will induce growth in other sectors. The issue of
sustainability of services growth, i.e., whether the lack of rise in the share of manufacturing sector and the corresponding shift to
services is sustainable or not is further examined by Banga and Goldar (2004). In this regard, the study estimates the impact of
higher use of services input on productivity growth of manufacturing sector. They construct a multilateral total factor productivity
index for 41 major industry groups for the period 1980-81 to 1999-00. Regressing the total factor productivity index on a set of
explanatory variables including the ratio of services input to employment, the study finds a positive relationship between use of
services input and industrial productivity. Their results show that the increase in use of services in manufacturing in the 1990s has
favorably affected productivity in the manufacturing sector. In the light of this result, the study argues that India’s service sector
will be successful in creating its own demand since higher use of services in the manufacturing sector has not only lead to higher
output growth in manufacturing sector but also improved productivity in the manufacturing sector.
The work of Olivier et.al on Assessing the Potential of Services Trade in Developing Countries: An Overview points out the
importance of service trade for these nations and brings out the policy measure that are required on the part of developed and
developing nations for increasing service trade.
OBJECTIVES
Find out the importance of service sector for a country like India. Importance of this sector will be measured in terms of
its contribution to GDP, Employment, Trade and FDI.
Finding out the growth in service trade, the focus will be on service exports. This section will take a detailed analysis of
the sub sectors and growth over the period.
METHODOLOGY
This paper is based on secondary data that is available online/printed. The major sources that have been consulted are: RBI-
Handbook of Indian Statistics, Economic surveys, WTO- World Trade Report and UNCTAD- Handbook of Statistics.
SERVICE SECTOR & ITS IMPORTANCE
Service sector has emerged as the fastest growing sector on the global platform, contributing more than 70%towards GDP and
providing employment to 50% of the workforce. This growth brought some indirect benefits in the form of increased trade in
services on global platform and more avenues of investment for developed nations.
Volume 5, Number 1, January – March’ 2016
ISSN (Print): 2279-0977, (Online): 2279-0985
PEZZOTTAITE JOURNALS SJIF (2012): 3.23, SJIF (2013): 5.057, SJIF (2014): 5.871, SJIF (2015): 6.492
International Journal of Applied Services Marketing Perspectives© Pezzottaite Journals. 2002 |P a g e
Developing economies are no exception to this structural transformation and in India too there has been growing importance of
this sector in terms of GDP, exports, FDI and employment. In India, service sector contribution to GDP has nearly doubled since
1951 and at present, this sector is pushing the growth rate of the nation.
Table-1.1 shows the services sector contribution (%) to GDP, Exports, Employment and Foreign Direct Investment (FDI) for the
period 1991-2012. There are four panels in the table each panel representing service sector contribution to GDP, Exports,
Employment and FDI. Panle 1 and 2 represents the time series data (in %) whereas panel 3 shows the share in employment for
2000-2011 and finally panel 4 shows the decadal share of services in FDI since 1991-2011.
With respect to services share in GDP it can be seen that for the period under study, share of service in GDP has increased from
49.8% in 1991 to 66.8 in 2012, for the same period there has been considerable fall in the share of agriculture and allied in the
GDP with 29.6% in 1991 to 14% in 2012.
For industrial sector, not significant change took place in its contribution to GDP. Thus, whatever fall in agriculture GDP happens
was absorbed by services. Compound annual growth rate (CAGR) for the whole period 1991-2012 comes to 2.9, 6.3 and 8.1
percent for different sectors respectively. Overall CAGR for the period is 6.6%. Thus, service sector had the capability of pulling
up the growth rate.
Panel 2 of the table shows sector wise share in exports for the period 1991-2012. Contribution of agriculture and allied and
industry has come down from 12.9% in 1991 to 7.1% in 2012 for agriculture and allied and that of industry came down to 35.5%
in 2012 from 50.1% in 1991. Only service sector share in total exports from India has registered an increase from 17.5% in 1991
to 26.9 in 2012. Compound annual growth rate for the respective sector for the period under study- 12.1%, 13.1% and 17.8%.
Overall CAGR for exports are 15.4%. Thus, on this front, also, service sector has been able to deliver and its growth rate is above
the total growth rate.
Panel 3 of the table shows the sector wise share in employment for the period 2000-2011, this period is further divided into two-
2000-05 and 2006-11. On employment front, there has been a fall in the share of agriculture and allied, whatever reduction took
place in agriculture was absorbed by industrial sector. On this front performance of service sector is not applaud able as not much
change took place in its share in employment from 23.7 for 2000-05 its share slightly increased to 24.4% for 2006-2011.
Panel 4 shows the share of services in the total FDI. Period covered for study is 1991-2012 with division into two- 1991-1999 and
2000-2012. Services share in FDI to has almost triple. It went up from 6.20% to 19.05%.
SERVICES AND ITS SUB-SECTORS
Service sectors comprises of the following sub-sectors:
Construction,
Trade, Hotels, Transport & Communication,
Financing, Insurance, Real estate and Business services,
Community, Business and Personal services.
Table-1.2 shows the share of services sub-sector in GDP, Services, year-on-year growth along with CAGR for the period covering
1991-2012. Table 1.2 is divided into three panels, panel one show the share of services and its sub-sectors in GDP, panel two
shows the share of sub-sectors in service and finally panel 3 shows the year-on-year growth rate in GDP, services and its sub-
sectors.
With respect to the share of services and its sub-sectors in GDP it can be seen that share of services and its sub-sectors (except for
community, business & personal services)has shown increasing trends over the period under study. With the share of services in
GDP of 49.76% in 1991, it increased to 66.77% in 2012. In sub-sectors the trade & hotels group along with finance and insurance
group has made major contribution to the GDP together there share increased from 29% in 1991 to 45% in 2012.
In terms of share of sub-sectors in services it can be seen that the share of construction and community services group has come
down, share of construction came down 14.24% in 1991 to 11.65 in 2012 whereas that of community services group came down
from 27.45% to 19.42% for the same period. Sectors that have registered increased in there share are trade group and finance
group service. Share of trade group increased from 35.55% in 1991 to 42.11% in 2012 whereas for finance group services its share
increased from 23.21% to 26.82% for the same period.

Volume 5, Number 1, January – March’ 2016
ISSN (Print): 2279-0977, (Online): 2279-0985
PEZZOTTAITE JOURNALS SJIF (2012): 3.23, SJIF (2013): 5.057, SJIF (2014): 5.871, SJIF (2015): 6.492
International Journal of Applied Services Marketing Perspectives© Pezzottaite Journals. 2003 |P a g e
Panel three of the table 1.2 shows the yearly growth rate in GDP; service GDP along with service sub-sector GDP for the period
1991-2012. Service sector GDP yearly growth rate has always been above the growth rate of the total GDP, this shows that the
service sector had the property of pulling up the growth rate of the nation. There are the years (2000, 2006-2008 and 2012) in
which the growth rate has been above 10%. With respect to the sub-sectors growth rate construction has the growth rate as high as
16.34% for 2004-05, although its share in services has come down.
Compound annual growth rate (CAGR) for the whole period (1991-2012) comes to 6.6 for total GDP, 8.16% for service GDP and
in sub-sector CAGR for construction, trade group, finance group and community group stands at 7.13, 9.04, 8.91 and 6.48
respectively. Except for community service group, all other sub-sectors have CAGR higher than that of total CAGR.
Services and Trade
In the last few decades, India service export to the world has underwent a major change. As per World Trade Organization- World
Trade Report-2012, India is placed at 6th position with share in world service export in commercial service of 3.4% and total value
148 (U.S $ billions) whereas for the year 2000 India was placed at 22 position with a share of 1.4% and export value at 17.4 (U.S
$ billion). World service exports for the period 2000-12 increased by 9.6% annually whereas that India increased by 19.52%
annually.
Table 1.3(a) shows the share of merchandise and invisible trade in total exports, share of service in invisible and total exports,
share of different service sub category in service exports and miscellaneous sub category in total service exports. This table is
divided into four panels respectively.
Panel 1 show the share of merchandise and invisible exports in total exports. It can be seen from the table that the merchandise
exports that once dominated the export basket with the share of 71.23% in 1991 had lost its importance in total exports and for the
year 2012, their share stood at 58.56% of the total exports. Invisible items share has increased from 28.77% in 1991 to 41.44% in
2012 with reaching the maximum of 47% for four years (2007-10).
Panel 2 shows the share of service exports in invisible exports and total exports. In both the share of service, export has seen an
increasing pattern. Its share in invisible items increased from 60.97% in 1991 to 64.92% in 2012 as against this share in total
export increased from 17.54% to 26.9% for the same period.
Panel 3 shows the share of service sub sectors that contributed towards to the service exports. Till 2000 data on service export was
reported for travel, transport, insurance, GNIE, miscellaneous and 2000 onwards miscellaneous category further expanded with
individual reporting for software and finally from 2004 onwards other services such as business, financial and communication
were also reported separately.
It can be seen that travel and transport contributed more than 50% of service export in 1991 with the share of miscellaneous items
was just 43%, with the passage of time there was reduction in the exports of these two category dn now the miscellaneous services
dominated the service export basket and contribute almost 72% of the total service export in 2012 with travel and transport
together contributing 25% in 2012. In miscellaneous itself maximum growth has been registered by software and business services
with financial services share has almost triple in eight years’ time i.e. from 2005-2012.
Coming to table 1.3(b) which shows the year on year growth in export from India along with services exports. Based on the
compound annual growth rate it can be seen that total exports from India grows at the rate of 15.4% with merchandise exports
growth rate of 14.35 and that of invisible items stands at 17.4%. With respect to service, it registered a growth of 17.8% for the
same period with the maximum growth coming from miscellaneous followed by insurance. Within miscellaneous category,
maximum growth rate has been achieved by financial services followed by business and software services. Only communication
services have registered a minimum growth rate of 2.095 for the period 2006-2012.
CONCLUSION
Thus from the above it can be concluded that services sector is emerging as an important sector for a country like India. It is
evident from its contribution that it made to GDP, foreign trade, FDI and employment. Although share of services have increased
on the entire front but they are of concern is its employment potential that has remained constant/ change negligible.
On the trade, front lot has been liberalized but still it is not at par with other developing nations and far below the developed
nations. The liberalization has mainly taken in form of relaxation of the investment policy. Since GATS- WTO guides the trade in
service on international platform, negotiations are going on but until now, no concrete outcome has been reached.
Volume 5, Number 1, January – March’ 2016
ISSN (Print): 2279-0977, (Online): 2279-0985
PEZZOTTAITE JOURNALS SJIF (2012): 3.23, SJIF (2013): 5.057, SJIF (2014): 5.871, SJIF (2015): 6.492
International Journal of Applied Services Marketing Perspectives© Pezzottaite Journals. 2004 |P a g e
The main rift between developed and developing nations is with respect to the opening up of the economy in mode 4. A concerted
effort is needed to help countries strengthen and improve service sector regulation and implementing institutions, as well as to
cooperate with each other where there are significant regulatory externalities.
Much of what remains to be done to remove developing nation barriers to trade in services will be conditional on such regulatory
improvements. An important element of any Doha package on services should therefore be agreement to create mechanisms to
promote pro-competitive domestic regulatory reform and thus support liberalization in the future.
Although comprehensive liberalization of service markets in all 153 members in the Doha round is neither possible nor now
desirable, the largest services economies (a “G25”) can and should go further.
However, the larger players may also need to pursue domestic regulatory reforms before opening up some services sectors to
foreign competition, and will need to strengthen regulatory cooperation to facilitate trade in some services. A pre-commitment
approach will allow such conditions to be put in place and ensure that there is an agreed timetable to open markets to greater
competition. Explicitly recognizing that services liberalization cannot – and should not be – divorced from services regulation will
do much to help harness the potential that trade agreements have to expand services trade and investment.
Until now, no consensus have been reached on DDA and if the outcome of the agenda had to be positive then it is the
responsibility of both developed and developing countries to bring out a package that serves the purpose both. These countries
should move to greatly increase their binding coverage and pre-commit to liberalization by a certain date in the future, and the
signatories should then extend the benefits to non-participants.
REFERENCES
1. Bhagwati, J. N. (1987). Trade in Services and the Multilateral Trade Negotiations. World Bank Economic Review, 1(4),
549–569.
2. Hoekman, B. (2008). The General Agreement on Trade in Services: Doomed to Fail? Does it Matter? Journal of
Industry, Competition and Trade, 8, 295-318.
3. Hoekman, B. (2011a). Designing North South Trade Agreements to Promote Economic Development. In J. P.
Chauffour and J.C. Maur (eds.), Preferential Trade Agreements and Development: A Handbook. Washington DC:
World Bank.
4. Hoekman, B., A. Mattoo, & A., Sapir. (2007). The Political Economy of Services Trade Liberalization: A Case for
International Regulatory Cooperation? Oxford Review of Economic Policy, 23(3)
5. Prabir De. (2005). Assessing Barriers to Trade in Services (Discussion Paper 173). RIS.
6. (2013). Handbook of Statistics on the Indian Economy. Mumbai: Reserve Bank of India.
7. Schott, Jeffrey J., Minsoo Lee, & Julia, Muir. (2012). Prospects for Services Trade Negotiations (Working Paper No.
12-17). Washington, D.C.: Peterson Institute for International Economics.
8. (2013). Manual on Statistics of International Trade in Services. EC, IMF, OECD, UNCTD and WTO, Department of
Economics and Social Affair, Statistic Division Services, New York: United Nations.
9. Van der Marel, E., & S., Miroudot. (2012). The Economics and Political Economy of Going beyond the GATS.
London School of Economics, mimeo.
10. (2010). World Development Indicators. World Bank.
11. (2011). Services Gateway. World Trade Organization.
12. (2013). World Trade Organisation: International Trade Statistics.
13. Retrieved from https://www.researchgate.net/publication/5127191_Critical_Issues_in_India
14. Retrieved from https://www.researchgate.net/publication/5127191_Critical_Issues...
Volume 5, Number 1, January – March’ 2016
ISSN (Print): 2279-0977, (Online): 2279-0985
PEZZOTTAITE JOURNALS SJIF (2012): 3.23, SJIF (2013): 5.057, SJIF (2014): 5.871, SJIF (2015): 6.492
International Journal of Applied Services Marketing Perspectives© Pezzottaite Journals. 2005 |P a g e
15. Retrieved from
http://www.researchgate.net/publication/5120415_International_Trade_in_Services_Implications_for_the...
16. Retrieved from http://shodhganga.inflibnet.ac.in/jspui/bitstream/10603/49267/2/project%20final%2007-05-14.docx
17. Retrieved from
http://www.researchgate.net/publication/228134981_Services_Trade_Liberalization_and_Regulatory_Refor...
18. Retrieved from http://www.imf.org/external/pubs/ft/pdp/2003/pdp06.pdf
19. Retrieved from http://www.voxeu.org/article/services-trade-liberalisation-and-regulatory-reform-re-invigorating-int...
20. Retrieved from http://www.voxeu.org/article/services-trade-and-doha
APPENDIX
Table-1.1: Sector wise Share in GDP, Exports, Employment & FDI
Sources: Computed from Planning Commission, Economic Survey and Handbook of Indian Statistics Data
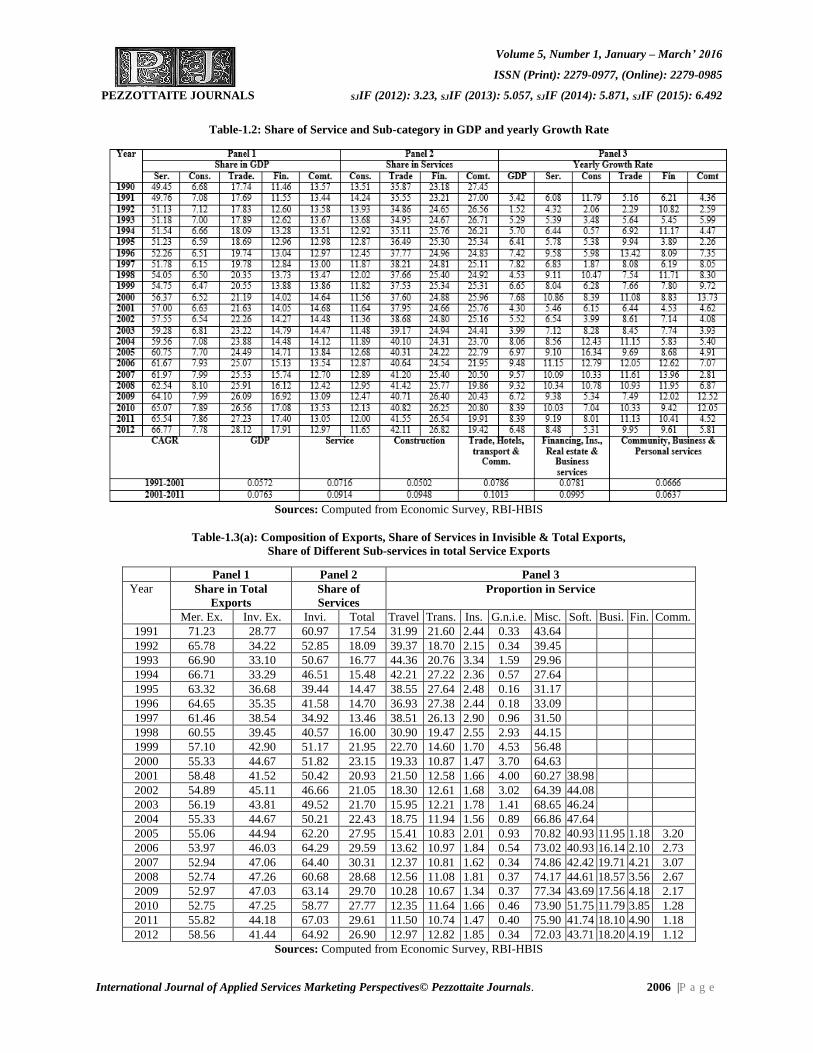
Volume 5, Number 1, January – March’ 2016
ISSN (Print): 2279-0977, (Online): 2279-0985
PEZZOTTAITE JOURNALS SJIF (2012): 3.23, SJIF (2013): 5.057, SJIF (2014): 5.871, SJIF (2015): 6.492
International Journal of Applied Services Marketing Perspectives© Pezzottaite Journals. 2006 |P a g e
Table-1.2: Share of Service and Sub-category in GDP and yearly Growth Rate
Sources: Computed from Economic Survey, RBI-HBIS
Table-1.3(a): Composition of Exports, Share of Services in Invisible & Total Exports,
Share of Different Sub-services in total Service Exports
Panel 1 Panel 2 Panel 3
Year Share in Total
Exports
Share of
Services
Proportion in Service
Mer. Ex. Inv. Ex. Invi. Total Travel Trans. Ins. G.n.i.e. Misc. Soft. Busi. Fin. Comm.
1991 71.23 28.77 60.97 17.54 31.99 21.60 2.44 0.33 43.64
1992 65.78 34.22 52.85 18.09 39.37 18.70 2.15 0.34 39.45
1993 66.90 33.10 50.67 16.77 44.36 20.76 3.34 1.59 29.96
1994 66.71 33.29 46.51 15.48 42.21 27.22 2.36 0.57 27.64
1995 63.32 36.68 39.44 14.47 38.55 27.64 2.48 0.16 31.17
1996 64.65 35.35 41.58 14.70 36.93 27.38 2.44 0.18 33.09
1997 61.46 38.54 34.92 13.46 38.51 26.13 2.90 0.96 31.50
1998 60.55 39.45 40.57 16.00 30.90 19.47 2.55 2.93 44.15
1999 57.10 42.90 51.17 21.95 22.70 14.60 1.70 4.53 56.48
2000 55.33 44.67 51.82 23.15 19.33 10.87 1.47 3.70 64.63
2001 58.48 41.52 50.42 20.93 21.50 12.58 1.66 4.00 60.27 38.98
2002 54.89 45.11 46.66 21.05 18.30 12.61 1.68 3.02 64.39 44.08
2003 56.19 43.81 49.52 21.70 15.95 12.21 1.78 1.41 68.65 46.24
2004 55.33 44.67 50.21 22.43 18.75 11.94 1.56 0.89 66.86 47.64
2005 55.06 44.94 62.20 27.95 15.41 10.83 2.01 0.93 70.82 40.93 11.95 1.18 3.20
2006 53.97 46.03 64.29 29.59 13.62 10.97 1.84 0.54 73.02 40.93 16.14 2.10 2.73
2007 52.94 47.06 64.40 30.31 12.37 10.81 1.62 0.34 74.86 42.42 19.71 4.21 3.07
2008 52.74 47.26 60.68 28.68 12.56 11.08 1.81 0.37 74.17 44.61 18.57 3.56 2.67
2009 52.97 47.03 63.14 29.70 10.28 10.67 1.34 0.37 77.34 43.69 17.56 4.18 2.17
2010 52.75 47.25 58.77 27.77 12.35 11.64 1.66 0.46 73.90 51.75 11.79 3.85 1.28
2011 55.82 44.18 67.03 29.61 11.50 10.74 1.47 0.40 75.90 41.74 18.10 4.90 1.18
2012 58.56 41.44 64.92 26.90 12.97 12.82 1.85 0.34 72.03 43.71 18.20 4.19 1.12
Sources: Computed from Economic Survey, RBI-HBIS
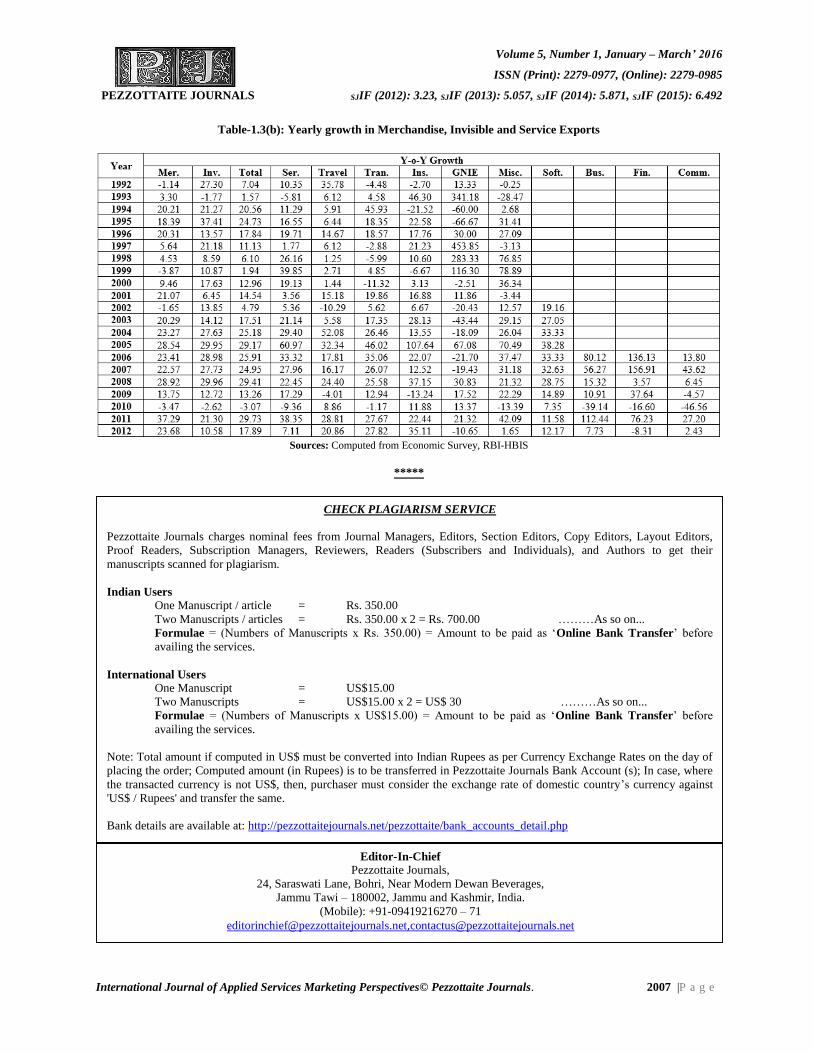
Volume 5, Number 1, January – March’ 2016
ISSN (Print): 2279-0977, (Online): 2279-0985
PEZZOTTAITE JOURNALS SJIF (2012): 3.23, SJIF (2013): 5.057, SJIF (2014): 5.871, SJIF (2015): 6.492
International Journal of Applied Services Marketing Perspectives© Pezzottaite Journals. 2007 |P a g e
Table-1.3(b): Yearly growth in Merchandise, Invisible and Service Exports
Sources: Computed from Economic Survey, RBI-HBIS
*****
CHECK PLAGIARISM SERVICE
Pezzottaite Journals charges nominal fees from Journal Managers, Editors, Section Editors, Copy Editors, Layout Editors,
Proof Readers, Subscription Managers, Reviewers, Readers (Subscribers and Individuals), and Authors to get their
manuscripts scanned for plagiarism.
Indian Users
One Manuscript / article = Rs. 350.00
Two Manuscripts / articles = Rs. 350.00 x 2 = Rs. 700.00 ………As so on...
Formulae = (Numbers of Manuscripts x Rs. 350.00) = Amount to be paid as ‘Online Bank Transfer’ before
availing the services.
International Users
One Manuscript = US$15.00
Two Manuscripts = US$15.00 x 2 = US$ 30 ………As so on...
Formulae = (Numbers of Manuscripts x US$15.00) = Amount to be paid as ‘Online Bank Transfer’ before
availing the services.
Note: Total amount if computed in US$ must be converted into Indian Rupees as per Currency Exchange Rates on the day of
placing the order; Computed amount (in Rupees) is to be transferred in Pezzottaite Journals Bank Account (s); In case, where
the transacted currency is not US$, then, purchaser must consider the exchange rate of domestic country’s currency against
'US$ / Rupees' and transfer the same.
Bank details are available at: http://pezzottaitejournals.net/pezzottaite/bank_accounts_detail.php
Editor-In-Chief
Pezzottaite Journals,
24, Saraswati Lane, Bohri, Near Modern Dewan Beverages,
Jammu Tawi – 180002, Jammu and Kashmir, India.
(Mobile): +91-09419216270 – 71
Volume 5, Number 1, January – March’ 2016
ISSN (Print): 2279-0977, (Online): 2279-0985
PEZZOTTAITE JOURNALS SJIF (2012): 3.23, SJIF (2013): 5.057, SJIF (2014): 5.871, SJIF (2015): 6.492
International Journal of Applied Services Marketing Perspectives© Pezzottaite Journals. 2008 |P a g e
PERCEPTION OF IT EMPLOYEES TOWARDS ONLINE SHOPPING
Dr. A. Sandhya Rani14
ABSTRACT
The capability of purchasing without leaving your place is of great interest to many consumers. Not only does online shopping
offer really good deals, but also brings optimum convenience to the consumers. Moreover, the use of Internet tools for price
searching and comparison provides an additional advantage in consumers’ final decision, as they can purchase their desired
products in the lowest available price. This study focuses on understanding the perception of IT employees towards online
shopping and examining the factors that influence IT employees towards online purchasing. For the study, a sample size of 60
Middle level employees (system engineers), has been taken into consideration. Through Chi-Square, analysis it is found that
there is no Significance of Age& Income on online shopping. Irrespective of Age and Income IT, employees are buying clothes
and electronics through online shopping.
KEYWORDS
Online Shopping, Age & Income, IT Employees, Perception, Security etc.
INTRODUCTION
India has more than 100 million internet users out of which one-half opts for online purchases and the number is rising sharply
every year. The growth in the number of online shoppers is greater than the growth in Internet users, indicating that more Internet
users are becoming comfortable to shop online. The capability of purchasing without leaving your place is of great interest to
many consumers. Not only does online shopping offer really good deals, but also brings optimum convenience to the consumers.
Moreover, the use of Internet tools for price searching and comparison provides an additional advantage in consumers’ final
decision, as they can purchase their desired products in the lowest available price.
With nearly half of the Indian population being young and net practical understanding, there has been an extra ordinary rise in the
numbers of online shoppers. The recent growth in the mall culture in the country has in fact made consumers more aware about
different options and encouraged them to search and eventually purchase online. India has more than 100 million internet users
out of which one-half opt for online purchases and the number is rising sharply every year. The growth in the number of online
shoppers is greater than the growth in Internet users, indicating that more Internet users are becoming comfortable to shop online.
Until recently, the consumers generally visit online to reserve hotel rooms and buy air, rail or movie tickets, books and gadgets
and gizmos, but now more and more offline product like clothes - saris, kurtis, T-shirts - shoes, and designer lingerie, consumer
durables are being purchased online. At present, the market is estimated at Rs.46000 crore and is growing at 100 percent per year.
The two most commonly cited reasons for online shopping have been convenience and price. The capability of purchasing without
leaving your place is of great interest to many consumers. Not only does online shopping offer really good deals, but also brings
optimum convenience to the consumers. Moreover, the use of Internet tools for price searching and comparison provides an
additional advantage in consumers’ final decision, as they can purchase their desired products in the lowest available price. On the
contrary, privacy and security have been the great concerns, resulting many people to browse the Internet for informational
matters than for buying online.
OBJECTIVES OF STUDY
To study the Perception of IT Employees towards online purchasing.
To examine the factors that influence IT employees towards online purchasing.
Null Hypothesis (H0): There is no significant impact of Age and Income on Online Shopping.
NEED FOR STUDY
IT employees are spending more time on internet so the online advertisers are trying to attract the customers in different websites.
Here the possibility of making the shopping is high through advertisement. It allows consumers of the world to research and
purchase services and products at their own pace and convenience. This study is to know the perception of IT employees towards
online shopping with respect to their Age & Income.
14 Associate Professor, School of Management Studies, Sreenedhi Institute of Science and Technology, (An Automonus
Institution), Telangana, India, [email protected]
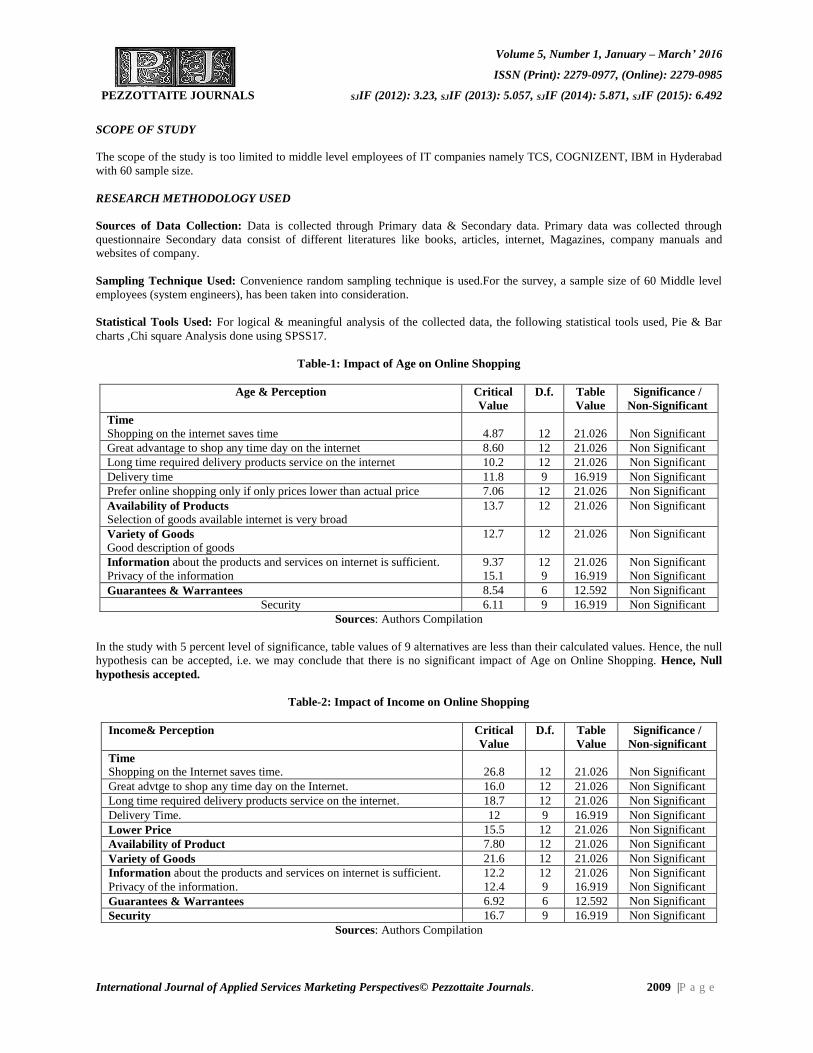
Volume 5, Number 1, January – March’ 2016
ISSN (Print): 2279-0977, (Online): 2279-0985
PEZZOTTAITE JOURNALS SJIF (2012): 3.23, SJIF (2013): 5.057, SJIF (2014): 5.871, SJIF (2015): 6.492
International Journal of Applied Services Marketing Perspectives© Pezzottaite Journals. 2009 |P a g e
SCOPE OF STUDY
The scope of the study is too limited to middle level employees of IT companies namely TCS, COGNIZENT, IBM in Hyderabad
with 60 sample size.
RESEARCH METHODOLOGY USED
Sources of Data Collection: Data is collected through Primary data & Secondary data. Primary data was collected through
questionnaire Secondary data consist of different literatures like books, articles, internet, Magazines, company manuals and
websites of company.
Sampling Technique Used: Convenience random sampling technique is used.For the survey, a sample size of 60 Middle level
employees (system engineers), has been taken into consideration.
Statistical Tools Used: For logical & meaningful analysis of the collected data, the following statistical tools used, Pie & Bar
charts ,Chi square Analysis done using SPSS17.
Table-1: Impact of Age on Online Shopping
Age & Perception
Critical
Value
D.f. Table
Value
Significance /
Non-Significant
Time
Shopping on the internet saves time
4.87
12
21.026
Non Significant
Great advantage to shop any time day on the internet 8.60 12 21.026 Non Significant
Long time required delivery products service on the internet 10.2 12 21.026 Non Significant
Delivery time 11.8 9 16.919 Non Significant
Prefer online shopping only if only prices lower than actual price 7.06 12 21.026 Non Significant
Availability of Products
Selection of goods available internet is very broad
13.7 12 21.026 Non Significant
Variety of Goods
Good description of goods
12.7 12 21.026 Non Significant
Information about the products and services on internet is sufficient.
Privacy of the information
9.37
15.1
12
9
21.026
16.919
Non Significant
Non Significant
Guarantees & Warrantees 8.54 6 12.592 Non Significant
Security 6.11 9 16.919 Non Significant
Sources: Authors Compilation
In the study with 5 percent level of significance, table values of 9 alternatives are less than their calculated values. Hence, the null
hypothesis can be accepted, i.e. we may conclude that there is no significant impact of Age on Online Shopping. Hence, Null
hypothesis accepted.
Table-2: Impact of Income on Online Shopping
Income& Perception
Critical
Value
D.f. Table
Value
Significance /
Non-significant
Time
Shopping on the Internet saves time.
26.8
12
21.026
Non Significant
Great advtge to shop any time day on the Internet. 16.0 12 21.026 Non Significant
Long time required delivery products service on the internet. 18.7 12 21.026 Non Significant
Delivery Time. 12 9 16.919 Non Significant
Lower Price 15.5 12 21.026 Non Significant
Availability of Product 7.80 12 21.026 Non Significant
Variety of Goods 21.6 12 21.026 Non Significant
Information about the products and services on internet is sufficient.
Privacy of the information.
12.2
12.4
12
9
21.026
16.919
Non Significant
Non Significant
Guarantees & Warrantees 6.92 6 12.592 Non Significant
Security 16.7 9 16.919 Non Significant
Sources: Authors Compilation
Volume 5, Number 1, January – March’ 2016
ISSN (Print): 2279-0977, (Online): 2279-0985
PEZZOTTAITE JOURNALS SJIF (2012): 3.23, SJIF (2013): 5.057, SJIF (2014): 5.871, SJIF (2015): 6.492
International Journal of Applied Services Marketing Perspectives© Pezzottaite Journals. 2010 |P a g e
In the study with 5 percent level of significance, table values of 9 alternatives are less than their calculated values. Hence, the null
hypothesis can be accepted, i.e. we may conclude that There is no significant impact of Income on Online Shopping. Hence, Null
hypothesis is accepted.
The Impact of Age on online shopping is studied through Chi-square analysis. The results shows at 5 percent level of significance,
table values of 9 alternatives are less than their calculated values. Hence accepting the null hypothesis i.e. there is no significant
impact of Age on Online Shopping is proved.
The Impact of Income on online shopping is studied through Chi-square analysis. The results shows at 5 percent level of
significance, table values of 9 alternatives are less than their calculated values. Hence accepting the null hypothesis i.e. there is no
significant impact of Income on Online Shopping is proved.
58% respondents are in between 21-29 years age, and 25% respondent 30-39 years of age group and the very low 6% respondents
are 50 years age group.
58% respondents are from Middle level, 25% respondents and junior level 15% respondents are upper level.
58% respondents have tried online purchasing and only 42% respondents have not tried online shopping among 100%
respondents.
38% respondents are agree that there is no need to shop online and 25% respondents started that there may be some security
problem and Products are not as same as photos. 5% respondents are saying in Expensive
53% respondents check the products before buying, 35% respondents are saying that it is easier to return the product & 12%
respondents are saying that they can purchase by check or cash.
Out of 100% respondents, 40% respondents agree that online shopping is very cheap, 22% respondents feel convenient to find
whatever they want, 30% respondents are thinking that they can buy different products in a short time
Out of 100% respondents 35% respondents buy more than 5 times in a month 30% respondents buy 3 to 4 times in a month&
28% respondents buy only 1 to 2 times for in a month
Out of 100% respondents, 37% respondents buy clothes, 30% respondents buy electronic products, 20% respondents are buy foot
wares & 8% respondents for books.
Out of 100% respondents 43% Respondents are purchasing on based on safety of payment and 17% Respondents are purchasing
on warrant and climes, 13% Respondents are locking for brand before buying any product in online
Out of 100% respondents 26% respondents prefer jabong, 24%respondents prefer e-bay, 23% respondents prefer Flipkart, 27%
respondents prefer other websites.
CONCLUSION
As many employees are from IT sectors and having access to online shopping .There is a need to educate business owners about
the growing importance of Internet marketing. My study has focused on IT Employees interest and Perception on online shopping.
Irrespective of Age and Income IT employees are buying clothes and electronics through online shopping.
REFERENCES
1. Thomas. (1998). Who forecasted that internet will change the way businesses work, Never Told You about Online
Shopping. Yahoo! Internet Life, (Winter 2000): 61-63.
2. Walter Effross. (2013). Ten Tips toward J.D. Jobs for Law Students and Graduates, Natl. L. J. Retrieved from
http://www.wcl.american.edu/faculty/effross/EffrossTenTips.pdf
3. Walter Effross. (2013). Corporate Governance: Principles and Practices, 2nd Ed., Aspen.
4. Hoffman, D. L., Novak, T. P., & Schlosser, A. E. Consumer Control in Online Environments (Working Paper).
Vanderbilt University. Retrieved in February, from www.2000.ogsm.vanderbilt.edu/papers.html
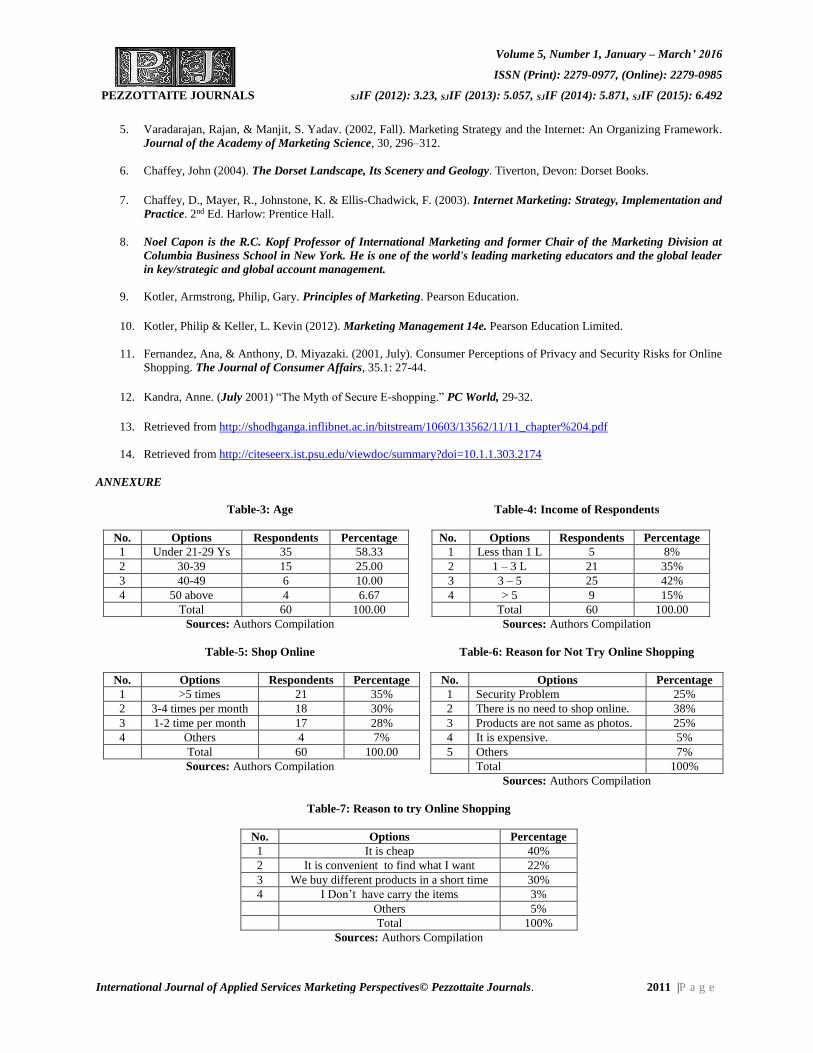
Volume 5, Number 1, January – March’ 2016
ISSN (Print): 2279-0977, (Online): 2279-0985
PEZZOTTAITE JOURNALS SJIF (2012): 3.23, SJIF (2013): 5.057, SJIF (2014): 5.871, SJIF (2015): 6.492
International Journal of Applied Services Marketing Perspectives© Pezzottaite Journals. 2011 |P a g e
5. Varadarajan, Rajan, & Manjit, S. Yadav. (2002, Fall). Marketing Strategy and the Internet: An Organizing Framework.
Journal of the Academy of Marketing Science, 30, 296–312.
6. Chaffey, John (2004). The Dorset Landscape, Its Scenery and Geology. Tiverton, Devon: Dorset Books.
7. Chaffey, D., Mayer, R., Johnstone, K. & Ellis-Chadwick, F. (2003). Internet Marketing: Strategy, Implementation and
Practice. 2nd Ed. Harlow: Prentice Hall.
8. Noel Capon is the R.C. Kopf Professor of International Marketing and former Chair of the Marketing Division at
Columbia Business School in New York. He is one of the world's leading marketing educators and the global leader
in key/strategic and global account management.
9. Kotler, Armstrong, Philip, Gary. Principles of Marketing. Pearson Education.
10. Kotler, Philip & Keller, L. Kevin (2012). Marketing Management 14e. Pearson Education Limited.
11. Fernandez, Ana, & Anthony, D. Miyazaki. (2001, July). Consumer Perceptions of Privacy and Security Risks for Online
Shopping. The Journal of Consumer Affairs, 35.1: 27-44.
12. Kandra, Anne. (July 2001) “The Myth of Secure E-shopping.” PC World, 29-32.
13. Retrieved from http://shodhganga.inflibnet.ac.in/bitstream/10603/13562/11/11_chapter%204.pdf
14. Retrieved from http://citeseerx.ist.psu.edu/viewdoc/summary?doi=10.1.1.303.2174
ANNEXURE
Table-3: Age
No. Options Respondents Percentage
1 Under 21-29 Ys 35 58.33
2 30-39 15 25.00
3 40-49 6 10.00
4 50 above 4 6.67
Total 60 100.00
Sources: Authors Compilation
Table-4: Income of Respondents
No. Options Respondents Percentage
1 Less than 1 L 5 8%
2 1 – 3 L 21 35%
3 3 – 5 25 42%
4 > 5 9 15%
Total 60 100.00
Sources: Authors Compilation
Table-5: Shop Online
No. Options Respondents Percentage
1 >5 times 21 35%
2 3-4 times per month 18 30%
3 1-2 time per month 17 28%
4 Others 4 7%
Total 60 100.00
Sources: Authors Compilation
Table-6: Reason for Not Try Online Shopping
No. Options Percentage
1 Security Problem 25%
2 There is no need to shop online. 38%
3 Products are not same as photos. 25%
4 It is expensive. 5%
5 Others 7%
Total 100%
Sources: Authors Compilation
Table-7: Reason to try Online Shopping
No. Options Percentage
1 It is cheap 40%
2 It is convenient to find what I want 22%
3 We buy different products in a short time 30%
4 I Don’t have carry the items 3%
Others 5%
Total 100%
Sources: Authors Compilation
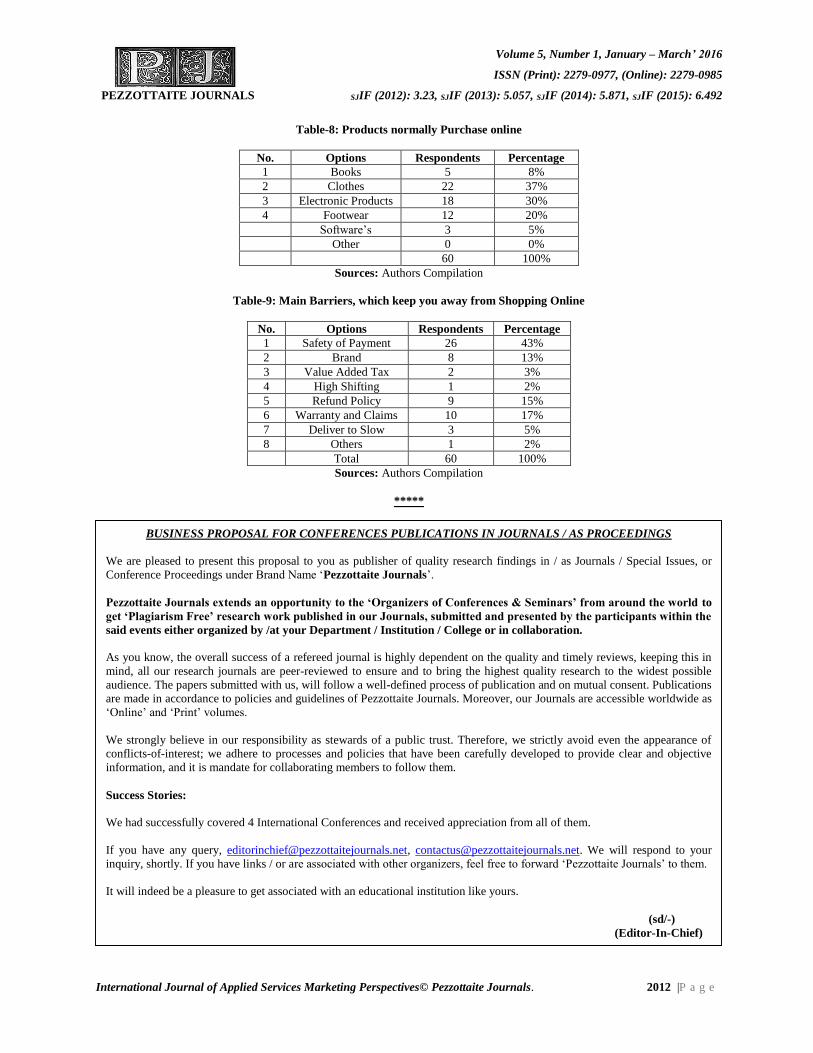
Volume 5, Number 1, January – March’ 2016
ISSN (Print): 2279-0977, (Online): 2279-0985
PEZZOTTAITE JOURNALS SJIF (2012): 3.23, SJIF (2013): 5.057, SJIF (2014): 5.871, SJIF (2015): 6.492
International Journal of Applied Services Marketing Perspectives© Pezzottaite Journals. 2012 |P a g e
Table-8: Products normally Purchase online
No. Options Respondents Percentage
1 Books 5 8%
2 Clothes 22 37%
3 Electronic Products 18 30%
4 Footwear 12 20%
Software’s 3 5%
Other 0 0%
60 100%
Sources: Authors Compilation
Table-9: Main Barriers, which keep you away from Shopping Online
No. Options Respondents Percentage
1 Safety of Payment 26 43%
2 Brand 8 13%
3 Value Added Tax 2 3%
4 High Shifting 1 2%
5 Refund Policy 9 15%
6 Warranty and Claims 10 17%
7 Deliver to Slow 3 5%
8 Others 1 2%
Total 60 100%
Sources: Authors Compilation
*****
BUSINESS PROPOSAL FOR CONFERENCES PUBLICATIONS IN JOURNALS / AS PROCEEDINGS
We are pleased to present this proposal to you as publisher of quality research findings in / as Journals / Special Issues, or
Conference Proceedings under Brand Name ‘Pezzottaite Journals’.
Pezzottaite Journals extends an opportunity to the ‘Organizers of Conferences & Seminars’ from around the world to
get ‘Plagiarism Free’ research work published in our Journals, submitted and presented by the participants within the
said events either organized by /at your Department / Institution / College or in collaboration.
As you know, the overall success of a refereed journal is highly dependent on the quality and timely reviews, keeping this in
mind, all our research journals are peer-reviewed to ensure and to bring the highest quality research to the widest possible
audience. The papers submitted with us, will follow a well-defined process of publication and on mutual consent. Publications
are made in accordance to policies and guidelines of Pezzottaite Journals. Moreover, our Journals are accessible worldwide as
‘Online’ and ‘Print’ volumes.
We strongly believe in our responsibility as stewards of a public trust. Therefore, we strictly avoid even the appearance of
conflicts-of-interest; we adhere to processes and policies that have been carefully developed to provide clear and objective
information, and it is mandate for collaborating members to follow them.
Success Stories:
We had successfully covered 4 International Conferences and received appreciation from all of them.
If you have any query, [email protected], [email protected]. We will respond to your
inquiry, shortly. If you have links / or are associated with other organizers, feel free to forward ‘Pezzottaite Journals’ to them.
It will indeed be a pleasure to get associated with an educational institution like yours.
(sd/-)
(Editor-In-Chief)
Volume 5, Number 1, January – March’ 2016
ISSN (Print): 2279-0977, (Online): 2279-0985
PEZZOTTAITE JOURNALS SJIF (2012): 3.23, SJIF (2013): 5.057, SJIF (2014): 5.871, SJIF (2015): 6.492
International Journal of Applied Services Marketing Perspectives© Pezzottaite Journals. 2013 |P a g e
AN EMPIRICAL STUDY OF CUSTOMER SATISFACTION TOWARDS
SAMSUNG SMART PHONE WITH REFERENCE TO MADURAI CITY
Dr. AR. Annadurai15
ABSTRACT
Customer satisfaction in Mobile phone is a complicated and assorted area of the research study. Since advertising is based on
identifying, anticipating and providing customer needs, it is important to understand them. Customer satisfaction in mobile
phone, it stands for user-friendly approach and full option facilities are availed by the end users, individuals and households
who purchases mobile phone and services for their own use. Consumers’ research takes place at every phase of the
consumption process, during the purchases and after purchased.
It attempts to analyze the customer perception on Samsung smart phones and factors influencing the level of satisfaction
among Samsung mobile users. It also tries to recognize the crucial change in product features and consumers implications
about the Samsung smart phones.
KEYWORDS
Samsung Smart Phone, Consumer Satisfaction, Market Perception etc.
INTRODUCTION
Over the past decade, the mobile phone industry has progressively more recognized the wisdom of customer satisfaction and
experience. However, in the present competitive scenario acquiring consumers’ satisfaction is a tough task. Indian mobile market
adopts various new innovative techniques to handle their customers. The promotional measures are adopted likely more
accessories, low cost, service centre and spare parts availabilities, insurance scheme for mobile, mobile safety locking system,
mobile exchange system and at most care for consumer complaints.
Customer satisfaction is a term frequently used in marketing. It is a measure of how products and services supplied by a company
meet or surpass customer expectation. Customer satisfaction is defined as, the number of customers, or percentage of total
customers, whose reported experience with a firm, its products, or its services (ratings) exceeds specified satisfaction goals. In the
survey of previous studies relating to customer satisfaction, more than 70 percent of the study results shows that they found a
customer satisfaction metric very useful in managing and monitoring their businesses.
SAMSUNG SMART PHONE
Smart phone users rabidly believed to be outside the metropolitan cities, in urban and semi-urban areas and a large chunk of
upwardly mobile population in such areas will give a Samsung product due consideration while looking to upgrade to a smart
phone. Sustained advertising campaigns through television, print and outdoor have also helped the company’s cause especially
since some of its television commercials feature an international look and feel, giving an impression to the buyer that he is buying
a world-class product.
Samsung’s flagship mobile handset line is the Samsung Galaxy S, which many consider a direct competitor of the Apple iPhone.
It was initially launched in Singapore, Malaysia and South Korea in June 2010, followed by the United States in July. It sold more
than one million units within the first 45 days on sale in the United States.
At the end of the third quarter of 2010, the company had surpassed the 70 million-unit mark in shipped phones, giving it a global
market share of 20.2 percent. Partially owing to strong sales of the Samsung Galaxy range of Smart phones, the company
overtook Apple in worldwide Smartphone sales during the third quarter 2011, with a total market share of 23.8 percent,
compared to Apple’s 14.6 percent share. Samsung became the world’s largest cell phone maker in 2012, with the sales of 95
million smart phones in the first quarter.
During the third quarter of 2013, Samsung’s Smartphone sales were boosted by a strong consumer reception in emerging markets
such as India and the Middle East, where lower-priced handsets were popular. As of October 2013, the company offers 40
Smartphone models on its US website.
15Assistant Professor (Commerce), Alagappa University College of Arts and Science, Tamil Nadu, India, [email protected]
Volume 5, Number 1, January – March’ 2016
ISSN (Print): 2279-0977, (Online): 2279-0985
PEZZOTTAITE JOURNALS SJIF (2012): 3.23, SJIF (2013): 5.057, SJIF (2014): 5.871, SJIF (2015): 6.492
International Journal of Applied Services Marketing Perspectives© Pezzottaite Journals. 2014 |P a g e
REVIEW OF LITERATURE
Dr. T. N. R. Kavitha and R. Mohanasundram (2014), in their research paper titled “A study on customer satisfaction towards
Samsung Mobile Phone in Erode City”, is carried out with an objective to determine the customer preference and satisfaction. The
primary objective of this study is to find out the customer preference and satisfaction towards Samsung mobile with reference to
Erode. The Samsung mobile phones are leading in the market race with over a dozen varieties and models living up every day.
Customer is left in confusion as to what to buy. With market gearing up with new companies and new products launch in
Samsung manufacturers have accepted the challenge. The company believes in customer satisfaction and that is the success of
their being the leading cell phone market.
Dr. S. Namasivayam, M. Prakash and M. Krishnakumar (2014), in their research article entitled “A study on customer
satisfaction towards Samsung Smart Phone in Erode City”, Samsung smart phone is a highly moving mobile phones, when
compared to other smart phones. The study conducted from Coimbatore City helps to make identification over its strength and
weakness of Samsung and find out the various aspects of customer satisfaction and the service provider on Samsung smart phones
i.e., handling convenience in Samsung smart phones.
Dr. S. Sukumar (2013), in his article entitled “A study of consumer attitude towards Samsung mobile instruments in Dindigul
district”, the researcher has analyzed the awareness, attitude, behaviour and post-purchase behaviour of the users towards various
facilities offered by Samsung mobile. The manufacturers are competing to attract the consumers, to increase their sales and fulfil
consumers’ needs and wants. However, in the present competitive scenario acquiring consumers’ satisfaction is a tough task.
Nidhi P. Shah (2013), in her entitled “Customer satisfaction of Samsung mobile handset users”, the main aim of this research
paper is to find customers satisfactions with relations to some variables like individual features, price and brand name etc. In this
study focused on the customer of Bhavnagar city and research is carried out by primary data analysis tools like correlation, study
indicates on average satisfaction of customers towards mobile handset users of Samsung.
OBJECTIVES OF STUDY
To study the Samsung smart phone market facility available in the study area.
To evaluate the satisfaction level of customers towards Samsung smart phones in the study area.
To analyses the variance between age and education with regard to satisfaction level of respondents.
HYPOTHESES OF STUDY
There is no significant difference between ages about satisfaction level of Samsung mobile phone users.
There is no significant difference between educations about satisfaction level of Samsung mobile phone users.
METHODOLOGY USED
The present study is an empirical research based on survey method. This study based both primary and secondary data. The
primary data are collected from the sample respondents through questionnaire. The secondary data are collected from the
magazines, journals and websites.
Sampling Design
This study used convenience-sampling method for collecting data. The total numbers of sample respondents 250 were selected
randomly in the study area for analyzing the data.
Period of Study
The survey conducted for this study to collect the primary data from September 2015 to November 2015 (3 months).
Profile of Sample Respondents
Demographic factors of the sample respondents in various classes, which helps to acquire some preliminary ideas with respect to
the objectives under study. The total number of sample respondents for various classes were examined for the analysis part of this
study.
The following table-1 represents the percentage of various classes of demographic factors acquired by the sample respondents.
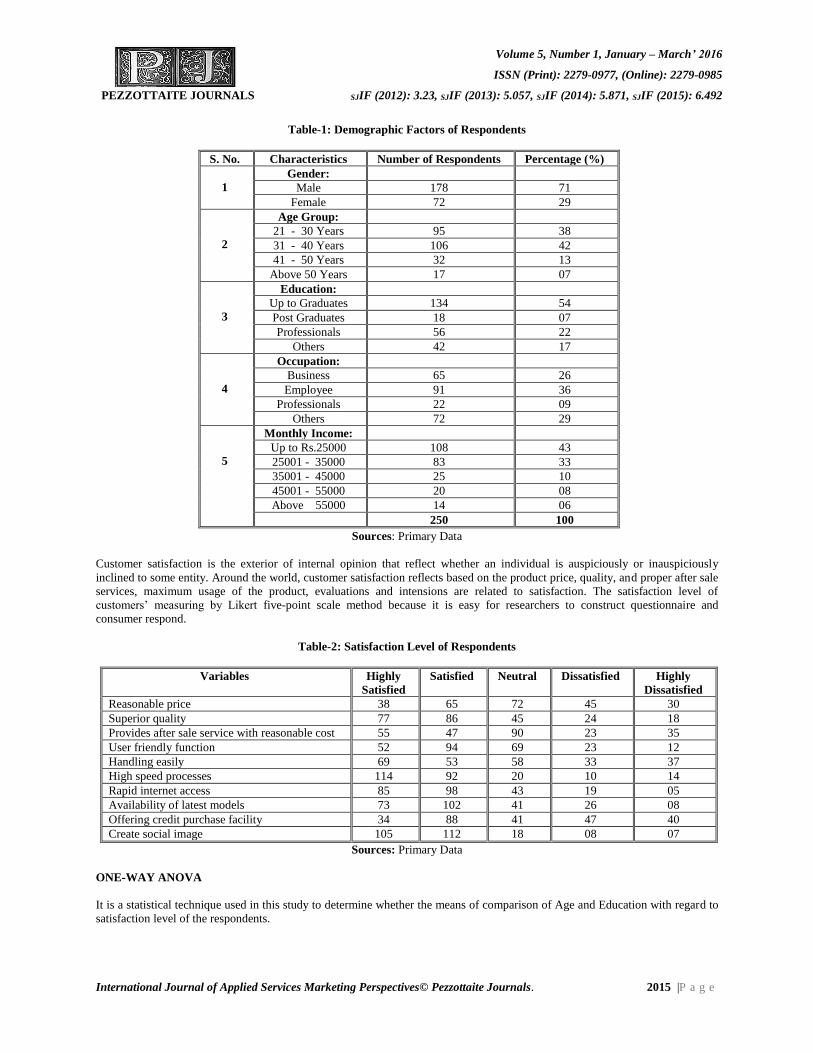
Volume 5, Number 1, January – March’ 2016
ISSN (Print): 2279-0977, (Online): 2279-0985
PEZZOTTAITE JOURNALS SJIF (2012): 3.23, SJIF (2013): 5.057, SJIF (2014): 5.871, SJIF (2015): 6.492
International Journal of Applied Services Marketing Perspectives© Pezzottaite Journals. 2015 |P a g e
Table-1: Demographic Factors of Respondents
Sources: Primary Data
Customer satisfaction is the exterior of internal opinion that reflect whether an individual is auspiciously or inauspiciously
inclined to some entity. Around the world, customer satisfaction reflects based on the product price, quality, and proper after sale
services, maximum usage of the product, evaluations and intensions are related to satisfaction. The satisfaction level of
customers’ measuring by Likert five-point scale method because it is easy for researchers to construct questionnaire and
consumer respond.
Table-2: Satisfaction Level of Respondents
Variables Highly
Satisfied
Satisfied Neutral Dissatisfied Highly
Dissatisfied
Reasonable price 38 65 72 45 30
Superior quality 77 86 45 24 18
Provides after sale service with reasonable cost 55 47 90 23 35
User friendly function 52 94 69 23 12
Handling easily 69 53 58 33 37
High speed processes 114 92 20 10 14
Rapid internet access 85 98 43 19 05
Availability of latest models 73 102 41 26 08
Offering credit purchase facility 34 88 41 47 40
Create social image 105 112 18 08 07
Sources: Primary Data
ONE-WAY ANOVA
It is a statistical technique used in this study to determine whether the means of comparison of Age and Education with regard to
satisfaction level of the respondents.
S. No. Characteristics Number of Respondents Percentage (%)
1
Gender:
Male 178 71
Female 72 29
2
Age Group:
21 - 30 Years 95 38
31 - 40 Years 106 42
41 - 50 Years 32 13
Above 50 Years 17 07
3
Education:
Up to Graduates 134 54
Post Graduates 18 07
Professionals 56 22
Others 42 17
4
Occupation:
Business 65 26
Employee 91 36
Professionals 22 09
Others 72 29
5
Monthly Income:
Up to Rs.25000 108 43
25001 - 35000 83 33
35001 - 45000 25 10
45001 - 55000 20 08
Above 55000 14 06
250 100
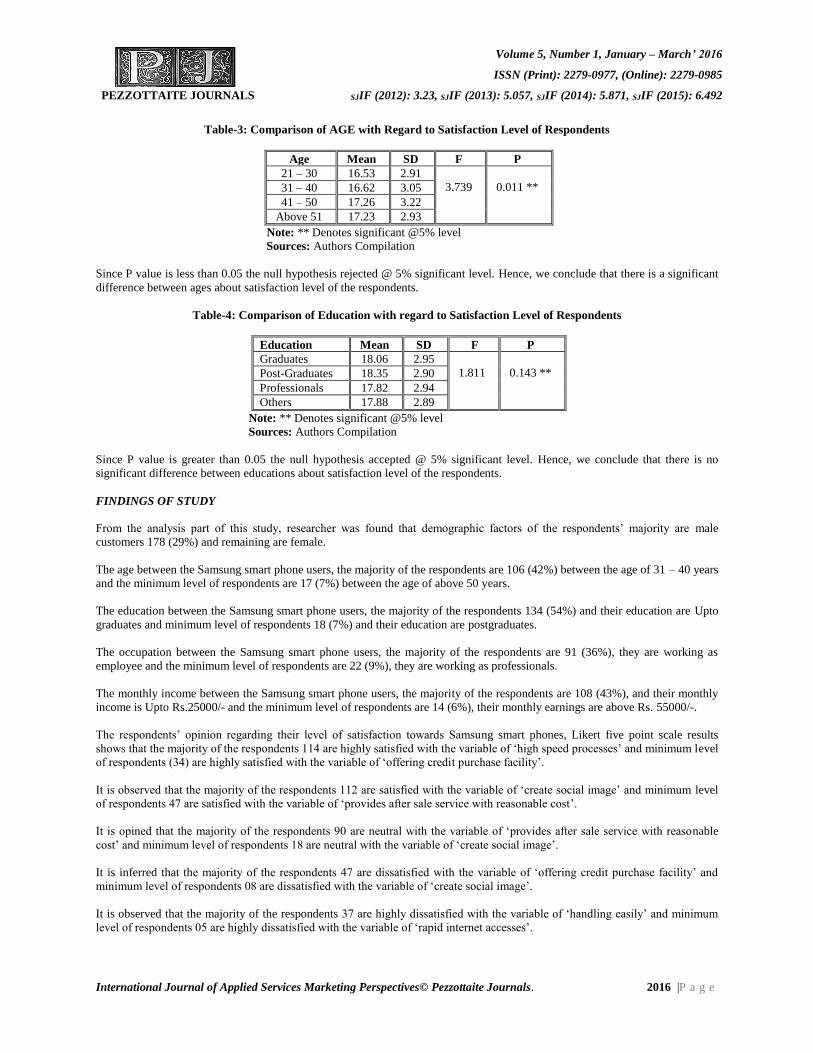
Volume 5, Number 1, January – March’ 2016
ISSN (Print): 2279-0977, (Online): 2279-0985
PEZZOTTAITE JOURNALS SJIF (2012): 3.23, SJIF (2013): 5.057, SJIF (2014): 5.871, SJIF (2015): 6.492
International Journal of Applied Services Marketing Perspectives© Pezzottaite Journals. 2016 |P a g e
Table-3: Comparison of AGE with Regard to Satisfaction Level of Respondents
Note: ** Denotes significant @5% level
Sources: Authors Compilation
Since P value is less than 0.05 the null hypothesis rejected @ 5% significant level. Hence, we conclude that there is a significant
difference between ages about satisfaction level of the respondents.
Table-4: Comparison of Education with regard to Satisfaction Level of Respondents
Note: ** Denotes significant @5% level
Sources: Authors Compilation
Since P value is greater than 0.05 the null hypothesis accepted @ 5% significant level. Hence, we conclude that there is no
significant difference between educations about satisfaction level of the respondents.
FINDINGS OF STUDY
From the analysis part of this study, researcher was found that demographic factors of the respondents’ majority are male
customers 178 (29%) and remaining are female.
The age between the Samsung smart phone users, the majority of the respondents are 106 (42%) between the age of 31 – 40 years
and the minimum level of respondents are 17 (7%) between the age of above 50 years.
The education between the Samsung smart phone users, the majority of the respondents 134 (54%) and their education are Upto
graduates and minimum level of respondents 18 (7%) and their education are postgraduates.
The occupation between the Samsung smart phone users, the majority of the respondents are 91 (36%), they are working as
employee and the minimum level of respondents are 22 (9%), they are working as professionals.
The monthly income between the Samsung smart phone users, the majority of the respondents are 108 (43%), and their monthly
income is Upto Rs.25000/- and the minimum level of respondents are 14 (6%), their monthly earnings are above Rs. 55000/-.
The respondents’ opinion regarding their level of satisfaction towards Samsung smart phones, Likert five point scale results
shows that the majority of the respondents 114 are highly satisfied with the variable of ‘high speed processes’ and minimum level
of respondents (34) are highly satisfied with the variable of ‘offering credit purchase facility’.
It is observed that the majority of the respondents 112 are satisfied with the variable of ‘create social image’ and minimum level
of respondents 47 are satisfied with the variable of ‘provides after sale service with reasonable cost’.
It is opined that the majority of the respondents 90 are neutral with the variable of ‘provides after sale service with reasonable
cost’ and minimum level of respondents 18 are neutral with the variable of ‘create social image’.
It is inferred that the majority of the respondents 47 are dissatisfied with the variable of ‘offering credit purchase facility’ and
minimum level of respondents 08 are dissatisfied with the variable of ‘create social image’.
It is observed that the majority of the respondents 37 are highly dissatisfied with the variable of ‘handling easily’ and minimum
level of respondents 05 are highly dissatisfied with the variable of ‘rapid internet accesses’.
Age Mean SD F P
21 – 30 16.53 2.91
3.739
0.011 ** 31 – 40 16.62 3.05
41 – 50 17.26 3.22
Above 51 17.23 2.93
Education Mean SD F P
Graduates 18.06 2.95
1.811
0.143 ** Post-Graduates 18.35 2.90
Professionals 17.82 2.94
Others 17.88 2.89
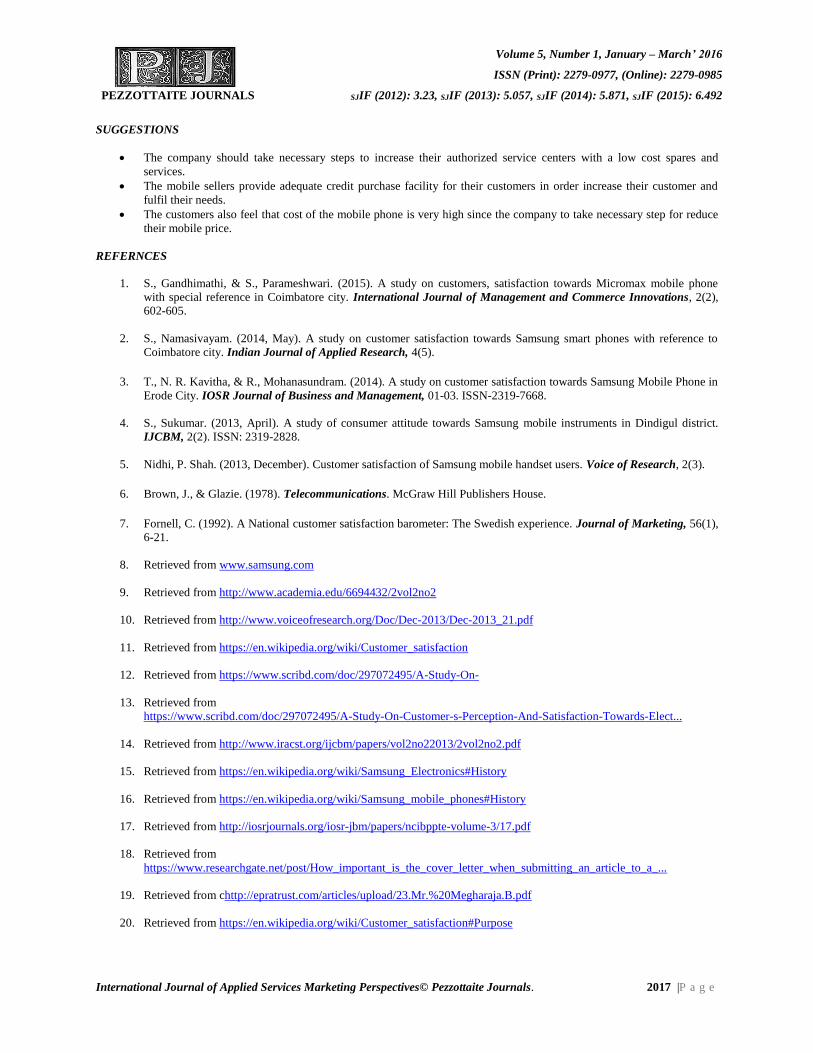
Volume 5, Number 1, January – March’ 2016
ISSN (Print): 2279-0977, (Online): 2279-0985
PEZZOTTAITE JOURNALS SJIF (2012): 3.23, SJIF (2013): 5.057, SJIF (2014): 5.871, SJIF (2015): 6.492
International Journal of Applied Services Marketing Perspectives© Pezzottaite Journals. 2017 |P a g e
SUGGESTIONS
The company should take necessary steps to increase their authorized service centers with a low cost spares and
services.
The mobile sellers provide adequate credit purchase facility for their customers in order increase their customer and
fulfil their needs.
The customers also feel that cost of the mobile phone is very high since the company to take necessary step for reduce
their mobile price.
REFERNCES
1. S., Gandhimathi, & S., Parameshwari. (2015). A study on customers, satisfaction towards Micromax mobile phone
with special reference in Coimbatore city. International Journal of Management and Commerce Innovations, 2(2),
602-605.
2. S., Namasivayam. (2014, May). A study on customer satisfaction towards Samsung smart phones with reference to
Coimbatore city. Indian Journal of Applied Research, 4(5).
3. T., N. R. Kavitha, & R., Mohanasundram. (2014). A study on customer satisfaction towards Samsung Mobile Phone in
Erode City. IOSR Journal of Business and Management, 01-03. ISSN-2319-7668.
4. S., Sukumar. (2013, April). A study of consumer attitude towards Samsung mobile instruments in Dindigul district.
IJCBM, 2(2). ISSN: 2319-2828.
5. Nidhi, P. Shah. (2013, December). Customer satisfaction of Samsung mobile handset users. Voice of Research, 2(3).
6. Brown, J., & Glazie. (1978). Telecommunications. McGraw Hill Publishers House.
7. Fornell, C. (1992). A National customer satisfaction barometer: The Swedish experience. Journal of Marketing, 56(1),
6-21.
8. Retrieved from www.samsung.com
9. Retrieved from http://www.academia.edu/6694432/2vol2no2
10. Retrieved from http://www.voiceofresearch.org/Doc/Dec-2013/Dec-2013_21.pdf
11. Retrieved from https://en.wikipedia.org/wiki/Customer_satisfaction
12. Retrieved from https://www.scribd.com/doc/297072495/A-Study-On-
13. Retrieved from
https://www.scribd.com/doc/297072495/A-Study-On-Customer-s-Perception-And-Satisfaction-Towards-Elect...
14. Retrieved from http://www.iracst.org/ijcbm/papers/vol2no22013/2vol2no2.pdf
15. Retrieved from https://en.wikipedia.org/wiki/Samsung_Electronics#History
16. Retrieved from https://en.wikipedia.org/wiki/Samsung_mobile_phones#History
17. Retrieved from http://iosrjournals.org/iosr-jbm/papers/ncibppte-volume-3/17.pdf
18. Retrieved from
https://www.researchgate.net/post/How_important_is_the_cover_letter_when_submitting_an_article_to_a_...
19. Retrieved from chttp://epratrust.com/articles/upload/23.Mr.%20Megharaja.B.pdf
20. Retrieved from https://en.wikipedia.org/wiki/Customer_satisfaction#Purpose
Volume 5, Number 1, January – March’ 2016
ISSN (Print): 2279-0977, (Online): 2279-0985
PEZZOTTAITE JOURNALS SJIF (2012): 3.23, SJIF (2013): 5.057, SJIF (2014): 5.871, SJIF (2015): 6.492
International Journal of Applied Services Marketing Perspectives© Pezzottaite Journals. 2018 |P a g e
21. Retrieved from http://www.slideshare.net/iosrjce/a-study-on-customers-perception-and-satisfaction-towards-electroni...
22. Retrieved from http://iosrjournals.org/iosr-jbm/papers/ncibppte-volume-4/26.pdf
23. Retrieved from http://www.studymode.com/essays/Employee-Welfare-674174.html
24. Retrieved from https://ideas.repec.org/p/vor/issues/2013-12-21.html
25. Retrieved from http://econpapers.repec.org/RePEc:vor:issues:2013-12-21
26. Retrieved from http://www.ukessays.com/essays/health-and-social-care/health-care-personalities-attitude-health-and-...
27. Retrieved from http://link.springer.com/article/10.1007%2FBF02893284
28. Retrieved from http://www.ijrbsm.org/pdf/v1-i1/6.pdf
29. Retrieved from http://citeseerx.ist.psu.edu/viewdoc/summary?doi=10.1.1.116.3644
*****
BUSINESS PROPOSAL FOR CONFERENCES PUBLICATIONS IN JOURNALS / AS PROCEEDINGS
We are pleased to present this proposal to you as publisher of quality research findings in / as Journals / Special Issues, or
Conference Proceedings under Brand Name ‘Pezzottaite Journals’.
We aims to provide the most complete and reliable source of information on current developments in the different disciplines.
The emphasis will be on publishing quality articles rapidly and making them available to researchers worldwide. Pezzottaite
Journals is dedicated to publish peer-reviewed significant research work and delivering quality content through information
sharing.
Pezzottaite Journals extends an opportunity to the ‘Organizers of Conferences & Seminars’ from around the world to
get ‘Plagiarism Free’ research work published in our Journals, submitted and presented by the participants within the
said events either organized by /at your Department / Institution / College or in collaboration.
As you know, the overall success of a refereed journal is highly dependent on the quality and timely reviews, keeping this in
mind, all our research journals are peer-reviewed to ensure and to bring the highest quality research to the widest possible
audience. The papers submitted with us, will follow a well-defined process of publication and on mutual consent. Publications
are made in accordance to policies and guidelines of Pezzottaite Journals. Moreover, our Journals are accessible worldwide as
‘Online’ and ‘Print’ volumes.
We strongly believe in our responsibility as stewards of a public trust. Therefore, we strictly avoid even the appearance of
conflicts-of-interest; we adhere to processes and policies that have been carefully developed to provide clear and objective
information, and it is mandate for collaborating members to follow them.
Success Stories:
We had successfully covered 4 International Conferences and received appreciation from all of them.
If you have any query, [email protected], [email protected]. We will respond to your
inquiry, shortly. If you have links / or are associated with other organizers, feel free to forward ‘Pezzottaite Journals’ to them.
It will indeed be a pleasure to get associated with an educational institution like yours.
(sd/-)
(Editor-In-Chief)
Volume 5, Number 1, January – March’ 2016
ISSN (Print): 2279-0977, (Online): 2279-0985
PEZZOTTAITE JOURNALS SJIF (2012): 3.23, SJIF (2013): 5.057, SJIF (2014): 5.871, SJIF (2015): 6.492
International Journal of Applied Services Marketing Perspectives© Pezzottaite Journals. 2019 |P a g e
LITERATURE REVIEW OF NEW DIMENSIONS IN INTERNET BANKING
T. Deepthi16
ABSTRACT
Indian banking industry has witnessed a tremendous developments due to sweeping changes that are taking place in the
information technology. Electronic banking has emerged from such an innovative development. The objective of the present
paper is to study and analyze the progress made by Indian banking industry in adoption of technology. The study is secondary
based review from various studies. The progress in e-banking in Indian banking industry is measured through various
parameters such Product Diversifications, Web Design/Features factor, Service quality dimensions and Service quality and
customer satisfaction: The paper concludes that in years to come e-banking will not only be acceptable mode of banking but
preferred mode of banking.
KEYWORDS
E-Banking, Information Technology, Automated Teller Machines, Service Quality etc.
INTRODUCTION
E-banking or electronic banking refers to conducting banking activities with the help of information technology and computers. E-
banking is a mix of services which include Internet banking, Mobile banking, ATM kiosks, Fund Transfer System, Real Time
Gross Settlement (payment & settlement system), Credit/Debit/Smart/Kisan Cards, Cash management services, and Data
warehousing, Operational data for MIS and Customer Relationship Management. Latest innovations in technology like broadband
transmission, internet access via mobiles and WebTV will further provide impetus to digital revolution. Banks are scanning the
image of a cheque, which can be zapped to another bank, into the depository and back to customer's bank. Banking transactions
can be carried out 24 hours a day using these methods. In fact, concept of Anytime, Anywhere banking is making it easy for
customers to access their money more conveniently.
PRODUCT DIVERSIFICATIONS
Van Hoeck, (2001). In the wake of the internet revolution, electronic commerce emerged and allowed businesses to interact more
effectively with their customers and other corporations. In this proliferated information age, banking industry has been using this
new communication channel to reach its varieties of customers. With cyber cafes and kiosks, springing up in different cities
access to the Net is going to be easy. Internet banking (also referred as e banking) is the latest in this series of technological
wonders in the recent past involving use of Internet for delivery of banking products & services. E-business has been continuously
growing as a new industry during the last decade. Brodie et al (2007). Internet banking is changing the banking industry and is
having the major effects on banking relationships. Banking is now no longer confined to the branches were one has to approach
the branch in person, to withdraw cash or deposit a cheque or request a statement of accounts. E-banking technologies have
proliferated in recent years, and the availability of a wide range of products has led to increasing adoption among consumers.
These technologies include direct deposit, computer banking, stored value cards, and debit cards such as networked ATMs,
internet banking, and smartcards based products etc. Anguelov et. al. (2004). All business, including small and medium scale
industries, no matter their geographical locations, are all beneficiaries of e banking. It encompasses all kinds of commercial
transaction that is conducted on an electronic medium, mostly through the internet.
Most of the consumers who start banking online do it because they need to pay bills frequently and would like to do it with
minimum effort. Besides that, people use the internet banking to keep an eye on their money matters, view their account balance
and check receiving payments from other parties. Kolodinsky, J.M., Hogarth, J.M. and Hilgert, M.A. (2004) In contrast to
traditional banking, i-Banking involves non-human interactions between customers and online bank information system.
Customer satisfaction, customer retention and new customer acquisition are the key factors in i-banking system. This becomes
more important since the acquisition costs in online banking exceed that of traditional offline business by 20%–40%.
(Reibstein, 2002), from the bank viewpoint, adoption of Internet banking will lead to cost reduction and improved
competitiveness. This service delivery channel is seen as powerful because it can retain current Internet-based customers who
continue using banking services from any location. Moreover, the electronic service channel can also provide efficient services to
customers via the mobile technology Prendergast G, and Marr N. (1994). 30 Banks have realized that in order to remain
16Assistant Professor, Department of Commerce, Annavaram Satyavathi Devi Government Degree for Women (Autonomous),
Andhra Pradesh, India, [email protected]
Volume 5, Number 1, January – March’ 2016
ISSN (Print): 2279-0977, (Online): 2279-0985
PEZZOTTAITE JOURNALS SJIF (2012): 3.23, SJIF (2013): 5.057, SJIF (2014): 5.871, SJIF (2015): 6.492
International Journal of Applied Services Marketing Perspectives© Pezzottaite Journals. 2020 |P a g e
competitive, they need to restructure their services to make use of rapid technology as well as to offer diverse service portfolio.
Arasli, H., Mehtap-Smadi, S. and Katircioglu, S. T. (2005).
WEB DESIGN / FEATURES FACTOR
For the deliverance of banking products, online banking is the economical channel (Sathye, 1999; Robinson, 2000; Giglio, 2002)
which reduces the cost of manpower (Karjaluoto, Koivumaki and Salo, 2003). On the other hand, it is not that all the financial
businesses using internet banking are flourishing with the use of this technology (Hernández-Ortega, Jiménez-Martínez, and
Hoyos, 2007). Failures in online banking are often associated with the poor design of the website. A website, which is easily
navigable, makes it easy for the users to get their desired information and quickly finish their operations .So to be successful on
internet-based businesses; fine website design is also required along with the satisfactory products (Hernández-Ortega et al.,
2007). Construction of easily navigable website should also be included in the strategies of internet banking (Serrano-Cinca,
Fuertes-Callén, and Gutierrez-Nieto, 2007). User of internet banking anticipate that the online system will be beneficial than
traditional banking and in other ways alike, would be speedy and would save time and would be beneficial economically
(Karjaluoto, 2002 b; Goi, 2007). User responsive website must also be there for getting all these advantages (Hernández-Ortega et
al., 2007). So the most important way of transmission for banks is the design of website (Liu and Arnett, 2000; Zhang and von
Dran, 2001; Liao, Huang and Chen, 2007). Operability and usability that a website should offer to its consumers is known as
navigability (Hernández-Ortega et al., 2007). Search options provided by the website for users to find what they are looking for is
navigability characteristic (Huizingh, 2000). Satisfaction of the users would be greater when there would be greater navigability
and user requires few clicks to get his desired object. The chances of getting customers that are more loyal would increase when
the navigability is easy. It is possible that a user may not be able to finalize his/her transaction due to poorly designed website
furthermore he/she may not visit that website again for financial transactions(Hernández-Ortega et al., 2007).
SERVICE QUALITY DIMENSIONS
(Olorurnnirvo F) In the view of changing scenario, the service quality dimensions have become vital. However, among all,
responsibility, reliability, easy use, accessibility, security, efficiency has vital bearing on the success of the e banking. The
research is the common method of measuring service quality. Service quality can thus be defined as the difference between
customer’s expectation of service and the customer experience. If the expectations are greater than performance, then the
perceived quality is less than the satisfaction level and hence customer dissatisfaction occurs. Mahapatra, Khan, M.S S.S. and
Sreekumar (2009) his study is based on the service quality of internet banking (i-banking) services in India from customer’s
perspective. A structured questionnaire containing 44 quality items is administered to various target groups. Seven quality
dimensions, viz. reliability, accessibility, user friendliness, privacy/security, efficiency, responsiveness and fulfillment, are
identified based on principal component factor analysis. Demographic analysis of data reveals that gender is hardly a bias for use
and evaluation of service quality of i-banking in most of the cases across various categories of customers. A valid mathematical
model is proposed to assess the overall service quality using regression analysis. The results show that customers are satisfied
with quality of service on four dimensions such as reliability, accessibility, privacy/security, responsiveness and fulfillment, but
least satisfied with the ‘user-friendliness’ dimension. The empirical findings not only prioritize different parameters but also
provide guidelines to bankers to focus on the parameters on which they need to improve.
SERVICE QUALITY AND CUSTOMER SATISFACTION
According to Kotler (2000), satisfaction is a person’s feelings of pleasure or disappointment resulting from comparing a product is
perceived performance (or outcome) in relation to his or her expectations. Researches in the past suggest that service quality and
satisfaction are distinct constructs (Bitner, 1990; Bolton and Drew, 1991; Parasuraman et al., 1988). The difference is that
perceived service quality is a form of attitude, a long-run overall evaluation, whereas satisfaction is a transaction-specific measure.
According to Cronin and Taylor (1992), the distinction between consumer satisfaction and service quality is important to
practitioners and researchers alike because service providers need to know whether their objective should be to have consumers
who are “satisfied” with their performance or to deliver the maximum level of “perceived service quality”.
Parasuraman et al. (1988) proposed that higher levels of perceived service quality result in increased customer satisfaction. Hurley
and Estelami (1998) reported that while service quality and satisfaction are distinct constructs, a causal relationship exists between
the two, and that perceptions of service quality affect feelings of satisfaction, which, in turn, influence future purchase behavior.
Lassar et al. (2000) investigated the impact service quality on customer satisfaction in private banking by using the SERVQUAL
and the technical/functional models. They reported that customer satisfaction is a multidimensional construct, and the service
quality dimensions will differentially affect its dimensions. Customer satisfaction in the online environment is referred as “e-
satisfaction”.
Volume 5, Number 1, January – March’ 2016
ISSN (Print): 2279-0977, (Online): 2279-0985
PEZZOTTAITE JOURNALS SJIF (2012): 3.23, SJIF (2013): 5.057, SJIF (2014): 5.871, SJIF (2015): 6.492
International Journal of Applied Services Marketing Perspectives© Pezzottaite Journals. 2021 |P a g e
Yang et al. (2001) proposed that the potential benefits of Internet could be realized through high standards of e-service quality.
Several studies in the past have paid much attention to the close relationship between service quality and customer satisfaction.
(Bitner et al., 1990; Parasuraman et al., 1988).
Grönroos (1984), Parsuraman et al. (1985), Johnston (1995), and others have investigated the key determinants of service quality
and whether it consequently results in satisfaction or not. Al-Hawari and Ward (2006) demonstrated that service quality caries a
significant impact on customer satisfaction, which in turn affects the financial performance of banks. Dina et al. (2004) found that
majority of previous studies view the dimensions of e-service quality as antecedents of e-satisfaction.
CONCLUSION
Indian banks are making sincere efforts for the adoption of advanced technology and installation of e-delivery channels but still
masses are wary of the concept. Banks are making earnest efforts to popularize the e-banking services and products. Younger
generation is beginning to see the convenience and benefits of e-banking. In years to come, e-banking will not only be acceptable
mode of banking but will be preferred mode of banking. As many as 7% of account holders in the country are using the Internet
for banking transactions, while branch banking has fallen by a full 15 percentage points, according to a report by global
management consultancy McKinsey & Company 20th July, 2011.
According to the recent report, only 9% of the active internet users transact online. Online transaction is still in its infancy owing
and there is a pressing need to educate and inform the user of the benefits of the internet services to drive the growth of internet
usage. CXOtoday News Desk (Oct 23, 2013).
REFERENCES
1. Al-Hawari, M., & Ward, T. (2006). The effect of automated service quality on Australian banks’ financial performance
and the mediating role of customer satisfaction. Marketing Intelligence & Planning, 24(2), 127-147.
2. Anguelov, C. E., Marianne, A. H., & Hogarth, J. M. (2004, Winter). U.S. Consumers and Electronic Banking: 1995–
2003. Federal Reserve Bulletin, 90, 1–18.
3. Arasli, H., Mehtap-Smadi, S. & Katircioglu, S. T. (2005). Customer service quality in the Greek Cypriot banking
industry. Managing Service Quality, 15(1), 41-56.
4. Brodie, R. J., Winklhofer, H., Coviello, N. E., & Johnston, W. J. (2007). Is e marketing coming of age? An Examination
of the penetration of e marketing and firm performance. J. Interactive Market. 21(1), 2-21.
5. Bitner, M. J., Brown, S. W., & Meuter, M. L. (2000). Technology Infusion in Service Encounters. Journal of the
Academy of Marketing Science, 28(1), 138-149.
6. Huizingh, E. K. R. E. (2000). The content design of web sites: an empirical study. Information and Management, 37,
123-134.
7. Hernández-Ortega, B., Jiménez-Martínez, J., & Hoyos, M. J. M. D. (2007, December). An analysis of Web Navigability
in Spanish Internet Banking. The Journal of Internet banking and Commerce, 12(3).
8. Karjaluoto, H. (2002 b). Electronic Banking in Finland: Consumer Beliefs, Attitudes, Intentions and Behaviors
(Doctoral Dissertation). Finland: University of Jyvaskyla.
9. Karjaluoto, H., Koivumaki, T., & Salo, J. (2003). Individual differences in private banking: Empirical evidence from
Finland. In Proceedings of the 36th Hawaii International Conference on System Sciences (HICSS). Big Island,
Hawaii.
10. Kotler, P. (2000). Marketing Management (International Edition). Prentice-Hall, Englewood Cliffs, NJ.
11. Kolodinsky, J. M., Hogarth, J. M., & Hilgert, M. A. (2004). The adoption of electronic banking technologies by US
consumers. International Journal of Bank Marketing, 22(4), 233–241.
12. Lassar, W. M., Manolis, C., & Winsor, R. D. (2000). Service Quality Perspectives and Satisfaction in Private Banking.
Journal of Services Marketing, 14(3), 244-271.
Volume 5, Number 1, January – March’ 2016
ISSN (Print): 2279-0977, (Online): 2279-0985
PEZZOTTAITE JOURNALS SJIF (2012): 3.23, SJIF (2013): 5.057, SJIF (2014): 5.871, SJIF (2015): 6.492
International Journal of Applied Services Marketing Perspectives© Pezzottaite Journals. 2022 |P a g e
13. Mahapatra, S. S., & Sreekumar. (2009). Service quality evaluation in internet banking: an empirical study in India. Int.
J. Indian Culture and Business Management, 2(1), 30–46.
14. Olorurnniro, F. Service Quality. Customer satisfaction and behavioural intentions in the service factory. Journal of
Service Marketing, Vol. 20, pp 59-72.
15. Parasuraman, A., Berry, L.L., & Zeithaml, V. A. (1991). Refinement and Reassessment of the SERVQUAL Scale.
Journal of Retailing, 67(4), 420-50. [44]
16. Parasuraman, A., Zeithaml, V. A., & Berry, L. L. (1985). A conceptual model of service quality and its implications for
future research. Journal of Marketing, 49(4), 41–50.
17. Prendergast, G., & Marr, N. (1994). The Future of Self-Service Technologies in Retail Banking. The Service Industries
Journal, 14(1), 94-114
18. Reibstein, D. J. (2002). What attracts customers to online stores, and what keeps them coming back? Journal of the
Academy of Marketing Science, 30, 465–473.
19. Sathye, M. (1999). Adoption of Internet Banking by Australian consumers: an empirical investigation. The
International Journal of Bank Marketing, 17(7), 324-334.
20. Serrano-Cinca, C., Fuertes-Callén, Y., & Gutierrez-Nieto, B. (2007). Online reporting by banks: a structural modeling
approach. Online Information Review, 31(3), 310-332.
21. Van Hoeck, R. (2001). E-supply chains – virtually non-existing. Supply Chain Management: An International
Journal, 6(1), 21–28.
22. Retrieved from http://shodhganga.inflibnet.ac.in/bitstream/10603/9518/9/09_chapter%202.pdf
23. Retrieved from http://www.macrothink.org/journal/index.php/ijld/article/download/1591/1339
24. Retrieved from http://dspace.nitrkl.ac.in:8080/dspace/bitstream/2080/746/1/sssm.pdf
25. Retrieved from
http://www.academia.edu/9422282/consumer_perceptions_of_the_e-_banking_services_in_andhra_pradesh_A_...
26. Retrieved from http://www.inderscienceonline.com/doi/abs/10.1504/IJICBM.2009.021596
27. Retrieved from http://www.ijrrr.com/papers/9%20-%20Ebanking%20(ML%20Sharma).pdf
28. Retrieved from
http://www.ukessays.com/essays/information-technology/a-review-on-the-e-banking-system-information-t...
29. Retrieved from https://www.scribd.com/doc/19889239
30. Retrieved from https://www.scribd.com/doc/19889239/a-study-of-netbanking-provided-by-hdfc-bank
31. Retrieved from http://ripublication.com/irph/ijict_spl/ijictv4n9spl_03.pdf
32. Retrieved from http://www.saiompublications.com/journal/index.php/ISSN-2347-7563/article/download/154/117
33. Retrieved from http://www.cxotoday.com/story/whats-ailing-internet-penetration-in-rural-india/
34. Retrieved from
http://www.academia.edu/14806613/AWARENESS_AND_SATISFACTION_LEVEL_OF_CUSTOMERS_REGARDI
NG_E_BANKING_S...
*****
Volume 5, Number 1, January – March’ 2016
ISSN (Print): 2279-0977, (Online): 2279-0985
PEZZOTTAITE JOURNALS SJIF (2012): 3.23, SJIF (2013): 5.057, SJIF (2014): 5.871, SJIF (2015): 6.492
International Journal of Applied Services Marketing Perspectives© Pezzottaite Journals. 2023 |P a g e
IMPACT OF SOCIAL NETWORKING SITES AND MESSAGING APPS ON YOUTH
Sushmitha R. Shetty17 Priya Shetty18 Shilpa19 Shruthi G. Bhatt20 Ranjitha21
ABSTRACT
A large community uses internet for educational purpose but unfortunately we have a large community including majority of
youth and teenagers who use Internet for only social networking sites. Social networking sites and messaging apps is a
popular trend today especially among youth. Through social networking sites and messaging apps, people can use networks of
online friends and group memberships to keep in touch with current friends, reconnect with old friends or create real life
friendships through similar interests or groups. Main purpose of the study is to know the knowledge about these sites and
main reasons for using these sites. Therefore, we are using both primary as well as secondary data to make our research more
precise. Thus, this paper sheds light on how effectively youths are using these messaging applications and social networking
sites.
KEYWORDS
Emotional Intelligence, Consumer Emotional Intelligence Scale (CEIS), Information Technology Enabled Services
(ITES) etc.
INTRODUCTION
Internet is a very important element of life, which cannot be ignored. A large community uses internet for educational purpose but
unfortunately we have a large community including majority of youth and teenagers who use Internet for only social networking
sites. Social networking sites and messaging apps is a popular trend today especially among youth. Through social networking
sites and messaging apps, people can use networks of online friends and group memberships to keep in touch with current friends,
reconnect with old friends or create real life friendships through similar interests or groups. Besides establishing important social
relationships, social networking members can share their interests with other likeminded members by joining groups and forums.
Some networking sites can also help members find a job or establish business contacts. Most social networking sites and
messaging apps also offer additional features like blogs and forums, members can express themselves by designing their profile
page to reflect their personality. The most popular extra features include music and video sections. Social networking sites and
messaging apps have facilitated communication. Members of such sites and apps can easily form groups (called the communities)
and share their opinions among themselves through discussion threads, forums and polls.
Though these sites serves good in many ways, it has its negative effects too such as cybercrimes, which has become a privacy
threat to the people worldwide. Although advantageous in many ways by building new relationship and reconnecting with lost or
old contacts, it also brought up some behavioural changes among the youth, not only the behavioural changes but also their social
behaviour and approaches. Social networking sites and messaging apps grabs the total attention and concentration of the youths
and diverts it towards non-educational, unethical and inappropriate actions such as useless chatting, time killing by random
searching and not doing their jobs.
NEED OF THE STUDY
Today’s present scenario usage of social networking sites and messaging application rapidly increasing especially in the young
generation. Thus, the research highlights on the positive as well as negative effects of these social networking sites and messaging
apps on the life style of young generation.
OBJECTIVE OF STUDY
To study about more frequently used social networking sites and messaging applications.
To study the awareness level about the social networking sites and messaging applications.
To know the reasons for usage of the social networking sites and messaging applications.
To study the effect of social networking sites and messaging application on the life style of youth.
17Lecturer, U.G. Department of Commerce, Alva’s College, Karnataka, India, [email protected] 18Student (M. Com.), Alva’s College, Karnataka, India, [email protected] 19Student (M. Com.), Alva’s College, Karnataka, India, [email protected] 20Student (M. Com.), Alva’s College, Karnataka, India, [email protected] 21Student (M. Com.), Alva’s College, Karnataka, India, [email protected]
Volume 5, Number 1, January – March’ 2016
ISSN (Print): 2279-0977, (Online): 2279-0985
PEZZOTTAITE JOURNALS SJIF (2012): 3.23, SJIF (2013): 5.057, SJIF (2014): 5.871, SJIF (2015): 6.492
International Journal of Applied Services Marketing Perspectives© Pezzottaite Journals. 2024 |P a g e
SCOPE OF STUDY
Social networking sites and messaging applications helps the people to stay in touch with far relatives, current friends and old
friends so while using these social networking sites and messaging apps users have both positive and negative effect on life style
of youth. To shed light on these positive and negative effects and to provide certain measures to reduce the negative effect of life
style of the young generation.
RESEARCH METHODOLOGY
Data Source
Primary Data: Collected by the method of questionnaire given to random population. The sample space used for this
filed work is 100. Simple statistical tool such as average and percentage is used to analyze the data.
Secondary data: The paper also took help of secondary data like various research papers, journals, newspapers, books
and online data base
LIMITATIONS OF STUDY
Primary data is collected with the help of questionnaire thus; non-respondents have an effect on interpretation.
Information collected only from Mangalore.
Currently we have several messaging apps and social networking sites but we could not cover all these Social Medias
because of time constraint.
COMPANY PROFILE
Facebook: Face book incorporated July 29, 2004 in a social networking company. The company builds engaging products that
enables people to connect and share through mobile devices and personal computers. The company offers various services focused
on people, marketer and developers. It offers online and mobile-based platform for people to share this opinions, ideas, photos,
and videos and to engage in other activities.
Hike: Hike was launched on 12 December 2012 and raised its first round of $7million from Bharti Soft Bank in April 2013.hike is
a joint venture between Bharati Enterprises and Soft bank. Hike attained 15 million users in February 2014 and raised $14 million
for its development over the next months, the next months, the application introduced free text messaging anywhere in India, chat
themes updated stickers hidden chats and revamped users and raised another big round of funding $65 million led by tiger global.
Hike message is made its acquisition, buying free voice-calling company Zip phones, which allowed it to launch free app based
calling services that are emerging as a key draw for users.
IMO: IMO founded in 1972, IMO has grown from its UK base to become a leading manufacturer and supplier of industrial
control and electronic products throughout Europe. From its early beginnings in a small London factory manufacturer industrial
relays. IMO has expanded to how provided product solution ranging from pCB terminal block connectors to programmable logic
controllers, with sales officers in the U.K, finance, Italy and Canada distributors in over 30 other countries around the world, IMO
derives 50% its revenue from overseas market.
WhatsApp: WhatsApp operators as across platform mobile messaging company. The company’s cross communication application
allows users to exchange unlimited text and multimedia messages, such as audio, video and photo messages without having to pay
for short messaging service fees. It supports I Phone, blackberry, android, windows, Nokia and Symbian platforms. The company
was founded in 2009 and based in Santa Clara California, as of October 6 2014 operate as a subsidiary of Face book.
Google +: It launched in June 2011, features included the ability to post photos and status updates to the steam or interest based
communities, group different types of relationship into circles a multi person instant messaging, text and video. Chat called
hangouts, events, location tagging and the ability to edit and upload photos to private cloud based albums.
Line: The line 1st launched in Japan in 2011, reaching 100 million users within eighteen months and 2000 million users only six
months later. Line becomes Japan’s largest social network in 2013. In October 2014.
Viber: In an application for I Phone and Android phones, that lets you make free phone calls and send text messages to anyone
who also has the application installed. You can call or text any viber user anywhere in the world for free. Viber integrates
seamlessly with your existing address book has great sound quality and once activated, does not require a PIN username or any
additional in application purchases.
Volume 5, Number 1, January – March’ 2016
ISSN (Print): 2279-0977, (Online): 2279-0985
PEZZOTTAITE JOURNALS SJIF (2012): 3.23, SJIF (2013): 5.057, SJIF (2014): 5.871, SJIF (2015): 6.492
International Journal of Applied Services Marketing Perspectives© Pezzottaite Journals. 2025 |P a g e
Twitter: The whole world is the following this company. Twitter operates a free digital services site that blends social networking
with the ability to post short messages limited to 140 characters or less, commonly known by as tweets. Twitters service works
equally well on personal computers, mobile devices and smart phones. Even Williams Jack Dorsey and big stone company
founded twitter in 2006. In 2013, the fast growing company went public, raising $1.82 billion in the process.
ANALYSIS AND INTERPRETATION
Frequency of Usage
45% of respondents are using social networking sites and messaging apps every day, 19 & 31 percentage of respondents are using
weekly and remaining 1 and 4 percentage of respondents are using for video calling and business contract.
Purpose of Using Social Networking Sites and Messaging Apps
45% of respondents are using social networking sites and messaging apps for chatting, 19 & 31 percentage of respondents are
using for the purpose of document sharing and have a social interaction, and remaining 1 and 4 percentage of respondents are
using for video calling and business contract.
Most Effective and User Friendly Sites / Apps
70% of the respondents are considered as WhatsApp is user-friendly app, and 22 and 8 percent of respondents are says Facebook
and hike effective to use. However, the public does not know line.
Currently using Apps
60% of respondents are using WhatsApp than the other apps. Currently 15 and 16 percentage respondents are using face book and
hike respectively. Compare to these apps usage of twitter (4%) and other apps (5%) is less.
Awareness about Social Networking Sites and Messaging Apps
87% of respondents are aware about the new advancements in the social networking sites and messaging applications and 13% of
respondents not much aware these new advancements.
Effect of Social Networking Sites on Daily News Papers and Magazines
54% respondents are considered as effect of social networking apps increasing on daily newspapers and 20% says decreasing,
23% respondents agreed that highly increasing and 3% respondents not agreed.
Improvement in Personal Knowledge
90% of respondents states that social networking sites led to growth of their personal knowledge and 10% of respondents states
that there is no scope for improving personal knowledge.
Negative Aspects in Social Networking Sites and Messaging Apps
Interpretation: According to our survey out of 100 respondents, 90 respondents say ‘yes’, there are negative aspects in social
networking sites and messaging apps and 10 respondents says ‘no’.
Awareness about Privacy
79% of people having more awareness about privacy settings and remaining 21% of people having less awareness about privacy
settings.
Social Networking Site Promotes E-Learning
60% of respondents say ‘yes’, social networking sites promote E-learning and 40% of respondents say ‘no’.
Advertisement as Marketing Strategy on Social Networking Site
90 respondents says that advertisement on social networking sites are effective and 10 respondents says that it is not effective.
Volume 5, Number 1, January – March’ 2016
ISSN (Print): 2279-0977, (Online): 2279-0985
PEZZOTTAITE JOURNALS SJIF (2012): 3.23, SJIF (2013): 5.057, SJIF (2014): 5.871, SJIF (2015): 6.492
International Journal of Applied Services Marketing Perspectives© Pezzottaite Journals. 2026 |P a g e
Number of Accounts in Social Networking Sites and Messaging Apps
71% respondents have at least two accounts, 25% respondents have 3 to 5 accounts and 4% respondents have more than 6
accounts.
Daily Time Spent
Majority of people around 66% of people spend 2 to 6 hours per day using social networking site and messaging app, the
remaining 31% spent less than one hour where as 3% spent 6 to 12 hours per day.
Table-1: Ratings
Messaging Applications
Features WhatsApp Hike Viber Line IMO
1.User Friendly 4.66 3.99 2.15 1.92 2.23
2.Data Consumption 3.90 2.74 2.15 2.02 2.16
3.Voice Call Clarity 2.78 2.12 2.27 1.78 2.09
4.Security 3.67 2.66 2.13 1.97 1.23
5.Updates 3.94 2.90 1.98 1.77 1.96
Sources: Authors Compilation
Interpretation: WhatsApp has been highest rated messaging apps by majority of respondent for the features such as user friendly,
data consumption, voice call clarity security and updates.
Table-2: Ratings
Social Networking Sites
Features Facebook Twitter Google Plus LinkedIn
1.User Friendly 4.03 2.27 2.63 1.87
2.Data Consumption 3.34 2.46 2.36 1.81
3.Quality Of Service 3.52 1.39 2.41 1.74
4.Security 2.57 2.11 2.11 2.11
5.Updates 3.12 2.18 2.20 1.72
Sources: Authors Compilation
Interpretation: Facebook has been highest rated social networking site by majority of respondent for the features such as user
friendly, data consumption, voice call clarity security and updates.
FINDINGS
According to our survey we found that most of the people are using social networking sites and messaging applications
regularly.
We have found that most of the people using social networking sites and messaging apps for chatting and to have a
social interaction.
Through our survey, it is found that WhatsApp is the most effective and user-friendly messaging application.
Most of the people are using WhatsApp application other than Face book hike and Twitter.
People are aware of new advancements in the social networking site that they are using at present.
Through our survey, we found that increasing use of social networking sites had led to decreasing consumption of
newspapers and magazines.
With the help of social sites, there is an improvement in personal knowledge of the users.
In our survey, we have found that along with several advantages social networking sites also have some negative aspects
like waste of time, cybercrimes, frauds and issues related to profile privacy.
In the survey of our research, we have found that most of people are aware about private setting in social networking
sites.
Social networking site promotes for E-Learning.
We have found that advertisement as marketing strategy on social networking site is more effective.
Most of the people having 0-2 accounts in social networking app and messaging application.
Volume 5, Number 1, January – March’ 2016
ISSN (Print): 2279-0977, (Online): 2279-0985
PEZZOTTAITE JOURNALS SJIF (2012): 3.23, SJIF (2013): 5.057, SJIF (2014): 5.871, SJIF (2015): 6.492
International Journal of Applied Services Marketing Perspectives© Pezzottaite Journals. 2027 |P a g e
Through our survey, we have found that people spending much time on using social networking sites and messaging
application daily.
SUGGESTION
Proper awareness about messaging apps and social networking sites should be provided. These messaging apps and
social networking sites can come up with new feature so people can easily connect to the public.
Creating awareness about privacy and security among the young stars, which is very low in the present scenario.
Company can use messaging apps, social networking sites to promote their product because majority of people think
these applications are effective, and user friendly.
CONCLUSION
Social media is a term used to describe the interaction between groups or individuals in which they produce, share and sometimes
exchange ideas over the internet and virtual communities. The impact of social networking sites as well as messaging apps on
young people is significant children are growing up surrounded by mobile devices and interactive social networking sites and
messaging apps such as Face book WhatsApp line Imo LinkedIn which has made social media a vital aspect of their life. The
effects of social networking sites are twofold. On the positive side, social networking sites and messaging apps can act as
invaluable tools for professionals and youth. They achieve this by assisting young professionals to market their skills and seek
business opportunities. On negative side, the internet is associated with online communities.
Cyber bullying that is perpetrated using electronic technology, is one of the risk. Young people also run the risk of inadvertently
disclosing their personal information since on most occasions youths usually neglect to read carefully websites ‘privacy policies.
Whenever young people fail to read the policies and disclaimers, they are exposed to risks of having their personal information
disclosed. This is especially a serious matter in light to the raising cases of cybercrimes such as identify theft. Thus, these social
Medias have both pros and cons while using these Medias user have to aware about all privacy settings and have to use these
Medias for right purpose.
REFERENCES
1. Retrieved from http://www.studymode.com/essays/Impact-Of-Social-Networking-Sites-1531275.html
2. Retrieved from https://en.wikipedia.org/wiki/Hike_Messenger#Features
3. Retrieved from https://en.wikipedia.org/wiki/Hike_Messenger#History
4. Retrieved from http://aupc.info/wp-content/uploads/2013/02/V5I2-5.pdf
5. Retrieved from http://www.termpaperwarehouse.com/essay-on/Impact-Of-Social-Networking-Site/241154
6. Retrieved from http://www.reuters.com/finance/stocks/companyProfile?symbol=FB.O
7. Retrieved from http://in.reuters.com/finance/stocks/companyProfile?symbol=FB.O
8. Retrieved from http://www.livetradingnews.com/facebook-inc-nasdaqfb-2-130798.htm
9. Retrieved from http://www.findfriendz.com/login.php
10. Retrieved from http://www.ijcsi.org/papers/IJCSI-9-4-3-407-411.pdf
11. Retrieved from http://files.eric.ed.gov/fulltext/EJ1018182.pdf
12. Retrieved from https://en.wikipedia.org/wiki/Line_(application)#History
13. Retrieved from https://en.wikipedia.org/wiki/Line_(application)#Market_share
*****
Volume 5, Number 1, January – March’ 2016
ISSN (Print): 2279-0977, (Online): 2279-0985
PEZZOTTAITE JOURNALS SJIF (2012): 3.23, SJIF (2013): 5.057, SJIF (2014): 5.871, SJIF (2015): 6.492
International Journal of Applied Services Marketing Perspectives© Pezzottaite Journals. 2028 |P a g e
A STUDY ON IMPACT OF ADVERTISEMENT ON CONSUMER BEHAVIOUR
WITH SPECIAL REFERENCE TO ALVAS COLLEGE AT MOODBIDRI
Swathi Bhat22 Chaithanya Hegde23 Ambili Chacko24 Bhagyashree Jain25 Prafulla Dsouza26
ABSTRACT
Advertising plays a major role in informing the customers towards making a purchase decision. Advertisement helps to
customers to take conscious brands and it gives information about particular product. The present study focuses on the
assessment of the impact of advertisement on purchase of youth. The objective of the study is to know about the impact of
advertisement on buying behavior and to find out influence of advertising strategies on consumers. Many people agree that
they have a huge impact of advertisement on their life. It also finds out the awareness level of the consumers.
INTRODUCTION
Advertising is how a company encourages people to buy their products, services or ideas. An advertisement (or "ad" for short) is
anything that draws good attention towards these things. It is usually designed by an identified sponsor, and performed through a
variety of media. Ads appear on television, as well as radio, newspapers, magazines and as billboards in streets and cities. They
try to get people to buy their products, by showing them the good rather than bad of their products.
MEANING OF ADVERTISEMENT
According to Wheeler, “Advertising is any form of paid non-personal presentation of ideas, goods or services for the purpose of
inducting people to buy.”
According to Richard Buskirk, “Advertising is a paid form of non-personal presentation of ideas, goods or services by an
identified sponsor.”
NEED OF THE STUDY
Advertising plays a significant role in buying behavior of the people. The need of the study is to know about impact of
advertisement on buying behavior of the people and know about the preference of advertisement media.
OBJECTIVES OF STUDY
The objective of the study is to know about the impact of advertisement on buying behavior.
To find out the awareness level of the consumers about advertisement.
To find out influence of advertising strategies on consumers.
RESEARCH METHODOLOGY
The data source used in this research paper is as follows:
Data Source
Primary Data: Collected by the method of questionnaire given to young people. The sample space used for this filed
work is 100. This questionnaire was asked to know about the impact of advertisement on buying behaviour of young
people. Simple statistical tool such as average and percentage are used to analyze the data.
Secondary Data: The paper also took help of secondary data like various research papers, journals, books and online
database.
22Lecturer (Commerce), Alva’s College, Karnataka, India, [email protected] 23Student (M. Com.), Alva’s College, Karnataka, India, [email protected] 24Student (M. Com.), Alva’s College, Karnataka, India, [email protected] 25Student (M. Com.), Alva’s College, Karnataka, India, [email protected] 26Student (M. Com.), Alva’s College, Karnataka, India, [email protected]
Volume 5, Number 1, January – March’ 2016
ISSN (Print): 2279-0977, (Online): 2279-0985
PEZZOTTAITE JOURNALS SJIF (2012): 3.23, SJIF (2013): 5.057, SJIF (2014): 5.871, SJIF (2015): 6.492
International Journal of Applied Services Marketing Perspectives© Pezzottaite Journals. 2029 |P a g e
SCOPE AND LIMITATION
The research study was conducted to assess an impact of advertisements on purchasing decision of youth. The data was collected
from the youth especially college students. The study was conducted in Alva’s College Moodbidri. The sample of 100 respondents
was selected on random basis to collect the data.
ANALYSIS AND INTERPRETAION
Do you see advertisement in between the programmes, which you see?
75% of people are watching the advertisement for sometimes. Remaining 25% of the people are always watching the
advertisement. In the sample taken to study there are no people who never watching the advertisement in between the programmes
which they see.
Which Media Gets Your Attention of Advertisement?
92% of the people states, that television advertisement is getting more attention than others. In addition, 3% each of the people
stated that radio and printing advertisement getting more attention respectively. Remaining 2% of people are getting more
attention through word of mouth.
Does an advertisement urge you to buy a new product?
Majority of the people have states that advertisement urges to buy new product, which rounds up to 79%.
How many influences do you feel advertisement have over your buying behavior?
69% of people states that advertisement are influence on buying behavior on average basis. 15% of people are states that
advertisement are influence on buying behavior on small basis and 13% of people are states that advertisement are influence on
largely basis. 3% people are said that not sure.
Advertisement is beneficial to consumer because it provide important information about goods and services.
65% of the people are just agrees that advertisement is beneficial to consumer. 20% of the people are said neither agrees nor
disagrees. 13% of people are states that they are strongly agreed about advertisement are beneficial for consumer. 2% of people
disagrees.
How much time you spend on watching television per day?
65% of people are spending time in TV for 0-2 hour and 26% of people are spending time in TV for 3-5 hour in per day and
remaining 5% of people are 0 hour and 4% of people are more than 5 hour.
Does the picture of a famous personality in the television add make you think that?
33% of people are states that picture of famous personality in advertisement makes they think that the product is high quality and
22% of people are thinks that the brand is facing intense competition, 16% of people have states it does effect on them and 15% of
people thinks that company must be big and remaining 14% of people are thinks that it must be expensive.
Do you find radio ads attractive?
81% people states that radio adds is not at all attractive. On the other hand, 19% people are states radio advertisement is attractive.
Which type of advertisement you like?
64% of the people likes funny advertisement and 17% of people are likes special character and remaining 15% are likes normal
advertisement 4% of people are likes other.
Whether advertisement is effect on your purchasing decision?
Majority of the people are states that advertisement is effect on their purchasing decision, which rounds up to 70%.
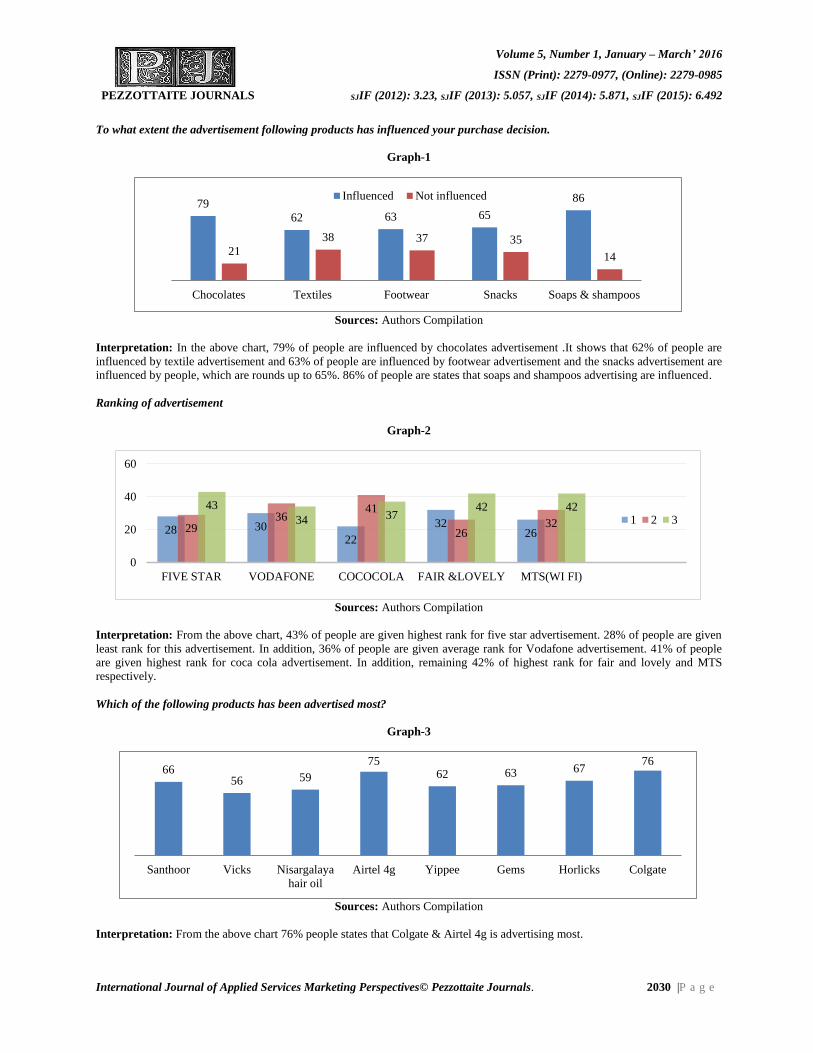
Volume 5, Number 1, January – March’ 2016
ISSN (Print): 2279-0977, (Online): 2279-0985
PEZZOTTAITE JOURNALS SJIF (2012): 3.23, SJIF (2013): 5.057, SJIF (2014): 5.871, SJIF (2015): 6.492
International Journal of Applied Services Marketing Perspectives© Pezzottaite Journals. 2030 |P a g e
To what extent the advertisement following products has influenced your purchase decision.
Graph-1
Sources: Authors Compilation
Interpretation: In the above chart, 79% of people are influenced by chocolates advertisement .It shows that 62% of people are
influenced by textile advertisement and 63% of people are influenced by footwear advertisement and the snacks advertisement are
influenced by people, which are rounds up to 65%. 86% of people are states that soaps and shampoos advertising are influenced.
Ranking of advertisement
Graph-2
Sources: Authors Compilation
Interpretation: From the above chart, 43% of people are given highest rank for five star advertisement. 28% of people are given
least rank for this advertisement. In addition, 36% of people are given average rank for Vodafone advertisement. 41% of people
are given highest rank for coca cola advertisement. In addition, remaining 42% of highest rank for fair and lovely and MTS
respectively.
Which of the following products has been advertised most?
Graph-3
Sources: Authors Compilation
Interpretation: From the above chart 76% people states that Colgate & Airtel 4g is advertising most.
79
62 63 65
86
21
38 37 35
14
Chocolates Textiles Footwear Snacks Soaps & shampoos
Influenced Not influenced
28 3022
322629
3641
2632
43
34 3742 42
0
20
40
60
FIVE STAR VODAFONE COCOCOLA FAIR &LOVELY MTS(WI FI)
1 2 3
6656 59
7562 63 67
76
Santhoor Vicks Nisargalaya
hair oil
Airtel 4g Yippee Gems Horlicks Colgate
Volume 5, Number 1, January – March’ 2016
ISSN (Print): 2279-0977, (Online): 2279-0985
PEZZOTTAITE JOURNALS SJIF (2012): 3.23, SJIF (2013): 5.057, SJIF (2014): 5.871, SJIF (2015): 6.492
International Journal of Applied Services Marketing Perspectives© Pezzottaite Journals. 2031 |P a g e
FINDINGS
It found that most of the people are watching TV per day for 1-2 hour.
It states that most of the people are watching the advertisement for sometimes. That means sometimes they are changing
the channel when advertisement comes between the programmes, which they see.
Majority of the people are getting more attention through TV advertisement than radio, print, and word of mouth
advertisement. Here we find that they are ignoring other media of advertisement.
Most of the people are agrees that advertisement urge them to buy new product. In this, we can say that advertisement
is influence on buying behaviour of the people.
Majority of the people are agrees that advertisement is beneficial to consumers because it provide important information
about goods and services.
Most of the people state that the picture of famous personality in advertisement makes them to think that the product is
of high quality.
Majority of the people are not agrees that radio advertisement is attractive.
It is found that most of the people are like funny advertisement than animated, normal or any special character.
The Purchasing decision is increase because of advertisement.
SUGGESTION
In our survey, we find that most of the people like funny advertisement than other. Therefore, in this view we can say
that company may concentrate for funny advertisement than other like animated or normal advertisement.
We also found that people are changing the channel when advertisement comes between the programmes, which they
see. Therefore, in this context we suggest that company can go for running advertisement. That means when they are
watching the programmes they are advertise their product down or up of the screen on TV.
People are getting more attention through TV advertisement. Therefore, radio and print advertisement must use
strategically plan to increase the attention of consumer.
Most of people dislike radio advertisement. Therefore, radio advertisement must change their advertisement style.
CONCLUSION
From the study, it can be concluded that the youth get the information about the different products mainly from various media of
advertisement. Majority of the youth make purchases after watching advertisement. Advertisements remind them to purchase the
products. There is a strongly relationship between the exposure to the media and recall of advertisement at the time of purchase.
Thus from the research study it can be concluded that advertisement influence on the purchase decision of youth for consumer
goods. Therefore, marketers need to design their advertisements and select such Medias by taking into consideration the buying
behavior of youth and their interests.
REFERENCES
1. Retrieved from
http://www.researchgate.net/profile/Deepa_Ingavale/publication/261031147_Impact_of_Advertisements_on...
2. Retrieved from https://simple.wikipedia.org/wiki/Advertisement#Types_of_advertising
3. Retrieved from https://simple.wikipedia.org/wiki/Advertising#Types_of_advertising
4. Retrieved from https://simple.wikipedia.org/wiki/Advertising#Techniques
5. Retrieved from https://simple.wikipedia.org/wiki/Advertisement#Techniques
6. Retrieved from http://www.publishyourarticles.net/knowledge-hub/business-studies/advertising/1028/
7. Retrieved from http://www.enotesmba.com/2012/06/mba-notes-definition-and-objectives-of.html
*****
Volume 5, Number 1, January – March’ 2016
ISSN (Print): 2279-0977, (Online): 2279-0985
PEZZOTTAITE JOURNALS SJIF (2012): 3.23, SJIF (2013): 5.057, SJIF (2014): 5.871, SJIF (2015): 6.492
International Journal of Applied Services Marketing Perspectives© Pezzottaite Journals. 2032 |P a g e
A STUDY ON IMPACT OF ONLINE MARKETING ON YOUTHS
Anantha Shayana27 Ashwitha28 Amitha Jain29 Kavya S. K.30 Chethana M. J.31
ABSTRACT
This paper is mainly concentrating on the importance of online marketing and their impact on youth’s behaviour. Marketers
consider youth as an important segment in recent globalized world. Due to their large number, accessibility to readily
available information and massive internet usage they are difficult to ignore. This research paper aims to study the impact of
online marketing on youths. The study has focused that how these online marketing strategies used by mobile phone
networking companies influence the purchase decision of youth in selection of their mobile phone network. Youth purchasing
behaviour has been taken as dependent variable to be influenced by various independent variables, which are service quality,
pricing, value offered, trust and switching cost. Paper examine how the effect of online marketing on consumer buying
behaviour and online. The method used was a quantitative analysis using the technique of purposive sampling method with a
sample of 100 people and collecting the information through secondary data. Dimensions interactivity of online marketing
provides the highest influence on the attitudes and interests of consumers purchasing online.
INTRODUCTION
With the increasing internet literacy, the prospect of online marketing is increasing in India. The consumers indulging in online
shopping consider many factors. This project is a part of study, and focuses on factors, which online Indian buyers keep in mind
while shopping online. This research found that information, perceived usefulness, ease of use; perceived enjoyment and security /
privacy are the five dominant factors, which influence consumer perceptions of online purchasing.
Internet has changed the way of businesses, consumers communication, interact and consumer transactions in worldwide. On-line
shopping is a recent phenomenon in the field of E-Business and is definitely going to be the future of shopping in the world.
Consumers especially youths are playing an important role in online shopping. The increasing use of Internet by the younger
generation in India provides an emerging prospect for online retailers. Most of the companies are running their on-line portals to
sell their products/services on-line. Though online shopping is very common outside India, its growth in Indian Market, which is a
large and strategic consumer market, is still not in line with the global market.
For organizations, it increases their customer value and the building of sustainable capabilities, next to the increased profits.
Online stores are usually available 24 hours a day, and many consumers have Internet access both at work and at home. A visit to
a conventional retail store requires travel and must take place during business hours. Searching or browsing an online catalogue
can be faster than browsing the aisles of a physical store.
Orders are only filled during warehouse operating hours, and there may be a delay of anywhere from a few minutes to a few days
to a few weeks before in-stock items are actually packaged and shipped. Many retailers inform customers how long they can
expect to wait before receiving a package, and whether or not they generally have a fulfilment backlog. A quick response time is
sometimes an important factor in consumers' choice of merchant
OBJECTIVES OF STUDY
This study aims at creating awareness regarding online marketing among people. The main objectives of our paper are:
To find out the pros and cons of online marketing,
To collect the opinion of users,
To find out role of online marketing in the creation of business for the companies.
RESEARCH DESIGN
The project is done through primary information and secondary information. We conducted market survey as a part of field study.
To make data more reliable questionnaire was developed and people’s opinion was collected.
27Lecturer, Department of PG Studies in Commerce, Alva’s College, Karnataka, India, [email protected] 28Student (M. Com.), Department of PG Studies in Commerce, Alva’s College, Karnataka, India, [email protected] 29Student (M. Com.), Department of PG Studies in Commerce, Alva’s College, Karnataka, India, [email protected] 30Student (M. Com.), Department of PG Studies in Commerce, Alva’s College, Karnataka, India, kavyask1593gmail.com 31Student (M. Com.), Department of PG Studies in Commerce, Alva’s College, Karnataka, India, [email protected]
Volume 5, Number 1, January – March’ 2016
ISSN (Print): 2279-0977, (Online): 2279-0985
PEZZOTTAITE JOURNALS SJIF (2012): 3.23, SJIF (2013): 5.057, SJIF (2014): 5.871, SJIF (2015): 6.492
International Journal of Applied Services Marketing Perspectives© Pezzottaite Journals. 2033 |P a g e
NEED OF THE STUDY
As online marketing is getting more scope and spreading, all over the world we need to study the future scope and should
understand drawbacks of this field. Therefore, we can give suggestion for the further development.
SCOPE OF STUDY
It is helpful for the future researchers.
It is helpful for the one who are already in to online marketing.
It also useful for the firms, which are interested to enter in to online marketing.
LIMITATION OF STUDY
Survey is conducted in limited area .It is done in and around Mangalore city.
This is an incomplete study as we collected information from few respondents.
As the study is also based on the secondary data, we cannot assure about the accuracy of the information.
INDUSTRY PROFILE
The global e-commerce industry saw impressive growth in 2014 with goods and services worth $1.5 trillion bought by shoppers
via desktops, tablets and smart phones. Advertisers are now spending an increasing proportion of their marketing budgets on
Internet advertising. This ad spend is forecast to surpass $160 billion in 2015, of which more than $58 billion will be spent on
Display advertising. Working with thousands of advertisers and publishers, we see billions of online transactions, providing us
with unique insights into online shopping behaviour. Here are our top 7 predictions of what advertisers can expect and must
prepare for - in 2015:
Mobile share will grow to 40% of E-commerce transactions globally.
Cross-device marketing will be real and drive significant value for advertisers.
Programmatic buying will drive rapid growth in native advertising.
Brick-and-mortar retailers will focus even more on online strategies.
Mobile apps focus will shift to re-engagement.
Automated ad formats will offer even greater flexibility.
Acquisitions and consolidation will continue to intensify in the ad-tech industry.
Mobile share will grow to 40% of E-commerce transactions globally. Mobile share of online sales grew steadily in
2014.
ANALYSIS AND INTERPRETATION
Purpose of Using Online Marketing
79% of the respondents are using online marketing for purchasing and 18% of them are using for selling and only 3% of them are
using online marketing for both the purpose.
Applications Used for Purchasing the Products
44% of the respondents are using Flip cart application for purchasing the products and remaining 25% of the people use Snap deal
and 30% of them use Amazon applications and only 1% of respondents are using other application.
Number of Respondent
66% of the respondents using OLX application and 14% of them are using quicker application for selling their goods and
remaining 20% of them are not using any applications for selling their goods.
Advantages from Online Marketing
23% of respondents tells that it saves money and time and 11% of them says that variety of product are available in online market
and 19% of respondents tells that products are available at discounted rates and remaining 47% of respondents agreed that all the
above advantages are getting from the online shopping
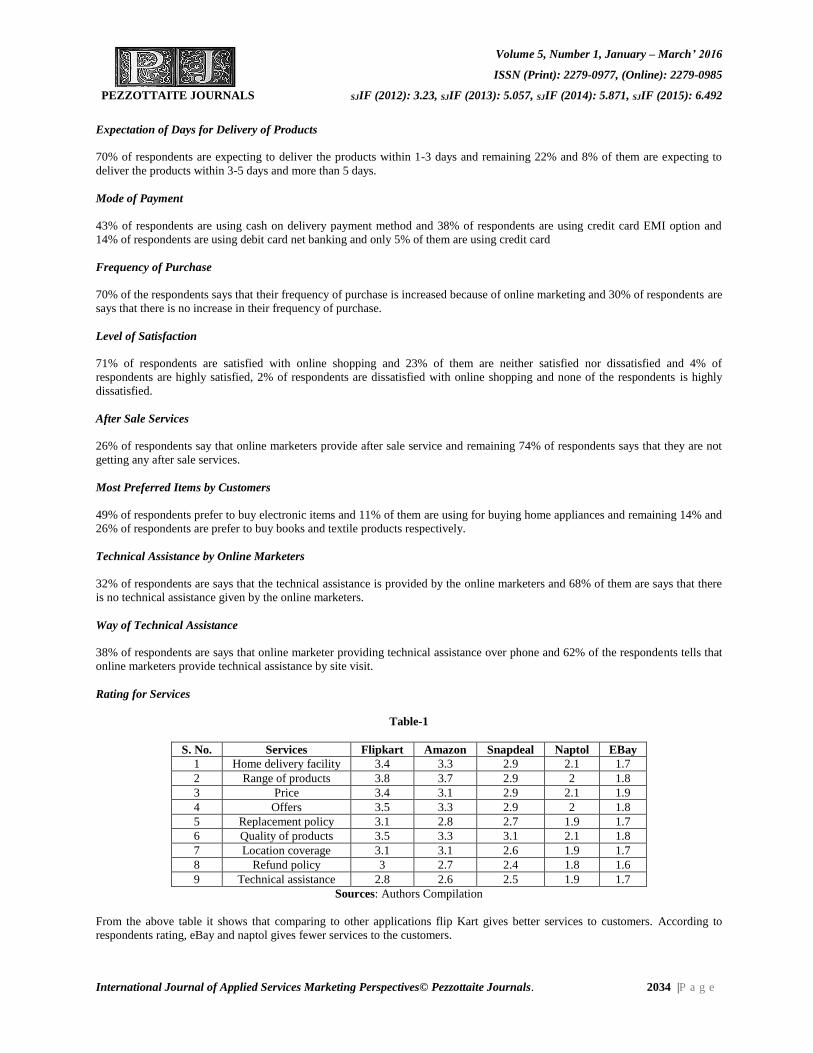
Volume 5, Number 1, January – March’ 2016
ISSN (Print): 2279-0977, (Online): 2279-0985
PEZZOTTAITE JOURNALS SJIF (2012): 3.23, SJIF (2013): 5.057, SJIF (2014): 5.871, SJIF (2015): 6.492
International Journal of Applied Services Marketing Perspectives© Pezzottaite Journals. 2034 |P a g e
Expectation of Days for Delivery of Products
70% of respondents are expecting to deliver the products within 1-3 days and remaining 22% and 8% of them are expecting to
deliver the products within 3-5 days and more than 5 days.
Mode of Payment
43% of respondents are using cash on delivery payment method and 38% of respondents are using credit card EMI option and
14% of respondents are using debit card net banking and only 5% of them are using credit card
Frequency of Purchase
70% of the respondents says that their frequency of purchase is increased because of online marketing and 30% of respondents are
says that there is no increase in their frequency of purchase.
Level of Satisfaction
71% of respondents are satisfied with online shopping and 23% of them are neither satisfied nor dissatisfied and 4% of
respondents are highly satisfied, 2% of respondents are dissatisfied with online shopping and none of the respondents is highly
dissatisfied.
After Sale Services
26% of respondents say that online marketers provide after sale service and remaining 74% of respondents says that they are not
getting any after sale services.
Most Preferred Items by Customers
49% of respondents prefer to buy electronic items and 11% of them are using for buying home appliances and remaining 14% and
26% of respondents are prefer to buy books and textile products respectively.
Technical Assistance by Online Marketers
32% of respondents are says that the technical assistance is provided by the online marketers and 68% of them are says that there
is no technical assistance given by the online marketers.
Way of Technical Assistance
38% of respondents are says that online marketer providing technical assistance over phone and 62% of the respondents tells that
online marketers provide technical assistance by site visit.
Rating for Services
Table-1
S. No. Services Flipkart Amazon Snapdeal Naptol EBay
1 Home delivery facility 3.4 3.3 2.9 2.1 1.7
2 Range of products 3.8 3.7 2.9 2 1.8
3 Price 3.4 3.1 2.9 2.1 1.9
4 Offers 3.5 3.3 2.9 2 1.8
5 Replacement policy 3.1 2.8 2.7 1.9 1.7
6 Quality of products 3.5 3.3 3.1 2.1 1.8
7 Location coverage 3.1 3.1 2.6 1.9 1.7
8 Refund policy 3 2.7 2.4 1.8 1.6
9 Technical assistance 2.8 2.6 2.5 1.9 1.7
Sources: Authors Compilation
From the above table it shows that comparing to other applications flip Kart gives better services to customers. According to
respondents rating, eBay and naptol gives fewer services to the customers.
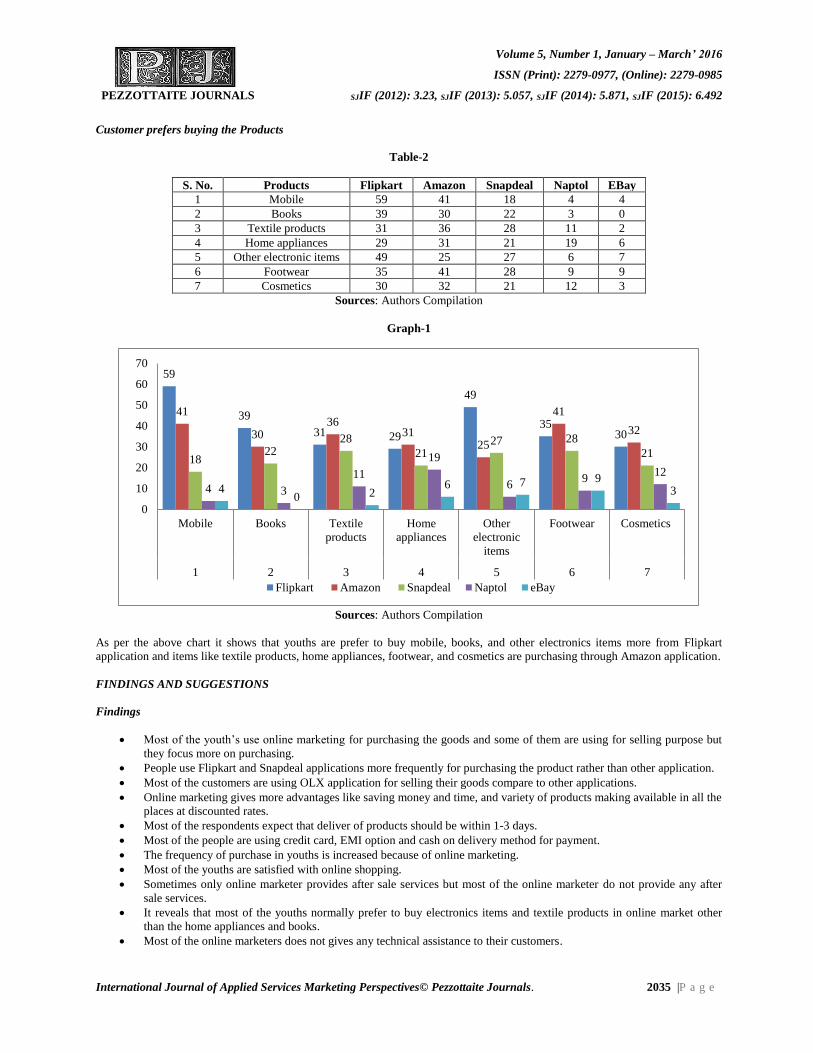
Volume 5, Number 1, January – March’ 2016
ISSN (Print): 2279-0977, (Online): 2279-0985
PEZZOTTAITE JOURNALS SJIF (2012): 3.23, SJIF (2013): 5.057, SJIF (2014): 5.871, SJIF (2015): 6.492
International Journal of Applied Services Marketing Perspectives© Pezzottaite Journals. 2035 |P a g e
Customer prefers buying the Products
Table-2
S. No. Products Flipkart Amazon Snapdeal Naptol EBay
1 Mobile 59 41 18 4 4
2 Books 39 30 22 3 0
3 Textile products 31 36 28 11 2
4 Home appliances 29 31 21 19 6
5 Other electronic items 49 25 27 6 7
6 Footwear 35 41 28 9 9
7 Cosmetics 30 32 21 12 3
Sources: Authors Compilation
Graph-1
Sources: Authors Compilation
As per the above chart it shows that youths are prefer to buy mobile, books, and other electronics items more from Flipkart
application and items like textile products, home appliances, footwear, and cosmetics are purchasing through Amazon application.
FINDINGS AND SUGGESTIONS
Findings
Most of the youth’s use online marketing for purchasing the goods and some of them are using for selling purpose but
they focus more on purchasing.
People use Flipkart and Snapdeal applications more frequently for purchasing the product rather than other application.
Most of the customers are using OLX application for selling their goods compare to other applications.
Online marketing gives more advantages like saving money and time, and variety of products making available in all the
places at discounted rates.
Most of the respondents expect that deliver of products should be within 1-3 days.
Most of the people are using credit card, EMI option and cash on delivery method for payment.
The frequency of purchase in youths is increased because of online marketing.
Most of the youths are satisfied with online shopping.
Sometimes only online marketer provides after sale services but most of the online marketer do not provide any after
sale services.
It reveals that most of the youths normally prefer to buy electronics items and textile products in online market other
than the home appliances and books.
Most of the online marketers does not gives any technical assistance to their customers.
59
39
31 29
49
3530
41
3036
3125
41
32
1822
28
2127 28
21
4 3
11
19
69
12
40 2
6 7 93
0
10
20
30
40
50
60
70
Mobile Books Textile
products
Home
appliances
Other
electronic
items
Footwear Cosmetics
1 2 3 4 5 6 7
Flipkart Amazon Snapdeal Naptol eBay
Volume 5, Number 1, January – March’ 2016
ISSN (Print): 2279-0977, (Online): 2279-0985
PEZZOTTAITE JOURNALS SJIF (2012): 3.23, SJIF (2013): 5.057, SJIF (2014): 5.871, SJIF (2015): 6.492
International Journal of Applied Services Marketing Perspectives© Pezzottaite Journals. 2036 |P a g e
Most of the online marketers provides technical assistance for some products over phone and some of them provide
technical assistance by site visit.
It reveals that flip kart gives better services to the customers compared to other applications.
Youths give more preference to Flipkart and Amazon applications for buying their products.
Suggestions
Online marketing is the better way for purchasing as well as selling of goods. Therefore, customers can trust online
marketing.
There are many applications, which provide online service. People can also prefer other application for buying the
products.
Quicker also gives better services so peoples can also use this application for selling.
Most of the people expect that the product should be delivered within a short period, hence online marketer should
deliver product to the customer within short duration.
Now a day’s people are giving more importance to the online marketing. So, the online marketer should provide after
sale services to the customer.
Online marketer should provide assistance that is more technical to the customer.
There is a heavy competition between online marketers, hence some other applications like Naptol, eBay, snap deal,
homeshop18, tragus, etc. should also provide better service to the customers to become competitive to flip kart and
Amazon.
Consumers should be educated on online shopping procedures with proper steps to be following while online shopping.
Transactions should be safe and proper security should be assured to the people making online purchases.
The study highlights that convenience, accessibility, scope, attraction, reliability, experience and clarity are the
important factors considered by the online shopper.
CONCLUSION
Online marketing is a new concept to the world. However, within a short period it has huge scope in market. As the service is
good, customers can save time and cost simultaneously. Online market is used often for purchase and sale and sometimes even for
resale. Nevertheless, according to the observation, most of the customers want online marketers to provide service more quickly,
and thereby the marketers can get wide promotion. One who are purchasing from Flipkart and Amazon are the satisfied
customers. If after sale service and technical, assistance is given to the customers then the marketing of the products will be more.
Thus, the online marketing has the opportunity to grow further and customers can get variety products at one.
REFERENCES
1. Retrieved from http://www.academia.edu/6649399/Vol2no1_5
2. Retrieved from http://www.ripublication.com/gjmbs_spl/gjmbsv3n2spl_03.pdf
3. Retrieved from http://www.eajournals.org/keywords/mobile-phone-network/
4. Retrieved from http://www.eajournals.org/wp-content/uploads/Impact-of-Marketing-Strategies-on-Youth-purchasing-
Beha...
5. Retrieved from https://monster4ever3.wordpress.com/
6. Retrieved from http://www.scienceandnature.org/IJEMS-Vol3(1)-Jan2012/IJEMS_V3(1)7.pdf
7. Retrieved from https://www.linkedin.com/pulse/20140716045145-65249411-changing-attitudes-of-indian-consumer-
towards...
8. Retrieved from https://en.wikipedia.org/wiki/Online_shopping#History
9. Retrieved from https://en.wikipedia.org/wiki/Online_shopping#International_e-commerce_statistics
10. Retrieved from http://www.academia.edu/9215001/CHAPTER_2_REVIEW_OF_LITERATURE_2.1_Introduction
*****
Volume 5, Number 1, January – March’ 2016
ISSN (Print): 2279-0977, (Online): 2279-0985
PEZZOTTAITE JOURNALS SJIF (2012): 3.23, SJIF (2013): 5.057, SJIF (2014): 5.871, SJIF (2015): 6.492
International Journal of Applied Services Marketing Perspectives© Pezzottaite Journals. 2037 |P a g e
EFFECTIVENESS OF MID-DAY MEAL SCHEME:
A STUDY WITH SPECIAL REFERENCE TO DIFFERENT PRIMARY SCHOOLS
OF SOUTH 24 PARGANAS DISTRICT IN WEST BENGAL
Biswajit Paul32
ABSTRACT
Through this paper, I are trying to highlight how the Mid-Day Meal Scheme (MDM) is becoming an influential factor in
education sector reforms. Different Mid-day Meal Schemes were initiated based on the philosophy that "when children have
to sit in class with empty stomachs, they cannot focus on learning”. The scheme is important for improving enrolment,
attendance and retention of primary school children, while simultaneously improving their nutritional status. Mid-Day Meal
Scheme had proved to be an effective means to check high dropout rates of children from economically weaker sections, while
also addressing their nutritional needs. On this issue, various schemes were implemented in the primary education sector by
the Government to reach the disadvantaged population. Apart from enhancing school attendance and child nutrition, mid-day
meal has an important social value and foster equality. The methodology included both the secondary data and primary data
and scope of the study limited to some Blocks of South 24 Parganas district of West Bengal.
KEYWORDS
Mid-day Meal, Primary Schools, Child Nutrition etc.
INTRODUCTION
In India, many numbers of children are suffering from hunger. Hunger is a big enemy to the human beings. It will take the lives of
the people. Children represent the future, and ensuring their healthy growth and development ought to be a prime concern of all
the societies. Our government is also trying its best to control and get back their rights.
Different Mid-day Meal Schemeswere initiated based on the philosophy that "when children have to sit in class with empty
stomachs, they cannot focus on learning”. The scheme is important for improving enrolment, attendance and retention of primary
school children, while simultaneously improving their nutritional status. Mid-Day Meal Scheme had proved to be an effective
means to check high dropout rates of children from economically weaker sections, while also addressing their nutritional needs.
On this issue, various schemes were implemented in the primary education sector by the Government to reach the disadvantaged
population. Apart from enhancing school attendance and child nutrition, mid-day meal has an important social value and foster
equality.
I know that a hungry child is a poor learner lacking in concentration. A mid-day meal is an important instrument for combating
classroom hunger and promoting better learning. Many children reach school with an empty stomach in the morning, since a good
early morning breakfast is not a part of the household routine. Under these circumstances, it is important to acknowledge the Short
Term Effects of MDM on learning. MDM could thus be a means for not only promoting school enrollment but also better learning
in schools. With children from all castes and communities eating together, it is also instrumental in bringing about better social
integration.
MDM could serve the important purpose of improving school enrollment and attendance especially girls thus contributing to
gender equality. With MDM, it would be easier for parents to persuade their children to go to school and for teachers to retain
children in the classrooms. It could foster sound social behavior among children and dispel feelings of difference between various
castes. As they are taking their meal by sitting together and sharing meal to each other, so it brings the social equality also. MDM
can also contribute to gender equality by reducing the gender gap in education by boosting female attendance in school.
Background of MDM
Article 47 of the Indian Constitution (in the Directive Principles of State Policy) explicitly states that - The State shall regard the
raising of the level of nutrition and the standard of living of its people and the improvement of public health as among its primary
duties…. Article 39 (f) of the Indian Constitution also directs the States to ensure that - children are given opportunities and
facilities to develop in a healthy manner and in conditions of freedom and dignity. Article 21 of the constitution implicitly
provides - right to life to every Indian citizen.
32Contractual Whole-Time Teacher, Department of Commerce (Post Graduation under Calcutta University), Naba Ballygunge
Mahavidyalaya, West Bengal, India, [email protected]
Volume 5, Number 1, January – March’ 2016
ISSN (Print): 2279-0977, (Online): 2279-0985
PEZZOTTAITE JOURNALS SJIF (2012): 3.23, SJIF (2013): 5.057, SJIF (2014): 5.871, SJIF (2015): 6.492
International Journal of Applied Services Marketing Perspectives© Pezzottaite Journals. 2038 |P a g e
In keeping with these constitutional provisions, the National Programme of Nutritional Support to Primary Education (NP-NSPE)
was launched as a Centrally Sponsored Scheme on 15th August 1995, in 2,408 blocks in the country as a dry ration scheme, to
enhance enrolment, retention and attendance and simultaneously improve nutritional levels among children. The Scheme was
revised in its content and coverage from time to time. The hot cooked mid-day meal is being served to the children of elementary
classes from 2004. The Scheme saw a significant development during 11th Plan and many studies reported that this Scheme has a
positive impact on various educational parameters and has helped a lot in achieving the goals of SSA in universalizing the
elementary education in the country. The provision of payment of honorarium to cook-cum-helpers has opened the path for the
disadvantage sections of the society to get employment in the Scheme with dignity and pride to prepare the meal and serve to the
children.
The Mid Day Meal was extended to cover all children of upper primary classes from 2008-09. The Scheme was further revised in
April 2008 to extend the scheme to recognized as well as unrecognized Madarsas / Maqtabs supported under Sarva Shiksha
Abhiyan (SSA) as Government aided centers. The scheme was further revised during 2009-10 to enable the States / UTs to
provide nutritious and calorific meal to the children of elementary classes. It was further extended to cover children under
National Child Labour Projects (NCLP) w.e.f. 1.4.2010.
The MDM scheme has played a very important role in enhancing the enrollment and reducing the drop out in elementary schools.
During the 11th plan the scheme has been stabilized and supply bottlenecks have been removed. The independent monitoring
institutes reported that Mid-Day Meal Scheme has positive impact on attendance and retention of the children in the school. The
Office of Supreme Court Commissioner also reported that the Mid Day Meal Scheme is the most widely accepted Scheme and has
positive impact in improvement of educational indicators. Many studies have reported that Mid-Day Meal Scheme has helped in
bringing girl child into the school and bridging the gender gap1.
SCOPE OF RESEARCH
The present research work is an attempt to analyze the impact of Mid-day Meals scheme on education in terms of enrolment and
dropout rates. It also aims at analyzing its effect on enrolment, attendance, dropout ratio, learning performance, teaching
effectiveness, and empowering woman.
Malnutrition is present among the school-going children in South 24 Parganas district specifically in rural area. It prevents a child
from developing into fully functional adult, it adversary effects of universalization of primary education terms of lack of
concentration. A malnourished child is less likely to attend school regularly.
The Mid Day Meal Scheme was introduced in West Bengal Primary schools in 2003. It involves provision of lunch at free of cost
to schoolchildren on all school working days. The key objectives of the programme are:
It protects children from classroom hunger.
It aims at increasing school enrolment and attendance ratio.
It improves learning performance and teaching effectiveness.
It is observed that the drop out ratio substantially decreased after implementing the Mid-day Meal scheme.
It has increased the enrolment and improved the attendance ratio substantially.
It has helped to raise the literacy rate in the area.
It helps to universalize the primary education.
Various studies have shown that food is an incentive for many parents to send their children to schools.
OBJECTIVES OF STUDY
To collect information on Mid-day Meal Scheme to encourage primary education in our state.
To know the increase in the enrolment ratio of primary schools in South 24 Parganas and reduce the dropout ratio.
To assess the impact of the scheme on overall education reforms in South 24 Parganas as well as in West Bengal.
Encouraging poor children, belonging to disadvantage section to attend school more regularly & help them to
concentrate on classroom activities.
To portray profile of beneficiaries of MDM Scheme and their suggestion for improvement of the programme.
METHODOLOGY
The methodology included both the secondary data and primary data. For secondary data, recent government and non-government
reports on primary education, government websites, newspaper articles and journals were relied upon. The necessary primary data
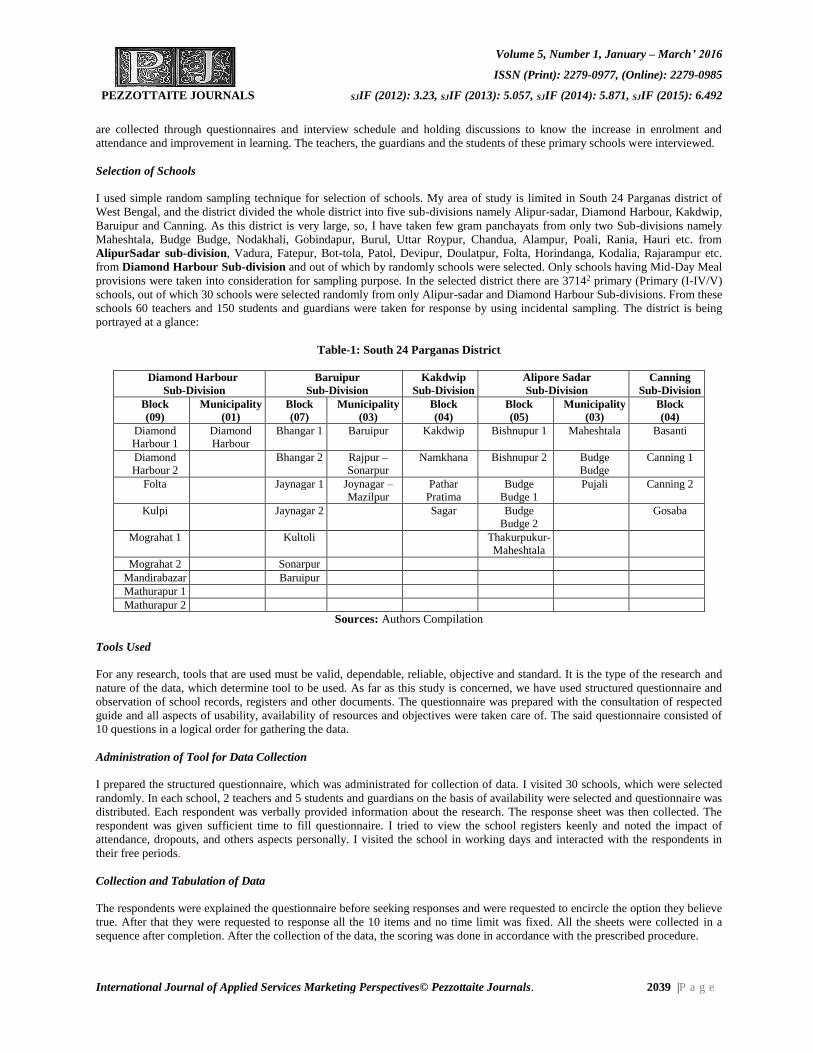
Volume 5, Number 1, January – March’ 2016
ISSN (Print): 2279-0977, (Online): 2279-0985
PEZZOTTAITE JOURNALS SJIF (2012): 3.23, SJIF (2013): 5.057, SJIF (2014): 5.871, SJIF (2015): 6.492
International Journal of Applied Services Marketing Perspectives© Pezzottaite Journals. 2039 |P a g e
are collected through questionnaires and interview schedule and holding discussions to know the increase in enrolment and
attendance and improvement in learning. The teachers, the guardians and the students of these primary schools were interviewed.
Selection of Schools
I used simple random sampling technique for selection of schools. My area of study is limited in South 24 Parganas district of
West Bengal, and the district divided the whole district into five sub-divisions namely Alipur-sadar, Diamond Harbour, Kakdwip,
Baruipur and Canning. As this district is very large, so, I have taken few gram panchayats from only two Sub-divisions namely
Maheshtala, Budge Budge, Nodakhali, Gobindapur, Burul, Uttar Roypur, Chandua, Alampur, Poali, Rania, Hauri etc. from
AlipurSadar sub-division, Vadura, Fatepur, Bot-tola, Patol, Devipur, Doulatpur, Folta, Horindanga, Kodalia, Rajarampur etc.
from Diamond Harbour Sub-division and out of which by randomly schools were selected. Only schools having Mid-Day Meal
provisions were taken into consideration for sampling purpose. In the selected district there are 37142 primary (Primary (I-IV/V)
schools, out of which 30 schools were selected randomly from only Alipur-sadar and Diamond Harbour Sub-divisions. From these
schools 60 teachers and 150 students and guardians were taken for response by using incidental sampling. The district is being
portrayed at a glance:
Table-1: South 24 Parganas District
Diamond Harbour
Sub-Division
Baruipur
Sub-Division
Kakdwip
Sub-Division
Alipore Sadar
Sub-Division
Canning
Sub-Division
Block
(09)
Municipality
(01)
Block
(07)
Municipality
(03)
Block
(04)
Block
(05)
Municipality
(03)
Block
(04)
Diamond
Harbour 1
Diamond
Harbour
Bhangar 1 Baruipur Kakdwip Bishnupur 1 Maheshtala Basanti
Diamond
Harbour 2
Bhangar 2 Rajpur –
Sonarpur
Namkhana Bishnupur 2 Budge
Budge
Canning 1
Folta Jaynagar 1 Joynagar –
Mazilpur
Pathar
Pratima
Budge
Budge 1
Pujali Canning 2
Kulpi Jaynagar 2 Sagar Budge
Budge 2
Gosaba
Mograhat 1 Kultoli Thakurpukur-
Maheshtala
Mograhat 2 Sonarpur
Mandirabazar Baruipur
Mathurapur 1
Mathurapur 2
Sources: Authors Compilation
Tools Used
For any research, tools that are used must be valid, dependable, reliable, objective and standard. It is the type of the research and
nature of the data, which determine tool to be used. As far as this study is concerned, we have used structured questionnaire and
observation of school records, registers and other documents. The questionnaire was prepared with the consultation of respected
guide and all aspects of usability, availability of resources and objectives were taken care of. The said questionnaire consisted of
10 questions in a logical order for gathering the data.
Administration of Tool for Data Collection
I prepared the structured questionnaire, which was administrated for collection of data. I visited 30 schools, which were selected
randomly. In each school, 2 teachers and 5 students and guardians on the basis of availability were selected and questionnaire was
distributed. Each respondent was verbally provided information about the research. The response sheet was then collected. The
respondent was given sufficient time to fill questionnaire. I tried to view the school registers keenly and noted the impact of
attendance, dropouts, and others aspects personally. I visited the school in working days and interacted with the respondents in
their free periods.
Collection and Tabulation of Data
The respondents were explained the questionnaire before seeking responses and were requested to encircle the option they believe
true. After that they were requested to response all the 10 items and no time limit was fixed. All the sheets were collected in a
sequence after completion. After the collection of the data, the scoring was done in accordance with the prescribed procedure.
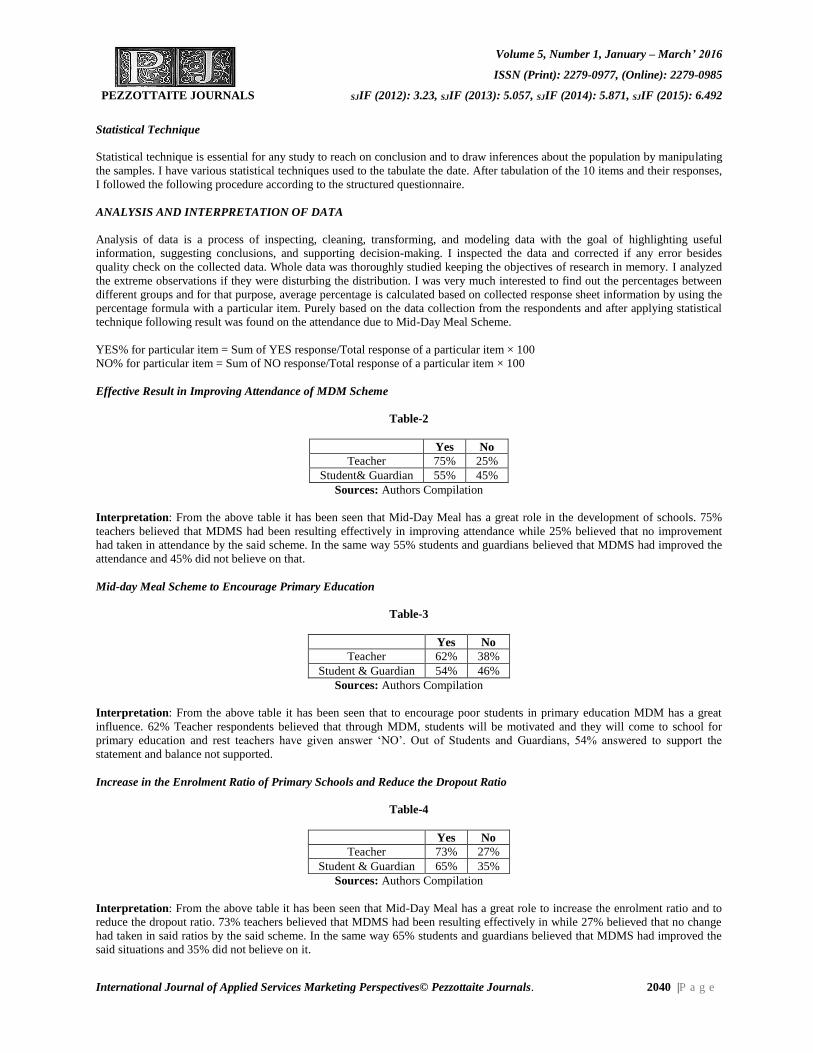
Volume 5, Number 1, January – March’ 2016
ISSN (Print): 2279-0977, (Online): 2279-0985
PEZZOTTAITE JOURNALS SJIF (2012): 3.23, SJIF (2013): 5.057, SJIF (2014): 5.871, SJIF (2015): 6.492
International Journal of Applied Services Marketing Perspectives© Pezzottaite Journals. 2040 |P a g e
Statistical Technique
Statistical technique is essential for any study to reach on conclusion and to draw inferences about the population by manipulating
the samples. I have various statistical techniques used to the tabulate the date. After tabulation of the 10 items and their responses,
I followed the following procedure according to the structured questionnaire.
ANALYSIS AND INTERPRETATION OF DATA
Analysis of data is a process of inspecting, cleaning, transforming, and modeling data with the goal of highlighting useful
information, suggesting conclusions, and supporting decision-making. I inspected the data and corrected if any error besides
quality check on the collected data. Whole data was thoroughly studied keeping the objectives of research in memory. I analyzed
the extreme observations if they were disturbing the distribution. I was very much interested to find out the percentages between
different groups and for that purpose, average percentage is calculated based on collected response sheet information by using the
percentage formula with a particular item. Purely based on the data collection from the respondents and after applying statistical
technique following result was found on the attendance due to Mid-Day Meal Scheme.
YES% for particular item = Sum of YES response/Total response of a particular item × 100
NO% for particular item = Sum of NO response/Total response of a particular item × 100
Effective Result in Improving Attendance of MDM Scheme
Table-2
Yes No
Teacher 75% 25%
Student& Guardian 55% 45%
Sources: Authors Compilation
Interpretation: From the above table it has been seen that Mid-Day Meal has a great role in the development of schools. 75%
teachers believed that MDMS had been resulting effectively in improving attendance while 25% believed that no improvement
had taken in attendance by the said scheme. In the same way 55% students and guardians believed that MDMS had improved the
attendance and 45% did not believe on that.
Mid-day Meal Scheme to Encourage Primary Education
Table-3
Yes No
Teacher 62% 38%
Student & Guardian 54% 46%
Sources: Authors Compilation
Interpretation: From the above table it has been seen that to encourage poor students in primary education MDM has a great
influence. 62% Teacher respondents believed that through MDM, students will be motivated and they will come to school for
primary education and rest teachers have given answer ‘NO’. Out of Students and Guardians, 54% answered to support the
statement and balance not supported.
Increase in the Enrolment Ratio of Primary Schools and Reduce the Dropout Ratio
Table-4
Yes No
Teacher 73% 27%
Student & Guardian 65% 35%
Sources: Authors Compilation
Interpretation: From the above table it has been seen that Mid-Day Meal has a great role to increase the enrolment ratio and to
reduce the dropout ratio. 73% teachers believed that MDMS had been resulting effectively in while 27% believed that no change
had taken in said ratios by the said scheme. In the same way 65% students and guardians believed that MDMS had improved the
said situations and 35% did not believe on it.
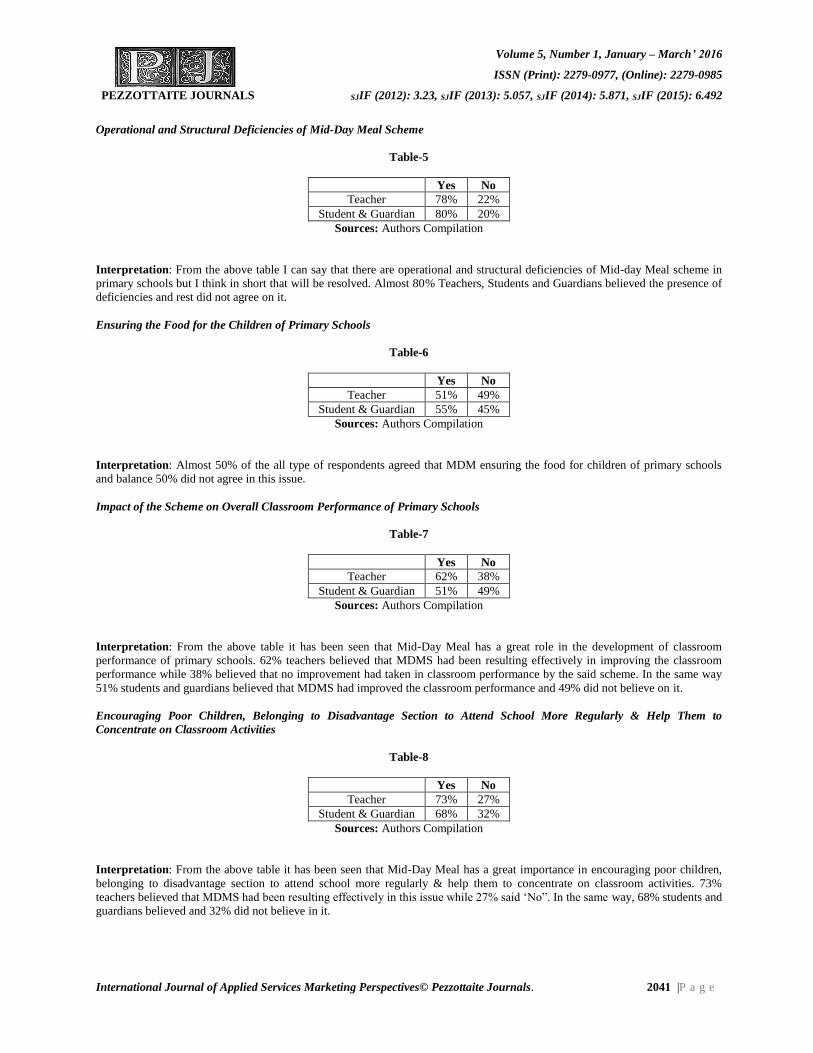
Volume 5, Number 1, January – March’ 2016
ISSN (Print): 2279-0977, (Online): 2279-0985
PEZZOTTAITE JOURNALS SJIF (2012): 3.23, SJIF (2013): 5.057, SJIF (2014): 5.871, SJIF (2015): 6.492
International Journal of Applied Services Marketing Perspectives© Pezzottaite Journals. 2041 |P a g e
Operational and Structural Deficiencies of Mid-Day Meal Scheme
Table-5
Yes No
Teacher 78% 22%
Student & Guardian 80% 20%
Sources: Authors Compilation
Interpretation: From the above table I can say that there are operational and structural deficiencies of Mid-day Meal scheme in
primary schools but I think in short that will be resolved. Almost 80% Teachers, Students and Guardians believed the presence of
deficiencies and rest did not agree on it.
Ensuring the Food for the Children of Primary Schools
Table-6
Yes No
Teacher 51% 49%
Student & Guardian 55% 45%
Sources: Authors Compilation
Interpretation: Almost 50% of the all type of respondents agreed that MDM ensuring the food for children of primary schools
and balance 50% did not agree in this issue.
Impact of the Scheme on Overall Classroom Performance of Primary Schools
Table-7
Yes No
Teacher 62% 38%
Student & Guardian 51% 49%
Sources: Authors Compilation
Interpretation: From the above table it has been seen that Mid-Day Meal has a great role in the development of classroom
performance of primary schools. 62% teachers believed that MDMS had been resulting effectively in improving the classroom
performance while 38% believed that no improvement had taken in classroom performance by the said scheme. In the same way
51% students and guardians believed that MDMS had improved the classroom performance and 49% did not believe on it.
Encouraging Poor Children, Belonging to Disadvantage Section to Attend School More Regularly & Help Them to
Concentrate on Classroom Activities
Table-8
Yes No
Teacher 73% 27%
Student & Guardian 68% 32%
Sources: Authors Compilation
Interpretation: From the above table it has been seen that Mid-Day Meal has a great importance in encouraging poor children,
belonging to disadvantage section to attend school more regularly & help them to concentrate on classroom activities. 73%
teachers believed that MDMS had been resulting effectively in this issue while 27% said ‘No”. In the same way, 68% students and
guardians believed and 32% did not believe in it.
Volume 5, Number 1, January – March’ 2016
ISSN (Print): 2279-0977, (Online): 2279-0985
PEZZOTTAITE JOURNALS SJIF (2012): 3.23, SJIF (2013): 5.057, SJIF (2014): 5.871, SJIF (2015): 6.492
International Journal of Applied Services Marketing Perspectives© Pezzottaite Journals. 2042 |P a g e
Mid-Day Meal Scheme and Teacher related Problems
Table-9
Yes No
Teacher 52% 48%
Student & Guardian 54% 46%
Sources: Authors Compilation
Interpretation: Almost 50% of the all type of respondents agreed that there is a relation between launching of MDM Scheme and
increasing the teacher related problems in primary schools and balance 50% did not agree in this issue, they think no such
problems are there.
Mid-Day Meal Scheme influencing women empowerment
Table-10
Yes No
Teacher 60% 40%
Student & Guardian 68% 32%
Sources: Authors Compilation
Interpretation: Most of the respondents agreed that MDM has a great influence in empowering women. 60% Teachers and 68%
Students and Guardians believed that and balance did not believe that MDM could influence the women empowerment.
Role of MDM in Elimination of Discrimination i.e., Gender Equality
Table-11
Yes No
Teacher 55% 45%
Student & Guardian 50% 50%
Sources: Authors Compilation
Interpretation: From the above table it has been seen that Mid-Day Meal has an effect to bring gender equality and 50% and
above respondents agreed that.
CONCLUSION
It may be concluded that on the basis of above criteria the effectiveness is gradually increasing in primary schools of our state i.e.,
West Bengal and MDM scheme is very important in educational reform. Still they are facing some problems related to this
Scheme but that should be resolved shortly, I hope. It can be said that MDM scheme though has been implemented but is not
being monitored properly. The scheme has given one-way provision. The feedback from the students and parents should be taken
regularly. Further, how MDM scheme is affecting the education in the schools. There are many aspects the current study could not
focus on.
REFERENCES
1. (2013, November 19-28). Joint Review Mission on Mid-Day Meal West Bengal.
2. (2011-12). District Information System for Education (DISE).
3. Mohd, Zubair Kales. (2014, June-July)). Mid-Day Meal Scheme: A study of different schools of district Jammu. SRJIS,
I/iv, 456-469.
4. Pratichi. (2005). Cooked Mid-Day Meal Programme in West Bengal: A Study of Birbhum District. Professor
AmartyaSen‟sPratichi Research Team (2005).
5. UNICEF. (2005). Situation Analysis of Mid-Day Meal Programme in Rajasthan. University of Rajasthan and
UNICEF.
Volume 5, Number 1, January – March’ 2016
ISSN (Print): 2279-0977, (Online): 2279-0985
PEZZOTTAITE JOURNALS SJIF (2012): 3.23, SJIF (2013): 5.057, SJIF (2014): 5.871, SJIF (2015): 6.492
International Journal of Applied Services Marketing Perspectives© Pezzottaite Journals. 2043 |P a g e
6. Afridi. (2005, April). Mid-day Meals: a Comparison of the Financial and Industrial Organization of the Programme in
Two States. EPW.
7. (2007). Guidelines for Mid-Day Meal, pp. 10-14. Jilla Panchayat and Department of Public Instruction Gadag.
8. (2008). Guidelines from Government of Karnataka. Akshara Dasoha for Government and Government aided
schoolchildren.
9. Krishnamurthy, Hosabedu H. R. (2007). Economic Development of India, pp. 175. Bangalore: Swapna Book House
Private Limited.
10. (2006-07). Mid Day Meal Annual Work Plan and Budget. Karnataka Department of Public Instruction Mid Day Meal
Cell, Department of Education, Government of Karnataka.
11. Ruddar, Dutta. (2002). Indian Economy, pp. 481. New Delhi: S. Chand and Company Limited.
12. Retrieved from
http://www.academia.edu/10389122/MID_-
_DAY_MEAL_SCHEME_A_STUDY_OF_DIFFERENT_SCHOOLS_OF_DISTRICT_JAMM...
*****
CHECK PLAGIARISM SERVICE
Pezzottaite Journals charges nominal fees from Journal Managers, Editors, Section Editors, Copy Editors, Layout Editors,
Proof Readers, Subscription Managers, Reviewers, Readers (Subscribers and Individuals), and Authors to get their
manuscripts scanned for plagiarism.
Indian Users
One Manuscript / article = Rs. 350.00
Two Manuscripts / articles = Rs. 350.00 x 2 = Rs. 700.00 ………As so on...
Formulae = (Numbers of Manuscripts x Rs. 350.00) = Amount to be paid as ‘Online Bank Transfer’ before
availing the services.
International Users
One Manuscript = US$15.00
Two Manuscripts = US$15.00 x 2 = US$ 30 ………As so on...
Formulae = (Numbers of Manuscripts x US$15.00) = Amount to be paid as ‘Online Bank Transfer’ before
availing the services.
Note: Total amount if computed in US$ must be converted into Indian Rupees as per Currency Exchange Rates on the day of
placing the order; Computed amount (in Rupees) is to be transferred in Pezzottaite Journals Bank Account (s); In case, where
the transacted currency is not US$, then, purchaser must consider the exchange rate of domestic country’s currency against
'US$ / Rupees' and transfer the same.
Bank details are available at: http://pezzottaitejournals.net/pezzottaite/bank_accounts_detail.php
Editor-In-Chief
Pezzottaite Journals,
24, Saraswati Lane, Bohri,
Near Modern Dewan Beverages,
Jammu Tawi – 180002,
Jammu and Kashmir, India.
(Mobile): +91-09419216270 – 71
Volume 5, Number 1, January – March’ 2016
ISSN (Print): 2279-0977, (Online): 2279-0985
PEZZOTTAITE JOURNALS SJIF (2012): 3.23, SJIF (2013): 5.057, SJIF (2014): 5.871, SJIF (2015): 6.492
International Journal of Applied Services Marketing Perspectives© Pezzottaite Journals. 2044 |P a g e
GREEN HUMAN RESOURCE PRACTICES IN BANKING INDUSTRY OF INDIA
Anshu Dixit33 Ankita Sajjan34
ABSTRACT
The environmental instability like weather shocks; climate change etc. have changed the people’s mindset to take green steps
by going green and adopting various environment management techniques. Banking sector plays an important role in
economic development and has recently come up with a new concept of ‘Green Human Resource Practices’. This consisted of
conducting banking business in such a manner that there is an overall reduction of external carbon emission and internal
carbon footprint. Being a service industry, human resource management is considered as an important segment of banking
industry where management of people and risk is considered as the two key challenges. Thus, Green Human Resource
Practices has become a key business strategy for various private and public sector organizations where Human Resource
Department plays an active part in going green at the office.
The main HR practices of banking sector includes acquiring the right people; Retaining/ Developing & Training the people;
managing people. As banking industries has already been green in few of its segment viz. online banking, e-statements etc. but
the scope still left in HR practices.
The present paper thus aims to explain the simplified meaning of Green Human Resource Practices, highlighting the various
Green banking and Human Resource Practices pursued by the banking sector of India. Further, an attempt has been made to
enumerate the Green Human Resource Practices functions and its future directions. Finally, the paper suggests some
potentially prolific HR initiatives, which can be adopted for Green Banking industries.
KEYWORDS
Green Human Resource Management Practices, Green Banking, Banking Sector, HR Practices etc.
INTRODUCTION
The present era is focusing on the environmental concerns due to the emergence of natural calamities faced by the countries all
over the world. The environmental interest has heightened around the globe irrespective of the related fields be it business, banks,
politics etc. Banking industry viewed from the angle of human resource, has its own peculiarities. It is a labor-intensive industry
where the quality of service is very dependent upon the employees. Being this the case, the professionalization of personnel
should be given a priority. Thus considering the environmental aspects, the banking industry can go green if personnel have been
managed and directed towards green economy.
Human Resource Management (HRM) is considered as an important fraction of management that deals with the human resources,
the most valuable assets of an organization. Currently, HRM is considered in the context of sustainability all over; we can expand
this statement more wisely, contending that the Green Human Resource Management is the most significant element of
sustainability. Green HRM can play a significant role in the banking sector promoting environment related issues by adopting and
following the Green HR policies and practices. Green HRM can enhance the image and brand value of the banking industry. It can
play an important role in circulating the awareness among the employees, about the preservation of natural resources and
contribute in pollution control and waste management. As the present paper deals with the topic of Green Human Resource
Practices in Banking Industry of India, an attempt will be made in the paper to analyze the present scenario and future prospects of
managing Human Resource Management (HRM) environmentally within an organization.
Being Banking, a labor-intensive industry, the focus should be made on the employees and staff to manage the banking
environment. Thus, an attempt has been made in the present paper to analyze and suggest the Green HRM practices to be adopted
in the Banking sector to make it more environment friendly. The first section of the paper comprehends about the HR practices
followed in the Banking Industry of India; analyzing its HR practices followed at each segment of the industry. Secondly we will
focus on the term in vogue i.e. ‘Green Human Resource Practices’ explaining in wide the meaning and aspects of the same,
Further in the next section we will analyze about the need of Green Human Resource Practices and lastly we will incorporate the
Green Human Resource Practices and banking industry, studying the present scenario and future prospects of Green Human
Resource Practices in the banking sector of India suggesting the Green practices that can be followed in the industry.
33Subject Expert, Institute of Management Sciences, University of Lucknow, Uttar Pradesh, India, [email protected] 34Subject Expert, Institute of Management Sciences, University of Lucknow, Uttar Pradesh, India, [email protected]
Volume 5, Number 1, January – March’ 2016
ISSN (Print): 2279-0977, (Online): 2279-0985
PEZZOTTAITE JOURNALS SJIF (2012): 3.23, SJIF (2013): 5.057, SJIF (2014): 5.871, SJIF (2015): 6.492
International Journal of Applied Services Marketing Perspectives© Pezzottaite Journals. 2045 |P a g e
HUMAN RESOURCE PRACTICES IN BANKS
The Human Resource management consists of all the management decisions and practices that have a direct affect or influence on
the human resources of an organization. The Efficient human resource management is essential for the banking industries of India.
According to the Indian Institute of Personnel Management, “Personnel Management aims to achieve both efficiency and justice
neither of which can be pursued successfully without the other. It seeks to bring together and develop into an effective
organization the men and women who make up an enterprise, enabling each to make up an enterprise, enabling each to make his
or her own best contribution to its success both as an individual and as a member of a working group. It seeks to provide fair terms
and conditions of employment and satisfying work for those employed”.
Human Resource Management practices is important for banks because banking is a labor intensive industry and as it falls under
the service sector, thus it becomes more essential to manage people to bring efficiency and optimality in banking sector. Banking
has always been and will be a "People Business". The management of people in an organization is necessary from the point of
earning as well as for the survival in the competitive scenario. Banks must articulate and emphasize on the core values in order to
attract and retain the certain customer segments. The Values consists of "sound”, “reliable", "innovative", "international", "close",
"socially responsible", "Indian", etc., which needs to be emphasized through concrete actions on the ground and it would be only
the bank’s human resource that would deliver this.
The core function of HR in banking industry is to facilitate the performance improvement among its people. Apart from that the
other factors such as the skill development, knowledge of personnel and their attitude also plays a critical role in determining the
competitiveness and efficiency within the industry. As the banking industry is very dependent upon the human resource
management, the quality of human resource indicates the value towards their clients or customers. Human resource management
(HRM) is considered as a critical organizational resource that helps to sustain the organizational effectiveness. HRM is one of the
important areas that influence a number of employees' attitudes and behavior such as the intent to leave, the levels of job
satisfaction, and the organizational commitment (Lee & Heard, 2000). According to Huselid (1995), the best Human Resource
practices areas are recruitment and selection, socialization, job design, training, communication/participation, career development,
performance management, employee reward and job security.
With the advent of competitiveness and environmental issues, the HR practices have become wider in scope. Apart from
recruitment, selection, training, development, and motivation the HR’s are playing an important role in building the instinct of
social responsibility of human resources towards the society and environment. Thus, the important HRM practices of banking
sector can be enumerated as follows:
Recruitment,
Training and skill development,
Performance appraisal,
Motivation,
Development of Green human resource practices and policies.
GREEN HUMAN RESOURCE PRACTICES
Green Human Resource Management is emerging as an important thrust area for management whose significance is increasing
manifold with the passage of time. It has come up as a field of research in the organizational studies after 1990s. The term ‘Green
Human Resource Practices’ refers to the contribution that HR policies and practices have towards the corporate environmental
agenda of protection and preservation of natural resources. Green Human Resource Practices/Management has been defined
differently by the different people, as According to Marhatta & Adhikari (2013, p.2), “Green HRM is the use of HRM policies to
promote the sustainable use of resources within organizations and, more generally promotes the causes of environment
sustainability”. Green Human Resource Practices is considered as to be directly responsible in creating green workforce that
understands, appreciates, and practices the green initiative and maintains its green objectives all throughout the HRM process of
hiring, recruiting, training, developing, compensating, and advancing the firms human capital (Mathapati, 2013). “It refers to the
policies, practices, and systems that make employees of the organization green for the benefit of the individual, society, natural
environment, and the business” (Opatha & Arulrajah, 2014, p. 104).
The term has secured its position as a hot topic in the recent research works since the awareness on environmental management
and sustainable development is significantly increasing day by day all round the globe. Green Human Resource Practices has gone
wider in scope, today; it not only includes the awareness toward environmental affairs, but also comprehends to the social as well
as economic well-being of both the organization and the employees within a broader prospect.
Volume 5, Number 1, January – March’ 2016
ISSN (Print): 2279-0977, (Online): 2279-0985
PEZZOTTAITE JOURNALS SJIF (2012): 3.23, SJIF (2013): 5.057, SJIF (2014): 5.871, SJIF (2015): 6.492
International Journal of Applied Services Marketing Perspectives© Pezzottaite Journals. 2046 |P a g e
Green HR must have two essential elements, which have to be considered importantly when we talk about the same, one is the
environment friendly HR practices and the other is preservation of knowledge capital. The green processes and practices can be
adapted in different HR functions like:
For the acquisition of human capital,
Induction of human capital,
The training of human capital,
The performance management and
The reward management
Which will have a greater impact on the overall carbon footprint of a company. Green HR initiatives can help the organizations to
bring cost efficiency without losing their human talent by bringing down the usage of paper. In green economy, there are
tremendous growth opportunities for the organizations by going green and creating a new environmental DNA, which can bring in
immense operational savings by reducing their carbon footprint.
Green HRM focuses on the employee’s environmental behavior in the company, which will have an impact on the employees, on
their consumption pattern of their private life as well (Muster & Schrader, 2011). The main objective of green HRM is to make the
employees aware about the intricacies of the environment management i.e. about what action is needed for green environment,
how does it functions, and how it helps in the environment upgradation. The Green Human Resource Practices policies and
practices aims to motivate the employees and helps in developing a sense of pride in them for being a part of the ‘go green’
initiative.
NEED FOR GREEN HUMAN RESOURCE PRACTICES
With the increasing pollution and natural disasters, the Green Human Resource Practices has become a need for the day. The last
two decades have witnessed a need for the environmental management drive all over the world as evident from the increasingly
deteriorating and depleting natural resources. In the first United Nation’s Conference on Human Environment, which was held in
June 1972 at Stockholm, the “Magna Carta” on Human Environment was declared. It has been studied and found out that to
defend and improve the human environment for present and future generation i.e. to bring sustainability in the environment have
become an imperative goal for mankind (Shaikh, 2010, p. 122). Daily and Huang (2001) has proposed that the organizations
essentially required to balance the industrial growth as well as preservation of the environment, because it has been confirmed by
the studies that by endorsing green practices in the organization, the companies may earn more profit than it was earning before
(Murari & Bhandari, 2011).On the other hand, Haden, Oyler, and Humphrey (2009) has comprehended that the environmental
objectives and strategies when integrated with the strategic development goals of a company, it results in an effective environment
management system. The Human Resource Department of an organization plays an important role in creating a sustainable culture
of the company (Harmon, Fairfield, & Wirtenberg, 2010). In the past studies, it has been identified that as much greater the
green human resource policies are, the greater is the intensity of adoption of environment management systems (EMS) and
policies by the different companies (Bohdanowicz, Zientara, & Novotna, 2011).
GREEN HUMAN RESOURCE PRACTICES IN BANKING SECTOR OF INDIA
Green Human Resource Practices and policies are creating a green workforce that can help in understanding and appreciating a
green culture in banking industries. HRM process of recruiting, hiring and training, compensating, developing, and advancing the
firm’s human capital can be followed under green initiative, which can maintain its green objectives throughout the organization
(Dutta, 2012). Banks have always been green, but here the term "green" in was denoted to ‘cash’. Now, the banks are taking green
initiative, which denotes to the eco-friendly and energy efficient options.
"Going green" can be simple and straightforward. As many businesses have:
Replaced the light bulbs with eco-friendly variants,
Has optioned for Recycled paper products,
Upgraded their technologies, and
Have gone paperless
The technology is seen to have a great contribution towards the green banking. Traditionally, banks used to rely on paper
documents which has now been replaced with the digital technology of online banking, paperless statements and similar other
transactions.
Volume 5, Number 1, January – March’ 2016
ISSN (Print): 2279-0977, (Online): 2279-0985
PEZZOTTAITE JOURNALS SJIF (2012): 3.23, SJIF (2013): 5.057, SJIF (2014): 5.871, SJIF (2015): 6.492
International Journal of Applied Services Marketing Perspectives© Pezzottaite Journals. 2047 |P a g e
The Green Human Resource Practices in banking sector of India aims to make the banking industry greener by bringing
motivation of going green among the employees. The specific HRM activities, which can bring sustainability and the natural
environment at the workplace, can be discussed below with the green in its approach:
Green Recruitment
Attracting the high-quality staff is a challenge for HR in the “war for talent” (Renwick et al., 2013, p. 2). Firms are
recognizing that gaining reputation, as a green employer has become an effective way to attract new talent
(Phillips, 2007; Stringer, 2009). As Wehrmeyer, in his study of 1996, found that the Rover Group carmaker, in Britain
has made environmental responsibilities and qualifications as a part of every job profile.
Green recruitment can be defined as the process of hiring the individuals with the knowledge, skills, approaches, and
behaviors, which are environmental in its approach within an organization. According to Wehrmeyer (1996),
“recruitment practices can support effective environmental management by making sure that new entrants are familiar
with an organization’s environmental culture and are capable of maintaining its environmental values.”
The banking sector of India has taken the initiative of green recruitment but only in terms of conducting online exams
and using digital technologies in places but has still left with the initiative of recruiting a person with environmental
approach i.e. there is no such pain been taken to recruit a person with green mind only.
Green Performance Management
The other HR practices consist of Performance management (PM). It can be defined as the process by which the
employees and staff members are prompted to enhance their professional skills to achieve the organizational goals and
objectives in better way. Talking about the banking sector, The most important aspect of PM is performance appraisal,
meeting the criteria of reliability, validity, and fairness, an effective performance appraisal helps in providing a useful
feedback to the employees and also supports towards a continuous improvements in the firm’s environmental outcomes
(Jackson et al., 2011). The green performance management lacks fully in the banking sector of India, which is required
to be integrated in the system.
Green Training and Development
Training and development can be defined as a practice that focuses on the development of employees’ skills,
knowledge, and attitudes. Green training and development helps in educating the employees about the value of going
green, it consists of training their employees a working method that helps in conservation of energy, reduction of waste,
and providing the opportunity to employees to solve the environmental problem (Zoogah, 2011).
The banking Industry of India builds the training and development program for their employees but lacks at some places
of green initiatives which is the need of the hour. Training should be such that the employees should also be adept to
educate their customers regarding the advantages of becoming more earth-friendly and buying green products.
Green Compensation
Rewards and compensation are the major HRM practices. Compensations or rewards works as a motivating tool. The
HR practices and policies are the most powerful method, which works as a link between individual’s interest and that of
the organizations. The employees can be motivated to ‘Go Green’ by compensating them with more rewards when they
take up the duties in relation to environmental responsibilities. It has been seen in the past studies that compensation has
been an effective way of motivating employees to ‘Go Green’.
Green Employee Relations
Employee relations are considered as the aspect of HR Practices in establishing the amicable employer–employee
relationship. The employee relations involve the participation of employees in the empowerment activities. The positive
employee relations are the intangible and enduring asset of a company that is considered as a source of competitive
advantage for any organization. The participation of employees in Green initiatives increases the chances of better green
management as it aligns employees’ goals, motivations, capabilities and perceptions with green management practices.
The banking sector of India is taking an initiative towards this Green HR practices by offering their employees to
indulge into the suggestion of building greener environment. Albeit the same is not followed by each banking firms but
still, being a labor intensive sector, the employees are called up to give their suggestion.
Volume 5, Number 1, January – March’ 2016
ISSN (Print): 2279-0977, (Online): 2279-0985
PEZZOTTAITE JOURNALS SJIF (2012): 3.23, SJIF (2013): 5.057, SJIF (2014): 5.871, SJIF (2015): 6.492
International Journal of Applied Services Marketing Perspectives© Pezzottaite Journals. 2048 |P a g e
Going through the Green Human Resource Practices which are followed and can be taken up fully in the banking sector of India,
there has been seen few gaps in green banking which can be filled with the further HR initiatives as suggested below, which can
make the banking Industry to be green viz.:
Banking Industry is a big user of light and as the consumption is high in banking industries, because of ATMs and
computers, they should adopt the alternative energy bandwagon, installing solar panels or buying wind power to run
their businesses.
Any technology tool that can remove the need for paper products, can help in speeding up the transaction processes, and
reduces the energy use should be adopted.
A green bank can tailor their products with eco-friendly cause. For example: A credit card could have a "green theme."
The banking Industry should now focus completely on the agenda of Paperless office.
There should be management of Recycling and waste disposal.
CONCLUSION
The banking sector of India is taking green initiatives to make the environmental condition to be favorable. The key elements of a
green bank can be enumerated as (a) Lower energy use, (b) Online and digital services (c) Green-centric products (d) recycling (e)
paperless office. Various initiatives have been taken in the terms of HR practices to make the eco-friendly banking environment in
India. The major initiative taken is in terms of the adaptation of the digital technologies, to become green by making a paperless
office. Apart from this, the recycling and energy conservation has also been adopted. However, many do not adopt the latter two.
Only few have taken initiative for it. There is still found a gap in the green banking efforts of banking sector of India. The
implementation is also considered as one of the problem, as the initiatives although been taken by the top management but is not
seriously followed at all hierarchical level and that to some extent lacks on the part of HR. On the concluding note, we can say
that HR is the major role player in implementing Green Human Resource Practices and policies in banking sector. Apart from this,
they play a crucial role in recruitment of new employees who are more responsible toward green business practices thus, indirectly
saving the Earth. In order to go green, the HR practices should be seriously adopted at banking level and the employees should
also be motivated to take an initiative to educate their customers to turn off the paper bank statements, switch to direct deposit to
eliminate paper, start using online banking to reduce waste significantly, instructed to not to take a receipt, try mobile banking,
such as banking by phone. HR has a significant opportunity to contribute to the organization’s green movement and it plays an
important role in enthusing, facilitating, and motivating employees for taking up green practices for greener business. The banking
Industry lacks with green initiative, thus the Green Human Resource Practices has become a necessity to be adopted for Green
banking Industry, and is the need of the hour.
REFERENCES
1. Bohdanowicz, P., Zientara, P., & Novotna, E. (2011). International hotel chains and environmental protection: An
analysis of Hilton’s we care! Programme (Europe, 2006–2008). Journal of Sustainable Tourism, 19, 797–
816.10.1080/09669582.2010.549566 [Taylor & Francis Online], [Web of Science ®]
2. Dutta, S. (2012). Greening people: A strategic dimension. ZENITH: International Journal of Business Economics &
Management Research, 2, 143–148.
3. Haden, S. S. P., Oyler, J. D., & Humphrey, J. H. (2009). Historical, practical, and theoretical perspectives on green
management. An Exploratory Analysis Management Decision, 47, 1041–1055.
4. Harmon, J., Fairfield, K. D., & Wirtenberg, J. (2010). Missing an opportunity: HR leadership and sustainability. People
& Strategy, 33, 16–21.
5. Jackson, S. E. Renwick, D. W. S. Jabbour, C. J. C., & Camen, M. M. (2011), State-of-the-Art and Future Directions for
Green Human Resource Management: Introduction to the Special Issue. German Journal of Research in Human
Resource Management, 25(2), 99-116.
6. Mathapati, C. M. (2013). Green HRM: A strategic facet. Tactful Management Research Journal, 2(2), 1–6.
7. Marhatta, S., & Adhikari, S. (2013). Green HRM and sustainability. International eJournal Of Ongoing Research in
Management & IT.
8. Murari, K., & Bhandari, M. (2011). Green HR: Going green with pride. Journal of Social Welfare and Management,
3, 107–110.
Volume 5, Number 1, January – March’ 2016
ISSN (Print): 2279-0977, (Online): 2279-0985
PEZZOTTAITE JOURNALS SJIF (2012): 3.23, SJIF (2013): 5.057, SJIF (2014): 5.871, SJIF (2015): 6.492
International Journal of Applied Services Marketing Perspectives© Pezzottaite Journals. 2049 |P a g e
9. Muster, V., & Schrader, U. (2011). Green work-life balance: A new perspective for Green HRM. Zeitschrift Fur
Personal Forschung, 25, 140–156.
10. Opatha, H. H. D. N. P., & Anton, Arulrajah A. (2014). Green Human Resource Management: A Simplified General
Reflections, International Business Research, 7(8), 101-112.
11. Phillips, L. (2007, August 23), Go Green to Gain the Edge over Rivals. People Management, pp. 9.
12. Renwick, D. W. S. Redman, T., & Maguire, S. (2013). Green Human Resource Management: A Review, and Research
Agenda. International Journal of Management Review, Vol. 15, pp. 1-14.
13. Shaikh, M. (2010). Green HRM: A requirement of 21st century. Journal of Research in Commerce and Management,
1, 122–127.
14. Stringer, L. (2009), The Green Workplace. Sustainable Strategies that Benefit Employees, the Environment, and the
Bottom Line. Palgrave Macmillan: New York. NY: Macmillan.
15. Wehrmeyer, W. (1996). Greening People – Human Resources and Environmental Management. Sheffield. England:
Greenleaf Publishing.
16. Zoogah, D. (2011). The dynamics of Green HRM behaviors: A cognitive social information processing approach.
Zeitschrift fur Personalforschung, 25, 117–139.
17. Retrieved from http://www.iosrjournals.org/iosr-jdms/papers/Vol12-issue4/A01240114.pdf
*****
BUSINESS PROPOSAL FOR CONFERENCES PUBLICATIONS IN JOURNALS / AS PROCEEDINGS
We are pleased to present this proposal to you as publisher of quality research findings in / as Journals / Special Issues, or
Conference Proceedings under Brand Name ‘Pezzottaite Journals’.
Pezzottaite Journals extends an opportunity to the ‘Organizers of Conferences & Seminars’ from around the world to
get ‘Plagiarism Free’ research work published in our Journals, submitted and presented by the participants within the
said events either organized by /at your Department / Institution / College or in collaboration.
As you know, the overall success of a refereed journal is highly dependent on the quality and timely reviews, keeping this in
mind, all our research journals are peer-reviewed to ensure and to bring the highest quality research to the widest possible
audience. The papers submitted with us, will follow a well-defined process of publication and on mutual consent. Publications
are made in accordance to policies and guidelines of Pezzottaite Journals. Moreover, our Journals are accessible worldwide as
‘Online’ and ‘Print’ volumes.
We strongly believe in our responsibility as stewards of a public trust. Therefore, we strictly avoid even the appearance of
conflicts-of-interest; we adhere to processes and policies that have been carefully developed to provide clear and objective
information, and it is mandate for collaborating members to follow them.
Success Stories:
We had successfully covered 4 International Conferences and received appreciation from all of them.
If you have any query, [email protected], [email protected]. We will respond to your
inquiry, shortly. If you have links / or are associated with other organizers, feel free to forward ‘Pezzottaite Journals’ to them.
It will indeed be a pleasure to get associated with an educational institution like yours.
(sd/-)
(Editor-In-Chief)
Volume 5, Number 1, January – March’ 2016
ISSN (Print): 2279-0977, (Online): 2279-0985
PEZZOTTAITE JOURNALS SJIF (2012): 3.23, SJIF (2013): 5.057, SJIF (2014): 5.871, SJIF (2015): 6.492
International Journal of Applied Services Marketing Perspectives© Pezzottaite Journals. 2050 |P a g e
MARKETING STRATEGIES ON CUSTOMER SATISFACTION
IN INDIAN INSURANCE INDUSTRY
Shahla Shahbaz35 Amulya M.36
ABSTRACT
Marketing strategy is the basic approach that the business units will use to achieve its objectives, and it consists of wide
decisions on target markets, market positioning and mix, and marketing expenditure levels. As the financial services segment
has become more competitive, financial institutions need to consider, ways of developing relationships with their existing
customers in order to defend their market share. Strategic measurement of marketing should focus on the direction that an
organization could take in relation to an exact market or set of markets in order to attain a specified set of objectives and
goals. Every insurer has to recognize that its "strategic posture" depends partially on the competitive surroundings, in part on
its share of marketing resources. An insurance company strategy is a plan for act that determines how an insurer can best
achieve its objectives in the light of the existing pressures exerted by competition, on the one hand, and its limited resources
on the other hand.
KEYWORDS
Marketing Strategy, Customer Satisfaction, Insurance Industry etc.
INTRODUCTION
The continuing lively nature of the insurance industry is making it more important than ever for Insurance professionals to
recognize the relationship between marketing attempt, sales, and profitability. Marketers have long felt that the organization that
embraces what is called the "Marketing strategy" will enjoy more stable growth and greater profitability of operations. Essentially,
the "Marketing strategy" calls for three things: (1) the integration of marketing operations throughout all departments of the
company; (2) a focus on customer satisfaction; and (3) a profit orientation, consistent with the previous two objectives.1 While the
authors have chosen to define the "Marketing strategy" in a manner closely following the methodology of those who proceeded
them with similar studies of other industries, they acknowledge that there is more than one way to state the concept. Implicit in
this and other interpretations of the "Marketing strategy" is the role of the professional marketer, who continuously consider
consumer needs and wants, develops products to satisfy these needs and wants, tests product validity, prices products, establishes
distribution channels, communicates with the public, monitors customer attitudes, revises marketing plans to reflect consumer
concerns, and finally, earns a profit.2 The integration of marketing functions throughout all departments of a company is seen by
marketers as essential to the highest levels of success in the process.
OBJECTIVES
To explain about the influence of marketing strategy on customer satisfaction in insurance company.
To describe the relationship between marketing strategy and customer satisfaction in insurance companies.
To identify customer satisfaction in insurance industry.
LITERATURE REVIEW
Nagaraja (2015) found there is example of empirical evidence to illustrate the relationship between the performance of insurance
industry and economic development. Although, there is a dearth of empirical research in developing countries and analytical
studies are limited in number, mainly in developing countries such as India, where the insurance diffusion and density are short
compared at global levels. In India, the growth rate of number of new policies issued and the insurance premium are experiencing
it is not positive trend since years ago.
Singh (2014) believes that if the service provider requirements to survive and grow then globalization competitive are very
essential to provide more value to the consumers. The Life Insurance Corporation and companies have also felt the vibrations of
the changes with the new entrants and changing critical achievement elements in the industry. The increase in the competition has
35 Research Scholar, B. N. Bahadure Institute of Management Sciences, University of Mysore, Karnataka, India,
[email protected] 36 Assistant Professor, B.N. Bahadur Institute of Management Sciences, University of Mysore, Karnataka, India,
Volume 5, Number 1, January – March’ 2016
ISSN (Print): 2279-0977, (Online): 2279-0985
PEZZOTTAITE JOURNALS SJIF (2012): 3.23, SJIF (2013): 5.057, SJIF (2014): 5.871, SJIF (2015): 6.492
International Journal of Applied Services Marketing Perspectives© Pezzottaite Journals. 2051 |P a g e
made it compulsive for the service providers to develop competencies in the areas as per the consumer's requirement. The
measurement of consumer's expectation and perceived quality is a difficult task due to its intangible nature.
Toyese (2014) issued that CRM is a greatly adopted model for managing firms’ interactions with their current and expected
customers. With CRM, more customers are retained, and nearly all the companies are able to get their customers loyalty. CRM is
a business strategy employed by the firms to understand the customer, retain customers through better customer’s experience,
absorbed new customers, and increase profitability through a decrease in customer management cost.
Rizwan et al. (2014) noted that there is significant relationship between all the independent variables and dependent variable but
the intensity of each relationship is different. Responsiveness and reliability have strong relationship with customer satisfaction
while the rest of the variables as security, awareness, ease of use and trust have moderate relationship with the customer
satisfaction. The satisfaction of the customer especially in the service business had a great importance because the satisfaction of
the customer directly linked with the customer loyalty or the repetition of using the services the modern banking has provided.
Aduloju, Olowokudejo and Obalola (2014) opined that all the three components of IT namely; IT infrastructure, IT technical skills
and IT spending have weak relationship with customer service performance. In order to realize benefits from IT investments, IT
resources must be accompanied by a judicious mix of management, economic, and human resources. While some organizations
continue to be able to record impressive performance due to their IT investments, others record low or negative IT business value.
There is the need, therefore, to better understand the sources of such variations and, consequently, the mechanisms by which IT
contributes to firm performance. For decision makers, while it is necessary for firms to invest in building and deploying IT to
improve their customer service process, the performance effects of such investments depend on the presence of certain firm-
specific resources that are complementary to IT.
Sogunro and Abiola (2014) on a case study in Lagos State, Nigeria studied the Measuring Customer Satisfaction on Life Insurance
Products and the fact of customer satisfaction and forcing all members of staff to understand the importance of the consumers
satisfaction from the highest to the lowest member of management and other parts in order to have the successful business and
retention in the market. In their study, the need for insurance companies to conduct continuous customer satisfaction surveys is
urged due to the importance of satisfaction and improvement. Seminar should be given in business conferences, educational
institutions and public places to provide information about company and its products as well as educating them about the
important of life insurance to show the image of security.
Borah (2013) found out the service factors that has the maximum impact on customer satisfaction. His research explicitly
indicated that Tangible, Accessibility and Understanding factor have the maximum impact on customer satisfaction. The company
should try to keep promise to do the work timely, should show sincere interest in customers problem, should provide prompt
service to satisfy the customer fully.
Olajide (2013) takes the case study investigating the impact of ICT adoption on insurance companies’ profitability in Nigeria. It
was inquired the imperatives for adoption of ICT to promote efficient and efficient service delivery in the insurance industry as a
strategy for acquisition of the profit maximization objectives of insurance companies in Nigeria. The outcome of the findings for
practice is that insurance corporations should scramble to update their ICT facilities regularly, in view of its impacts on quality of
service delivery and profitability. In addition, there is a need for regular training of insurance employees to maintain them abreast
of the current innovations in the use of ICT to ensure that the industry contribute positively to the economy.
Rai and Medha (2013) they examined the loyalty status of life insurance customers in India and draw a comparison between
public and private sector life insurance companies in order to provide significant insights to the life insurance companies that may
assist them in devising better loyalty practices. The findings of the research suggested that Indian customers do care about the
public sector status of a financial service provider as it entails a sense of security and stability and thus creates a difference
between customer loyalty of public sector life insurer and that of private sector life insurer.
Hafeez and Muhammad, (2012) stated that Service quality; customer satisfaction and loyalty programs are the important factors
that can increase the loyalty of a customer. Research also indicates that companies should focus on improving the quality of their
services for better and greater customer satisfaction and customer loyalty. To be successful, any company should focus on
building customer loyalty by offering quality products and by treating people how they want to be treated for better and greater
customer satisfaction.
STATEMENT OF PROBLEM
Since economic reforms in India, insurance sector has undergone tremendous changes. Insurance, which was the state monopoly
for a quite a long time, became an open and regulated market with private participants both from India and abroad. Despite of
increase in the number of private life insurance companies since 2001, LIC of India continue to be the giant market shareholder in
Volume 5, Number 1, January – March’ 2016
ISSN (Print): 2279-0977, (Online): 2279-0985
PEZZOTTAITE JOURNALS SJIF (2012): 3.23, SJIF (2013): 5.057, SJIF (2014): 5.871, SJIF (2015): 6.492
International Journal of Applied Services Marketing Perspectives© Pezzottaite Journals. 2052 |P a g e
the industry. The private insurance companies in the early years of their entry recorded a rapid growth in terms of penetration,
density, premium collection and the opening up of offices all over the country. In the initial years of competitive insurance
market, the ULIPs have shown an unprecedented growth however, after 2008, the global economic meltdown depicted a
downward trend, giving scope for replacing conventional insurance products.
SCOPE OF THE STUDY
The study focuses on marketing mix strategies. This study also attempts to analyze the growth of Indian Insurance industry since
liberalization in terms of market penetration and service quality. Demographic variables such as age, gender, occupation, income,
usage and service marketing mix elements, customer awareness, customer satisfaction and customer loyalty are analyzed from the
viewpoints of the customers.
HYPOTHESES
Larger insurance firms tend to implement or adapt the Marketing strategy to a greater amount than smaller and medium-
size life insurers.
Several life insurance companies, which adopted the Marketing strategy, tend to have better presentation than those
insurers, which do not.
MATERIALS AND METHODOLOGY
Methodology of this study has based on secondary data, which was through meta-analysis and in-depth interviews with the
frontline staff, customers and managers of insurance firms. The study groups consisted of small and medium scale industrial
customers of general insurance companies. The strata included two types of companies. Private and public section high volume,
medium volume and low volume of business. The respondents (insurance policy holders) were based in India; however, the
service providers included several multi-national companies.
FINDINGS
The primary data for the study in order to analyze the Marketing strategies of Select private life Insurance companies in India,
data was collected from a sample of 300 customers and 200 employees and 100 Insurance agents of the ICICI Prudential , HDFC
Life Insurance, Reliance Life Insurance, Birla Life Insurance, Bajaj Life Insurance located in Bangalore and Mysore city.
Opinions of both customers as well as the employees and insurance agents of the five insurance companies are taken for the study.
The data was collected with the help of a structured questionnaire containing three different segments of respondents for the study
namely the customers, employees, Insurance agents/advisors. Secondary data is used to analyze the macro economic variables of
the life insurance sector in India.
CONCLUSION
Indian life insurance industry, after opening up for the private participation since 2001, has made tremendous impact in terms of
increased penetration and density with as many as 24 life insurance companies along with the public sector giant, LIC of India.
However, the fact that only 26% of Indian population is insured itself is an indication that this industry has huge untapped market
on offer for all the players and will attract many players that are more private in the time to come. In such a highly competitive
environment, the insurance companies are focusing on product innovations and distribution, underwriting and claims
management, use of technology to integrate business process, improve service quality delivery, enhance company’s image, build
customer loyalty and thereby capture high market share.
Insurance industry is essentially a service industry where expectations of customers/policyholders are ever increasing towards
quality and quantity of insurance products available in the market. With continuous product innovations coupled with
improvement in customer services, it has been the endeavor both of the Insurers and the Regulator to codify time limit starting
from policy purchase to settlement of claims. Government as well as the Regulator (IRDA) have taken a number of initiatives to
put in place machineries like Policyholder Protection Committee, Insurance Ombudsman, besides continuous Awareness
programs to safeguard the interest of policyholders towards timely receipt of services. It is expected that the system in place with
the use of Information Technology should ensure timely delivery of services to the policyholders while helping towards orderly
growth of Insurance Penetration in the country.
REFERENCES
1. Aduloju, K., Olowokudejo, F., & Obalola, M. (2014). Information Technology and Customer Service Performance
among Insurance Companies in Nigeria. European Journal of Business and Management, 6(20), 80-87.
Volume 5, Number 1, January – March’ 2016
ISSN (Print): 2279-0977, (Online): 2279-0985
PEZZOTTAITE JOURNALS SJIF (2012): 3.23, SJIF (2013): 5.057, SJIF (2014): 5.871, SJIF (2015): 6.492
International Journal of Applied Services Marketing Perspectives© Pezzottaite Journals. 2053 |P a g e
2. Arokiasamy, A. R. A. (2012). The Effect of Marketing Mix and Customer Perception on Brand Loyalty. IOSR Journal
of Business and Management (IOSRJBM, 2278-487X, 4(1).
3. Azzam, Z. A., & Alramahi, N. M. (2010). Effect of Electronic Interactive Technologies Usage on Services Marketing
Activities Empirical Study on Banking Sector in Jordan. Int. Arab J. e-Technol., 1(4), 154-163.
4. Borah, S. (2013). A study on customer satisfaction towards private sector life insurance companies with special
reference to Kotak Mahindra and Aviva life insurance Company of Jorhat district. Indian Journal of Commerce and
Management Studies, 4(3), 19.
5. Chen, P. F., Lee, C. C., & Lee, C. F. (2012). How does the development of the life insurance market affect economic
growth? Some international evidence. Journal of International Development, 24(7), 865-893.
6. Duan, M. (2012). Strategic management and marketing strategy in insurance companies: case: China Life Insurance
Company Limited in Shifang.
7. Gulati, K., Kumar, A., & Ravi, V. (2012). E-Crm and Customer Satisfaction in Indian Insurance Industry. Asian
Journal of Business and Economics, 2(2.3).
8. Hafeez, S., & Muhammad, B. (2012). The Impact of Service Quality, Customer Satisfaction and Loyalty Programs on
Customer’s Loyalty: Evidence from Banking Sector of Pakistan. International Journal of Business and Social
Science, 3(16), 200-209.
9. Kheng, L. L., Mahamad, O., Ramayah, T., & Mosahab, R. (2010). The impact of service quality on customer loyalty: A
study of banks in Penang, Malaysia. International Journal of Marketing Studies, 2(2), p57.
10. Kumar, N., & Gangal, V. K. (2011). Customer satisfaction in new generation banks (A case study of HDFC bank).
Journal of Arts, Science & Commerce, 2(4).
11. Nagaraja, B. (2015). Performance of Insurance Industry in India: A Critical Analysis. Int. J. of Multidisciplinary and
Scientific Emerging Research, 4(1).
12. Olajide, S. F. (2013). Information and Communication Technology (ICT) and Insurance Companies Profitability in
Nigeria. Journal of Accounting, Business & Management, 20(2), 1-13.
13. Rizwan, M., Rehman, A., Rizivi, A., Khan, R., Ayuub, S., Baloch, U., & Sardar, B. (2014, July). Modern Banking and
Customer Satisfaction. International SAMANM Journal of Finance and Accounting, 2(3). ISSN 2308-2356.
14. Rai, A. K., & Medha, S. (2013). The antecedents of customer loyalty: An empirical investigation in life insurance
context. Journal of Competitiveness, 5(2), 139-163.
15. Sadeghi, T., & Farokhian, S. (2011). Survey to Measure Customer Satisfaction of the Insurance Services in
Iran. Middle-East Journal of Scientific Research, 8(3), 620-624.
16. Selvan, Kumar M., & Vimal, Priyan J. (2010, January-June). Indian Life Insurance Industry: Prospectus of Private
Sector. The Journal of Insurance Institute of India, pp. 57.
17. Singh, B. (2014). The Service Quality Provided by Public and Private Life Insurance Companies: With Special
Reference to State of Punjab.
18. Sogunro, A. B., & Abiola, B. (2014). Measuring Customer Satisfaction on Life Insurance Products (Case Study: Lagos
State, Nigeria). International Journal of Management and Business Research, 4(2), 73-80.
19. Toyese, A. Y. (2014). Customer relationship management and customer loyalty in Nigerian telecommunication industry.
Journal of Business & Retail Management Research, 8(2), 1-7.
20. Retrieved from www.managementjournal.info
21. Retrieved from www.mse.ac.in
Volume 5, Number 1, January – March’ 2016
ISSN (Print): 2279-0977, (Online): 2279-0985
PEZZOTTAITE JOURNALS SJIF (2012): 3.23, SJIF (2013): 5.057, SJIF (2014): 5.871, SJIF (2015): 6.492
International Journal of Applied Services Marketing Perspectives© Pezzottaite Journals. 2054 |P a g e
22. Retrieved from www.euacademic.org
23. Retrieved from https://books.google.co.in
24. Retrieved from https://community.data.gov.in
25. Retrieved from www.m.mydigitalfc.com
26. Retrieved from www.profit.ndtv.com
27. Retrieved from www.financialexpress.com
28. Retrieved from www.inflation.eu
29. Retrieved from www.tradingeconomics.com
30. Retrieved from https://www.focus-economics.com
31. Retrieved from http://www.ijbmi.org/papers/Vol(2)1/Version_3/K0218492.pdf
32. Retrieved from https://dialnet.unirioja.es/servlet/articulo?codigo=4499442&info=...
33. Retrieved from http://www.iiste.org/Journals/index.php/EJBM/article/view/14149
*****
PEZZOTTAITE JOURNALS MESSAGE TO AUTHORS
We require that, prior to publication; authors make warranties to these effects when signing their Agreements.
An author must not submit a manuscript to more than one journal simultaneously, nor should an author submit previously
published work, nor work which is based in substance on previously published work.
An author should present an accurate account of research performed and an objective discussion of its significance, and
present sufficient detail and reference to public sources of information so to permit the author's peers to repeat the work.
An author must cite all relevant publications. Information obtained privately, as in conversation, correspondence, or
discussion with third parties, should not be used or reported in the author's work unless fully cited, and with the permission of
that third party.
An author must make available all requisite formal and documented ethical approval from an appropriate research ethics
committee using humans or human tissue, including evidence of anonymisation and informed consent from the client (s) or
patient (s) studied.
An author must follow national and international procedures that govern the ethics of work done on animals.
An author must avoid making defamatory statements in submitted articles which could be construed as impugning any
person's reputation, for example, making allegations of dishonesty or sharp practice, plagiarism, or misrepresentation; or in
any way attacking a person's integrity or competence.
An author must ensure all named co-authors consent to publication and being named as a co-author, and, equally, that all
those persons who have made significant scientific or literary contributions to the work reported are named as co-authors.
Additionally, the author understands that co-authors are bound by these same principles.
(sd/-)
(Editor-In-Chief)
Volume 5, Number 1, January – March’ 2016
ISSN (Print): 2279-0977, (Online): 2279-0985
PEZZOTTAITE JOURNALS SJIF (2012): 3.23, SJIF (2013): 5.057, SJIF (2014): 5.871, SJIF (2015): 6.492
International Journal of Applied Services Marketing Perspectives© Pezzottaite Journals. 2055 |P a g e
STUDY ON SERVICE QUALITY AND CUSTOMER SATISFACTION OF BSNL SERVICES
Dr. U. Kanaka Rao37 D. Udaya Shekhar38
ABSTRACT
Service quality is the global evaluation or attitude of overall excellence of service. Whether an organization provides quality
services or not will depend on the customers’ feedback on the satisfaction they get from consuming the products, since higher
levels of service quality lead to higher levels of customer satisfaction. Customer satisfaction is the level of persons felt state
resulting from comparing a products perceived performance or out come in violation to customer expectation. Customer
satisfaction could be considered as comparative behaviour between inputs beforehand and post obtainments. Service quality
was found to have significant impact on customer satisfaction and value perceptions. In recent years, the BSNL revenue and
market share plunged into heavy losses due to intense competition in the Indian telecommunications sector. In this connection,
it is very important to analyze how BSNL is providing quality of services with that how BSNL customers are satisfied.
PRELUDE
The Indian telecom industry is one of the fastest growing industry in the world and it is predicted that India will have a billion
plus mobile users by 2015. Since the past decade, the telecommunication activities have gained momentum in India and required
efforts have been made by both governmental and non-governmental platforms to enhance the infrastructure. This idea is to help
modern telecommunication technologies to serve all segments of India’s culturally diverse society. According to the Telecom
Regulatory Authority of India (TRAI), India’s total telephone subscriber base is 915.19 million which includes 886.30 million
wireless and 28.89 million wireline connections as on October 2014.
In India, mobile subscribers have grown from 7.56 million to 75.94 during December 2001-2005. Between 2005 and 2009, the
subscribers grew from 75.94 to 525.94 million and by December 2010, the total mobile subscribers in India were 752.19 million
and 886.30 million as on October 2014. About one and half decade ago, there was only one organization, which was monopoly in
the market with regard to landline. In the year 2000 October 1st it was corporatized and named as Bharath Sanchar Nigam Limited
(BSNL).
PRESENT SCENARIO OF BSNL
Bharat Sanchar Nigam Limited (abbreviated BSNL) is an Indian state-owned telecommunications company headquartered in New
Delhi, India. It was incorporated on 15th September 2000. It took over the business of providing telecom services and network
management from the Central Government Departments of Telecom Services (DTS) and Telecom Operations (DTO), with effect
from 1st October 2000 on going concern basis. It is the largest service provider of fixed telephony and fourth largest mobile
service provider in India, and is a provider of broadband services.
Department of Telecommunications, had been a near monopoly during the socialist period of the Indian economy. During this
period, BSNL was the only telecom service provider in the country. MTNL was present only in Mumbai and New Delhi. During
this period, BSNL operated as a typical state-run organization, which is inefficient, slow, bureaucratic, and heavily unionized. As
a result, subscribers had to wait for years to get a telephone connection. The corporation tasted competition for the first time after
the liberalization of Indian economy in 1991, which had given rise to tough competition from the private telecom service
providers. BSNL has customer base of 121.65 million as on 31st March, 2013 and further plans to increase it to 189 million
customers by March, 2017. However, in recent years the company's revenue and market share plunged into heavy losses due to
intense competition in the Indian telecommunications sector.
Mobile Phones in India
Two politicians West Bengal Chief Minister Joythi Basu and Union Minister of communications Sukh Ram were the first official
users of cell phones in India. Basu called up ram on July 31st, 1995 to inaugurate India’s first cellular services (Modi Telstra) in
Calcutta. However, neither politicians nor the industry foresaw the telecommunication revolution in coming years. The wireless
technologies currently used in Indian telecom industry are Global System for Mobile Communications (GSM) and Code Division
Multiple Access (CDMA). There are primarily 9 GSM and 5 CDMA operators providing mobile services in 19
telecommunication circles and 4 metro cities, covering more than 2000 towns across the country. The entry of private service
37Associate Professor, Department of Business Management, Swarna Bharathi Institute of Science & Technology, Telangana,
India, [email protected] 38Assistant Professor, Department of Business Management, Madawalabu University, Ethiopia, [email protected]
Volume 5, Number 1, January – March’ 2016
ISSN (Print): 2279-0977, (Online): 2279-0985
PEZZOTTAITE JOURNALS SJIF (2012): 3.23, SJIF (2013): 5.057, SJIF (2014): 5.871, SJIF (2015): 6.492
International Journal of Applied Services Marketing Perspectives© Pezzottaite Journals. 2056 |P a g e
providers brought the inevitable need for independent regulation. The Telecom Regulation Authority of India (TRAI) was
established in the year 1997 by an act of parliament. Telecom Regulatory Authority of India Act, 1997, to regulate the
telecommunication services and to protect the interests of service providers and consumers of telecom services.
Service Quality
Service quality is the global evaluation or attitude of overall excellence of service. Whether an organization provides quality
services or not will depend on the customers’ feedback on the satisfaction they get from consuming the products, since higher
levels of service quality lead to higher levels of customer satisfaction. There is a model of service quality named SERVQUAL,
which consists of five dimensions, reliability, responsiveness, empathy, assurance and tangibility, which are used to measure the
customer satisfaction levels.
There is a model of service quality named SERVQUAL, which consists of five dimensions, reliability, responsiveness, empathy,
assurance and tangibility, which are used to measure the customer satisfaction levels. Che Aniza Bintichewel (2007) identified
that there are five dimensions, which influence customer satisfaction, loyalty and commitment they are service quality, assurance,
empathy, tangibles, security and reliability. Sandhya joshi (2011) founded that telecom companies need to focus on identifying the
drives of customer satisfaction and improving network coverage and providing personalize customer care service and providing
training to employees to handle customer problems.
Customer Satisfaction
Customer satisfaction is the level of persons felt state resulting from comparing a products perceived performance or out come in
violation to customer expectation. Customer satisfaction could be considered as comparative behaviour between inputs
beforehand and post obtainments. Service quality was found to have significant impact on customer satisfaction and value
perceptions. Customer satisfaction has been a subject of great interest to organizations and the principal objective of organizations
is to maximize profits and to minimize cost. Profit maximization can be achieved through increase in sales with lesser costs. One
of the factors that can help to increase sales is customer satisfaction. Customers are always aiming to get maximum satisfaction
from the products or services that they buy. Winning in today’s marketplace there is an essential need to build customer
relationship and not just building the products; building customer relationship means delivering superior value over competitors to
the target customers. Snajeev and Rahul (2005) stated that the quality of telecom service is the result of network designing,
planning, operating and maintenance and the management of service delivery, serviceability, accessibility can increases the level
of customer satisfaction. Rajesh Kothari et.al. (2009) concluded that the delivery of quality in service is an integral part of
business not only for success but also for customer satisfaction, achieving and maintaining customer perceived service is an
essential strategy.
STUDY OBJECTIVE
To measure the services quality and the level of customer satisfaction among BSNL mobile users.
Tools of Data Collection
The primary data is collected through a pre-tested structured questionnaire (to the sample respondents) and through personal
interviews with the executives and responses of the sample respondents. The secondary data includes published sources like
journals, magazines, Newspapers, annual reports of service provider (BSNL), Ministry of Telecommunications, Telecom
Regulatory Authority of India (TRAI), and from various websites.
Tools of the Analysis
The data collected were processed, analyzed and interpreted by applying statistical tools like those that descriptive statistics
(mean, mode, median) were used.
Sample of Study
For the present study, the samples were chosen from the customers who are having the BSNL mobile connections. A sample of
1000 respondents based on stratified random sampling has been chosen for the study (arrived at by considering 0.377% of mobile
users in Khammam district, as on June 2013, i.e. 2,65,000). Sample respondents were selected from 46 mandals of Khammam
district and 0.0357% of mobile users from each mandals population constitute the sample for the study. The respondents are from
various strata Viz. employees, businesspersons, housewives, students chosen as respondents for this present study. The
geographical area of the study is restricted to khammam district only. In the first stage, stratified sampling is done from 46
Volume 5, Number 1, January – March’ 2016
ISSN (Print): 2279-0977, (Online): 2279-0985
PEZZOTTAITE JOURNALS SJIF (2012): 3.23, SJIF (2013): 5.057, SJIF (2014): 5.871, SJIF (2015): 6.492
International Journal of Applied Services Marketing Perspectives© Pezzottaite Journals. 2057 |P a g e
mandals of the district and in the second stage; convenient sampling was used to identify the villages. In the final stage, simple
random sampling is applied for selecting the respondents. A total of 1000 respondents are selected for the study.
SCOPE OF STUDY
The present study is aimed at understanding the BSNL services and to measure the services quality and the level of customer
satisfaction among BSNL mobile users. The scope of the present study is entirely focused on the mobile services rendered by
BSNL in the Khammam District of Telangana state.
SERVICE QUALITY MODEL OR THE ‘GAP’ MODEL
A customer's expectation of a particular service is determined by factors such as recommendations, personal needs and
experiences. The expected service and the perceived service sometimes may not be equal, thus leaving a gap. The service quality
model or the ‘GAP model’ developed by a group of authors- Kevin, Kristine and Berry at Texas and North Carolina in 1985,
highlights the main requirements for delivering high service quality. Customers generally have a tendency to compare the service
they 'experience' with the service they ‘expect’. If the experience does not match the expectation, there arises a gap. Five
determinants that may influence the appearance of a gap were described by Parasuraman, Zeithaml and Berry. SERVQUAL
model consists of reliability, responsiveness, assurance, empathy and tangibles.
Reliability Dimension: Customer perceives the reliability dimension to be the most important of the five SERQUAL dimensions.
In general, it reflects on consistency and dependability of firm’s performance. Customers are ready to spend more money if only
the service provider will show up and conduct the transaction as promised. This dimension reflects on keeping the promises, bill
the customer accurately, keeping accurate records, and performing the services correctly at the very first instance.
Descriptive Statistics: While analyzing the descriptive statistics, the mean value of all the attributes is less than 3.56,
which means the tendency of all attributes is towards neutrality. So mode value is considered for analyzing and
interpreting the data.
Table-1: Reliability Dimension
Reliability Dimension N Mean Median Mode Std. Deviation Skewness Kurtosis
Showing the keen interest in solving
the problems of the customers 1000 3.56 4 5 1.395 -0.47 -1.178
Performing required services correctly
in the very first instance 1000 3.23 4 4 1.331 -0.403 -1.047
Providing the services at the time it
promises to do so 1000 3.2 3 4 1.38 -0.187 -1.273
Sources: Primary Data
Table 1 reveals that more number of respondents agreed that BSNL is showing keen interest in solving the problems of the
customers. The analysis also indicates that the majority of the customers have agreed with the fact that the BSNL performing
required services correctly in the very first instance and BSNL providing the services at the time it promises to do so. Skewness of
the distribution of data is negative for all the factors indicating that the numbers of respondents who have given positive response
are more than the number of respondents who have given negative or neutral response. Kurtosis of the distribution is platykurtic,
which indicates that there are no extreme responses in the distribution.
Responsiveness Dimension: Responsiveness reflects a firm’s commitment to provide its services in a timely manner. As such,
the responsiveness dimension of SERQUAL concerns the willingness and readiness of employees to provide a service.
Responsiveness also reflects the preparedness of the firms to provide a service.
Table-2: Responsiveness Dimension
Responsiveness Dimension N Mean Median Mode Std. Deviation Skewness Kurtosis
Updating of the customers about the new service 1000 3.29 4 4 1.378 -0.245 -1.253
Willingness of the employees to help the customer 1000 3.12 3 4 1.347 -0.267 -1.179
Positive response of Employees towards customers 1000 3.08 3 4 1.391 -0.107 -1.325
Sources: Primary Data
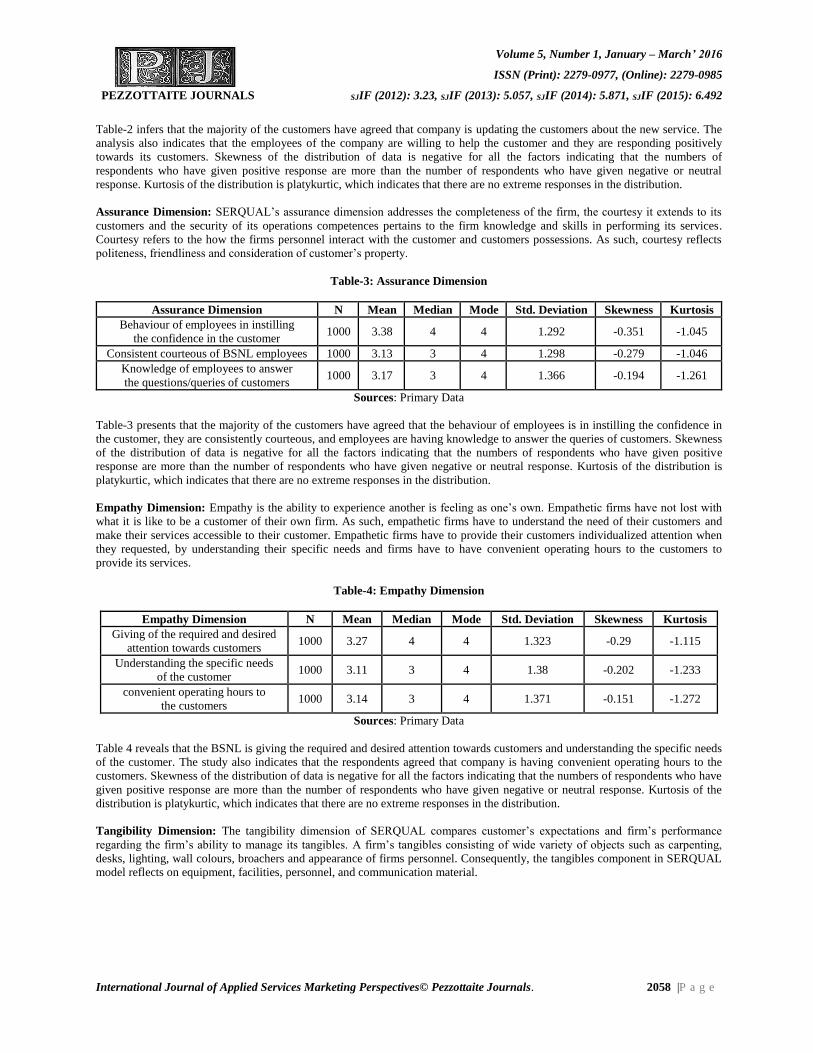
Volume 5, Number 1, January – March’ 2016
ISSN (Print): 2279-0977, (Online): 2279-0985
PEZZOTTAITE JOURNALS SJIF (2012): 3.23, SJIF (2013): 5.057, SJIF (2014): 5.871, SJIF (2015): 6.492
International Journal of Applied Services Marketing Perspectives© Pezzottaite Journals. 2058 |P a g e
Table-2 infers that the majority of the customers have agreed that company is updating the customers about the new service. The
analysis also indicates that the employees of the company are willing to help the customer and they are responding positively
towards its customers. Skewness of the distribution of data is negative for all the factors indicating that the numbers of
respondents who have given positive response are more than the number of respondents who have given negative or neutral
response. Kurtosis of the distribution is platykurtic, which indicates that there are no extreme responses in the distribution.
Assurance Dimension: SERQUAL’s assurance dimension addresses the completeness of the firm, the courtesy it extends to its
customers and the security of its operations competences pertains to the firm knowledge and skills in performing its services.
Courtesy refers to the how the firms personnel interact with the customer and customers possessions. As such, courtesy reflects
politeness, friendliness and consideration of customer’s property.
Table-3: Assurance Dimension
Assurance Dimension N Mean Median Mode Std. Deviation Skewness Kurtosis
Behaviour of employees in instilling
the confidence in the customer 1000 3.38 4 4 1.292 -0.351 -1.045
Consistent courteous of BSNL employees 1000 3.13 3 4 1.298 -0.279 -1.046
Knowledge of employees to answer
the questions/queries of customers 1000 3.17 3 4 1.366 -0.194 -1.261
Sources: Primary Data
Table-3 presents that the majority of the customers have agreed that the behaviour of employees is in instilling the confidence in
the customer, they are consistently courteous, and employees are having knowledge to answer the queries of customers. Skewness
of the distribution of data is negative for all the factors indicating that the numbers of respondents who have given positive
response are more than the number of respondents who have given negative or neutral response. Kurtosis of the distribution is
platykurtic, which indicates that there are no extreme responses in the distribution.
Empathy Dimension: Empathy is the ability to experience another is feeling as one’s own. Empathetic firms have not lost with
what it is like to be a customer of their own firm. As such, empathetic firms have to understand the need of their customers and
make their services accessible to their customer. Empathetic firms have to provide their customers individualized attention when
they requested, by understanding their specific needs and firms have to have convenient operating hours to the customers to
provide its services.
Table-4: Empathy Dimension
Empathy Dimension N Mean Median Mode Std. Deviation Skewness Kurtosis
Giving of the required and desired
attention towards customers 1000 3.27 4 4 1.323 -0.29 -1.115
Understanding the specific needs
of the customer 1000 3.11 3 4 1.38 -0.202 -1.233
convenient operating hours to
the customers 1000 3.14 3 4 1.371 -0.151 -1.272
Sources: Primary Data
Table 4 reveals that the BSNL is giving the required and desired attention towards customers and understanding the specific needs
of the customer. The study also indicates that the respondents agreed that company is having convenient operating hours to the
customers. Skewness of the distribution of data is negative for all the factors indicating that the numbers of respondents who have
given positive response are more than the number of respondents who have given negative or neutral response. Kurtosis of the
distribution is platykurtic, which indicates that there are no extreme responses in the distribution.
Tangibility Dimension: The tangibility dimension of SERQUAL compares customer’s expectations and firm’s performance
regarding the firm’s ability to manage its tangibles. A firm’s tangibles consisting of wide variety of objects such as carpenting,
desks, lighting, wall colours, broachers and appearance of firms personnel. Consequently, the tangibles component in SERQUAL
model reflects on equipment, facilities, personnel, and communication material.
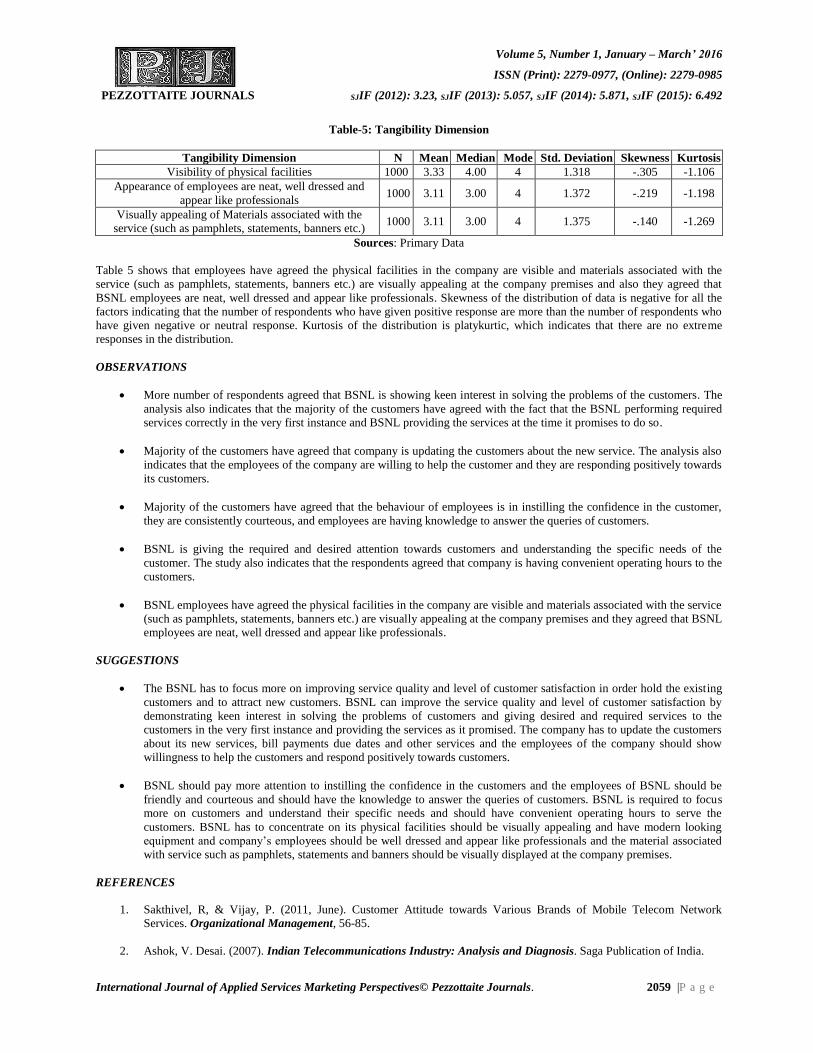
Volume 5, Number 1, January – March’ 2016
ISSN (Print): 2279-0977, (Online): 2279-0985
PEZZOTTAITE JOURNALS SJIF (2012): 3.23, SJIF (2013): 5.057, SJIF (2014): 5.871, SJIF (2015): 6.492
International Journal of Applied Services Marketing Perspectives© Pezzottaite Journals. 2059 |P a g e
Table-5: Tangibility Dimension
Tangibility Dimension N Mean Median Mode Std. Deviation Skewness Kurtosis
Visibility of physical facilities 1000 3.33 4.00 4 1.318 -.305 -1.106
Appearance of employees are neat, well dressed and
appear like professionals 1000 3.11 3.00 4 1.372 -.219 -1.198
Visually appealing of Materials associated with the
service (such as pamphlets, statements, banners etc.) 1000 3.11 3.00 4 1.375 -.140 -1.269
Sources: Primary Data
Table 5 shows that employees have agreed the physical facilities in the company are visible and materials associated with the
service (such as pamphlets, statements, banners etc.) are visually appealing at the company premises and also they agreed that
BSNL employees are neat, well dressed and appear like professionals. Skewness of the distribution of data is negative for all the
factors indicating that the number of respondents who have given positive response are more than the number of respondents who
have given negative or neutral response. Kurtosis of the distribution is platykurtic, which indicates that there are no extreme
responses in the distribution.
OBSERVATIONS
More number of respondents agreed that BSNL is showing keen interest in solving the problems of the customers. The
analysis also indicates that the majority of the customers have agreed with the fact that the BSNL performing required
services correctly in the very first instance and BSNL providing the services at the time it promises to do so.
Majority of the customers have agreed that company is updating the customers about the new service. The analysis also
indicates that the employees of the company are willing to help the customer and they are responding positively towards
its customers.
Majority of the customers have agreed that the behaviour of employees is in instilling the confidence in the customer,
they are consistently courteous, and employees are having knowledge to answer the queries of customers.
BSNL is giving the required and desired attention towards customers and understanding the specific needs of the
customer. The study also indicates that the respondents agreed that company is having convenient operating hours to the
customers.
BSNL employees have agreed the physical facilities in the company are visible and materials associated with the service
(such as pamphlets, statements, banners etc.) are visually appealing at the company premises and they agreed that BSNL
employees are neat, well dressed and appear like professionals.
SUGGESTIONS
The BSNL has to focus more on improving service quality and level of customer satisfaction in order hold the existing
customers and to attract new customers. BSNL can improve the service quality and level of customer satisfaction by
demonstrating keen interest in solving the problems of customers and giving desired and required services to the
customers in the very first instance and providing the services as it promised. The company has to update the customers
about its new services, bill payments due dates and other services and the employees of the company should show
willingness to help the customers and respond positively towards customers.
BSNL should pay more attention to instilling the confidence in the customers and the employees of BSNL should be
friendly and courteous and should have the knowledge to answer the queries of customers. BSNL is required to focus
more on customers and understand their specific needs and should have convenient operating hours to serve the
customers. BSNL has to concentrate on its physical facilities should be visually appealing and have modern looking
equipment and company’s employees should be well dressed and appear like professionals and the material associated
with service such as pamphlets, statements and banners should be visually displayed at the company premises.
REFERENCES
1. Sakthivel, R, & Vijay, P. (2011, June). Customer Attitude towards Various Brands of Mobile Telecom Network
Services. Organizational Management, 56-85.
2. Ashok, V. Desai. (2007). Indian Telecommunications Industry: Analysis and Diagnosis. Saga Publication of India.
Volume 5, Number 1, January – March’ 2016
ISSN (Print): 2279-0977, (Online): 2279-0985
PEZZOTTAITE JOURNALS SJIF (2012): 3.23, SJIF (2013): 5.057, SJIF (2014): 5.871, SJIF (2015): 6.492
International Journal of Applied Services Marketing Perspectives© Pezzottaite Journals. 2060 |P a g e
3. Amulya, M. (2011, June). Market Competence of BSNL in the Present Dynamic Telecom World. Indian Journal of
Marketing, 13-21.
4. Sandell, P. (2009). Bharat Sanchar Nigam Limited - Ruling the Indian Telecommunication Market. Center for
Management Research.
5. Sinha, P. K., & Sanchari, Singh. (2010, December). Telecom Sector: Business Risks and Management. The
Management Accountant.
6. (2010). Opportunity India – Telecom Industry (CII Report).
7. Indian Telecom Statistics 2009. Ministry of Communications, Government of India.
8. Retrieved from http://dxm.org/techonomist/news/cellcal.html
9. Retrieved from https://en.wikipedia.org/wiki/Service_quality#Dimensions_of_service_quality
10. Retrieved from https://en.wikipedia.org/wiki/Service_quality#Definition
11. Retrieved from https://en.wikipedia.org/wiki/Service_quality
12. Retrieved from http://shodhganga.inflibnet.ac.in/bitstream/10603/23870/8/08_chapter3.pdf
13. Retrieved from http://business.mapsofindia.com/communications-industry/overview.html
14. Retrieved from http://www.indianmirror.com/indian-industries/telecom.html
15. Retrieved from https://www.highbeam.com/doc/1P2-10958101.html
16. Retrieved from https://www.highbeam.com/doc/1P3-1022198871.html
*****
CALL TO JOIN AS MEMBER OF EDITORIAL ADVISORY BOARD
We present you an opportunity to join Pezzottaite Journals as member of ‘Editorial Advisory Board’ and ‘Reviewers
Board’. Pezzottaite Journals seek academicians and corporate people from around the world who are interested in serving our
voluntarily ‘Editorial Advisory Board’ and ‘Reviewers Board’. Your professional involvement will greatly benefit the success
of Pezzottaite Journals.
Please forward below stated details at [email protected].
Updated Resume, Scanned Photograph, and Academic Area of Interest.
For Paper Submission & Clarification or Suggestion, Email Us @:
[email protected], [email protected]
Editor-In-Chief
Pezzottaite Journals,
24, Saraswati Lane, Bohri,
Near Modern Dewan Beverages,
Jammu Tawi – 180002,
Jammu and Kashmir, India.
(Mobile): +91-09419216270 – 71.
(sd/-)
(Editor-In-Chief)
Volume 5, Number 1, January – March’ 2016
ISSN (Print): 2279-0977, (Online): 2279-0985
PEZZOTTAITE JOURNALS SJIF (2012): 3.23, SJIF (2013): 5.057, SJIF (2014): 5.871, SJIF (2015): 6.492
International Journal of Applied Services Marketing Perspectives© Pezzottaite Journals. 2061 |P a g e
A STUDY OF ONLINE SHOPPING OF JEWELLERY CONSUMER BEHAVIOUR AND
PERCEPTION REFERRED TO MANGALORE CITY
Dr. B. Shekhar39 Sharath40
INTRODUCTION
As a matter of fact that the computer literacy rate is increasing by leaps and bounds in India especially school and college going
students and those who are working in any organisations. The resulted into the shopping behaviour drastically. Increasing
computer literacy rate has changed the life-style and buying behaviour of the consumers everywhere in urban areas especially
state capitals. The current transition of our life has emerged a new opportunity for all marketers across the globe. Retailing has
become one of the essential characteristics in the Internet era. According to UCLA Centre for Communication Policy (2001),
online shopping has become the third most popular Internet activity, immediately following e-mail using/instant messaging and
web browsing. It is even more popular than seeking out entertainment information and news, two commonly thought of activities
when considering what Internet users do when online. The online shopping of jewellery is not very popular in India. Several
professionals and leading academicians including Suja R. Nair consider jewellery-buying behaviour as a complex buying
behaviour because of expensiveness. The jewellery also requires a bit expertise or technical knowledge to understand and check
whether it is pure as per standard and hallmark or not. This type of buying behaviour creates hesitation in consumer’s mind and
restricts them to shop from anywhere. Jewellery buying behaviour being a complex in its nature involves higher risk and hence
gives less scope to shop for fun.
BACKGROUND OF STUDY
The consumer is more cusses towards the price and offers they always hunt the offers and discount. If the customer buy from
retail outlets there is extra charge, they have to pay as a profit to the retailers. Therefore, these online shopping sites offer the
product from directly from the company, they provide the various discount and offers, and it will help the consumer to buy the
product from these sites. Online shopping (also called online buying and Internet shopping/buying) refers to the buying products
or services through any web site of company and/or on the internet. The consumer behaviour that is associated with online
shopping is similar to the traditional shopping behaviour except the difference of going to market place and evaluating products in
physical forms. In online shopping behaviour, we need to visit any market space instead of market place and we evaluate the
products on computer screen with the help of information motioned there too. The process consists of five steps similar to those
associated with traditional shopping behaviour (Liang and Lai 2000). In the typical online shopping process, when potential
consumers recognize a need for some merchandise or service, they go to the Internet and search for need-related information. This
study tries to analysis the buyer behaviour towards the online shopping regarding jewellery.
OBJECTIVES
To study the online shopping behaviour of customer regarding jewellery in the Mangalore city.
METHODOLOGY
This study has been conducted based on primary and secondary data. The primary data based on the structured questionnaire and
secondary data based on past record like journal and magazine and published reports. Data will be analyzed based on percentage.
REVIEW OF LITERATURE
Vijaya (1991), Consumer behaviour is exhibition of the people when they buy, plan and use the economic goods and services.
When the buying habit increases on this economic goods the wealth of product and services produced in the country make our
country strong. There are many alternative suppliers, i.e., substitute products are available to consumers, who make decision to
buy products. Therefore, a seller, most of his time, seeks buyer and tries to please them. There are some buyers they are buy the
product from particular buyer these are called patronage motives.
Bhuvaneswari (2015) strongly believe that gold ornaments are very popular in the Indian culture and there is no occasion where
the Indian are not used the gold. Gold are used in all occasion and to gift other persons. Investment in gold gives a standard
assurance in value and serves the consumers as an ornamental beauty. Because of this reason, there are businesses in variety of
jewels. There is high demand for the gold even the price is high. This type of attitude due to the resale of the gold.
39Associate Professor & Research Guide, Department of Studies and Research in Commerce, Tumkur University, Karnataka,
India, [email protected] 40Assistant Professor, Department of Commerce, Alva’s College, Karnataka, India, [email protected]
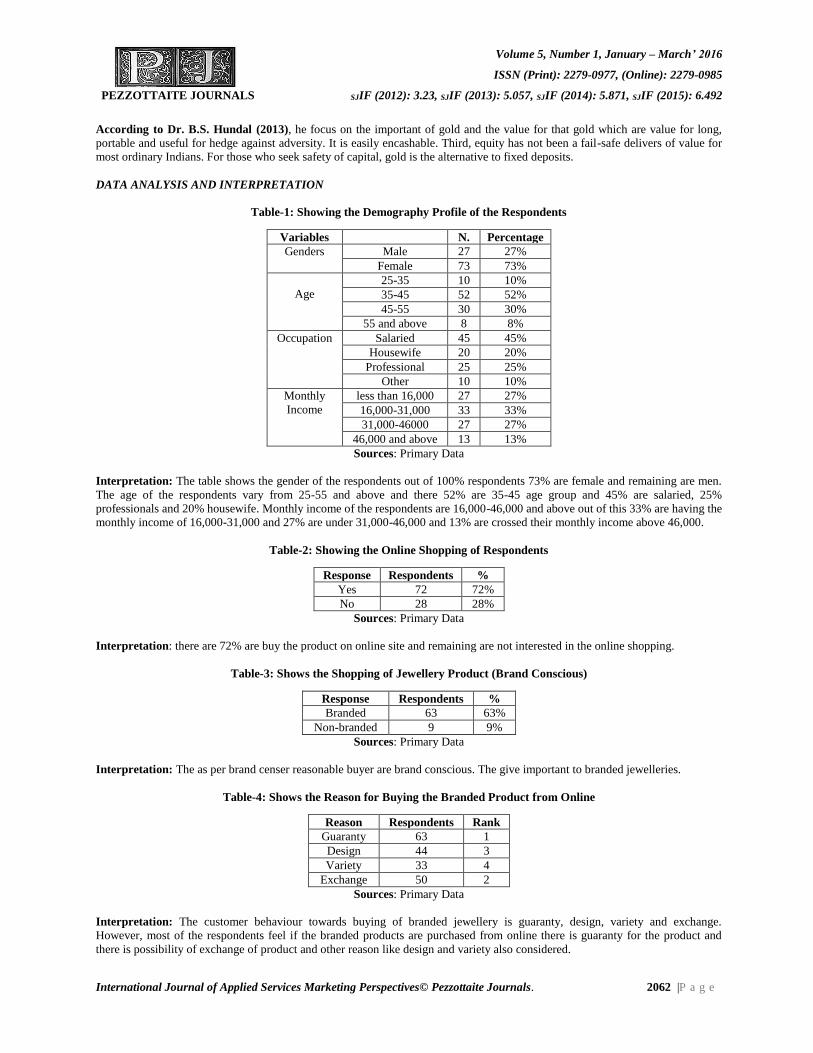
Volume 5, Number 1, January – March’ 2016
ISSN (Print): 2279-0977, (Online): 2279-0985
PEZZOTTAITE JOURNALS SJIF (2012): 3.23, SJIF (2013): 5.057, SJIF (2014): 5.871, SJIF (2015): 6.492
International Journal of Applied Services Marketing Perspectives© Pezzottaite Journals. 2062 |P a g e
According to Dr. B.S. Hundal (2013), he focus on the important of gold and the value for that gold which are value for long,
portable and useful for hedge against adversity. It is easily encashable. Third, equity has not been a fail-safe delivers of value for
most ordinary Indians. For those who seek safety of capital, gold is the alternative to fixed deposits.
DATA ANALYSIS AND INTERPRETATION
Table-1: Showing the Demography Profile of the Respondents
Variables N. Percentage
Genders Male 27 27%
Female 73 73%
Age
25-35 10 10%
35-45 52 52%
45-55 30 30%
55 and above 8 8%
Occupation Salaried 45 45%
Housewife 20 20%
Professional 25 25%
Other 10 10%
Monthly
Income
less than 16,000 27 27%
16,000-31,000 33 33%
31,000-46000 27 27%
46,000 and above 13 13%
Sources: Primary Data
Interpretation: The table shows the gender of the respondents out of 100% respondents 73% are female and remaining are men.
The age of the respondents vary from 25-55 and above and there 52% are 35-45 age group and 45% are salaried, 25%
professionals and 20% housewife. Monthly income of the respondents are 16,000-46,000 and above out of this 33% are having the
monthly income of 16,000-31,000 and 27% are under 31,000-46,000 and 13% are crossed their monthly income above 46,000.
Table-2: Showing the Online Shopping of Respondents
Response Respondents %
Yes 72 72%
No 28 28%
Sources: Primary Data
Interpretation: there are 72% are buy the product on online site and remaining are not interested in the online shopping.
Table-3: Shows the Shopping of Jewellery Product (Brand Conscious)
Response Respondents %
Branded 63 63%
Non-branded 9 9%
Sources: Primary Data
Interpretation: The as per brand censer reasonable buyer are brand conscious. The give important to branded jewelleries.
Table-4: Shows the Reason for Buying the Branded Product from Online
Reason Respondents Rank
Guaranty 63 1
Design 44 3
Variety 33 4
Exchange 50 2
Sources: Primary Data
Interpretation: The customer behaviour towards buying of branded jewellery is guaranty, design, variety and exchange.
However, most of the respondents feel if the branded products are purchased from online there is guaranty for the product and
there is possibility of exchange of product and other reason like design and variety also considered.
Volume 5, Number 1, January – March’ 2016
ISSN (Print): 2279-0977, (Online): 2279-0985
PEZZOTTAITE JOURNALS SJIF (2012): 3.23, SJIF (2013): 5.057, SJIF (2014): 5.871, SJIF (2015): 6.492
International Journal of Applied Services Marketing Perspectives© Pezzottaite Journals. 2063 |P a g e
Table-5: Shows the Factors Considered while Buying the Jewellery from Online
Factors Respondents Rank
Offers and discount 63 1
Payment 44 5
Faction and design 52 3
Convenient 45 4
Brand name 59 2
Sources: Primary Data
Interpretation: There are few factors, which influence the buying of jewellery from online shop. The most important factor
which influence is offers and discount, brand name, faction and design and other factor like payment and convenient also support
the buying behaviour.
Table-6: Showing the Problem Faced by the Customer while Buying from Online Site
Problems Respondents %
Delivery of Product 44 67%
Mismatch of the Product 12 18%
Defect in Product Nil Nil
Out of Stock 07 11%
Sources: Primary Data
Interpretation: The online shopping too has some demerit the customer had faced some problem while shopping in the online
shops. 67% of respondents says the time of delivery is not punctual, 18% are faced the miss-match in the product and remaining
11% are find when they about to order it shows out of stock in their site.
FINDINGS OF STUDY
There is more number of female respondents.
There are 52% are middle age respondents.
Only 63% of the respondents are shopping for jewellery remaining 9% are other items.
The important reason for the buying of the jewellery in online site because of guaranty and exchange.
The factor, which motivates the customer to buy from online, is the brand and the offers and discounts.
The online sites too have limitation like the delivery time, miss match of product and so on.
CONCLUSION
The study shows that the willingness for online shopping is very high. People across the different ages are highly encouraged for
online shopping. The people are motivated for various reasons viz. product variety and design, fashionable and trendiness,
convenience, effective presentation, gifts and offers, payment facility etc. On the contrary, the result of the survey of online
shopping behaviour for jewellery is a bit upset because the survey was taken for 100 respondents out of which only 60% are
buying some kind of gold from online this is due to the family structure and the social censer. In most of the situation, the family
member decides the product design and cost in that situation, it is difficult to satisfy the family members.
REFERENCES
1. Bhuvaneswari, G. D. (2015, July 07). Buying Behaviour of women towards Gold Ornaments. International Journal of
Advance Research in Computer Science and Management Studies, Volume 3, 50, 51. ISSN 2321-7782 (online).
2. Dr. B. S. Hundal, (2013, November–December). Herd Behaviour and Gold Investments - A Perceptual study of Retail
Investors. Journal of Business and Management, 15(4), 63. ISSN: 2278487X, P-ISSN 2319-7668
3. Vijaya, D. (2014, October 10). Consumer Behaviour in Jewellery Market. Indian Journal of Research, 1. ISSN 2250-
1991.
4. Retrieved from http://www.termpaperwarehouse.com/essay-on/Consumer-Behavior/285156
Volume 5, Number 1, January – March’ 2016
ISSN (Print): 2279-0977, (Online): 2279-0985
PEZZOTTAITE JOURNALS SJIF (2012): 3.23, SJIF (2013): 5.057, SJIF (2014): 5.871, SJIF (2015): 6.492
International Journal of Applied Services Marketing Perspectives© Pezzottaite Journals. 2064 |P a g e
5. Retrieved from
http://www.researchgate.net/publication/262818455_HRD_Climate_and_Knowledge_Management_Practices-_Em...
6. Retrieved from http://melody.syr.edu/pzhang/publications/AMCIS02_Li_Zhang.pdf
7. Retrieved from
http://www.slideshare.net/EKTAKAPRI/feamleconsumerbehaviortowardonlineshopping-151202070028lva1app68...
8. Retrieved from https://www.scribd.com/doc/302365163/5-IJHRMD-A-STUDY-ON-STUDENTS...
9. Retrieved from
https://www.scribd.com/doc/302365163/5-IJHRMD-A-STUDY-ON-STUDENTS-PREFERENCES-AND-
SATISFACTION-TOWAR...
*****
CALL TO JOIN AS MEMBER OF EDITORIAL ADVISORY BOARD
We present you an opportunity to join Pezzottaite Journals as member of ‘Editorial Advisory Board’ and ‘Reviewers
Board’. Pezzottaite Journals seek academicians and corporate people from around the world who are interested in serving our
voluntarily ‘Editorial Advisory Board’ and ‘Reviewers Board’. Your professional involvement will greatly benefit the success
of Pezzottaite Journals.
Please forward below stated details at [email protected].
Updated Resume, Scanned Photograph, and Academic Area of Interest.
For Paper Submission & Clarification or Suggestion, Email Us @:
[email protected], [email protected]
Editor-In-Chief
Pezzottaite Journals,
24, Saraswati Lane, Bohri,
Near Modern Dewan Beverages,
Jammu Tawi – 180002,
Jammu and Kashmir, India.
(Mobile): +91-09419216270 – 71.
(sd/-)
(Editor-In-Chief)
FOR PAPER SUBMISSION & CLARIFICATION OR SUGGESTION, EMAIL US @:
Editor-In-Chief
Pezzottaite Journals,
24, Saraswati Lane, Bohri,
Near Modern Dewan Beverages,
Jammu Tawi – 180002,
Jammu and Kashmir, India.
(Mobile): +91-09419216270 – 71
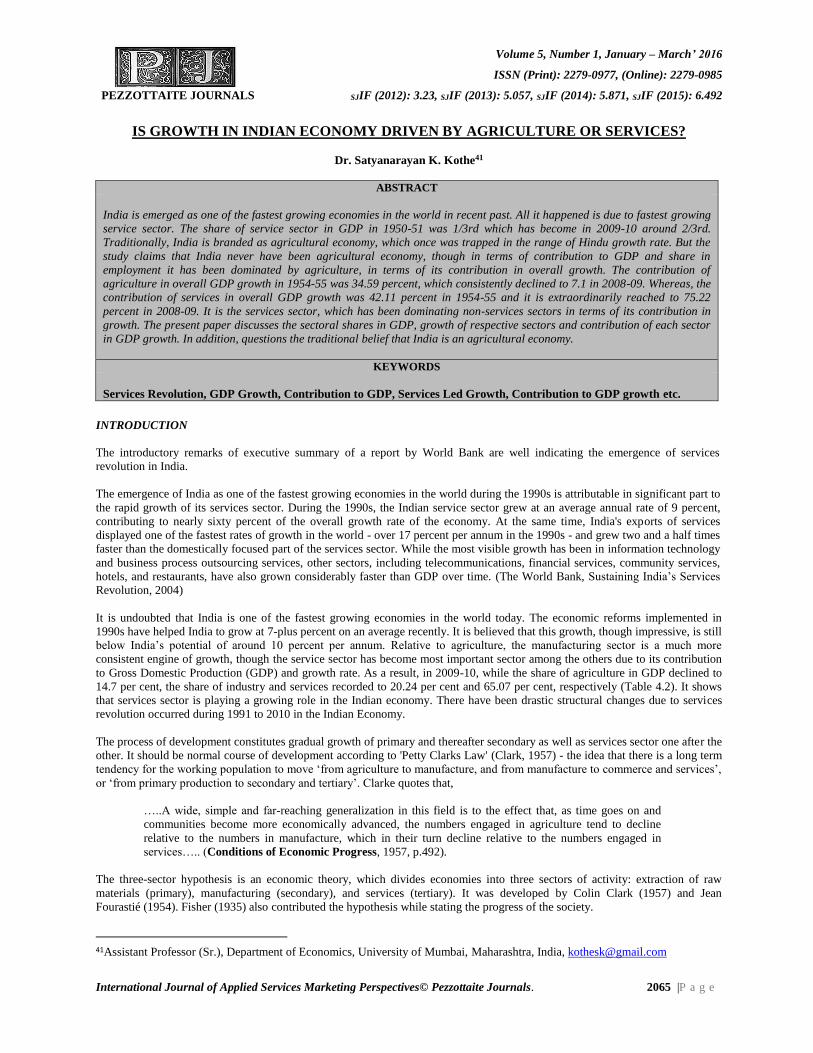
Volume 5, Number 1, January – March’ 2016
ISSN (Print): 2279-0977, (Online): 2279-0985
PEZZOTTAITE JOURNALS SJIF (2012): 3.23, SJIF (2013): 5.057, SJIF (2014): 5.871, SJIF (2015): 6.492
International Journal of Applied Services Marketing Perspectives© Pezzottaite Journals. 2065 |P a g e
IS GROWTH IN INDIAN ECONOMY DRIVEN BY AGRICULTURE OR SERVICES?
Dr. Satyanarayan K. Kothe41
ABSTRACT
India is emerged as one of the fastest growing economies in the world in recent past. All it happened is due to fastest growing
service sector. The share of service sector in GDP in 1950-51 was 1/3rd which has become in 2009-10 around 2/3rd.
Traditionally, India is branded as agricultural economy, which once was trapped in the range of Hindu growth rate. But the
study claims that India never have been agricultural economy, though in terms of contribution to GDP and share in
employment it has been dominated by agriculture, in terms of its contribution in overall growth. The contribution of
agriculture in overall GDP growth in 1954-55 was 34.59 percent, which consistently declined to 7.1 in 2008-09. Whereas, the
contribution of services in overall GDP growth was 42.11 percent in 1954-55 and it is extraordinarily reached to 75.22
percent in 2008-09. It is the services sector, which has been dominating non-services sectors in terms of its contribution in
growth. The present paper discusses the sectoral shares in GDP, growth of respective sectors and contribution of each sector
in GDP growth. In addition, questions the traditional belief that India is an agricultural economy.
KEYWORDS
Services Revolution, GDP Growth, Contribution to GDP, Services Led Growth, Contribution to GDP growth etc.
INTRODUCTION
The introductory remarks of executive summary of a report by World Bank are well indicating the emergence of services
revolution in India.
The emergence of India as one of the fastest growing economies in the world during the 1990s is attributable in significant part to
the rapid growth of its services sector. During the 1990s, the Indian service sector grew at an average annual rate of 9 percent,
contributing to nearly sixty percent of the overall growth rate of the economy. At the same time, India's exports of services
displayed one of the fastest rates of growth in the world - over 17 percent per annum in the 1990s - and grew two and a half times
faster than the domestically focused part of the services sector. While the most visible growth has been in information technology
and business process outsourcing services, other sectors, including telecommunications, financial services, community services,
hotels, and restaurants, have also grown considerably faster than GDP over time. (The World Bank, Sustaining India’s Services
Revolution, 2004)
It is undoubted that India is one of the fastest growing economies in the world today. The economic reforms implemented in
1990s have helped India to grow at 7-plus percent on an average recently. It is believed that this growth, though impressive, is still
below India’s potential of around 10 percent per annum. Relative to agriculture, the manufacturing sector is a much more
consistent engine of growth, though the service sector has become most important sector among the others due to its contribution
to Gross Domestic Production (GDP) and growth rate. As a result, in 2009-10, while the share of agriculture in GDP declined to
14.7 per cent, the share of industry and services recorded to 20.24 per cent and 65.07 per cent, respectively (Table 4.2). It shows
that services sector is playing a growing role in the Indian economy. There have been drastic structural changes due to services
revolution occurred during 1991 to 2010 in the Indian Economy.
The process of development constitutes gradual growth of primary and thereafter secondary as well as services sector one after the
other. It should be normal course of development according to 'Petty Clarks Law' (Clark, 1957) - the idea that there is a long term
tendency for the working population to move ‘from agriculture to manufacture, and from manufacture to commerce and services’,
or ‘from primary production to secondary and tertiary’. Clarke quotes that,
…..A wide, simple and far-reaching generalization in this field is to the effect that, as time goes on and
communities become more economically advanced, the numbers engaged in agriculture tend to decline
relative to the numbers in manufacture, which in their turn decline relative to the numbers engaged in
services….. (Conditions of Economic Progress, 1957, p.492).
The three-sector hypothesis is an economic theory, which divides economies into three sectors of activity: extraction of raw
materials (primary), manufacturing (secondary), and services (tertiary). It was developed by Colin Clark (1957) and Jean
Fourastié (1954). Fisher (1935) also contributed the hypothesis while stating the progress of the society.
41Assistant Professor (Sr.), Department of Economics, University of Mumbai, Maharashtra, India, [email protected]
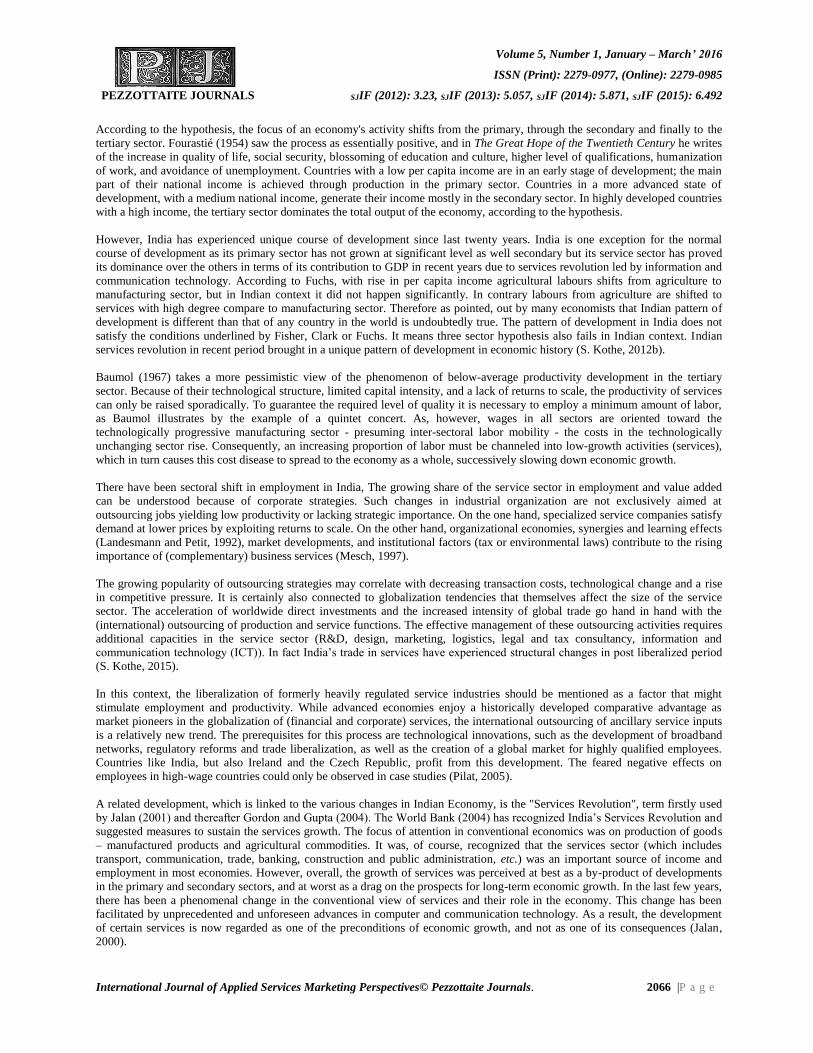
Volume 5, Number 1, January – March’ 2016
ISSN (Print): 2279-0977, (Online): 2279-0985
PEZZOTTAITE JOURNALS SJIF (2012): 3.23, SJIF (2013): 5.057, SJIF (2014): 5.871, SJIF (2015): 6.492
International Journal of Applied Services Marketing Perspectives© Pezzottaite Journals. 2066 |P a g e
According to the hypothesis, the focus of an economy's activity shifts from the primary, through the secondary and finally to the
tertiary sector. Fourastié (1954) saw the process as essentially positive, and in The Great Hope of the Twentieth Century he writes
of the increase in quality of life, social security, blossoming of education and culture, higher level of qualifications, humanization
of work, and avoidance of unemployment. Countries with a low per capita income are in an early stage of development; the main
part of their national income is achieved through production in the primary sector. Countries in a more advanced state of
development, with a medium national income, generate their income mostly in the secondary sector. In highly developed countries
with a high income, the tertiary sector dominates the total output of the economy, according to the hypothesis.
However, India has experienced unique course of development since last twenty years. India is one exception for the normal
course of development as its primary sector has not grown at significant level as well secondary but its service sector has proved
its dominance over the others in terms of its contribution to GDP in recent years due to services revolution led by information and
communication technology. According to Fuchs, with rise in per capita income agricultural labours shifts from agriculture to
manufacturing sector, but in Indian context it did not happen significantly. In contrary labours from agriculture are shifted to
services with high degree compare to manufacturing sector. Therefore as pointed, out by many economists that Indian pattern of
development is different than that of any country in the world is undoubtedly true. The pattern of development in India does not
satisfy the conditions underlined by Fisher, Clark or Fuchs. It means three sector hypothesis also fails in Indian context. Indian
services revolution in recent period brought in a unique pattern of development in economic history (S. Kothe, 2012b).
Baumol (1967) takes a more pessimistic view of the phenomenon of below-average productivity development in the tertiary
sector. Because of their technological structure, limited capital intensity, and a lack of returns to scale, the productivity of services
can only be raised sporadically. To guarantee the required level of quality it is necessary to employ a minimum amount of labor,
as Baumol illustrates by the example of a quintet concert. As, however, wages in all sectors are oriented toward the
technologically progressive manufacturing sector - presuming inter-sectoral labor mobility - the costs in the technologically
unchanging sector rise. Consequently, an increasing proportion of labor must be channeled into low-growth activities (services),
which in turn causes this cost disease to spread to the economy as a whole, successively slowing down economic growth.
There have been sectoral shift in employment in India, The growing share of the service sector in employment and value added
can be understood because of corporate strategies. Such changes in industrial organization are not exclusively aimed at
outsourcing jobs yielding low productivity or lacking strategic importance. On the one hand, specialized service companies satisfy
demand at lower prices by exploiting returns to scale. On the other hand, organizational economies, synergies and learning effects
(Landesmann and Petit, 1992), market developments, and institutional factors (tax or environmental laws) contribute to the rising
importance of (complementary) business services (Mesch, 1997).
The growing popularity of outsourcing strategies may correlate with decreasing transaction costs, technological change and a rise
in competitive pressure. It is certainly also connected to globalization tendencies that themselves affect the size of the service
sector. The acceleration of worldwide direct investments and the increased intensity of global trade go hand in hand with the
(international) outsourcing of production and service functions. The effective management of these outsourcing activities requires
additional capacities in the service sector (R&D, design, marketing, logistics, legal and tax consultancy, information and
communication technology (ICT)). In fact India’s trade in services have experienced structural changes in post liberalized period
(S. Kothe, 2015).
In this context, the liberalization of formerly heavily regulated service industries should be mentioned as a factor that might
stimulate employment and productivity. While advanced economies enjoy a historically developed comparative advantage as
market pioneers in the globalization of (financial and corporate) services, the international outsourcing of ancillary service inputs
is a relatively new trend. The prerequisites for this process are technological innovations, such as the development of broadband
networks, regulatory reforms and trade liberalization, as well as the creation of a global market for highly qualified employees.
Countries like India, but also Ireland and the Czech Republic, profit from this development. The feared negative effects on
employees in high-wage countries could only be observed in case studies (Pilat, 2005).
A related development, which is linked to the various changes in Indian Economy, is the "Services Revolution", term firstly used
by Jalan (2001) and thereafter Gordon and Gupta (2004). The World Bank (2004) has recognized India’s Services Revolution and
suggested measures to sustain the services growth. The focus of attention in conventional economics was on production of goods
– manufactured products and agricultural commodities. It was, of course, recognized that the services sector (which includes
transport, communication, trade, banking, construction and public administration, etc.) was an important source of income and
employment in most economies. However, overall, the growth of services was perceived at best as a by-product of developments
in the primary and secondary sectors, and at worst as a drag on the prospects for long-term economic growth. In the last few years,
there has been a phenomenal change in the conventional view of services and their role in the economy. This change has been
facilitated by unprecedented and unforeseen advances in computer and communication technology. As a result, the development
of certain services is now regarded as one of the preconditions of economic growth, and not as one of its consequences (Jalan,
2000).
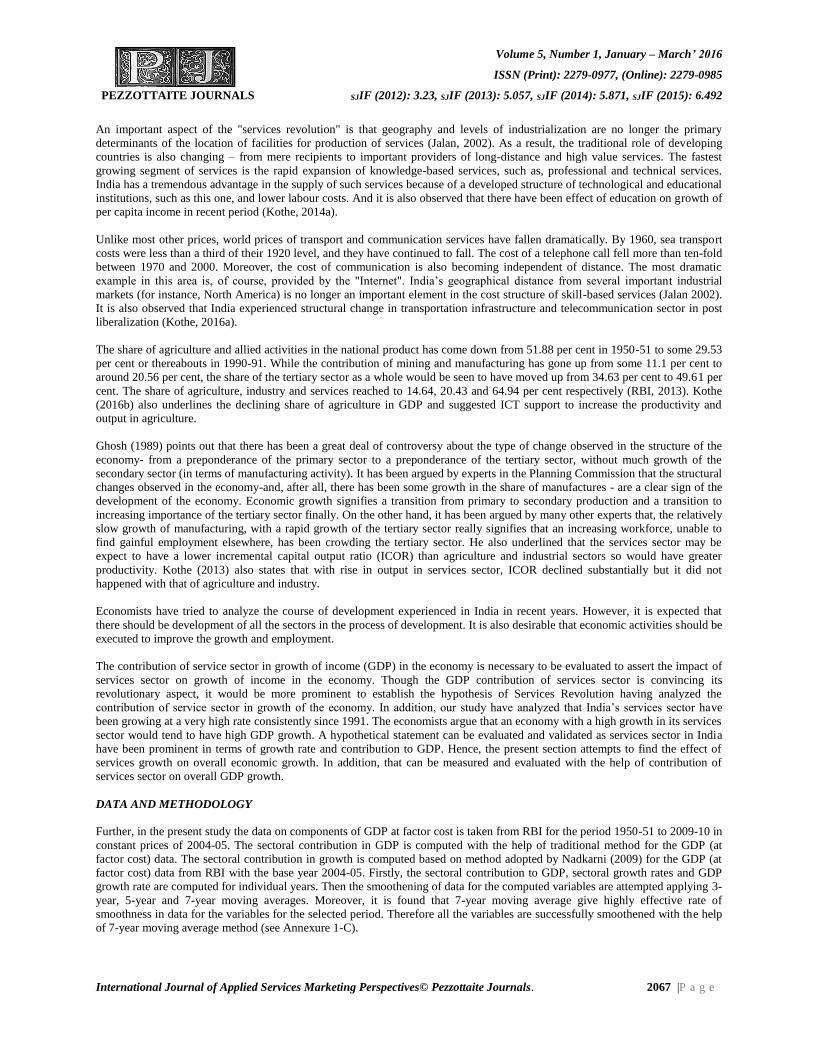
Volume 5, Number 1, January – March’ 2016
ISSN (Print): 2279-0977, (Online): 2279-0985
PEZZOTTAITE JOURNALS SJIF (2012): 3.23, SJIF (2013): 5.057, SJIF (2014): 5.871, SJIF (2015): 6.492
International Journal of Applied Services Marketing Perspectives© Pezzottaite Journals. 2067 |P a g e
An important aspect of the "services revolution" is that geography and levels of industrialization are no longer the primary
determinants of the location of facilities for production of services (Jalan, 2002). As a result, the traditional role of developing
countries is also changing – from mere recipients to important providers of long-distance and high value services. The fastest
growing segment of services is the rapid expansion of knowledge-based services, such as, professional and technical services.
India has a tremendous advantage in the supply of such services because of a developed structure of technological and educational
institutions, such as this one, and lower labour costs. And it is also observed that there have been effect of education on growth of
per capita income in recent period (Kothe, 2014a).
Unlike most other prices, world prices of transport and communication services have fallen dramatically. By 1960, sea transport
costs were less than a third of their 1920 level, and they have continued to fall. The cost of a telephone call fell more than ten-fold
between 1970 and 2000. Moreover, the cost of communication is also becoming independent of distance. The most dramatic
example in this area is, of course, provided by the "Internet". India’s geographical distance from several important industrial
markets (for instance, North America) is no longer an important element in the cost structure of skill-based services (Jalan 2002).
It is also observed that India experienced structural change in transportation infrastructure and telecommunication sector in post
liberalization (Kothe, 2016a).
The share of agriculture and allied activities in the national product has come down from 51.88 per cent in 1950-51 to some 29.53
per cent or thereabouts in 1990-91. While the contribution of mining and manufacturing has gone up from some 11.1 per cent to
around 20.56 per cent, the share of the tertiary sector as a whole would be seen to have moved up from 34.63 per cent to 49.61 per
cent. The share of agriculture, industry and services reached to 14.64, 20.43 and 64.94 per cent respectively (RBI, 2013). Kothe
(2016b) also underlines the declining share of agriculture in GDP and suggested ICT support to increase the productivity and
output in agriculture.
Ghosh (1989) points out that there has been a great deal of controversy about the type of change observed in the structure of the
economy- from a preponderance of the primary sector to a preponderance of the tertiary sector, without much growth of the
secondary sector (in terms of manufacturing activity). It has been argued by experts in the Planning Commission that the structural
changes observed in the economy-and, after all, there has been some growth in the share of manufactures - are a clear sign of the
development of the economy. Economic growth signifies a transition from primary to secondary production and a transition to
increasing importance of the tertiary sector finally. On the other hand, it has been argued by many other experts that, the relatively
slow growth of manufacturing, with a rapid growth of the tertiary sector really signifies that an increasing workforce, unable to
find gainful employment elsewhere, has been crowding the tertiary sector. He also underlined that the services sector may be
expect to have a lower incremental capital output ratio (ICOR) than agriculture and industrial sectors so would have greater
productivity. Kothe (2013) also states that with rise in output in services sector, ICOR declined substantially but it did not
happened with that of agriculture and industry.
Economists have tried to analyze the course of development experienced in India in recent years. However, it is expected that
there should be development of all the sectors in the process of development. It is also desirable that economic activities should be
executed to improve the growth and employment.
The contribution of service sector in growth of income (GDP) in the economy is necessary to be evaluated to assert the impact of
services sector on growth of income in the economy. Though the GDP contribution of services sector is convincing its
revolutionary aspect, it would be more prominent to establish the hypothesis of Services Revolution having analyzed the
contribution of service sector in growth of the economy. In addition, our study have analyzed that India’s services sector have
been growing at a very high rate consistently since 1991. The economists argue that an economy with a high growth in its services
sector would tend to have high GDP growth. A hypothetical statement can be evaluated and validated as services sector in India
have been prominent in terms of growth rate and contribution to GDP. Hence, the present section attempts to find the effect of
services growth on overall economic growth. In addition, that can be measured and evaluated with the help of contribution of
services sector on overall GDP growth.
DATA AND METHODOLOGY
Further, in the present study the data on components of GDP at factor cost is taken from RBI for the period 1950-51 to 2009-10 in
constant prices of 2004-05. The sectoral contribution in GDP is computed with the help of traditional method for the GDP (at
factor cost) data. The sectoral contribution in growth is computed based on method adopted by Nadkarni (2009) for the GDP (at
factor cost) data from RBI with the base year 2004-05. Firstly, the sectoral contribution to GDP, sectoral growth rates and GDP
growth rate are computed for individual years. Then the smoothening of data for the computed variables are attempted applying 3-
year, 5-year and 7-year moving averages. Moreover, it is found that 7-year moving average give highly effective rate of
smoothness in data for the variables for the selected period. Therefore all the variables are successfully smoothened with the help
of 7-year moving average method (see Annexure 1-C).
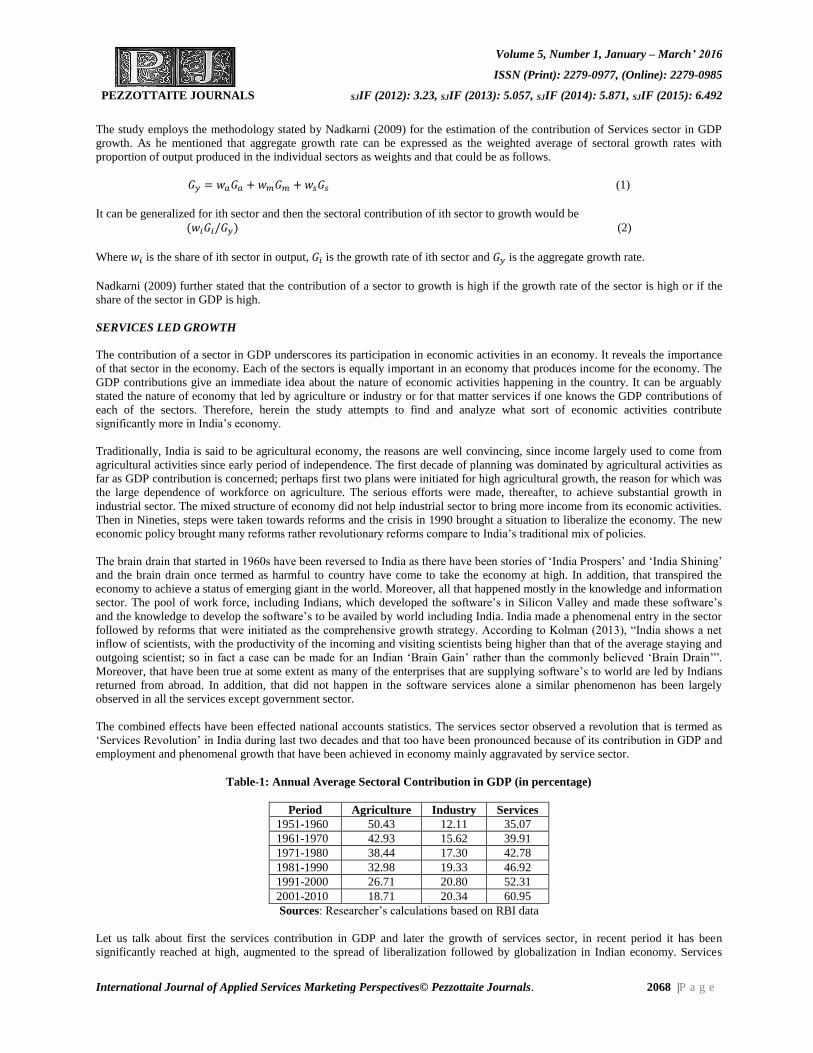
Volume 5, Number 1, January – March’ 2016
ISSN (Print): 2279-0977, (Online): 2279-0985
PEZZOTTAITE JOURNALS SJIF (2012): 3.23, SJIF (2013): 5.057, SJIF (2014): 5.871, SJIF (2015): 6.492
International Journal of Applied Services Marketing Perspectives© Pezzottaite Journals. 2068 |P a g e
The study employs the methodology stated by Nadkarni (2009) for the estimation of the contribution of Services sector in GDP
growth. As he mentioned that aggregate growth rate can be expressed as the weighted average of sectoral growth rates with
proportion of output produced in the individual sectors as weights and that could be as follows.
𝐺𝑦 = 𝑤𝑎𝐺𝑎 + 𝑤𝑚𝐺𝑚 + 𝑤𝑠𝐺𝑠 (1)
It can be generalized for ith sector and then the sectoral contribution of ith sector to growth would be
(𝑤𝑖𝐺𝑖/𝐺𝑦) (2)
Where 𝑤𝑖 is the share of ith sector in output, 𝐺𝑖 is the growth rate of ith sector and 𝐺𝑦 is the aggregate growth rate.
Nadkarni (2009) further stated that the contribution of a sector to growth is high if the growth rate of the sector is high or if the
share of the sector in GDP is high.
SERVICES LED GROWTH
The contribution of a sector in GDP underscores its participation in economic activities in an economy. It reveals the importance
of that sector in the economy. Each of the sectors is equally important in an economy that produces income for the economy. The
GDP contributions give an immediate idea about the nature of economic activities happening in the country. It can be arguably
stated the nature of economy that led by agriculture or industry or for that matter services if one knows the GDP contributions of
each of the sectors. Therefore, herein the study attempts to find and analyze what sort of economic activities contribute
significantly more in India’s economy.
Traditionally, India is said to be agricultural economy, the reasons are well convincing, since income largely used to come from
agricultural activities since early period of independence. The first decade of planning was dominated by agricultural activities as
far as GDP contribution is concerned; perhaps first two plans were initiated for high agricultural growth, the reason for which was
the large dependence of workforce on agriculture. The serious efforts were made, thereafter, to achieve substantial growth in
industrial sector. The mixed structure of economy did not help industrial sector to bring more income from its economic activities.
Then in Nineties, steps were taken towards reforms and the crisis in 1990 brought a situation to liberalize the economy. The new
economic policy brought many reforms rather revolutionary reforms compare to India’s traditional mix of policies.
The brain drain that started in 1960s have been reversed to India as there have been stories of ‘India Prospers’ and ‘India Shining’
and the brain drain once termed as harmful to country have come to take the economy at high. In addition, that transpired the
economy to achieve a status of emerging giant in the world. Moreover, all that happened mostly in the knowledge and information
sector. The pool of work force, including Indians, which developed the software’s in Silicon Valley and made these software’s
and the knowledge to develop the software’s to be availed by world including India. India made a phenomenal entry in the sector
followed by reforms that were initiated as the comprehensive growth strategy. According to Kolman (2013), “India shows a net
inflow of scientists, with the productivity of the incoming and visiting scientists being higher than that of the average staying and
outgoing scientist; so in fact a case can be made for an Indian ‘Brain Gain’ rather than the commonly believed ‘Brain Drain’”.
Moreover, that have been true at some extent as many of the enterprises that are supplying software’s to world are led by Indians
returned from abroad. In addition, that did not happen in the software services alone a similar phenomenon has been largely
observed in all the services except government sector.
The combined effects have been effected national accounts statistics. The services sector observed a revolution that is termed as
‘Services Revolution’ in India during last two decades and that too have been pronounced because of its contribution in GDP and
employment and phenomenal growth that have been achieved in economy mainly aggravated by service sector.
Table-1: Annual Average Sectoral Contribution in GDP (in percentage)
Period Agriculture Industry Services
1951-1960 50.43 12.11 35.07
1961-1970 42.93 15.62 39.91
1971-1980 38.44 17.30 42.78
1981-1990 32.98 19.33 46.92
1991-2000 26.71 20.80 52.31
2001-2010 18.71 20.34 60.95
Sources: Researcher’s calculations based on RBI data
Let us talk about first the services contribution in GDP and later the growth of services sector, in recent period it has been
significantly reached at high, augmented to the spread of liberalization followed by globalization in Indian economy. Services
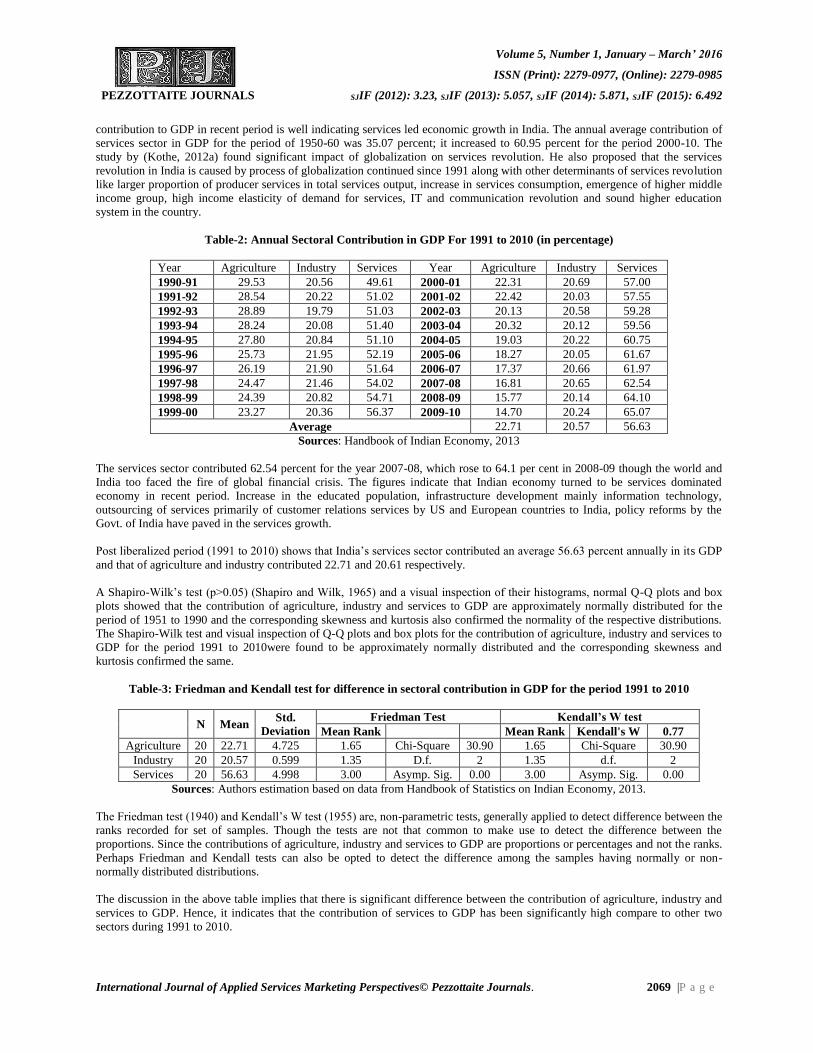
Volume 5, Number 1, January – March’ 2016
ISSN (Print): 2279-0977, (Online): 2279-0985
PEZZOTTAITE JOURNALS SJIF (2012): 3.23, SJIF (2013): 5.057, SJIF (2014): 5.871, SJIF (2015): 6.492
International Journal of Applied Services Marketing Perspectives© Pezzottaite Journals. 2069 |P a g e
contribution to GDP in recent period is well indicating services led economic growth in India. The annual average contribution of
services sector in GDP for the period of 1950-60 was 35.07 percent; it increased to 60.95 percent for the period 2000-10. The
study by (Kothe, 2012a) found significant impact of globalization on services revolution. He also proposed that the services
revolution in India is caused by process of globalization continued since 1991 along with other determinants of services revolution
like larger proportion of producer services in total services output, increase in services consumption, emergence of higher middle
income group, high income elasticity of demand for services, IT and communication revolution and sound higher education
system in the country.
Table-2: Annual Sectoral Contribution in GDP For 1991 to 2010 (in percentage)
Year Agriculture Industry Services Year Agriculture Industry Services
1990-91 29.53 20.56 49.61 2000-01 22.31 20.69 57.00
1991-92 28.54 20.22 51.02 2001-02 22.42 20.03 57.55
1992-93 28.89 19.79 51.03 2002-03 20.13 20.58 59.28
1993-94 28.24 20.08 51.40 2003-04 20.32 20.12 59.56
1994-95 27.80 20.84 51.10 2004-05 19.03 20.22 60.75
1995-96 25.73 21.95 52.19 2005-06 18.27 20.05 61.67
1996-97 26.19 21.90 51.64 2006-07 17.37 20.66 61.97
1997-98 24.47 21.46 54.02 2007-08 16.81 20.65 62.54
1998-99 24.39 20.82 54.71 2008-09 15.77 20.14 64.10
1999-00 23.27 20.36 56.37 2009-10 14.70 20.24 65.07
Average 22.71 20.57 56.63
Sources: Handbook of Indian Economy, 2013
The services sector contributed 62.54 percent for the year 2007-08, which rose to 64.1 per cent in 2008-09 though the world and
India too faced the fire of global financial crisis. The figures indicate that Indian economy turned to be services dominated
economy in recent period. Increase in the educated population, infrastructure development mainly information technology,
outsourcing of services primarily of customer relations services by US and European countries to India, policy reforms by the
Govt. of India have paved in the services growth.
Post liberalized period (1991 to 2010) shows that India’s services sector contributed an average 56.63 percent annually in its GDP
and that of agriculture and industry contributed 22.71 and 20.61 respectively.
A Shapiro-Wilk’s test (p>0.05) (Shapiro and Wilk, 1965) and a visual inspection of their histograms, normal Q-Q plots and box
plots showed that the contribution of agriculture, industry and services to GDP are approximately normally distributed for the
period of 1951 to 1990 and the corresponding skewness and kurtosis also confirmed the normality of the respective distributions.
The Shapiro-Wilk test and visual inspection of Q-Q plots and box plots for the contribution of agriculture, industry and services to
GDP for the period 1991 to 2010were found to be approximately normally distributed and the corresponding skewness and
kurtosis confirmed the same.
Table-3: Friedman and Kendall test for difference in sectoral contribution in GDP for the period 1991 to 2010
N Mean Std.
Deviation
Friedman Test Kendall’s W test
Mean Rank Mean Rank Kendall's W 0.77
Agriculture 20 22.71 4.725 1.65 Chi-Square 30.90 1.65 Chi-Square 30.90
Industry 20 20.57 0.599 1.35 D.f. 2 1.35 d.f. 2
Services 20 56.63 4.998 3.00 Asymp. Sig. 0.00 3.00 Asymp. Sig. 0.00
Sources: Authors estimation based on data from Handbook of Statistics on Indian Economy, 2013.
The Friedman test (1940) and Kendall’s W test (1955) are, non-parametric tests, generally applied to detect difference between the
ranks recorded for set of samples. Though the tests are not that common to make use to detect the difference between the
proportions. Since the contributions of agriculture, industry and services to GDP are proportions or percentages and not the ranks.
Perhaps Friedman and Kendall tests can also be opted to detect the difference among the samples having normally or non-
normally distributed distributions.
The discussion in the above table implies that there is significant difference between the contribution of agriculture, industry and
services to GDP. Hence, it indicates that the contribution of services to GDP has been significantly high compare to other two
sectors during 1991 to 2010.
Volume 5, Number 1, January – March’ 2016
ISSN (Print): 2279-0977, (Online): 2279-0985
PEZZOTTAITE JOURNALS SJIF (2012): 3.23, SJIF (2013): 5.057, SJIF (2014): 5.871, SJIF (2015): 6.492
International Journal of Applied Services Marketing Perspectives© Pezzottaite Journals. 2070 |P a g e
We observed that there have not been any significant difference between the growth rates of agriculture in pre and post
liberalization period. The similar is the case of industry. Convincingly, there have been significant difference between growth
rates of services sector in pre and post liberalization period. Which also implies that the growth rate of services sector for the
period of 1991 to 2010 is significantly greater than that of 1951 to 1990 (see Annexure 1-A).
We also observed that comparative analysis of growth among the sectors for pre and post liberalization confirms that the services
sector have been dominating in terms of growth over the other two sectors in the two periods. The growth rates of agriculture,
industry and services for pre liberalization period are denoted by Ga0, Gm0 and Gs0 respectively. In addition, the growth rates of
agriculture, industry and services for post liberalization period are denoted by Ga1, Gm1 and Gs1 respectively (see Annexure 1- B).
The study found that there is significant difference between Ga0 and Gs0 at 95 per cent level of significance. Moreover, the
comparison of growth rates of industry and services implies that there is no significant difference between Gm0 and Gs0 at 95 per
cent level of significance. It means that the growth rate of services was greater than agriculture but the growth rate of services was
not that different from the industry in pre-liberalization period. However, the new economic policy of 1991 have enlarged the
growth rate of services in post liberalization period since 1991. It is found that the growth rate of services (Gs1) was significantly
greater than that of agriculture (Ga1) and industry (Gm1) at 95 per cent level of significance in post liberalization period (see
Annexure 1-B).
The agriculture dominated the economy by contributing highest in GDP until 1967-68. The services sector started leading
economy in terms of contribution to GDP from the year 1968-69. Comparatively higher growth in services sector made the
services sector to overtake the agriculture sector during 1950-51 to 1967-68. It is observed that the double the growth in services
sector (an average) compare to agriculture during 1968-69 to 1990, the service sector started contributing nearly half the GDP.
Perhaps all the initial plans were designed to accelerate growth of agriculture to support larger population in the country. Not all
the dedicated efforts in the perceived direction could brand the economic growth led by agriculture.
And that of industrial sector also grown at the similar rate of growth despite the policy arrangements for the growth of industrial
sector in the wake of infant industry argument, and its contribution to GDP being comparatively small to services sector could not
create its identity for which many factors contribute, few of them are large public sector, MRTP Act, License Raj and slow
infrastructure development. The industrial policy of 1956 created positive environment for industrialization in the economy and
that can be observed through the growth rate of industrial sector for the period of post 1956. Nevertheless, lack of sufficient
support from Government in creation of infrastructure in the consecutive period, lack of international competition and
modernization, traditional technology and baburaj infiltrated industrial sickness.
It is 1985-86, Rajiv Gandhi lead the economic policies by allowing modern technology to be imported to boost the productivity in
industrial sector. It was under his government, in 1985, that around one-third of all three-digit industries were delicensed (Aghion,
Burgess, Redding and Zilibott, 2008). Pangariya (2008) states that substantial liberalization took place in second half of 1980s that
includes major depreciation of the rupee that led to a spurt in exports. Kothe (2014b) also stated that liberalization has positive
impact on services exports in India. In addition, industrial sector started growing again at 6 per cent of growth annually as a
consequence of the policy changes. Nevertheless, not all the efforts made through perceived policy changes could make the
economy led by industrial sector.
It was 1991, with wider perspective, India liberalized its economy. The new economic policy of 1991 brought in systemic reforms
that followed by disinvestment and globalization in most of the sectors. The main objective of the new economic policy was to
remove the red tape, to integrate the economy with the world economy, to welcome FDI and to make domestic industrial houses
MRTP Act free. In addition, it was decided to close loss making public industries and to disinvest most of the public enterprises to
reduce the role of state and raise the competition among domestic industries. Therefore, industrial licensing was abolished and
FDI was allowed to 51 per cent in specific industries. The government started giving automatic approval for technology
agreement for high priority sectors. The cautious steps towards the current account convertibility also contributed in inflow of
foreign capital through FDI route and in export led growth attributed by IT exports. In fact as a response to the policy relating to
FDI, it has played a significant role, along with domestic investment, in services sector growth (S. Kothe & Sawant, 2010). In
addition, the efforts to make the economy market operated various measures have been implemented.
The above discussion implies that services sector has a significantly large contribution to GDP since 1991 compare to other two
sectors. It is observed that, in the context of the results relating to sectoral contribution to growth, in 1954-55, contribution of
agriculture, industry and services to GDP growth was 34.59, 21.3 and 42.11 respectively. Till 2000 Agriculture accounted double
digit share in GDP growth but post 2000 it reached to 7.1 per cent in 2008-09 which indicates that agriculture has very little
influence over overall growth in the economy though large proportion of population depend on agriculture for their livelihood.
Industrial sector have been contributing by 20 per cent an average across the years and reached at 18.34 per cent in 2008-09. It
shows that 1 percent growth in economy comes with 1/5th share in GDP growth by industry (See Annexure 1 C).
Volume 5, Number 1, January – March’ 2016
ISSN (Print): 2279-0977, (Online): 2279-0985
PEZZOTTAITE JOURNALS SJIF (2012): 3.23, SJIF (2013): 5.057, SJIF (2014): 5.871, SJIF (2015): 6.492
International Journal of Applied Services Marketing Perspectives© Pezzottaite Journals. 2071 |P a g e
The services growth contribution to GDP growth rose to 60 per cent by 1990. It means it took 45 years to touch 60 per cent. But
the services revolution is in this sense is more defined that the services growth contribution to GDP growth reached from 60 per
cent in 1990 to 75 per cent in 2002-03, it took only 13 years to add its contribution to growth by 15 per cent. In the year 2008-09,
the contribution of growth in services sector to overall growth stood at 75.2 per cent, which implies that out one per cent growth
0.75 growth, is contributed by services sector (See Annexure 1 C). Now it iterates that services were always dominating in terms
of contribution to GDP growth. As also stated by Nadkarni (2009) Indian growth has always been services-led, it is imperative to
state that in post reform period services-led growth in India become more prominent and IT and Communication revolution during
the period 1991-2010 reshaped India as service economy.
CONCLUSION
The services contribution to GDP in recent period is well indicating services led economic growth in India. The annual average
contribution of services sector in GDP for the period of 1950-60 was 35.07 percent; it increased to 60.95 percent for the period
2000-10. It indicates that Indian economy turned to be services dominated economy in recent period. Increase in the educated
population, infrastructure development mainly information technology, outsourcing of services mainly of customer relations
services by US and European countries to India, policy reforms by the Govt. of India have paved in the services growth. Though
the contribution of services sector in GDP is convincing its revolutionary characteristic, the contribution of service sector in
overall growth also underlines the India’s recent trajectory of services led growth. It is found that its contribution in overall
growth was 58.62 per cent in 1990-91, which consistently reached to 75.22 per cent in 2008-09 that transpires that agriculture and
industry together advance growth by 24.78 per cent and account independently 7.1 and 18.34 respectively.
Therefore it concludes that the services sector contribution in GDP have been significantly greater than that of agriculture and
industry since 1991. In addition, the growth rate of services sector have been significantly greater than agriculture and industry
since 1991. Therefore the hypotheses stated in relation to contribution to GDP and growth rate is that India's economic
development is highly influenced by the growth of service sector during 1991 to 2010, the contribution of service sector in GDP is
considerably more than the others and the policy reforms in recent period have influenced services growth significantly are found
to be true. Therefore, we conclude that India’s growth is driven by services sector and not by agriculture.
REFERENCES
1. Aghion, P., Burgess, R., Redding, S. J., & Zilibotti, F. (2008). The Unequal Effects of Liberalization: Evidence from
Dismantling the License Raj in India. American Economic Review, 98(4), 1397–1412. Retrieved from
http://doi.org/10.1257/aer.98.4.1397
2. Bank, T. W. (2004). Sustaining India’s Services Revolution: Access to Foreign Markets, Domestic Reform and
International Negotiations, pp. 1–63.
3. Baumol, W. J. (1967). Macroeconomics of Unbalanced Growth: The Anatomy of Urban Crisis. The American
Economic Review, 57(3), 415–426 CR–Copyright © 1967 American Econo. Retrieved from
http://doi.org/10.2307/1812111
4. Clark, C. (1957). The Conditions of Economic Progress. London: MacMillan.
5. Fisher, A. G. B. (1935). The Clash of Progress and Security. London: Macmillan.
6. Friedman, M. (1937). The Use of Ranks to Avoid the Assumption of Normality Implicit in the Analysis of Variance.
Journal of the American Statistical Association, 32(200), 675–701. Retrieved from
http://doi.org/10.1080/01621459.1937.10503522
7. Fuchs, V. R. (1968). The Service Economy. Assisted by Irving F. Leveson, The National Bureau of Economic
Research, Cambridge.
8. Ghosh, A. (1989). Mystery of a Declining Capital-Output Ratio. Economic and Political Weekly, 2527–2530.
9. Gordon, J., & Gupta, P. (2004). Understanding India’s Services Revolution (IMF Working Papers No. 04/171).
10. Jalan, B. (2001). India’s Economy in the Twenty-First Century: New Beginning or False Dawn? India International
Centre Quarterly, 28(2), 138–154.
Volume 5, Number 1, January – March’ 2016
ISSN (Print): 2279-0977, (Online): 2279-0985
PEZZOTTAITE JOURNALS SJIF (2012): 3.23, SJIF (2013): 5.057, SJIF (2014): 5.871, SJIF (2015): 6.492
International Journal of Applied Services Marketing Perspectives© Pezzottaite Journals. 2072 |P a g e
11. Kothe, S. (2016a, January-March). Structural Change in Transportation Infrastructure and Services Led Growth in India:
Revisited. International Journal of Logistics and Supply Chain Management Perspectives, 5(1). Forthcoming.
12. Kothe, S. (2016b). ICT for Agriculture and Rural Development in India. International Journal of Retailing and Rural
Business Perspectives, 5(1). Forthcoming.
13. Kothe, S. (2015). India’s Trade in Services: A Structural Analysis. International Journal on Trade and Global
Business Perspectives, 4(1), 1544–1552.
14. Kothe, S. (2014a). Educating India: A Cause for Services Revolution. International Research Journal of Commerce,
Business and Social Sciences, 2(12 (III)), 32–36.
15. Kothe, S. (2014b). Standard Export Demand Function for India’s Services. International Journal of Trade & Global
Business Perspectives, 3(1), 780–784.
16. Kothe, S. (2013). Incremental Capital Output Ratio and Growth in India’s Services Sector. International Journal of
Development Studies and Research, 2(2), 41–50.
17. Kothe, S. (2012a). Globalization and Services Revolution in India. In L. H. Patil (Ed.), Jagtikikarananantarchi
Bhartiya Arthvyavasthetil Sthityantare, pp. 197–202. Udgir; Gudsur: Principal, Shivaji College; Mayur Publications.
18. Kothe, S. (2012b). Inter-Sectoral Shifts in Employment and Employment Elasticity in Service Sector in India.
International Journal of Development Studies and Research, 1(1), 159–167.
19. Kothe, S., & Sawant, A. (2010). Global Financial Crisis and FDI in Services Sector in India. In S. A. Baskaran & J. J.
Soundararaj (Eds.), The Impact of Foreign Direct Investment on Indian Economy, pp. 259–268. New Delhi: Excel
Publications.
20. Landesmann, M., & Petit, P. (1992). Trade in Producer Services: International Specialization and European
Integration. Faculty of Economics, University of Cambridge.
21. Mesch, M. (1997). Die Ursachen fu‹r die Bescha‹ftigungsentwicklung im Dienstleistungssektor. Wirtschaft Und
Gesellschaft, 23(1), 11–54.
22. Nadkarni, A. (2009). A Note on Static Contribution of Services Sector to Growth in India (Working Paper).
23. Panagariya, A. (2008). India: The Emerging Giant. USA: Oxford University Press. Retrieved from
https://books.google.com/books?hl=en&lr=&id=iQIoaA4sWxAC&pgis=1
24. Pilat, D. (2005). Introduction and synthesis. Enhancing the Performance of the Services Sector, pp. 9–26.
25. Shapiro, S. S., & Wilk, M. B. (1972). An analysis of variance test for the exponential distribution (complete samples).
Technometrics, 14(2), 355–370.
26. Retrieved from
http://www.researchgate.net/publication/5206292_High_Employment_with_Low_Productivity_The_Service_Se...
27. Retrieved from
https://en.wikipedia.org/wiki/Three-sector_hypothesis#Structural_transformation_according_to_Fourast...
28. Retrieved from https://en.wikipedia.org/wiki/Three-sector_hypothesis#Further_reading
29. Retrieved from
http://www.researchgate.net/publication/228238944_Service_Sector_The_Snitch_of_Globalization_Game
30. Retrieved from https://www.elsevier.com/about/press-releases/science-and-technology/elsevier-analysis-reveals-brain...
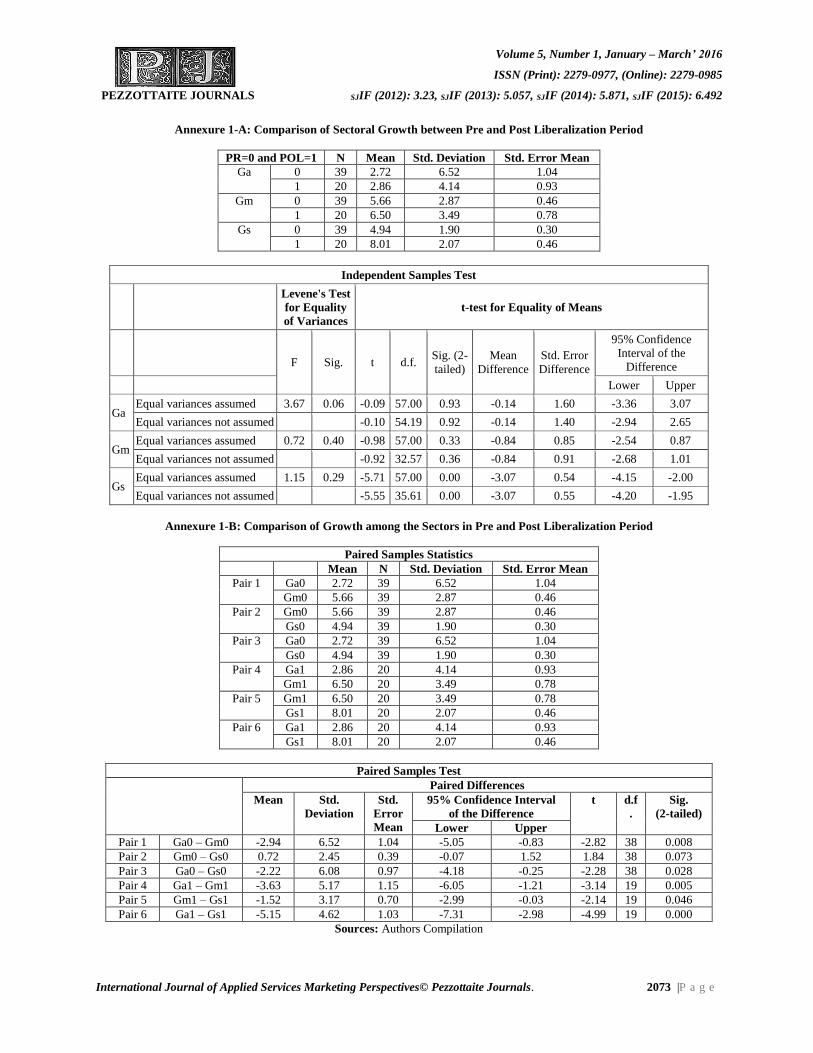
Volume 5, Number 1, January – March’ 2016
ISSN (Print): 2279-0977, (Online): 2279-0985
PEZZOTTAITE JOURNALS SJIF (2012): 3.23, SJIF (2013): 5.057, SJIF (2014): 5.871, SJIF (2015): 6.492
International Journal of Applied Services Marketing Perspectives© Pezzottaite Journals. 2073 |P a g e
Annexure 1-A: Comparison of Sectoral Growth between Pre and Post Liberalization Period
PR=0 and POL=1 N Mean Std. Deviation Std. Error Mean
Ga 0 39 2.72 6.52 1.04
1 20 2.86 4.14 0.93
Gm 0 39 5.66 2.87 0.46
1 20 6.50 3.49 0.78
Gs 0 39 4.94 1.90 0.30
1 20 8.01 2.07 0.46
Independent Samples Test
Levene's Test
for Equality
of Variances
t-test for Equality of Means
F Sig. t d.f.
Sig. (2-
tailed)
Mean
Difference
Std. Error
Difference
95% Confidence
Interval of the
Difference
Lower Upper
Ga Equal variances assumed 3.67 0.06 -0.09 57.00 0.93 -0.14 1.60 -3.36 3.07
Equal variances not assumed -0.10 54.19 0.92 -0.14 1.40 -2.94 2.65
Gm Equal variances assumed 0.72 0.40 -0.98 57.00 0.33 -0.84 0.85 -2.54 0.87
Equal variances not assumed -0.92 32.57 0.36 -0.84 0.91 -2.68 1.01
Gs Equal variances assumed 1.15 0.29 -5.71 57.00 0.00 -3.07 0.54 -4.15 -2.00
Equal variances not assumed -5.55 35.61 0.00 -3.07 0.55 -4.20 -1.95
Annexure 1-B: Comparison of Growth among the Sectors in Pre and Post Liberalization Period
Paired Samples Statistics
Mean N Std. Deviation Std. Error Mean
Pair 1 Ga0 2.72 39 6.52 1.04
Gm0 5.66 39 2.87 0.46
Pair 2 Gm0 5.66 39 2.87 0.46
Gs0 4.94 39 1.90 0.30
Pair 3 Ga0 2.72 39 6.52 1.04
Gs0 4.94 39 1.90 0.30
Pair 4 Ga1 2.86 20 4.14 0.93
Gm1 6.50 20 3.49 0.78
Pair 5 Gm1 6.50 20 3.49 0.78
Gs1 8.01 20 2.07 0.46
Pair 6 Ga1 2.86 20 4.14 0.93
Gs1 8.01 20 2.07 0.46
Paired Samples Test
Paired Differences
Mean Std.
Deviation
Std.
Error
Mean
95% Confidence Interval
of the Difference
t d.f
.
Sig.
(2-tailed)
Lower Upper
Pair 1 Ga0 – Gm0 -2.94 6.52 1.04 -5.05 -0.83 -2.82 38 0.008
Pair 2 Gm0 – Gs0 0.72 2.45 0.39 -0.07 1.52 1.84 38 0.073
Pair 3 Ga0 – Gs0 -2.22 6.08 0.97 -4.18 -0.25 -2.28 38 0.028
Pair 4 Ga1 – Gm1 -3.63 5.17 1.15 -6.05 -1.21 -3.14 19 0.005
Pair 5 Gm1 – Gs1 -1.52 3.17 0.70 -2.99 -0.03 -2.14 19 0.046
Pair 6 Ga1 – Gs1 -5.15 4.62 1.03 -7.31 -2.98 -4.99 19 0.000
Sources: Authors Compilation
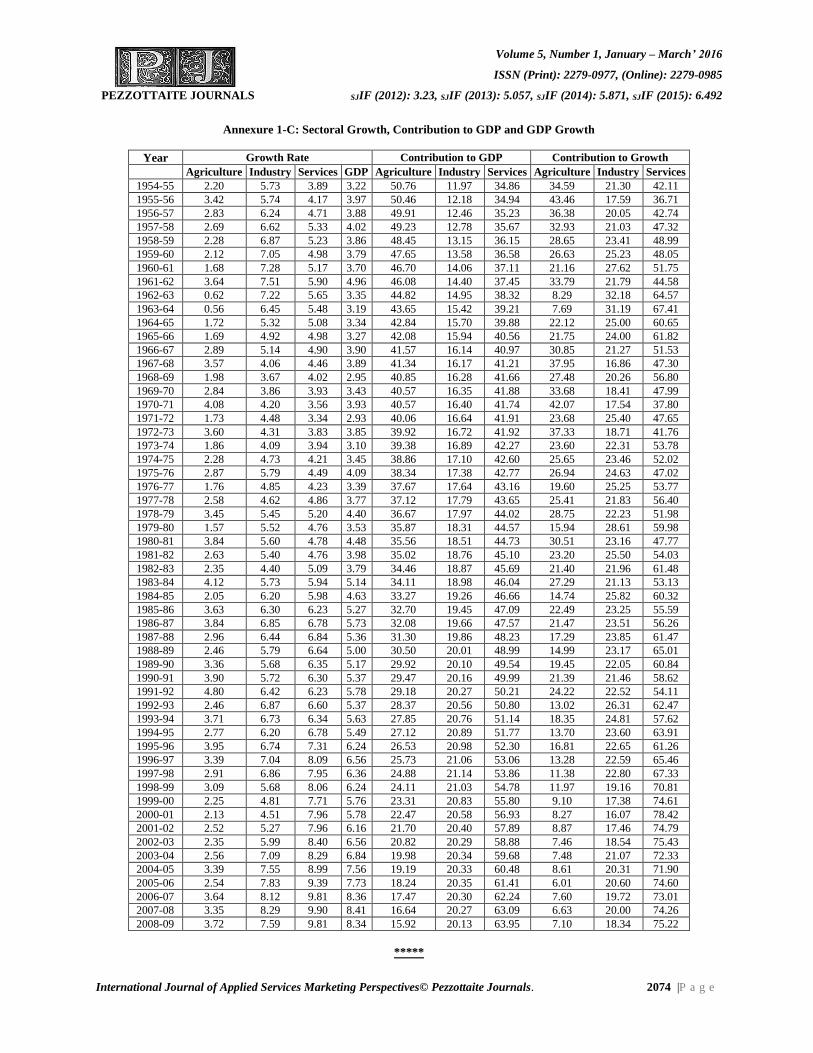
Volume 5, Number 1, January – March’ 2016
ISSN (Print): 2279-0977, (Online): 2279-0985
PEZZOTTAITE JOURNALS SJIF (2012): 3.23, SJIF (2013): 5.057, SJIF (2014): 5.871, SJIF (2015): 6.492
International Journal of Applied Services Marketing Perspectives© Pezzottaite Journals. 2074 |P a g e
Annexure 1-C: Sectoral Growth, Contribution to GDP and GDP Growth
Year Growth Rate Contribution to GDP Contribution to Growth
Agriculture Industry Services GDP Agriculture Industry Services Agriculture Industry Services
1954-55 2.20 5.73 3.89 3.22 50.76 11.97 34.86 34.59 21.30 42.11
1955-56 3.42 5.74 4.17 3.97 50.46 12.18 34.94 43.46 17.59 36.71
1956-57 2.83 6.24 4.71 3.88 49.91 12.46 35.23 36.38 20.05 42.74
1957-58 2.69 6.62 5.33 4.02 49.23 12.78 35.67 32.93 21.03 47.32
1958-59 2.28 6.87 5.23 3.86 48.45 13.15 36.15 28.65 23.41 48.99
1959-60 2.12 7.05 4.98 3.79 47.65 13.58 36.58 26.63 25.23 48.05
1960-61 1.68 7.28 5.17 3.70 46.70 14.06 37.11 21.16 27.62 51.75
1961-62 3.64 7.51 5.90 4.96 46.08 14.40 37.45 33.79 21.79 44.58
1962-63 0.62 7.22 5.65 3.35 44.82 14.95 38.32 8.29 32.18 64.57
1963-64 0.56 6.45 5.48 3.19 43.65 15.42 39.21 7.69 31.19 67.41
1964-65 1.72 5.32 5.08 3.34 42.84 15.70 39.88 22.12 25.00 60.65
1965-66 1.69 4.92 4.98 3.27 42.08 15.94 40.56 21.75 24.00 61.82
1966-67 2.89 5.14 4.90 3.90 41.57 16.14 40.97 30.85 21.27 51.53
1967-68 3.57 4.06 4.46 3.89 41.34 16.17 41.21 37.95 16.86 47.30
1968-69 1.98 3.67 4.02 2.95 40.85 16.28 41.66 27.48 20.26 56.80
1969-70 2.84 3.86 3.93 3.43 40.57 16.35 41.88 33.68 18.41 47.99
1970-71 4.08 4.20 3.56 3.93 40.57 16.40 41.74 42.07 17.54 37.80
1971-72 1.73 4.48 3.34 2.93 40.06 16.64 41.91 23.68 25.40 47.65
1972-73 3.60 4.31 3.83 3.85 39.92 16.72 41.92 37.33 18.71 41.76
1973-74 1.86 4.09 3.94 3.10 39.38 16.89 42.27 23.60 22.31 53.78
1974-75 2.28 4.73 4.21 3.45 38.86 17.10 42.60 25.65 23.46 52.02
1975-76 2.87 5.79 4.49 4.09 38.34 17.38 42.77 26.94 24.63 47.02
1976-77 1.76 4.85 4.23 3.39 37.67 17.64 43.16 19.60 25.25 53.77
1977-78 2.58 4.62 4.86 3.77 37.12 17.79 43.65 25.41 21.83 56.40
1978-79 3.45 5.45 5.20 4.40 36.67 17.97 44.02 28.75 22.23 51.98
1979-80 1.57 5.52 4.76 3.53 35.87 18.31 44.57 15.94 28.61 59.98
1980-81 3.84 5.60 4.78 4.48 35.56 18.51 44.73 30.51 23.16 47.77
1981-82 2.63 5.40 4.76 3.98 35.02 18.76 45.10 23.20 25.50 54.03
1982-83 2.35 4.40 5.09 3.79 34.46 18.87 45.69 21.40 21.96 61.48
1983-84 4.12 5.73 5.94 5.14 34.11 18.98 46.04 27.29 21.13 53.13
1984-85 2.05 6.20 5.98 4.63 33.27 19.26 46.66 14.74 25.82 60.32
1985-86 3.63 6.30 6.23 5.27 32.70 19.45 47.09 22.49 23.25 55.59
1986-87 3.84 6.85 6.78 5.73 32.08 19.66 47.57 21.47 23.51 56.26
1987-88 2.96 6.44 6.84 5.36 31.30 19.86 48.23 17.29 23.85 61.47
1988-89 2.46 5.79 6.64 5.00 30.50 20.01 48.99 14.99 23.17 65.01
1989-90 3.36 5.68 6.35 5.17 29.92 20.10 49.54 19.45 22.05 60.84
1990-91 3.90 5.72 6.30 5.37 29.47 20.16 49.99 21.39 21.46 58.62
1991-92 4.80 6.42 6.23 5.78 29.18 20.27 50.21 24.22 22.52 54.11
1992-93 2.46 6.87 6.60 5.37 28.37 20.56 50.80 13.02 26.31 62.47
1993-94 3.71 6.73 6.34 5.63 27.85 20.76 51.14 18.35 24.81 57.62
1994-95 2.77 6.20 6.78 5.49 27.12 20.89 51.77 13.70 23.60 63.91
1995-96 3.95 6.74 7.31 6.24 26.53 20.98 52.30 16.81 22.65 61.26
1996-97 3.39 7.04 8.09 6.56 25.73 21.06 53.06 13.28 22.59 65.46
1997-98 2.91 6.86 7.95 6.36 24.88 21.14 53.86 11.38 22.80 67.33
1998-99 3.09 5.68 8.06 6.24 24.11 21.03 54.78 11.97 19.16 70.81
1999-00 2.25 4.81 7.71 5.76 23.31 20.83 55.80 9.10 17.38 74.61
2000-01 2.13 4.51 7.96 5.78 22.47 20.58 56.93 8.27 16.07 78.42
2001-02 2.52 5.27 7.96 6.16 21.70 20.40 57.89 8.87 17.46 74.79
2002-03 2.35 5.99 8.40 6.56 20.82 20.29 58.88 7.46 18.54 75.43
2003-04 2.56 7.09 8.29 6.84 19.98 20.34 59.68 7.48 21.07 72.33
2004-05 3.39 7.55 8.99 7.56 19.19 20.33 60.48 8.61 20.31 71.90
2005-06 2.54 7.83 9.39 7.73 18.24 20.35 61.41 6.01 20.60 74.60
2006-07 3.64 8.12 9.81 8.36 17.47 20.30 62.24 7.60 19.72 73.01
2007-08 3.35 8.29 9.90 8.41 16.64 20.27 63.09 6.63 20.00 74.26
2008-09 3.72 7.59 9.81 8.34 15.92 20.13 63.95 7.10 18.34 75.22
*****
Volume 5, Number 1, January – March’ 2016
ISSN (Print): 2279-0977, (Online): 2279-0985
PEZZOTTAITE JOURNALS SJIF (2012): 3.23, SJIF (2013): 5.057, SJIF (2014): 5.871, SJIF (2015): 6.492
International Journal of Applied Services Marketing Perspectives© Pezzottaite Journals. 2075 |P a g e
ECO-DESTINATION OF NITHYAPOOJA KONA: A STUDY
IN KADAPA, Y.S.R. DISTRICT IN ANDHRA PRADESH
N. Sivaparvathi42 B. Gangadhar43
Tourism is travel for pleasure, also the theory and practice of touring, the business of attracting, accommodating, and entertaining
tourists, and the business of operating tours. Tourism may be international or within the traveler’s country. The World Tourism
Organization defines tourism more generally, in terms which “go beyond the common perception of tourism as being limited to
holiday activity only”, as people “travelling to and staying in places outside their usual environment for not more than one
consecutive year for leisure, business and purposes”.
Ecotourism is defined as responsible travel to natural areas that conserves the environment and improves the welfare of local
people. The concept of ecotourism evolved from a need to convert conservation, promotion and protection of environment in to a
massive global economic enterprise. Its popularity is gradually increasing and gaining momentum worldwide. Government of
Andhra Pradesh (A.P) has taken several initiatives including partnerships with private sector to promote ecotourism that are
yielding excellent results.
The World Tourism Organization has defined ecotourism as, “tourism that involves travelling to relatively undisturbed natural
areas with specified objectives of studying, admiring and enjoying the scenery and its wild plants and animals, as well as any
existing cultural aspects found in these areas”. International Ecotourism Society defines ecotourism as, “responsible travel to
natural areas that conserves the environment and improves the welfare of local people”. Ecotourism is also referred to as
“Sustainable Tourism”, “Responsible Tourism”, “Nature Based Travel”, “Green Travel”, and “Cultural Tourism”.
Eco-Tourism is the fastest growing segment of tourism industry. It encompasses activities that make a destination integrated,
environment friendly, sustainable and useful for visitors and local inhabitants. Eco-Tourism is not a nature based tourism
attraction where visitors go and enjoy nature and its surroundings, but is takes place in nature’s solitude, visitors, and destination
operators attempt to envisage appropriate methods and measures to give direct and indirect benefits to both hosts and guests in a
mutually acceptable manner.
Eco-Tourism is the most viable and economically rewarding area of tourism. It ensures conservation of nature and natural
resources, protection of our traditional values, customs and culture, integrity of the Eco-System while producing economic
benefits. It could be as damaging as mass tourism, if not properly planned and organized. Especially, two areas of Eco-tourism are
very sensitive- cultural / ethnic tourism, which is directly associated with human life and nature / wildlife tourism, which is related
with Eco-System.
Accordingly, the Tourism Department of Andhra Pradesh has started taking effective measures to promote tourism, its products
and destinations at local, regional, national and international level. While promoting tourism in the state, it was logical for the
Government of Andhra Pradesh to also leverage its efforts towards tourism promotion to its rich natural and cultural heritage. The
Tourism Department thus started developing such sites with rich natural and environmental resources. Through highly innovative
measures, it also started engaging with the local population in its endeavor to promote tourism in the state.
Thus, ecotourism in Andhra Pradesh is not only providing a rich and meaningful tourism experience to the tourists it is also
generating livelihoods for many families at the destination of ecotourism. Such families who were otherwise deriving their
livelihoods by exploiting natural resources have become protectors of such resources. They have understood that inflow of tourists
to their places and thus their newly acquired livelihoods depends upon protection and promotion of natural resources of their
areas. In the process, they have also started assisting the Forest Department in its efforts to protect and conserve environment.
People want to experienced nature and the world, but should try to do so in a way that does not affect the natural environment. In
response to the increasing appreciation of nature experiences, a new travel ethic has arisen called ecotourism. The Nature
Conservancy adopts the definition articulated by the World Conservation Union. “Environmentally responsible travel to natural
areas, in order to enjoy and appreciate nature that promote conservation, have a low visitor impact and provide for beneficially
active socio-economic involvement of local people’.
42 Lecturer (History), Government Degree College for Men (Autonomous), Andhra Pradesh, India,
[email protected] 43Lecturer (History), SKR & SKR Government College for Woman, Andhra Pradesh, India, [email protected]
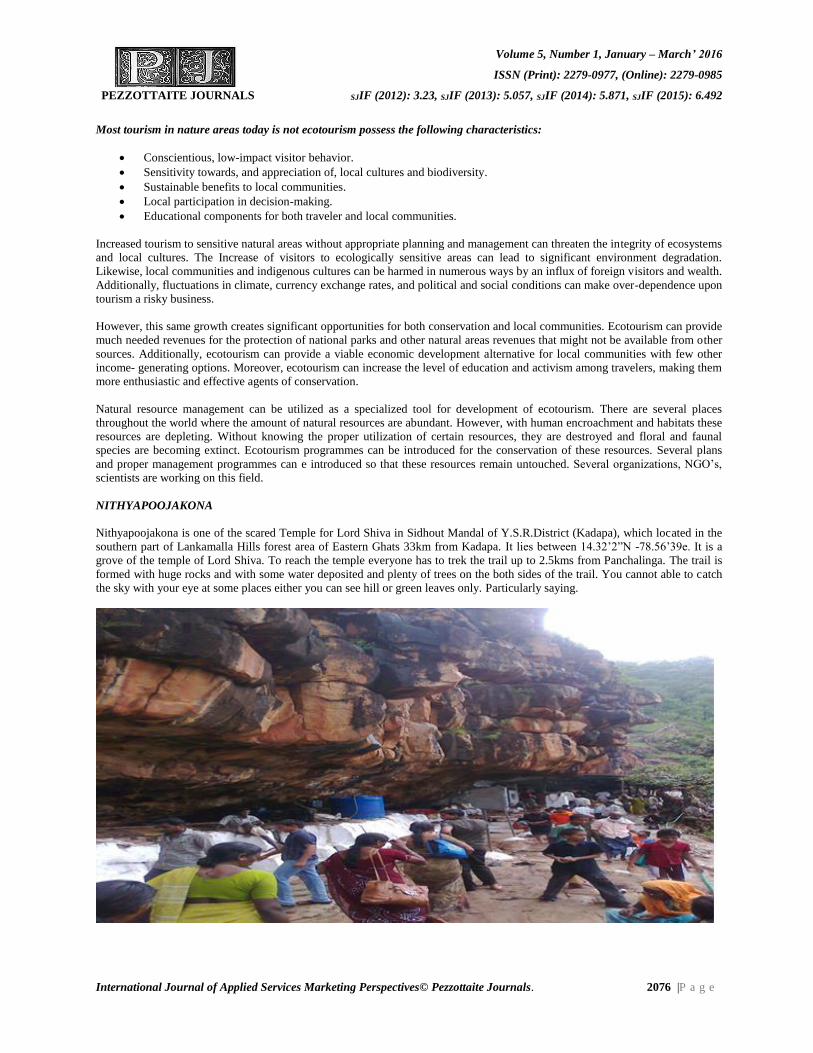
Volume 5, Number 1, January – March’ 2016
ISSN (Print): 2279-0977, (Online): 2279-0985
PEZZOTTAITE JOURNALS SJIF (2012): 3.23, SJIF (2013): 5.057, SJIF (2014): 5.871, SJIF (2015): 6.492
International Journal of Applied Services Marketing Perspectives© Pezzottaite Journals. 2076 |P a g e
Most tourism in nature areas today is not ecotourism possess the following characteristics:
Conscientious, low-impact visitor behavior.
Sensitivity towards, and appreciation of, local cultures and biodiversity.
Sustainable benefits to local communities.
Local participation in decision-making.
Educational components for both traveler and local communities.
Increased tourism to sensitive natural areas without appropriate planning and management can threaten the integrity of ecosystems
and local cultures. The Increase of visitors to ecologically sensitive areas can lead to significant environment degradation.
Likewise, local communities and indigenous cultures can be harmed in numerous ways by an influx of foreign visitors and wealth.
Additionally, fluctuations in climate, currency exchange rates, and political and social conditions can make over-dependence upon
tourism a risky business.
However, this same growth creates significant opportunities for both conservation and local communities. Ecotourism can provide
much needed revenues for the protection of national parks and other natural areas revenues that might not be available from other
sources. Additionally, ecotourism can provide a viable economic development alternative for local communities with few other
income- generating options. Moreover, ecotourism can increase the level of education and activism among travelers, making them
more enthusiastic and effective agents of conservation.
Natural resource management can be utilized as a specialized tool for development of ecotourism. There are several places
throughout the world where the amount of natural resources are abundant. However, with human encroachment and habitats these
resources are depleting. Without knowing the proper utilization of certain resources, they are destroyed and floral and faunal
species are becoming extinct. Ecotourism programmes can be introduced for the conservation of these resources. Several plans
and proper management programmes can e introduced so that these resources remain untouched. Several organizations, NGO’s,
scientists are working on this field.
NITHYAPOOJAKONA
Nithyapoojakona is one of the scared Temple for Lord Shiva in Sidhout Mandal of Y.S.R.District (Kadapa), which located in the
southern part of Lankamalla Hills forest area of Eastern Ghats 33km from Kadapa. It lies between 14.32’2”N -78.56’39e. It is a
grove of the temple of Lord Shiva. To reach the temple everyone has to trek the trail up to 2.5kms from Panchalinga. The trail is
formed with huge rocks and with some water deposited and plenty of trees on the both sides of the trail. You cannot able to catch
the sky with your eye at some places either you can see hill or green leaves only. Particularly saying.

Volume 5, Number 1, January – March’ 2016
ISSN (Print): 2279-0977, (Online): 2279-0985
PEZZOTTAITE JOURNALS SJIF (2012): 3.23, SJIF (2013): 5.057, SJIF (2014): 5.871, SJIF (2015): 6.492
International Journal of Applied Services Marketing Perspectives© Pezzottaite Journals. 2077 |P a g e
Nithyapoojakona waterfalls cascading down a height of 100 feet. The water flows through the trail also and in rainy seasons, you
can experience walking on water. There is no written history about this groove but the tale is just like Tirumala. Lord Shiva came
to earth and residing at Nithyapoojakona. Every day one cow used to give milk to Shiva. The owner of the cow observed it and he
beats the Shiva later he realizes and became devotee 1000 trees were seen in the groove, 181 species of probable medicinal
potential belonging to 138 genera and 71 families. World famous Red sanders population of the area is being destroyed
unethically and it is to be protected.
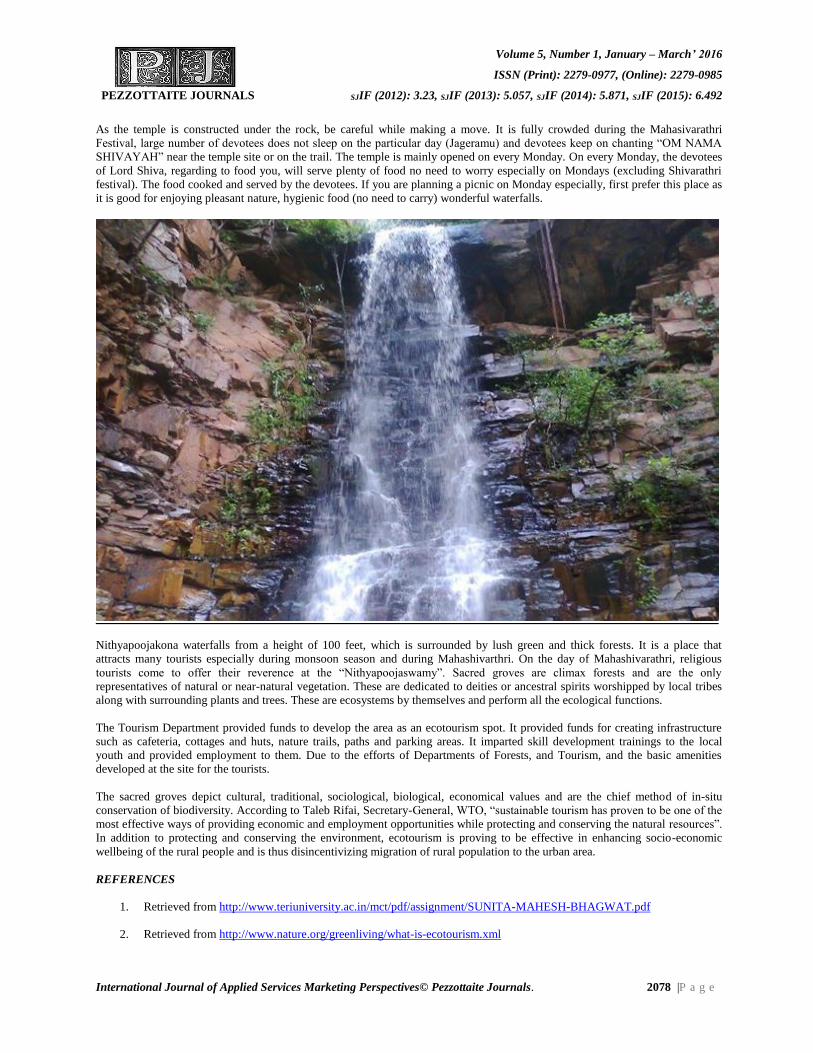
Volume 5, Number 1, January – March’ 2016
ISSN (Print): 2279-0977, (Online): 2279-0985
PEZZOTTAITE JOURNALS SJIF (2012): 3.23, SJIF (2013): 5.057, SJIF (2014): 5.871, SJIF (2015): 6.492
International Journal of Applied Services Marketing Perspectives© Pezzottaite Journals. 2078 |P a g e
As the temple is constructed under the rock, be careful while making a move. It is fully crowded during the Mahasivarathri
Festival, large number of devotees does not sleep on the particular day (Jageramu) and devotees keep on chanting “OM NAMA
SHIVAYAH” near the temple site or on the trail. The temple is mainly opened on every Monday. On every Monday, the devotees
of Lord Shiva, regarding to food you, will serve plenty of food no need to worry especially on Mondays (excluding Shivarathri
festival). The food cooked and served by the devotees. If you are planning a picnic on Monday especially, first prefer this place as
it is good for enjoying pleasant nature, hygienic food (no need to carry) wonderful waterfalls.
Nithyapoojakona waterfalls from a height of 100 feet, which is surrounded by lush green and thick forests. It is a place that
attracts many tourists especially during monsoon season and during Mahashivarthri. On the day of Mahashivarathri, religious
tourists come to offer their reverence at the “Nithyapoojaswamy”. Sacred groves are climax forests and are the only
representatives of natural or near-natural vegetation. These are dedicated to deities or ancestral spirits worshipped by local tribes
along with surrounding plants and trees. These are ecosystems by themselves and perform all the ecological functions.
The Tourism Department provided funds to develop the area as an ecotourism spot. It provided funds for creating infrastructure
such as cafeteria, cottages and huts, nature trails, paths and parking areas. It imparted skill development trainings to the local
youth and provided employment to them. Due to the efforts of Departments of Forests, and Tourism, and the basic amenities
developed at the site for the tourists.
The sacred groves depict cultural, traditional, sociological, biological, economical values and are the chief method of in-situ
conservation of biodiversity. According to Taleb Rifai, Secretary-General, WTO, “sustainable tourism has proven to be one of the
most effective ways of providing economic and employment opportunities while protecting and conserving the natural resources”.
In addition to protecting and conserving the environment, ecotourism is proving to be effective in enhancing socio-economic
wellbeing of the rural people and is thus disincentivizing migration of rural population to the urban area.
REFERENCES
1. Retrieved from http://www.teriuniversity.ac.in/mct/pdf/assignment/SUNITA-MAHESH-BHAGWAT.pdf
2. Retrieved from http://www.nature.org/greenliving/what-is-ecotourism.xml
Volume 5, Number 1, January – March’ 2016
ISSN (Print): 2279-0977, (Online): 2279-0985
PEZZOTTAITE JOURNALS SJIF (2012): 3.23, SJIF (2013): 5.057, SJIF (2014): 5.871, SJIF (2015): 6.492
International Journal of Applied Services Marketing Perspectives© Pezzottaite Journals. 2079 |P a g e
3. Retrieved from https://www.linkedin.com/pulse/20141020183324-57503751-ecotourism-in-nepal
4. Retrieved from http://www.guyanatimesgy.com/2014/08/18/wildlife-and-ecotourism/
5. Retrieved from https://en.wikipedia.org/wiki/Ecotourism#Criteria
6. Retrieved from https://en.wikipedia.org/wiki/Ecotourism#Terminology_and_history
7. Retrieved from https://en.wikipedia.org/wiki/Tourist#Significance_of_tourism
8. Retrieved from https://en.wikipedia.org/wiki/Tourism#Significance_of_tourism
9. Retrieved from https://en.wikipedia.org/wiki/Tourism#Etymology
10. Retrieved from http://www.nepjol.info/index.php/IJE/article/view/12648
11. Retrieved from http://westbengalforest.gov.in/urls_all/activities_eco_tourism.html
12. Retrieved from http://untamedpath.com/eco-tours/defining-ecotourism.shtml
13. Retrieved from http://www.orissa.gov.in/e-magazine/Orissareview/Sept2004/englishPdf/Marketing.pdf
*****
CALL TO JOIN AS MEMBER OF EDITORIAL ADVISORY BOARD
We present you an opportunity to join Pezzottaite Journals as member of ‘Editorial Advisory Board’ and ‘Reviewers
Board’. The emphasis will be on publishing quality articles rapidly and making them available to researchers worldwide.
Pezzottaite Journals is dedicated to publish peer-reviewed significant research work and delivering quality content through
information sharing. Pezzottaite Journals seek academicians and corporate people from around the world who are interested in
serving our voluntarily ‘Editorial Advisory Board’ and ‘Reviewers Board’.
Your professional involvement will greatly benefit the success of Pezzottaite Journals. You have privilege to nominate
yourself for any /all of our journals after going through the ‘Aims & Scope of Journals’.
Qualifying Norms:
For member of ‘Editorial Advisory Board’ & ‘Reviewers Board’, you must be one of the following:
Vice Chancellors / Deans / Directors / Principals / Head of Departments / Professors / Associate Professors with D.Sc. /
D.Litt. / Ph.D. only;
Government Department Heads;
Senior Professionals from Corporate;
Retired Senior Professionals from Government / Corporate / Academia are also welcome.
Please forward below stated details at [email protected].
Updated Resume,
A Scanned Photograph, and
Academic Area of Interest.
If you have any query, write to us. We will respond to you inquiry, shortly.
(sd/-)
(Editor-In-Chief)
Volume 5, Number 1, January – March’ 2016
ISSN (Print): 2279-0977, (Online): 2279-0985
PEZZOTTAITE JOURNALS SJIF (2012): 3.23, SJIF (2013): 5.057, SJIF (2014): 5.871, SJIF (2015): 6.492
International Journal of Applied Services Marketing Perspectives© Pezzottaite Journals. 2080 |P a g e
EMERGING TRENDS IN CONSUMER BEHAVIOUR IN ONLINE BUYING:
A KALEIDOSCOPIC VIEW
Ivaturi Murali Krishna44 Dr. G. V. Chalam45
ABSTRACT
It is an internet era and e-Commerce has become an essential characteristic of this era. The University of California, Los
Angeles (UCLA) Center for Communication Policy reinstates that online shopping has become the third most popular internet
activity, following the e-mail using/instant messaging and web browsing. According to the UCLA, e-Commerce has become
more common than seeking net entertainment information and news, two commonly thought of activities when considering
what internet users do when online. Consumer behavior online thus, deals with psychological state of the consumer while
purchasing on internet. In recent studies, it has been observed that following consumer behavior patterns are evolving in
online marketing. They are: consumers are shifting to more sophisticated queries to increase the chance of finding the exact
product they desire; consumers are now embracing an increased visual culture. The one-step solution for the above mentioned
consumer behavior is optimized data feed. Successful search marketers need to understand data feeds and start thinking about
how these programs can work together to improve brand image and online sales.
KEYWORDS
Consumer Behavior, e-Marketing Strategies, Online Shopping etc.
INTRODUCTION
Over the past few decades, internet penetration has been steadily growing and the number of people using it for performing
business transactions and digital/electronic commerce has turned into a major phenomenon across the globe. Indian internet
retailing touched US $10.672 billion in 2013. The increased use of Smartphone and tablets, along with advanced security features
being offered by the online retailers are adding strength to e-commerce industry. Growing at an astonishing rate at 85 per cent, as
against 65 per cent growth of regular shopping over the previous year, internet retailing in India touched US $10.672 billion in
2013, making it one of the most anticipated destinations for national and multinational online retailers. This study gains
importance as Indian arms of multinational online selling companies like Amazon and eBay are fighting various homegrown
players like Snapdeal, Flipkart and many more.
As one of the most convenient methods of shopping, online shopping provides functional as well as practical benefits. Consumers
perceive that buying through the internet provides them with the possibility of availability of products and services at a lesser
price as compared to the offline stores. Instantly fulfilling their emotional and hedonistic requirements are other significant
benefits that consumers are able to draw upon through online shopping. There are people who shop online only for fun, pleasure
and gratification. Growth in the number of mobile subscribers, especially Smartphone users is further driving the growth of online
shopping. The number of people using the internet on mobiles crossed 155 million by the end of March 2014, and 185 million by
June 2014.
The internet and web technologies provide means and tools for an advanced comprehension and improved service of online
customers, helping companies to gain their loyalty. If a company directs its resources to potential and current customers, in order
to gain their trust, and to use web technologies to better understand them, then that company is building the foundation for profits
of years to come. The use of smart phones for mobile shopping has become increasingly popular and has caused revolutionary
changes in consumer behaviors. Consumers can easily find and cheaply purchase products and services by engaging in mobile
shopping.
The rise of web 2.0 tools and mobile devices means that the image of the traditional consumer has to be replaced with an active,
permanently connected, consumer who uses the Internet to find information about brands and to share opinions and shopping
experiences with other consumers - a consumer who can be classified as a prosumer (producer + consumer). In this context, it is
important for marketers to know how consumers use social networks within their purchasing decision process. Since the creation
of Face book in 2006, social networks have quickly become a platform in which citizens feel comfortable interacting with each
other. They have not only become a sociological phenomenon, but also a marketing opportunity that firms are unwilling to let go
44Research Scholar, Department of Commerce & Business Administration, Acharya Nagarjuna University, Andhra Pradesh, India,
[email protected] 45 Professor, Department of Commerce & Business Administration, Acharya Nagarjuna University, Andhra Pradesh, India,
Volume 5, Number 1, January – March’ 2016
ISSN (Print): 2279-0977, (Online): 2279-0985
PEZZOTTAITE JOURNALS SJIF (2012): 3.23, SJIF (2013): 5.057, SJIF (2014): 5.871, SJIF (2015): 6.492
International Journal of Applied Services Marketing Perspectives© Pezzottaite Journals. 2081 |P a g e
by. In this context, Face book can have a real impact on the four stages of the purchasing decision processes that follow
recognition of need: the search for information, the evaluation of alternatives, the purchase, and subsequent evaluation
Technology Acceptance Model (TAM) designed to explain and predict how individuals decide to adopt a particular technology.
This model is a preferred choice when parsimony, research costs and outcomes are considered. We choose this model because
TAM explains more variance in attitude toward a technology, and a comparable percentage of variance in usage and the TAM
constructs are more amenable to operationalization and empirical testing than other models. The impact of information technology
(IT) services on businesses in every industry has never been greater. Indeed, it is rare to find a product or service that is not
touched by, or enabled by IT in some manner. IT is a key source of innovations that drive growth. Smarter IT service innovations
will enable e-commerce’s growth via optimization and transformation.
SIGNIFICANCE OF STUDY
The main purpose of this paper is to study the emerging trends in consumer online behavior in the emerging markets in India.
Here, it is proposed to understand the evolution, growth and development of e-Commerce as a prelude. Further, it is also proposed
to study the evolution of consumer online behavior in India and by comparison try to arrive at today’s online Indian consumers.
The study also focuses on e-WOM, which is an emerging trend, setting the purchase engine of online consumption on. Besides,
the study also covered to know how channels are playing a significant role in purchase decisions.
SURVEY OF LITERATURE
According to Sheridon Orr (2013) today’s busy consumer, caught in a whirlwind of information, has little patience for convoluted
purchase path. Instead, they want their search to yield exactly the information they need- validation, reviewer specs and price. To
ensure they get the results they desire, Consumers have modified their behavior-using more sophisticated search queries, relying
on product images, reading recommendations, researching the facts and finding the best price.
Sanjay Hooda and Sandeep Agarwal (2012) examine the key consumer behavior attributes and relations among them in e-
marketing perspective. In this paper attempt has been made to study the acceptance rate of e-marketing among Jaipur consumers
and its impact on their purchase decision. Most of the respondents irrespective of gender of different age group find e-shopping
more convenient and time saving and prefer credit card as the convenient mode of payment.
Efthymios Constantinides (2004) addresses one of the fundamental issues of e-marketing, how to attract and win over the
consumers in the highly competitive internet market place. His paper analyses the factors affecting the online consumer behavior
and examines how e-marketers can influence the outcome of the virtual interaction and buying process by focusing their
marketing efforts on elements shaping the customer virtual experience, the web experience.
Mark Brown and Rose Muchira (2004) in their paper investigate the relationship between internet privacy concerns and online
purchase behavior note many organizations now emphasize the use of technology that can help them get closer to consumers and
build on going relationships with them .It is often assumed that consumers like to believe that they can trust a company with their
personal details. Lack of trust may cause consumers to have privacy concerns. The authors opine collecting data about consumers
is helpful but perhaps it is even more important to use the data collected in a way that does not cause consumers to be concerned.
Svatosova Veronika (2013) shows buyer behavior of consumers plays one of the key roles in fulfillment of the main goals of a
company. It is influenced by many external and internal factors but the company can also influence the final process of buyer
decision-making significantly by its activities. It also focuses on analyzing the behavior of consumer when shopping on internet
and their motives. The results of the study shows the motives of online shopping behavior are independent of age of respondents.
Motives in each age group are the same and related.
RESEARCH GAP
Although there is a lot of research on e-Commerce and consumer behavior, there is a very little research in the synthesis of these
two, i.e., online consumer behavior. In fact, there is no standard literature on online consumer behavior. This study addresses this
problem in a small scale. In recent years, there is a rapid development in e-commerce industry. Online retail competition is
heating up as consumer behavior is becoming more and well informed on the web. Competition is increasing day by day with it
online consumer expectations are also skyrocketing. Therefore, it is becoming a norm to provide online shoppers a strong online
shopping experience. Here we try to study how the sites that perform best in customer experience have a significant advantage in
driving online sales.
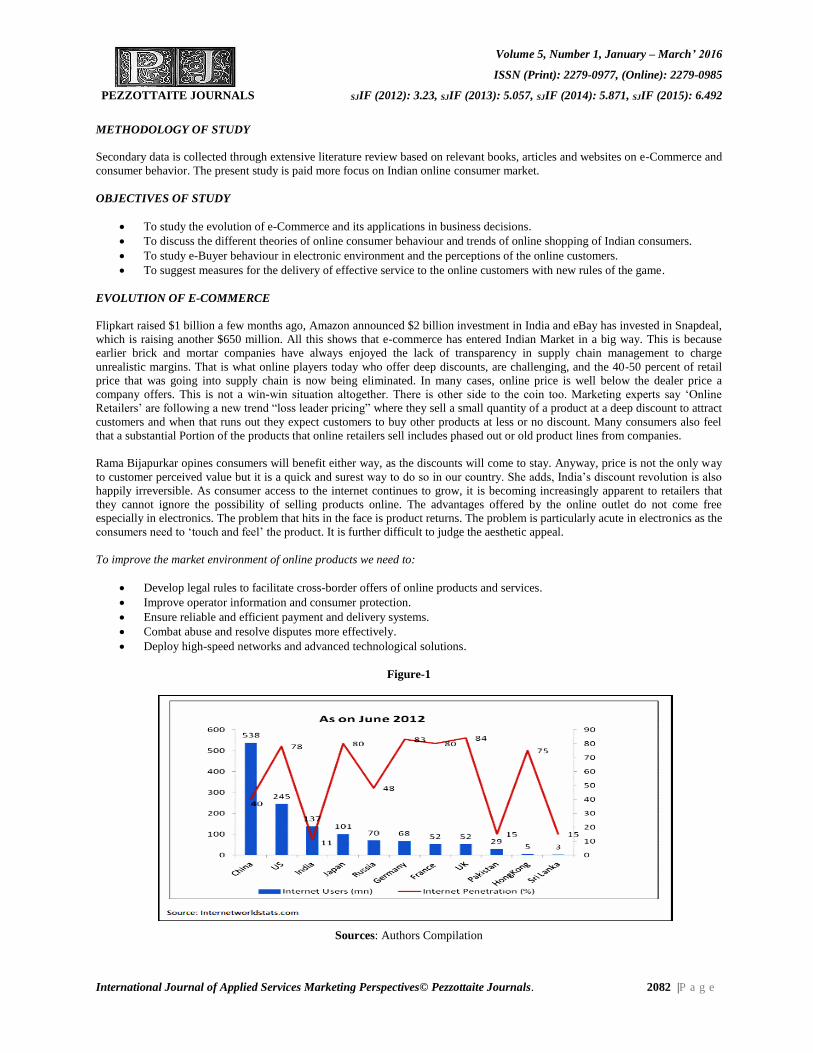
Volume 5, Number 1, January – March’ 2016
ISSN (Print): 2279-0977, (Online): 2279-0985
PEZZOTTAITE JOURNALS SJIF (2012): 3.23, SJIF (2013): 5.057, SJIF (2014): 5.871, SJIF (2015): 6.492
International Journal of Applied Services Marketing Perspectives© Pezzottaite Journals. 2082 |P a g e
METHODOLOGY OF STUDY
Secondary data is collected through extensive literature review based on relevant books, articles and websites on e-Commerce and
consumer behavior. The present study is paid more focus on Indian online consumer market.
OBJECTIVES OF STUDY
To study the evolution of e-Commerce and its applications in business decisions.
To discuss the different theories of online consumer behaviour and trends of online shopping of Indian consumers.
To study e-Buyer behaviour in electronic environment and the perceptions of the online customers.
To suggest measures for the delivery of effective service to the online customers with new rules of the game.
EVOLUTION OF E-COMMERCE
Flipkart raised $1 billion a few months ago, Amazon announced $2 billion investment in India and eBay has invested in Snapdeal,
which is raising another $650 million. All this shows that e-commerce has entered Indian Market in a big way. This is because
earlier brick and mortar companies have always enjoyed the lack of transparency in supply chain management to charge
unrealistic margins. That is what online players today who offer deep discounts, are challenging, and the 40-50 percent of retail
price that was going into supply chain is now being eliminated. In many cases, online price is well below the dealer price a
company offers. This is not a win-win situation altogether. There is other side to the coin too. Marketing experts say ‘Online
Retailers’ are following a new trend “loss leader pricing” where they sell a small quantity of a product at a deep discount to attract
customers and when that runs out they expect customers to buy other products at less or no discount. Many consumers also feel
that a substantial Portion of the products that online retailers sell includes phased out or old product lines from companies.
Rama Bijapurkar opines consumers will benefit either way, as the discounts will come to stay. Anyway, price is not the only way
to customer perceived value but it is a quick and surest way to do so in our country. She adds, India’s discount revolution is also
happily irreversible. As consumer access to the internet continues to grow, it is becoming increasingly apparent to retailers that
they cannot ignore the possibility of selling products online. The advantages offered by the online outlet do not come free
especially in electronics. The problem that hits in the face is product returns. The problem is particularly acute in electronics as the
consumers need to ‘touch and feel’ the product. It is further difficult to judge the aesthetic appeal.
To improve the market environment of online products we need to:
Develop legal rules to facilitate cross-border offers of online products and services.
Improve operator information and consumer protection.
Ensure reliable and efficient payment and delivery systems.
Combat abuse and resolve disputes more effectively.
Deploy high-speed networks and advanced technological solutions.
Figure-1
Sources: Authors Compilation
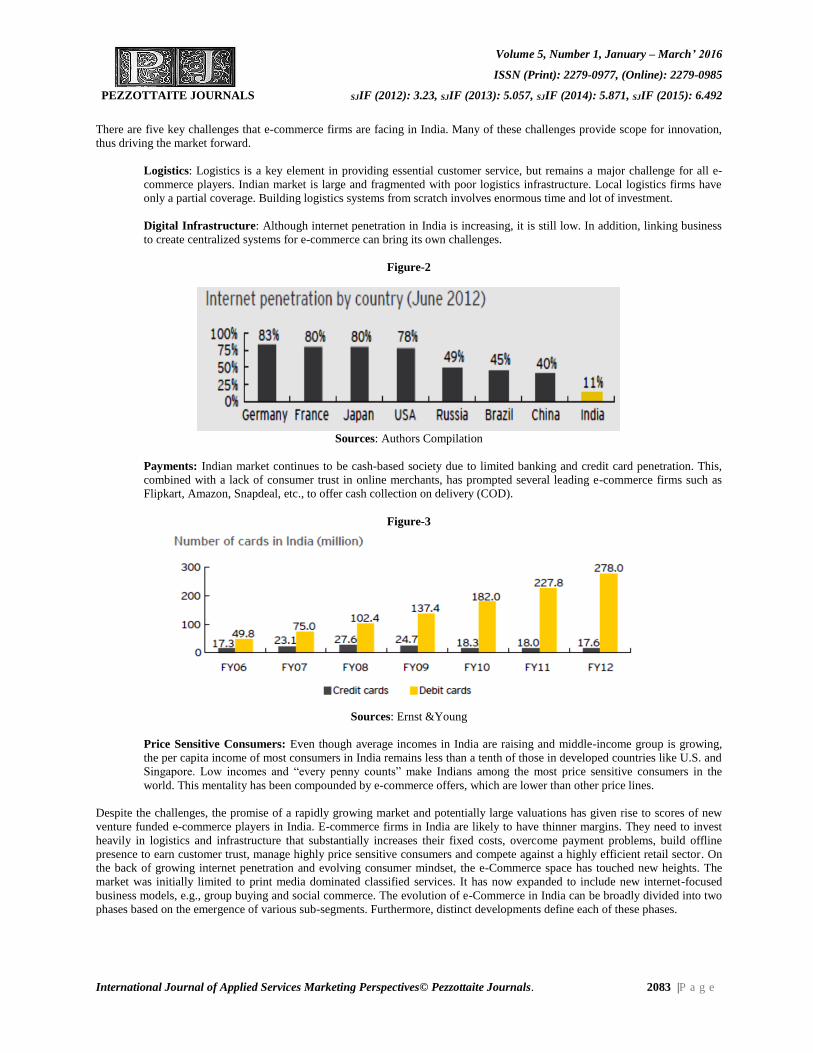
Volume 5, Number 1, January – March’ 2016
ISSN (Print): 2279-0977, (Online): 2279-0985
PEZZOTTAITE JOURNALS SJIF (2012): 3.23, SJIF (2013): 5.057, SJIF (2014): 5.871, SJIF (2015): 6.492
International Journal of Applied Services Marketing Perspectives© Pezzottaite Journals. 2083 |P a g e
There are five key challenges that e-commerce firms are facing in India. Many of these challenges provide scope for innovation,
thus driving the market forward.
Logistics: Logistics is a key element in providing essential customer service, but remains a major challenge for all e-
commerce players. Indian market is large and fragmented with poor logistics infrastructure. Local logistics firms have
only a partial coverage. Building logistics systems from scratch involves enormous time and lot of investment.
Digital Infrastructure: Although internet penetration in India is increasing, it is still low. In addition, linking business
to create centralized systems for e-commerce can bring its own challenges.
Figure-2
Sources: Authors Compilation
Payments: Indian market continues to be cash-based society due to limited banking and credit card penetration. This,
combined with a lack of consumer trust in online merchants, has prompted several leading e-commerce firms such as
Flipkart, Amazon, Snapdeal, etc., to offer cash collection on delivery (COD).
Figure-3
Sources: Ernst &Young
Price Sensitive Consumers: Even though average incomes in India are raising and middle-income group is growing,
the per capita income of most consumers in India remains less than a tenth of those in developed countries like U.S. and
Singapore. Low incomes and “every penny counts” make Indians among the most price sensitive consumers in the
world. This mentality has been compounded by e-commerce offers, which are lower than other price lines.
Despite the challenges, the promise of a rapidly growing market and potentially large valuations has given rise to scores of new
venture funded e-commerce players in India. E-commerce firms in India are likely to have thinner margins. They need to invest
heavily in logistics and infrastructure that substantially increases their fixed costs, overcome payment problems, build offline
presence to earn customer trust, manage highly price sensitive consumers and compete against a highly efficient retail sector. On
the back of growing internet penetration and evolving consumer mindset, the e-Commerce space has touched new heights. The
market was initially limited to print media dominated classified services. It has now expanded to include new internet-focused
business models, e.g., group buying and social commerce. The evolution of e-Commerce in India can be broadly divided into two
phases based on the emergence of various sub-segments. Furthermore, distinct developments define each of these phases.
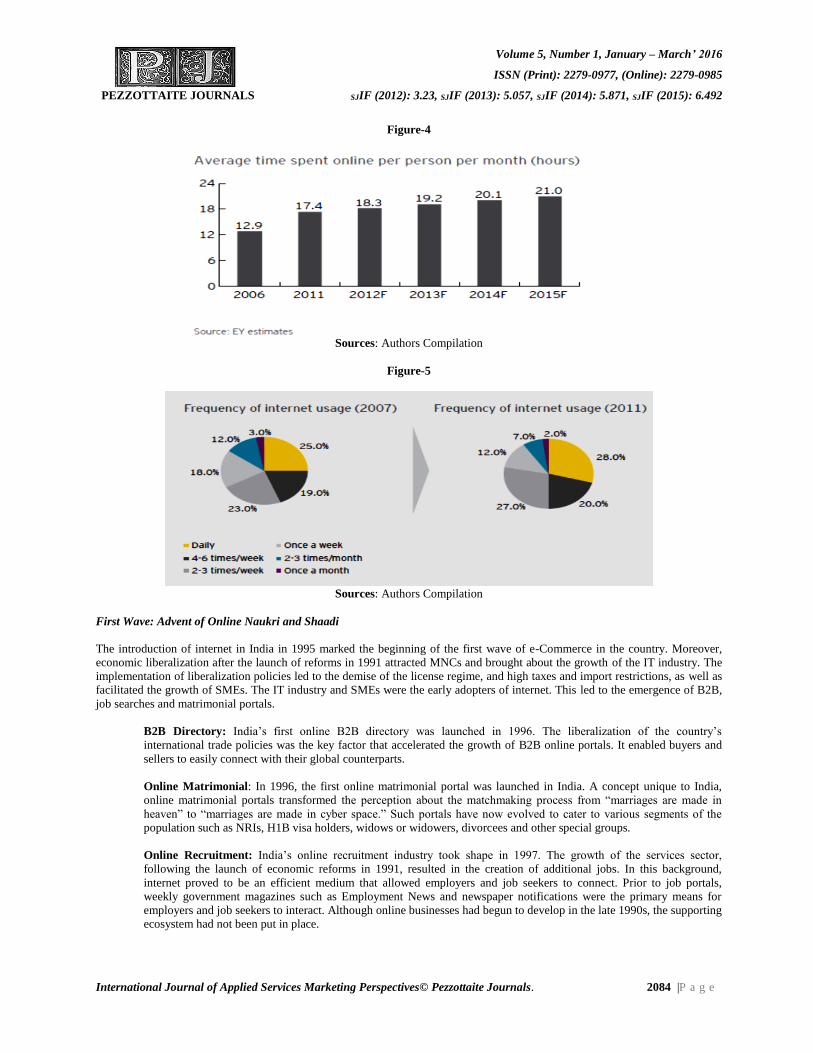
Volume 5, Number 1, January – March’ 2016
ISSN (Print): 2279-0977, (Online): 2279-0985
PEZZOTTAITE JOURNALS SJIF (2012): 3.23, SJIF (2013): 5.057, SJIF (2014): 5.871, SJIF (2015): 6.492
International Journal of Applied Services Marketing Perspectives© Pezzottaite Journals. 2084 |P a g e
Figure-4
Sources: Authors Compilation
Figure-5
Sources: Authors Compilation
First Wave: Advent of Online Naukri and Shaadi
The introduction of internet in India in 1995 marked the beginning of the first wave of e-Commerce in the country. Moreover,
economic liberalization after the launch of reforms in 1991 attracted MNCs and brought about the growth of the IT industry. The
implementation of liberalization policies led to the demise of the license regime, and high taxes and import restrictions, as well as
facilitated the growth of SMEs. The IT industry and SMEs were the early adopters of internet. This led to the emergence of B2B,
job searches and matrimonial portals.
B2B Directory: India’s first online B2B directory was launched in 1996. The liberalization of the country’s
international trade policies was the key factor that accelerated the growth of B2B online portals. It enabled buyers and
sellers to easily connect with their global counterparts.
Online Matrimonial: In 1996, the first online matrimonial portal was launched in India. A concept unique to India,
online matrimonial portals transformed the perception about the matchmaking process from “marriages are made in
heaven” to “marriages are made in cyber space.” Such portals have now evolved to cater to various segments of the
population such as NRIs, H1B visa holders, widows or widowers, divorcees and other special groups.
Online Recruitment: India’s online recruitment industry took shape in 1997. The growth of the services sector,
following the launch of economic reforms in 1991, resulted in the creation of additional jobs. In this background,
internet proved to be an efficient medium that allowed employers and job seekers to connect. Prior to job portals,
weekly government magazines such as Employment News and newspaper notifications were the primary means for
employers and job seekers to interact. Although online businesses had begun to develop in the late 1990s, the supporting
ecosystem had not been put in place.
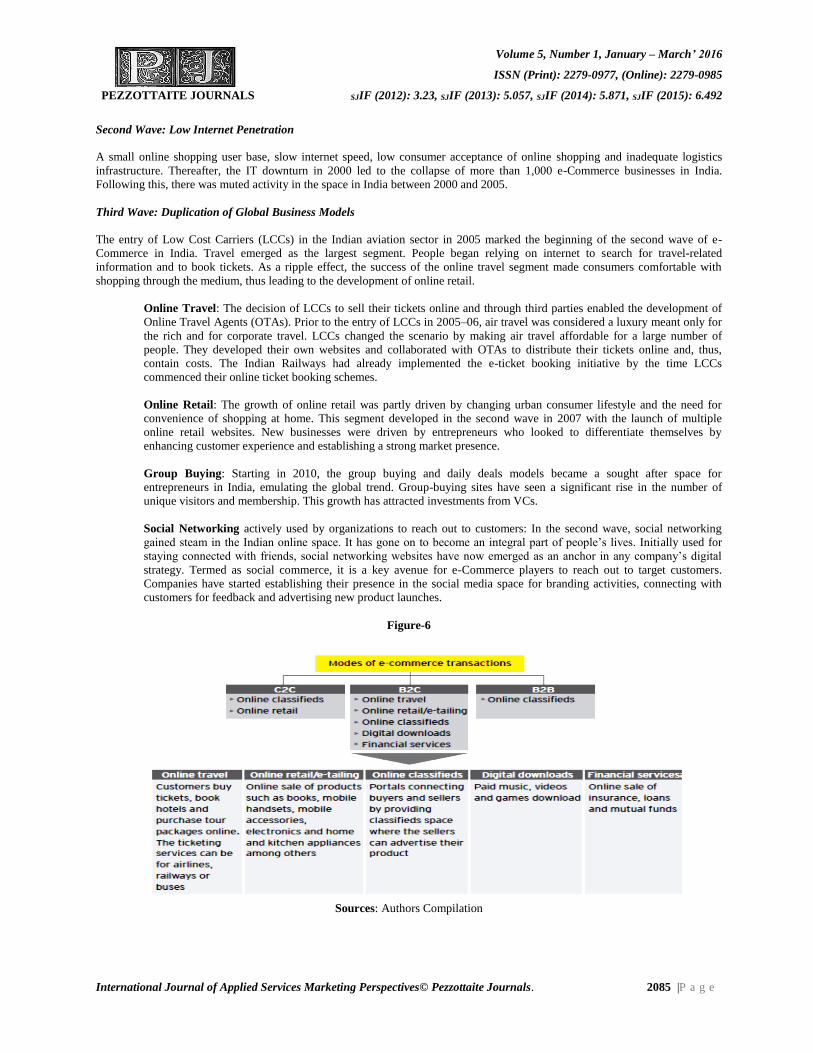
Volume 5, Number 1, January – March’ 2016
ISSN (Print): 2279-0977, (Online): 2279-0985
PEZZOTTAITE JOURNALS SJIF (2012): 3.23, SJIF (2013): 5.057, SJIF (2014): 5.871, SJIF (2015): 6.492
International Journal of Applied Services Marketing Perspectives© Pezzottaite Journals. 2085 |P a g e
Second Wave: Low Internet Penetration
A small online shopping user base, slow internet speed, low consumer acceptance of online shopping and inadequate logistics
infrastructure. Thereafter, the IT downturn in 2000 led to the collapse of more than 1,000 e-Commerce businesses in India.
Following this, there was muted activity in the space in India between 2000 and 2005.
Third Wave: Duplication of Global Business Models
The entry of Low Cost Carriers (LCCs) in the Indian aviation sector in 2005 marked the beginning of the second wave of e-
Commerce in India. Travel emerged as the largest segment. People began relying on internet to search for travel-related
information and to book tickets. As a ripple effect, the success of the online travel segment made consumers comfortable with
shopping through the medium, thus leading to the development of online retail.
Online Travel: The decision of LCCs to sell their tickets online and through third parties enabled the development of
Online Travel Agents (OTAs). Prior to the entry of LCCs in 2005–06, air travel was considered a luxury meant only for
the rich and for corporate travel. LCCs changed the scenario by making air travel affordable for a large number of
people. They developed their own websites and collaborated with OTAs to distribute their tickets online and, thus,
contain costs. The Indian Railways had already implemented the e-ticket booking initiative by the time LCCs
commenced their online ticket booking schemes.
Online Retail: The growth of online retail was partly driven by changing urban consumer lifestyle and the need for
convenience of shopping at home. This segment developed in the second wave in 2007 with the launch of multiple
online retail websites. New businesses were driven by entrepreneurs who looked to differentiate themselves by
enhancing customer experience and establishing a strong market presence.
Group Buying: Starting in 2010, the group buying and daily deals models became a sought after space for
entrepreneurs in India, emulating the global trend. Group-buying sites have seen a significant rise in the number of
unique visitors and membership. This growth has attracted investments from VCs.
Social Networking actively used by organizations to reach out to customers: In the second wave, social networking
gained steam in the Indian online space. It has gone on to become an integral part of people’s lives. Initially used for
staying connected with friends, social networking websites have now emerged as an anchor in any company’s digital
strategy. Termed as social commerce, it is a key avenue for e-Commerce players to reach out to target customers.
Companies have started establishing their presence in the social media space for branding activities, connecting with
customers for feedback and advertising new product launches.
Figure-6
Sources: Authors Compilation
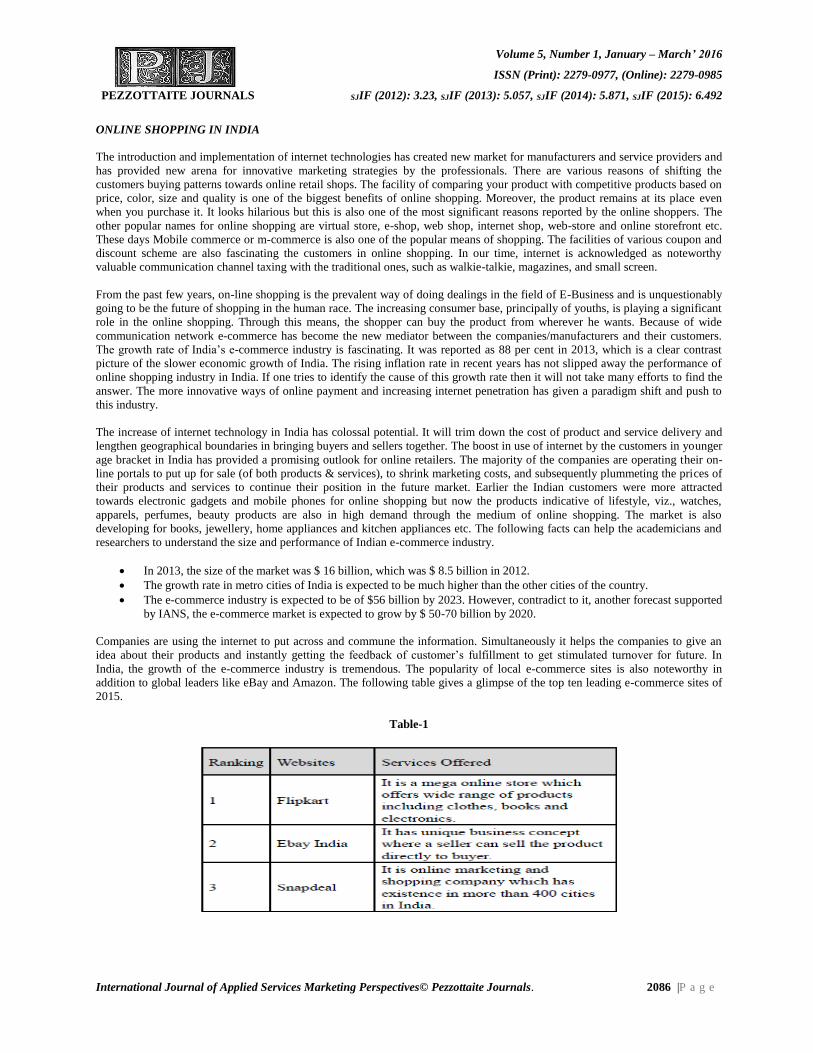
Volume 5, Number 1, January – March’ 2016
ISSN (Print): 2279-0977, (Online): 2279-0985
PEZZOTTAITE JOURNALS SJIF (2012): 3.23, SJIF (2013): 5.057, SJIF (2014): 5.871, SJIF (2015): 6.492
International Journal of Applied Services Marketing Perspectives© Pezzottaite Journals. 2086 |P a g e
ONLINE SHOPPING IN INDIA
The introduction and implementation of internet technologies has created new market for manufacturers and service providers and
has provided new arena for innovative marketing strategies by the professionals. There are various reasons of shifting the
customers buying patterns towards online retail shops. The facility of comparing your product with competitive products based on
price, color, size and quality is one of the biggest benefits of online shopping. Moreover, the product remains at its place even
when you purchase it. It looks hilarious but this is also one of the most significant reasons reported by the online shoppers. The
other popular names for online shopping are virtual store, e-shop, web shop, internet shop, web-store and online storefront etc.
These days Mobile commerce or m-commerce is also one of the popular means of shopping. The facilities of various coupon and
discount scheme are also fascinating the customers in online shopping. In our time, internet is acknowledged as noteworthy
valuable communication channel taxing with the traditional ones, such as walkie-talkie, magazines, and small screen.
From the past few years, on-line shopping is the prevalent way of doing dealings in the field of E-Business and is unquestionably
going to be the future of shopping in the human race. The increasing consumer base, principally of youths, is playing a significant
role in the online shopping. Through this means, the shopper can buy the product from wherever he wants. Because of wide
communication network e-commerce has become the new mediator between the companies/manufacturers and their customers.
The growth rate of India’s e-commerce industry is fascinating. It was reported as 88 per cent in 2013, which is a clear contrast
picture of the slower economic growth of India. The rising inflation rate in recent years has not slipped away the performance of
online shopping industry in India. If one tries to identify the cause of this growth rate then it will not take many efforts to find the
answer. The more innovative ways of online payment and increasing internet penetration has given a paradigm shift and push to
this industry.
The increase of internet technology in India has colossal potential. It will trim down the cost of product and service delivery and
lengthen geographical boundaries in bringing buyers and sellers together. The boost in use of internet by the customers in younger
age bracket in India has provided a promising outlook for online retailers. The majority of the companies are operating their on-
line portals to put up for sale (of both products & services), to shrink marketing costs, and subsequently plummeting the prices of
their products and services to continue their position in the future market. Earlier the Indian customers were more attracted
towards electronic gadgets and mobile phones for online shopping but now the products indicative of lifestyle, viz., watches,
apparels, perfumes, beauty products are also in high demand through the medium of online shopping. The market is also
developing for books, jewellery, home appliances and kitchen appliances etc. The following facts can help the academicians and
researchers to understand the size and performance of Indian e-commerce industry.
In 2013, the size of the market was $ 16 billion, which was $ 8.5 billion in 2012.
The growth rate in metro cities of India is expected to be much higher than the other cities of the country.
The e-commerce industry is expected to be of $56 billion by 2023. However, contradict to it, another forecast supported
by IANS, the e-commerce market is expected to grow by $ 50-70 billion by 2020.
Companies are using the internet to put across and commune the information. Simultaneously it helps the companies to give an
idea about their products and instantly getting the feedback of customer’s fulfillment to get stimulated turnover for future. In
India, the growth of the e-commerce industry is tremendous. The popularity of local e-commerce sites is also noteworthy in
addition to global leaders like eBay and Amazon. The following table gives a glimpse of the top ten leading e-commerce sites of
2015.
Table-1
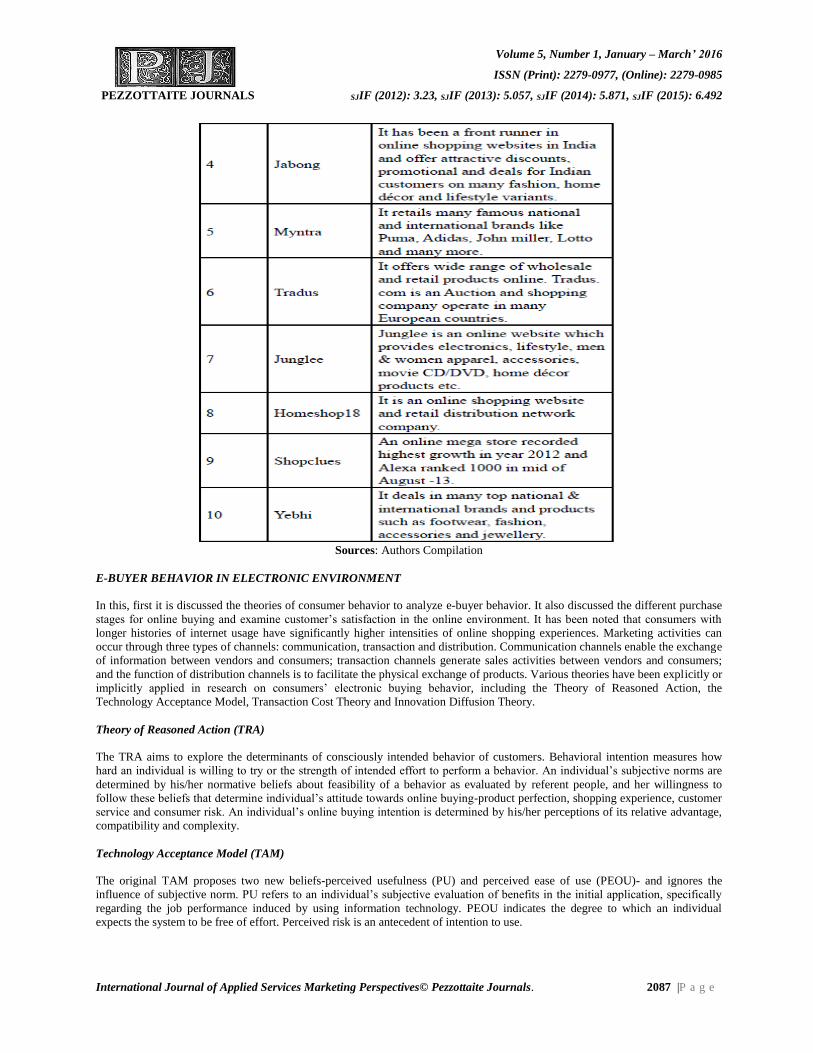
Volume 5, Number 1, January – March’ 2016
ISSN (Print): 2279-0977, (Online): 2279-0985
PEZZOTTAITE JOURNALS SJIF (2012): 3.23, SJIF (2013): 5.057, SJIF (2014): 5.871, SJIF (2015): 6.492
International Journal of Applied Services Marketing Perspectives© Pezzottaite Journals. 2087 |P a g e
Sources: Authors Compilation
E-BUYER BEHAVIOR IN ELECTRONIC ENVIRONMENT
In this, first it is discussed the theories of consumer behavior to analyze e-buyer behavior. It also discussed the different purchase
stages for online buying and examine customer’s satisfaction in the online environment. It has been noted that consumers with
longer histories of internet usage have significantly higher intensities of online shopping experiences. Marketing activities can
occur through three types of channels: communication, transaction and distribution. Communication channels enable the exchange
of information between vendors and consumers; transaction channels generate sales activities between vendors and consumers;
and the function of distribution channels is to facilitate the physical exchange of products. Various theories have been explicitly or
implicitly applied in research on consumers’ electronic buying behavior, including the Theory of Reasoned Action, the
Technology Acceptance Model, Transaction Cost Theory and Innovation Diffusion Theory.
Theory of Reasoned Action (TRA)
The TRA aims to explore the determinants of consciously intended behavior of customers. Behavioral intention measures how
hard an individual is willing to try or the strength of intended effort to perform a behavior. An individual’s subjective norms are
determined by his/her normative beliefs about feasibility of a behavior as evaluated by referent people, and her willingness to
follow these beliefs that determine individual’s attitude towards online buying-product perfection, shopping experience, customer
service and consumer risk. An individual’s online buying intention is determined by his/her perceptions of its relative advantage,
compatibility and complexity.
Technology Acceptance Model (TAM)
The original TAM proposes two new beliefs-perceived usefulness (PU) and perceived ease of use (PEOU)- and ignores the
influence of subjective norm. PU refers to an individual’s subjective evaluation of benefits in the initial application, specifically
regarding the job performance induced by using information technology. PEOU indicates the degree to which an individual
expects the system to be free of effort. Perceived risk is an antecedent of intention to use.
Volume 5, Number 1, January – March’ 2016
ISSN (Print): 2279-0977, (Online): 2279-0985
PEZZOTTAITE JOURNALS SJIF (2012): 3.23, SJIF (2013): 5.057, SJIF (2014): 5.871, SJIF (2015): 6.492
International Journal of Applied Services Marketing Perspectives© Pezzottaite Journals. 2088 |P a g e
Innovation Diffusion Theory (IDT)
Compared to traditional buying, e-buying is an innovative application of information technology by retail industries. Therefore,
IDT can be applied to explore consumer’s buying behavior. Generally the cumulative adoption of an innovation follows a sigmoid
curve, wit adoption growing slowly in its initial years, growing steeply as it reaches its half waypoint and growing slowly again as
it nears its saturation level i.e. maximum penetration into the market. The rate of adoption is dependent on five attributes of an
innovation—relative advantage, compatibility, complexity, tradability and observability. Out of these, complexity is negatively
associated while the rest are positively associated.
Classical Attitudes Model (CAM)
Classical Attitudes Model structure is compounded by beliefs or cognitions (c), affect (a) and behavior (b). It discusses about the
ABC model of attitudes usually seen as components of attitude, which act as determinants of its formation. The three main types
of existing hierarchies or sequences for attitude formation are –the standard learning hierarchy (CAB), the low involvement
hierarchy (CBA) and finally the experiential hierarchy (ABC). Knowledge of consumer opinions, beliefs and attitudes with regard
to specific object is essential for understanding consumer behavior.
The internet provides firms with an important opportunity to increase their market base by marketing products online. Many firms
that have concentrated their efforts on traditional offline channels are now moving to include the online channel in their marketing
approach. Consumer evaluation of benefits offered by a marketing channel, by the internet in particular, is affected by their
experience with the channel. Four factors that define online service quality including web design are: (i) In-depth information,
Efficiency, Personalization and Selection, (ii) Fulfillment / Reliability, (iii) Privacy/security, and (iv) Customer Service.
THEORETICAL IMPLICATIONS
The literature review shows Indian consumer as more conservative and value driven today than yesteryears. We realize that
consumers have significant degree of variation in their definition of “value”. These variations show different approaches of the
consumers towards spending, price sensitivity, brand loyalty, methods of researching products and shopping preferences. In our
analysis consumer behavior and spending uncovered, six segments of online Indian consumers:
Shopper 2.0 is technologically most advanced consumer. The members of this niche are price sensitive, frequently use
coupons and exhibit little brand or format loyalty.
Deal hunters are highly price sensitive consumers. They are heavy coupon users with low levels of brand or format
loyalty.
Online window shoppers: Conduct high level of research online and most of the times purchase offline.
Channel surfers: They are brand conscious and are most willing to hunt for the brands they love and may shift channels
to get best deals.
Loyalists: They are least likely to change brands and retail formats at least for reasons of price. These niche members
conduct research and buy online, often seeking to preserve their established brand preferences.
Laggards: The members of this niche conduct very little online research or purchasing and they exhibit lowest level of
coupon usage. They are not particularly motivated to switch brands or retail format.
PRACTICAL IMPLICATIONS
Many web 2.0 applications such as social networking, eBay and YouTube allow users to upload, create and sell information. This
phenomenon has led to evolution of ‘Prosumers’ (Consumer + Producer = Prosumer). Prosumer is an individual who acts not only
as consumer but also as producer. In the digital environment, the traditional distinction between consumer and producer has
become increasingly blurred and consumers are often both consumers and producers of content online that is consumed by other
consumers
RESULTS AND DISCUSSION
Development of internet and e-Commerce has opened kaleidoscopic opportunities for Indian consumers and businesses.
Businesses today have become boundary less. Consumers today are benefiting from wider variety of goods and services, greater
convenience, improved possibilities to compare products and prices. Familiarity and confidence exert a great influence on
consumer online shopping behavior. Results of this study encourage strategy development for the internet-marketing environment,
product characteristics, familiarity and confidence and promotional offers. Inputs regarding what motivates consumers to shop
online would help e-vendors in formulating strategy, technology and marketing decisions as well as website design. The
government should play an important role in increasing net users.
Volume 5, Number 1, January – March’ 2016
ISSN (Print): 2279-0977, (Online): 2279-0985
PEZZOTTAITE JOURNALS SJIF (2012): 3.23, SJIF (2013): 5.057, SJIF (2014): 5.871, SJIF (2015): 6.492
International Journal of Applied Services Marketing Perspectives© Pezzottaite Journals. 2089 |P a g e
FINDINGS
Internet has provided various benefits for both consumers and sellers in terms of increased innovation, creativity,
learning, instant and unlimited access and reduced environmental costs associated with transactions.
Growth of e-Commerce between 2010 and 2015 mainly occurred in places where e-Commerce is already well
established.
Online purchases are still in domestic trade rather than international.
Consumers are demanding personalized products, services in a convenient way and at a convenient time.
Consumers are now turning into prosumers
Illegal content is the major obstacle for e-Commerce consumers.
CONCLUSION
Understanding the mechanism of online shopping and the behavior of the online consumer is a priority issue for practitioners, who
are competing in the fast expanding virtual market place. The internet shopping site in which products and/or services are
purchased is equivalent to the retail store, which shows that the merchandise and communicates image to the consumer.
Maintaining a consumer friendly shopping site is essential to the success of internet retailers. Therefore, it is important to
understand the variables that contribute to satisfaction among internet consumers.
Consumers have the ability to research products and compare prices across internet shopping sites, as well as across sopping sites
and retail stores. Specifically, there is a need to evaluate the influence of the internet-shopping environment on consumer
behavior. The internet-shopping environment communicates image through product and suite offerings and often influences
consumers’ satisfaction. Atmospheric variables lead to some behavioral response by the consumer, which is communicated
through enjoyment.
FUTURE-SHOPPER: SUGGESTIONS
Bill Gates once said that , “we overestimate the change that will occur in the next two years and underestimate the change that will
occur in the next ten “Shoppers and shopping are just reaching the tipping point between the short term and the long. Consumer
expectations and socio economic change is transforming the way we shop and what it means for suppliers, manufacturers and
retailers alike. What is striking about the story is that there is a collision of old and the new. It is a world in which the needs of
shoppers remain, in many ways, largely unchanged-but their expectations of how businesses will fulfill those needs are being
transformed.
NEW RULES OF THE GAME
The shopping process has been disaggregated - and this will continue. The shift from a ‘purchase funnel’ to purchase
fish’ model is explained that different stages of the shopper process are happening in different places and through
different channels, many of which are beyond the control of retailer.
The store needs to be extended in time and space - because the shopping process has been disaggregated, the store needs
to extend itself in time and space, beyond a physical location or website.
Pricing will become more personal - the digital and personalized world of the future shopper enables retailers to offer
personalized pricing - and it is expect that this will come increasingly commonplace, especially as a way of rewarding
regular or frequent customers.
If your shopper marketing is being done in-store, it is being done too late - much of shopper’s research and planning is
now being done long before they ever reach the store – whether that store is physical, virtual or some combination of the
two.
Manage your intermediaries - one of the results of disaggregation - and it has seen this repeatedly since the arrival of
World Wide Web - is that it opens up spaces for new intermediaries.
Put a smile on your shoppers’ faces by surprising them - one of the recurring stories is that shopper needs are to a large
extent familiar, but their expectations about how they are delivered are changing.
The interaction between the physical and the digital world opens up new business models that were impossible to imagine a
generation ago, creating bold possibilities for reimagining retail. To generate value, retailers will have to understand more
fundamentally what their shoppers need and how best to deliver it. It is an old challenge in a new world. The winners will be
retailers able to hold both parts of this paradox in their hands at the same time, and then put them back together in a new way that
better serves retailers and shoppers alike.
Volume 5, Number 1, January – March’ 2016
ISSN (Print): 2279-0977, (Online): 2279-0985
PEZZOTTAITE JOURNALS SJIF (2012): 3.23, SJIF (2013): 5.057, SJIF (2014): 5.871, SJIF (2015): 6.492
International Journal of Applied Services Marketing Perspectives© Pezzottaite Journals. 2090 |P a g e
REFERENCES
1. Bijal, Z. V. (2014). The Impact of E-Marketing on E-Buyer Behavior. Biztantra.
2. (2011). Consumer Behavior in a Digital Environment, IMCO, Executive Summary.
3. Efthymios Constantinides. (2004). influencing the Online Consumer’s Behavior: The Web Experience. Emerald
Group Publishing Limited.
4. Ernst, & Young. (2012). Rebirth of e-commerce in India.
5. Mark, Brown, & Rose, Muchira. (2004). Investigating the relationship between internet privacy concerns and online
purchase behavior. Journal of Electronic Commerce Research, 5(1).
6. Mohammad Hossein Moshref Javadi, Hossein, Rezavi Dolatabadi, Mojtaba, Nourbaksh, Amir, Porsaeedi, & Ahmad,
Raza Asadolahi. (2012). An analysis of factors affecting on online shopping behavior of consumers. International
Journal of Marketing Studies, 4(5).
7. Nali, & Ping, Zhang. (2002). Consumer Online Shopping Attitudes and Behavior: An Assessment of Research. In
Eighth Americas Conference on Information Systems.
8. Norazah, Mohd Suki, & Norbayah, Mohd Suki. (2013). Consumer Online Shopping Behavior: The Effect of Internet
Marketing Environment, Product Characteristics, Familiarity and confidence and promotional offers. International
Journal of Social, Management, Economics and Business Engineering, 7(3).
9. Rama, Bijapurkar. (2013). We are like that only: Understanding the logic of consumer India. Penguin India.
10. Stephen, Guo, Mongquiwang, & Jure, Leskovec. (2011, June 05-09). The role of social networks in online shopping:
information passing, price of trust and consumer choice, EC’11. San Jose, California, USA.
11. Svatosova. (2013). Motivation of Online Buying Behavior. Journal of Competitiveness, 5(3).
12. Retrieved from http://www.ermt.net/docs/papers/Volume_4/7_July2015/V4N7-246.pdf
13. Retrieved from https://monster4ever3.wordpress.com/
14. Retrieved from http://www.igi-global.com/article/antecedents-to-online-shopping/124254
15. Retrieved from
https://www.linkedin.com/pulse/20140713182547-26227186-dawn-of-the-planet-of-the-e-commerce?articleI...
16. Retrieved from http://bizresearchlabs.com/ecommerce-in-india/
17. Retrieved from http://thefuturescompany.com/new-rules-for-retail/
18. Retrieved from http://www.slideshare.net/ijerd_editor/online-shopping-behaviour-in-india
*****
Editor-In-Chief
Pezzottaite Journals,
24, Saraswati Lane, Bohri,
Near Modern Dewan Beverages,
Jammu Tawi – 180002,
Jammu and Kashmir, India.
(Mobile): +91-09419216270 – 71
Volume 5, Number 1, January – March’ 2016
ISSN (Print): 2279-0977, (Online): 2279-0985
PEZZOTTAITE JOURNALS SJIF (2012): 3.23, SJIF (2013): 5.057, SJIF (2014): 5.871, SJIF (2015): 6.492
International Journal of Applied Services Marketing Perspectives© Pezzottaite Journals. 2091 |P a g e
CUSTOMER ORIENTATION AND CUSTOMER SATISFACTION:
A STUDY WITH REFERENCE TO PRIVATE BANKS
P. Sravan Kumar46 B. Raghavendra47
ABSTRACT
The customer orientation is a basic for any financial services provider, especially banking that operates from physically to
digital mode. After liberalization of the economy, the competition between scheduled banks and private banks benefited never
seen before products and services to the customer with the usage of technology. As new banks are entering into the already
existing competitive market, the customer orientation has become norm for any bank today’s scenario. The techno-savvy new
age private banks, already achieved the almost the number of customers and in terms of customers. These new age banks have
set up ‘benchmarks’ in terms of technology and different types of products and services with customer orientation. This study
aims to measure customer orientations of the private banks from the opinions of employees and satisfaction levels from
customers. Data has been collected from with 151 employees and 320 customers from four cities of Andhra Pradesh. The
findings of the study demonstrate that customer orientation levels of the banks are almost high in few aspects and customer
satisfaction levels were moderate. The correlation between customer orientation and customer satisfaction was medium effect
size.
KEYWORDS
Private Banks, Customer Orientation, Customer Satisfaction etc.
INTRODUCTION
The banking in India was started with establishment of Bank of Hindustan in 1770 and the present largest and oldest bank still in
existence is State Bank of India and its associates. With the liberalization of this sector, entered New Generation tech-savvy banks
and were successful in revitalizing the sector. The banking sector is mature in terms of supply, product-range and reach with many
challenges to overcome and more opportunities to exploit unbanked population and demographic dividend in retail banking,
mortgages and investment services. The recent financial inclusive initiative, Pradhan Mantri Jan Dhan Yojana, ensured almost 17
crore new bank accounts were opened by the end of 2015. The banking infrastructure operates, physically in addition to virtual
expansion of banking via tele-banking, internet banking, mobile banking, bio-metric and mobile ATMS. Today customers has
more banking options with same products and service, it is the customer orientation of employee can influence the performance of
the bank and its success. The past research studies pointed that customer orientation is the secret behind every successful
organization. This study examines the customer orientation of the employees and customer satisfaction levels, and explores the
relationship between customer orientation and customer satisfaction levels.
REVIEW OF LITERATURE
Customer Orientation
Saxe and Weitz (1982) defined Customer orientation defined as employee’s behaviour in which they assist the clients and
customers to satisfy their long-term needs and wants. Levitt (1960) was the first to explain the concept of customer orientation.
Kotler (2004) proposed customer orientation as the marketing concept between sales person and customers, and asserted that the
every activity of the company is meant for satisfying customer and to make long-term relationship with customers. The major task
of the business is to find out the perceptions, needs and want of the chosen markets and to satisfy them through the design,
communication, pricing and delivery of right and affordable offerings. Customer Orientation is the clear understanding of one’s
customers to generate superior value for them continuously (Narver and Slater, 1990). This process includes acquiring information
about the customers in the selected market and sharing it right through the business organisations for suitable solutions to fulfill
the customer needs and preferences at a profit (Karvinen & Bennett, 2006). In service organisations, the employee behaviour play
a central role with regard to a customer’s perception of satisfaction and service quality (Thurau and Thurau, 2003). Customer
Orientation is a set of measures taken by organisations to support its sales and other employees in taking into account the
customer needs and satisfaction as first choice. Employees can perceive customer orientation from an internal perspective than
external customers, which result in improved customer satisfaction. More recently, organisations have largely recognized the
46Research Scholar, Sri Krishnadeveraya Institute of Management, Sri Krishnadeveraya University, Andhra Pradesh, India,
[email protected] 47Research Scholar, Sri Krishnadeveraya Institute of Management, Sri Krishnadeveraya University, Andhra Pradesh, India,
Volume 5, Number 1, January – March’ 2016
ISSN (Print): 2279-0977, (Online): 2279-0985
PEZZOTTAITE JOURNALS SJIF (2012): 3.23, SJIF (2013): 5.057, SJIF (2014): 5.871, SJIF (2015): 6.492
International Journal of Applied Services Marketing Perspectives© Pezzottaite Journals. 2092 |P a g e
importance of orienting their processes to suit customer needs and wants as efficiency measures to improve their performance.
Customer orientation is an important component of the customer retention process of any business. Once the visitor or guest
becomes a customer, the organisations have the responsibility to inform the customer about various features of your business.
Thurau and Thurau (2003) presented customer orientation as three-dimensional construct, the interrelated dimensions being the
employee’s motivation to serve customers, his or her customer-oriented skills, and his or her self-perceived decision-making
authority. Marcos et al. (2012) study observed customer orientation from two angles. First, as a group of task-oriented behaviour
that includes product description or the identification of customer needs. Second, it involves behaviour that are intended to
establish a personal relationship with the customer. Zablah et al. (2012) study found customer oriented employee experience
reduced role stress, increase commitment towards their jobs and perform better.
Customer Satisfaction
Customer satisfaction is defined as, as the customer’s response to the positive evaluation of the consumption outcome comparative
to his/her anticipations (Arecksamy & Hurnath, 2010). Fornell (1992) and Anderson et al. (1994) describe, as the customer
enjoyable emotional state with the company, is a summary of evaluative reaction. Customer satisfaction results in outcomes, like
repurchase, customer loyalty, referrals, customers are less price sensitive, and customer retention that are beneficial to an
organisations. Majority of past studies established customer satisfaction enhances customer relationships and relationships yields
more sales. There are two types of customer satisfaction measures, first one, satisfaction was considered to be transaction-specific,
that results in immediate post purchase judgment (Oliver, 1993) and second one, considered as cumulative satisfaction perception,
that is defined as overall experience to date with a product or service (Johnson et al., 2001). The second type, cumulative
satisfaction concept, is most widely used (Gupta and Zeithaml, 2006). In services, it is measured as the difference between service
expectation and actual experience (Hanzaee and Mirvaisi, 2011). Customer satisfaction is one of the most used customer-oriented
metrics in research studies, due to its generic nature and universal measurability (Gupta and Zeithaml, 2006).
Customer Orientation related to Customer Satisfaction
According to Saxe and Weitz (1982), an employee is customer oriented when he or she engages in behaviour designed to build
customer satisfaction. Jaworski and Kohli, (1993) asserted customer orientation as foundation of marketing theory and practice.
Research studies observed customer-oriented companies are capable of enhance customer satisfaction and value (Slater and
Narver, 1995). Customer orientation culture influences a service firm’s business performance via the development of lasting
customer-employee relationships (Bove and Johnsom, 2000). As the satisfaction of customer needs at the level of employee-
customer interaction. Customer orientation behaviour of employees increase the satisfaction that paves the way for long-term
relationships between organisations and customers that are beneficial to both (Kelley, 1992). Hennig-Thurau (2004) found
positive relationship between customer orientation and customer satisfaction. Due to distinct characteristics of services, customers
rely on employee’s behaviour to evaluate quality of a service, so employee’s level of customer orientation influences
organisations performance. Studies found customer-oriented companies could enhance customer satisfaction by creating
customers demand and quality service (Lee et al. 2010). Zablah et al. (2012) study resulted Customer orientation levels have effect
on customer satisfaction. Macintosh (2007) found relationships between customer orientation and employee’s relationship quality
with customer that enhanced customer satisfaction.
OBJECTIVE OF STUDY
This study examines the customer orientation of the employees and customer satisfaction levels, and explores the relationship
between customer orientation and customer satisfaction levels.
HYPOTHESIS
H0: Banks customer orientation and customer satisfaction are not positively correlated.
H1: Banks customer orientation and customer satisfaction are positively correlated
RESEARCH DESIGN
Sampling Approach and Profile
The employee respondents were belongs to banks of private sector, namely ICICI, HDFC, AXIS and Karur Vysya bank. Who had
business operations in four cities of Anantapuramu, Chittoor, YSR Kadapa, and Kurnool districts, in together called as
Rayalaseema region of Andhra Pradesh? These four districts share rich cultural and historical environment in the state. Survey
method was used to distribute questionnaires. The respondents were approached personally and convenience-sampling method
was used to collect the data. The employee respondents with dully filled questionnaires was 151, consists of Anantapuramu
(25%), Chittoor (27%), YSR Kadapa (24%), Kurnool (26%) and they belongs to ICICI bank (n= 39, 25.8%), HDFC bank (n= 42,
Volume 5, Number 1, January – March’ 2016
ISSN (Print): 2279-0977, (Online): 2279-0985
PEZZOTTAITE JOURNALS SJIF (2012): 3.23, SJIF (2013): 5.057, SJIF (2014): 5.871, SJIF (2015): 6.492
International Journal of Applied Services Marketing Perspectives© Pezzottaite Journals. 2093 |P a g e
27.8%), AXIS bank (n= 38, 25.2%), KARUR VYSYA bank (n= 32, 21.2%). Majority of the employees were male (92, 61%) and
female (59, 39%), their age group under 30 (37, 24.5%), 31-40 (81, 53.6%),41-50 (28, 18.5%), 51 and above (5, 3.4%), the
education criteria Degree (42, 27.8%), Post Graduate (97, 64.3%), and Professional (12, 7.9%) and Majority of the respondents
were bank Executives (84, 55.6%) and Managers (67, 44.4%).
The help was sought from bank’s employees to distribute questionnaires for customer satisfaction survey. The customers
respondents with complete responses was 320, includes Ananatpuramu (25%). Chittoor (26%), YSR Kadapa (25%), Kurnool
(24%) and they were from ICICI bank (n= 83, 25.9%), HDFC bank (n= 88, 27.6%), AXIS bank (n= 81, 25.3%), KARUR
VYSYA bank (n= 68, 21.2%). Majority of the bank customers were male (201, 62.8%) and female (119, 37.2%), their age group
under 30 (72, 22.5%), 31-40 (132, 41.3%),41-50 (107, 33.4%), 51 and above (9, 2.8%); the majority of them were Post Graduates
(165, 51.6%), 10+2 (6, 1.9%), Degree (132, 41.2%), and Professional education (17, 5.3%); respondents were of Self-employed
(148, 46.3%), followed by Employees (89, 27.8%), Retired (25, 7.8%), Home maker (22, 6.9%), student (19, 5.9%), and
Professionals (17, 5.3%); and Income levels less than 25,000 per month (112, 35%), 25,001-50,000(129, 40.4%), 50,001-1,00,000
(52, 16.2%) and above 1 lakh rupees (27,8.4%).
Measures
The study conceptualized customer orientation as the extent to which bank or its employee emphasizes in understanding the
customer needs and satisfy them and used Saxe and Weitz (1982) 6-item scale adapted by Homburg and Stock (2005). Sample
items includes, “I try to get to discuss the customer needs” and “I try to help the customers to achieve their goals”.
The scale reliability α =810; Mean = 3.32; Standard deviation = 0.67. The Cronbach Alpha indicates strong internal consistency.
Customer satisfaction is defined as, the customer’s overall evaluation of consumption experience to the day and adapted
Jayawardhena et al. (2008) Customer satisfaction 5-item scale, Mean = 2.94; Standard deviation = 0.79. Sample items included “I
am satisfied with the service I receive from the bank” and “This organization’s services meets my expectations”. The Cronbach
alpha α =862 indicates that the reliability of questions with strong internal consistency.
DATA ANALYSIS
Reliability test, descriptive and correlation analyses conducted using Statistical package for social sciences 19.0.
Table-1: Pearson Correlation Analysis
Customer Orientation Customer Satisfaction
Customer Orientation 1
Customer Satisfaction 0.445 1
Note: *Correlation is significant at the 0.01 level (2-tailed)
DISCUSSION AND MANAGERIAL IMPLICATIONS
The above table shows that there is a moderate correlation of 0.445 between Customer Orientation (of the banks) and Customer
satisfaction levels in the selected area. This result establishes that higher the customer orientation can lead to higher customer
satisfaction. The customer orientation of the banks are not surprising and consistent with the past research studies between
customer orientation and customer satisfaction (Schneider et al. 1998; Lings and Greenley, (2005); Hanzaee & Mirvaisi, 2011).
The customer orientation of the selected banks was reported high, in terms of helping the customer to realize their goals and it
with other items. Getting the customers information by influence rather than by pressure was reported minimal by the employees.
The overall customer orientations of the banks are moderate and the scope to enhance their activities this side is more. The
findings suggest that the customer orientation of the banks relates to the satisfactions of bank customers. While the results are
encouraging, it is important to consider other organizational factors that affect the customer satisfaction levels. This finding
explains that the ability of any services organisations in meeting the customer needs is critically important for customer
satisfaction. As the banking options became more to the customers and the importance given to the customer by the bank results
more customer satisfaction, this is true because as technology being adapted by banks requires greater coproduction from
customer side and information provided by the bank. The extent to which the customer involves in the banking process requires
seamless support provided by banks by on-line and off-line affects the satisfaction of the customers.
CONCLUSION
The study results indicate that customer orientation relates moderately and significantly to customer satisfaction. The moderate
customer orientation ratings of the bank employees and customer satisfaction ratings support the hypothesis. The results point out
Volume 5, Number 1, January – March’ 2016
ISSN (Print): 2279-0977, (Online): 2279-0985
PEZZOTTAITE JOURNALS SJIF (2012): 3.23, SJIF (2013): 5.057, SJIF (2014): 5.871, SJIF (2015): 6.492
International Journal of Applied Services Marketing Perspectives© Pezzottaite Journals. 2094 |P a g e
that the customer orientation of the banks influences the customer satisfactions. The other organizational factors and expectations
also affect the customer satisfaction levels. This finding demonstrates meeting the customer needs is important for enhancing
performance. From a long-term perspective, the technology advancement slowly replacing the face-to-face interaction between
banks and customers, it is important for the banks to maintain on-line support and call-centre support to maintain better customer
relationships.
REFERENCES
1. Anderson, E. W., Fornell, C., & Lehmann, D. R. (1994). Customer satisfaction, market share, and profitability: findings
from Swedan. Journal of Marketing, 58(3).
2. Bove, L. L., & Johnson, L. W. (2000). A customer-service worker relationship model. International Journal of Service
Industry Management, 11(5), 491-511.
3. Arecksmy, Marie Wendy Lovena, & Hurnath, Chaya. (2010, August 24-27). Investigating the relationship between
Service climate and Customer satisfaction. In International Research Symposium in Service Management. Le
Meridien Hotel, Mauritius. ISSN 1694-0938.
4. Fornell, C. (1992). A national customer satisfaction barometer: The Swedish experience. Journal of Marketing, 92(1),
6-21.
5. Gupta, & Valarie, Zeithaml. (2006, November). Customer metrics and their impact on financial performance, working
paper, Columbia University, New York. In Gupta et al., Modeling Customer Life Value. Journal of Service Research,
9(2).
6. Hanzaee, Kambiz Heidarzadeh, & Mirvaisi, Masjid. (2011, November). Customer Orientation of Service Employees: A
case study of Iranian Islamic Banking-Based on COSE model. International Journal of Marketing Studies, 3(4).
doi:10.5539/ijms.v3n4p130.
7. Hennig-Thurau, Thorsten. (2004). Customer orientation of service employees – Its impact on customer satisfaction
commitment, and retention. International Journal of Service Industry Management, 15(5), 460-478.
8. Humburg, C., & Stock, R. (2005, May). Exploring the conditions under which sales person work satisfaction can lead to
customer satisfaction. Psychology & Marketing, 22(5), 393-420. doi: 10.1002/mar.20065
9. Jaworski, J. Bernard, & Kohli, K. (1993, July). Market Orientation: Antecedents and Consequences. Journal of
Marketing, 57.
10. Jayawardhena, Chanaka, Farrell, Andrew M., & Sharma, Ankit. (2008). The impact of employees’ customer orientation
and service orientation behaviours on customers’ service evaluation. In Academy of Marketing Science Conference
2008. Vancouver, 2008-05-28 – 2008-05-31. Retrieved from http://inferringvalue.files.wordpress.com/2010/06/
11. Johnson, M. D., Gustafsson, A., Andreassen, T. W., Lervik, L., & Cha, J. (2001). The evolution and future of national
customer satisfaction index models. Journal of Economic Psychology, 22(2), 217-45. Doi: dx.doi.org/10.1016/S0167-
4870(01)0030-7.
12. Karvinen, Kauko, & Bennett, David. (2006). Enhancing performance through the introduction of customer orientation
into the building components industry [of Singapore company]. International Journal of Productivity and
Performance Management, 55(5), 400-422.
13. Kelley, W. Scott. (1992). Developing Customer Orientation Among service employees. Journal of the Academy of
Marketing Science, 20(1), 27-36. ISSN: 0092-0703.
14. Kotler, Philip. (2004). Marketing Management: Analysis, Planning, Implementation and Control (10th Edition). New
Delhi: Prentice Hall India
15. Lee Wan-I, Cheng-Wu Chen, Tsung-Hao Chen, & Chen-Yuan Chen. (2010, April). The relationship between consumer
orientation, service value, medical care service quality and patient satisfaction: The case of a medical center in Southern
Taiwan. African Journal of Business Management, 4(4), 448-458. ISSN 1993-8233. Retrieved from
www.academicjournals.org/AJBM
Volume 5, Number 1, January – March’ 2016
ISSN (Print): 2279-0977, (Online): 2279-0985
PEZZOTTAITE JOURNALS SJIF (2012): 3.23, SJIF (2013): 5.057, SJIF (2014): 5.871, SJIF (2015): 6.492
International Journal of Applied Services Marketing Perspectives© Pezzottaite Journals. 2095 |P a g e
16. Lings, I., & Greenley, G. (2005). Measuring internal market orientation. Journal of Service Research, 7(3), 290-305.
17. Macintosh, Gerrard. (2007). Customer orientation, relationship quality, and relational benefits to the firm. Journal of
Services Marketing, 21(3), 150-159.
18. Marcos, Anabela Maria Bello da Silveria Baptista de Figueiredo, Arnaldo Fernandes Matos Coelho, & Maria Manuela
Vivaldo dos Santos Silva. (2012). Antecedents of Customer satisfaction with Insurance Companies, Soft Computing in
Management and Business Economics. Studies in Fuzziness and Soft Computing, 286, 351-362.
19. Narver, J., & Slater. (1990). The effect of a market orientation on business profitability. Journal of Marketing, 54, 1-
18.
20. Oliver, R. L. (1993). A conceptual model of service quality and service satisfaction: compatible goals, different
concepts. In Swartz, T. A. (Ed.)., Advances in Service Marketing and Management, 12. JAI Press, Greenwich, CT, 65-
85.
21. Saxe, Robert, & Barton, A. Weitz. (1982). The SOCO Scale: A measure of Customer Orientation of Sales people.
Journal of Marketing Research, 19(3), 343-351.
22. Schneider, B., White, S. S., & Paul, M. C. (1998). Linking service climate and customer perceptions of service quality:
test of a causal model. Journal of Applied Psychology, 83, 150-163.
23. Slater, Stanley, & Narver, John. (1995, July). Market Orientation and the Learning Organization. Journal of Marketing,
59.
24. Thurau, Thorsten Hennig, & Thurau, Claudia. (2003). Customer Orientation of Service Employees – Toward a
Conceptual framework of a Key Relationship Marketing Construct. Journal of Relationship Marketing, 2(1-2), 23-41.
25. Zablah, R. Alex, George, R.Franke, Tom, J. Brown, & Darrell, E. Bartholomew. (2012, May). How and When Deos
Customer orientations influence Frontline employee job outcomes. A meta-Analytic Evaluation. Journal of Marketing,
76(3).
26. Retrieved from http://link.springer.com/content/pdf/10.1007/978-3-642-30457-6_23.pdf
27. Retrieved from https://www.researchgate.net/profile/K_Kacmar/publication/10822966...
*****
INFORMATION FOR AUTHORS
Pezzottaite Journals invite research to go for publication in other titles listed with us. The contributions should be original and
insightful, unpublished, indicating an understanding of the context, resources, structures, systems, processes, and performance
of organizations. The contributions can be conceptual, theoretical and empirical in nature, review papers, case studies,
conference reports, relevant reports & news, book reviews and briefs; and must reflect the standards of academic rigour.
Invitations are for:
International Journal of Applied Services Marketing Perspectives.
International Journal of Entrepreneurship & Business Environment Perspectives.
International Journal of Organizational Behaviour & Management Perspectives.
International Journal of Retailing & Rural Business Perspectives.
International Journal of Applied Financial Management Perspectives.
International Journal of Information Technology & Computer Sciences Perspectives.
International Journal of Logistics & Supply Chain Management Perspectives.
International Journal of Trade & Global Business Perspectives.
All the titles are available in Print & Online Formats.
Volume 5, Number 1, January – March’ 2016
ISSN (Print): 2279-0977, (Online): 2279-0985
PEZZOTTAITE JOURNALS SJIF (2012): 3.23, SJIF (2013): 5.057, SJIF (2014): 5.871, SJIF (2015): 6.492
International Journal of Applied Services Marketing Perspectives© Pezzottaite Journals. 2096 |P a g e
SOCIO ECONOMIC STATUS OF FISHER FOLK
P. Vinoth48 Dr. B. Revathy49
ABSTRACT
The fisheries sector, both marine and inland, plays an important role in our economy. Fish resources are of utmost
importance for food security. Tamil Nadu has a total marine fisher folk population of about 396,000 living in 422 fishing
villages. The total number actually engaged in fishing is estimated at 96,500. The size of an average family is 5.2 and adult
males and females are 32% each, the rest being children. It has been estimated that about 40,000 fishermen do not own either
boats or gear. In cases where there is no ownership by the crew, 60% of the earning goes to the owners of the craft and gear
and 40% to the crew.
There have been no serious efforts towards sectoral studies regarding poverty / health / education / housing / social
development situation of fisher folk in Tamilnadu. Most of the traditional and small fisher families barely survive. The income
from fishing is seasonal and the bulk of the earnings are often realized during a few months in the year. The margin for
savings or for even distribution of expenditures is small, and fishermen often get indebted to traders or moneylenders to
survive during the off-season. The major part of the income is spent on food and related items and on clothing. Over the last
decades or so, the Tamilnadu coast has been under attack by the forces of globalization and export-oriented developmental
policies of the State and central Governments. Rapid industrialization and huge infrastructure projects have posed an
increasing threat to both the livelihood of fishing communities and the ecological balance of the sensitive coastal sphere.
The present research work examines socio economic status of the fisher folk of rural coastal villages in Tuticorin district. It is
an attempt to assess the standard of living, income, expenditure, savings and indebtedness of fisher folk. The result shows that
the standard of living of fishermen families is very low and poor. Majority of the fisher folk are in the status of below poverty
due to insufficient income and huge debt trap. Every fishing village should be provided with suitable road facilities with
adequate feeder roads linking every fishing center. Fishermen should be educated sufficiently to preserve fish at the catching
point itself. Modern fish processing units must be established in all the important fishing centers along with State fisheries
units. The Government and Voluntary Organization should initiate measures to solve the problems of the fisher folk in rural
coastal villages and should take appropriate steps to improve their standard of living.
KEYWORDS
Expenditure, Income, Indebtedness, Savings, Standard of Living etc.
INTRODUCTION
India has enormous inland and marine waters, which provide vast livelihood and employment opportunities. Fisheries are one of
the main sources of livelihood for the rural poor, particularly the fisher community. It is estimated that about 6.7 million people
depend on fisheries. Roughly 7,25,000 fulltime and equal number of part-time fishermen are engaged in fishing operations and
over 1 million people are engaged in pre-post-harvest activities (Government of India (GOI) 2010). The incidence of poverty in a
marine fishery sector is much higher than any other backward sectors in our country. Fisheries families living below the poverty
line are estimated about 60%, which is far higher than the national average of 26%. (Drawes, E., 1982) The impact of
mechanization on fish catchments, income, export, and standard of living and employment opportunities is of importance in our
national economy. (Mahesh V. Joshy 1996), the present socio economic conditions of traditional fishermen community is not
satisfactory (Rajan 2000). The fisheries sector is characterized by a sheer unpredictability and seasonality of catch (kurian 1995).
Fish is considered the internationally traded primary commodity and fisheries sector occupies a very important place in the socio
economic development of the many developed and developing countries in the world (S.Supra Raju 2003).
Every year, millions of people all over the world have been meagerly engaged in fishing and fish trading over the years. Fishing
sector is a principal source of livelihood for a large section of economically underprivileged of the country, especially for the rural
coastal population (Mahesh V Joshy, 1996). The fisher folk along the coastal area are socio-economically backward and they lack
various basic amenities like education, drinking water and food. Thus, their standard of living is not up to the level of expectations
(M.A. Oladoja and O.A Adeokun, 2009). The housing conditions of the fisher folk are poor. Majority of them live in huts made of
mud, only few of them reside in houses made of cement and bricks (KDR, 2008). Infrastructure facilities like housing, sanitation
48 Research Scholar, Department of Commerce, Manonmaniam Sundaranar University, Tamil Nadu, India,
[email protected] 49 Associate Professor, Department of Commerce, Manonmaniam Sundaranar University, Tamil Nadu, India,
Volume 5, Number 1, January – March’ 2016
ISSN (Print): 2279-0977, (Online): 2279-0985
PEZZOTTAITE JOURNALS SJIF (2012): 3.23, SJIF (2013): 5.057, SJIF (2014): 5.871, SJIF (2015): 6.492
International Journal of Applied Services Marketing Perspectives© Pezzottaite Journals. 2097 |P a g e
health care are major problem facing the fishing community (Asha Krishna Kumar, 2010). The level of income of the fisher folk
is not enough to meet their expenditures. Their daily earnings from fisheries are low, fluctuating and often uncertain which affects
their livelihood security. As most of the fisher folk are illiterates they lack knowledge in improving their fishing activities (R.
Mahesh and D. Rajasenan, 2006). In the absence of adequate institutional credit, the only remedy for the fisher folk is the informal
credit system at exorbitant rates of interest (K.G. Karmakar, et. al., 2009). Due to the risk of exposure to the vagaries of catch and
price fluctuations, they depend on the local moneylenders and hence the fish trader-financers have multiplied. Due to the low
incomes as well as lack of institutional credit systems, fisher folk are in the grip of middlemen, who provide them loans at high
rates of interest and bind them to sell the fish caught by them at reduced prices. Since generations, the fishermen are under debt
burdens, despite of working day and night (Charu Gupta and Mukul Sharma, 2010).
STATEMENT OF PROBLEM
Majority of the fishermen are economically weak, follow traditional methods of fishing and employ indigenous crafts and gears.
Several factors such as low social status, poor economic conditions, illiteracy, traditional fishing equipment’s and methods of
fishing, low production rate and income influence the socio economic conditions of fishermen. The fisheries sector is
characterized by a sheer unpredictability and seasonality of catch (kurian1995). The life and livelihood of the traditional fishers
have become tough. (Shely and Alam, 1998). Structure of livelihood of poor fishermen is often quite diverse and their socio
economic status is also low and livelihood options are limited, the natural calamities in addition leads to poverty. During rainy
days and lean seasons, their earnings are low. Therefore, they are not able to manage their family and they get into trouble and get
loans from moneylenders. The fishermen in the coastal areas are subject to all kinds of diseases, as proper sanitation and medical
facilities are not available in their fisheries. Schemes for providing dispensaries in coastal fishing villages have helped to solve the
problem to some context. Community amenities such a drinking water, wells, latrines, common pathways and community halls
have been provided in some of the colony sites, but majority of the coastal fishing villages are without amenities.
Majority of fishing communities in the area do not have access to electricity. The fisher folk are forced to sell their harvest to local
market and the middlemen (Srivastava et.al.1984). Some of the important programmes are taken up by the Government to
ameliorate various problems encountered by the sector (Shely and Alam, 1998). Government lends money to the co-operative
societies in the form of loans and subsidies. Likewise, they also assist economically backward people in coastal region for the
purpose of fishery and fishery business, to increase their standard of living (Vhankade P.G. 2011). The various welfare
programmes are envisaged by the State Fisheries Department to improve the living conditions of fisher folk like sanitation,
housing, health care, drinking water supply have so far failed to yield the desired results and workers and as a community still
remain socially and economically backward (Economic Review 1997). Government and voluntary organizations provide training
and financial assistance to fisher folk families. Despite their socio-economic status is very low. Hence, an attempt is made to trace
out the reason for the low socio economic status of the fisher folk in selected rural coastal villages of Tuticorin in Tamilnadu.
SIGNIFICANCE OF STUDY
India is the seventh largest fishing nation of the world with an Exclusive Economic Zone (EEZ) of 2.02 million square kilometers.
The 3 million marine fishermen population is living in 7,56,212 fishermen households spread over 3,202 fishing villages. There
are 8,89,528 active fishermen of which 7,17,999 have fishing as a fulltime occupation. Indian fisheries sector contributes an
annual per capita supply of 3.3 kilograms of animal protein food and about 3 percent of total export earnings (Sudarsan 1991).
India is a major supplier of fish in the world. In 2006, the country exported over 600,000 metric tons of fish, to some 90 countries,
earning over $1.8 billion. In India, fishing sector is a principal source of livelihood for a large section of the economically
underprivileged of the country, especially in the rural coastal population (Mahesh V Joshy, 1996). Fisherfolk are engaged in
fishing around the clock, even day and night, in deep-sea fishing to meet their basic needs (P.G. Vhankade, 2011). Despite of their
sincere hard work, their income is frequently inadequate and disproportionate to their strain and suffering mainly because of using
non-mechanized crafts. Their income also depends on the games of seasons and vagaries of nature (J. Fredrick, 2011). The
infrastructural facilities like health facility, clean drinking water, electricity and education are inadequate among the rural coastal
fishing communities. Most of the fishermen have no fishing assets like boats and nets of their own. Housing conditions of the
fisherfolk is also not up to the expected level. Literacy rate and education are also low among them (Ali, 1996). According to the
survey conducted by two NGOs (CODEC and PDP) working with fishermen, most of the fishermen among the coastal districts
borrow money from local moneylenders in absence of loan facilities from the scheduled banks (Observer, 2000).
In order to uplift the socio-economic status of traditional fishermen, the Tamil Nadu State Fisheries Apex Co-operative Federation
Limited has implemented Integrated Marine Fisheries Development Project in 78 fishing villages in 6 coastal districts of Tamil
Nadu (TAFCOFED). Because of the poor and pathetic condition of fisherfolk, banks are also not ready to provide credit to the
fisherfolk because they do not have any collateral security. In the absence of adequate institutional credit, the fisherfolk’s only
option is the informal credit system for which the fishermen have to pay an exorbitant interest (K.G. Karmakar, et., al., 2009).
There is an increasing exposure to the vagaries of catch and price fluctuations, they depend for debts to the local moneylenders
and the fish trader-financers have multiplied. Due to the low incomes as well as lack of institutional credit systems, fisherfolk are
Volume 5, Number 1, January – March’ 2016
ISSN (Print): 2279-0977, (Online): 2279-0985
PEZZOTTAITE JOURNALS SJIF (2012): 3.23, SJIF (2013): 5.057, SJIF (2014): 5.871, SJIF (2015): 6.492
International Journal of Applied Services Marketing Perspectives© Pezzottaite Journals. 2098 |P a g e
in the grip of middlemen, who provide them loans at high interest rates and bind them to sell their fish caught by them at reduced
prices. Resultantly, the fishermen are under debt burden since generations, despite working day and night (Charu Gupta and
Mukul Sharma, 2010).
The fisherfolk along the coastal area are socio-economically backward and they lack various basic amenities like education,
drinking water and food. Thus, their standard of living is not up to the expected level (M.A. Oladoja and O.A. Adeokun, 2009).
The housing condition of the fisherfolk is poor. Majority of them live in huts made of mud and only few of them reside in houses
made of cement and bricks (Kerala Development Report, 2008). Infrastructure facilities like housing, sanitation health care are the
major problems facing the fishing community (Asha Krishna Kumar, 2010). The fisherfolk income level is not enough to meet
their expenditure and their daily earnings from fisheries are low, fluctuating and often uncertain which lead to uncertain their
livelihood security. As most of the fisherfolk are illiterate, they lack knowledge in improving their fishing activities (R. Mahesh
and D. Rajasenan, 2006). Government provides several relief grants and welfare schemes to the fisherfolk viz., relief amount
(Rs.2000 p.a.) during fishing ban period, special relief amount (Rs.4000 p.a.) during fishing lean season, relief amount of
Rs.1,00,000 and Rs.50,000 to the deceased or totally disabled and partially disabled fisherfolk respectively. The owners of the
mechanized fishing boats who are below poverty line are eligible to get a subsidy of Rs.3.00/liter with a ceiling of 500 liters boat
per month during peak season. Subsidy assistance has given at the rate of 25% in the conversion cost, subject to a maximum of
Rs.5, 00,000/boat for conversion of traditional crafts into mechanized crafts. Subsidy and sales tax exemption is given to the
kerosene operated traditional crafts in Thoothukudi, Tirunelveli and Kanyakumari districts of Tamil Nadu (The Department of
Fisheries Citizen Charter, 2012-2013).
Nowadays modern and scientific methods have been used for fishing. This increases more fishing than conventional methods. The
government provides enormous welfare schemes for the upliftment of fishermen families, though the standard of living of
fishermen is still poor and they are often in debt. Hence, an attempt is made to analyze the reasons for poor standard of living and
high indebtedness of fishing community in the costal districts.
REVIEW OF LITERATURE
Kalawar (1981) examined the living conditions of fishermen in Maharashtra. According to him, the living conditions overall are
deplorable. Owing to lack of economic development in this region, there is continuous exodus of labour from the coastal region.
As a result, the females have to bear most of the burden of economic activity. Indebtedness in the fishermen community is
widespread. Necessary infrastructure by way of communication and transport facilities, water supply and power should have to be
provided on priority basis. This creates scope for setting up agro-based and fisheries-based industries.
Kurien (1981) pointed out that are two reasons for the poverty of fishermen, namely the inequality in the asset holdings among
them and secondly the exploitation of all of them by those who are involved in the process of buying what they produce. As a
result, for the average traditional fishermen, saving from his income for investment is a painful task. Indebtedness among the
fisher folk is high. Credit in the form of wage advances is a very common phenomenon in traditional fishing communities. Credit
of other forms may be obtained by pledging ration cards, gold and fishing nets with individuals in the village who are not
necessarily concerned with fishing. The rate of interest ranges from 24 to 60 percent for the mortgage of their products. Fish
merchants are a source of big credit. They normally lend large amounts to fishermen who own fishing equipment’s.
Nuruddin (1994) analyzed the socio-economic conditions of fisherfolk in Kuala Sepetang, a coastal village in the west coast of
peninsular in Malaysia. This village has all the public amenities like transport, sanitation, telephones, drinking water etc. The
illiteracy rate is low. Fishing is the primary income generating activity in the village.
Shanmugaraj et al., (1998) in a project to find out the Socio-Economic Status of the Fisherfolk Communities of the Gulf of
Mannar Marine Biosphere Reserve, point out that there are 49 villages along the coast, of which 38 are in Ramanathapuram
district and 11 are in Thoothukudi district bordering the marine biosphere area. The fishermen from these villages depend solely
on fishing for their livelihood. The fishermen are well trained in sorting fish, cleaning, drying and marketing them. They also act
as agents for the boat owners at auction centers and earn a good commission. The fisherman’s daily income depends upon his
day’s catch, which is not regular, and at a steady level.
OBJECTIVES
The present study is based on the following specific objectives:
To ascertain the socio economic status of the fisher folk.
To analyze the incomes and expenditures of the fisher folk and its impact on their indebtedness.
To examine the habits of thrift among the fisher folk.
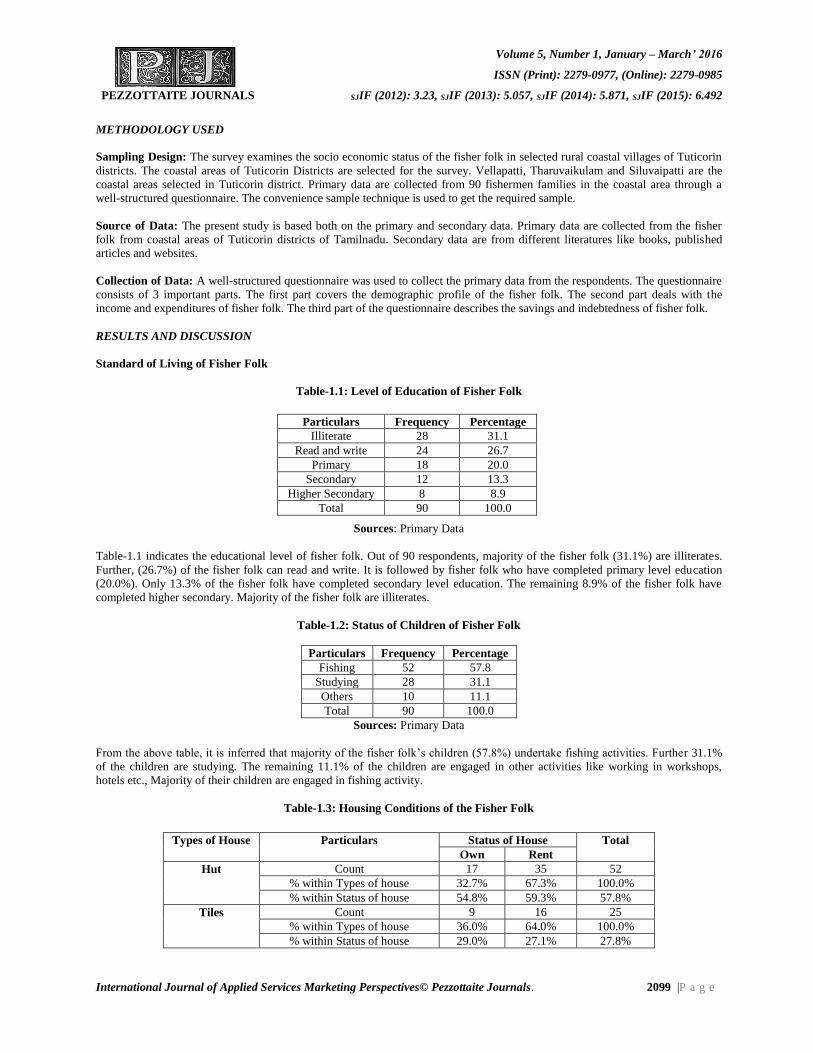
Volume 5, Number 1, January – March’ 2016
ISSN (Print): 2279-0977, (Online): 2279-0985
PEZZOTTAITE JOURNALS SJIF (2012): 3.23, SJIF (2013): 5.057, SJIF (2014): 5.871, SJIF (2015): 6.492
International Journal of Applied Services Marketing Perspectives© Pezzottaite Journals. 2099 |P a g e
METHODOLOGY USED
Sampling Design: The survey examines the socio economic status of the fisher folk in selected rural coastal villages of Tuticorin
districts. The coastal areas of Tuticorin Districts are selected for the survey. Vellapatti, Tharuvaikulam and Siluvaipatti are the
coastal areas selected in Tuticorin district. Primary data are collected from 90 fishermen families in the coastal area through a
well-structured questionnaire. The convenience sample technique is used to get the required sample.
Source of Data: The present study is based both on the primary and secondary data. Primary data are collected from the fisher
folk from coastal areas of Tuticorin districts of Tamilnadu. Secondary data are from different literatures like books, published
articles and websites.
Collection of Data: A well-structured questionnaire was used to collect the primary data from the respondents. The questionnaire
consists of 3 important parts. The first part covers the demographic profile of the fisher folk. The second part deals with the
income and expenditures of fisher folk. The third part of the questionnaire describes the savings and indebtedness of fisher folk.
RESULTS AND DISCUSSION
Standard of Living of Fisher Folk
Table-1.1: Level of Education of Fisher Folk
Sources: Primary Data
Table-1.1 indicates the educational level of fisher folk. Out of 90 respondents, majority of the fisher folk (31.1%) are illiterates.
Further, (26.7%) of the fisher folk can read and write. It is followed by fisher folk who have completed primary level education
(20.0%). Only 13.3% of the fisher folk have completed secondary level education. The remaining 8.9% of the fisher folk have
completed higher secondary. Majority of the fisher folk are illiterates.
Table-1.2: Status of Children of Fisher Folk
Particulars Frequency Percentage
Fishing 52 57.8
Studying 28 31.1
Others 10 11.1
Total 90 100.0
Sources: Primary Data
From the above table, it is inferred that majority of the fisher folk’s children (57.8%) undertake fishing activities. Further 31.1%
of the children are studying. The remaining 11.1% of the children are engaged in other activities like working in workshops,
hotels etc., Majority of their children are engaged in fishing activity.
Table-1.3: Housing Conditions of the Fisher Folk
Particulars Frequency Percentage
Illiterate 28 31.1
Read and write 24 26.7
Primary 18 20.0
Secondary 12 13.3
Higher Secondary 8 8.9
Total 90 100.0
Types of House Particulars Status of House Total
Own Rent
Hut Count 17 35 52
% within Types of house 32.7% 67.3% 100.0%
% within Status of house 54.8% 59.3% 57.8%
Tiles Count 9 16 25
% within Types of house 36.0% 64.0% 100.0%
% within Status of house 29.0% 27.1% 27.8%
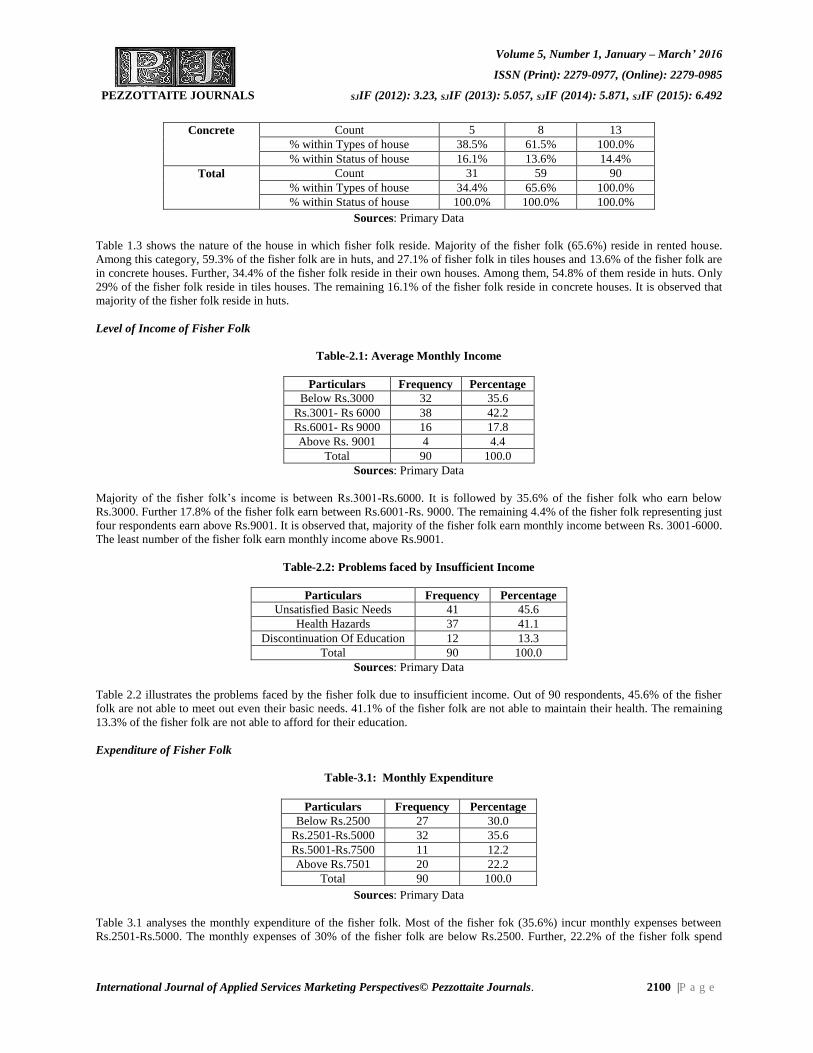
Volume 5, Number 1, January – March’ 2016
ISSN (Print): 2279-0977, (Online): 2279-0985
PEZZOTTAITE JOURNALS SJIF (2012): 3.23, SJIF (2013): 5.057, SJIF (2014): 5.871, SJIF (2015): 6.492
International Journal of Applied Services Marketing Perspectives© Pezzottaite Journals. 2100 |P a g e
Sources: Primary Data
Table 1.3 shows the nature of the house in which fisher folk reside. Majority of the fisher folk (65.6%) reside in rented house.
Among this category, 59.3% of the fisher folk are in huts, and 27.1% of fisher folk in tiles houses and 13.6% of the fisher folk are
in concrete houses. Further, 34.4% of the fisher folk reside in their own houses. Among them, 54.8% of them reside in huts. Only
29% of the fisher folk reside in tiles houses. The remaining 16.1% of the fisher folk reside in concrete houses. It is observed that
majority of the fisher folk reside in huts.
Level of Income of Fisher Folk
Table-2.1: Average Monthly Income
Particulars Frequency Percentage
Below Rs.3000 32 35.6
Rs.3001- Rs 6000 38 42.2
Rs.6001- Rs 9000 16 17.8
Above Rs. 9001 4 4.4
Total 90 100.0
Sources: Primary Data
Majority of the fisher folk’s income is between Rs.3001-Rs.6000. It is followed by 35.6% of the fisher folk who earn below
Rs.3000. Further 17.8% of the fisher folk earn between Rs.6001-Rs. 9000. The remaining 4.4% of the fisher folk representing just
four respondents earn above Rs.9001. It is observed that, majority of the fisher folk earn monthly income between Rs. 3001-6000.
The least number of the fisher folk earn monthly income above Rs.9001.
Table-2.2: Problems faced by Insufficient Income
Particulars Frequency Percentage
Unsatisfied Basic Needs 41 45.6
Health Hazards 37 41.1
Discontinuation Of Education 12 13.3
Total 90 100.0
Sources: Primary Data
Table 2.2 illustrates the problems faced by the fisher folk due to insufficient income. Out of 90 respondents, 45.6% of the fisher
folk are not able to meet out even their basic needs. 41.1% of the fisher folk are not able to maintain their health. The remaining
13.3% of the fisher folk are not able to afford for their education.
Expenditure of Fisher Folk
Table-3.1: Monthly Expenditure
Sources: Primary Data
Table 3.1 analyses the monthly expenditure of the fisher folk. Most of the fisher fok (35.6%) incur monthly expenses between
Rs.2501-Rs.5000. The monthly expenses of 30% of the fisher folk are below Rs.2500. Further, 22.2% of the fisher folk spend
Concrete Count 5 8 13
% within Types of house 38.5% 61.5% 100.0%
% within Status of house 16.1% 13.6% 14.4%
Total Count 31 59 90
% within Types of house 34.4% 65.6% 100.0%
% within Status of house 100.0% 100.0% 100.0%
Particulars Frequency Percentage
Below Rs.2500 27 30.0
Rs.2501-Rs.5000 32 35.6
Rs.5001-Rs.7500 11 12.2
Above Rs.7501 20 22.2
Total 90 100.0
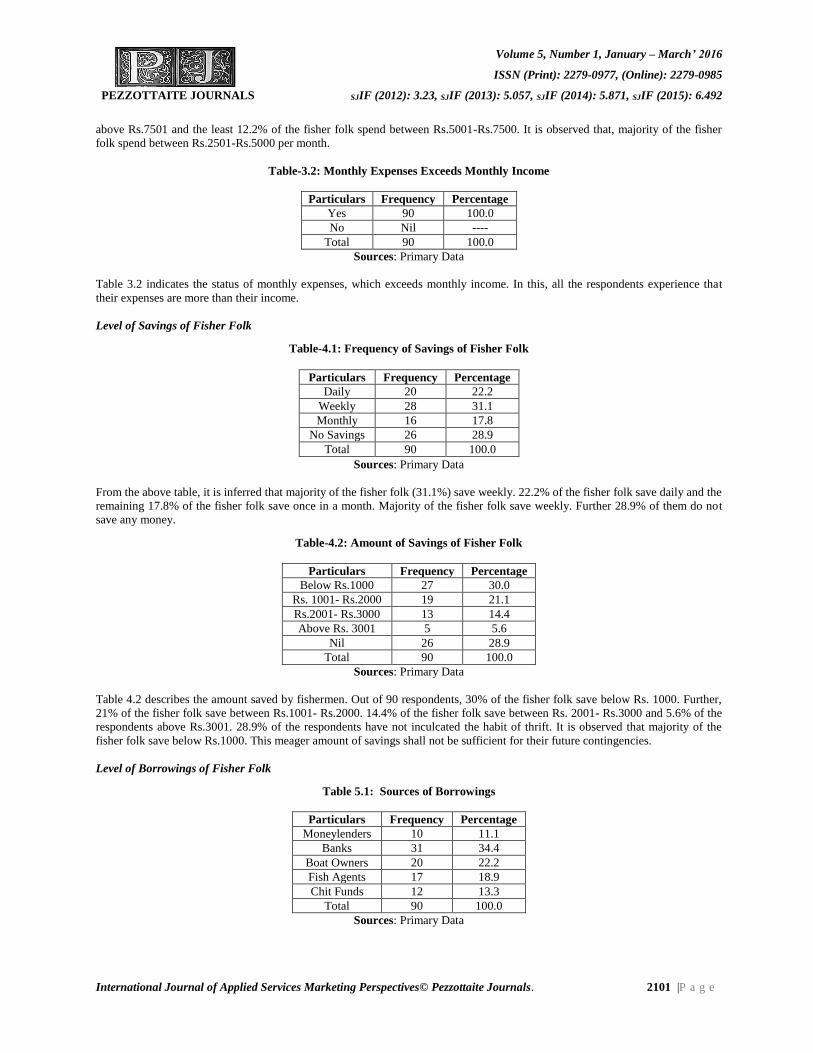
Volume 5, Number 1, January – March’ 2016
ISSN (Print): 2279-0977, (Online): 2279-0985
PEZZOTTAITE JOURNALS SJIF (2012): 3.23, SJIF (2013): 5.057, SJIF (2014): 5.871, SJIF (2015): 6.492
International Journal of Applied Services Marketing Perspectives© Pezzottaite Journals. 2101 |P a g e
above Rs.7501 and the least 12.2% of the fisher folk spend between Rs.5001-Rs.7500. It is observed that, majority of the fisher
folk spend between Rs.2501-Rs.5000 per month.
Table-3.2: Monthly Expenses Exceeds Monthly Income
Particulars Frequency Percentage
Yes 90 100.0
No Nil ----
Total 90 100.0
Sources: Primary Data
Table 3.2 indicates the status of monthly expenses, which exceeds monthly income. In this, all the respondents experience that
their expenses are more than their income.
Level of Savings of Fisher Folk
Table-4.1: Frequency of Savings of Fisher Folk
Sources: Primary Data
From the above table, it is inferred that majority of the fisher folk (31.1%) save weekly. 22.2% of the fisher folk save daily and the
remaining 17.8% of the fisher folk save once in a month. Majority of the fisher folk save weekly. Further 28.9% of them do not
save any money.
Table-4.2: Amount of Savings of Fisher Folk
Particulars Frequency Percentage
Below Rs.1000 27 30.0
Rs. 1001- Rs.2000 19 21.1
Rs.2001- Rs.3000 13 14.4
Above Rs. 3001 5 5.6
Nil 26 28.9
Total 90 100.0
Sources: Primary Data
Table 4.2 describes the amount saved by fishermen. Out of 90 respondents, 30% of the fisher folk save below Rs. 1000. Further,
21% of the fisher folk save between Rs.1001- Rs.2000. 14.4% of the fisher folk save between Rs. 2001- Rs.3000 and 5.6% of the
respondents above Rs.3001. 28.9% of the respondents have not inculcated the habit of thrift. It is observed that majority of the
fisher folk save below Rs.1000. This meager amount of savings shall not be sufficient for their future contingencies.
Level of Borrowings of Fisher Folk
Table 5.1: Sources of Borrowings
Particulars Frequency Percentage
Moneylenders 10 11.1
Banks 31 34.4
Boat Owners 20 22.2
Fish Agents 17 18.9
Chit Funds 12 13.3
Total 90 100.0
Sources: Primary Data
Particulars Frequency Percentage
Daily 20 22.2
Weekly 28 31.1
Monthly 16 17.8
No Savings 26 28.9
Total 90 100.0
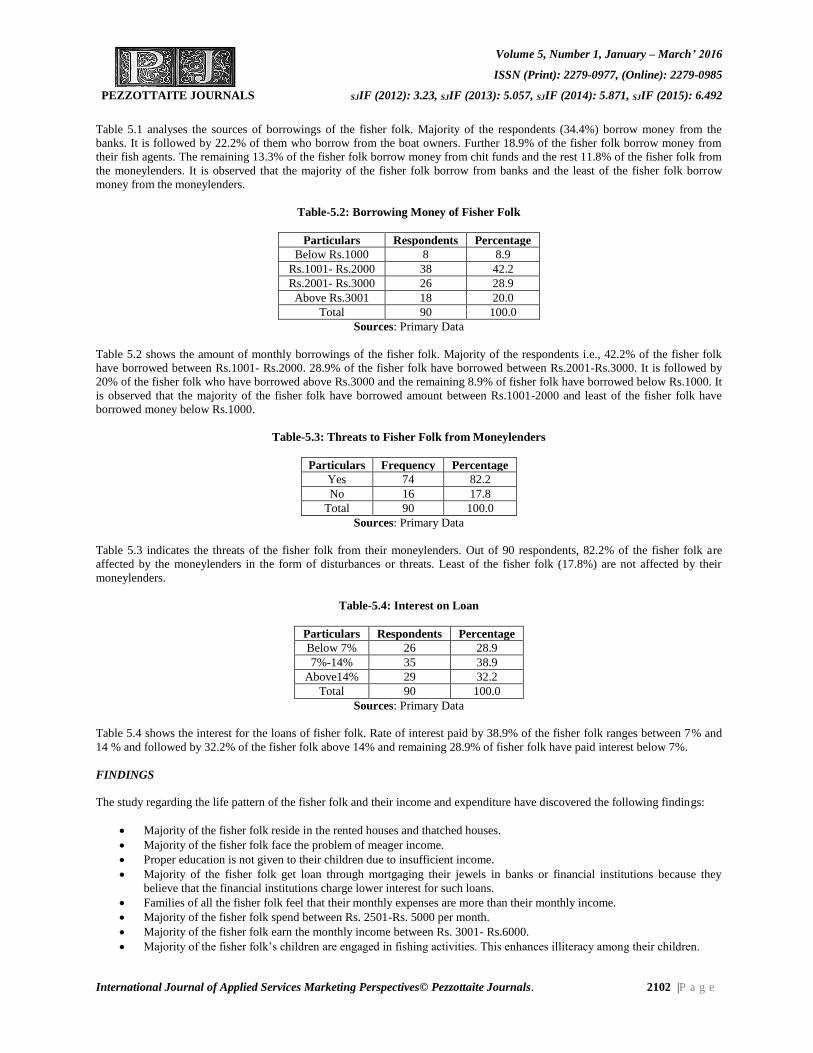
Volume 5, Number 1, January – March’ 2016
ISSN (Print): 2279-0977, (Online): 2279-0985
PEZZOTTAITE JOURNALS SJIF (2012): 3.23, SJIF (2013): 5.057, SJIF (2014): 5.871, SJIF (2015): 6.492
International Journal of Applied Services Marketing Perspectives© Pezzottaite Journals. 2102 |P a g e
Table 5.1 analyses the sources of borrowings of the fisher folk. Majority of the respondents (34.4%) borrow money from the
banks. It is followed by 22.2% of them who borrow from the boat owners. Further 18.9% of the fisher folk borrow money from
their fish agents. The remaining 13.3% of the fisher folk borrow money from chit funds and the rest 11.8% of the fisher folk from
the moneylenders. It is observed that the majority of the fisher folk borrow from banks and the least of the fisher folk borrow
money from the moneylenders.
Table-5.2: Borrowing Money of Fisher Folk
Particulars Respondents Percentage
Below Rs.1000 8 8.9
Rs.1001- Rs.2000 38 42.2
Rs.2001- Rs.3000 26 28.9
Above Rs.3001 18 20.0
Total 90 100.0
Sources: Primary Data
Table 5.2 shows the amount of monthly borrowings of the fisher folk. Majority of the respondents i.e., 42.2% of the fisher folk
have borrowed between Rs.1001- Rs.2000. 28.9% of the fisher folk have borrowed between Rs.2001-Rs.3000. It is followed by
20% of the fisher folk who have borrowed above Rs.3000 and the remaining 8.9% of fisher folk have borrowed below Rs.1000. It
is observed that the majority of the fisher folk have borrowed amount between Rs.1001-2000 and least of the fisher folk have
borrowed money below Rs.1000.
Table-5.3: Threats to Fisher Folk from Moneylenders
Particulars Frequency Percentage
Yes 74 82.2
No 16 17.8
Total 90 100.0
Sources: Primary Data
Table 5.3 indicates the threats of the fisher folk from their moneylenders. Out of 90 respondents, 82.2% of the fisher folk are
affected by the moneylenders in the form of disturbances or threats. Least of the fisher folk (17.8%) are not affected by their
moneylenders.
Table-5.4: Interest on Loan
Particulars Respondents Percentage
Below 7% 26 28.9
7%-14% 35 38.9
Above14% 29 32.2
Total 90 100.0
Sources: Primary Data
Table 5.4 shows the interest for the loans of fisher folk. Rate of interest paid by 38.9% of the fisher folk ranges between 7% and
14 % and followed by 32.2% of the fisher folk above 14% and remaining 28.9% of fisher folk have paid interest below 7%.
FINDINGS
The study regarding the life pattern of the fisher folk and their income and expenditure have discovered the following findings:
Majority of the fisher folk reside in the rented houses and thatched houses.
Majority of the fisher folk face the problem of meager income.
Proper education is not given to their children due to insufficient income.
Majority of the fisher folk get loan through mortgaging their jewels in banks or financial institutions because they
believe that the financial institutions charge lower interest for such loans.
Families of all the fisher folk feel that their monthly expenses are more than their monthly income.
Majority of the fisher folk spend between Rs. 2501-Rs. 5000 per month.
Majority of the fisher folk earn the monthly income between Rs. 3001- Rs.6000.
Majority of the fisher folk’s children are engaged in fishing activities. This enhances illiteracy among their children.

Volume 5, Number 1, January – March’ 2016
ISSN (Print): 2279-0977, (Online): 2279-0985
PEZZOTTAITE JOURNALS SJIF (2012): 3.23, SJIF (2013): 5.057, SJIF (2014): 5.871, SJIF (2015): 6.492
International Journal of Applied Services Marketing Perspectives© Pezzottaite Journals. 2103 |P a g e
SUGGESTIONS
The fishermen reside in thatched houses, which are more risky at times of heavy rainfall and storm. Therefore,
Government shall extent help to rebuild their houses.
Fishing is not a permanent job and the income from fishing is from hand to mouth, so the fishermen shall find an
alternate source of income, which gives him an additional earning to run the family.
The government should help the fishermen by offering scholarships to the children of the fisher folk, which shall
motivate their children for literacy.
Most of the fishermen get loans by mortgaging their jewels in the bank, and they are unable to repay the due amount due
to their meager income, which is not even sufficient to meet out their monthly expenditures. Therefore, the government
can take steps to waive the interest on their jewel loans.
Sufficient cold storage and ice plants facilities must be provided to prevent fish from going waste. Internal market
facilities must be developed with suitable transport facilities. Every fishing village should be provided with suitable road
facilities with adequate feeder roads linking every fishing center. Fishermen should be educated sufficiently to preserve
fish at the catching point itself.
Modern fish processing units must be established in all the important fishing centers along with State fisheries units.
Fishermen in the coastal area should be provided with proper sanitation and medical facilities, drinking water, wells and
electricity.
All-important minor ports must be given top priority for berthing facilities and processing units with freezer–cum–ice
plants for the use of small fishermen.
Alternate jobs during off-season should be provided to the fishermen and their womenfolk.
ISSUES / CONCERN AREA
Unregulated Market: The market is highly unregulated for fishery with no minimum prices fixed for species, no product
differentiation, no control on quality standards, no weighing mechanism for the catch, etc. The scenario further worsen with few
players dictating the terms and condition of the trade.
Price Paradox: The pricing of the fish is one of the major concerns in the trade. The species, which are exported, sees a quantum
jump of more than 500% from the source of origin. There are numerous other ways of modulating the price in favour of business
at the expense of the poor fisherman, leverage being the credit, which supports the industry and the processors, rather than the
poor fisherman.
Infrastructure: The state of the infrastructure was observed to be poor except for the few major landing centers. Even the basic
amenities like weighing machines, landing platform, icing facility (cold storage) etc. were absent. Immediate attention by the
government in developing the basic facility at the landing centre needs to be prioritized.
Credit: The availability of credit to the fisherman is yet another area of concern for equitable growth of the sector. The credit
leverage with the bigger players of the trade is one of the most important controls used on the trade. The rising of the “Client
Patron Relationship” is the effect of the credit control, which has distorted the trade unfavorably for the fisherman. The financial
institution needs to review the modus operandi for providing credit facility to the fisherman community on terms and conditions,
which support the fisherman. In addition, the place of availability needs to be in proximity of the settlement of the fisherman
which will help them accessing credit on requirement. Special schemes in terms of credit for boat and nets need to be developed,
as it is an important requirement for the fisherman.
Primary Phase- Secondary Phase Articulation: The articulation between the catch / culture and industrial phases has been an
area of concern for the fishery sector. In general, through practical constraints and facilitation and the use of multiple means, links
have been established between the crafts and the processing plants, providing certain minimum stability to the chain, but the
scenario continues to be bleak for the poor fisherman as the trade barriers created by the players of the value chain sharply and
critically hampers the profit margin for him. On the other hand, the problem connected with the method by which the product is
prepared in the catch / culture phase is of prime concern to the industrial phase because of the barriers to trade created by the
global market standards, which limits the possibilities for its industrial processing.
Ancillary Support Services: Ancillary support services are the lifeline of the fishery trade owing to the perishable nature of the
product. Immediate availability of ice, cold storage and transportation facility is necessary for the fishery trade. The control over
ice factory, cold storage and transportation lies with the big players of the trade and the poor fisherman is devoid of these facilities
when he wants to access /use it.
Gender: Gender concerns in the fishery business have a different dimension altogether in terms of physical as well as financial
exploitation of the women even though they play an important role in the fish supply chain at the local level. The centre of power
Volume 5, Number 1, January – March’ 2016
ISSN (Print): 2279-0977, (Online): 2279-0985
PEZZOTTAITE JOURNALS SJIF (2012): 3.23, SJIF (2013): 5.057, SJIF (2014): 5.871, SJIF (2015): 6.492
International Journal of Applied Services Marketing Perspectives© Pezzottaite Journals. 2104 |P a g e
in terms of decision making, trade, financial access over product and market had been traditionally the domain of the male counter
parts and women have little say in it. Fish drying and selling is the major activity in which the women are involved. The financial
exploitation of women is severest in the market place because of the unregulated market. In addition, the choice in terms of
purchases is very limited at the landing centre where they have say only for the products of low value and category.
Sustainable Harvest: Exploitation of the natural resource with the advent of trawlers and ever-increasing number of the
traditional craft has decreased the quantum of catch per trip to the fisherman. In addition, destructive fishing by the trawler and
advances craft has severely impeded the capacity of the resource to rejuvenate back. In light of the issues raises above and in quest
for redressal of the problems to improve upon the socio-economic condition of the poor fisherman a directed concentrated effort
should be made on the axis of the trade. This leads us to the supply chain management and its implication on the various players.
Experiences with the wonderful outcome of supply chain management in dairy sector (Amul experience) highlight the need for
such an intervention in fishery sector. There exists a lot of similarity between nature of product, scope of production, trade
practices, market, value addition, exports, etc. in dairy and fishery sector. This inspires to think for strategic intervention in the
fishery sector on the similar lines keeping the intrinsic nature of the sector as the directive force for such an intervention.
Development of fishermen is often restricted to the traditional fishing communities near the coastal areas in maritime states while
the interest of those associated with inland fishery is relatively neglected. The frequency or regularity of fish catch, its volume and
yield of profit from an aquaculture enterprise, efficiency in management, the involvement of the members in the cooperative /
group in the management pattern of an aquaculture pond are likely to have a bearing on the socio-economic status of the
fishermen who are primarily engaged in catching fish from the concerned ponds. Disparity in the standard of living, differential
access to income earning capacity and other perquisites are likely to give rise to the growth of discontent amongst the relatively
indigent fishermen, thus partially weakening their urge to wholeheartedly participate in the activity of fishing. Even their devotion
to work may be shaken because of a sense of relative deprivation.
CONCLUSION
Fisher folk hardly have any other alternative job opportunity to switch over. The little amount that they could possibly save get
drained away for buying medicine or for servicing of the nets which for most part of the year remain idle. For fuel and water, the
two important ingredients of household maintenance, most of them have still to depend on outdoor collection. The previously
mentioned conditions are manifest mostly in rural areas compared to urban sector. Some of these features like poor family
income, low level of literacy, family size etc., coupled with poor financial inputs have left many of the fishermen in unimproved
state of economic condition. Instability in earning potential from fishing occupation has in many cases compelled the offspring of
the fishermen to turn to alternative employment prospects. This trend needs to be countered by ameliorative steps. Ensuring access
of fishermen in poorer rural cooperatives to credit support from various financial institutions, National Bank for Agricultural and
Rural Development (NABARD) etc., on congenial terms, provision of quality seed and feed, role of non-governmental
organizations (NGO) or local institutions in the spread of literacy, or even spread of distance education through print or electronic
media, are essential prerequisite for preventing potential exodus of people from traditional fishing occupation in near future.
Income inequality in some of these cases, although low has been found to be coexistent with low literacy and low income earning
opportunities. These need to be replaced by higher terms for all alike. Poor literacy and lack of training have in many cases
hindered the adoption of improved technology. Human resource development programmes with emphasis on sanitation and health
insurance, better training facilities, adoption of small family norms, together with reclamation of hitherto unused wetlands and
need, based public grants are some of the means that can activate the rural fishers. Besides this proper marketing facility for the
harvested fish, storage facility within easy reach of the fishermen covering a number of cooperatives or group and even provision
of dissemination of time-to-time information about market prices and demand to the fishermen, can provide viable fishing
strategies conducive to a successful eking out of a livelihood.
It might be difficult to implement all these strategies simultaneously in all the cases, but implementation of site-specific
combinations of several of these strategic options at different degrees have emerged to be extremely necessary to resuscitate the
condition of fishermen and rejuvenate the prospects of a viable fishery enterprise.
REFERENCES
1. Drawes, E. (1982). Three Fishing Villages in Tamil Nadu: A Socio-Economic Study with Special Reference to the
Role and Status of Women (BOBP/WP/14). Madras: BOBP.
2. (2011, December). Economics & Management Research, 1(3).
3. Fredrick, (2011). An analysis of Income and Expenditure Pattern of Fisherfolk with reference to Thoothukudi District.
Zenith International Journal of Business.
Volume 5, Number 1, January – March’ 2016
ISSN (Print): 2279-0977, (Online): 2279-0985
PEZZOTTAITE JOURNALS SJIF (2012): 3.23, SJIF (2013): 5.057, SJIF (2014): 5.871, SJIF (2015): 6.492
International Journal of Applied Services Marketing Perspectives© Pezzottaite Journals. 2105 |P a g e
4. (2012-2013). Government of Tamil Nadu. Department of Fisheries Citizen Charter.
5. (1997). Economic Review. Government of Tamilnadu. State-Planning Board.
6. Kalawar, A. G. (1981). Socio- Economic Conditions of the Coastal Rural Sector. CMFRI Bulletin, 30.
7. Karmakar (et. al.). (2009). Review of the Development of Microfinance Services for Coastal Small Scale Fisheries
and Aquaculture for South Asia Countries, (including India, Bangladesh & Sri Lanka), pp. 1-10.
8. (2008). Kerala Development Report 2008, in World Development Report.
9. Kurien, John. (1981). Socio-Economic Conditions of Traditional Fishermen. CMFRI Bulletin, 30: Magnified by the
Tsunami, Chennai Fisherfolk Poor Socio Condition, 2010. Population Reference Bureau.
10. Mahesh V. Joshi, (1996). Economics of Fisheries, APH. Publishing Corporation, New Delhi.
11. Mahesh, R., & Rajesenan, D. (2006). Retrieved from http://dyuthi.cusat.ac.in/purl/99 Cochin
12. Mahesh. Joshy. (1996). Economics of Fisheries. New Delhi: APJ Publishing Corporation.
13. Nuruddin, Adnam Bin. (1994). Bio Socio-Economics of Fishing for Shrimp in Kuala Sepetang, Malaysia.
14. Observer Robert, E., Bowen, & Cory, Riley. (2003). Socio-Economic Indicators and Integrated Coastal Management,
46, 299-331.
15. Oladoja, M. A., & Adeokun, O. A. (2009). Analysis of Socio-Economic Constraints of Fisherfolk on Poverty
Alleviation in Lagos State, Nigeria. Agricultural Journal, 4(3), 130-134.
16. Rajan, J. (2000). Fishing Economy of Kerala. Chathanoor. Kollam: Sujilee Publishing House.
17. Shanmugaraj, T., & Upreti, Ashok. (1998). Socio-Economic Status of Fisherfolk Communities in the Gulf of Mannar,
Marine Biosphere Reserve A Survey of Tamil Nadu Forest Department. Society, 1(1), / February 2011, 101-108.
18. Sudarsan, D. (et. al.). (1991). Charted Fishing Vessels Operations in Indian EEZ and Annual Reports of FSI.
19. Supra, Raju S. (2003, June). Andhra Pradesh Marine Fisheries: A Comparison. Yogana, 17, 3-3.
20. Retrieved from http://shodhganga.inflibnet.ac.in/bitstream/10603/14791/8/08_chapter%202.pdf
21. Retrieved from http://www.readbag.com/ssvk-pdf-doc-files-ssvk-study-coastal-fisherman
22. Retrieved from
http://www.researchgate.net/publication/262124275_Blurred_Borders_Coastal_Conflicts_between_India_an...
23. Retrieved from http://citeseerx.ist.psu.edu/viewdoc/summary?doi=10.1.1.255.6135
*****
FOR PAPER SUBMISSION & CLARIFICATION OR SUGGESTION, EMAIL US @:
Editor-In-Chief
Pezzottaite Journals,
24, Saraswati Lane, Bohri, Near Modern Dewan Beverages,
Jammu Tawi – 180002, Jammu and Kashmir, India.
(Mobile): +91-09419216270 – 71
Volume 5, Number 1, January – March’ 2016
ISSN (Print): 2279-0977, (Online): 2279-0985
PEZZOTTAITE JOURNALS SJIF (2012): 3.23, SJIF (2013): 5.057, SJIF (2014): 5.871, SJIF (2015): 6.492
International Journal of Applied Services Marketing Perspectives© Pezzottaite Journals. 2106 |P a g e
WATERSHED PROGRAMMES, LIVELIHOOD AND ASSETS GENERATED
AND PERCEPTION LEVEL OF CONTROLLING SOIL EROSION
Raghu C.50 Dr. B. Ravindrakumar51
ABSTRACT
Watershed programmes aims at raising the agricultural production in rain fed areas, conserves natural resources and reduce
poverty in the world’s semi-arid and arid zone. These are mainly found in South Asian and Sub-Sahara Africa. In these areas,
it is felt that watersheds conserve water during rainy seasons for subsequent use in dry periods (Farrington J., et al. 1990).
Watershed programmes benefit landholders while harming landless, particularly herders and women (John Kerr 2002). It is
interesting to note that India has a history of innovative style of sharing benefits of watershed programme where the
downstream landholders compensate upstream landless for providing a practical environmental service. The upstream users
should settle claims emphasis that without compensation they could refuse to provide the watershed service to downstream
property owners.
The integrated approach of watershed development focuses on conservation and development of three natural resources, viz.,
land, water and vegetarian. In the light of problems like emphasis on resource conservation than utilization, conflicting
interest between private and common prospective and implied tradeoffs between stakeholders from different economic and
social strata (Shah 2000), and these problems necessities prioritization of programmes undertaken under the watershed
approach. The degree of fragility of ecological socio-economic of respective regions can be the basis for prioritization.
INTRODUCTION
Major portion of rain fed areas in India is characterized by low productivity, high risk and uncertainly, low level of technological
change and vulnerability to degradation of natural resources. Acute poverty, unemployment, low standard of living, cost conflicts
undernourished population are some of the demographic characteristics in India. Rain fed areas were overtaken by irrigable areas
in terms of investment, infrastructure and adopting of technology. Such a tendency has led to regressive in the growth
performance of rain fed areas as compared to the irrigated area. In India, watershed programmes were initiated primarily with an
objective to solve increasing environmental crisis and to ensure sustainability of agricultural operations especially in the rain fed
and arid / semi-arid.
REVIEW OF LITERATURE
There are no systematic and large-scale impact assessment studies on the performance of watershed programmes. There is a lack
of proper indicators and evaluation methods to assess the tangible and non-tangible economic, social and sustainability impacts of
the programme. The mid-term appraisal of the 9th plan of the planning commission articulated satisfactory and unsatisfactory
performance of watershed programme on different issues (Government of India, 2001). On a satisfactory scale, it has informed
that impact was visible in increasing cropping intensity, changing patterns, increasing crop productivity and augmenting recharge.
On social aspects, the impact was noted in generating employment opportunities, and increasing family income.
Deshpande and Ratna Reddy (1991) concluded that location specialty was an extremely important aspect of watershed
programmes. Further, they have also stated that watershed treatment changed income, stabilize income flow and have positive
impact on income distribution. They concluded by stating that people’s participation and scientific input were two most important
components watershed planning that enhances impacts.
Studies by Chopra et al 1990, Farrington on Lobo 1997, Samira 1997, Ratna Reddy 2000, have mixed conclusions on the
performance of watershed programmes in achieving the expected economic and environmental outcomes. These studies brought
useful insights regarding impacts created by numerous watershed programmes and verified the successfulness.
OBJECTIVES OF STUDY
To know the livelihood activities undertaken by the respondents.
To know the livelihood assets created and possessed by the respondents.
To know the perception on controlling soil erosion through different activities.
50Research Scholar, Department of Economics, Tumkur University, Karnataka, India, [email protected] 51Associate Professor, Department of Economics, Tumkur University, Karnataka, India, [email protected]
Volume 5, Number 1, January – March’ 2016
ISSN (Print): 2279-0977, (Online): 2279-0985
PEZZOTTAITE JOURNALS SJIF (2012): 3.23, SJIF (2013): 5.057, SJIF (2014): 5.871, SJIF (2015): 6.492
International Journal of Applied Services Marketing Perspectives© Pezzottaite Journals. 2107 |P a g e
HYPOTHESES
Livelihood assets are not generated in the study area.
There are no livelihood activities undertaken in the study area.
Respondents in the study area have not saved for their future use.
RESEARCH METHODOLOGY
The study is based on primary data. Data obtained from selected watershed villagers by using a structured questionnaire. In order
to study the livelihood activities and assets generated one Gram Panchayat was selected in Kolar district. All villages under
Srinivasapura Taluk, Lakshmipura Grama Panchayat of Kolar District of Karnataka was selected as it has contained many
watershed programmes. For the purpose of data collection, 30% of households with a minimum 500 respondents has been
selected. Talking into account the literacy rates the questionnaire was administered as schedule. The data collection started on Feb
15, 2015 and ended on March 10th 2015. In order to present perception level of the soil erosion controlling activities Kindells
coefficient of concordance quantitative metrics is applied to analyses variations in bipolar opinions expressed by respondents.
SURVEY FINDINGS
Impact measurement is presented in the table-1. It is measured in terms of change in various indicators due to watershed
programme in four sample villages. The measurement of impact. Table reveals 2H (High) in case of Srinivasapura village, one H
in case of Chintamakalahalli and 7H in case of Lakshmipura and no H in case of Shagathur Impact indicators are grouped under
financial capital (livelihoods / economic natural capital (ecological) human capital and social capital. Financial capital or
livelihood impact is measured in terms of changes in migration and difference in gender equity while women capital is measured
in terms of changes in health and educational status. Natural capital is measured in terms of changes in availability of drinking
water, ground water, fodder and fuel wood.
Impact is measured in terms of performance of watershed in enhancing the livelihood assets and activities. Both assets and impact
acre measured on a relative scale, which is based on the performance among the sample villages. The level of performance varies
from one to another variable. Social assets are measured in terms of expenditure incurred. Higher expenditure made on education
is a positive indicator and while on health may be either positive or negative. Here positives is taken by that because of increased
livelihood security towards the use to spend more and spend more account of poor health conditions more. The situation in terms
of availability of fodder and fuel wood. In case of migration low stands for positive and high reflects negativeness. Equity is
defined in terms of in case, agricultural output inequalities among the households. Table reveals that all selected sample villages a
better positive as far as agriculture is considered. Lakshmipura shows high involvement in agriculture and the rest medium.
Further, the table also reveals that agriculture is not only source of income. Srinivasapura village shows low stature in education
and medium in case of health. All villages shows medium health conditions. Social capital also vary among the 4 sample villages
and table reveals that low-level migration in all 4 sample villages.
Impact of Watershed on Livelihood Security
Table-2 reveals data about impact of watershed on livelihood of respondents. The success of any programme is measured in terms
creation of impact and the stronger the impishness more is the successfulness of watershed programme. The highest impact is
about food security and 500 respondents said watershed programme has succeeded because of food security benefit. Further 480
respondents expressed watershed programmes creates employment generation activities. 450 respondents said watershed
programme provided public amenities 420-community life and 390 housing. The high impact created made the respondents to
spend more to lead a better life.
Perception on Controlling Soil Erosion through Different Activities
Table-3 shows details of perception of respondents about soil erosion control through different activities. Respondent’s perception
is measured and shown in the table in the form of 5-point Likert scale. 295 respondents out of 500 highly agreed that they possess
perception on controlling soil erosion through different activities. 150 respondents agreed that they possess perception and 22
neutral and 33 either not aware or highly not aware. Kendell’s coefficient of concordance rejects the null hypotheses and accepts
the alternative. Therefore, it may be concluded here that respondents possess perceptive knowledge about soil erosion controlling
through different activities.
CONCLUSION
The study area offers a greater scope for further improvement in the activities of watershed programme. Several soil expert
committees were constituted to seek recommendations for making watershed programme a success. All the recommendations
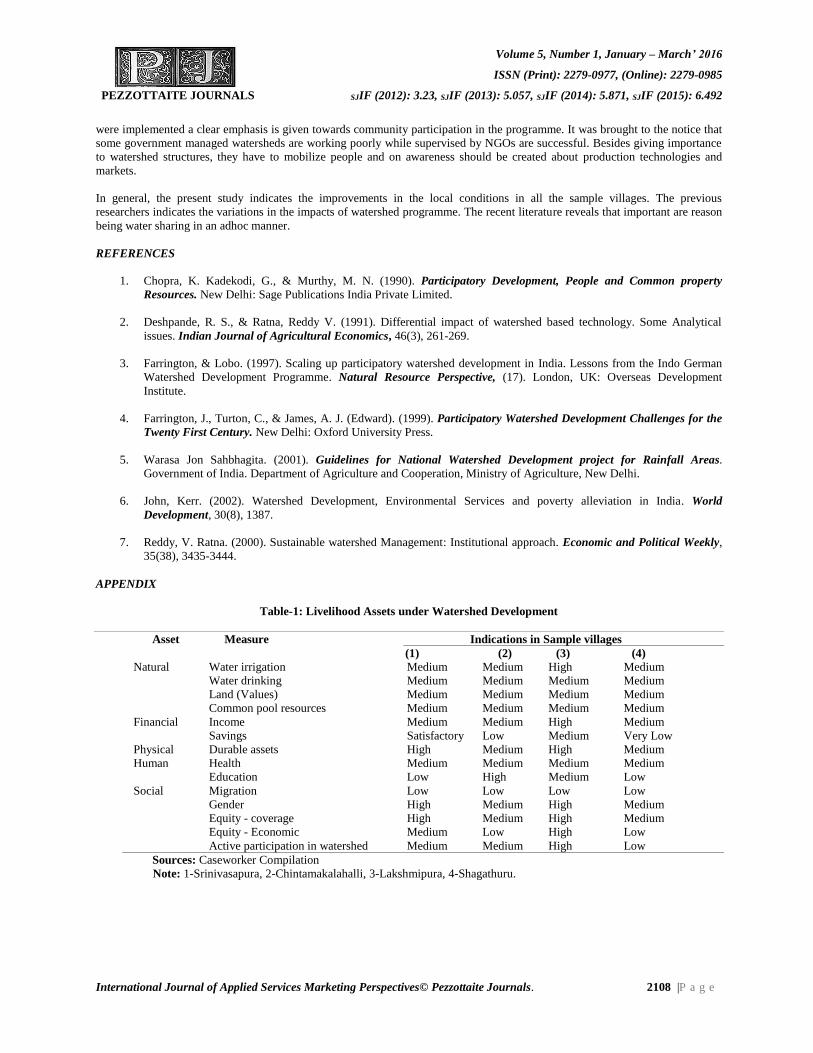
Volume 5, Number 1, January – March’ 2016
ISSN (Print): 2279-0977, (Online): 2279-0985
PEZZOTTAITE JOURNALS SJIF (2012): 3.23, SJIF (2013): 5.057, SJIF (2014): 5.871, SJIF (2015): 6.492
International Journal of Applied Services Marketing Perspectives© Pezzottaite Journals. 2108 |P a g e
were implemented a clear emphasis is given towards community participation in the programme. It was brought to the notice that
some government managed watersheds are working poorly while supervised by NGOs are successful. Besides giving importance
to watershed structures, they have to mobilize people and on awareness should be created about production technologies and
markets.
In general, the present study indicates the improvements in the local conditions in all the sample villages. The previous
researchers indicates the variations in the impacts of watershed programme. The recent literature reveals that important are reason
being water sharing in an adhoc manner.
REFERENCES
1. Chopra, K. Kadekodi, G., & Murthy, M. N. (1990). Participatory Development, People and Common property
Resources. New Delhi: Sage Publications India Private Limited.
2. Deshpande, R. S., & Ratna, Reddy V. (1991). Differential impact of watershed based technology. Some Analytical
issues. Indian Journal of Agricultural Economics, 46(3), 261-269.
3. Farrington, & Lobo. (1997). Scaling up participatory watershed development in India. Lessons from the Indo German
Watershed Development Programme. Natural Resource Perspective, (17). London, UK: Overseas Development
Institute.
4. Farrington, J., Turton, C., & James, A. J. (Edward). (1999). Participatory Watershed Development Challenges for the
Twenty First Century. New Delhi: Oxford University Press.
5. Warasa Jon Sahbhagita. (2001). Guidelines for National Watershed Development project for Rainfall Areas.
Government of India. Department of Agriculture and Cooperation, Ministry of Agriculture, New Delhi.
6. John, Kerr. (2002). Watershed Development, Environmental Services and poverty alleviation in India. World
Development, 30(8), 1387.
7. Reddy, V. Ratna. (2000). Sustainable watershed Management: Institutional approach. Economic and Political Weekly,
35(38), 3435-3444.
APPENDIX
Table-1: Livelihood Assets under Watershed Development
Asset Measure Indications in Sample villages
(1) (2) (3) (4)
Natural Water irrigation Medium Medium High Medium
Water drinking Medium Medium Medium Medium
Land (Values) Medium Medium Medium Medium
Common pool resources Medium Medium Medium Medium
Financial Income Medium Medium High Medium
Savings Satisfactory Low Medium Very Low
Physical Durable assets High Medium High Medium
Human Health Medium Medium Medium Medium
Education Low High Medium Low
Social Migration Low Low Low Low
Gender High Medium High Medium
Equity - coverage High Medium High Medium
Equity - Economic Medium Low High Low
Active participation in watershed Medium Medium High Low
Sources: Caseworker Compilation
Note: 1-Srinivasapura, 2-Chintamakalahalli, 3-Lakshmipura, 4-Shagathuru.
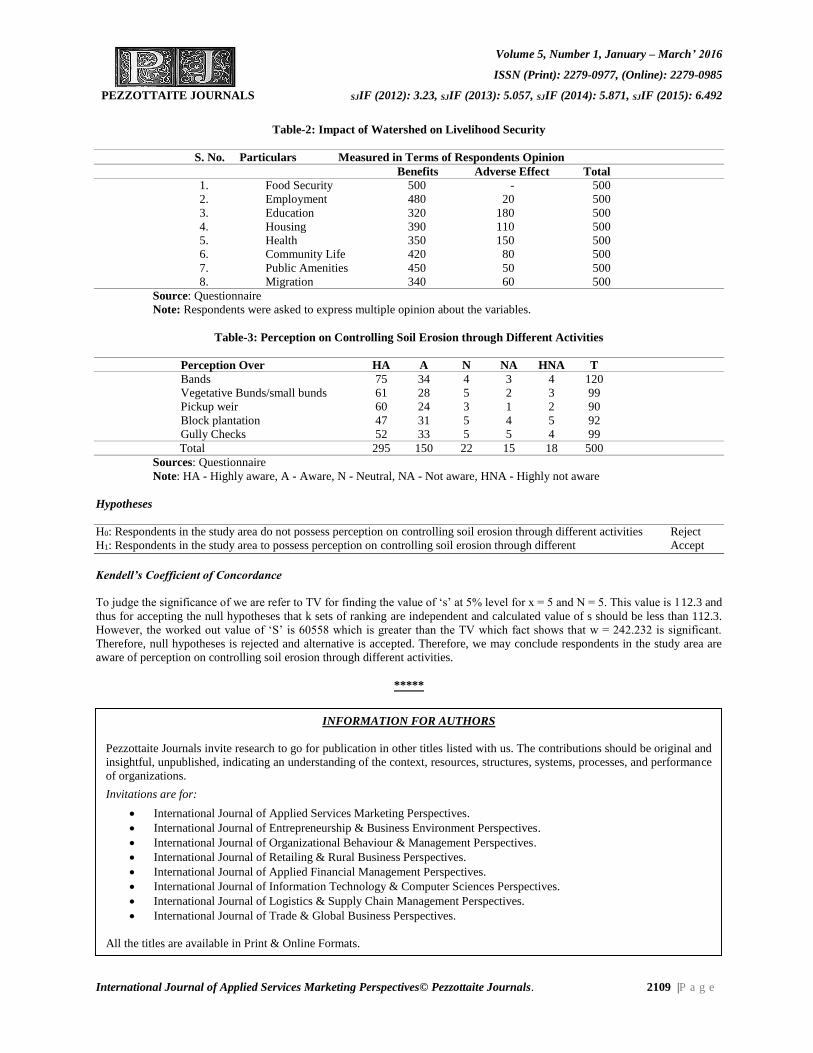
Volume 5, Number 1, January – March’ 2016
ISSN (Print): 2279-0977, (Online): 2279-0985
PEZZOTTAITE JOURNALS SJIF (2012): 3.23, SJIF (2013): 5.057, SJIF (2014): 5.871, SJIF (2015): 6.492
International Journal of Applied Services Marketing Perspectives© Pezzottaite Journals. 2109 |P a g e
Table-2: Impact of Watershed on Livelihood Security
S. No. Particulars Measured in Terms of Respondents Opinion
Benefits Adverse Effect Total
1. Food Security 500 - 500
2. Employment 480 20 500
3. Education 320 180 500
4. Housing 390 110 500
5. Health 350 150 500
6. Community Life 420 80 500
7. Public Amenities 450 50 500
8. Migration 340 60 500
Source: Questionnaire
Note: Respondents were asked to express multiple opinion about the variables.
Table-3: Perception on Controlling Soil Erosion through Different Activities
Perception Over HA A N NA HNA T
Bands 75 34 4 3 4 120
Vegetative Bunds/small bunds 61 28 5 2 3 99
Pickup weir 60 24 3 1 2 90
Block plantation 47 31 5 4 5 92
Gully Checks 52 33 5 5 4 99
Total 295 150 22 15 18 500
Sources: Questionnaire
Note: HA - Highly aware, A - Aware, N - Neutral, NA - Not aware, HNA - Highly not aware
Hypotheses
H0: Respondents in the study area do not possess perception on controlling soil erosion through different activities Reject
H1: Respondents in the study area to possess perception on controlling soil erosion through different Accept
Kendell’s Coefficient of Concordance
To judge the significance of we are refer to TV for finding the value of ‘s’ at 5% level for x = 5 and N = 5. This value is 112.3 and
thus for accepting the null hypotheses that k sets of ranking are independent and calculated value of s should be less than 112.3.
However, the worked out value of ‘S’ is 60558 which is greater than the TV which fact shows that w = 242.232 is significant.
Therefore, null hypotheses is rejected and alternative is accepted. Therefore, we may conclude respondents in the study area are
aware of perception on controlling soil erosion through different activities.
*****
INFORMATION FOR AUTHORS
Pezzottaite Journals invite research to go for publication in other titles listed with us. The contributions should be original and
insightful, unpublished, indicating an understanding of the context, resources, structures, systems, processes, and performance
of organizations.
Invitations are for:
International Journal of Applied Services Marketing Perspectives.
International Journal of Entrepreneurship & Business Environment Perspectives.
International Journal of Organizational Behaviour & Management Perspectives.
International Journal of Retailing & Rural Business Perspectives.
International Journal of Applied Financial Management Perspectives.
International Journal of Information Technology & Computer Sciences Perspectives.
International Journal of Logistics & Supply Chain Management Perspectives.
International Journal of Trade & Global Business Perspectives.
All the titles are available in Print & Online Formats.
Volume 5, Number 1, January – March’ 2016
ISSN (Print): 2279-0977, (Online): 2279-0985
PEZZOTTAITE JOURNALS SJIF (2012): 3.23, SJIF (2013): 5.057, SJIF (2014): 5.871, SJIF (2015): 6.492
International Journal of Applied Services Marketing Perspectives© Pezzottaite Journals. 2110 |P a g e
ROLE OF MATHEMATICS FOR ENGINEERING STREAMS IN
HIGHER EDUCATIONAL INSTITUTES IN ETHIOPIA:
A CASE OF CIVIL ENGINEERING DEPARTMENT
Dr. Tripti Sharma52 MelakuBerhe53
ABSTRACT
Mathematics plays a vital role in the engineering education. The applications of mathematics to engineering problems are one
of the most important disciplines to the all-undergraduate and graduate educational programs. Engineering advancements
have encouraged mathematical research to different innovations. The objective of this research is to shed some light on the
role of Mathematics for engineering streams in higher educational institutes of Ethiopia. This study evaluates the share of
mathematical courses delivered during the entire course offering in civil engineering by investigating the existing harmonized
curriculum, course offering specially focused on the percentages of mathematics courses during the entire duration and their
effectiveness at under graduate level.
KEYWORDS
Applied Mathematics, Civil Engineering, Role of Mathematics, Effectiveness of Mathematics Courses etc.
INTRODUCTION
Civil engineers play an increasingly critical role in shoring up infrastructure of any country and in building the next generation of
roads, bridges and other public infrastructure [6].
Model construction and analysis has a central emphasis in engineering education of all streams. A good engineer brings together
the fundamental education to build and refine a mathematical model of a process that will help to understand and optimize its
performance. To be skilled at modeling and analysis, one must have at hand the mathematical background to understand and work
with the core scientific areas, as well as to find solutions to the final model that they build. In this context, the solution to a
mathematical problem is often in the understanding of the behavior of the process described be mathematics, rather than the
specific closed form (or numerical) result [7]. “If and when technology fails us in the field – batteries run out unexpectedly, the
satellite signal is lost or desert heat waves distort survey data collection- we must rely on our math and science skill to get our job
done safely and complete the mission.” (Paul D. Welborn technical Engineer, instructor/Program Developer U.S. Army [6].
The importance of a serious mathematics education for engineering was highlighted in many studies. While there is no consensus
on the amount and content of mathematics for different engineering disciplines, there is consensus on the need of basic
mathematics in all of them [1]. Insufficient skills in basic mathematics cause problem for those majoring in engineering at degree
level [3].
OBJECTIVES
This study focuses:
Role of Mathematics for civil engineering education.
Percentage of Mathematics course delivered during the entire course offering in civil engineering education at degree
level.
Effectiveness of Mathematics course delivered during the entire course offering in civil engineering educational degree
level.
METHOD
Literature and Harmonized curriculum has studied to discuss percentage and effectiveness of mathematical courses for civil
engineering studies at undergraduate degree level.
52Associate Professor, Addis Ababa Science and Technology University, Addis Ababa, Mathematics Division, Directorate of
Interdisciplinary, Ethiopia, [email protected] 53 Lecturer, Addis Ababa Science and Technology University, Addis Ababa, Mathematics Division, Directorate of
Interdisciplinary, Ethiopia, [email protected]
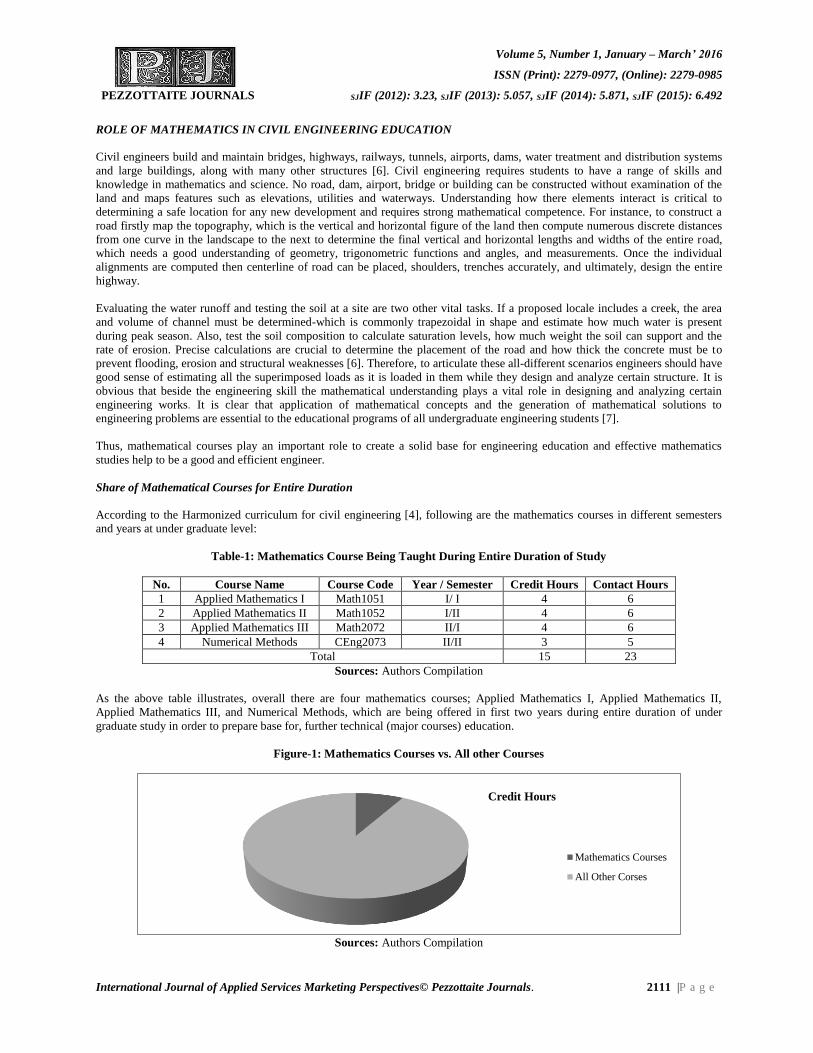
Volume 5, Number 1, January – March’ 2016
ISSN (Print): 2279-0977, (Online): 2279-0985
PEZZOTTAITE JOURNALS SJIF (2012): 3.23, SJIF (2013): 5.057, SJIF (2014): 5.871, SJIF (2015): 6.492
International Journal of Applied Services Marketing Perspectives© Pezzottaite Journals. 2111 |P a g e
ROLE OF MATHEMATICS IN CIVIL ENGINEERING EDUCATION
Civil engineers build and maintain bridges, highways, railways, tunnels, airports, dams, water treatment and distribution systems
and large buildings, along with many other structures [6]. Civil engineering requires students to have a range of skills and
knowledge in mathematics and science. No road, dam, airport, bridge or building can be constructed without examination of the
land and maps features such as elevations, utilities and waterways. Understanding how there elements interact is critical to
determining a safe location for any new development and requires strong mathematical competence. For instance, to construct a
road firstly map the topography, which is the vertical and horizontal figure of the land then compute numerous discrete distances
from one curve in the landscape to the next to determine the final vertical and horizontal lengths and widths of the entire road,
which needs a good understanding of geometry, trigonometric functions and angles, and measurements. Once the individual
alignments are computed then centerline of road can be placed, shoulders, trenches accurately, and ultimately, design the entire
highway.
Evaluating the water runoff and testing the soil at a site are two other vital tasks. If a proposed locale includes a creek, the area
and volume of channel must be determined-which is commonly trapezoidal in shape and estimate how much water is present
during peak season. Also, test the soil composition to calculate saturation levels, how much weight the soil can support and the
rate of erosion. Precise calculations are crucial to determine the placement of the road and how thick the concrete must be to
prevent flooding, erosion and structural weaknesses [6]. Therefore, to articulate these all-different scenarios engineers should have
good sense of estimating all the superimposed loads as it is loaded in them while they design and analyze certain structure. It is
obvious that beside the engineering skill the mathematical understanding plays a vital role in designing and analyzing certain
engineering works. It is clear that application of mathematical concepts and the generation of mathematical solutions to
engineering problems are essential to the educational programs of all undergraduate engineering students [7].
Thus, mathematical courses play an important role to create a solid base for engineering education and effective mathematics
studies help to be a good and efficient engineer.
Share of Mathematical Courses for Entire Duration
According to the Harmonized curriculum for civil engineering [4], following are the mathematics courses in different semesters
and years at under graduate level:
Table-1: Mathematics Course Being Taught During Entire Duration of Study
No. Course Name Course Code Year / Semester Credit Hours Contact Hours
1 Applied Mathematics I Math1051 I/ I 4 6
2 Applied Mathematics II Math1052 I/II 4 6
3 Applied Mathematics III Math2072 II/I 4 6
4 Numerical Methods CEng2073 II/II 3 5
Total 15 23
Sources: Authors Compilation
As the above table illustrates, overall there are four mathematics courses; Applied Mathematics I, Applied Mathematics II,
Applied Mathematics III, and Numerical Methods, which are being offered in first two years during entire duration of under
graduate study in order to prepare base for, further technical (major courses) education.
Figure-1: Mathematics Courses vs. All other Courses
Sources: Authors Compilation
Credit Hours
Mathematics Courses
All Other Corses
Volume 5, Number 1, January – March’ 2016
ISSN (Print): 2279-0977, (Online): 2279-0985
PEZZOTTAITE JOURNALS SJIF (2012): 3.23, SJIF (2013): 5.057, SJIF (2014): 5.871, SJIF (2015): 6.492
International Journal of Applied Services Marketing Perspectives© Pezzottaite Journals. 2112 |P a g e
Total credit hours for mathematics courses are 15 and a student takes 168/170 credit hours for entire study excluding Internship,
which is approximately 8.9 % of total credit hours. Further, if we compare in terms of contact hours, a student takes 23 contact
hours out of 287/289, which is more or less 8 % of total contact hours. Thus, share of mathematics courses is quit big and
considerable.
In addition, let us have a look to the share of other non-technical courses:
Table-2: Other Non-Technical Courses Offered During Entire Duration Time
No. Course Name Course Code Year / Semester Credit
Hours
Contact
Hours
1 Communicative Skill EnLa1011 I/ I 3 5
2 Civics and Ethical Education CvEt1021 I/I 3 5
3 Reasoning Skill Phil1031 I/II 3 5
4 Basic Writing Skill EnLa1011 I/II 3 5
5 Computer Programming Comp2064 II/I 3 4
6 Probability and Statistics Stat2071 II/I 3 4
7 Engineering Economics CEng5201 V/I 3 4
8 Entrepreneurship for Engineers CEng5211 V/II 2 4
Total 23 36
Sources: Authors Compilation
As seen in the table above there are total eight non-technical courses except mathematics. The total credit hours and contact hours
engaged by these courses are 23 and 37 respectively.
Figure-2: Mathematics and Other Non-Technical Courses in terms of Credit Hours
Sources: Authors Compilation
The pie chart clearly indicates that mathematical courses heavily outweigh in the sense of individual course credit hours than any
other non-technical course offered during entire duration of civil engineering education.
Therefore, mathematics courses play an important role for the civil engineering education in comparison to any other non-
technical individual course for the entire duration of study.
Civil Engineering Courses and Effectiveness of Mathematics
Although all engineering courses need support of mathematics, the following are the courses, which are not supported as, desired
to be by Mathematics courses.
Credit Hours
Mathematics Courses
English Language Courses
Civics and Ethical Education
Philosophy
Computer Courses
Management Courses
Engineering Economics
Probability and Statistics
Volume 5, Number 1, January – March’ 2016
ISSN (Print): 2279-0977, (Online): 2279-0985
PEZZOTTAITE JOURNALS SJIF (2012): 3.23, SJIF (2013): 5.057, SJIF (2014): 5.871, SJIF (2015): 6.492
International Journal of Applied Services Marketing Perspectives© Pezzottaite Journals. 2113 |P a g e
Table-3: Course Break Down for Mathematics and Partially supported Technical Courses
S. No. Course Name Offered in
Semester / year
Mathematics
Course Needed
Offered in
Semester / Year
1 Engineering Mechanics I (Statics)
CEng1041
I/I Applied Math I
Applied Math II
I/I
II/I
2 Engineering Mechanics II (Dynamics) II/I Applied Math III I/II
3 Surveying I, II/I Numerical Methods II/II
4 Surveying II I/II Numerical Methods II/II
5 Soil Mechanics I II/II Numerical Methods II/II
6 Hydraulics II II/II Numerical Methods II/II
Sources: Authors Compilation
Courses Contents of Applied Mathematics I, Applied Mathematics II and Mechanics I
Applied Mathematics I: Vectors and vector spaces: Plane vector, Addition and scalar multiplication of vectors, Space vectors,
Scalar product and vector product, Lines in plane, Lines in space, planes in space, Applications. Matrices and determinant:
Matrix Addition, scalar multiplication, product of matrices, Transpose, Determinant, Inverse, and Applications. Limit and
Continuity: Definition of limit and examples, Basic limit theorems, One-sided limits, Infinite limits and limit at infinity,
L’Hopital’s rule, Continuity of a function, Derivative and application of derivatives: Inverse functions and their derivatives
and application: Inverse functions, Inverse trigonometric functions, Hyperbolic functions and their inverses, Derivatives of
inverse functions, Derivatives of trigonometric functions and their inverses, Derivatives of hyperbolic functions and their inverses,
Implicit differentiation, higher order derivatives, Application of derivatives, Techniques of integration and their application:
Integration by parts, Integration by substitution, Trigonometric integral, Trigonometric substitution, Integration by partial
fractions, Improper integrals, Application of Integrals [4].
Applied Mathematics II: Sequence and series: Definition and types of sequence, Convergence properties of sequences,
Subsequence and limit points, Definition of infinite series, Convergence and divergence, properties of convergent series,
Nonnegative term series, Tests of convergence (integral, comparison, ratio and root tests), Alternating series and alternating series
test, Absolute and conditional convergence, Generalized convergence tests, Power series: Definition of power series at any 𝑥0
and 𝑥0 = 0, Convergence and divergence, radius and interval of convergence, Algebraic operations on convergent power series,
Differentiation and integration of power series, Taylor series; Taylor polynomial and application, Differential calculus of
function of several variables: Notations, examples, level curves and graphs, Limit and continuity, Partial derivatives; tangent
lines, higher order partial derivatives, Directional derivatives and gradients, Total differential and tangent planes, Applications:
tangent plane approximation of values of a function, The chain rule, implicit differentiation, Relative extrema of functions of two
variables, Largest and smallest values of function on a given set, Extreme values under constraint conditions: Lagrange’s
multiplier, Multiple integrals: Double integrals and their evaluation by iterated integrals, Double integrals in polar coordinates,
Application: Area, centre of mass of plane region, surface, Triple integrals in cylindrical and spherical coordinates, Application:
Volume, centre of mass of solid region [4].
Mechanics I (CEng1041): Scalars and Vectors: Introduction, Scalars and Vectors, Operation with Vectors (Vector Addition or
Composition, Vector Multiplication: Dot & Cross), Force Systems: Introduction, Two Dimensional Force Systems (Rectangular
Resolution of Forces, Moment and Couple, Resultants of general coplanar force systems), Three Dimensional Force Systems
(Rectangular Components, Moment and Couple, Resultants), Equilibrium: Introduction, Equilibrium in Two Dimensions
(System Isolation, Equilibrium Conditions), Equilibrium in Three Dimensions (System Isolation, Equilibrium Conditions),
Analysis of simple Structures: Introduction, Plane Trusses (Method of Joints, Method of Sections, Frames and Simple
Machines), Internal Actions in beams: Introduction, Diagrammatic conventions and classification of beams, Diagrammatic
representations of internal actions in beams, Types of loads and reactions, Shear force and bending moment in beams, Relation
between the static functions and their applications, Relations among load, shear, and bending moments, Centroids: Introduction,
Center of gravity, Centroids of lines, Areas, and Volumes, Centroids of composite bodies, Determination of centroid by
integrations, Distributed loads in beams, Area Moments of Inertia: Introduction to area moments of inertia, Moment of inertia of
plane areas and curves, Moments of inertia of Composite areas, Products of Inertia and Rotation of Axes, Friction: Introduction,
Types of Friction, Characteristics of dry friction, Application of Friction in Machines [4].
Observation 1
According to the harmonized curriculum under the course breakdown students take Applied Mathematics I and Engineering
Mechanics I (Statics) in parallel and Applied Mathematics II is in next semester.
Volume 5, Number 1, January – March’ 2016
ISSN (Print): 2279-0977, (Online): 2279-0985
PEZZOTTAITE JOURNALS SJIF (2012): 3.23, SJIF (2013): 5.057, SJIF (2014): 5.871, SJIF (2015): 6.492
International Journal of Applied Services Marketing Perspectives© Pezzottaite Journals. 2114 |P a g e
Under Engineering Mechanics I, chapters 1 Scalars and Vectors and chapter 2 Force Systems are about Scalars and vectors and
Force System respectively. Also in Applied Mathematics I, chapter 1 Vectors and vector spaces which is supposed to support by
the beginning of Engineering Mechanics I that is Chapter 1 and chapter 2. During the course delivery, chapters 1 Scalars,
Vectors, and chapter 2 Force Systems of Engineering Mechanics I consume the same or less time as chapter 1 Vectors and
vector spaces of Applied Mathematics I. As a result, the purpose of Mathematics course is not achieved effectively.
Again, chapter 6 Centroids and chapter 7 Area Moments of Inertia of the same course Engineering Mechanics I have the
applications of multiple Integrals (i.e. double and triple integral) but the concepts of multiple integrals are addressed in Applied
Mathematics II which is being taught in second semester that is after finishing the whole course.
Courses Contents of Applied mathematics III and Engineering Mechanics II (Dynamics)
Applied Mathematics III: Ordinary Differential Equations: Ordinary Differential Equations of the first order, Basic Concepts,
modelling, Separable Equations, Homogeneous Differential equation, Exact Differential Equations, Linear first Order Differential
Equations Ordinary Linear Differential equations of the second order, Homogeneous Linear Differential equations of the second
order, Method for solving non homogeneous linear differential equations, Laplace Transforms: Laplace Transform, Inverse
transform, Transform Linearity, s-Shifting, Transforms of Derivatives and Integrals, ODEs, Differentiation and Integration of
Transforms, Systems of ODEs, Fourier Series: Fourier series and integrals, The complex Fourier series and integrals, Forced
Oscillations, Fourier and Laplace transformations, Fourier cosine and sine transformation, Differentiation and integration of
Laplace transformations, Vector Calculus: Gradient of a scalar field, Divergence of a vector field, Curl of a vector field, Line
integrals, Surface integrals, Gauss divergence theorem and its application, Complex Analysis: Complex Analytic Functions,
Complex Integrals, Integration by method of residue [4].
Engineering Mechanics II (Dynamics): Introduction to Dynamics: Basic concepts, Equations of motion, Gravitation,
Kinematics of Particles: Introduction, Rectangular motion, Plane curvilinear motion, Coordinate systems, Space Curvilinear
Motion, Relative motion, Constrained motion, Kinetics of Particles: Introduction, Newton’s second law, Work Energy equation,
Impulse and Momentum, Conservation of Energy and Momentum, Special application s/ Impact /, Kinematics of rigid bodies:
Introduction, Fixed axis rotation, Absolute motion, Relative motion, Kinetics of rigid bodies: Introduction, General equations of
motion, Work Energy method, Impulse and Momentum [4].
Observation 2
Here chapter 2, Kinematics of particles of Engineering Mechanics II (Dynamics) necessitated strong background of Advanced
Engineering Mathematics (Applied Mathematics III) in particular Vector calculus but again the course Advanced Engineering
Mathematics (Applied Mathematics III) is given in the second year first semester, which is after completion of Engineering
Mechanics II (Dynamics).
Besides all these, the course Numerical Methods is being given in second semester of second year while the courses like
Surveying I, Surveying II, Soil Mechanics I and Hydraulics II are in already finished semesters or in parallel besides requisite
basics of Numerical Methods.
CONCLUSION
With these evidences, it can be conclude that, civil engineers play an important role in building up infrastructure of any country.
Mathematics courses have crucial role in civil engineering education and this study has brought some contradictions in light
against position of mathematics courses in course breakdown of civil engineering education. Enhanced cooperation between the
mathematics faculty and engineering faculty can lead to a better experience for students.
RECOMMENDATIONS
On the basis of above study:
There should be an understanding between mathematics and engineering department about what to be and where to be included in
the curriculum.
A student must be with knowledge in hand of particular mathematics course before going to further course where it is applicable,
to be benefited.
If the courses are in parallel, chapter sequence should be compatible for both courses in order to maintain smooth and effective
course delivery.
Volume 5, Number 1, January – March’ 2016
ISSN (Print): 2279-0977, (Online): 2279-0985
PEZZOTTAITE JOURNALS SJIF (2012): 3.23, SJIF (2013): 5.057, SJIF (2014): 5.871, SJIF (2015): 6.492
International Journal of Applied Services Marketing Perspectives© Pezzottaite Journals. 2115 |P a g e
ACKNOWLEDGEMENT
We are thankful to Dr. Masey, Director of School of Civil Engineering and COTM, AASTU, and Head of Civil Engineering
Department, AASTU for their kind support and providing us necessary information and data.
REFERENCES
1. Broad bridge, P. A., & Henderson, S. (2008). Mathematics Education for 21 Century Engineering Student (Final
Report). Australian Mathematical Sciences Institute.
2. Goold, Eileen. (2012). The Role of Mathematics in Engineering Practice and in the Formation of Engineers
(Doctoral Thesis). National University of Ireland Maynooth.
3. Figen, Uysal. (2008). the Mathematics Education for the Engineering Students of 21st Century. The Online Journal of
New Horizons in Education. Retrieved from www.tojned.net/volume02-issue02.html.
Retrieved from
https://www.google.co.in/url?sa=t&rct=j&q=&esrc=s&source=web&cd=2&cad=rja&uact=8&ved=0ahUKEwiG76aSxJ
7JAhWJ1hoKHeIGBoAQFggiMAE&url=http%3A%2F%2Fwww.tojned.net%2Fvolume02-
issue02.html&usg=AFQjCNGWxhpr96PPndbYQgZFY_wKieYw8w&bvm=bv.108194040,d.ZWU
4. (2013, July). National Harmonized Curriculum: Study Program for the Degree of Bachelor of Science in Civil
Engineering.
5. Scanlan, J. O. (2006). The role of mathematics in engineering education: an engineer's view. International Journal of
Mathematical Education in Science and Technology, 16, 445-457.
6. (2009, January). Mathematics at Work. Achieve, Inc. Retrieved from www.Achieve.org
7. (2000, May 04-07). CRAFTY Curriculum Foundations Project. Clemson University.
8. Retrieved from http://www.readbag.com/achieve-files-mathatwork-civilengineering
9. Retrieved from http://alex.state.al.us/ccrs/sites/alex.state.al.us.ccrs/files/MathatWork-CivilEngineering-2013.pdf
10. Retrieved from http://ceas.uc.edu/caecm/undergraduate/civil_engineering.html
*****
CHECK PLAGIARISM SERVICE
Pezzottaite Journals charges nominal fees to get their manuscripts scanned for plagiarism.
Indian Users
One Manuscript / article = Rs. 350.00
Two Manuscripts / articles = Rs. 350.00 x 2 = Rs. 700.00 ………As so on...
Formulae = (Numbers of Manuscripts x Rs. 350.00) = Amount to be paid as ‘Online Bank Transfer’ before
availing the services.
International Users
One Manuscript = US$15.00
Two Manuscripts = US$15.00 x 2 = US$ 30 ………As so on...
Formulae = (Numbers of Manuscripts x US$15.00) = Amount to be paid as ‘Online Bank Transfer’ before
availing the services.
Note: Total amount if computed in US$ must be converted into Indian Rupees as per Currency Exchange Rates on the day of
placing the order; Computed amount (in Rupees) is to be transferred in Pezzottaite Journals Bank Account (s); In case, where
the transacted currency is not US$, then, purchaser must consider the exchange rate of domestic country’s currency against
'US$ / Rupees' and transfer the same.