Embed Size (px)
Citation preview
PAYING FOR PERFORMANCE:
A Study of Salary and Performance Statistics in the MLB
(During 2010)

Topic Questions
How does Team Salary correlate with performance in Major League Baseball?
Which Performance Statistics have the strongest correlation to Team Salary? (What are you
paying for?)
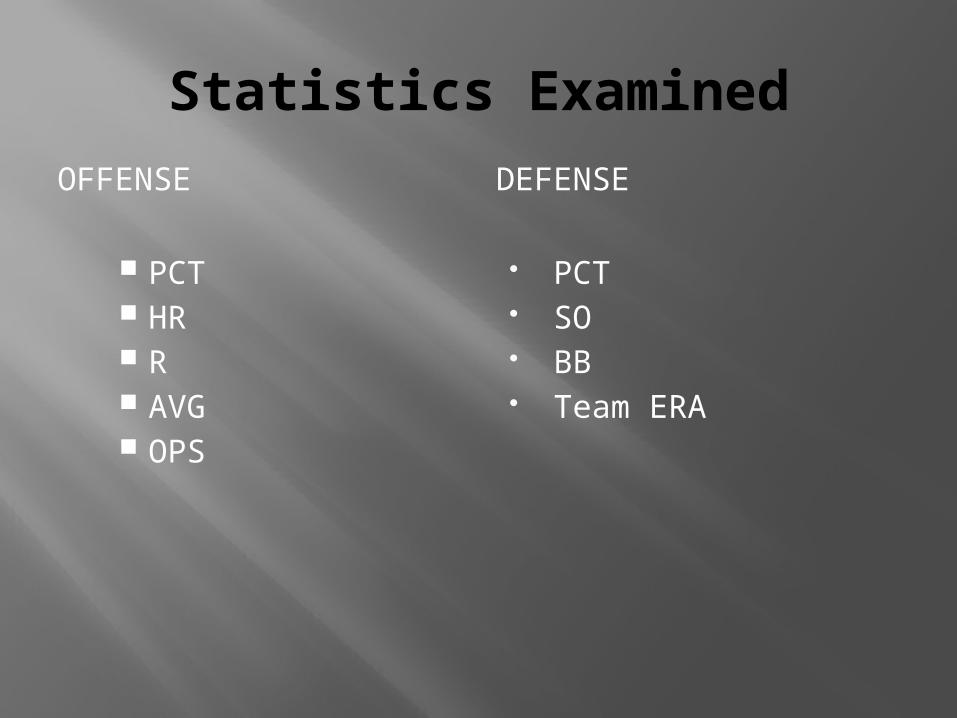
Statistics Examined
OFFENSE DEFENSE
PCT HR R AVG OPS
PCT SO BB Team ERA
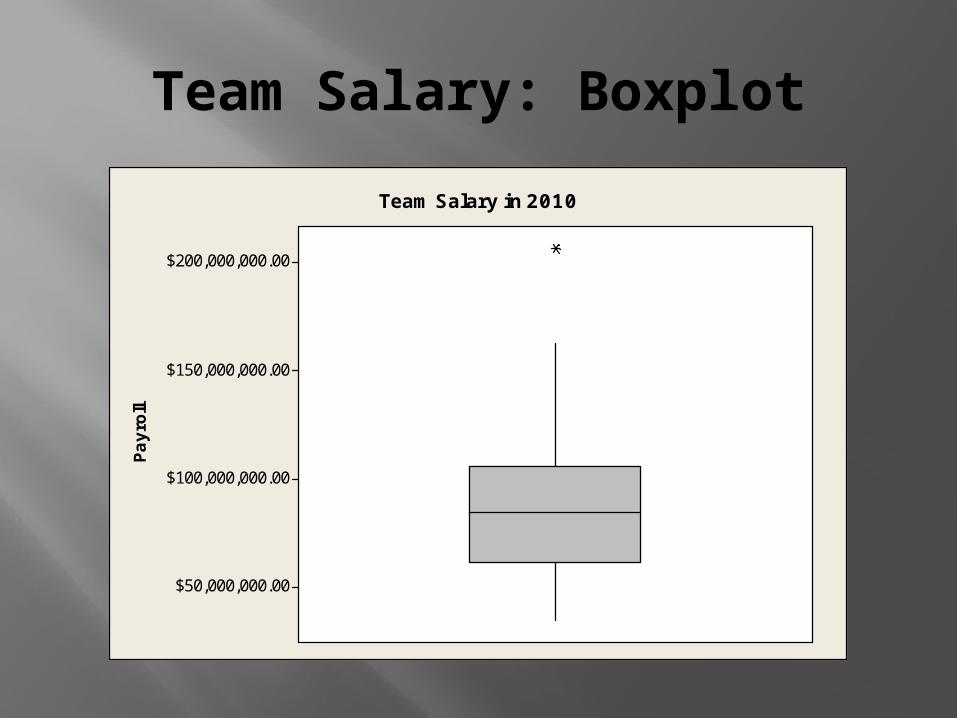
Team Salary: Boxplot
$200,000,000.00
$150,000,000.00
$100,000,000.00
$50,000,000.00
Payro
ll
Team Salary in 2010
Team Salary: Descriptive Stats
N=30 Mean= 91,020,056 Median=
84,325,334 Standard
Deviation= 38,258,046
Minimum= 34,943,000 Pittsburgh Pirates
Maximum= 206,333,389 New York Yankees
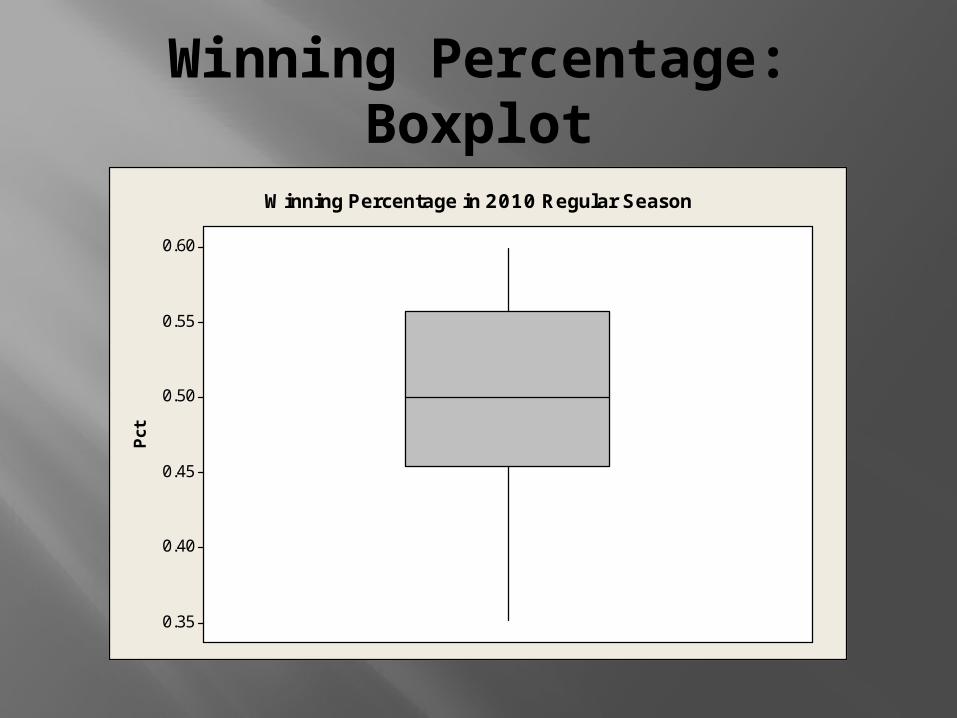
Winning Percentage: Boxplot
0.60
0.55
0.50
0.45
0.40
0.35
Pct
Winning Percentage in 2010 Regular Season
Winning Percentage: Descriptive Stats
N=30 Mean=.501 Median=.500 Standard
Deviation=.0679Minimum=.3520 Pittsburgh
Pirates Maximum=.5990
Philadelphia Phillies
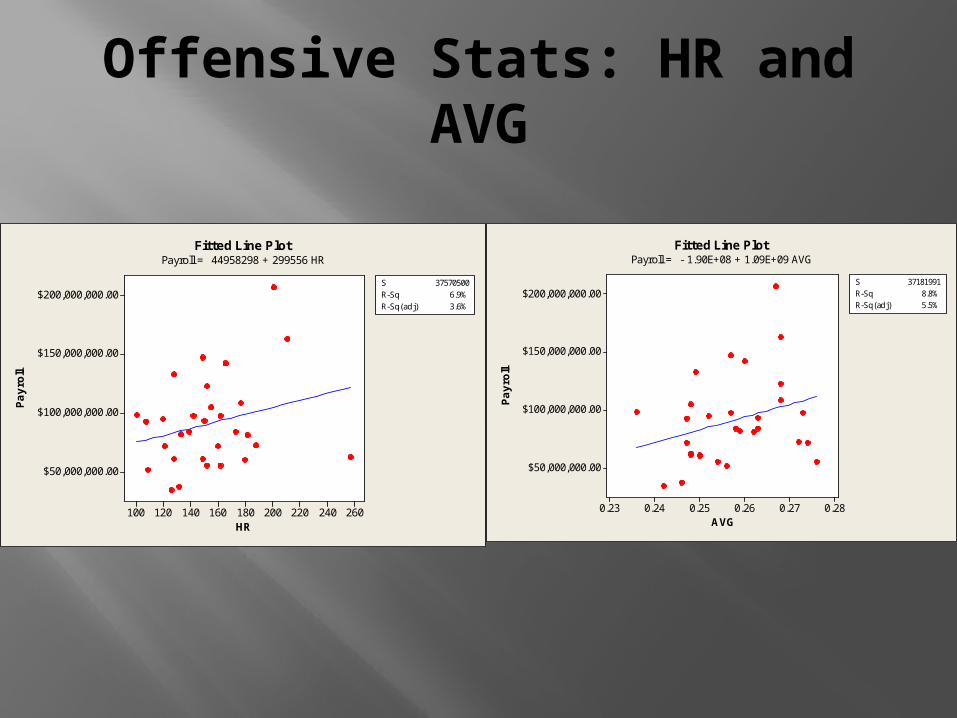
Offensive Stats: HR and AVG
260240220200180160140120100
$200,000,000.00
$150,000,000.00
$100,000,000.00
$50,000,000.00
HR
Payro
ll
S 37570500R-Sq 6.9%R-Sq(adj) 3.6%
Fitted Line PlotPayroll = 44958298 + 299556 HR
0.280.270.260.250.240.23
$200,000,000.00
$150,000,000.00
$100,000,000.00
$50,000,000.00
AVG
Payro
ll
S 37181991R-Sq 8.8%R-Sq(adj) 5.5%
Fitted Line PlotPayroll = - 1.90E+08 + 1.09E+09 AVG
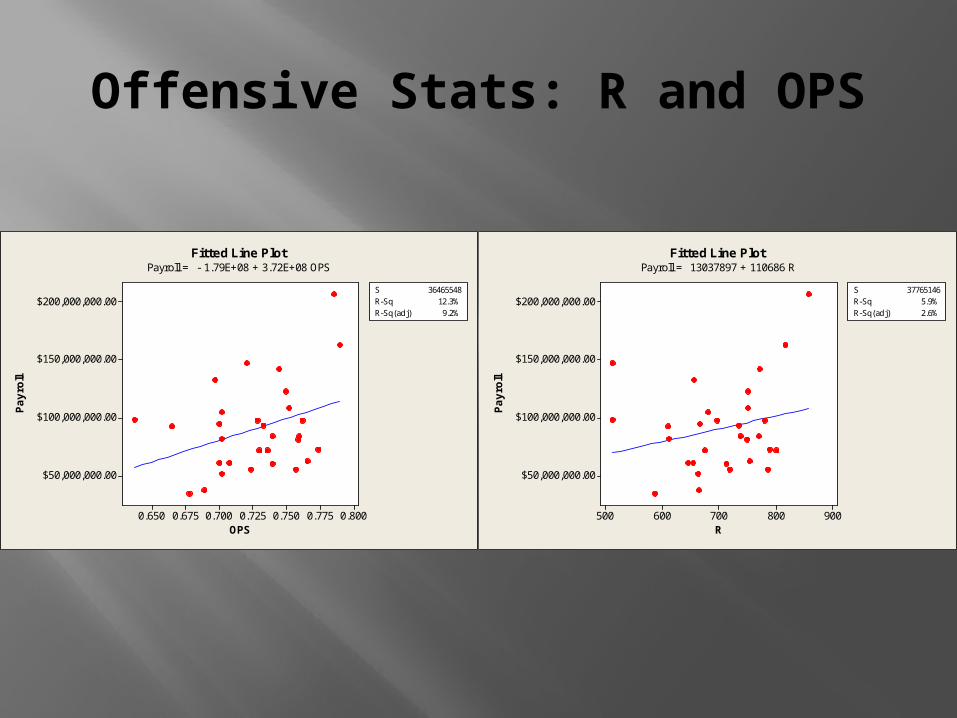
Offensive Stats: R and OPS
0.8000.7750.7500.7250.7000.6750.650
$200,000,000.00
$150,000,000.00
$100,000,000.00
$50,000,000.00
OPS
Payro
ll
S 36465548R-Sq 12.3%R-Sq(adj) 9.2%
Fitted Line PlotPayroll = - 1.79E+08 + 3.72E+08 OPS
900800700600500
$200,000,000.00
$150,000,000.00
$100,000,000.00
$50,000,000.00
R
Payro
ll
S 37765146R-Sq 5.9%R-Sq(adj) 2.6%
Fitted Line PlotPayroll = 13037897 + 110686 R
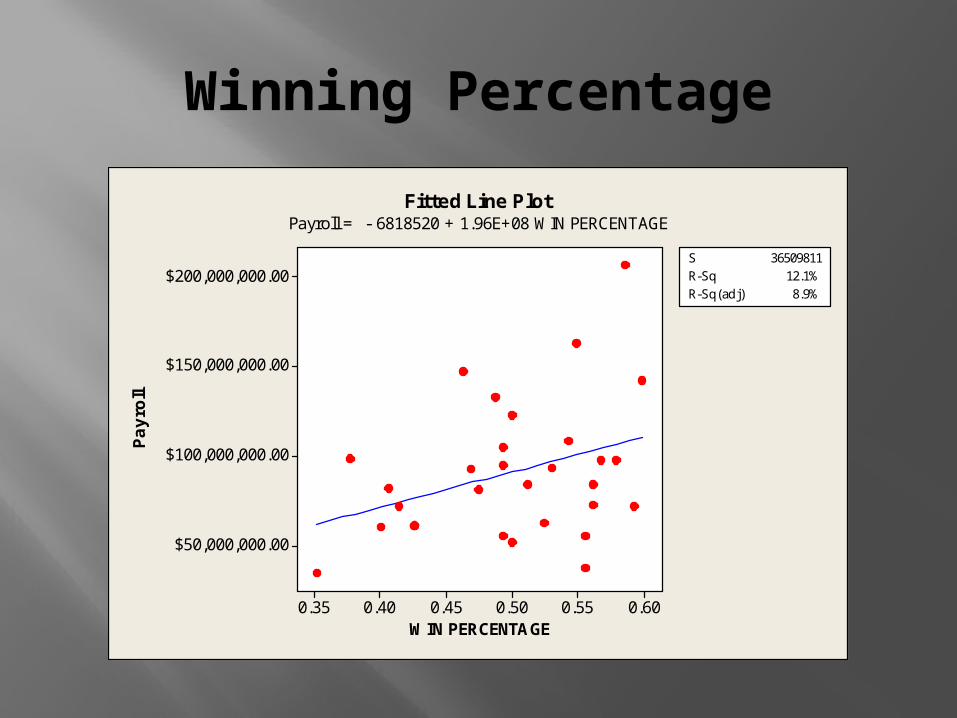
Winning Percentage
0.600.550.500.450.400.35
$200,000,000.00
$150,000,000.00
$100,000,000.00
$50,000,000.00
WIN PERCENTAGE
Payro
ll
S 36509811R-Sq 12.1%R-Sq(adj) 8.9%
Fitted Line PlotPayroll = - 6818520 + 1.96E+08 WIN PERCENTAGE
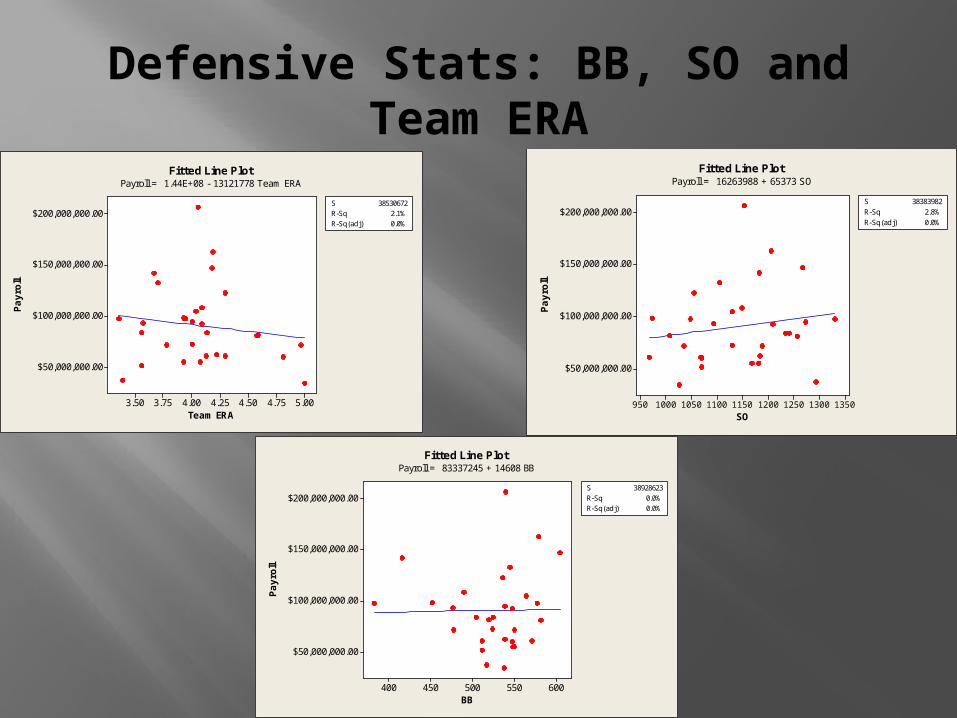
Defensive Stats: BB, SO and Team ERA
5.004.754.504.254.003.753.50
$200,000,000.00
$150,000,000.00
$100,000,000.00
$50,000,000.00
Team ERA
Payro
ll
S 38530672R-Sq 2.1%R-Sq(adj) 0.0%
Fitted Line PlotPayroll = 1.44E+08 - 13121778 Team ERA
13501300125012001150110010501000950
$200,000,000.00
$150,000,000.00
$100,000,000.00
$50,000,000.00
SO
Payro
ll
S 38383982R-Sq 2.8%R-Sq(adj) 0.0%
Fitted Line PlotPayroll = 16263988 + 65373 SO
600550500450400
$200,000,000.00
$150,000,000.00
$100,000,000.00
$50,000,000.00
BB
Payro
ll
S 38928623R-Sq 0.0%R-Sq(adj) 0.0%
Fitted Line PlotPayroll = 83337245 + 14608 BB
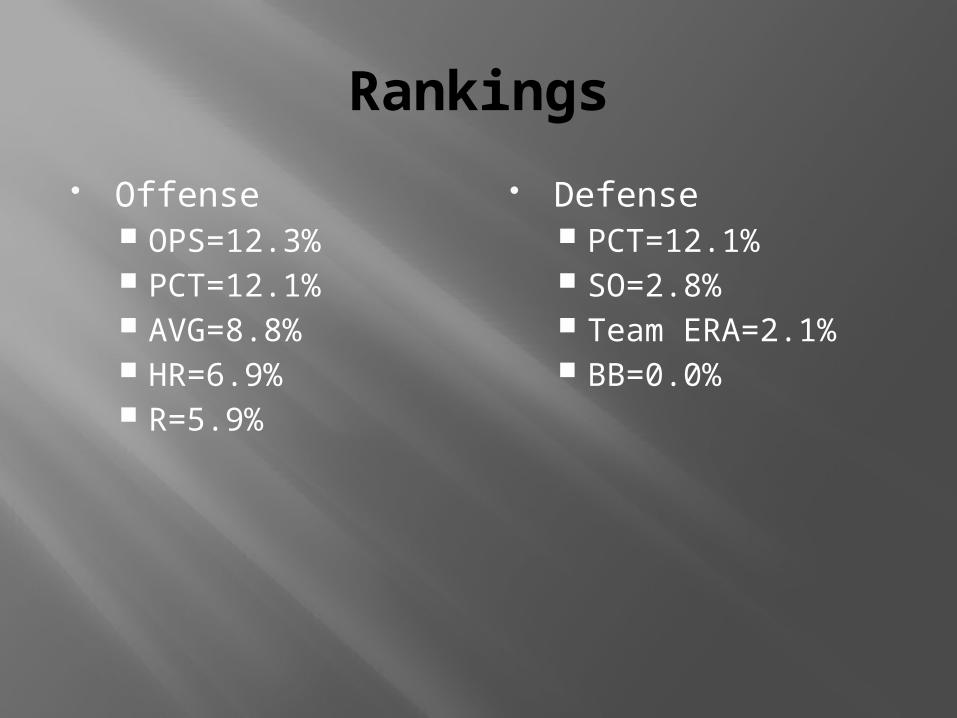
Rankings
Offense OPS=12.3% PCT=12.1% AVG=8.8% HR=6.9% R=5.9%
Defense PCT=12.1% SO=2.8% Team ERA=2.1% BB=0.0%
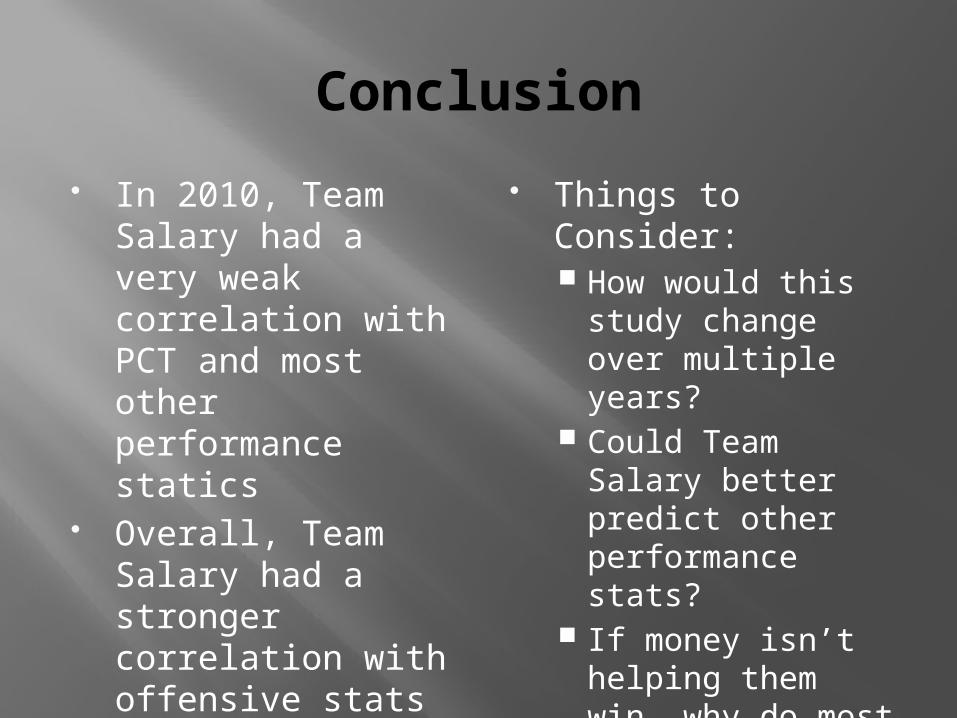
Conclusion
In 2010, Team Salary had a very weak correlation with PCT and most other performance statics
Overall, Team Salary had a stronger correlation with offensive stats than defensive stats
Things to Consider: How would this
study change over multiple years?
Could Team Salary better predict other performance stats?
If money isn’t helping them win, why do most baseball fans hate the Yankees?

Sources
mlb.com cbssports.com espn.go.com