Embed Size (px)
Citation preview

A STUDY OF BRAND CHOICE DECISION OF TOP 3 GLOBAL BRAND QUICK
SERVICED RESTAURANT (KFC, MCDONALD’S, BURGER KING) IN
BANGKOK

A STUDY OF BRAND CHOICE DECISION OF TOP 3 GLOBAL BRAND QUICK
SERVICED RESTAURANT (KFC, MCDONALD’S, BURGER KING) IN
BANGKOK
Xin Guan
This Independent Study Manuscript Presented to
The Graduate School of Bangkok University
in Partial Fulfillment
of the Requirements for the Degree
Master of Business Administration
2015

©2015
Xin Guan
All Right Reserved


Guan, X. M.B.A , September 2015, Graduate School, Bangkok University
The Study of Brand Choice Decision of Top 3 Global Brand Quick Serviced
Restaurant (KFC, McDonald’s, Burger King) in Bangkok (61 pp.)
Advisor: Sumas Wongsunopparat, Ph.D
ABSTRACT
Fast food or quick meal is one of the world’s fastest growing food types. The
development of fast food is one of the effects of urban development; the quick service
restaurant (SQR) industry has been developing rapidly throughout the world. As the
economic develop and major changes in lifestyle, education, income of the Thailand
consumers in the two last decades have encourage the young consumers to eat out.
This independent study aims to exam the consumer’s preference and perception
toward quick service restaurant and aims to explore the key factors influencing for
KFC, McDonald’s and Burger King customer choice decision in Bangkok.
The survey research used questionnaire survey method to collect the data. The
target populations are the consumer of KFC, McDonald’s and Burger King in
Bangkok with the age of 14-60 years old in both male and female gender of all
nationalities, and the sample size for this study is 400.
This research discusses about the consumer choice behavior, consumption
demand, and social demographic variables. The results of the study are that the
Gender and Location doesn’t have significant relationship with consumer’s brand
choice. In this study, the delivery service, easy access to the restaurant and good
product taste are the top 3 primary factors influencing the choice of quick service
restaurant. According to the results of the study, provide for using of academic
research, and hope that can help operator when making decision in Thailand QSR
market, and provide reference suggestions for marketing strategy.
Key words: Quick Service Restaurant, Consumer choice decision, Marketing Mix
v
ACKNOWLEDGEMENT
I would like to express my sincere gratitude to my advisor, Dr.Sumas
Wongsunopparat for the continuous support of this research, for his patience, review,
modification and suggestion. This Independent study form selected topic, designed
questionnaire, choice SPPS model to finished, every step from my adviser to help me
in all the time. Besides my advisor, I would like to thank all professors of MBA
International Program for knowledge and encouragement.
I sincerely thank to all participants who delicate their valuable time to answering
and completing the questionnaire. This paper would not have been possible unless
many support from KFC, McDonald’s and Burger king restaurants and many
individuals who has provided assistance in many ways.
I thank all my friends and my classmates to help me to solve some problem, and
accompany in my side in these years, thank all particularly MBA international
program colleagues who help me to pass the troubled situations and for all the fun.I
would like to dedicate this document to my family, thank for my parents’ support
TABLE OF CONTENTS
Page
ABSTRACT……………………….………………………..…………………….…..iv
ACKNOLEGDMENT………………………………..………………….……………v
LIST OF TABLES……...………………………………………………….………..viii
LIST OF FIGURES……………………………………………..…………………….ix
CHAPTER 1: INTRODUCTION……………………...………………………….….1
1.1 Relational and problem statement …………………………………...………..1
1.2 Research Objectives……………………………………………………..…….3
1.3 Scope of study…………………………………………………...…………….3
1.4 Research question……………………………………………………………...3
1.5 Significant of research ………………………………………………………...4
CHARTER 2: LITERATURE REVIEW………………………………………………5
2.1 Quick Service Restaurant Industry ……………………………………………5
2.2 The Related Theories…………………………………………………………..9
2.3 Marketing Mix and Consumer Purchasing Decision Behavior………………11
2.4 Previous Research ………………………………………………………...…13
2.5 Hypotheses……………………………………………………………..…….16
2.6 Theoretical Framework………………………………………………………18
CHAPTER 3: METHODOLOGY...............................................................................19
3.1 Research Design……………………………………………………………...19
3.2 Population and Sample Selection…………………………………………….19
3.3 Research Instrument………………………………………………………….20
3.4 Data Collection Procedure……………………………………………………21
vii
TABLE OF CONTENTS (Continued)
Page
CHAPTER 4: DATA RESULTS………………………..…………………………….22
4.1 Frequency Distribution ……………………………….…………………..…22
4.2 Data Result of Influencing Factors…………………………………………..29
4.3 Findings of Hypotheses Testing …………………………………………….31
4.4 Other Findings………………………………………………………………..43
CHAPTER 5: DISCUSSION………………………………………………………...45
5.1 Conclusion ………………………………………………………………....45
5.2 Discussion………………………………………………………………..….49
5.3 Limitation and Suggestion for Future study……………………………...…50
BIBLOGRAPHY………………………………………………………………….....52
APPENDIX………………………………………………………………………..... 56
Appendix A: Survey Questions………………………………….…………..….56
BIODATA ………………………………………………………………………..….60
LICENSE AGREEMENT …………………………………………………………..61
viii
LIST OF TABLES
Page
Table 1 : Major Players and their Products……………………………………………6
Table 2 : The results of Demographic Information …...……………………………..22
Table 3 : Brand Preference…………………………………...………………………24
Table 4 : Demographic Information for each Brand…………………………………24
Table 5 : Demographic Information for each Brand (age) ……………….………….25
Table 6 : Demographic Information for each Brand (marital status) ………………..26
Table 7 : Demographic Information for each Brand (education level) ……………...26
Table 8: Demographic Information for each Brand (occupation)……………………27
Table 9: Demographic Information for each Brand (income)………………………..28
Table 10: Demographic Information for each Brand (liked-level)…………………...28
Table 11: Demographic Information for each Brand (eating frequency)…………….29
Table 12: Descriptive Statistics for Influencing Factors……………………………..30
Table 13: Likelihood Ratio Tests for H1, H2, H3…………………………………....31
Table 14: Likelihood Ratio Tests for H4 …………………………………………….32
Table 15: Gender X Food Safety Cross tabulation…………………………………...32
Table 16: Gender X Saving the Meal Time Cross tabulation …………………..……33
Table 17: Gender X Easy access to the restaurant Cross tabulation.………...………33
Table 18: Age X Brand image Cross tabulation……………………………………...34
Table 19: Age X Product variety Cross tabulation…………………………………...34
Table 20: Age X Good product taste Cross tabulation……………………………….35
Table 21: Age X Convenient operating hours Cross tabulation……………………...35
Table 22: Age X Easy access to the restaurant Cross tabulation……………………..36
Table 23: Age X Gift Cross tabulation……………………………………………….36
Table 24: Age X No alternative choice Cross tabulation…………………………….37
Table 25: Age X To accompany with others Cross tabulation……………………….37
ix
LIST OF TABLES (Continued)
Page
Table 26: Income X Brand image Cross tabulation………………………………….38
Table 27: Income X Easy access to the restaurant Cross tabulation…………………39
Table 28: Income X Delivery Service Cross tabulation……………………………..40
Table 29: Income X Gift Cross tabulation…………………………………………...41
Table 30: Multinomial Logit Model Burger King VS McDonalds’ & KFC…………42
Table 31: Life-style variables for each brand………………………………………...43
x
LIST OF FIGURES
Page
Figure 1 : Theory of planned behavior………………………………………………...9
Figure 2 : Maslow’s Extended Hierarchies of Need………………………………….10
Figure 3 : Kotler’s Buyer Decision Process………….……………………...……….11
Figure 4: Theoretical Framework…………………………………………………….18
CHAPTER 1
INTRODUCTION
1.1 Relational and Problem Statement
Fast food or quick meal is one of the world’s fastest growing food types. The
development of fast food is one of the effects of urban development. The entry of
women in working place and the growth of IT sector, which increase the sales of
ready cooked meals. In the era of globalization, American style fast food became
popular through the world within the spread of western culture.
The Quick Serviced Restaurant (QSR) industry has been developing rapidly
throughout the world. According to a report from Datamonitor (2010), the global
fast-food market is predicted to have a value of $239.7 billion and a projected volume
of 248.7 billion transactions by 2014.
Fast foods include not only pizza, burger, chicken but also a wide range of easy
prepared food items. However in some countries there are some especial styles of fast
food items such as Kebab in Middle East, America style fast food are still the
common fast food. The most famous Fast food restaurants all over the world are
McDonalds, Subway, Dominos, Burger king etc.
There is a variety of factors such as socioeconomic, technological, and
ecological and market perspectives have contributed towards its growth. Now fast
food accounts for half of the revenue of restaurant in developed countries, however
the most growth is occurring in developing countries. Eating fast food is not a new
phenomenon by recent years, it has grown after 1950s, which gradually change people
way of eat.
Quick Serviced Restaurant has become an essential part of Thailand lifestyles.
As Quick Serviced Restaurant which is defined as a “branded convenience food”
(Mohammad, Barker & Kandampully 2005, p. 97), since 1980s, America style quick
service restaurant entry into Thai market, more and more are associate with it.

2
Teenagers and the young adults is the main target customer of fast food.
Bangkok as the capital of Thailand has a population of 8,280,925 according to
the 2010 census, or 12.6 percent of the national population. As the economic center of
Thailand, Bangkok attracted many other nations to registered, for instance people
from Japan, China, as well as America and Europe. Bangkok is also one of world top
tourist destination cities, with 15.98 million projected visitors in 2013. In addition,
over 14 million people (22.2%) live within the surrounding Bangkok Metropolitan
Region, a large number of Bangkok's daytime population commutes from those
people who work or study in Bangkok. The large number of foreigners and population
in daytime demand a huge number of convenience food service, which promote the
restaurant service, especially the quick restaurant service in Bangkok.
According to a survey of the Bangkok fast food sector, conducted by ACNielsen,
KFC leads the market with a 43% share, dominating 70% of the burger and chicken
segment. The top 3 restaurant from chicken segment are KFC, McDonalds and
Chester’s Gill, while from the burger segment are McDonalds, KFC and Burger King.
Other quick service restaurant chain popular in Thailand are: Subway, Pizza Hut, the
Pizza Company and Dominos. Thus this study will investigate the consumer’s
perception of KFC, McDonald’s and Burger King.
Researchers (Ali, Kara, Erdener & Orsay, 1997) studied the food consumption
trend and predicted the fast growth of QSR in a long term period in the future;
therefore QSR markets will still offer greater growth opportunities for marketers.
While the global development of QSRs has created opportunities, at the same
time, significant challenges exist. In this era of globalization, there are many factors
tend to increase the challenges and threats faced by companies and nations such as
economic crisis, political unrest, imbalances in income distribution, environmental
degradation and a plethora of other factors. While these factors can be threats to a
business, marketers try continuously to convert them into opportunities.
The rising income, hygiene consciousness and different preferences for food
3
have given scope for the QSRs to attract youngsters and other consumers. With more
companies, especially the multinational companies enter the quick service restaurant
industry; competition has increased and paved way for innovative dishes, attracting
consumers. Thus understanding the preference and perception of consumers toward
the fast food is necessary for the market players to get the final triumph in the intense
competition.
1.2 Research Objectives
The main objective of this study is to exam the consumer’s preference and
perception toward quick service restaurant.
In detail, first, to study the factors influencing the choice of quick service
restaurant such as price, taste, convenience service etc. And to understand the
association of demographic factors, lifestyle, and quick service restaurant
consumption patterns.
Second, to tell the difference among the consumer profile of KFC, McDonald’s
and Burger King.
In addition, to get an insight about the influence of age and gender toward fast
food preference.
1.3 Scope of Study
This research is in the category of descriptive research which study the factors
-brand, product, taste, convenience service, ambience, price and promotion-influence
the consumer choice of quick service restaurant in Bangkok, Thailand. The scope of
the study is confined to study the consumers’ preference and perception toward the
three quick service restaurant chains KFC, McDonald’s and Burger King in Bangkok.
The target populations are the consumers of KFC, McDonald’s and Burger King in
Bangkok with the age of 14-60 years old in both male and female gender of all
nationalities.

4
1.4 Research Question
The main objective of this study is to examine the consumer choice decision
toward quick service restaurant in Bangkok. In detail, first, to study the factors
influencing the choice of quick service restaurant such as price, taste, convenience
service etc. Second, this study also seeks to understand the association of
demographic factors, lifestyle, and consumption of quick service restaurant, and to tell
the difference among the consumer profile of KFC, McDonald’s and Burger King.
The research questions are:
1 What are the important factors influencing the consumer choice of Quick
Service Restaurant?
2 What is the difference among the consumer profile of KFC, McDonald’s and
Burger King?
1.5 Significant Of Research
This study will provide benefit for QSR players in management level and
marketing level to develop the strategies in order to improve the product and service.
The data can help to predict the consumer purchasing behavior of QSR. There are
studies in the areas of factors influencing consumer buying behavior in the other
country,but the studies and data are much lacking in Thailand. This study intends to
understand the consumer’s preference and perception from Bangkok according to real
data, it is look to provide better understanding to the consumer of QSR in Bangkok
and for further study in marketing field.
CHAPTER 2
LITERATURE REVIEW
The purpose of the study is to exam the consumer’s preference and perception
toward quick service restaurant in Bangkok. The study intends to study the factor
influence the consumer choice of QSR in Bangkok, and the relationship with
demographic variable.
Thus, this following chapter consists with four sections:
Quick Service Restaurant Industry
The Theory of Planned Behavior and Maslow’s Hierarchies of Needs
Marketing Mix and Consumer Purchasing Decision Behavior
Previous Research Related to Quick Service Restaurant
2.1 Quick Service Restaurant Industry
2.1.1 Fast Food
Fast food is low cost, quick service, usually high calories and served by chain
restaurant. Bender and Bender (1993) defined fast food as: “Food items which have a
limited menu and which fall under production line techniques are termed as fast food
items.” Later Davies and Smith (2004) added “products such as pizza, sandwiches or
hamburgers where the supplier tends to specialize.”
Fast food is a wide range of food items, including not only the heavy fast food
such as burger,pizza,chicken but also light fast food as doughnut, premium
ice-cream etc.
Quick service restaurant (QSR), as known as fast food restaurant originated in
United State in the early of 1900s, with the opening of fast food outlet named
Automat in New York, which served simple drink and food by coin based vending
machines. Automat became the America first fast food chain and remained extremely
popular throughout 1920s and 1930s.
6
2.1.2 The Development of Quick Service Restaurant
Quick service restaurant developed rapidly from 1905s. In 1960s, more women
in United States returned to job market, which meant they had less time to spend in
the kitchen, therefore households depended more on quick service restaurant.
Since the middle of 1990s, quick service restaurant had an explosive growth
through the world as a result of globalization. The United States take the lead of
worldwide quick service restaurant industry and currently control 52.4% market share,
and America style fast food restaurants are now franchised in over the 100 countries
(Datamonitor 2009).
According to Hanson (2002), people were forced to find quicker meal solutions
by the shortened lunch hours and the fast pace of life. Quick service restaurant chain
adopted standardization in raw materials of their food, processing, price and service,
therefore it is popular for supply safe and convenient fast food to people who are in
hurry. The huge market attracted big food chains such as McDonalds, Burger King
and TV Dinner, Kentucky Fried Chicken, and these organized QSR grown gradually
into worldwide reputed brand in the industry.
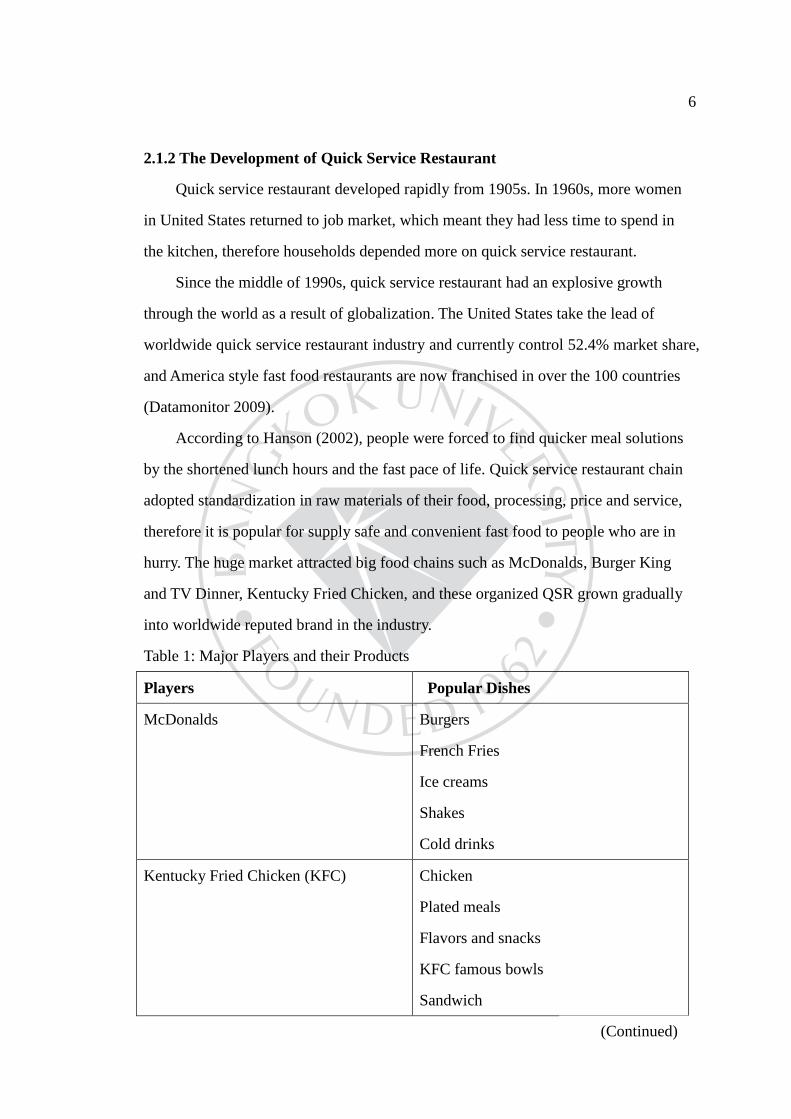
Table 1: Major Players and their Products
Players Popular Dishes
McDonalds Burgers
French Fries
Ice creams
Shakes
Cold drinks
Kentucky Fried Chicken (KFC) Chicken
Plated meals
Flavors and snacks
KFC famous bowls
Sandwich
(Continued)
7
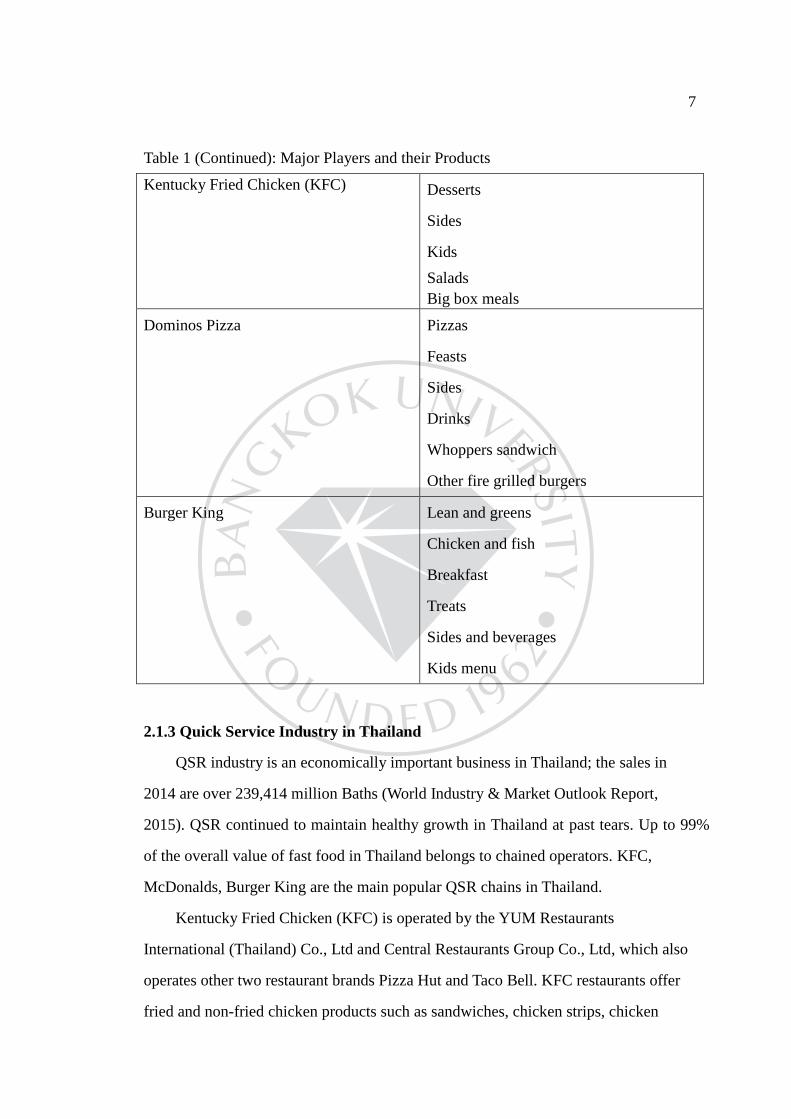
Table 1 (Continued): Major Players and their Products
Kentucky Fried Chicken (KFC) Desserts
Sides
Kids
Salads
Big box meals
Dominos Pizza Pizzas
Feasts
Sides
Drinks
Whoppers sandwich
Other fire grilled burgers
Burger King Lean and greens
Chicken and fish
Breakfast
Treats
Sides and beverages
Kids menu
2.1.3 Quick Service Industry in Thailand
QSR industry is an economically important business in Thailand; the sales in
2014 are over 239,414 million Baths (World Industry & Market Outlook Report,
2015). QSR continued to maintain healthy growth in Thailand at past tears. Up to 99%
of the overall value of fast food in Thailand belongs to chained operators. KFC,
McDonalds, Burger King are the main popular QSR chains in Thailand.
Kentucky Fried Chicken (KFC) is operated by the YUM Restaurants
International (Thailand) Co., Ltd and Central Restaurants Group Co., Ltd, which also
operates other two restaurant brands Pizza Hut and Taco Bell. KFC restaurants offer
fried and non-fried chicken products such as sandwiches, chicken strips, chicken
8
on-the-bone products, and other chicken products marketed under a variety of names.
KFC restaurants also offer a variety of entrees and side items.
KFC opened first restaurant in 1984 in Thailand and now has more than 400
branches across the country. KFC has become the market leader in Thai QSR industry.
(Global Restaurants Industry Profile, 2015)
KFC took their social responsibility to launch event to promote active lifestyles
and support educations in Thai society, which earned recognition from the public.
The McDonalds chains, which began operation in 1995 and now operate more
than 36,000 restaurants over the 119 countries, entered in Bangkok in 1985 (Global
Restaurants Industry Profile, 2015). Until now there are over 100 McDonald’s
restaurants to provide convenience service in Thailand.
The McDonalds chain is one of the world's largest food service retailing chains.
McDonald's restaurants offer a standardized menu, although geographic variations
exist. McDonald's key product offerings include hamburgers and cheeseburgers,
chicken sandwiches, French fries, wraps, chicken nuggets, salads, oatmeal, desserts,
sundaes, soft serve cones and pies. It also offers beverages such as shakes, soft drinks,
coffee, flavored tea and others. In Thailand McDonald's restaurant also offer breakfast
including muffins, biscuits, hotcakes, and bagel sandwiches.
Burger king is the third largest global quick service restaurant chains following
The McDonalds chains and Yum! Brands. To the end of 2013, Burger King had over
13,000 outlets in 79 countries, of these, 66 percent are in the United States and 99
percent are privately owned and operated by independent franchisees.
Burger King entered Thailand market in year 1994,which cooperated
with Minor Food Group, operated more than 20 restaurant outlets. The main product
of Burger King is the signature hamburgers, as well French fries, soft drinks,
milkshakes and desserts are also provided. In Thailand, between 65 per cent and 70
per cent of Burger King's sales were mainly to foreign tourists. The sales volume of
Burger King ranked the third in the burger segment, after KFC and McDonalds

9
Beyond these QSR chains, there are other reputed brands within the industry, for
instance Burger King, Pizza Hut. Because the huge market and intense competition,
studying the factors influencing the customer choice could provide an important
guidance to the market players
2.2 The Theory of Planned Behavior and Maslow’s Hierarchies of Needs
2.2.1 The Theory of Planned Behavior
The theory of planned behavior (TPB) which is an improvement of theory of
reasoned action, explain the process of the decision making.
The TPB proposes that the best determinant of behavior is intention which is
influenced by three factors: attitude, subjective norm, and perceived behavioral
control.
Figure 1: Theory of planned behavior
Consumer behavior is defined most often as a result of a system of dynamic
relationships between the processes of perception, information, attitude, motivation
and the actual event. In this process, attitude is one the one that presents the greatest
stability over time.
Attitude is nowadays defined as “a psychological tendency that is expressed by
evaluating a particular entity with some degree of favor or disfavor” (Eagly &
Chaiken, 1993, p.1). This state of mind influences the responses of the audience
towards all objects and situations with which the audience interacts (Allport, 1935)

10
Attitudes are the result of affective processes and knowledge that create the
predisposition to act on convictions. They are an important factor influencing
consumer behavior. Some researchers define attitude as a latent dimension of
consumer behavior.
The theory of planned behavior models a proposed explanation for the
relationship between attitudes and behavior. People may have different level of
positive or negative attitude toward objective, previous research has conduct to
evaluate people’s attitude. Therefore, it is helpful through measuring the attitude to
predict the consumer behavior.
2.2.2 Maslow’s Hierarchies of Needs
Figure 2: Maslow’s Extended Hierarchies of Needs (based on Maslow 1943; 1987)
Maslow’s (1943; 1948a; 1948b; 1967; 1987) hierarchy of needs is a widely used
model of customer needs (Kotler, Keller and Burton 2009). Maslow (1943) suggested
categories of basic (conative) needs to motivate the consumer behavior: physiological,
safety, belongingness and love, esteem and, self-actualization. Later Maslow (1987)
11
extended needs hierarchies and adds self-transcendence needs to complete the
concept.
Maslow’s hierarchy of needs states that once the most fundamental
needs-physiological needs have been largely satisfied, individual seek for satisfy
safety needs. After that, needs for love, affection, and belonging guide individual’s
actions. Afterwards, self-esteem becomes the most important, and then individuals
attempt to self-actualization, and they eventually strive for self-transcendence.
Maslow’s theory has been adapted successfully to explain the motivation of consumer
behavior.
2.3 Marketing Mix and Consumer Purchasing Decision Behavior
2.3.1 The Marketing Mix
The concept of marketing mix is introduced by Borden in 1953. Borden (1964)
point out that marketing mix is an important element in helping marketers to
formulate effective marketing strategies, and the marketing mix concept has been
studied and developed by various researchers (Booms & Bitner, 1981; Magrath, 1986;
McCarthy, 1960). In early time, Borden (1964) introduced 12 elements, namely,
product planning, pricing, branding, channels of distribution, personal selling,
advertising, promotions, packaging, display, servicing, physical handling, and fact
finding and analysis. McCarthy (1960) simplified it into four elements, termed “The
Four Ps”- product, price, promotion, and place.
Product plays a central role in the marketing mix. Kotler and Keller (2012) argued
that a product is either goods or services offered to the market to satisfy demand. In
quick service restaurant, product covers a wide range of variables such as brand name,
quality, taste, convenient service.
Price is the amount of money paid by customers for a product. Kotler and Keller
(2012) suggested that by offering value pricing, a strategy of low pricing with
high-quality offering, will win loyal customers.
Place or distribution can create value for customers by making the products
12
available in accessible locations when needed.
Promotional activities and tools are vital as it communicates the merits of the
products and services through influencing the respond, belief, and attitude of
consumer, in order to persuade and convince target customers, (Kotler & Armstrong,
2010). Promotion involves in advertising, personal selling, sales promotion, publicity,
and direct marketing.
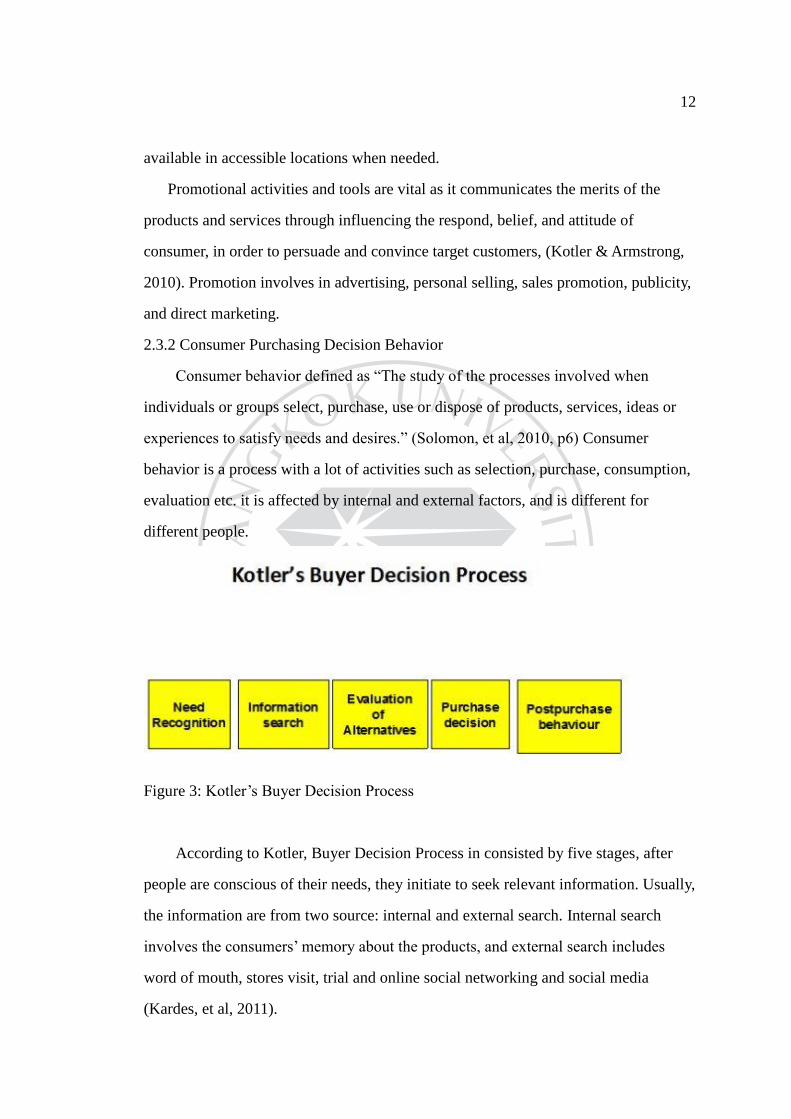
2.3.2 Consumer Purchasing Decision Behavior
Consumer behavior defined as “The study of the processes involved when
individuals or groups select, purchase, use or dispose of products, services, ideas or
experiences to satisfy needs and desires.” (Solomon, et al, 2010, p6) Consumer
behavior is a process with a lot of activities such as selection, purchase, consumption,
evaluation etc. it is affected by internal and external factors, and is different for
different people.
Figure 3: Kotler’s Buyer Decision Process
According to Kotler, Buyer Decision Process in consisted by five stages, after
people are conscious of their needs, they initiate to seek relevant information. Usually,
the information are from two source: internal and external search. Internal search
involves the consumers’ memory about the products, and external search includes
word of mouth, stores visit, trial and online social networking and social media
(Kardes, et al, 2011).

13
Consumers’ and social environment have huge influences on consumers’
purchase decision and can make a big difference in their desire and motives for
product purchase (Blythe, 2008).
In the step of evaluation of alternatives, consumers compare the compare and
evaluate several alternatives in terms of products to choose the best to fulfill their
need (Blythe, 2008)
After the comparison, consumer they should make their choice among the
alternatives and choose the certain product. In the after purchasing decision stage of
process consumer evaluate how well the choice worked out and start to compare their
perceptions of the product with their expectations (Kardes, et al, 2011)
Buyer decision process influenced by cultural factors - social, group- individual
psychological factors, and situational factors guild working of the marketing mix
2.4 Previous Research
Because the ORS industry is viewed as a service industry (Parasuraman,
Zeithaml, and Berry 1985), there is increasing attention on the importance of service
quality, service value, and customer satisfaction
According to Auty (1992), the main reasons for consumers to choose a
particular restaurant are food type and food quality. The study also found that
restaurant style and atmosphere also attract the customers. The three segments
considered for the study—students and middle-aged and older people with moderate
income—prefer restaurants based on their style of living.
Clarke and Wood (1998) studied the same grounds and found that the type of
food and the quality are the key factors in determining consumer loyalty towards a
particular restaurant.
Kara et al. (1995) studied consumers’ perceptions of and preferences for fast
food restaurants in the US and Canada. According to their study, the consumers in the
age of 12 to 24 years look for variety, price, delivery service and location in America
14
and for price and novelties in Canada. In the age group of 46 to above 55 years
cleanliness, nutritional value, quality and taste are considered by Americans and
preference is given to nutritional value and seating capacity by Canadians in
identifying fast food restaurants. In the middle age group of 25 to 45 years, Americans
preferred speed and friendly personnel whereas Canadians looked for speed, quality
and service.
Ergin & Akbay (2014) suggested five dominant factors which including brand
name reputation, cost, convenience, consistency and quality have an impact on young
consumers’ preference of different brands of fast food restaurant; these factors are
significantly related to several demographic variable such as age, gender, income
level.
A study by Agnes et al (2004) revealed that the waiting time, staff attitude, food
quality and variety significantly influence and affect customer satisfaction.
Law, Hui, and Zhao (2004) studied the same group found that waiting time, staff
attitude; environment, seat availability, and food quality influence return frequency.
Maria (1994) found that Chinese consumers prefer American fast food because
of their taste, packaging and service speed.
Lee and Ulgado (1997) investigated difference between the consumer from
United States and South Korea and found that customer’ expectations and perceptions
of QSR service quality, food price, service time, and location are significantly
difference.
A research conducted by Monika and Morven (2005) found that brand value,
nutritional value, ethical value and food quality are the four factors that influence the
purchase behavior of the consumers.
A study by Keillor, Hult, and Kandemir (2004) revealed that service encounter
including physical good quality, service quality, and service scape positively influence
consumer behavioral intentions to buy.
According to Qin and Prybutok (2008), they examined the five key determinants
15
of service quality (tangibles, reliability, responsiveness, assurance, and empathy),
food quality and price are found to be significant factors on customer satisfaction and
behavioral intentions.
Goyal & Singh (2007) conducted a research seeks to estimate the importance of
various factors affecting the choice of fast food outlets by Indian young consumers.
The study estimated Consumer acceptance of food served by OSR is critically
important for the future growth of ORS in any economy. Though the rating of fast
food outlets’ attributes under study is very high but still consumers visit fast food
outlets for fun, change o entertaining their friends but certainly not as a substitute of
homemade food.
Despite the fast growth of QSR industry, there have been several issues
concerning fast food in recent times. Large fast food chains are being questioned in
the context of nutritional content of the food products and hygiene. Fast food is a
cause of great concern to children because it can lead to problems like diabetes,
obesity, etc.
Brown et al (2000) emphasized the need for nutritional awareness and fast food
preferences of young consumers during adolescent years. Davies and Smith (2004)
have analyzed the importance of nutritional values of fast food and also information
printed/disclosed by the fast food providers in London.
Tassalina and Augustine (2007) found that food choices were influenced by
health/nutritional benefits (60.8%), safety/sanitation (60.0%), and the price of menu
(55.8%), and celebration of a special occasion (60.8%) was the most popular reason
for ‘eating out’.
Davies and Smith (2004) have analyzed the importance of nutritional values of
fast food and also the information printed/disclosed by the fast food providers in
London. In addition to the factors considered for choosing a fast food outlet, there are
research studies towards the nutritional value of fast food. A survey of more than
9,000 consumers nationwide in US has shown that about 25% of those who eat fast

16
food and drink sugary, carbonated soft drinks generally consume more calories, fats,
carbohydrates, added sugars and proteins than those who do not (Bowman, 2005).
According to the study of Mc Neal et al. (1980), respondents felt that meals were
moderately nutritious and a good food buy, but they were fattening and contained
harmful additives. These findings further indicate that although the consumers
perceive the nutritional aspects of fast food meals to be important, they often ignore
the aspects in practice.
Adams (2005) paper outlines the basis for establishing fast food industry,
responsible for obesity as articulated in litigation against fast food chains in the US. In
the Indian context, there is high concern towards health in the 21st century. There are
health-related articles in daily newspapers, and health shows on television. There are
special health-related magazines that are now very popular. Health-related articles do
advise readers to consume more fruits, vegetables, and water and less or nil of junk
food including fast food, being high on fat and calories.
2.5 Hypotheses
Based on the previous search, food type and food quality are found as the
common factors influencing the choice of QSR Other factors such as service speed,
service quality, taste, price, brand image, are also considering factors influencing the
consumer choice (Auty, 1992; Lee and Ulgado, 1997; Clarke &Wood, 1998; Keillor,
Hult, and Kandemir, 2004; Monika and Morven , 2005; Qin and Prybutok ,2008; ).
Based on the above discussions we propose the following research questions:
1 What are the important factors influencing the consumer choice of Quick
Service Restaurant?
2 What is the difference among the factors influencing the consumer choice of
KFC, McDonald’s and Burger King?
The first question examines how the marketing mix variable influence the
consumer choice and investigate the relationship among demographic factors,
17
marketing mix variable and consumer’s choice of quick service restaurant. Hence the
hypotheses for RQ1 are:
H1: Age has significant relationship with the consumer’s choice,
H2: Income has significant relationship with the consumer’s choice,
H3: Gender has significant relationship with the consumer’s choice,
H4: Location has significant relationship with the consumer’s choice.
The second question intends to tell the difference among the factors influencing
the consumer choice of KFC, McDonald’s and Burger King. Hence the hypotheses for
RQ2 are
H5: Marketing mix factors are significant impact in choosing KFC
over Burger king.
H6: Marketing mix factors are significant impact in choosing McDonalds’
over Burger king.
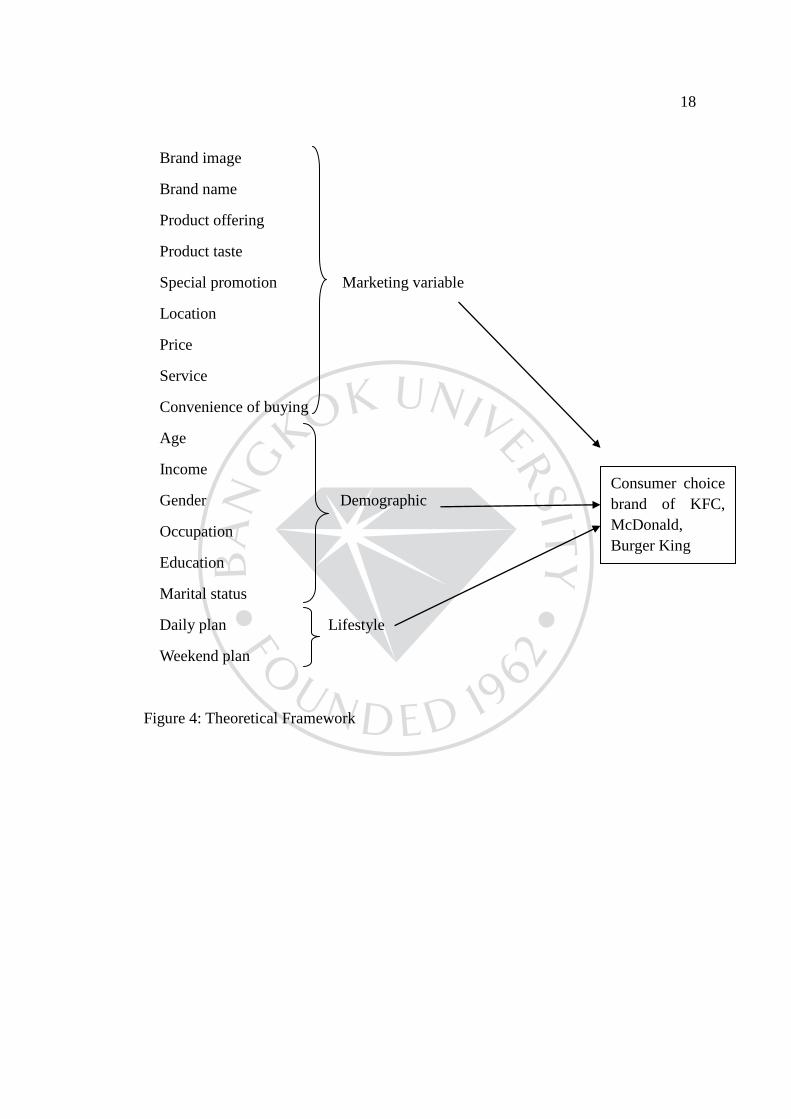
2.6 Theoretical Framework
18
Brand image
Brand name
Product offering
Product taste
Special promotion Marketing variable
Location
Price
Service
Convenience of buying
Age
Income
Gender Demographic
Occupation
Education
Marital status
Daily plan Lifestyle
Weekend plan
Figure 4: Theoretical Framework
Consumer choice
brand of KFC,
McDonald,
Burger King
CHAPTER 3
METHODOLOGY
This chapter provides a summary of research methodology
3.1 Research Design
To answer the research question, a descriptive research has been adopted to
conduct the captioned study by interacting with consumers to understand the factors
influencing the choice of quick service restaurant. A quantitative approach was
applied in the research.
Participants were asked to complete a cross-sectional self-administered survey.
The questionnaire stated that respondents’ answers were completely anonymous but
other demographic information such as age, income, education. The privacy of
participants was protected. All participates were voluntary and agree to use of their
answers in the data set. There was no cost and minimal time requirement to answer
the questionnaire that allowed a large number of participants.
3.2 Population and Sample Selection
As the research aimed to study the consumer’s perception and choice of quick
service restaurant in Bangkok. The target population of this research was the male and
female consumers who consumed QSR, aged from 14-55 years old, living in Bangkok.
The questionnaire survey were distributed to consumers who experienced KFC,
McDonalds and Burger King in Bangkok.
The samples size is calculate according to the follow formula:
n = Z2p(1-p)
E2
n = sample size
Z2 = square of the confidence level in standard error units (1.96 for 95%
confidence level)
p = Sample proportion of successes (favorable outcomes)
Usually, p = 0.5, when there is no prior knowledge or estimate proportion p
20
(Berenson, 1999).
(1-p)= (1−p) = Sample proportion of failures (unfavorable outcomes); often
called "q"
E2 = 0.05 or 5%, the acceptable sampling error in estimating the population
proportion.
According to the formula
n = 1.962* 0.5(1-0.5)
(0.05)2
n = 384.16 samples
≈385 samples
So the sample size is 385 at least.
3.3 Research Instrument
The research conducted an English cross-sectional self-administered survey. The
questionnaire (APPENDIX A) was consisted with three sections demographic
information and lifestyle, degree of the influencing factors and last sections is
consumer’s preference and consumer behavior.
Section I would explore the consumer demographic information and lifestyle of
participants including gender, age, marital status, occupation, education level, income
years of living in Bangkok and the way of pass time.
Section II provided the influencing factors of consumer choice, including Brand
image, product variety, product taste, price, food safety, ambience, convenient
operating hours, convenient service in the restaurant, easy access to the restaurant,
delivery service, promotion, gift, no alternative choice , to save the meal time, and to
accompany with others. Participants would rank the degree of agreement to the
factors.
21
Section III investigated the consumer’s attitude toward fast food, preference of
three QSR brands, frequency, channels and food variety.
3.4 Data Collection Procedure
The questionnaire surveys were distributed face to face in Bangkok city from
10th
, June, 2015 to 18th
, June, 2015. Random sampling method was used to collect
data. After the 400 questionnaires were collected, the data were entered into SPSS
statistical program and analysis was run to determine significant findings.
Questionnaires were collected and entered into a SPSS statistical program. To
answer the RQ1, multinomial logistic statistic was used to investigate the factors
influencing the consumer choice of Quick Service Restaurant. Regarding the
hypothesis of RQ2, cross tabulation were used to examine the difference among the
consumer profile of KFC, McDonald’s and Burger King. A level of .005 was set for
significance to accept or reject a hypothesis.
CHAPTER 4
RESULTS
This chapter will analyze the result of SPSS, and give answer to the research
questions. Collect the data total of 400 consumers completely the survey and 100%
participates live in Bangkok.
4.1 Frequency Distribution
In the questionnaire, the first part including the customer’s demographic and
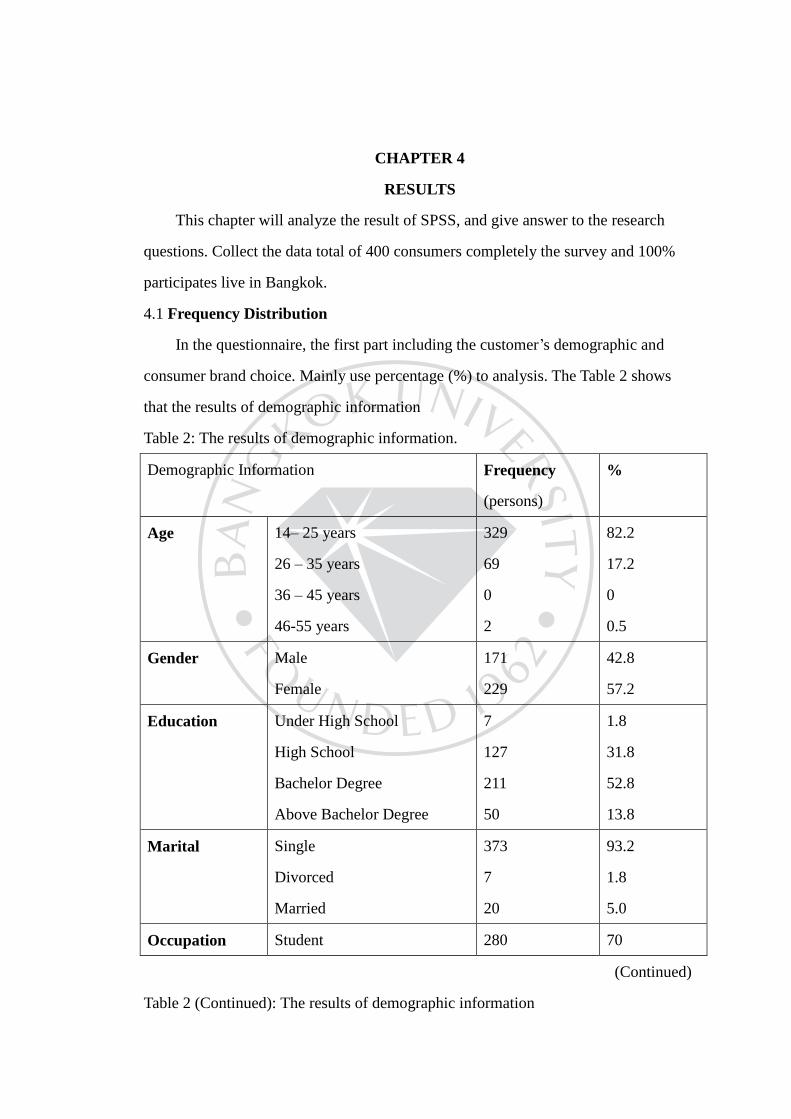
consumer brand choice. Mainly use percentage (%) to analysis. The Table 2 shows
that the results of demographic information
Table 2: The results of demographic information.
Demographic Information Frequency
(persons)
%
Age 14– 25 years
26 – 35 years
36 – 45 years
46-55 years
329
69
0
2
82.2
17.2
0
0.5
Gender Male
Female
171
229
42.8
57.2
Education Under High School
High School
Bachelor Degree
Above Bachelor Degree
7
127
211
50
1.8
31.8
52.8
13.8
Marital Single
Divorced
Married
373
7
20
93.2
1.8
5.0
Occupation Student 280 70
(Continued)
Table 2 (Continued): The results of demographic information

23
Occupation Government Officers/
Employees of state enterprise
Business owner
Individual Companies
31
44
38
7.8
11
9,5
Income Less than 10,000 Bath
10,001-15,000 Bath
15,001-20,000 Bath
20,001-25,000 Bath
More than 25,000 Bath
127
99
68
53
53
31.8
24.8
17.0
13.2
13.2
Living in BKK Less than 1 year
1-5 year
5-10 year
More than 10 year
32
106
46
216
8.0
26.5
11.5
54.0
Age: majority of the samples aged between 14-25 years old (82.2%, n=329), and
samples aged between 26 – 35 years old (17.2%, n=69), It is provide that QSR
consumer in Bangkok is young ages.
Gender: majority of the samples gender are female (57.2%, n=229), respectively
minority of samples gender are male (42.8%, n=171).
Education level: majority of the samples are Bachelor Degree (52.8%, n=211),
and High school (31.8%, n=127), respectively minority of samples are Above
Bachelor Degree (13.8%, n=55), and Under High School (1.8%, n=7).
Marital status: majority of the samples marital status are single (93.2%, n=373),
respectively minority of samples marital status are married (5.0%, n=20).
Occupation: majority of the samples are Student (70.0%, n=280), respectively
minority of samples are Business owner (11.0%, n=44), individual companies (9.5%,
n=38) and government officers/employees of state enterprise (7.8%, n=31).
Income: majority of the samples incomes ranged in Less than 10,000 Bath
(31.8%, n=127), and 10,001 – 15,000 Bath (24.8%, n=99) respectively minority of
24
samples incomes ranged in 15,001-20,000Bath (17%, n=68), 20,001-25,000 Bath
(13.2%, n=53), and more than 25,000 Bath (13.2%%, n=53).
Living in BKK: majority of the samples lived in Bangkok more than 10 years
(54.0%, n=216), and respectively minority of samples lived in Bangkok Less than 1
year (8%, n=32).
The Table 3 to Table 9 are show that the consumer brand preference and
demographic information for each brand.
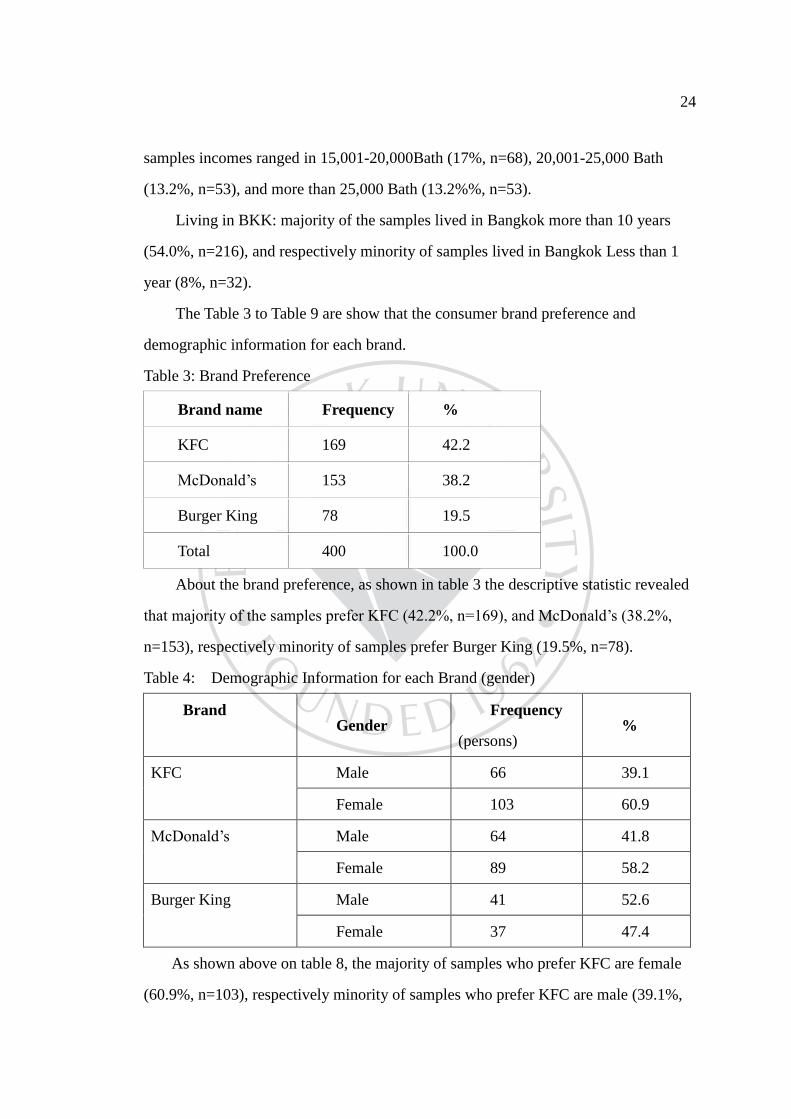
Table 3: Brand Preference
Brand name Frequency %
KFC 169 42.2
McDonald’s 153 38.2
Burger King 78 19.5
Total 400 100.0
About the brand preference, as shown in table 3 the descriptive statistic revealed
that majority of the samples prefer KFC (42.2%, n=169), and McDonald’s (38.2%,
n=153), respectively minority of samples prefer Burger King (19.5%, n=78).
Table 4: Demographic Information for each Brand (gender)
Brand Gender
Frequency
(persons) %
KFC Male 66 39.1
Female 103 60.9
McDonald’s Male 64 41.8
Female 89 58.2
Burger King Male 41 52.6
Female 37 47.4
As shown above on table 8, the majority of samples who prefer KFC are female
(60.9%, n=103), respectively minority of samples who prefer KFC are male (39.1%,
25
n=66). The majority of samples who prefer McDonald’s are female (58.2%, n=89),
respectively minority of samples who prefer McDonald’s are male (41.8%, n=64).
The majority of samples who prefer Burger King are male (52.6%, n=41),
respectively minority of samples who prefer Burger King are female (47.4%, n=37).
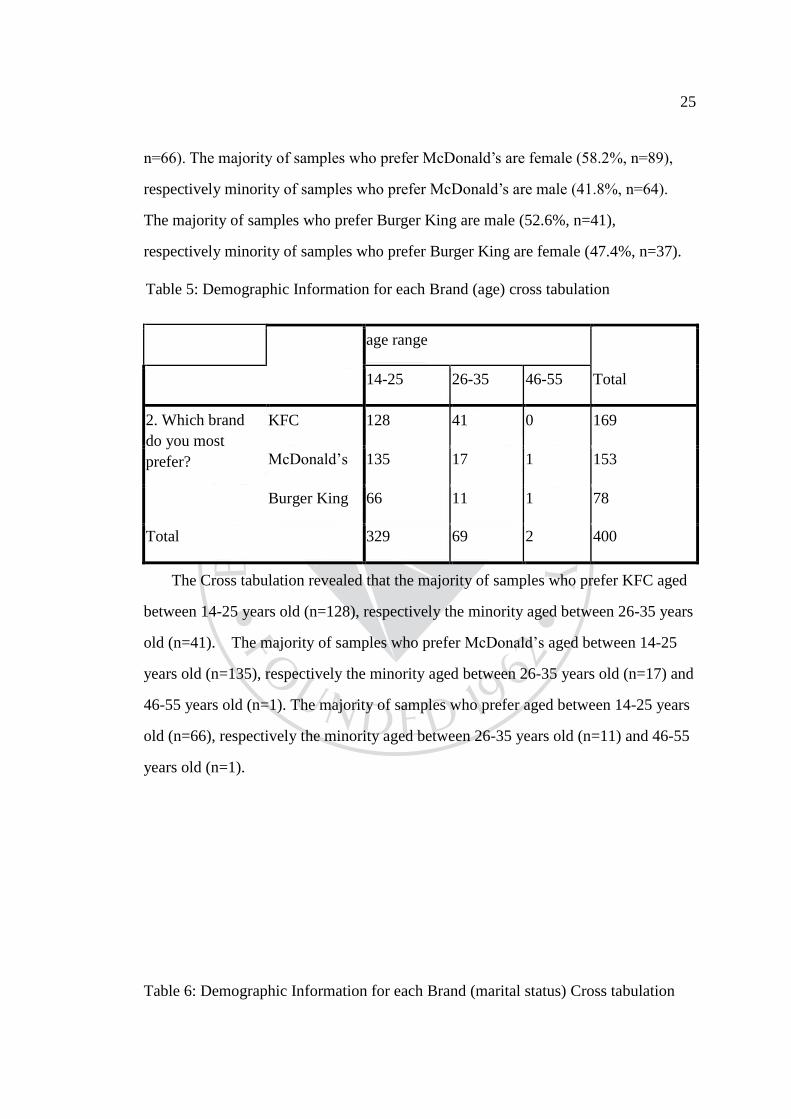
Table 5: Demographic Information for each Brand (age) cross tabulation
age range
Total 14-25 26-35 46-55
2. Which brand
do you most
prefer?
KFC 128 41 0 169
McDonald’s 135 17 1 153
Burger King 66 11 1 78
Total 329 69 2 400
The Cross tabulation revealed that the majority of samples who prefer KFC aged
between 14-25 years old (n=128), respectively the minority aged between 26-35 years
old (n=41). The majority of samples who prefer McDonald’s aged between 14-25
years old (n=135), respectively the minority aged between 26-35 years old (n=17) and
46-55 years old (n=1). The majority of samples who prefer aged between 14-25 years
old (n=66), respectively the minority aged between 26-35 years old (n=11) and 46-55
years old (n=1).
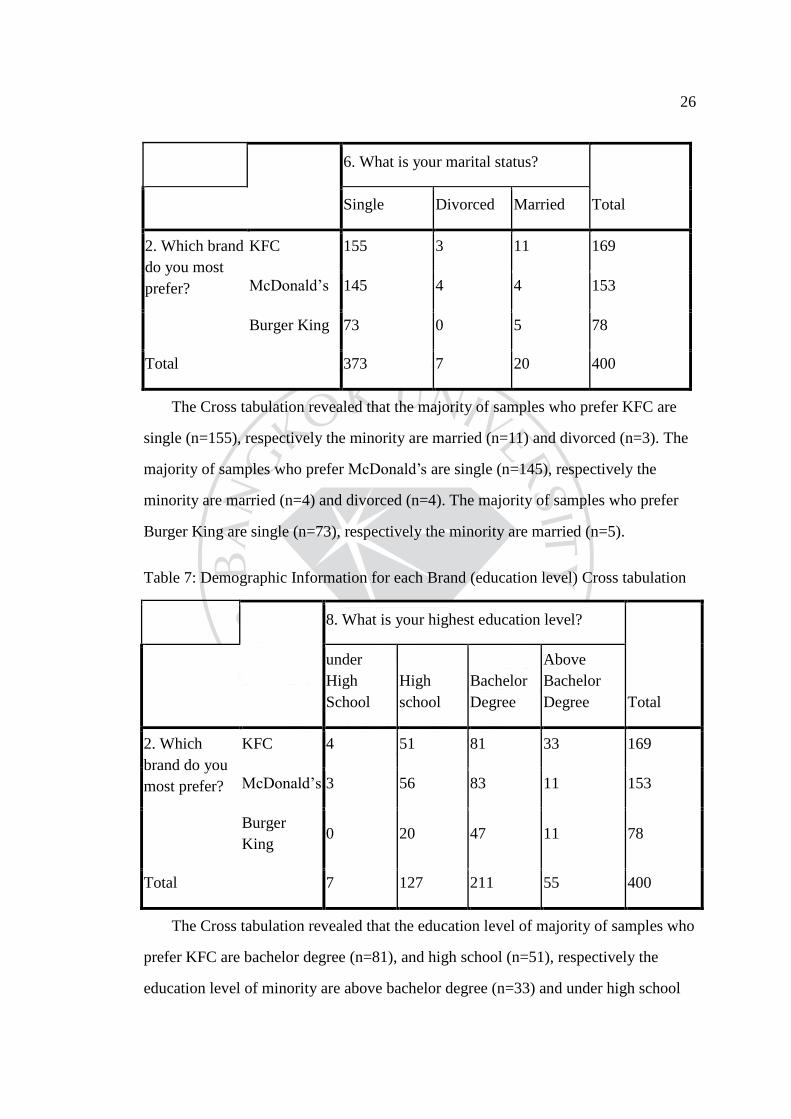
Table 6: Demographic Information for each Brand (marital status) Cross tabulation
26
6. What is your marital status?
Total Single Divorced Married
2. Which brand
do you most
prefer?
KFC 155 3 11 169
McDonald’s 145 4 4 153
Burger King 73 0 5 78
Total 373 7 20 400
The Cross tabulation revealed that the majority of samples who prefer KFC are
single (n=155), respectively the minority are married (n=11) and divorced (n=3). The
majority of samples who prefer McDonald’s are single (n=145), respectively the
minority are married (n=4) and divorced (n=4). The majority of samples who prefer
Burger King are single (n=73), respectively the minority are married (n=5).
Table 7: Demographic Information for each Brand (education level) Cross tabulation
8. What is your highest education level?
Total
under
High
School
High
school
Bachelor
Degree
Above
Bachelor
Degree
2. Which
brand do you
most prefer?
KFC 4 51 81 33 169
McDonald’s 3 56 83 11 153
Burger
King 0 20 47 11 78
Total 7 127 211 55 400
The Cross tabulation revealed that the education level of majority of samples who
prefer KFC are bachelor degree (n=81), and high school (n=51), respectively the
education level of minority are above bachelor degree (n=33) and under high school
27
(n=4). The education level of majority of samples who prefer McDonald’s are
bachelor degree (n=83), and high school (n=56), respectively the education level of
minority are above bachelor degree (n=11) and under high school (n=3). The
education level of majority of samples who prefer Burger King are bachelor degree
(n=47), and high school (n=20), respectively the education level of minority are above
bachelor degree (n=11).
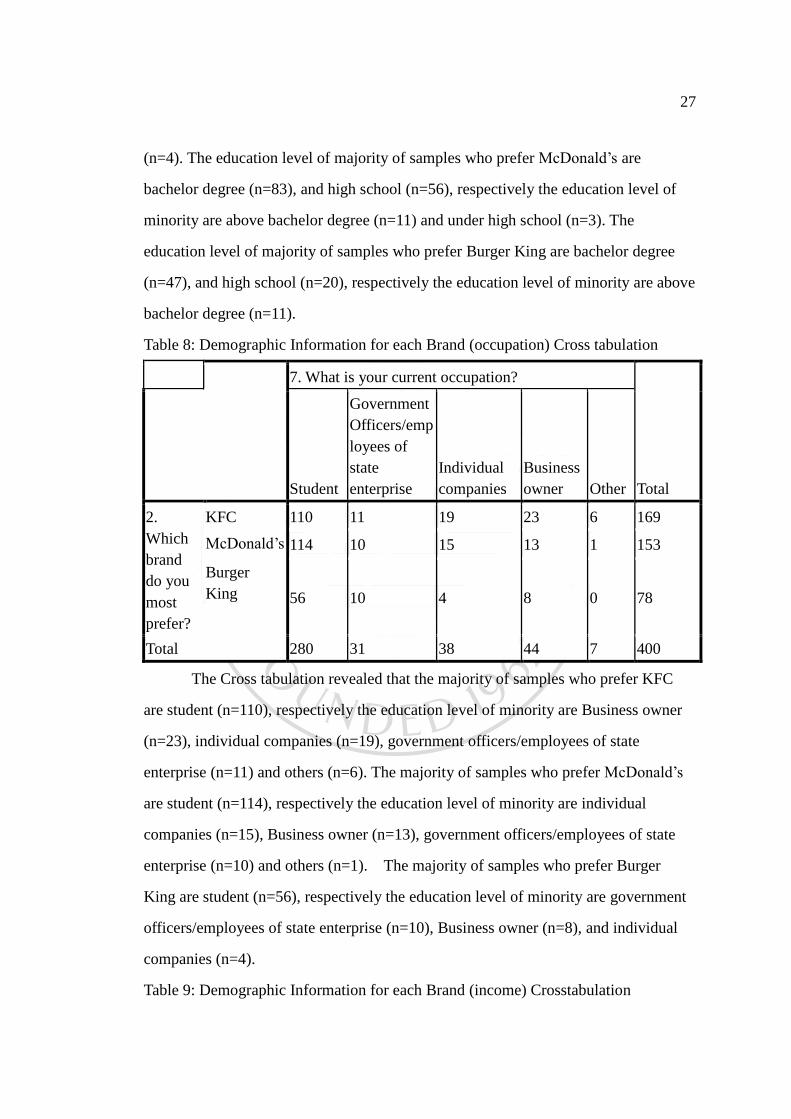
Table 8: Demographic Information for each Brand (occupation) Cross tabulation
7. What is your current occupation?
Total
Student
Government
Officers/emp
loyees of
state
enterprise
Individual
companies
Business
owner Other
2.
Which
brand
do you
most
prefer?
KFC 110 11 19 23 6 169
McDonald’s 114 10 15 13 1 153
Burger
King 56 10 4 8 0 78
Total 280 31 38 44 7 400
The Cross tabulation revealed that the majority of samples who prefer KFC
are student (n=110), respectively the education level of minority are Business owner
(n=23), individual companies (n=19), government officers/employees of state
enterprise (n=11) and others (n=6). The majority of samples who prefer McDonald’s
are student (n=114), respectively the education level of minority are individual
companies (n=15), Business owner (n=13), government officers/employees of state
enterprise (n=10) and others (n=1). The majority of samples who prefer Burger
King are student (n=56), respectively the education level of minority are government
officers/employees of state enterprise (n=10), Business owner (n=8), and individual
companies (n=4).
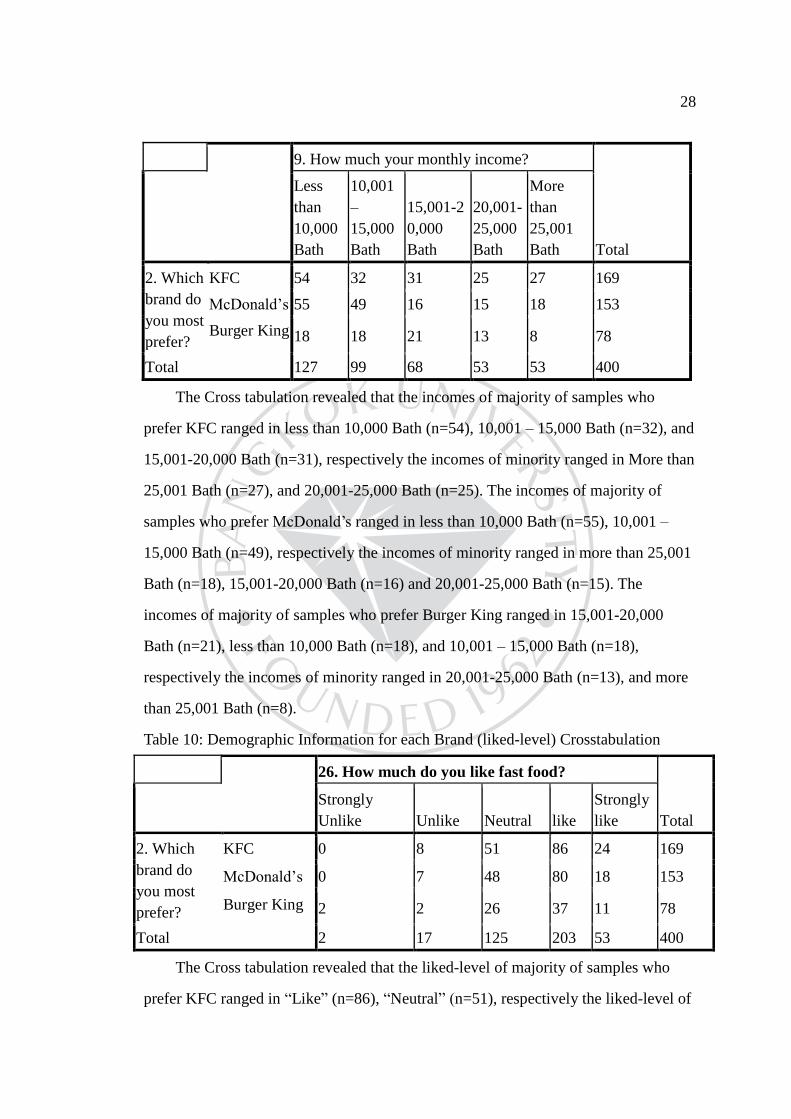
Table 9: Demographic Information for each Brand (income) Crosstabulation
28
9. How much your monthly income?
Total
Less
than
10,000
Bath
10,001
–
15,000
Bath
15,001-2
0,000
Bath
20,001-
25,000
Bath
More
than
25,001
Bath
2. Which
brand do
you most
prefer?
KFC 54 32 31 25 27 169
McDonald’s 55 49 16 15 18 153
Burger King 18 18 21 13 8 78
Total 127 99 68 53 53 400
The Cross tabulation revealed that the incomes of majority of samples who
prefer KFC ranged in less than 10,000 Bath (n=54), 10,001 – 15,000 Bath (n=32), and
15,001-20,000 Bath (n=31), respectively the incomes of minority ranged in More than
25,001 Bath (n=27), and 20,001-25,000 Bath (n=25). The incomes of majority of
samples who prefer McDonald’s ranged in less than 10,000 Bath (n=55), 10,001 –
15,000 Bath (n=49), respectively the incomes of minority ranged in more than 25,001
Bath (n=18), 15,001-20,000 Bath (n=16) and 20,001-25,000 Bath (n=15). The
incomes of majority of samples who prefer Burger King ranged in 15,001-20,000
Bath (n=21), less than 10,000 Bath (n=18), and 10,001 – 15,000 Bath (n=18),
respectively the incomes of minority ranged in 20,001-25,000 Bath (n=13), and more
than 25,001 Bath (n=8).
Table 10: Demographic Information for each Brand (liked-level) Crosstabulation
26. How much do you like fast food?
Total
Strongly
Unlike Unlike Neutral like
Strongly
like
2. Which
brand do
you most
prefer?
KFC 0 8 51 86 24 169
McDonald’s 0 7 48 80 18 153
Burger King 2 2 26 37 11 78
Total 2 17 125 203 53 400
The Cross tabulation revealed that the liked-level of majority of samples who
prefer KFC ranged in “Like” (n=86), “Neutral” (n=51), respectively the liked-level of
29
minority ranged in “Unlike” (n=8) and “Strongly like” (n=24). The liked-level
majority of samples who prefer McDonald’s ranged in “Like” (n=80), “Neutral”
(n=48), respectively the liked-level of minority ranged in “Unlike” (n=7), “Strong like”
(n=18). The liked-level of majority of samples who prefer Burger King ranged in
“Like” (n=37), “Neutral” (n=26) and “strongly like” (n=11), respectively the
liked-level of minority ranged in “strongly unlike” (n=2) and “unlike” (n=2).
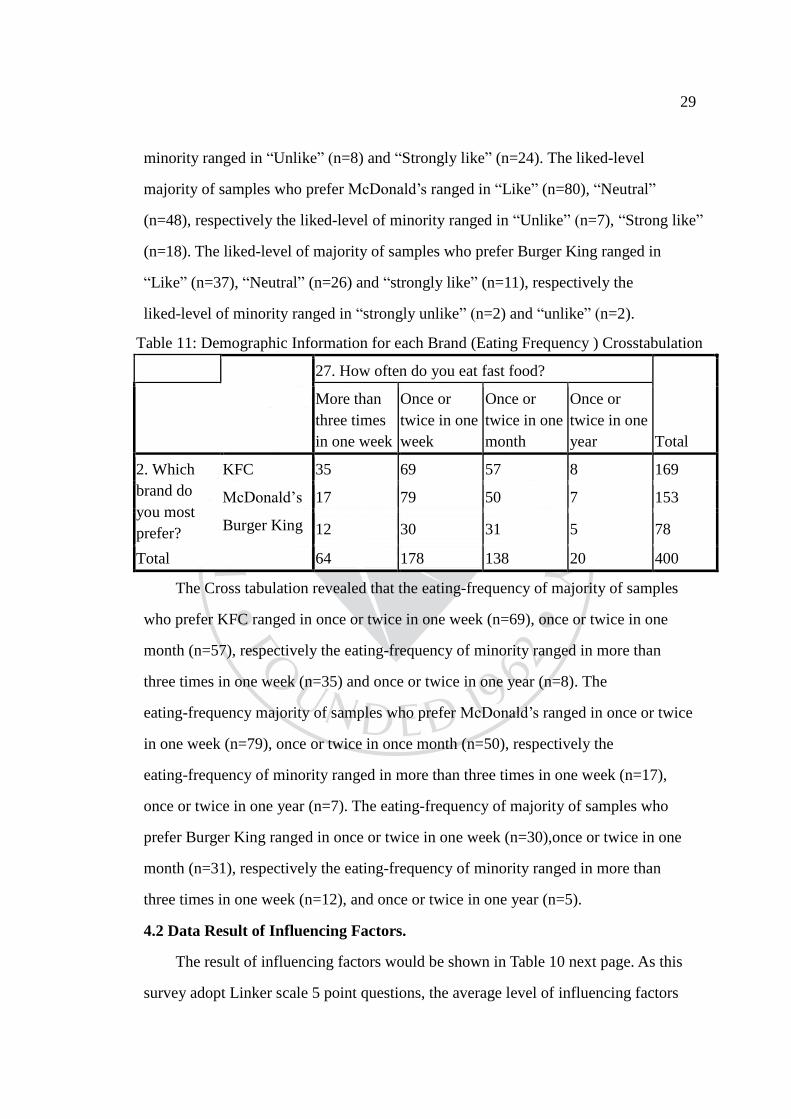
Table 11: Demographic Information for each Brand (Eating Frequency ) Crosstabulation
27. How often do you eat fast food?
Total
More than
three times
in one week
Once or
twice in one
week
Once or
twice in one
month
Once or
twice in one
year
2. Which
brand do
you most
prefer?
KFC 35 69 57 8 169
McDonald’s 17 79 50 7 153
Burger King 12 30 31 5 78
Total 64 178 138 20 400
The Cross tabulation revealed that the eating-frequency of majority of samples
who prefer KFC ranged in once or twice in one week (n=69), once or twice in one
month (n=57), respectively the eating-frequency of minority ranged in more than
three times in one week (n=35) and once or twice in one year (n=8). The
eating-frequency majority of samples who prefer McDonald’s ranged in once or twice
in one week (n=79), once or twice in once month (n=50), respectively the
eating-frequency of minority ranged in more than three times in one week (n=17),
once or twice in one year (n=7). The eating-frequency of majority of samples who
prefer Burger King ranged in once or twice in one week (n=30),once or twice in one
month (n=31), respectively the eating-frequency of minority ranged in more than
three times in one week (n=12), and once or twice in one year (n=5).
4.2 Data Result of Influencing Factors.
The result of influencing factors would be shown in Table 10 next page. As this
survey adopt Linker scale 5 point questions, the average level of influencing factors
30
will be defined as following:
1.00 – 1.80 = Very low
1.81 – 2.60 = Low
2.61 – 3.40 = Medium
3.41 – 4.20 = High
4.21 – 5.00 = Very High
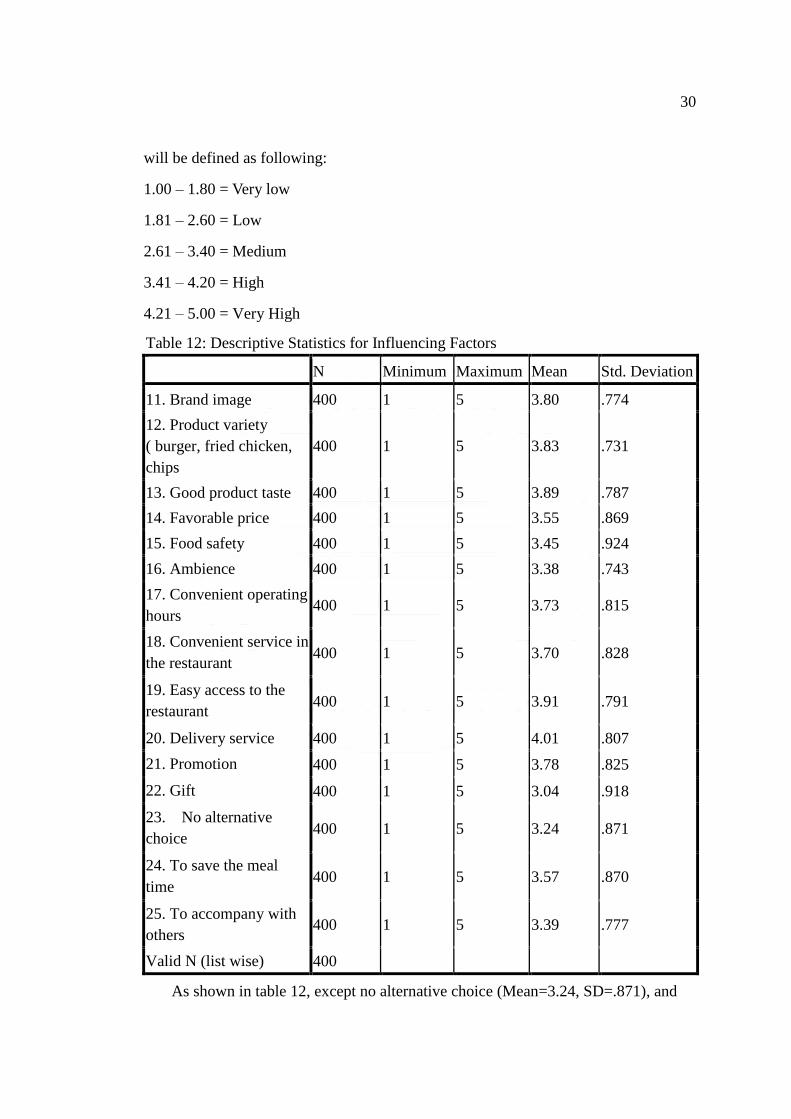
Table 12: Descriptive Statistics for Influencing Factors
N Minimum Maximum Mean Std. Deviation
11. Brand image 400 1 5 3.80 .774
12. Product variety
( burger, fried chicken,
chips
400 1 5 3.83 .731
13. Good product taste 400 1 5 3.89 .787
14. Favorable price 400 1 5 3.55 .869
15. Food safety 400 1 5 3.45 .924
16. Ambience 400 1 5 3.38 .743
17. Convenient operating
hours 400 1 5 3.73 .815
18. Convenient service in
the restaurant 400 1 5 3.70 .828
19. Easy access to the
restaurant 400 1 5 3.91 .791
20. Delivery service 400 1 5 4.01 .807
21. Promotion 400 1 5 3.78 .825
22. Gift 400 1 5 3.04 .918
23. No alternative
choice 400 1 5 3.24 .871
24. To save the meal
time 400 1 5 3.57 .870
25. To accompany with
others 400 1 5 3.39 .777
Valid N (list wise) 400
As shown in table 12, except no alternative choice (Mean=3.24, SD=.871), and
31
gift (Mean=3.04, SD=.918) fall in the medium average level in Likert scale questions,
the other factors fall in the high average level, therefore none fall in the low average.
The results predict that comparing with other factors; no alternative choice and
gift have less influence on the consumer’s choice.
The result also predict that delivery service (Mean=4.01, SD=.807), easy access
to the restaurant (Mean=3.91, SD=.791) and good product taste (Mean=3.89,
SD=.787) are the top 3 primary factors influencing the choice of QSR.
4.3 Findings of Hypotheses Testing.
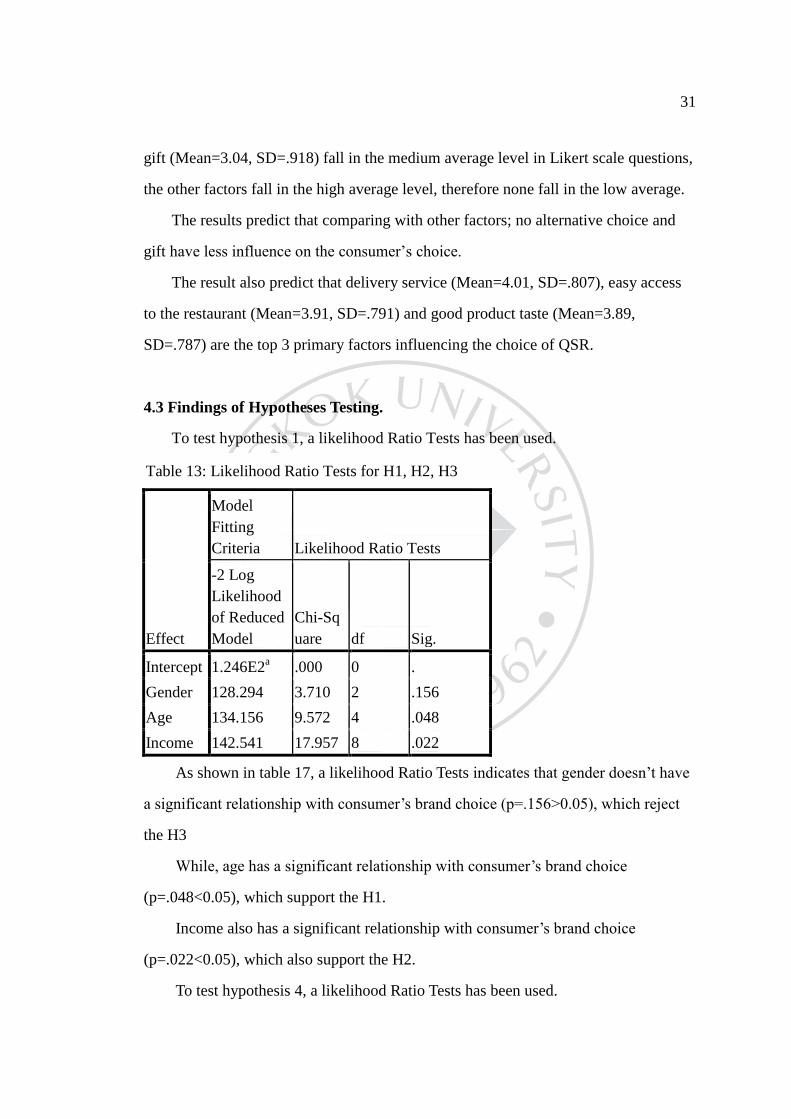
To test hypothesis 1, a likelihood Ratio Tests has been used.
Table 13: Likelihood Ratio Tests for H1, H2, H3
Effect
Model
Fitting
Criteria Likelihood Ratio Tests
-2 Log
Likelihood
of Reduced
Model
Chi-Sq
uare df Sig.
Intercept 1.246E2a .000 0 .
Gender 128.294 3.710 2 .156
Age 134.156 9.572 4 .048
Income 142.541 17.957 8 .022
As shown in table 17, a likelihood Ratio Tests indicates that gender doesn’t have
a significant relationship with consumer’s brand choice (p=.156>0.05), which reject
the H3
While, age has a significant relationship with consumer’s brand choice
(p=.048<0.05), which support the H1.
Income also has a significant relationship with consumer’s brand choice
(p=.022<0.05), which also support the H2.
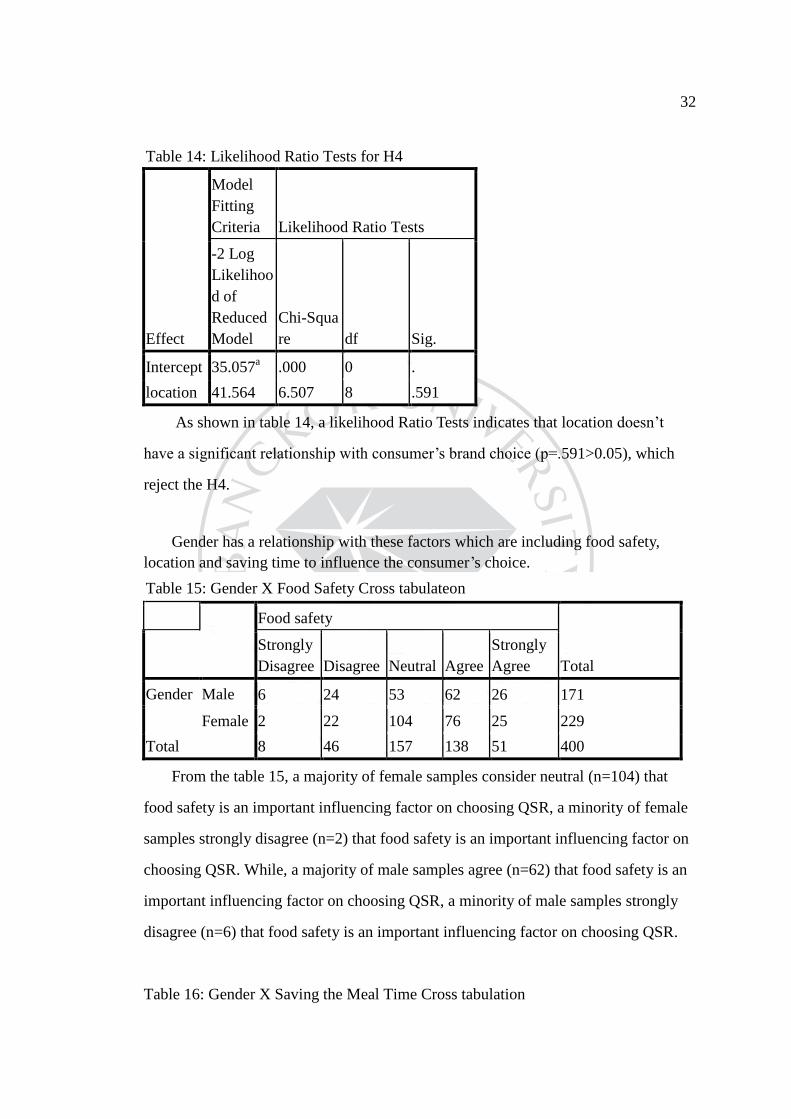
To test hypothesis 4, a likelihood Ratio Tests has been used.
32
Table 14: Likelihood Ratio Tests for H4
Effect
Model
Fitting
Criteria Likelihood Ratio Tests
-2 Log
Likelihoo
d of
Reduced
Model
Chi-Squa
re df Sig.
Intercept 35.057a .000 0 .
location 41.564 6.507 8 .591
As shown in table 14, a likelihood Ratio Tests indicates that location doesn’t
have a significant relationship with consumer’s brand choice (p=.591>0.05), which
reject the H4.
Gender has a relationship with these factors which are including food safety,
location and saving time to influence the consumer’s choice.
Table 15: Gender X Food Safety Cross tabulateon
Food safety
Total
Strongly
Disagree Disagree Neutral Agree
Strongly
Agree
Gender Male 6 24 53 62 26 171
Female 2 22 104 76 25 229
Total 8 46 157 138 51 400
From the table 15, a majority of female samples consider neutral (n=104) that
food safety is an important influencing factor on choosing QSR, a minority of female
samples strongly disagree (n=2) that food safety is an important influencing factor on
choosing QSR. While, a majority of male samples agree (n=62) that food safety is an
important influencing factor on choosing QSR, a minority of male samples strongly
disagree (n=6) that food safety is an important influencing factor on choosing QSR.
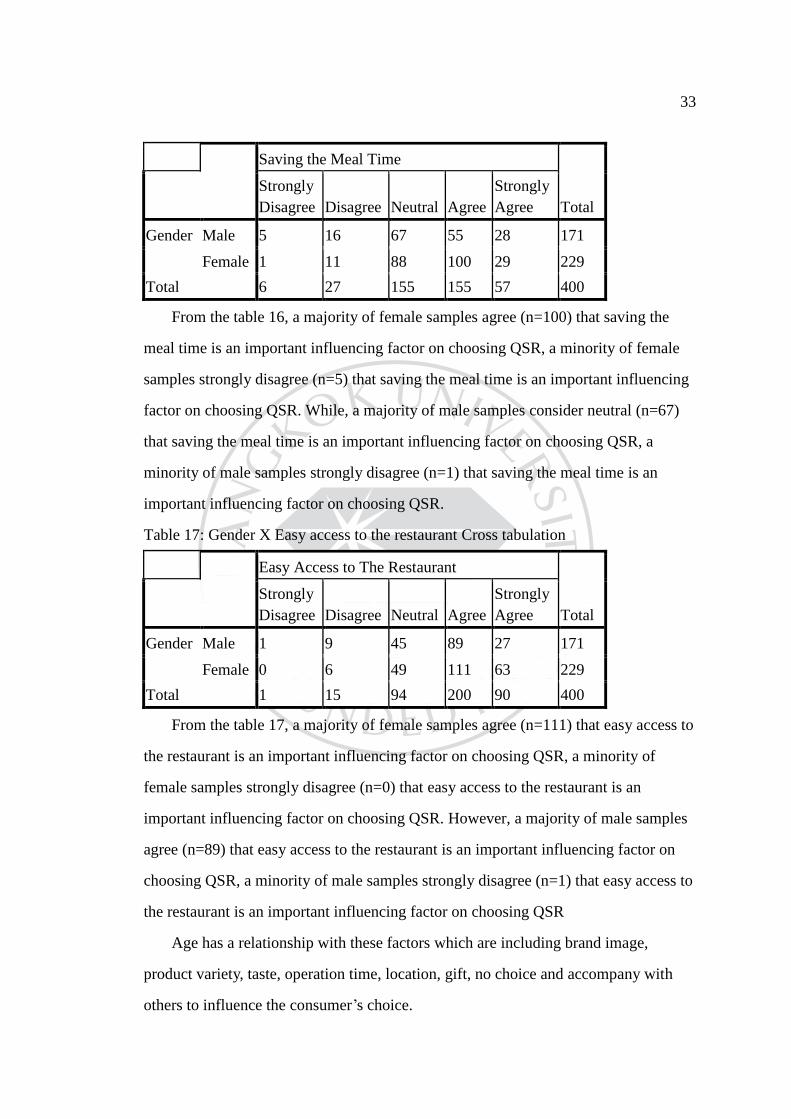
Table 16: Gender X Saving the Meal Time Cross tabulation
33
Saving the Meal Time
Total
Strongly
Disagree Disagree Neutral Agree
Strongly
Agree
Gender Male 5 16 67 55 28 171
Female 1 11 88 100 29 229
Total 6 27 155 155 57 400
From the table 16, a majority of female samples agree (n=100) that saving the
meal time is an important influencing factor on choosing QSR, a minority of female
samples strongly disagree (n=5) that saving the meal time is an important influencing
factor on choosing QSR. While, a majority of male samples consider neutral (n=67)
that saving the meal time is an important influencing factor on choosing QSR, a
minority of male samples strongly disagree (n=1) that saving the meal time is an
important influencing factor on choosing QSR.
Table 17: Gender X Easy access to the restaurant Cross tabulation
Easy Access to The Restaurant
Total
Strongly
Disagree Disagree Neutral Agree
Strongly
Agree
Gender Male 1 9 45 89 27 171
Female 0 6 49 111 63 229
Total 1 15 94 200 90 400
From the table 17, a majority of female samples agree (n=111) that easy access to
the restaurant is an important influencing factor on choosing QSR, a minority of
female samples strongly disagree (n=0) that easy access to the restaurant is an
important influencing factor on choosing QSR. However, a majority of male samples
agree (n=89) that easy access to the restaurant is an important influencing factor on
choosing QSR, a minority of male samples strongly disagree (n=1) that easy access to
the restaurant is an important influencing factor on choosing QSR
Age has a relationship with these factors which are including brand image,
product variety, taste, operation time, location, gift, no choice and accompany with
others to influence the consumer’s choice.
34
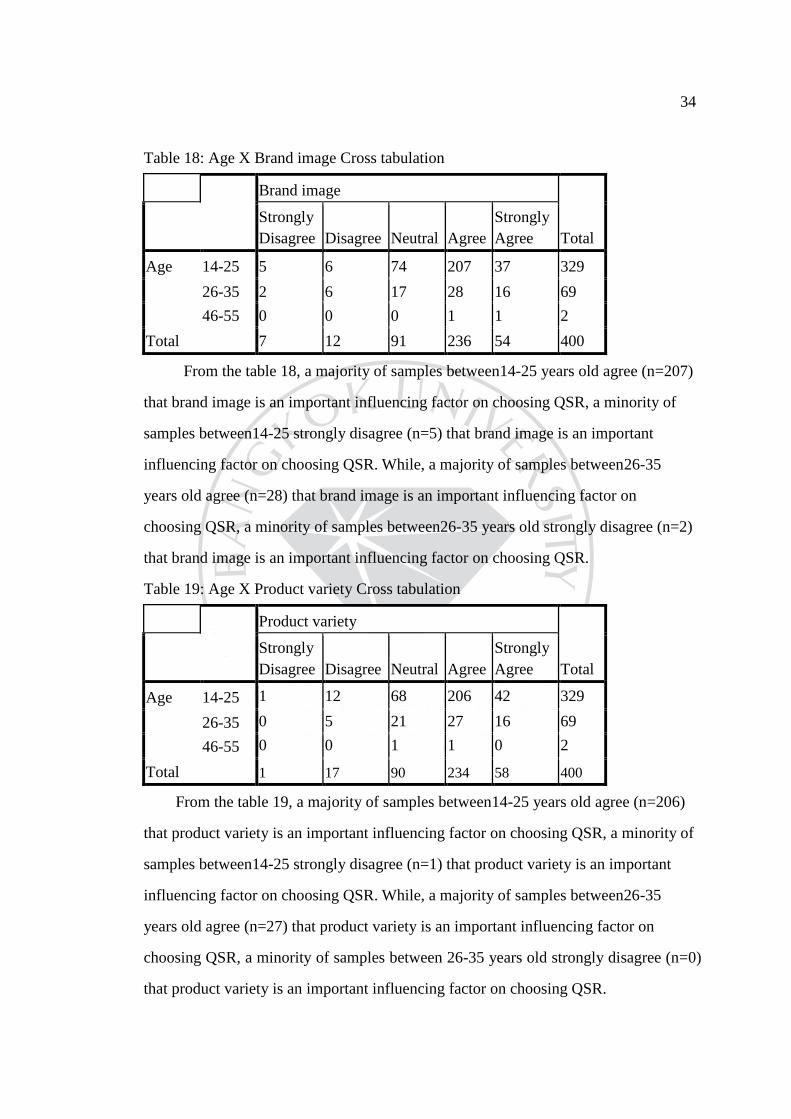
Table 18: Age X Brand image Cross tabulation
Brand image
Total
Strongly
Disagree Disagree Neutral Agree
Strongly
Agree
Age 14-25 5 6 74 207 37 329
26-35 2 6 17 28 16 69
46-55 0 0 0 1 1 2
Total 7 12 91 236 54 400
From the table 18, a majority of samples between14-25 years old agree (n=207)
that brand image is an important influencing factor on choosing QSR, a minority of
samples between14-25 strongly disagree (n=5) that brand image is an important
influencing factor on choosing QSR. While, a majority of samples between26-35
years old agree (n=28) that brand image is an important influencing factor on
choosing QSR, a minority of samples between26-35 years old strongly disagree (n=2)
that brand image is an important influencing factor on choosing QSR.
Table 19: Age X Product variety Cross tabulation
Product variety
Total
Strongly
Disagree Disagree Neutral Agree
Strongly
Agree
Age 14-25 1 12 68 206 42 329
26-35 0 5 21 27 16 69
46-55 0 0 1 1 0 2
Total 1 17 90 234 58 400
From the table 19, a majority of samples between14-25 years old agree (n=206)
that product variety is an important influencing factor on choosing QSR, a minority of
samples between14-25 strongly disagree (n=1) that product variety is an important
influencing factor on choosing QSR. While, a majority of samples between26-35
years old agree (n=27) that product variety is an important influencing factor on
choosing QSR, a minority of samples between 26-35 years old strongly disagree (n=0)
that product variety is an important influencing factor on choosing QSR.
35
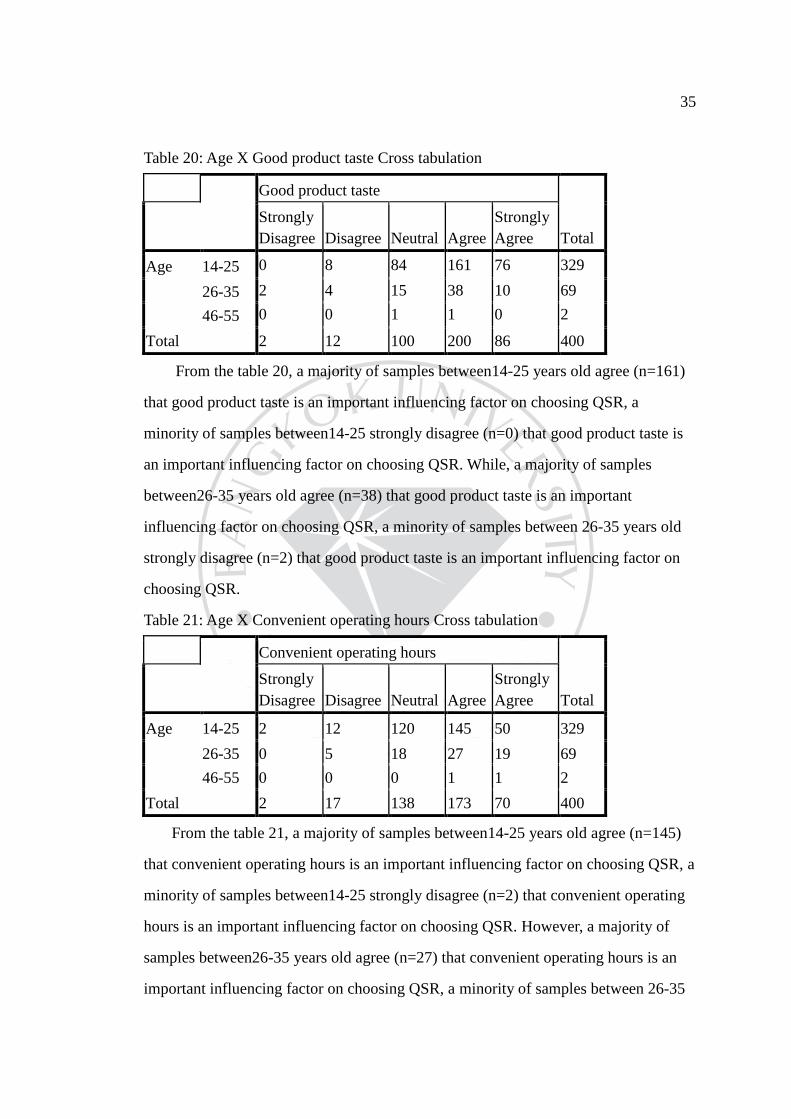
Table 20: Age X Good product taste Cross tabulation
Good product taste
Total
Strongly
Disagree Disagree Neutral Agree
Strongly
Agree
Age 14-25 0 8 84 161 76 329
26-35 2 4 15 38 10 69
46-55 0 0 1 1 0 2
Total 2 12 100 200 86 400
From the table 20, a majority of samples between14-25 years old agree (n=161)
that good product taste is an important influencing factor on choosing QSR, a
minority of samples between14-25 strongly disagree (n=0) that good product taste is
an important influencing factor on choosing QSR. While, a majority of samples
between26-35 years old agree (n=38) that good product taste is an important
influencing factor on choosing QSR, a minority of samples between 26-35 years old
strongly disagree (n=2) that good product taste is an important influencing factor on
choosing QSR.
Table 21: Age X Convenient operating hours Cross tabulation
Convenient operating hours
Total
Strongly
Disagree Disagree Neutral Agree
Strongly
Agree
Age 14-25 2 12 120 145 50 329
26-35 0 5 18 27 19 69
46-55 0 0 0 1 1 2
Total 2 17 138 173 70 400
From the table 21, a majority of samples between14-25 years old agree (n=145)
that convenient operating hours is an important influencing factor on choosing QSR, a
minority of samples between14-25 strongly disagree (n=2) that convenient operating
hours is an important influencing factor on choosing QSR. However, a majority of
samples between26-35 years old agree (n=27) that convenient operating hours is an
important influencing factor on choosing QSR, a minority of samples between 26-35
36
years old strongly disagree (n=0) that convenient operating hours is an important
influencing factor on choosing QSR. The difference is the more samples
between14-25 years old consider it neutral rather than strongly agree, which is
opposite the result of samples between 26-35 years old.
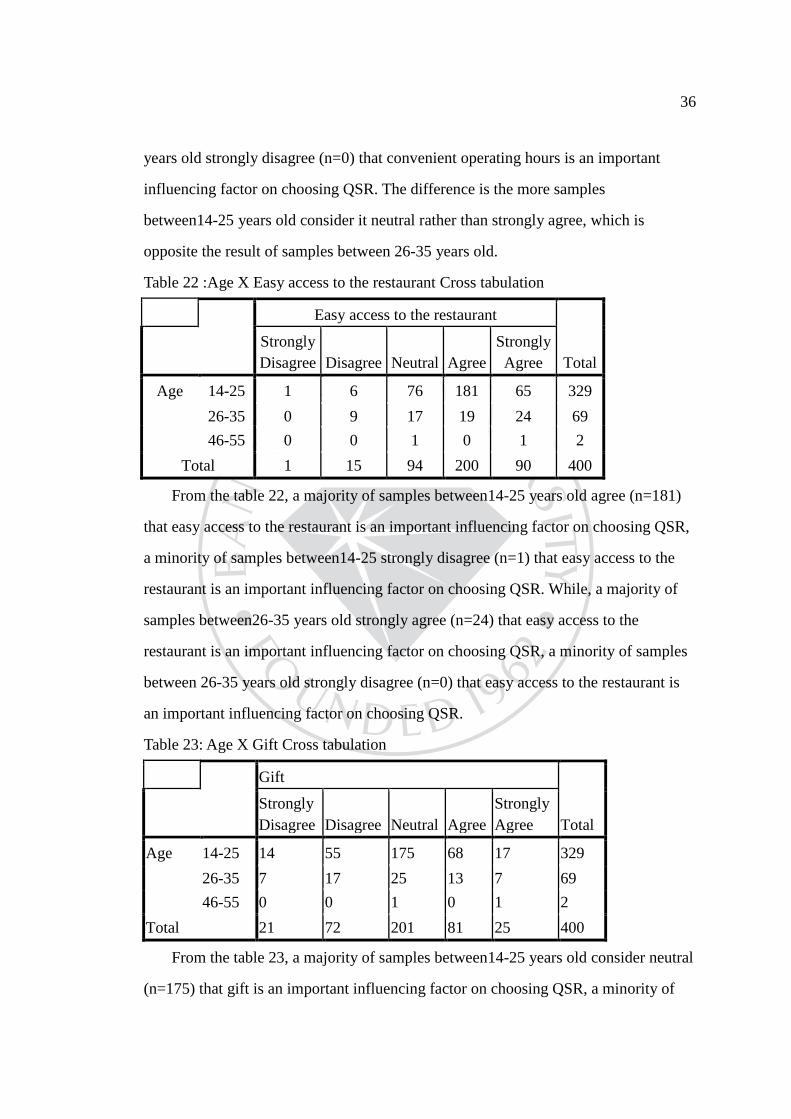
Table 22 :Age X Easy access to the restaurant Cross tabulation
Easy access to the restaurant
Total
Strongly
Disagree Disagree Neutral Agree
Strongly
Agree
Age 14-25 1 6 76 181 65 329
26-35 0 9 17 19 24 69
46-55 0 0 1 0 1 2
Total 1 15 94 200 90 400
From the table 22, a majority of samples between14-25 years old agree (n=181)
that easy access to the restaurant is an important influencing factor on choosing QSR,
a minority of samples between14-25 strongly disagree (n=1) that easy access to the
restaurant is an important influencing factor on choosing QSR. While, a majority of
samples between26-35 years old strongly agree (n=24) that easy access to the
restaurant is an important influencing factor on choosing QSR, a minority of samples
between 26-35 years old strongly disagree (n=0) that easy access to the restaurant is
an important influencing factor on choosing QSR.
Table 23: Age X Gift Cross tabulation
Gift
Total
Strongly
Disagree Disagree Neutral Agree
Strongly
Agree
Age 14-25 14 55 175 68 17 329
26-35 7 17 25 13 7 69
46-55 0 0 1 0 1 2
Total 21 72 201 81 25 400
From the table 23, a majority of samples between14-25 years old consider neutral
(n=175) that gift is an important influencing factor on choosing QSR, a minority of

37
samples between14-25 old strongly disagree (n=14) that gift is an important
influencing factor on choosing QSR. However, a majority of samples between26-35
years old consider neutral (n=25) that gift is an important influencing factor on
choosing QSR, a minority of samples between 26-35 years old strongly disagree (n=7)
that gift is an important influencing factor on choosing QSR.
Table 24: Age X No alternative choice Cross tabulation
No alternative choice
Total
Strongly
Disagree Disagree Neutral Agree
Strongly
Agree
Age 14-25 6 40 170 94 19 329
26-35 5 12 27 15 10 69
46-55 0 0 0 1 1 2
Total 11 52 197 110 30 400
From the table 24, a majority of samples between14-25 years old consider neutral
(n=170) that no alternative choice is an important influencing factor on choosing QSR,
a minority of samples between14-25 old strongly disagree (n=6) that no alternative
choice is an important influencing factor on choosing QSR. However, a majority of
samples between26-35 years old consider neutral (n=27) that no alternative choice is
an important influencing factor on choosing QSR, a minority of samples between
26-35 years old strongly disagree (n=5) that no alternative choice is an important
influencing factor on choosing QSR.
Table 25: Age X To accompany with others Cross tabulation
To accompany with others
Total
Strongly
Disagree Disagree Neutral Agree
Strongly
Agree
Age 14-25 2 21 172 113 21 329
26-35 2 12 21 28 6 69
46-55 0 0 1 0 1 2
Total 4 33 194 141 28 400
From the table 25, a majority of samples between14-25 years old consider neutral
38
(n=172) that to accompany with others is an important influencing factor on choosing
QSR, a minority of samples between14-25 old strongly disagree (n=2) that to
accompany with others is an important influencing factor on choosing QSR. However,
a majority of samples between 26-35 years old agree (n=28) that to accompany with
others is an important influencing factor on choosing QSR, a minority of samples
between 26-35 years old strongly disagree (n=5) that to accompany with others is an
important influencing factor on choosing QSR.
Income has a relationship with these factors which are including the brand image,
operation time, delivery service and gift to influence the consumer’s choice.
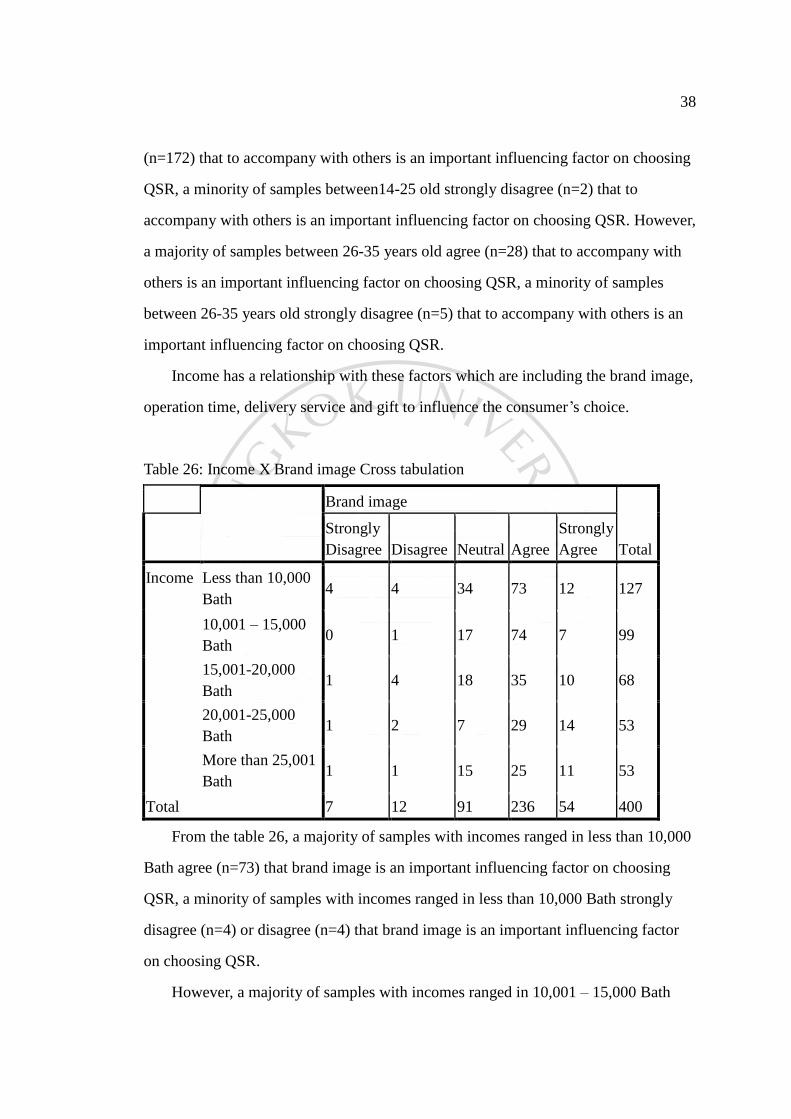
Table 26: Income X Brand image Cross tabulation
Brand image
Total
Strongly
Disagree Disagree Neutral Agree
Strongly
Agree
Income Less than 10,000
Bath 4 4 34 73 12 127
10,001 – 15,000
Bath 0 1 17 74 7 99
15,001-20,000
Bath 1 4 18 35 10 68
20,001-25,000
Bath 1 2 7 29 14 53
More than 25,001
Bath 1 1 15 25 11 53
Total 7 12 91 236 54 400
From the table 26, a majority of samples with incomes ranged in less than 10,000
Bath agree (n=73) that brand image is an important influencing factor on choosing
QSR, a minority of samples with incomes ranged in less than 10,000 Bath strongly
disagree (n=4) or disagree (n=4) that brand image is an important influencing factor
on choosing QSR.
However, a majority of samples with incomes ranged in 10,001 – 15,000 Bath

39
agree (n=74) that brand image is an important influencing factor on choosing QSR, a
minority of samples with incomes ranged in 10,001 – 15,000 Bath strongly disagree
(n=0) that brand image is an important influencing factor on choosing QSR, as well as
the samples with incomes ranged in 15,001-20,000 Bath, 20,001-25,000 Bath, and
more than 25,001 Bath. The minority samples with incomes ranged in 20,001-25,000
Bath rather strongly agree (n=14) than consider neutral (n=7) that brand image is an
important influencing factor on choosing QSR, which is different with other income
groups.
Table 27: Income X Easy access to the restaurant Cross tabulation
Easy access to the restaurant
Total
Strongly
Disagree Disagree Neutral Agree
Strongly
Agree
Income Less than 10,000
Bath 0 2 25 78 22 127
10,001 – 15,000
Bath 0 2 22 58 17 99
15,001-20,000
Bath 1 5 21 26 15 68
20,001-25,000
Bath 0 3 15 20 15 53
More than 25,001
Bath 0 3 11 18 21 53
Total 1 15 94 200 90 400
From the table 27, a majority of samples with incomes ranged in less than 10,000
Bath agree (n=78) that easy access to the restaurant is an important influencing factor
on choosing QSR, a minority of samples with incomes ranged in less than 10,000
Bath strongly disagree (n=0) that brand image is an important influencing factor on
choosing QSR, as same as other incomes group. The minority samples with incomes
ranged in more than 25,001 Bath rather strongly agree (n=21) than consider neutral
(n=11) that easy access to the restaurant is an important influencing factor on
40
choosing QSR, which is different with the samples with incomes ranged in less than
10,000 Bath , 15,001-20,000 Bath and 20,001-25,000 Bath.
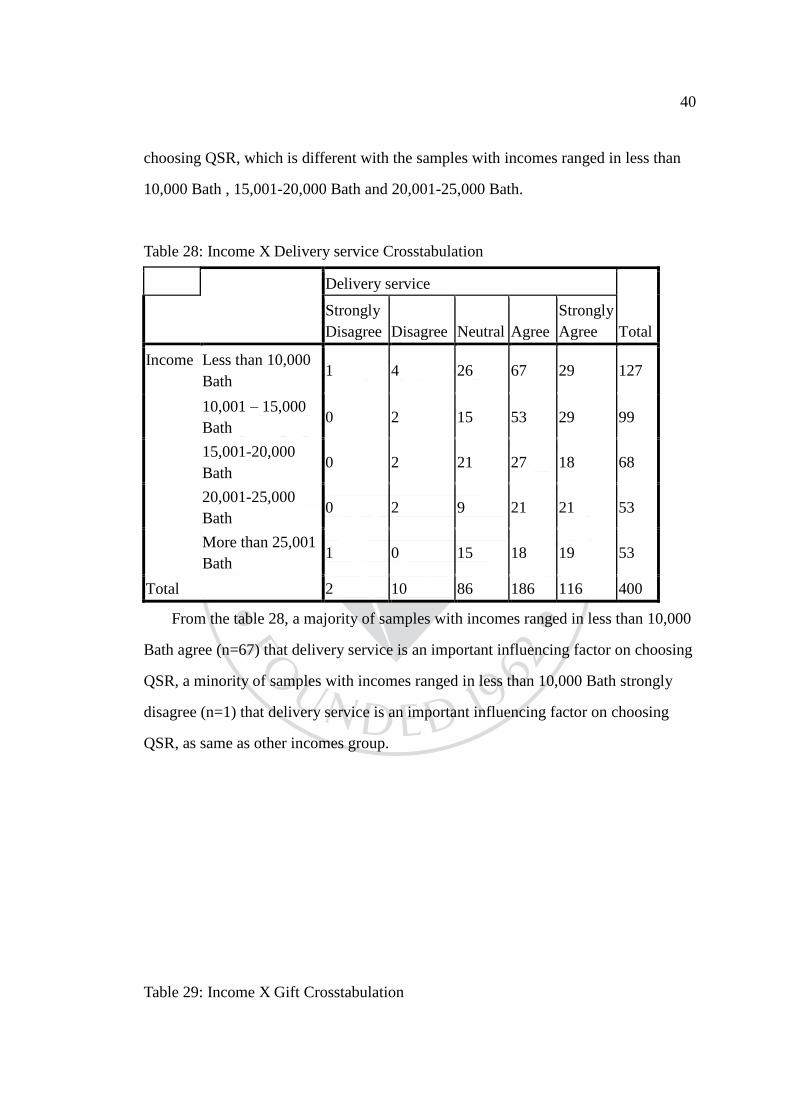
Table 28: Income X Delivery service Crosstabulation
Delivery service
Total
Strongly
Disagree Disagree Neutral Agree
Strongly
Agree
Income Less than 10,000
Bath 1 4 26 67 29 127
10,001 – 15,000
Bath 0 2 15 53 29 99
15,001-20,000
Bath 0 2 21 27 18 68
20,001-25,000
Bath 0 2 9 21 21 53
More than 25,001
Bath 1 0 15 18 19 53
Total 2 10 86 186 116 400
From the table 28, a majority of samples with incomes ranged in less than 10,000
Bath agree (n=67) that delivery service is an important influencing factor on choosing
QSR, a minority of samples with incomes ranged in less than 10,000 Bath strongly
disagree (n=1) that delivery service is an important influencing factor on choosing
QSR, as same as other incomes group.
Table 29: Income X Gift Crosstabulation

41
Gift
Total
Strongly
Disagree Disagree Neutral Agree
Strongly
Agree
Income Less than 10,000
Bath 6 24 66 27 4 127
10,001 – 15,000
Bath 1 13 49 29 7 99
15,001-20,000
Bath 5 10 33 14 6 68
20,001-25,000
Bath 4 12 27 6 4 53
More than 25,001
Bath 5 13 26 5 4 53
Total 21 72 201 81 25 400
From the table 29, a majority of samples with incomes ranged in less than
10,000 Bath consider neutral (n=66) that gift is an important influencing factor on
choosing QSR, a minority of samples with incomes ranged in less than 10,000 Bath
strongly disagree (n=6) that gift is an important influencing factor on choosing QSR,
as same as other incomes group
To test hypotheses 5 and 6, an multinomial logit to figure out the result of

42
hypotheses
Table 30: Multinomial Logit Model Burger King VS McDonalds’& KFC
2. Which brand do you most
prefer? B
Std.
Error Wald df Sig.
KFC [Food safety
=Neutral] 1.293 .656 3.885 1 .049
[Convenient
service
=disagree]
-2.954 1.279 5.330 1 .021
[Favorable
price=Disagree] -1.842 .855 4.645 1 .031
McDonalds ’ Intercept 1.178 1.162 1.029 1 .310
[Good product
taste=Neutral] 1.476 .621 5.657 1 .017
[Good product
taste=agree] 1.106 .522 4.495 1 .034
[Ambience=
Neutral] -2.216 1.130 3.849 1 .050
[Convenient
service
=disagree]
-2.725 1.194 5.209 1 .022
From table 30, the result reveals that food safety in the restaurants is significant
indifferent in choosing between KFC and Burger King (p=0.049<0.05), which reject
the hypothesis 5. Consumer disagree that convenient service in the restaurants is
significant important in choosing KFC over Burger King (p=0.021<0.05), which also
reject the hypothesis 5. Consumer disagree that favorable price is significant in
choosing KFC over Burger King (p=0.031<0.05), which reject the hypothesis 5.
There is no other significant p value to support the hypothesis 5, thus hypothesis 5 is
rejected.
From table 30, the result reveals that that good product taste in the restaurants is
significant different in choosing McDonalds’ over Burger King (p=0.034<0.05),
which support the hypothesis 6. While ambience in the restaurants is significant

43
indifferent in choosing between McDonalds’ and Burger King (p=0.050=0.05), which
reject the hypothesis 6. Consumer disagree that convenient service in the restaurants is
significant important in choosing McDonalds’ over Burger King (p=0.021<0.05),
which also reject the hypothesis 6.
4.4 Other Findings
Table 31: life-style variables for each brand
Brand name life-style variables Frequency %
KFC Sport 48 28.4
Reading 43 25.4
movie 93 55
Music 70 41.4
shopping 55 32.5
Sleeping 59 34.9
drinking 34 20.1
others 9 5.3
McDonald’s Sport 50 32.7
Reading 21 13.7
movie 73 47.7
Music 63 41.2
shopping 35 39.3
Sleeping 38 23.8
drinking 36 23.5
others 6 3.9
Burger king
Sport 36 46.2
Reading 20 22.5
(Continued)
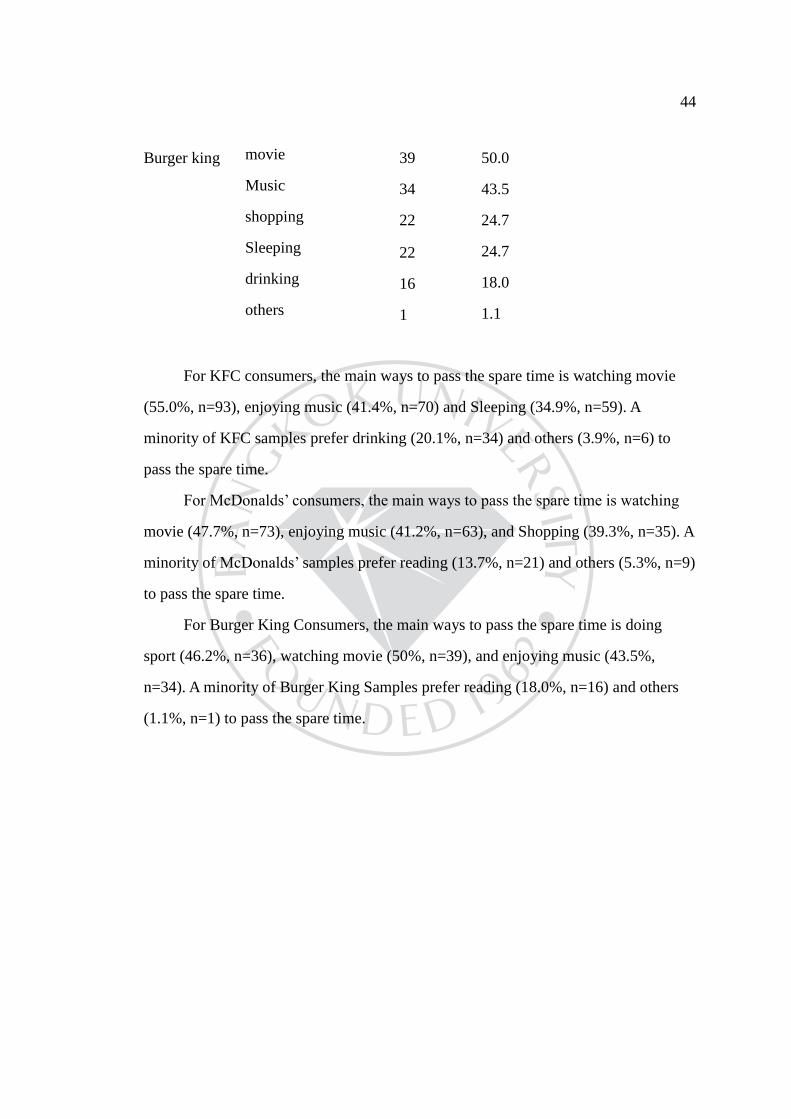
Table 31 (Continued): life-style variables for each brand
44
Burger king
movie 39 50.0
Music 34 43.5
shopping 22 24.7
Sleeping 22 24.7
drinking 16 18.0
others 1 1.1
For KFC consumers, the main ways to pass the spare time is watching movie
(55.0%, n=93), enjoying music (41.4%, n=70) and Sleeping (34.9%, n=59). A
minority of KFC samples prefer drinking (20.1%, n=34) and others (3.9%, n=6) to
pass the spare time.
For McDonalds’ consumers, the main ways to pass the spare time is watching
movie (47.7%, n=73), enjoying music (41.2%, n=63), and Shopping (39.3%, n=35). A
minority of McDonalds’ samples prefer reading (13.7%, n=21) and others (5.3%, n=9)
to pass the spare time.
For Burger King Consumers, the main ways to pass the spare time is doing
sport (46.2%, n=36), watching movie (50%, n=39), and enjoying music (43.5%,
n=34). A minority of Burger King Samples prefer reading (18.0%, n=16) and others
(1.1%, n=1) to pass the spare time.
CHAPTER 5
DISCUSSION
This chapter will conclude and interpret the result of research. The limitation
will also be described and the suggestion for further study will be given.
5.1 Conclusion
As fast food is one of the worlds’s fastest growing food types, a great amount
of researchers have been done to examine the factors influencing on the consumer
choice of quick service restaurant. Previous researchers have examined the consumer
of quick service restaurant and found the common factors that influence on choosing
the QSR, for instance, food quality, taste, price, service quality, brand image (Auty,
1992; Lee and Ulgado, 1997; Clarke &Wood, 1998; Keillor, Hult, and Kandemir,
2004; Monika and Morven, 2005; Qin and Prybutok, 2008;). The objective of this
study is to exam the consumer’s preference and perception toward quick service
restaurant KFC, McDonald’s and Burger King in Bangkok, especially, to study the
factors influencing on the consumer choice of quick service restaurant KFC,
McDonald’s and Burger King in Bangkok.
To achieve the research objectives, two research questions were raised as follow:
1 What are the important factors influencing the consumer choice of Quick
Service Restaurant?
According to the data collected in this study, Age has significant relationship
with the consumer’s choice (p=0.048<0.05), which support the H1.
Income has significant relationship with the consumer’s choice
(P=0.022<0.05), which support the H2.
Gender doesn’t have a significant relationship with consumer’s brand choice
(p=.156>0.05), which reject the H3.
The majority of the samples aged between 14-25 years old (82.2%, n=329). A
majority of samples who prefer KFC aged between 14-25 years old, as same as
McDonalds’ and Burger King, young consumer more like fast food.
46
Regarding to the incomes, a majority of the samples incomes ranged in Less
than 10,000 Bath, instead a minority of samples incomes ranged in
15,001-20,000Bath (17%, n=68), 20,001-25,000 Bath (13.2%, n=53), and more than
25,001 Bath (13.2%%, n=53). A majority of samples who prefer KFC and McDonalds’
ranged in less than 10,000 Bath, meanwhile, a majority of samples who prefer Burger
King ranged in 15,001-20,000 Bath.
Thus, gender doesn’t have significant relationship with the consumer choice of
quick service restaurant, while age and incomes has significant relationship with the
consumer choice of quick service restaurant. The data can be interpreted as people of
new generation or on the middle and low incomes prefer more quick service
restaurant in this research, consumer of Burger King are higher-earning than KFC and
McDonalds’ .
According to the data collected, location doesn’t have a significant
relationship with consumer’s brand choice (p=.591>0.05), which reject the H4.
The results that regarding to the factors which influence the consumer choice,
except no alternative choice (Mean=3.24, SD=.871), and gift (Mean=3.04, SD=.918)
fall in the medium average level in Likert scale questions, the other factors fall in the
high average level, therefore none fall in the low average. The result predict that
comparing with other factors, no alternative choice and gift have less influence on the
consumer’s choice and delivery service (Mean=4.01, SD=.807), easy access to the
restaurant (Mean=3.91, SD=.791) and good product taste (Mean=3.89, SD=.787) are
the top 3 primary factors influencing the choice of QSR. The result can be interpreter.
Gender has a relationship with the factors of food safety, location, and saving
times) which influence the consumer’s choice.
a. The majority of female samples consider neutral (n=104) that food safety
is an important influencing factor on choosing QSR, instead, a majority of male
samples agree (n=62) that food safety is an important influencing factor on choosing
QSR.
47
b. The majority of female samples consider neutral (n=104) that saving the
meal time is an important influencing factor on choosing QSR, instead, a majority of
male samples agree (n=62) that saving the meal time is an important influencing
factor in choosing QSR.
c. The majority of female samples agree (n=111) that easy access to the
restaurant is an important influencing factor on choosing QSR as same as male
samples.
Age has a relationship with the factors of brand image, product variety, taste,
operation time, location, gift, no choice and accompany with others, which influence
the consumer choice.
a. The majority of samples between14-25 years old agree (n=207) that brand
image is an important influencing factor on choosing QSR, instead, a majority of
samples between26-35 years old agree (n=28) that brand image is an important
influencing factor on choosing QSR.
b. The majority of samples between14-25 years old agree (n=206) that product
variety is an important influencing factor on choosing QSR, as same as other group.
c. The majority of samples between14-25 years old agree (n=161) that good
product taste is an important influencing factor on choosing QSR, as same as other
group.
d. The majority of samples between14-25 years old agree (n=145) that
convenient operating hours is an important influencing factor on choosing QSR, as
same as other group. The difference is the more samples between14-25 years old
consider it neutral rather than strongly agree, which is opposite the result of samples
between 26-35 years old.
e. The majority of samples between14-25 years old agree (n=181) that easy
access to the restaurant is an important influencing factor on choosing QSR, and a
majority of samples between26-35 years old strongly agree (n=24) that easy access to
the restaurant is an important influencing factor on choosing QSR.

48
f. The majority of samples between14-25 years old consider neutral (n=175)
that gift is an important influencing factor on choosing QSR, as same as other group.
g. The majority of samples between14-25 years old consider neutral (n=172)
that to accompany with others is an important influencing factor on choosing QSR,
while a majority of samples between26-35 years old agree (n=28) that to accompany
with others is an important influencing factor on choosing QSR.
Income has a relationship with the factors of brand image, operation time,
delivery service, gift, which influence the consumer’s choice.
a. The majority of samples with incomes ranged in less than 10,000 Bath agree
(n=73) that brand image is an important influencing factor on choosing QSR, as same
as other incomes group.
b. The majority of samples with incomes ranged in less than 10,000 Bath
agree (n=78) that easy access to the restaurant is an important influencing factor on
choosing QSR, as same as other incomes group.
c. The majority of samples with incomes ranged in less than 10,000 Bath agree
(n=67) that delivery service is an important influencing factor on choosing QSR, as
same as other incomes group.
d. The majority of samples with incomes ranged in less than 10,000 Bath
consider neutral (n=66) that gift is an important influencing factor on choosing QSR, ,
as same as other incomes group.
2 What is the difference among the factors influencing on the consumer choice
of KFC, McDonald’s and Burger King?
According to the data collected in this study, food safety in the restaurants is
significant indifferent in choosing between KFC and Burger King (p=0.049<0.05),
which reject the hypothesis 6. Consumer disagree that convenient service in the
restaurants is significant important in choosing KFC over Burger King
(p=0.021<0.05), which also reject the hypothesis 6. There is no other significant p
49
value to support the hypothesis 6, thus hypothesis 6 is rejected. Therefore, the data
result can be interpreted as there is no difference between the factors influencing on
the consumer choice of KFC and Burger King.
The data result reveals that that good product taste in the restaurants is
significant different in choosing McDonalds’ over Burger King (p=0.034<0.05),
which support the hypothesis 7. While ambience in the restaurants is significant
indifferent in choosing between McDonalds’ and Burger King (p=0.050=0.05), which
reject the hypothesis 7. Consumer disagree that convenient service in the restaurants
is significant important in choosing McDonalds’ over Burger King (p=0.021<0.05),
which also reject the hypothesis 7. Therefore, good product taste significantly
influence consumer’s choice on McDonalds’ than Burger King, while other factors
have not differences in influencing on consumer’s choice.
5.2 Discussion
As the economic develop and major changes in lifestyle, education, income of
the Thailand consumers in the two last decades have encouraged the young consumers
to eat out. Factors such as food taste, price, service, time cost, consumers’ attitudes,
preferences play an important role in influencing the choice of QSR.
Consumer acceptance of food served by QSR is critically important for the
future growth of quick service restaurant in any economy. According to these study, as
the primary reason that people choose QSR are convenient location, delivery service,
consumer or food taste, while no alternative reason and gift are not important reason,
thus Consumer demand less time cost and more convenient location due to the fast
pace in modern life and still visit fast food outlets for fun, change or entertaining their
friends but certainly not as a substitute of homemade food.
Cheap food and speedy service are still the traditional factors emphasized in
consumer preference. Therefore, value for money is another important factor in
differentiating a business from its competitors. The product taste and product variety
50
are also the common factors which influencing the consumer choice, the quick service
restaurant marketers can make the menu attractive by improving the food taste and
keeping food innovation in the cuisine.
A comparison of consumer’s choice among different gender indicates that
female consumers are considering less important than male samples in food safety and
time cost. Both genders consider convenient location is important.
A comparison of consumer’s choice among different ages indicates that all the
age groups consider brand image, product variety, taste, operation time, location are
important. But consumers age between14-25 years old consider less important than
consumers between 26-35 years old in accompany with others. That might because
consumer age between14-25 years old engage more in social activities.
A comparison of consumer’s choice among different incomes indicates there is
no difference in the different attributes. All incomes group consider brand image,
operation time, delivery service are important factors.
A comparison of McDonalds, KFC and Burger King clearly indicates that
there is no difference in the different attributes, except good product taste which was
comparatively found better in McDonalds than Burger king.
Because of the change in lifestyle and the more and more consumer consider
health status, consumers demand more and more information related to hygiene issues
and nutritional values of the products of fast food outlets. The restaurateurs can make
an attempt to increase revenues by introducing special menu offers like weight
watchers.
5.3 Limitation and Suggestion for Future study
One limitation for the recent study is the sample. The data were collected in
several days and the age concentrated between 14-36 years old. The result might be
more accurate if survey lasted a long term and age distributed more reasonable.
Second, because the questionnaire was sent in English, the consumer were

51
demand to have ability to read English, the sample might concentrate the consumer
well educated and that might affects the truthful answers of participants because of the
language understanding problem.
However, a more detailed experimental analysis would be able to determine
the effect of perceptual attributes on consumer demand as well. . Specific qualities of
taste, consumer self-esteem, the reputation of each restaurant and other
non-measurable may be relevant to a consumer choice toward QSR.
For the further study, to measure the consumer choice, consumer purchase
behavioral intention can be brought into the study, Consumer behavior can be defined
as the decision process and physical activity that individuals engage in while
evaluating, using or disposing goods and services. Behavioral variables include usage
rate and loyalty. According to the theory of planned behavior, consumer behavior is
determined by purchase intention, it benefit for investigating consumer behavior
through studying consumer purchase intention.
According to a widely accepted conceptualization, consumer satisfaction is “a
customer’s post-consumption evaluation of a product or service” (Mittal & Frennea
2010, p. 3) that occurs if the perceived performance of a product or service meets or
exceeds customers’ prior expectations (e.g., Bearden and Teel 1983; Oliver 1980,
2010). Generally, consumer satisfaction translates into steady or increasing company
sales. Therefore, businesses rely heavily on customer-satisfaction surveys to learn
about how they can improve their products and services to meet their customers'
expectations more accurately. Because of this, consumer satisfaction can be
introduced into the body of studying consumer perception in quick service restaurant
industry.
BIBLIOGRAPHY
Adams, R .(2005). “Fast Food, Obesity and Tort Reform: An Examination of Industry
Responsibility for Public Health”. Business and Society Review, 110 (3),
297-320.
Allport, G. W. (1935). Attitudes. In C. Murchison (Ed.), A handbook of social
psychology (pp. 798-844). New York: Russell & Russell.
Agnes, K.Y., Law, H.Y. V., & Zhao, X.D. (2004). “Modeling Repurchase Frequency
and Customer Satisfaction for Fast Food Outlets”. International
Journal of Quality and Reliability Management, Emerald Group
Publishing Limited, 21 (5), 545-563.
Anita,G. S. N.P .(2007). Consumer Perception About Fast Food In An Exploratory
Study. British Food Journal, 109 (2), 182-195.
Auty, S. (1992). Consumer choice and segmentation in the restaurant industry. The
Service Industries Journal , 12, 324–39.
Blythe,J. (2008). Essentials of marketing (4th
ed.). Upper Saddle River, New Jersey:
Financial Times/Prentice Hall.
Bender, A. E., & Bender, D. A. (1993). A Dictionary of food and nutrition (3rd
ed.).
Oxford: Oxford University Press.
Borden, N. H. (1964). The Concept of the Marketing Mix. Journal of Advertising
Research, 4, 2–7.
Booms, B. H., & Bitner, M. J. (1981). ‘Marketing strategies and organization
structures for service firms’, in Donnelly, J.H. and George, W.R. (eds.),
Marketing of Services. Chicago: American Marketing Association.
Bowman, S. A. (2005), “Agricultural Research”. Science Update, 53 (1), 23.
Brady, M. K. C. J., Robertson, & Cronin, J, J. (2001). Managing behavioral intentions
in diverse cultural environments: an investigation of service quality, service
value, and satisfaction for American and Ecuadorian fast-food customers.
Journal of International Management, 7 (2), 129-149.
53
Brown, K., Mcllveen, H. & Strugnell,C. (2000). “Nutritional Awareness and Food
Preferences of Young Consumers”. Nutrition & Food Science, 30 (5),
230-235.
Clark, M. A. & Wood, R.C. (1999). Consumer Loyalty in the Restaurant Industry: A
Preliminary Exploration of the Issues. British Food Journal, 101 (4), 317-327.
Davies, G. J. & Smith, J. L. (2004), “Fast Food Dietary Perspective”, Nutrition and
Food Science, 34 (2), 80-82.
Datamonitor. (2010). Fast food: Global industry guide. Retrieved from
http://www.reportbuyer.com/leisure_media/dining/fast_food/fast_food_global
_industry_guide.html.
Eagly, A.H., & Chaiken, S. (1993). The Psychology of Attitudes. New York: Harcourt
Brace Jovanovich.
Ergin, E. A., & Akbay, H. Ö. (2014). Factors Influencing Young Consumers’
Preferences of Domestic and International Fast Food Brands. Retrieved from
http://www.marketing-trends-congress.com/archives/2012/Materials/Papers/C
onsumer%20Behavior/AkagunErginOzdemirAkbay.pdf.
Global Restaurants Industry Profile. (2015). Restaurants Industry Profile: Global.
Hanson, R. (2002). “Turkey HRI Food Service Sector Report 2002”, USDA Foreign
Agricultural Service Gain Report. Retrieved from http://fas.usda.gov
Kara, A. E., Kaynak., & Kucukemiroglu, O. (1995). marketing strategies for fast-food
restaurants: a customer view. International Journal of Contemporary
Hospitality Management, 7 (4), 16-22.
Kardes S. N., Demiralp, Y., Dykeman, J., & Altan, T. (2012). "Determining a flow
stress curve with the LDH test". Stamping Journal, 16-17.
Keillor, B. D. G. T. M., Hult., & Kandemir, D. (2004). a study of service encounter in
eight countries. Journal of International Marketing, 12 (1), 9-35.
Kotler, P., Armstrong, G. & Tait, M. (2010). Principles of marketing: Global and
Southern African perspectives. Cape Town: Pearson Education South Africa
54
Kotler, P., Keller, K. L. (2012). Marketing management (14th
ed.), England: Prentice
Hall.
Lee, M., & Ulgado, F. M. ( 1997). Customer Evaluation of Fast-Food Services: A
Cross-National Comparison. The Journal of Services Marketing, 11 (1), 39-52.
Magrath, A.J. (1986). When Marketing Services, 4Ps Are Not Enough. Business
Horizons, 44-50.
Marai, G. (1994), “The Perception of Chinese Consumers on American Fast Food in
Beijing”. Retrieved from
http://thescholarship.ecu.edu/bitstream/handle/10342/3987/Tsao_ecu_0600M_
10704.pdf?sequence=1.
Maslow, A. H. (1943). A Theory of Human Motivation. Psychological Review, 50 (4),
370-396.
Maslow, A. (1943a). A theory of human motivation. Psychological Review, 50.
Maslow, A. H. (1943b). Preface to motivation theory. Psychosomatic Medicine, 5.
Maslow, A. H. (1948a). “Higher” and “lower” needs. Journal of Psychology, 25.
Maslow, A. H. (1948b). Some theoretical consequences of basic need gratification.
Journal of Personality, 16.
Maslow, A. H. (1967). A theory of metamotivation: the biological rooting of the
value-life. Journalof Humanistic Psychology, 7(2), 370-380.
Maslow, A. H. (1998). Maslow on management (D.C. Stephens & G.Heil, Eds.). New
York: Wiley.
McCarthy, E. J. (1964). Basic Marketing, a Managerial Approach. Homewood, III:
Richard D. Irwin, Inc.
McNeal, J. U., Stem, D. E. Jr., & Nelson, C. S. (1980). “Consumers’ nutritional
ratings of fast-food meals”, The Journal of Consumer Affairs, 14 (1), 165.
Mittal, V. & Carly, F. (2010). Customer Satisfaction: A Strategic Review and
Guidelines for Managers. Cambridge, MA: MSI Fast Forward Series,
Marketing Science Institute.
55
Mohammad, T., Barker, S., & Kandampully, J. (2005). Multicultural student
perceptions of fast food restaurant brands: An Australian study. Journal of
Hospitality and Leisure Marketing, 12(4), 93-117.
Monika, J. A., Schröder., & Morven, G., McEachern. (2005). “Fast Foods and Ethical
Consumer Value: A Focus on Mcdonald’s and KFC”. British Food Journal,
107 (4), 212-222.
Qin, H.V. Prybutok, R., & Zhao, Q. (2010). Perceived service quail in fast-food
restaurants: Empirical evidence from China. International Journal of Quality
and Reliability Management,27 (4), 424-437.
Parasuraman, A., Zeithaml, V. A., & Berry, L. L. (1985), “A Conceptual Model of
Service Quality and its Implication”. Journal of Marketing, 49, 41-50.
Solomon, M. (2014). Consumer Behavior – Buying, Having and Being. Upper Saddle
River: Prentice Hall.

APPENDIX

57
A questionnaire of influential factors of quick service restaurant
I.
1. Do you eat fast food?
A.YES B.NO
2. Which brand do you most prefer?
A. KFC B. McDonald’s C. Burger King
3. What’s your gender?
A. Male B. Female
4. How long are you living in Bangkok?
A. Less than 1 year B. 1-5 years C. 5-10 years
D. More than 10 years
5. What is your age range?
A. 14-25 B 26-35 C. 36-45 D.46-55 E. 55+
6. What is your marital status?
A. Single B. Divorced C. Married D. Widowed
7. What is your current occupation?
A. student B. Government Officers/employees of state enterprise
C. Individual companies D. Business owner E. Other ________
8. What is your highest education level?
A. under High School B. High school C. Bachelor Degree
D. Above Bachelor Degree
9. How much your monthly income?
A. Less than 10,000 Bath B. 10,001 – 15,000 Bath
C. 15,001-20,000 Bath D. 20,001-25,000 Bath
E. More than 25,001 Bath
10. What do you like to do in your spare time?
A. Sport B. Reading C. watching movie D. Listen to music
E. Shopping F. Sleeping G. Drinking/ Party H. Others
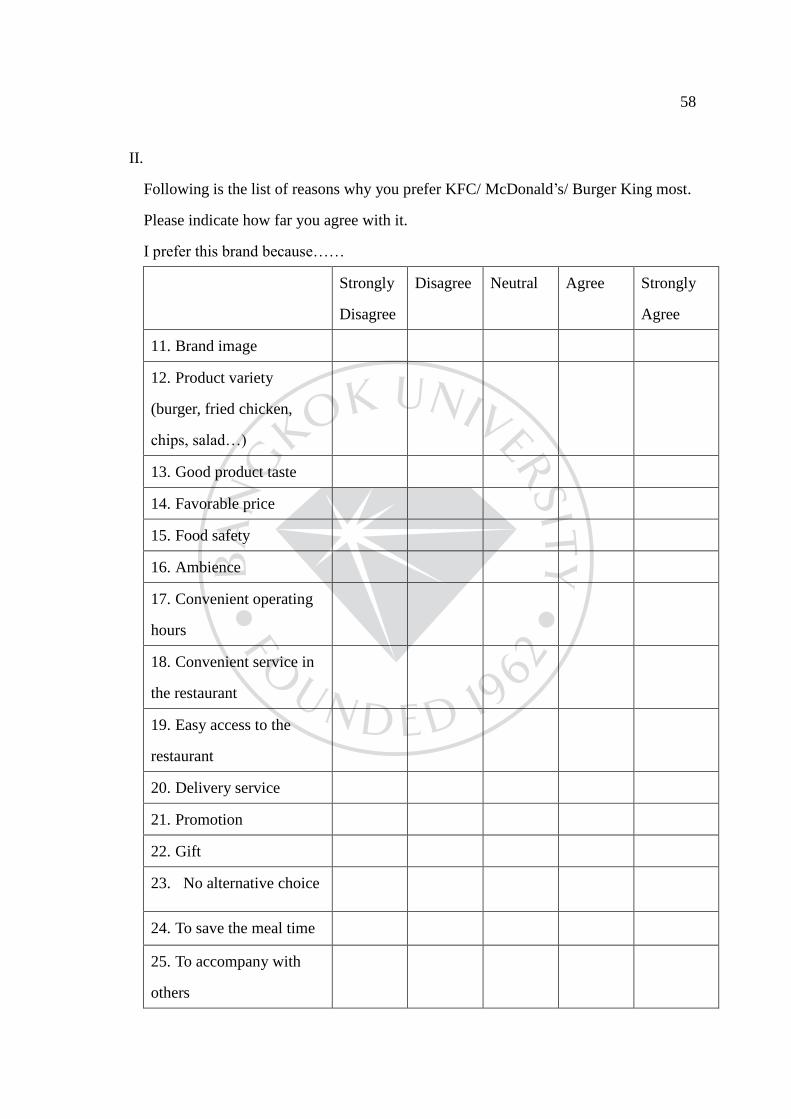
58
II.
Following is the list of reasons why you prefer KFC/ McDonald’s/ Burger King most.
Please indicate how far you agree with it.
I prefer this brand because……
Strongly
Disagree
Disagree Neutral Agree Strongly
Agree
11. Brand image
12. Product variety
(burger, fried chicken,
chips, salad…)
13. Good product taste
14. Favorable price
15. Food safety
16. Ambience
17. Convenient operating
hours
18. Convenient service in
the restaurant
19. Easy access to the
restaurant
20. Delivery service
21. Promotion
22. Gift
23. No alternative choice
24. To save the meal time
25. To accompany with
others

59
26. How much do you like fast food?
A. Strongly like B. like C. Neutral D. Unlike E. Strongly Unlike
27. How often do you eat fast food?
A.More than three times in one week B. Once or twice in one week
C. Once or twice in one month D. Once or twice in one year
28. What is the channel when you usually take the fast food?
A. Eating in the restaurant
B. Buying in the restaurant and getting take-out meals
C. Ordering delivery service
29. Which product variable do you like (multiple choice)?
A. burger B. fried chicken C. chips D. salad
E others ____________________
30. Do you consider yourself health conscious?
A. Always B. Frequently C. Sometimes
D. Infrequently E. Never
60
BIODATA
Name in full: Xin. Guan
Residential Address Tichapong Apartment, 3 soi poonsapsin ramkanheang road
24/12, huamark, bangkapi, Bangkok, 10240
Telephone No. 0909630463
Date of Birth 13 JAN 1991
Education: 2008-2012: Bachelor of international trade at Xiangsihu
College of Guangxi University for Nationalities.


![Jeremy Bentham (1748-1832) [1] - Utilitarianism Jeremy Bentham ( 1748–1832) -- and his preserved body in University College, London](https://img.pdfslide.us/doc/110x75/56649ebd5503460f94bc6100/jeremy-bentham-1748-1832-1-utilitarianism-jeremy-bentham-17481832.jpg)