Embed Size (px)
Citation preview
A SIMULATION BASED EVALUATION OF ACTIVE SURVEILLANCE PROTOCOL OPTIONS FOR THE
MOVEMENT OF BROILERS TO SLAUGHTER
Sasidhar Malladi a, J Todd Weaver b, Dave Halvorson a a University of Minnesota, Center for Animal Health and Food Safety
b United States Department of Agriculture, Animal Plant Health Inspection Service, Veterinary Services, Science Technology and Analysis Services, Center for Epidemiology and Animal Health
• Managed movement of broilers is critical for business continuity in an HPAI outbreak
• The unrecognized or unintentional movement of infectious birds from monitored flocks may result in further HPAI spread
• Pre-movement active surveillance is a key measure to increase confidence that HPAI infected broilers are not moved to processing
Background
2
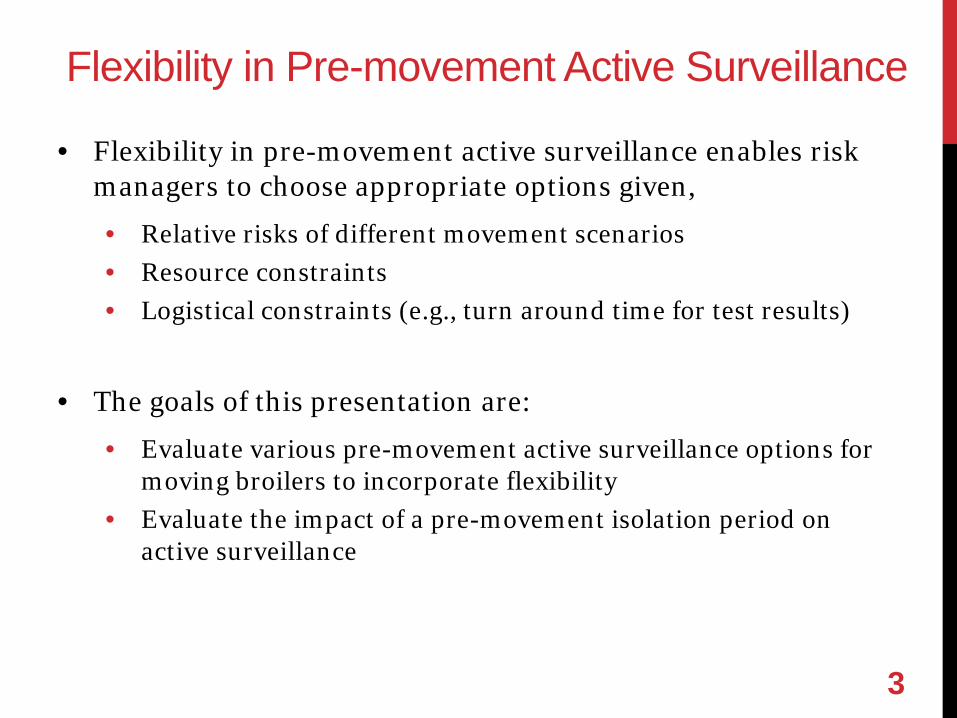
Flexibility in Pre-movement Active Surveillance
• Flexibility in pre-movement active surveillance enables risk managers to choose appropriate options given,
• Relative risks of different movement scenarios • Resource constraints • Logistical constraints (e.g., turn around time for test results)
• The goals of this presentation are:
• Evaluate various pre-movement active surveillance options for moving broilers to incorporate flexibility
• Evaluate the impact of a pre-movement isolation period on active surveillance
3
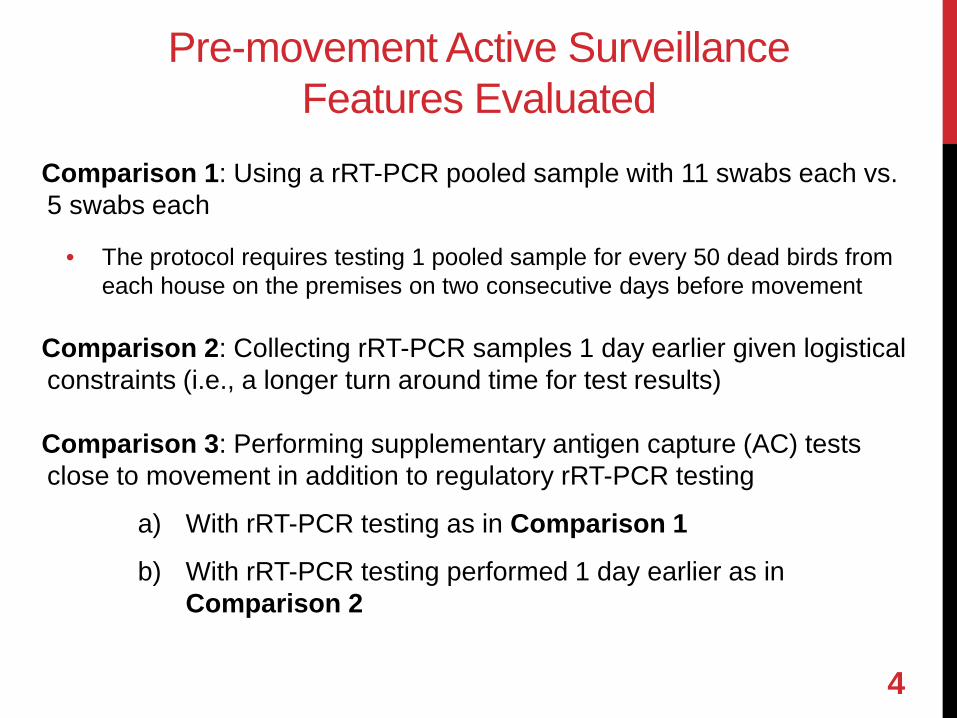
Pre-movement Active Surveillance Features Evaluated
Comparison 1: Using a rRT-PCR pooled sample with 11 swabs each vs. 5 swabs each
• The protocol requires testing 1 pooled sample for every 50 dead birds from each house on the premises on two consecutive days before movement
Comparison 2: Collecting rRT-PCR samples 1 day earlier given logistical constraints (i.e., a longer turn around time for test results)
Comparison 3: Performing supplementary antigen capture (AC) tests close to movement in addition to regulatory rRT-PCR testing
a) With rRT-PCR testing as in Comparison 1
b) With rRT-PCR testing performed 1 day earlier as in Comparison 2
4
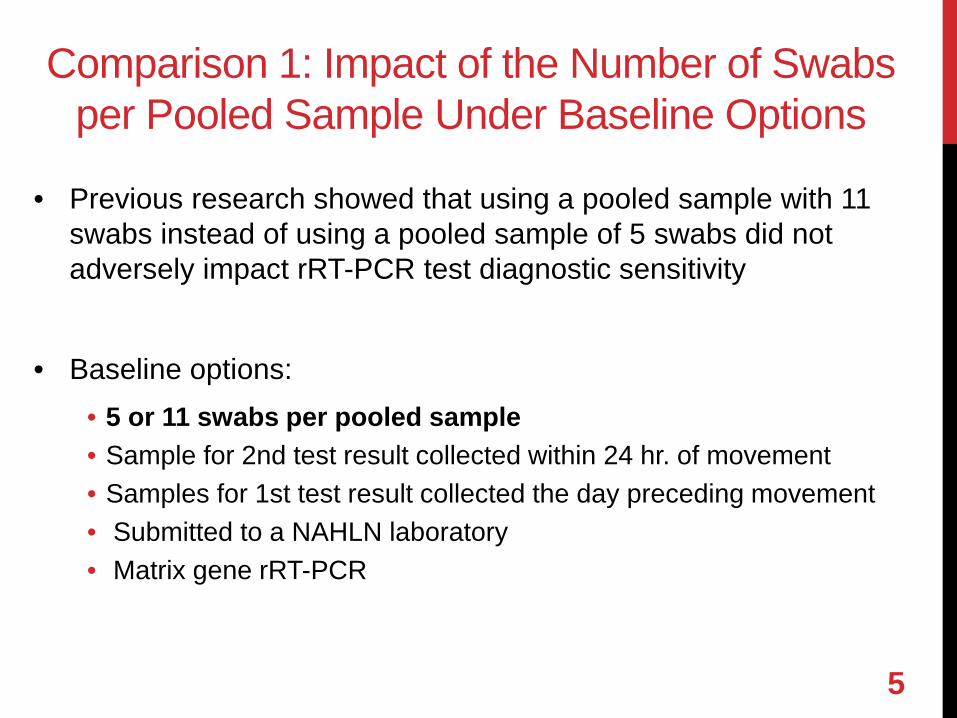
Comparison 1: Impact of the Number of Swabs per Pooled Sample Under Baseline Options
• Previous research showed that using a pooled sample with 11 swabs instead of using a pooled sample of 5 swabs did not adversely impact rRT-PCR test diagnostic sensitivity
• Baseline options: • 5 or 11 swabs per pooled sample • Sample for 2nd test result collected within 24 hr. of movement • Samples for 1st test result collected the day preceding movement • Submitted to a NAHLN laboratory • Matrix gene rRT-PCR
5
Pool size HPAI Strain
5 swabs H5N2 11 swabs H5N2
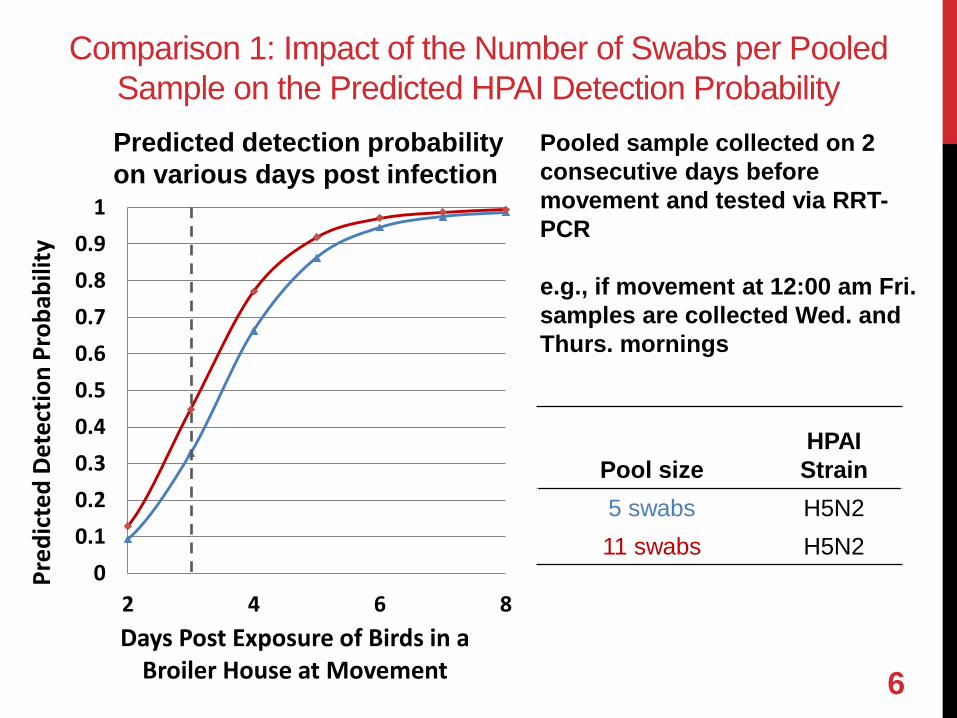
Comparison 1: Impact of the Number of Swabs per Pooled Sample on the Predicted HPAI Detection Probability
6
Pooled sample collected on 2 consecutive days before movement and tested via RRT-PCR
e.g., if movement at 12:00 am Fri. samples are collected Wed. and Thurs. mornings
00.10.20.30.40.50.60.70.80.9
1
2 4 6 8
Pred
icte
d De
tect
ion
Prob
abili
ty
Days Post Exposure of Birds in a Broiler House at Movement
Predicted detection probability on various days post infection
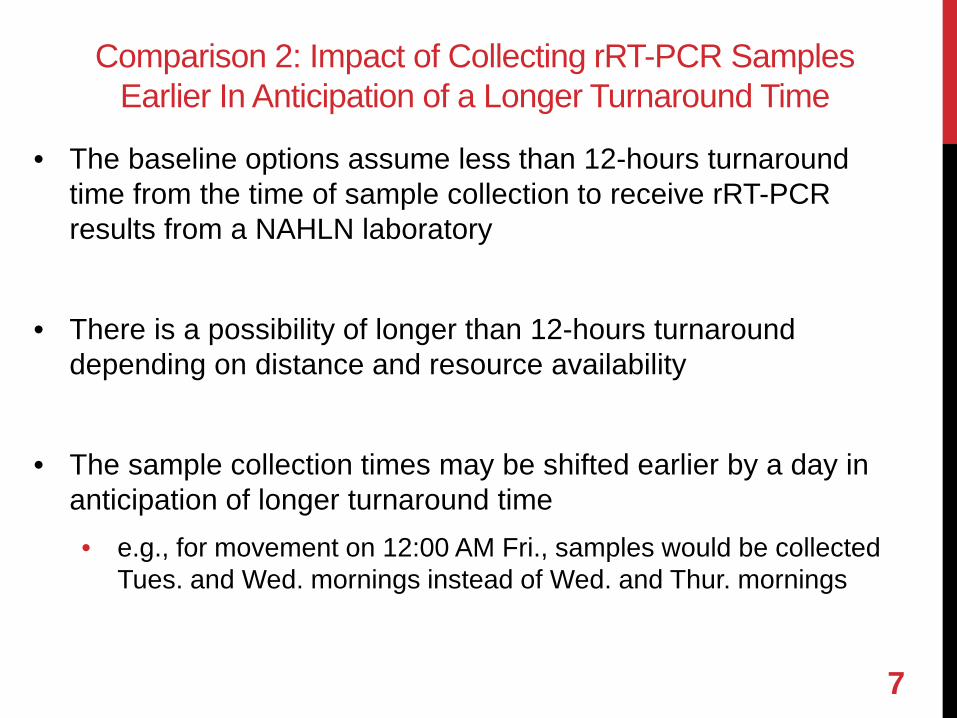
Comparison 2: Impact of Collecting rRT-PCR Samples Earlier In Anticipation of a Longer Turnaround Time
• The baseline options assume less than 12-hours turnaround time from the time of sample collection to receive rRT-PCR results from a NAHLN laboratory
• There is a possibility of longer than 12-hours turnaround depending on distance and resource availability
• The sample collection times may be shifted earlier by a day in anticipation of longer turnaround time • e.g., for movement on 12:00 AM Fri., samples would be collected
Tues. and Wed. mornings instead of Wed. and Thur. mornings
7
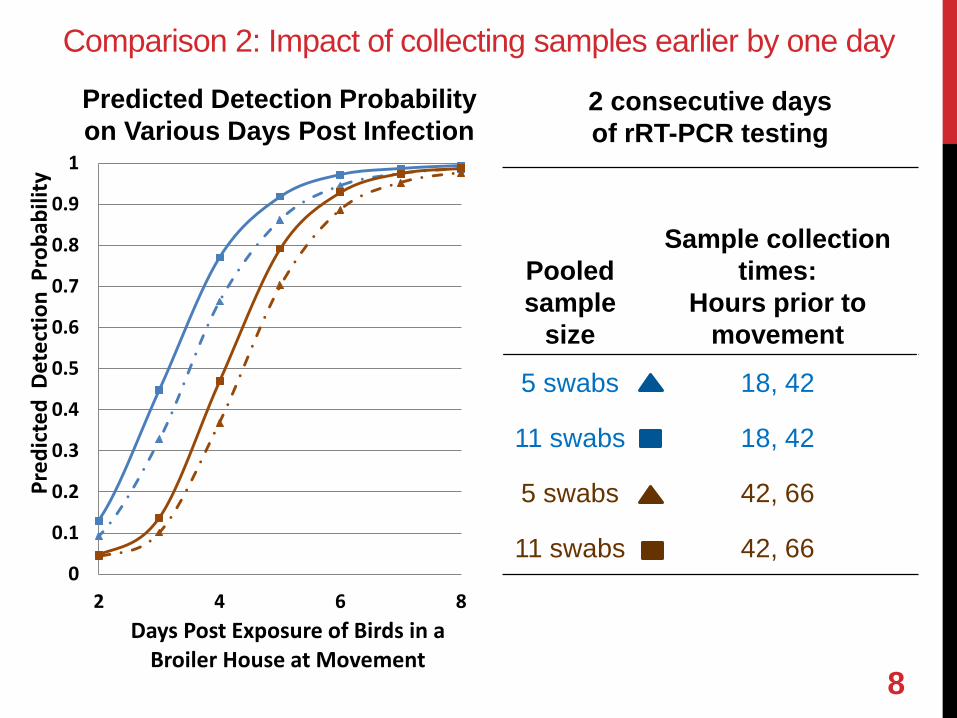
Pooled sample
size
Sample collection times:
Hours prior to movement
5 swabs 18, 42
11 swabs 18, 42
5 swabs 42, 66
11 swabs 42, 66
Comparison 2: Impact of collecting samples earlier by one day
8
0
0.1
0.2
0.3
0.4
0.5
0.6
0.7
0.8
0.9
1
2 4 6 8
Pred
icte
d D
etec
tion
Pro
babi
lity
Days Post Exposure of Birds in a Broiler House at Movement
Predicted Detection Probability on Various Days Post Infection
2 consecutive days of rRT-PCR testing
Leveraging the Logistical Advantages of Supplementary Antigen Capture Testing
• Proposed to be used by industry to supplement not replace regulatory RRT-PCR testing
• Potential benefits in HPAI response:
• Logistical advantage: ability to test closer to movement to slaughter • Provides additional HPAI detection probability • Stop movement in the event of a non-negative test
– Further diagnostic investigation is conducted
• HPAI viral titers are highest in morbid and dead birds (i.e., within the detection range of AC tests)
• Analytical sensitivity limits for AC tests range from 104 to 106 EID50/ml (Marché et al. 2010; Soliman et al. 2010; Slomka et al. 2011)
• Several studies concluded that AC tests are best suited for use in morbid and dead birds (Chua et al. 2006; and others)
9
Study to Evaluate Performance of Antigen Capture Tests for H5 and H7 HPAI Strains
• Detection of H5 and H7 highly pathogenic avian influenza virus with lateral flow devices: Performance with healthy, sick and dead chickens
• Erica Spackman, J. Todd Weaver, Sasidhar Malladi • Objectives:
• Quantify how clinical condition correlates to the detection of HPAI virus with AC tests
• Evaluate whether delayed testing of dead chickens affects detection
• Experiment details: • Exposed 50 chickens to a low dose of an H5 and an H7 HPAI virus • Delayed swab collection for 12 hr. for half of the carcasses • Tested oropharyngeal swabs
• Commercially available U.S. licensed AC test • Quantitative rRT-PCR
10
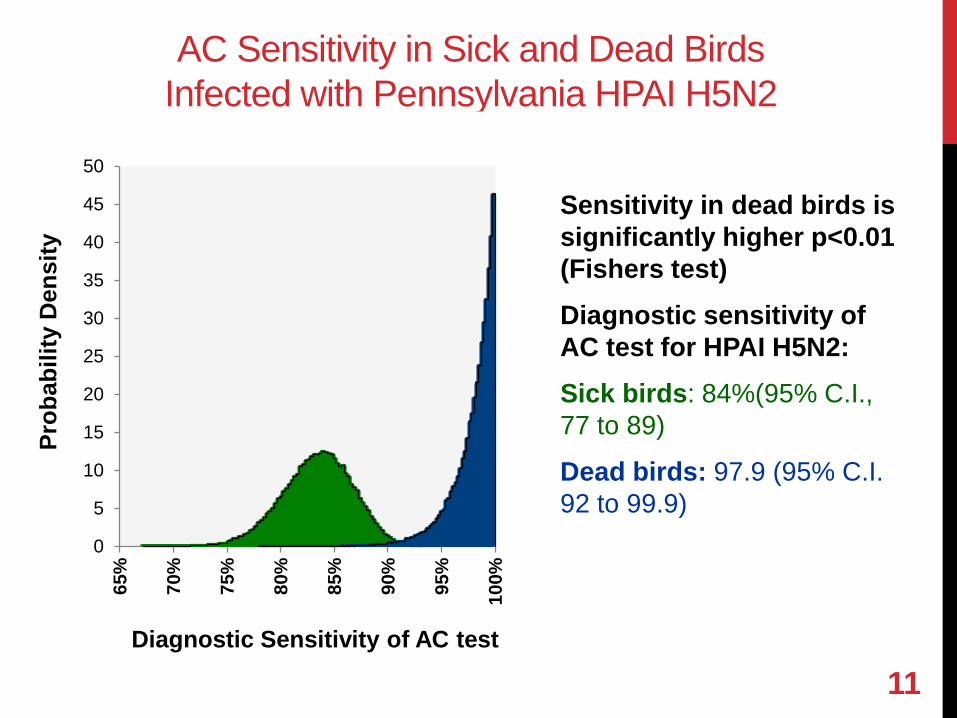
AC Sensitivity in Sick and Dead Birds Infected with Pennsylvania HPAI H5N2
Sensitivity in dead birds is significantly higher p<0.01 (Fishers test) Diagnostic sensitivity of AC test for HPAI H5N2: Sick birds: 84%(95% C.I., 77 to 89)
Dead birds: 97.9 (95% C.I. 92 to 99.9)
0
5
10
15
20
25
30
35
40
45
50
65%
70%
75%
80%
85%
90%
95%
100%
Prob
abili
ty D
ensi
ty
Diagnostic Sensitivity of AC test
11
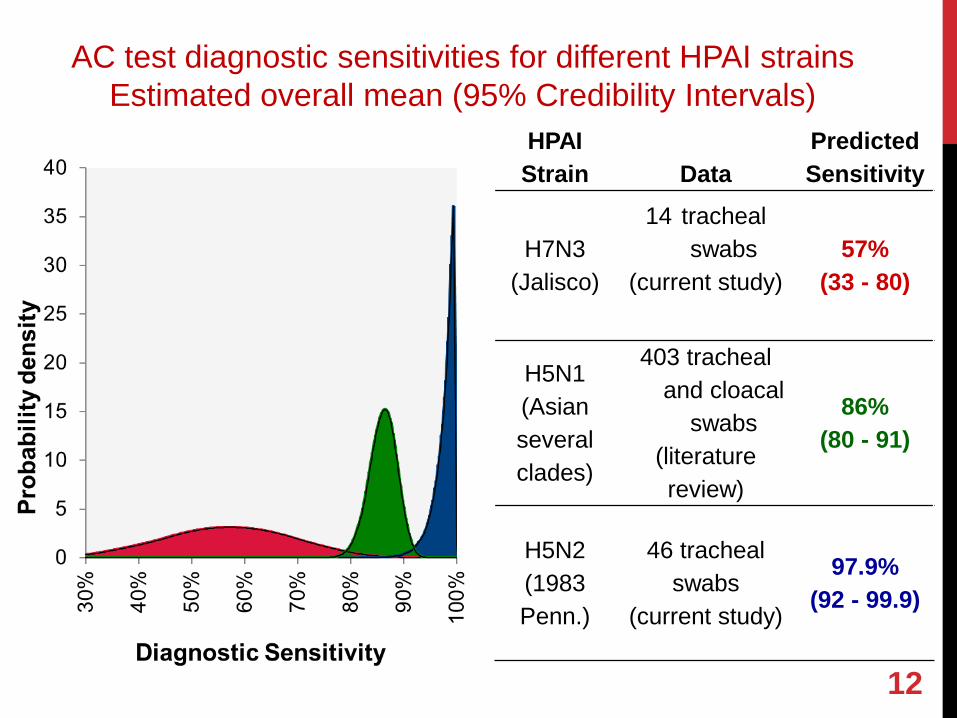
HPAI Strain Data
Predicted Sensitivity
H7N3 (Jalisco)
14 tracheal swabs
(current study)
57% (33 - 80)
H5N1 (Asian several clades)
403 tracheal and cloacal
swabs (literature review)
86% (80 - 91)
H5N2 (1983 Penn.)
46 tracheal swabs
(current study)
97.9% (92 - 99.9)
AC test diagnostic sensitivities for different HPAI strains Estimated overall mean (95% Credibility Intervals)
12
Comparison 3 a: Performing supplementary antigen capture (AC) tests in addition to regulatory rRT-PCR testing
• rRT-PCR testing:
• 2 Consecutive days of rRT-PCR testing as in baseline scenario (e.g., at 18 and 42 hrs. prior to movement)
• Pooled samples of 11 swabs from the daily mortality
• rRT-PCR + supplementary AC testing:
• 2 Pooled samples of 5 swabs from the daily mortality tested by AC (e.g., at 18 or 42 hrs. after second RRT-PCR close to load out)
• Scenarios with AC test diagnostic sensitivity of 60% and 85%
were also evaluated given the uncertainty in its value
13
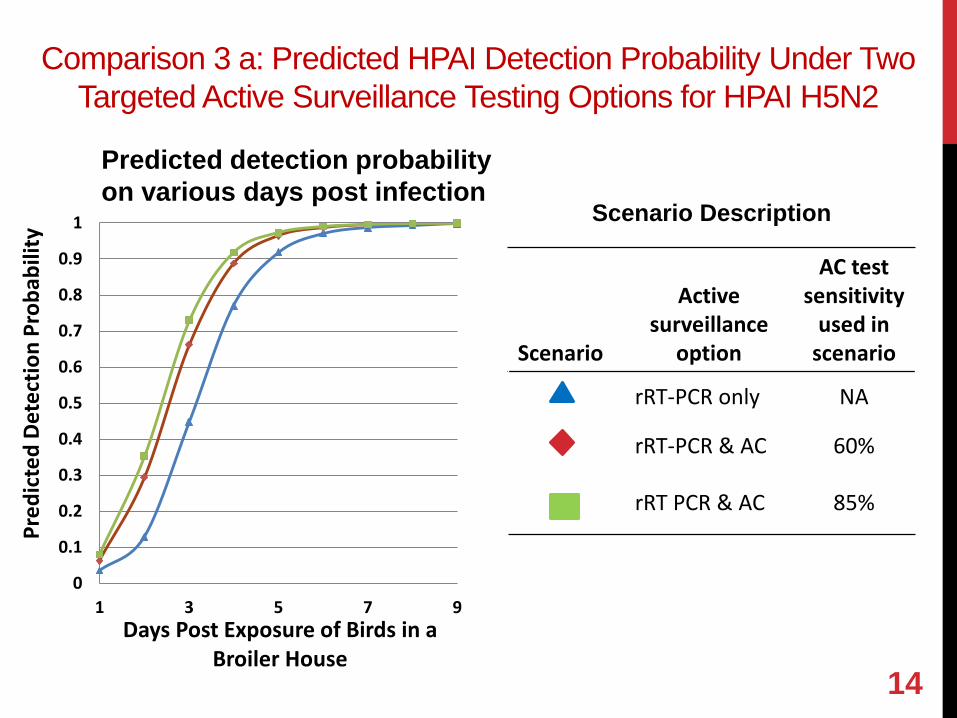
Scenario
Active surveillance
option
AC test sensitivity
used in scenario
rRT-PCR only NA
rRT-PCR & AC 60%
rRT PCR & AC 85%
Comparison 3 a: Predicted HPAI Detection Probability Under Two
Targeted Active Surveillance Testing Options for HPAI H5N2
14
0
0.1
0.2
0.3
0.4
0.5
0.6
0.7
0.8
0.9
1
1 3 5 7 9
Pred
icte
d D
etec
tion
Prob
abili
ty
Days Post Exposure of Birds in a Broiler House
Predicted detection probability on various days post infection
Scenario Description
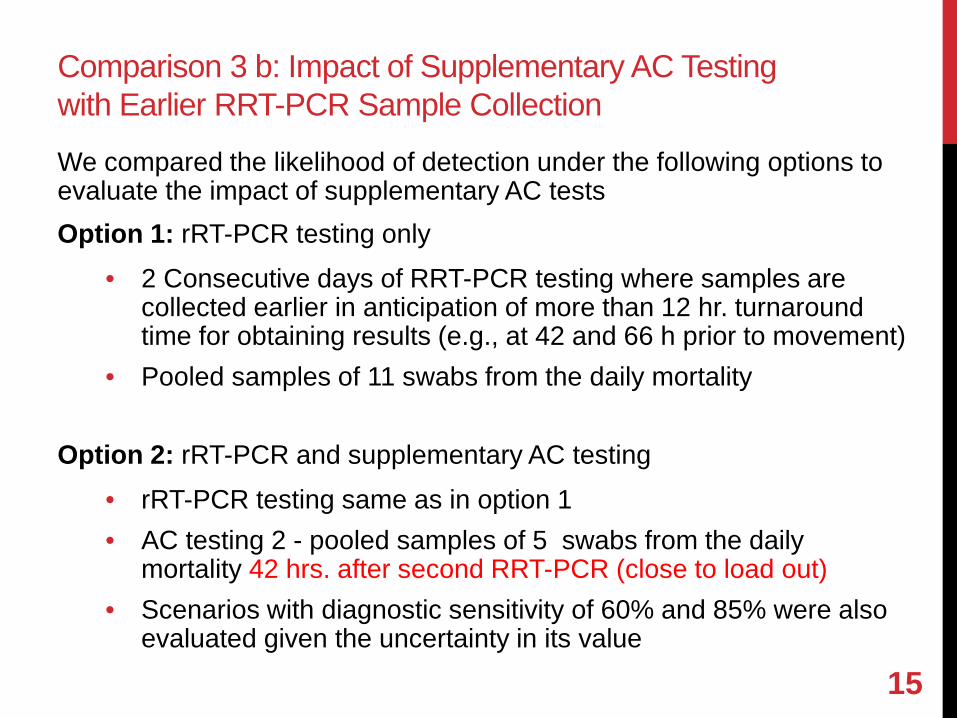
Comparison 3 b: Impact of Supplementary AC Testing with Earlier RRT-PCR Sample Collection
We compared the likelihood of detection under the following options to evaluate the impact of supplementary AC tests Option 1: rRT-PCR testing only
• 2 Consecutive days of RRT-PCR testing where samples are collected earlier in anticipation of more than 12 hr. turnaround time for obtaining results (e.g., at 42 and 66 h prior to movement)
• Pooled samples of 11 swabs from the daily mortality Option 2: rRT-PCR and supplementary AC testing
• rRT-PCR testing same as in option 1 • AC testing 2 - pooled samples of 5 swabs from the daily
mortality 42 hrs. after second RRT-PCR (close to load out) • Scenarios with diagnostic sensitivity of 60% and 85% were also
evaluated given the uncertainty in its value 15
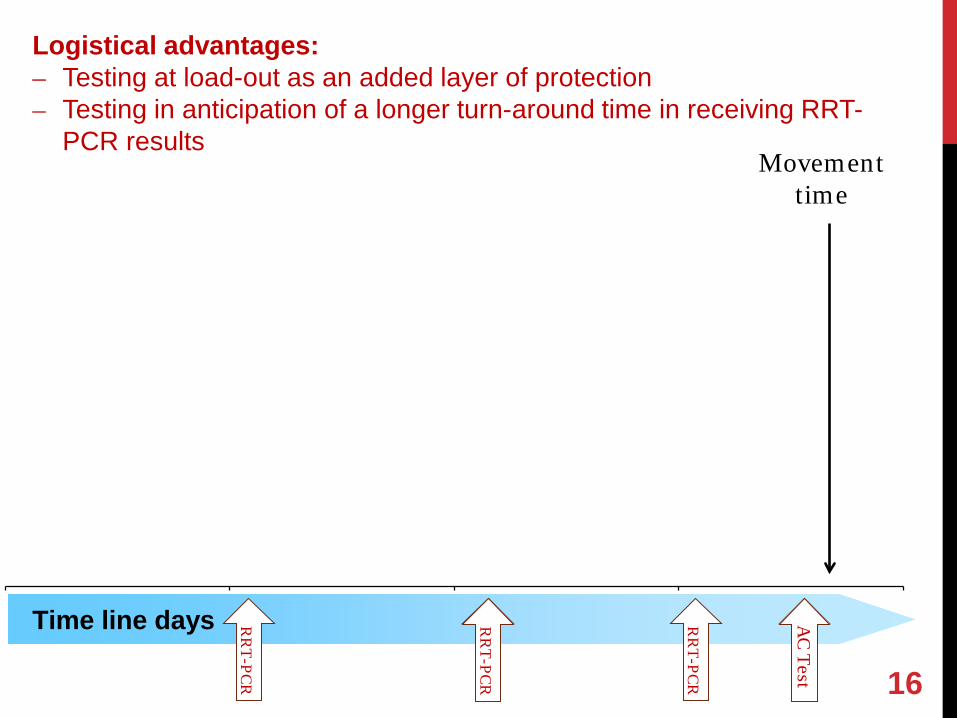
1 4 7 10Days Time line days
Movement time
Logistical advantages: – Testing at load-out as an added layer of protection – Testing in anticipation of a longer turn-around time in receiving RRT-
PCR results
RR
T-PCR
RR
T-PCR
RR
T-PCR
RR
T-PCR
AC
Test A
C Test 16
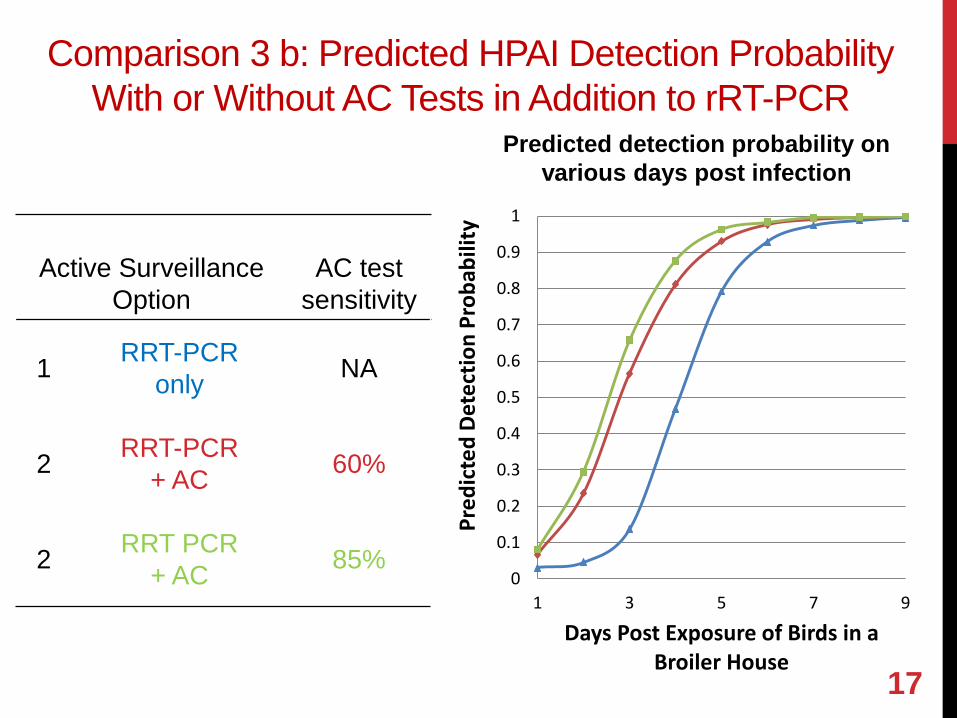
Active Surveillance Option
AC test sensitivity
1 RRT-PCR only NA
2 RRT-PCR + AC 60%
2 RRT PCR + AC 85%
Comparison 3 b: Predicted HPAI Detection Probability With or Without AC Tests in Addition to rRT-PCR
17
0
0.1
0.2
0.3
0.4
0.5
0.6
0.7
0.8
0.9
1
1 3 5 7 9
Pred
icte
d D
etec
tion
Prob
abili
ty
Days Post Exposure of Birds in a Broiler House
Predicted detection probability on various days post infection
Dead
Infectious
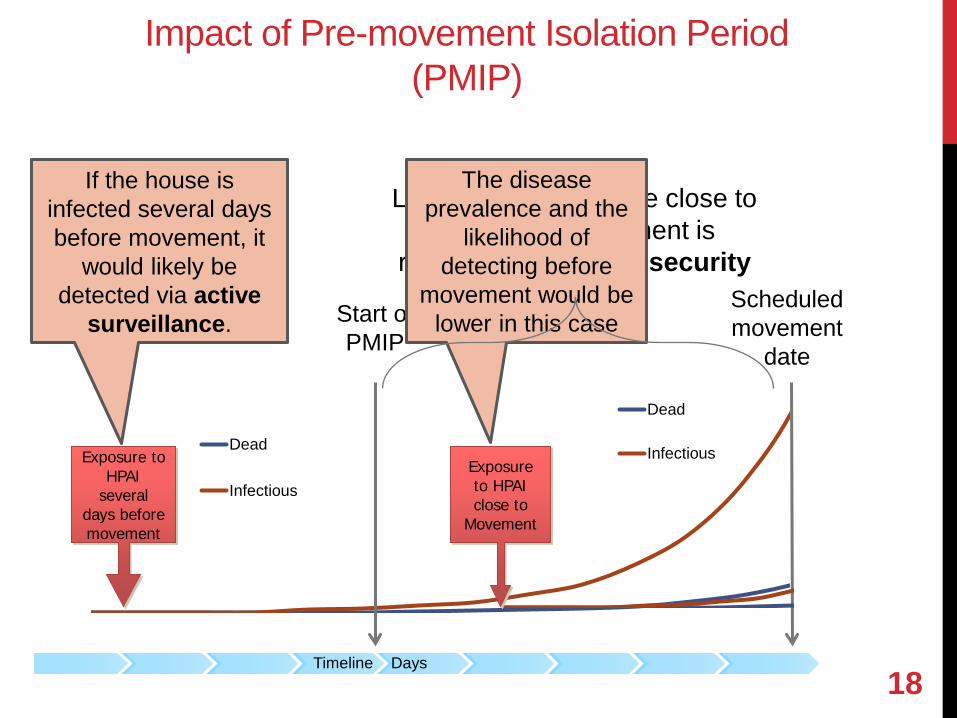
Impact of Pre-movement Isolation Period (PMIP)
18
Exposure to HPAI
several days before movement
Scheduled movement
date
Start of PMIP
If the house is infected several days before movement, it
would likely be detected via active
surveillance.
Likelihood of exposure close to the time of movement is
reduced by PMIP biosecurity
Dead
InfectiousExposure to HPAI close to
Movement
The disease prevalence and the
likelihood of detecting before
movement would be lower in this case
Timeline Days
Baseline PMIP Measures
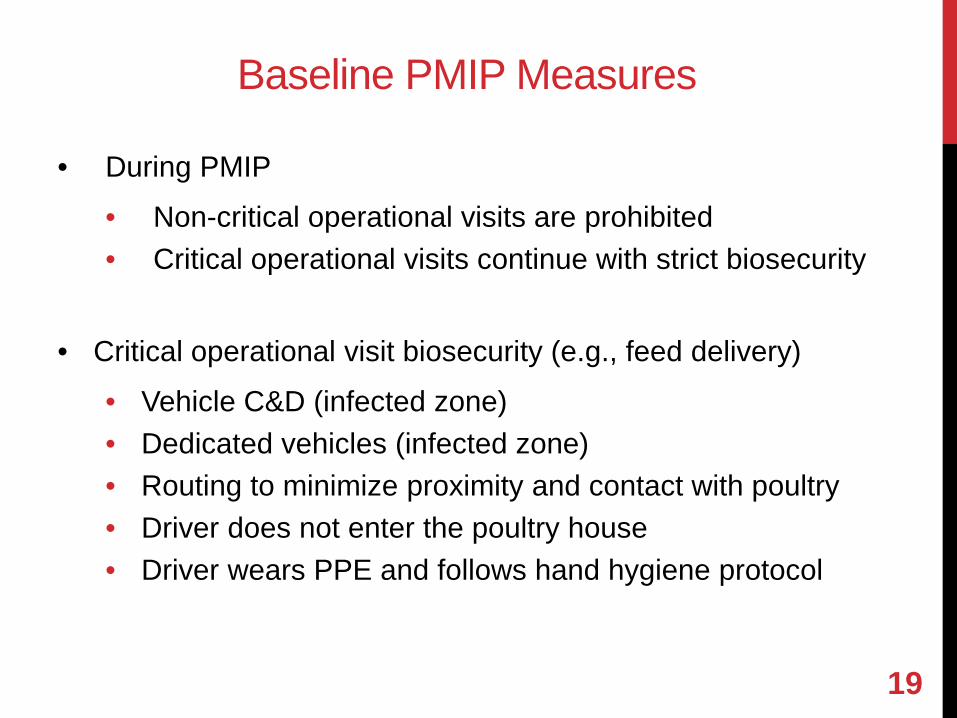
• During PMIP
• Non-critical operational visits are prohibited • Critical operational visits continue with strict biosecurity
• Critical operational visit biosecurity (e.g., feed delivery)
• Vehicle C&D (infected zone) • Dedicated vehicles (infected zone) • Routing to minimize proximity and contact with poultry • Driver does not enter the poultry house • Driver wears PPE and follows hand hygiene protocol
19
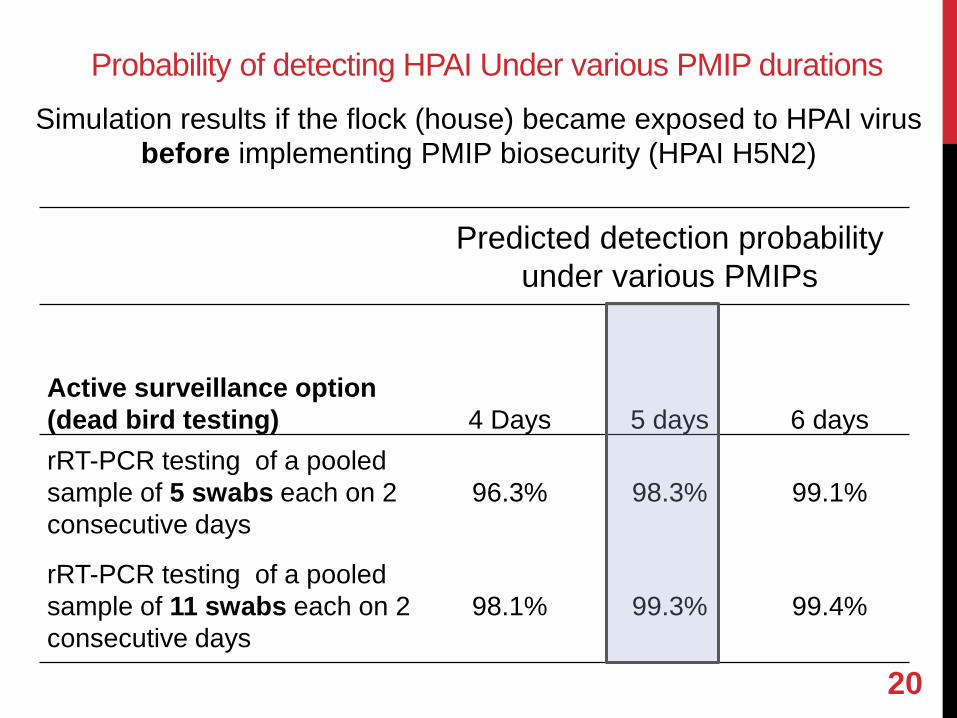
Probability of detecting HPAI Under various PMIP durations
20
Predicted detection probability
under various PMIPs
Active surveillance option (dead bird testing) 4 Days 5 days 6 days rRT-PCR testing of a pooled sample of 5 swabs each on 2 consecutive days
96.3% 98.3% 99.1%
rRT-PCR testing of a pooled sample of 11 swabs each on 2 consecutive days
98.1% 99.3% 99.4%
Simulation results if the flock (house) became exposed to HPAI virus before implementing PMIP biosecurity (HPAI H5N2)
21
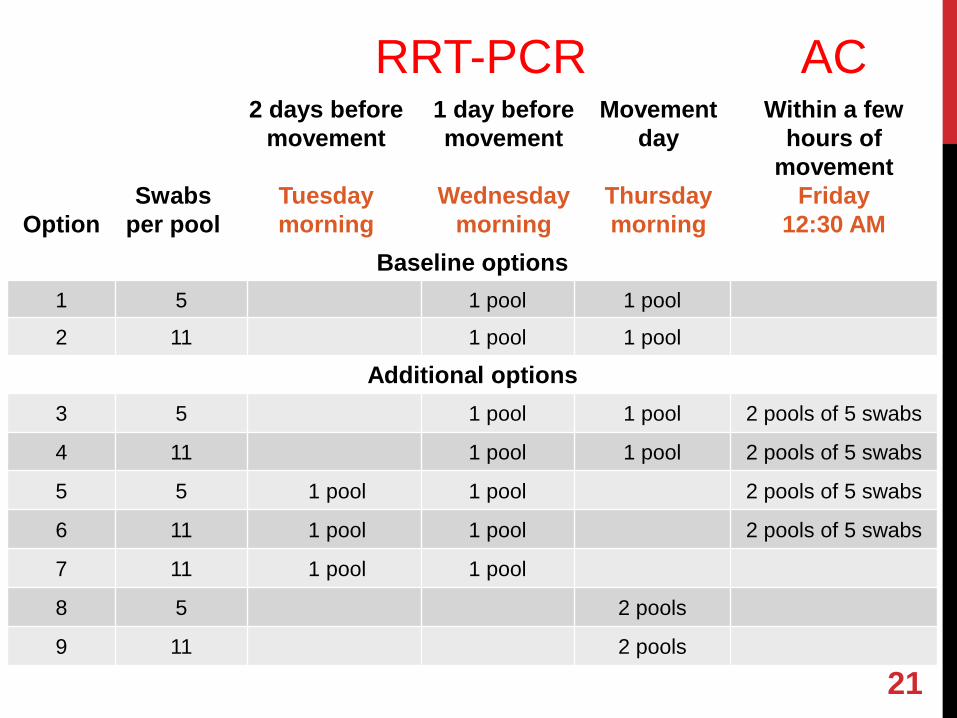
Option Swabs
per pool
RRT-PCR AC 2 days before
movement
Tuesday morning
1 day before movement
Wednesday
morning
Movement day
Thursday morning
Within a few hours of
movement Friday
12:30 AM Baseline options
1 5 1 pool 1 pool
2 11 1 pool 1 pool
Additional options 3 5 1 pool 1 pool 2 pools of 5 swabs
4 11 1 pool 1 pool 2 pools of 5 swabs
5 5 1 pool 1 pool 2 pools of 5 swabs
6 11 1 pool 1 pool 2 pools of 5 swabs
7 11 1 pool 1 pool
8 5 2 pools
9 11 2 pools
Overall Conclusions • Using a rRT-PCR pooled sample with 11 swabs each vs. a
pooled sample with 5 swabs each could result in a moderate gain in detection probability – especially recent exposures
• Collecting rRT-PCR samples earlier to accommodate logistical constraints (i.e., a longer turn around time for results) can decrease detection probability
• Supplemental flock-side AC testing conducted by industry veterinarians has the potential to enhance HPAI detection probability, particularly in situations where there are logistical constraints
22
Overall Conclusions
• Active surveillance and pre-movement isolation period (extreme biosecurity) can increase confidence that HPAI infected and undetected broilers are not moved to processing
• Further studies on the performance of AC tests would improve confidence in their field application during a HPAI outbreak
• Evaluation of AC test performance in dead birds for different strains of HPAI virus
• Effects of pooling on AC testing protocols
23