Embed Size (px)
Citation preview

i
A
SEMINAR REPORT
On
Ischemia Detection: By Identification of
Isoelectric Line and ST Segment
Under Guidance of
Dr. Mandeep Singh
Submitted by:
Gitika Gupta
M.E (2nd
year)
Electronics Instrumentation and Control Engg.
Roll No. 800851006
Department of Electrical Engineering
Thapar University
Patiala, (Punjab).

ii

iii

iv
Abstract
In this research work we present an algorithm for the automated detection of ST deviation
that can be useful in diagnosing Coronary Heart Disease (CHD) using electrocardiogram
(ECG) recordings. The technique is developed using Long Term ST database (LTST
DB). Preprocessing is carried out prior to the extraction of ST segment which includes
noise filtering using seven-point parabolic filter and then application of Wavelet
Transform for QRS detection. The algorithm determines the R-peak detection in large
number of samples, and then estimates the ST-segment’s relative level with respect to
iso-electric level using overlapping band selection method. It then compares the two
levels, which is later used for ischemia detection. The performance of the proposed
solution was evaluated on 14 records from LTST database. We found that there is
reasonable amount of accuracy (98.5%) and it can therefore be concluded that the
algorithm which have proposed can be used for most of the practical purposes.

v
Organization of Thesis
The first chapter introduces the Functioning of Heart, ischemia, its causes, types. A
description of Cardiac Ischemia, Myocardial Infarction, ECG and its parameters and the
technique used in ischemia detection algorithm i.e: Wavelet Transform
The second chapter tells about the work that has been already carried out in this field.
The third chapter formulates the problem.
The fourth chapter gives the detailed description of proposed solution with an algorithm
and implementation of various tools of application software.
The fifth chapter shows the result obtained from the program in the tabular form and
finally, thesis concluded in this chapter with future scopes.

vi
Table of Contents
Chapter Item Description Page No.
Declaration
Acknowledgement
Abstract
Organization of Thesis
Contents
(ii)
(iii)
(iv)
(v)
(vi)-(viii)
List of figures
List of tables
(ix)-(x)
(xi)
Abbreviations (xii)-(xiii)
1. Introduction
1.1 Functioning of Heart 1
1.2 Ischemia
1.2.1 Mechanism
1.2.2 Causes
1.2.3 Ischemia Types
2
2
3-4
5-7
1.3 Cardiac Ischemia 8-9
1.4 Angina Pectoris
1.4.1 Types of Angina
1.4.1.1 Stable Angina
1.4.1.2 Unstable Angina
10
10
1.5 Myocardial Infarction
1.5.1 Causes
1.5.2 Signs and Symptoms
11
12
12
1.6 Electrocardigram(ECG)
1.6.1 Heart Function and ECG
1.6.2 Waves and Intervals
13
14
15
1.7 ST Segment 16

vii
1.7.1 STEMI and NSTEMI
1.7.2 ST Segment Depression
17
18
1.8 Isoelectric Line 19
1.9 Wavelet Transform
1.9.1 Continuous Wavelet Transform
1.9.2 Discrete Wavelet Transform
20
20
21
2. Literature Survey
2.1 Recognition of the Shape of the ST Segment in ECG Waveforms 22
2.2 Detection And Extraction Of The Ecg Signal Parameters 22
2.3 ECG Analysis Using Nonlinear PCA Neural Networks for
Ischemia Detection
23
2.4 Advanced Detection Of ST Segment Episodes In 24-Hour
Ambulatory ECG Data By Automated Tracking Of Transient ST
Segment Reference Level.
23
2.5 Long-term ST database: a reference for the development and
evaluation of automated ischaemia detectors and for the study of
the dynamics of myocardial ischaemia.
24
2.6 Simulation of ST Segment Changes During Subendocardial
Ischemia Using a Realistic 3-D Cardiac Geometry.
24
2.7 A QRS detection method using analog wavelet transform in
ECG analysis.
25
2.8 ECG Feature Extraction Based on Multiresolution Wavelet
Transform.
25
2.9 Challenge 2006: QT Interval Measurement. 26
2.10 Detection of ST Segment Deviation Episodes in the ECG using
KLT with an Ensemble Neural Classifier.
26
2.11 Automatic Distinguishing Between Ischemic and Heart-Rate
Related Transient ST Segment Episodes in Ambulatory ECG
Records.
27
2.12 Detection Of The QRS Complex, P Wave And T Wave In
Electrocardiogram.
27

viii
2.13 Adaptive ECG Filtering And QRS Detection Using Orthogonal
Wavelet Transform.
28
2.14 An Automated System for On-line Monitoring and Detection of
ST Changes in ECG Signal.
28
3. Problem Defination 30
4. Problem Solution And Implementation
4.1 Overview 31
4.2 MATLAB Simulink
3.2.1 Key Features
32
32
4.3 Database 32
4.4 Methodology
4.4.1 Preprocessing
4.4.1.1 Least Square Polynomial Smoothing Filter
4.4.2 QRS Detection
4.4.2.1 Discrete Wavelet Transform
4.4.3 Detection of Isoelectric level
4.4.4 Detection of ST Segment Detection
4.4.5 Comparison of amplitudes of Isoelectric line and ST
Segment.
33
33
36
37-44
45-46
47-48
49
5. Results And Discussion 50-53
6. Conclusion and Future Scope 54
References 55

ix
List Of Figures
Figure
No.
Item Description Page No.
1.1 Electrical functioning of the heart 1
1.2 Plaque build up in arteries 4
1.3 Discoloration of skin (cutaneous ischemia) 5
1.4 Blood clot in the middle cerebral artery leads to cerebral
ischemia.
6
1.5 Bowel Ischemia(Intestine) 7
1.6 Myocardial ischemia 9
1.7 Plaque formation and blood clots in the arteries’ walls. 11
1.8 Diagram of a myocardial infarction (2) of the tip of the anterior
wall of the heart (an apical infarct) after occlusion (1) of a
branch of the left coronary artery.
12
1.9 Heart Functioning 14
1.10 One-cycle ECG tracing is shown. 15
1.11 Negative ST Deviation (top row), positive ST deviation (middle
row) and normal (bottom row)
17
1.12 Isoelectric line between P wave and QRS complex. 19
1.13 Demonstration of (a) a Wave and (b) a Wavelet. 20
4.1 (a) Parabolic fitting of groups of seven sampled datapoints.
(b) Signal flow graph.
34
4.2 Original ECG data plot. 35
4.3 Filtered ECG signal using seven point parabolic filter. 36
4.4 Four level wavelet decomposition tree. 38
4.5 (a)Level1 approximation coefficient, (b)Level2 approximation
coefficient, (c)Level3 approximation coefficient, (d)Level4
40

x
approximation coefficient.
4.6 (a)Level1 detail coefficients, (b) Level 2 detail coefficients, (c)
Level 3 detail coefficients, (d) Level 4 detail coefficients.
42

xi
List Of tables
Table
No.
Table Description Page No.
1.1 ECG parameters description 15
5.1 Reports the actual and detected number of peaks 50
5.2 Reports the relative position of ST segment w.r.t isoelectric
line.( LTSTDB_s20101).
51
5.3 Reports the relative position of ST segment w.r.t isoelectric
line(LTSTDB_s20041).
52

xii
Abbreviations
CHD
AV
SA
TIA
MI
AMI
RCA
LCA
ECG
STEMI
NSTEMI
STFT
CWT
DWT
PCA
NLPCA
DFT
DCT
KLT
ANN
Coronary Heart Disease
Atrioventricular node
Sinoatrial Node
Transient Ischemic Attack
Myocardial Infarction
Acute Myocardial Infarction
Right Coronary Artery
Left Coronary Artery
Electrocardiogram
ST Segment Elevation Myocardial Infarction
Non-ST Segment Elevation Myocardial Infarction
Short Time Fourier Transform
Continuous Wavelet Transform
Discrete Wavelet Transform
Principal Component Analysis
Non Linear Principal Component Analysis
Discrete Fourier Transform
Discrete Cosine Transform
Karhunen Loeve Transform
Artificial Neural Network

xiii
LTST-DB
db1
Long Term ST Database
Daubechie wavelet of order 1

1
CHAPTER-1
Introduction
1.1 Functioning of Heart
The heart is a specialised muscle that contracts regularly and continuously, pumping
blood to the body and the lungs. The pumping action is caused by a flow of electricity
through the heart that repeats itself in a cycle. If this electrical activity is disrupted - for
example by a disturbance in the heart's rhythm known as an arrhythmia - it can affect the
heart's ability to pump properly. The heart has four chambers: the atria and the ventricles.
The normal trigger for the heart to contract arises from the heart's natural pacemaker, the
SA node, which is in the top chamber. The SA node sends out regular electrical impulses
causing the atrium to contract and to pump blood into the bottom chamber (the ventricle).
Fig1.1 Electrical Functioning of Heart
The electrical impulse then passes to the ventricles through a form of 'junction box' called
the AV node (atrio-ventricular node). This electrical impulse spreads into the ventricles,
causing the muscle to contract and to pump blood to the lungs and the body. Chemicals
which circulate in the blood, and which are released by the nerves that regulate the heart,
alter the speed of the pacemaker and the force of the pumping action of the ventricles.
For example, adrenaline increases the heart rate and the volume of blood pumped by the

2
heart. Heart disease is the one of the leading causes of death all over the world with
Myocardial Ischemia and Infarction called Coronary Heart Disease or CHD being the
most common among these cardiac disorders. Myocardial Ischemia and Infarction results
from the insufficient blood supply to the heart muscles (myocardium) due to blockages
in the coronary artery, which is responsible for providing blood to the heart.
1.2 Ischemia
In medicine, ischemia (Isch – is restriction, hema or haema is blood) is a restriction in
blood supply, generally due to factors in the blood vessels, with resultant damage or
dysfunction of tissue. Ischemia is an absolute or relative shortage of the blood supply to
an organ, i.e. a shortage of oxygen, glucose and other blood-borne fuels. A relative
shortage means the mismatch of blood supply (oxygen/fuel delivery) and blood request
for adequate metabolism of tissue. Ischemia results in tissue damage because of a lack of
oxygen and nutrients. Ultimately, this can cause severe damage because of the potential
for a build-up of metabolic wastes. Ischemia is considered to be a major complication of the cardiac function, and a
prime cause for the occurrence of cardiac infarction and dangerous cardiac arrhythmias.
1.2.1 Mechanism
Hypoxia is a general term denoting a shortage of oxygen, usually a result of lack of
oxygen in the air being breathed but in comparison ischemia is an absolute or relative
shortage of the blood supply to an organ, i.e. a shortage of oxygen, glucose and other
blood-borne fuels. A relative shortage means the mismatch of blood supply (oxygen/fuel
delivery) and blood request for adequate metabolism of tissue. Ischemia results in tissue
damage because of a lack of oxygen and nutrients. Ultimately, this can cause severe
damage because of the potential for a build-up of metabolic wastes.
Ischemia can also be described as an inadequate flow of blood to a part of the body,
caused by constriction or blockage of the blood vessels supplying it.

3
1.2.2 Causes
1.2.2.1 Compression of Blood Vessels : Blood vessels can be compressed from the
outside by growths. Tumors can press on major arteries blocking oxygen pathways,
resulting in ischemia. Where other factors do not exist, ischemic episodes may indicate
either the presence of cancer or large benign tumors.
1.2.2.2. Ventricular Tachycardia : Ventricular Tachycardia is a series of sudden
irregular heartbeats that can cause the heart to function incorrectly, or in the most severe
cases to stop completely. Resultant complications can include ischemia, since significant
arrhythmias causing irregular heart function may also inhibit oxygen flow. In cardiac
death as a result of ventricular tachycardia, the heart stops completely, depriving the
entire body of oxygen. Though a person can be revived with the use of a defibrillator,
length of oxygen deprivation may have caused damage to major organs.
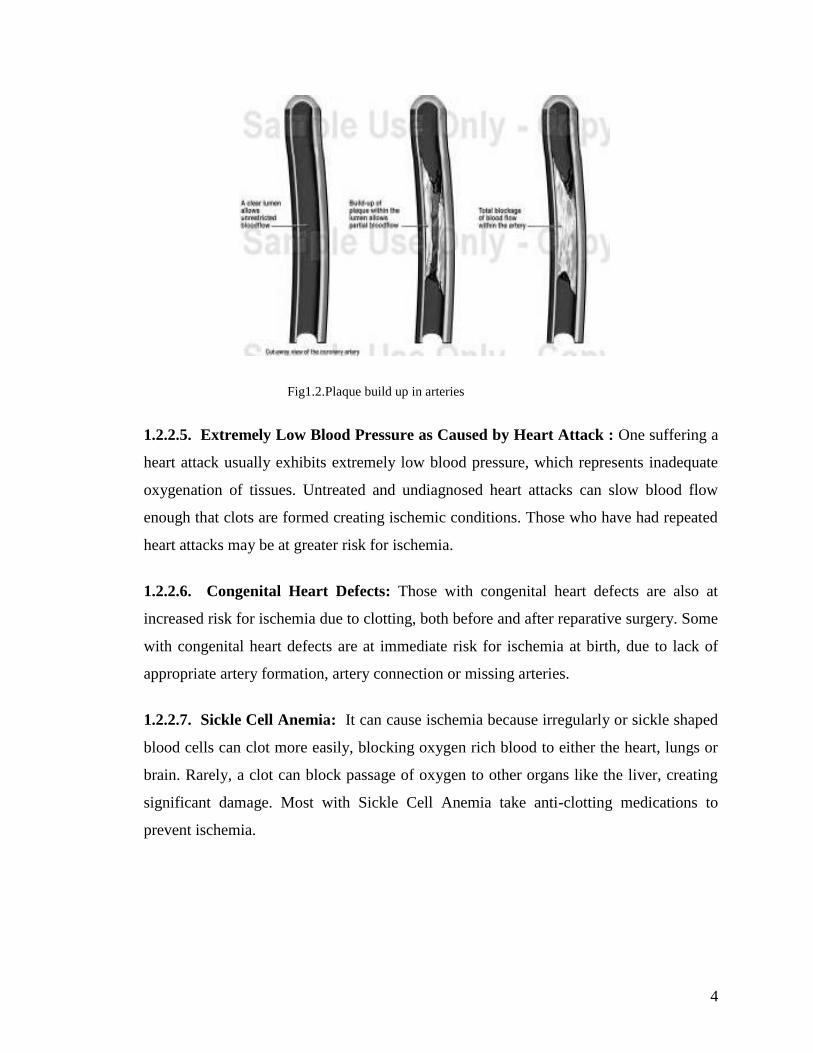
1.2.2.3. Plaque Build-Up in Arteries (Atherosclerosis) : Atherosclerosis is the
narrowing of arteries caused by the build-up of plaque. This is frequently seen in the
elderly, and can usually be corrected. However, ischemia may first present when an
artery becomes so completely blocked that blood cannot get to the brain or lungs. As
well, narrow passageways make it easier for blood to clot and completely block the
arteries.
1.2.2.4. Blood Clots : Blood clots can be caused by people having a high platelet count,
by surgical procedures, or in those taking an excess of blood clotting agents. As well,
some blood clots can form in the legs of those who are inactive. In very rare cases, blood
clots can form in the legs during long airplane flights, causing almost immediate
ischemia. Often blood clots are too small to block veins and arteries, but occasionally a
large clot can block blood flow to a major organ, creating great damage.
4
Fig1.2.Plaque build up in arteries
1.2.2.5. Extremely Low Blood Pressure as Caused by Heart Attack : One suffering a
heart attack usually exhibits extremely low blood pressure, which represents inadequate
oxygenation of tissues. Untreated and undiagnosed heart attacks can slow blood flow
enough that clots are formed creating ischemic conditions. Those who have had repeated
heart attacks may be at greater risk for ischemia.
1.2.2.6. Congenital Heart Defects: Those with congenital heart defects are also at
increased risk for ischemia due to clotting, both before and after reparative surgery. Some
with congenital heart defects are at immediate risk for ischemia at birth, due to lack of
appropriate artery formation, artery connection or missing arteries.
1.2.2.7. Sickle Cell Anemia: It can cause ischemia because irregularly or sickle shaped
blood cells can clot more easily, blocking oxygen rich blood to either the heart, lungs or
brain. Rarely, a clot can block passage of oxygen to other organs like the liver, creating
significant damage. Most with Sickle Cell Anemia take anti-clotting medications to
prevent ischemia.

5
1.2.3 Ischemia Types
1.2.3.1.Cutaneous Ischemia
Reduction in blood flow to the skin layers may result in mottling or uneven, patchy
discoloration of the skin. It may cause due to any blockage that may cause due to plaque
formation,due to blood clots in the arteries or blood vessels or due to compression of
blood vessels.
Fig1.3.Discoloration of skin(cutaneous ischemia)
1.2.3.2.Cerebral Ischemia
It occurs in the arteries of the brain, where blockages can lead to a stroke. Most
blockages in the cerebral arteries are due to a blood clot, often in an artery narrowed by
plaque. Sometimes, a blood clot in the heart or aorta travels to a cerebral artery. A
transient ischemic attack(TIA) is a "mini-stroke" caused by a temporary deficiency of
blood supply to the brain. It occurs suddenly, lasts a few minutes to a few hours, and is a
strong warning sign of an impending stroke. Ischemia can also effect intestines, legs, feet
and kidneys. Pain, malfunctions, and damage in those areas may result.
A stroke is a partially fatal event in which the part of the brain doesnot get enough
oxygen. It occurs either due to lack of oxygen rich blood to the brain or due to bleeding
around the brain.

6
Fig1.4.Blood clot in the middle cerebral artery leads to cerebral ischemia
1.2.3.3. Bowel Ischemia
A person with ischemic bowel disease has narrowing of the arteries that supply blood and
oxygen to the intestines. As the narrowing worsens, the arteries become unable to supply
enough oxygen to meet demand. This can cause abdominal pain and damage to the
intestine. Ischemic bowel disease is caused by hardening of the arteries, called
atherosclerosis. It is rare in those who are less than 50 years old.
Symptoms of bowel ischemia are :
(i) Abdomen Pain,
(ii) Blood in the stool,
(iii) Black stool,
(iv) Diarrhea,
(v) Constipation.

7
Fig1.5.Bowel Ischemia(Intestine)
1.2.3.4 Cardiac Ischemia
Cardiac ischemia is a situation in which the flow of oxygen-rich blood to the heart
muscle is impeded, resulting in inadequate oxygenation of the heart. The most common
cause of cardiac ischemia is plaque buildup in the arteries due to the long-term effects of
coronary artery disease. This plaque buildup narrows the arteries to the point where the
amount of blood flowing through the arteries is not enough to supply oxygen-rich blood
to the heart, especially during times of physical exertion or emotional stress.

8
CARDIAC ISCHEMIA
1.3 Myocardial/Cardiac Ischemia
Myocardial ischemia is the most common cardiac disease and it is caused by a lack of
sufficient blood flow to the contractile cells and may lead to myocardial infarction. The
most common cause of cardiac ischemia is plaque buildup in the arteries due to the long-
term effects of coronary artery disease. The development of plaque within the coronary
artery that blocks more than 70% of the lumen of the vessel can cause symptoms of
myocardial ischemia, such as decreased exercise tolerance and exertional angina, to
appear. At times, this may be the first instance where the subject begins to experience
effects of the suboptimal operation of the heart due to decreased blood supply. The main
characteristic of ischemia in the cellular level is the depolarization of the cellular resting
membrane potential. As large areas of the heart muscle become ischemic, its relaxation
and contraction patterns are affected, which cause variations in the ST level and T-wave
in electrocardiogram (ECG) due to the development of an injury current between the
ischemic and non-ischemic regions of the heart. The ST level change episodes lasting
several seconds or sometimes some minutes, is an important indication in the diagnosis of
myocardial ischemia. Repeated ischemia may lead to tissue injury and changes in
electrophysiological properties that may in turn predispose the heart to arrhythmias.
The ischemic region is classified as subendocardial or transmural. Subendocardial
ischemia begins at the endocardial surface, the region furthest from the blood supply, and
extends partially through the heart wall. If the ischemic region extends from the
endocardium through to the epicardium then it is classified as transmural ischemia.
The lack of oxygen is often temporary, and symptoms can include a type of chest pain,
pressure or discomfort called angina. These episodes may last anywhere from 2 to 20
minutes. However, many episodes of ischemia do not have any associated symptoms
(silent ischemia).

9
Lengthy episodes of cardiac ischemia can be a sign of a heart attack. A heart attack
occurs when a blood clot blocks the flow of blood to the heart muscle. It can occur in an
artery already narrowed by plaque (atherosclerosis), or a heart attack can occur after a
blood clot breaks off from its original site and travels through the arteries. The blockage
causes a sudden and possibly complete interruption of oxygen-rich blood flow, and the
resulting heart attack could cause permanent damage and scarring to the portion of the
heart muscle supplied by the blocked artery. Prevention and treatment are related to
modifying the underlying factors that promote the development of atherosclerosis and
blood clot formation.
Ischemia can be silent or symptomatic.
1. Symptomatic ischemia is characterized by chest pain called angina pectoris.
2. Silent ischemia usually is caused by emotional or mental stress or by exertion,
but there are no symptoms.
Fig1.6.:Myocardial ischemia

10
Minor episodes of cardiac ischemia tend to cause little long-term damage to the heart, but
there may be serious side effects in some patients:
1) They can cause abnormal heart rhythms (arrhythmias), which can lead to either
syncope (fainting) or cardiac arrest (the abrupt inability of the heart to pump blood)
and sudden cardiac death.
2) Severe or lengthy episodes can trigger a heart attack.
3) The collective effects of minor episodes of cardiac ischemia can potentially lead to
a weakening of the heart muscle (cardiomyopathy).
1.4 Angina Pectoris
Angina pectoris, commonly known as angina, is severe chest pain due to ischemia (a lack
of blood and hence oxygen supply) of the heart muscle, generally due to obstruction or
spasm of the coronary arteries (the heart's blood vessels). Coronary artery disease, the main
cause of angina, is due to atherosclerosis of the cardiac arteries.
Myocardial ischemia comes about when the myocardia (the heart muscles) receive
insufficient blood and oxygen to function normally either because of increased oxygen
demand by the myocardia or by decreased supply to the myocardia. This inadequate
perfusion of blood and the resulting reduced delivery of oxygen and nutrients is directly
correlated to blocked or narrowed blood vessels.
1.4.1 Types of Angina
1.Stable angina
2.Unstable angina
1.4.1.1 Stable Angina: Stable angina occurs during exertion, can be quickly
relieved by resting or taking nitroglycerin, and lasts from three to twenty minutes.
1.4.1.2 Unstable angina: Unstable angina increases the risk of a heart attack, occurs
more frequently, lasts longer, is more severe, and may cause discomfort during rest or
light exertion.

11
Fig1.7Plaque formation and blood clots in the arteries‘walls
1.5 Myocardial Infarction
Myocardial infarction (MI) or acute myocardial infarction (AMI), commonly known
as a heart attack, is the interruption of blood supply to part of the heart, causing some
heart cells to die. This is most commonly due to occlusion (blockage) of a coronary artery
following the rupture of a vulnerable atherosclerotic plaque, which is an unstable
collection of lipids (fatty acids) and white blood cells (especially macrophages) in the
wall of an artery. The resulting ischemia (restriction in blood supply) and oxygen
shortage, if left untreated for a sufficient period of time, can cause damage or death
(infarction) of heart muscle tissue (myocardium).
12
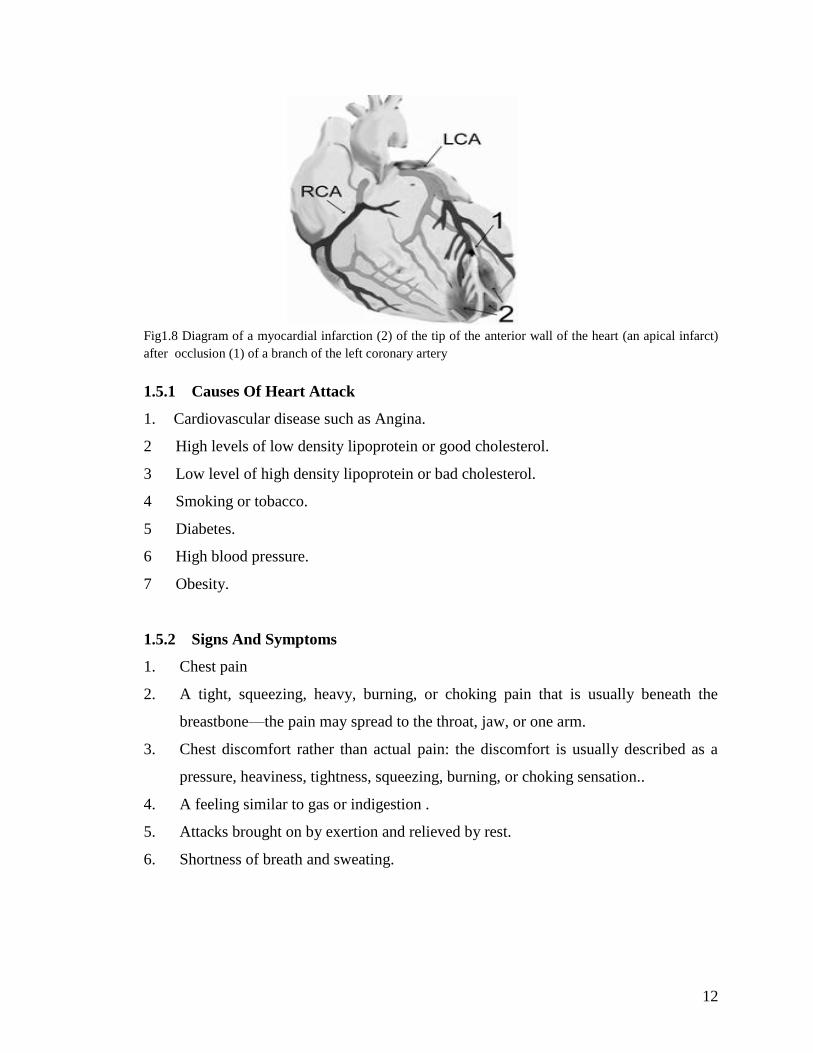
Fig1.8 Diagram of a myocardial infarction (2) of the tip of the anterior wall of the heart (an apical infarct)
after occlusion (1) of a branch of the left coronary artery
1.5.1 Causes Of Heart Attack
1. Cardiovascular disease such as Angina.
2 High levels of low density lipoprotein or good cholesterol.
3 Low level of high density lipoprotein or bad cholesterol.
4 Smoking or tobacco.
5 Diabetes.
6 High blood pressure.
7 Obesity.
1.5.2 Signs And Symptoms
1. Chest pain
2. A tight, squeezing, heavy, burning, or choking pain that is usually beneath the
breastbone—the pain may spread to the throat, jaw, or one arm.
3. Chest discomfort rather than actual pain: the discomfort is usually described as a
pressure, heaviness, tightness, squeezing, burning, or choking sensation..
4. A feeling similar to gas or indigestion .
5. Attacks brought on by exertion and relieved by rest.
6. Shortness of breath and sweating.

13
1.6 Electrocardiogram(ECG)
The electrocardiogram (ECG or EKG) is a diagnostic tool that measures and records the
electrical activity of the heart in exquisite detail. Interpretation of these details allows
diagnosis of a wide range of heart conditions. These conditions can vary from minor to
life threatening. The ECG is a graphic record of the direction and magnitude of the
electrical activity that is generated by depolarization and repolarization of the atria and
ventricles. One cardiac cycle in an ECG signal consists of the P-QRS-T waves. Most of
the clinically useful information in the ECG is found in the intervals and amplitudes
defined by its features (characteristic wave peaks and time durations). The development
of accurate and quick methods for automatic ECG feature extraction is of major
importance, especially for the analysis of long recordings.
The ECG has evolved over the years.
1. The standard 12-lead ECG is used.
2. It is called a 12-lead ECG because it examines the electrical activity of the heart from
12 points of view.
3. This is necessary because no single point (or even 2 or 3 points of view) provides a
complete picture of what is going on.
1.6.1 Heart Function And The ECG
The heart normally beats between 60 and 100 times per minute, with many normal
variations. For example, athletes at rest have slower heart rates than most people. This
rate is set by a small collection of specialized heart cells called the sinoatrial (SA) or
sinus node.
Located in the right atrium, the sinus node is the heart's "natural pacemaker."
1. It has "automaticity," meaning it discharges all by itself without control from the
brain.

14
2. Two events occur with each discharge: (1) both atria contract, and (2) an electrical
impulse travels through the atria to reach another area of the heart called the
atrioventricular (AV) node, which lies in the wall between the 2 ventricles.
3. The AV node serves as a relay point to further propagate the electrical impulse.
4. From the AV node, an electrical wave travels to both ventricles, causing them to
contract and pump blood.
5. The normal delay between the contraction of the atria and of the ventricles is 0.12 to
0.20 seconds. This delay is perfectly timed to account for the physical passage of the
blood from the atrium to the ventricle. Intervals shorter or longer than this range
indicate possible problems.
The ECG records the electrical activity that results when the heart muscle cells in the
atria and ventricles contract.
6. Atrial contractions (both right and left) show up as the P wave.
7. Ventricular contractions (both right and left) show as a series of 3 waves, Q-R-S,
known as the QRS complex.
8. The third and last common wave in an ECG is the T wave. This reflects the electrical
activity produced when the ventricles are recharging for the next contraction
(repolarizing).
Fig1.9.:Heart Functioning

15
1.6.2 Waves And Intervals
Fig1.10.One-cycle ECG tracing is shown.
Feature Description Duration
P-Wave
During normal atrial depolarization, the main electrical vector is
directed from SA node towards the AV node, and spreads from the
right atrium to the left atrium. This turns into the P wave on the
ECG.
80ms
QRS
Complex
The QRS complex corresponds to the depolarization of the right
and left ventricles. 70-
110ms
ST segment The ST segment connects the QRS complex and the T wave.
80-
120ms
T-Wave
The T wave represents the repolarization (or recovery) of the
ventricles. The interval from the beginning of the QRS complex to
the apex of the T wave is referred to as the absolute refractory
period. The last half of the T wave is referred to as the relative
refractory period (or vulnerable period).
160ms
PR interval
The PR interval is measured from the beginning of the P wave to
the beginning of the QRS complex. 120-
200ms

16
ST interval
The ST interval is measured from the J point to the end of the T
wave.
320ms
QT interval
The QT interval is measured from the beginning of the QRS
complex to the end of the T wave. 300-
430ms
Table1.1 ECG parameters description
1.7 ST Segment
The ST interval is measured from the J point to the end of the T wave. The S point is
identified as the first inflection after the Rwave. In normal ECG, the S point can be
recognised as a relative minimum after the R-wave. Generally, it can be recognised by a
change in the slope of the ECG signal. The T-wave is the inflection after the S point and
within 0.75 of the RR interval. Ischaemia is caused by insufficient blood supply to the
heart muscle. The most important ECG change caused by myocardia1 ischemia is the ST
elevation on the epicardium . It relates to a delay in conduction velocity due to
accumulation of [K+] in the ischemic zone relative to the normal zone. This causes a
depolarization of the resting membrane potential and leads to ST elevation and TQ
depression. The ST-level is widely being used as an electrocardiographic indicator of
ischemic states of the myocardium during physical stress and silent ischemia episodes.
Unfortunately, not all ischemic states are reflected by the ST-level on the body surface,
and not all ECG leads respond to time-varying coronary perfusion by means of ST-level
changes. The extent of subendocardial underperfusion and related transmural potential
gradients were shown to strongly influence the ST measure during ischemia. Elevation
and depression of the ST segment together with the T-wave changes indicate the zone of
ischaemia around the applied lead. Therefore, the ST slope is the most important feature
of the ECG for investigating myocardial ischaemia. The ST level is the maximum
deviation from the isoelectric level.

17
Fig1.11 Negative ST Deviation (top row), positive ST deviation (middle row) and normal (bottom row)
1.7.1 STEMI and NSTEMI
STEMI is an acronym meaning "ST segment elevation myocardial infarction," which is a
type of heart attack. This is determined by an electrocardiogram (ECG) test.
Myocardial infarctions(heart attacks) occur when a coronary artery suddenly becomes at
least partially blocked by a blood clot, causing at least some of the heart muscle being
supplied by that artery to become infarcted (that is, to die). Heart attacks are divided into
two types, according to their severity. A STEMI is the more severe type.
In a STEMI, the coronary artery is completely blocked off by the blood clot, and as a
result virtually all the heart muscle being supplied by the affected artery starts to die.
This more severe type of heart attack is usually recognized by characteristic changes it
produces on the ECG. One of those ECG changes is a characteristic elevation in what is

18
called the "ST segment." The elevated ST segment indicates that a relatively large
amount of heart muscle damage is occurring (because the coronary artery is totally
occluded), and is what gives this type of heart attack its name.
NSTEMI
NSTEMI is an acronym meaning "non-ST segment elevation myocardial infarction,"
which is a type of heart attack. This is determined by a electrocardiogram (ECG) test.
Myocardial infarctions (heart attacks) occur when a coronary artery suddenly becomes
occluded by a blood clot, causing at least some of the heart muscle being supplied by that
artery to become infarcted (that is, to die). Myocardial infarctions are divided into two
types, according to their severity. A NSTEMI is the less severe type.
In a NSTEMI, the blood clot only partly occludes the artery, and as a result only a portion
of the heart muscle being supplied by the affected artery dies.
In contrast to the more severe form of heart attack (the STEMI), the NSTEMI does not
produce characteristic elevation in the "ST segment" portion of the ECG. (ST segment
elevation indicates that a relatively large amount of heart muscle damage is occurring,
because the coronary artery is totally blocked). This means that in a NSTEMI, the artery
is only partially blocked.
1.7.2 ST Segment Depression
ST segment depression can be caused by ischemia, digitalis, rapid heart rate, and
temperature or electrolyte abnormality. It can also be a ―reflected‖ or reciprocal ST
elevation (showing an inverted view of what‘s happening at another place in the heart).
The shape of the ST segment, and whether the abnormality is localized to leads looking at
one area of the heart, often allows the cause of ST depression to be diagnosed. ST
segment depression is considered significant if the ST segment is at least one box below
baseline, as measured two boxes after the end of the QRS. As with infarction, the location

19
of the ischemia is reflected in the leads in which the ST depression occurs. When ST
deviation is more than 0.08 mV below the isoelectric line and has an angle larger than
65degree measured from vertical line, it is considered as negative ST deviation or ST
depression. The second rule classifies beat as ischemic if ST deviation is more than 0.08
mv above the isoelectric line (ST elevation).
1.8 Isoelectric Line
Isoelectric line is the flat parts of the ECG, for example between the T and P waves or
between the P wave and the QRS complex.
Fig1.12 Isoelectric line between P wave and QRS complex
ST segment‘s relative level with respect to isoelectric level can be determined which is
used for ischemia detection. If this segment is significantly below the isoelectric line it is
called ST segment depression and it suggests that part of the subject‘s myocardium is not
getting enough oxygen (myocardial ischema). This segment is also frequently elevated
(ST segment elevation) above the isoelectric line in the early stages of a myocardial
infarction.
1.9 Wavelet Transform
The transform of a signal is just another form of representing the signal. It does not
change the information content present in the signal. The Wavelet Transform provides a
time-frequency representation of the signal. It was developed to overcome the short
coming of the Short Time Fourier Transform (STFT), which can also be used to analyze

20
non-stationary signals. While STFT gives a constant resolution at all frequencies, the
Wavelet Transform uses multi-resolution technique by which different frequencies are
analyzed with different resolutions.
A wave is an oscillating function of time or space and is periodic. In contrast, wavelets
are localized waves. They have their energy concentrated in time or space and are suited
to analysis of transient signals. While Fourier Transform and STFT use waves to analyze
signals, the Wavelet Transform uses wavelets of finite energy.
(a) (b)
Figure 1.13 Demonstration of (a) a Wave and (b) a Wavelet
The wavelet analysis is done similar to the STFT analysis. The signal to be analyzed is
multiplied with a wavelet function just as it is multiplied with a window function in
STFT, and then the transform is computed for each segment generated. However, unlike
STFT, in Wavelet Transform, the width of the wavelet function changes with each
spectral component. The Wavelet Transform, at high frequencies, gives good time
resolution and poor frequency resolution, while at low frequencies, the Wavelet
Transform gives good frequency resolution and poor time resolution.
1.9.1 The Continuous Wavelet Transform and the Wavelet Series
The Continuous Wavelet Transform (CWT) is provided by equation 2.1, where x(t) is the
signal to be analyzed. ψ(t) is the mother wavelet or the basis function. All the wavelet
functions used in the transformation are derived from the mother wavelet through
translation (shifting) and scaling (dilation or compression).
XWT(τ,s) =

21
The mother wavelet used to generate all the basis functions is designed based on some
desired characteristics associated with that function. The translation parameter τ relates to
the location of the wavelet function as it is shifted through the signal. Thus, it
corresponds to the time information in the Wavelet Transform. The scale parameter s is
defined as |1/frequency| and corresponds to frequency information. Scaling either dilates
(expands) or compresses a signal. Large scales (low frequencies) dilate the signal and
provide detailed information hidden in the signal, while small scales (high frequencies)
compress the signal and provide global information about the signal.
1.9.2 Discrete Wavelet Transform
The Wavelet Series is just a sampled version of CWT and its computation may consume
significant amount of time and resources, depending on the resolution required. The
Discrete Wavelet Transform (DWT), which is based on sub-band coding is found to yield
a fast computation of Wavelet Transform. It is easy to implement and reduces the
computation time and resources required.
In CWT, the signals are analyzed using a set of basis functions which relate to each other
by simple scaling and translation. In the case of DWT, a time-scale representation of the
digital signal is obtained using digital filtering techniques. The signal to be analyzed is
passed through filters with different cutoff frequencies at different scales.

22
CHAPTER-2
Literature Survey
2.1 Recognition of the Shape of the ST Segment in ECG Waveforms
In October 1986, E. Skordalakis presented a method which recognizes the shape of the
ST segment. This method when applied to an ST segment gives as results of the onset
and the end of the ST segment and the equation of a straight line or of a parabola that
best approximates this ST segment. The method is based on the idea that since the ST
segment is supposed to be either a line segment or a parabolic segment, its recognition
can be made by approximating it first by a straight line and then by a parabola, and
choosing among these two approximations the one with the smaller error norm. Such a
method for the recognition of the ST segment cannot be implemented because in actual
practice it is very difficult to calculate the endpoint of the ST segment. A way to
overcome this difficulty is to take a segment larger than the ST segment but with the
following constraints: 1) it incorporates the ST segment, 2) its onset as well as its end can
be reliably calculated, and 3) it can be divided into subsegments in such a way that one of
them is the ST segment. The method presented in this paper has not been gone
through a strict evaluation procedure because of lack of a test set of data. Despite it, it can
be said that the results taken so far are satisfactory and so the method deserves
consideration.
2.2 Detection And Extraction Of The Ecg Signal Parameters
In 1998, H. Gholam - Hosseini et. al presented a set of efficient techniques to extract
important features from the ECG data applicable in automatic cardiac arrhythmia
classification. The selected parameters are divided into two main categories namely
morphological and statistical features. Extraction of morphological features were
achieved using signal processing techniques and detection of statistical features were

23
performed by employing mathematical methods. The morphological features are found
most effective method for further ECG signal analysis and the mathematical approach is
preferred for a precise and robust feature extraction. A computer based ECG signal
classifier can be developed by employing the extracted features for detection of a vast
range of cardiac arrhythmias.
2.3 ECG Analysis Using Nonlinear PCA Neural Networks for Ischemia Detection
In November,1998, T. Stamkopoulos, et. al is investigated that the detection of ischemic
cardiac beats from a patient‘s electrocardiogram (ECG) signal is based on the
characteristics of a specific part of the beat called the ST segment. An algorithm is
developed for this feature extraction based on nonlinear principal component analysis
(NLPCA). NLPCA is a relatively recently proposed method for nonlinear feature
extraction that is usually implemented by a multilayer neural network. The algorithm was
tested in application to the detection of ischemic beats in ECG Holter recordings, which
is one of the most important biomedical signal processing problems. The method
apparently exhibits superior performance compared with other methods using PCA/NN
for ischemic beat/episode detection.
2.4 Advanced Detection Of ST Segment Episodes In 24-Hour Ambulatory ECG
Data By Automated Tracking Of Transient ST Segment Reference Level
In year 2002, A Smrdel, F.Jager developed an algorithm for automated detection of
transient ST segment episodes in 24-hour ambulatory data. To detect ST change episodes,
the algorithm automatically tracks the time-varying ST segment reference level due to
clinically not important non-ischemic causes and subtracts it from the ST segment level.
Tracking the ST segment reference level is crucial ability for the reliable ST segment
episode detection, resulting in high sensitivity and positive perdictivity. Further
improvements of the algorithm are planned by incorporating information of raw signal
waveform.

24
2.5 Long-term ST database: a reference for the development and evaluation of
automated ischaemia detectors and for the study of the dynamics of myocardial
ischaemia:
In year 2003, F.Jager et. al goal was to develop a challenging and realistic research
resource for development and evaluation of automated systems to detect transient ST
segment changes in electrocardiograms and for supporting basic research into the
mechanisms and dynamics of transient myocardial ischaemia. Twenty-four hour
ambulatory ECG records were selected from routine clinical practice settings in the USA
and Europe, between 1994 and 2000, on the basis of occurrence of ischaemic and
nonischaemic ST segment changes. Human expert annotators used newly developed
annotation protocols and a specially developed interactive graphic editor tool (SEMIA)
that supported paperless editing of annotations and facilitated international co-operation
via the Internet. The database contains 86 two- and three-channel 24 h annotated
ambulatory records from 80 patients and is stored on DVD-ROMs. The database
annotation files contain ST segment annotations of transient ischaemic (1155) and heart-
rate related ST episodes and annotations of non-ischaemic ST segment events related to
postural changes and conduction abnormalities. The database is intended to complement
the European Society of Cardiology ST-T database and the MIT-BIH and AHA
arrhythmia databases.
2.6 Simulation of ST Segment Changes During Subendocardial Ischemia Using a
Realistic 3-D Cardiac Geometry
In May 2005, Mary C. MacLachlan , et. al investigated that a realistic three-dimensional
model of the ventricles, including fiber rotation and anisotropy, is embedded in a
nonhomogeneous torso model. A simplification of the bidomain model is used to
calculate only the ST segment shift. The simulation results suggest that subendocardial
ischemia can be located by ST segment shift on the epicardial and torso surfaces.
Simulation results have shown both ST elevation and depression associated with the
subendocardial ischemic region, elevation above the transmural boundary and depression

25
above the lateral boundaries. In this case, it appears that the precordial leads are facing
the transmural boundary. Simulations presented here can be concluded that
subendocardial ischemia is indeed locatable by ST segment shift above the ischemic
region on both the epicardial and torso surfaces. The results show that both ST depression
(lateral boundaries) and ST elevation (transmural boundary) can be associated with
subendocardial ischemia.
2.7 A QRS detection method using analog wavelet transform in ECG analysis
In June 2005, M.J. Vaessen investigated that low power implementable devices like the
pacemaker need good sensing circuits to correctly analyze the cardiac signal and take
appropriate actions. Existing methods are reaching their limits on sensing abilities. An
approximation of the wavelet transform (WT), that can be implemented in an analog
dynamic translinear circuit, can be used to further the advances of cardiac signal sensing
and lead to better pacemakers. A method is presented for automatic QRS complex
detection in an ECG signal for use with an analog implementation of the wavelet
transform. He concluded that by using the modulus maxima in the WT and the time
differences between them, QRS complex detection rates are up to 98% on the MIT/BIH
database.
2.8 ECG Feature Extraction Based on Multiresolution Wavelet Transform
In September 2005,S. Z. Mahmoodabad et al. have developed and evaluated an
electrocardiogram (ECG) feature extraction system based on the multi-resolution wavelet
transform. ECG signals from Modified Lead II (MLII) are chosen for processing. In the
first step, the ECG signal was de-noised by removing the corresponding wavelet
coefficients at higher scales. Then, QRS complexes are detected and each complex is
used to locate the peaks of the individual waves, including onsets and offsets of the P and
T waves which are present in one cardiac cycle. The proposed wavelet based feature
extraction system achieved good detection performance on the MIT – BIH database. The
QRS detector attained sensitivity of 99.18% 2.75 and a positive predictivity of 98.00%�
4.45 on the first lead of the validation databases among 46 records.

26
2.9 Challenge 2006: QT Interval Measurement
In year 2006, R Schneider, A Bauer, et. al implemented an algorithm which performs
beat detection, measures wave boundaries on a beat-to-beat basis and selects a
representative beat whose QT interval is used. To get the positions of the wave
boundaries, the algorithm searches for peaks in the 1st derivative of bandpass filtered
ECG signals using thresholds which are adapted to the amplitudes in the segments of
interest. When the peaks associated with the QRS complex and the T wave are found, the
beginning of the QRS complex and the end of the T wave are assessed. The score of our
approach is 70.94ms. the main reason for the poor performance of our approach is that
we looked only in one lead and did not use the information of the other leads. Another
deficit of our approach is the lack of plausibility checks. One simple plausibility check
could be that only QT intervals between 250ms and 500ms are allowed all beats with a
QT interval outside this range are excluded.
2.10 Detection of ST Segment Deviation Episodes in the ECG using KLT with an
Ensemble Neural Classifier
In year 2007, Fayyaz A. Afsarl et. al describe a technique for the automatic detection of
ST Segment deviations for the diagnosis of Coronary Heart Disease (CHD) using
ambulatory ECG recordings through the application of lead-dependent Karhunen-Loeve
Transform (KLT) bases for dimensionality reduction of ST Segment Data. Preprocessing
is carried out prior to the extraction of the ST Segment which involves noise and artifact
filtering using a digital band-pass filter, baseline removal and application of a Discrete
Wavelet Transform (DWT) based technique for detection and delineation of the QRS
Complex in the ECG. ST deviation episodes are detected by a classifier ensemble
comprising of Back Propagation Neural Networks. A comparison of the proposed method
with other techniques in the literature has done which shows that the proposed method
outperforms all existing techniques for ST deviation. The results obtained through the use
of this method, (Sensitivity/Positive Predictive Value) of (90.75%/89.2%) compare well
with those given in existing research and exhibit the potential of this method to be
adopted in the design of a practical ischemia detection system. These results can be

27
improved further but caution must be taken to evaluate the accuracies of the database
annotations themselves as it can affect the generalization performance of the system on
other databases.
2.11 Automatic Distinguishing Between Ischemic and Heart-Rate Related Transient
ST Segment Episodes in Ambulatory ECG Records
In year 2008, J Faganeli, et.al investigated that ischemia is manifested by transient ST
segment episodes which may or may not be accompanied by increase in heart rate. There
can also be transient non-ischemic ST segment morphology-change episodes which are
not caused by an obstruction of the blood flow to the heart, but are caused by
simultaneous change in heart rate. These transient non-ischemic heart-rate related ST
segment episodes complicate automatic detection of true ischemia. The goal of this work
was to automatically distinguish between transient ischemic and heart-rate related ST
segment episodes. The ST segment deviation change is higher in ischemic episodes and
the ST segment slope change is higher in heart-rate related episodes. The ST segment
shape changes more in ischemic episodes. The change of the first Legendre coefficient
represents the change of the ST segment deviation and is higher in ischemic episodes.
The change of the second coefficient, represents the change of the ST segment slope
and is similar in both types of episodes as well. The change of the third coefficient
represents the scooping of the ST segment and is not significant.
2.12 Detection Of The QRS Complex, P Wave And T Wave In Electrocardiogram
K. F. Tan, et. al proposed two QRS detection methods are studied. The first method, the
―So and Chan‖ method, is based on the maximum slope detection with the QRS onset
selected when two successive values of the slope exceed the threshold. The second
method is developed by Pan and Tompkins. American Heart Association (AHA) ECG
data files are used to test these two QRS detection methods. Our results show that the ―So
and Chan‖ method performs better than the ―Pan and Tompkins‖ method. Further
development continues on the ―So and Chan‖ method. This is due both to lower false
positive and false negative results. Based on the information of the identified QRS

28
complexes, the P waves and the T waves are also be detected. However, in some
circumstances, the detected T wave in the previous beat is overlapped with the P wave in
the current beat. Therefore, the autocorrelation approach to ECG classification is carried
out using only the information of the QRS complex.
2.13 Adaptive ECG Filtering And QRS Detection Using Orthogonal Wavelet
Transform.
Alice de Jesus Kozakevicius, et. al presented an orthogonal wavelets to filter and analyse
ECG signals. First, they used compactly supported wavelets associated to the statistical
Stein‘s Unbiased Risk Estimator (SURE) in order to obtain an adaptive thresholding
strategy to filter ECG signals. Second, the filtered signals are analyzed by using the
Haar wavelet transform in order to detect the positions of the occurrence of the QRS
complex during the period of analysis. Through the SURE adaptive wavelet thresholding
all irrelevant noise are removed of the signal, allowing the utilization of a simple wavelet
transform in the QRS detection. The main advantage of this kind of detection is a less
time consuming analysis for long time ECG signal.
2.14 An Automated System for On-line Monitoring and Detection of ST Changes in
ECG Signal.
M. Mohebbi, et. al presented a new automated system for on-line monitoring and
detection of ST changes in one channel electrocardiograms (ECG). This system consists
of a preprocessing step for QRS detection, baseline wandering removal, and noise
suppression. In the next step, the system uses a normal beat template as reference and a
set of rules defined by cardiologists for detecting ischemic beats based on ST
slope/deviation measurements. In the third step, the system uses a window classification
for detecting sequences of ischemic beats. In the final step ischemic episodes in ECG
signal are detected by merging sequences which are close together. The performance of
the system was evaluated using a subset of ESC ST-T database including 48 records. This
evaluation demonstrated high sensitivity (94.5%) and good positive predictivity (85.03%)
of our system. Short processing time and acceptable accuracy of the proposed method,

29
are its main advantages and enable it to be used in real time ischemic episodes detection
systems and reliable clinical monitoring of the patient status.

30
CHAPTER-3
Problem Definition
The most important ECG change caused by myocardia1 ischemia is the ST segment
change. Elevation and depression of the ST segment together with the T-wave changes
indicate the zone of ischaemia around the applied lead. Therefore, to identify the ST
segment is the most important feature of the ECG for investigating myocardial ischaemia.
One of the ways to identify ischemia is to compare the level of ST segment with the
isoelectric line level. Isoelectric line is that potential potential which is recorded by ECG
machine when there is no cardiac activity. Generally, it is defined as the flat parts of the
EKG that is between the P wave and the QRS complex .
Therefore, to compare these two levels(ST segment level and isoelectric line
level) ,it is essential that PQ segment and ST segment to be identified which further
requires the identification of QRS complex. The objective of the work is to identify QRS
complex, isoelectric line and its level and ST segment and its level.

31
CHAPTER-4
Problem Solution And Implementation
4.1 Overview
The detection of ST segment deviation is the most important task in detection of
ischemia. Several mathematical transforms have been applied to the ECG for ischemia
detection such as the discrete cosine transform (DCT), the discrete Fourier transform
(DFT), the Karhunen-Loève transform (KLT) and wavelet transform . Other techniques
such as artificial neural networks, fuzzy-logic and rule-based have been also proposed
literature for ST segment deviation detection. In this , we describe a technique for
automatic detection of ST segment deviations that can be used in the diagnosis of
coronary heart disease (CHD) using ambulatory electrocardiogram (ECG) recordings. We
are presenting a very simple algorithm based on Haar wavelet coefficients to detect QRS
complex positions and then determine the ST segment‘s relative level with respect to
isoelectric level which is later used for ischemia detection.
The algorithm should take (at least) the following into account:
Preprocessing
QRS detection
Detection of isoelectric level
Detection of ST segment level
Comparison of amplitudes
4.2 MATLAB Simulink
MATLAB is a high-level technical computing language and interactive environment for
algorithm development, data visualization, data analysis, and numeric computation.
Using the MATLAB product, you can solve technical computing problems faster than
with traditional programming languages, such as C, C++, and Fortran.

32
You can use MATLAB in a wide range of applications, including signal and image
processing, communications, control design, test and measurement, financial modeling
and analysis, and computational biology. Add-on toolboxes (collections of special-
purpose MATLAB functions, available separately) extend the MATLAB environment to
solve particular classes of problems in these application areas.
MATLAB provides a number of features for documenting and sharing your work. You
can integrate your MATLAB code with other languages and applications, and distribute
your MATLAB algorithms and applications.
4.2.1 Key Features
High-level language for technical computing
Development environment for managing code, files, and data
Interactive tools for iterative exploration, design, and problem solving
Mathematical functions for linear algebra, statistics, Fourier analysis, filtering,
optimization, and numerical integration
2-D and 3-D graphics functions for visualizing data
Tools for building custom graphical user interfaces
Functions for integrating MATLAB based algorithms with external applications and
languages, such as C, C++, Fortran, Java, COM, and Microsoft Excel
4.3 Database
The Long-Term ST Database (LTST DB) contains 86 2- or 3-lead 24-hour ambulatory
ECG records, sampled at 250 samples s−1
per channel, and is intended for development
and testing of automatic ischemia detectors. The records were collected during routine
clinical practice to model significant number of real-world clinical conditions. During
development of the LTST DB, a considerable preprocessing phase took place in order to
derive a number of time series of diagnostic and morphologic parameters. The goals of
the LTST DB are:

33
(a) more adequately to represent the wide variety of realworld data that typically
challenge real-time automatic ischaemia detectors. The database should include a
meaningful number of:
_ transient ST segment episodes compatible with ischaemia (ischaemic ST episodes)
_ non-ischaemic ST episodes due to changes in heart rate (heart-rate related ST episodes)
_ non-ischaemic slow ST segment drifts
_ non-ischaemic ST shifts due to postural changes (axis shifts)
_ non-ischaemic ST shifts due to changes in ventricular conduction (conduction changes)
_ data corrupted by noise and artifacts
(b) to provide sufficient data in each record adequately to represent a variety of
characteristic temporal patterns and
dynamics of episodic ischaemia
(c) to include a variety of arrhythmias to support studies on their possible correlations
with transient ischaemia.
4.4 Methodology
4.4.1 Preprocessing
In first stage, preprocessing of ECG recording is carried out prior to the extraction of the
ST segment which involves removal of noise and rejection of artifact. The standard least-
square polynomial curve-fitting technique has been used. This is done in order to avoid
the step line quantization error so that the reconstructed signal is acceptable to the
physician. In the present work, effect of the use of different standard least-square
polynomial curve fitting techniques is considered in detail.
4.4.1.1 Least Square Polynomial Smoothing Filter
This family of finite impulse response filters, fits a parabola to an odd number (2L + 1) of
input data points in a least-square sense (L is an integer). Figure(3.1a) shows that the
output of the filter is the midpoint of the parabola. Writing the equation for a parabola at
each point, we obtain:

34
p(nT+kT) = a(nT) + b(nT).k + c(nT).k2
where k ranges from –L to +L.
Fig4.1(a) Parabolic fitting of groups of seven sampled datapoints. (b) Signal flow graph
The fit is found by selecting a(nT), b(nT) and c(nT) to minimize the squared error
between parabola and input data. Setting the partial-derivatives of the error with respect
to a(nT), b(nT) and c(nT) equal to zero results in a set of simultaneous equations in a(nT),
b(nT), c(nT), k and p(nT − kT). Solving to obtain an expression for a(nT), the value of the
parabola at k = 0 yields an expression, a function of the input values. The coefficients of
this expression are the tap weights for the least-square polynomial filter as shown in the
signal flow graph of figure(4.1b) for a 7-point filter.
The difference equation for the 7-point parabolic filter is:
H(z) = 1/21[-2 + 3z-1
+ 6z-2
+ 7z-3
+ 6z-4
+ 3z-5
+ -2z-6
]

35
4.4.1.1(a) Original ECG Signal
For ECG signal plot in MATLAB:
>> plot (origsignal);
>> title ('original signal');
>> xlabel ('time');
>> ylabel ('amplitude');
plot(origsignal) plots the columns of ‗origsignal‘ versus their index if ‗origsignal‘ is a
real number.
title ('original signal') outputs the string at the top and in the center of the current axes.
xlabel ('time') labels the x-axis of the current axes.
ylabel ('amplitude') labels the y-axis of the current axis.
Fig 4.2 Original ECG data plot
4.4.1.1(b) Denoised ECG Signal
Implementation of seven-point parabolic filter in MATLAB:
>>filtsignal=m(n)*7+m(n-1)*6+m(n-2)*3+m(n-3)*-2+m(n+1)*6+m(n+2)*3+m(n+3)*(-
2);
>>denois(n) = filtsignal/21;
>>subplot(2,1,2); plot(denois);
>>title('denoised signal');

36
>>xlabel('t');
>>ylabel('a');
Fig4.3 Filtered ECG signal using seven point parabolic filter
4.4.2 QRS Detection
The QRS complex duration is another important parameter employed in the analysis and
classification of the ECG signal. Because all other features, like the P and T waves and
the on- and offset of the QRS complex are defined relative to the QRS complex. This
parameter is defined as the time it takes for depolarization of the ventricles. Normal
depolarization requires normal functioning of the right and left bundle branches and it
varies from 0.04 to 0.09 seconds. Any block in either the right or left bundle branch
delays depolarization of the ventricle due to the blocked bundle. In abnormal cases the
QRS interval is 0.1 seconds or more. There is an intraventricular conduction delay when
the QRS interval is between 0.1 to 0.12 seconds. QRS intervals greater than 0.12 seconds
indicate bundle branch block .
In this section a simpler method is proposed, based on Haar transform, to obtain a
lightweight detection algorithm. On this algorithm, P and T waves are not detected, since
it is focused on counting and localizing abnormal QRS patterns for long time ECG
analysis. After we filtered the signal with the seven-point parabolic filter, Haar wavelet
transform is applied in order to capture small scale variations, which are intrinsic to the

37
signal. These variations will localize the QRS complex in each scale. Even in abnormal
cases, this behaviour is observed.
The following algorithm summarizes the procedure for detecting QRS
localization through Daubechie wavelet coefficients:
1. Apply Daubechie wavelets of order 1 on ECG in j levels;
2. Find the maximum wavelet coefficient for each level (max(cDj));
3. For each level select the details ( cD j,i ) associated to QRS complex using β1 = 0.5
(a weight of max (cD j ) ):
if |cDj,i| > β1 max (cDj) then position i ϵ QRS complex
else position i QRS complex
4. Identify different QRS complexes: cDj,i and cD j,i’ are consecutive selective
coefficients; β2 0.1 is 0.1*(standard QRS time duration);
t1/f 0.0005 ;
if (t = 2j t |i- i‘| < β2 then i, i‘ ϵ same QRS complex
else i, i‘ same QRS complex
4.4.2.1 Discrete Wavelet Transform
A discrete wavelet transform (DWT) is any wavelet transform for which the wavelets are
discretely sampled. As with other wavelet transforms, a key advantage it has over Fourier
transforms is temporal resolution: it captures both frequency and location information . it
converts an input series x0, x1, ..xm, into one high-pass wavelet coefficient series and one
low-pass wavelet coefficient series (of length n/2 each) given by:
Hi = (1)
Li= (2)
where sm(Z) and tm(Z) are called wavelet filters, K is the length of the filter, and i=0, ...,
[n/2]-1.

38
The DWT is computed by successive lowpass and highpass filtering of the discrete time-
domain signal as shown in figure 2.2. This is called the Mallat algorithm or Mallat-tree
decomposition. Its significance is in the manner it connects the continuous-time
mutiresolution to discrete-time filters. In the figure, the signal is denoted by the sequence
x[n], where n is an integer. The low pass filter is denoted by G0
while the high pass filter
is denoted by H0. At each level, the high pass filter produces detail information, d[n],
while the low pass filter associated with scaling function produces coarse
approximations, a[n].
Fig4.4.Four level wavelet decomposition tree
At each decomposition level, the half band filters produce signals spanning only half the
frequency band. This doubles the frequency resolution as the uncertainity in frequency is
reduced by half. In accordance with Nyquist‘s rule if the original signal has a highest
frequency of ω, which requires a sampling frequency of 2ω radians, then it now has a
highest frequency of ω/2 radians. It can now be sampled at a frequency of ω radians thus
discarding half the samples with no loss of information. This decimation by 2 halves the
time resolution as the entire signal is now represented by only half the number of
samples. Thus, while the half band low pass filtering removes half of the frequencies and
thus halves the resolution, the decimation by 2 doubles the scale. The choice of the
wavelet function depends on the application. The Haar wavelet algorithm has the
advantage of being simple to compute and easy to understand. The Daubechies algorithm
is conceptually more complex and has a slightly higher computational overhead. But, the
Daubechies algorithm picks up detail that is missed by the Haar wavelet algorithm. Even

39
if a signal is not well represented by one member of the Db family, it may still be
efficiently represented by another. Selecting a wavelet function which closely matches
the signal to be processed is of utmost importance in wavelet applications.
To make a 4-level wavelet decomposition of a signal m with Daubechie wavelets of order
1(db1) using the command line tools you write
>> [C,L] = wavedec(m,4,‘db1‘);
The coefficients of all the components of a fourth-level decomposition (that is, the four-
level approximation and the first four levels of detail) are returned concatenated into one
vector, C. Vector L gives the lengths of each component.
To extract the level 4 approximation coefficients from C, type
>>cA1 = appcoef(C,L,‘db1‘,1);
>>cA2 = appcoef(C,L,‘db1‘,2);
>>cA3 = appcoef(C,L,‘db1‘,3);
>>cA4=appcoef(C,L,'db1',4);
(a)
40
(b)
(c)
(d)
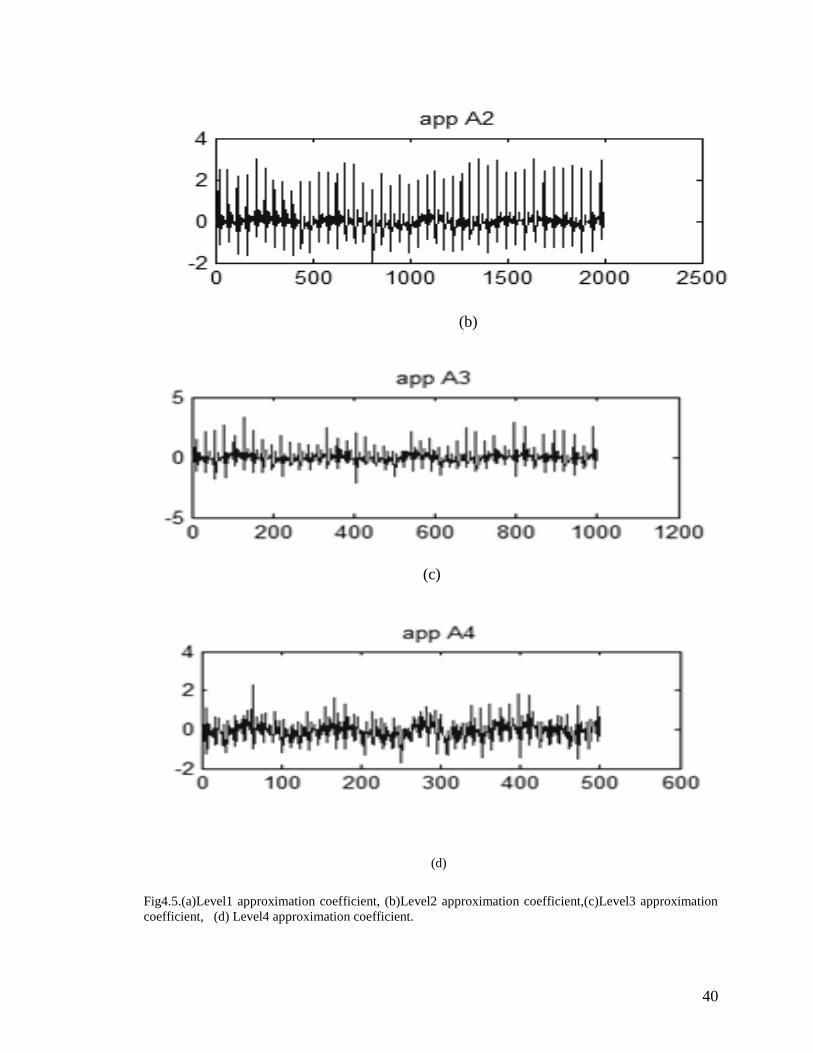
Fig4.5.(a)Level1 approximation coefficient, (b)Level2 approximation coefficient,(c)Level3 approximation
coefficient, (d) Level4 approximation coefficient.

41
To extract the levels 4,3, 2, and 1 detail coefficients from C, type
>>cD1 = detcoef(C,L,1);
>>cD2 = detcoef(C,L,2);
>>cD3 = detcoef(C,L,3);
>>cD4 = detcoef(C,L,4);
(a)
(b)
(c)

42
(d)
Fig4.6.(a)Level1 detail coefficients, (b) Level 2 detail coefficients,(c) Level 3 detail coefficients, (d) Level
4 detail coefficients
1. Find the maximum wavelet coefficient for each level (max(cDj));
MATLAB code for this is given below:
>> absval1=abs(cD1)
>> absval2=abs(cD2)
>> absval3=abs(cD3)
>> absval4=abs(cD4)
>> absval5=abs(cD5)
>> max1 = max(absval1)
>> max2 = max(absval2)
>> max3 = max(absval3)
>> max4 = max(absval4)
absvalj= abs(cDj) returns the absolute value of object cDj with same numeric type.
maxj = max(absvalj) returns the maximum value along different dimensions of an array.
2. For each level select the details ( cD j,i ) associated to QRS complex using β1 =
0.5 (a weight of max (cD j ) ):
MATLAB code for this is given below:
>> detail1=max1/2
>>detail2=max2/2
>>detail3=max3/2
>>detail4=max4/2

43
>>len1=length(absval1);
>>k=1;
>>for loop1=1:len1
>> if(absval1(loop1)>deatil1)
>> mat1(k)=2*loop1;
>> k=k+1;
>> else
>> end;
>> end
>> len2=length(absval2);
>> k=1;
>> for loop2=1:len2
>> if(absval2(loop2)>detail2)
>> mat2(k)= 4*loop2;
>> k=k+1;
>> else
>> end;
>> end
>> len3=length(absval3)
>> k=1;
>> for loop3=1:len3
>> if(absval3(loop3)>detail3)
>> mat3(k)=8*loop3;
>> k=k+1;
>> else
>> end;
>> end
>> len4=length(absval4);
>>k=1;
>> for loop4=1:len4

44
>> if(absval4(loop4)>detail4)
>> mat4(k)=16*loop4;
>> k=k+1;
>> else
>> end;
>> end
The position of above calculated matrix values in mat1,mat2,mat3,mat4 belong to QRS
complex.
3. Identify different QRS complexes: cDj,i and cD j,i’ are consecutive selective
coefficients; β2 0.1 is 0.1*(standard QRS time duration)
MATLAB code for peak identification is given by:
>> newdata = [mat1 mat2 mat3 mat4];
>> sortdata = sort(newdata);
>> lendata=length(sortdata);
>> s=1;
>> for t=1:(lendata-1)
>> diff = sortdata(t+1)-sortdata(t);
>> if (diff<10)
>> limit1(s)=sortdata(t);
>> s=s+1;
>> else
>> break;
>> end;
>> end
>> r=length(limit1);
>> k=1;
>> for i=limit1(1):limit1(r)
>> peakdet(k)=abs(denois(i));
>> k=k+1;
>> end

45
>> rpeak=max(peakdet);
>> length1=length(peakdet);
>> for x=1:length1
>> if (peakdet(x)==denois)
>> peak1=limit1(1)+(x);
>> end;
>> end
With the application of above code to the pairs having difference in their elements less
than 10 in the sortdata matrix, the total number of peaks detected were 41 which when
visually compared with original data having actually 42 peaks. And no false peak is
detected.
4.4.3 Detection of Isoelectric Level
Isoelectric line is the flat parts of the EKG, for example between the T and P waves or
between the P wave and the QRS complex. A band selection method is developed for the
detection of isoelectric level detection. In this, the results obtained from QRS detection
technique i.e: the magnitude of R-peak which is also known as first maxima of the ECG
signal.
Firstly, small overlapping bands are chosen between the maxima and minima of QRS
peak. Each band is 0.05mV wide and the two consecutive bands are differentiated by
0.1mV.
MATLAB code for this is given by:
>> steps = floor((rpeak-peakmin1)/0.05);
>> for n = 1:steps+1
>> nofpoints(n)=0;
>> end
>> j=1;
>> for w=peakmin1:0.05:rpeak
>> for i=1:length(isomat)-1
>> if (isomat(i)>w)&&(isomat(i)<(w+0.1))

46
>> nofpoints(j)=nofpoints(j)+1;
>> end;
>> end
>> j=j+1;
>> end
After the selection of bands, the population in each band upto 50 points to the left of
maxima is calculated using MATLAB coding. The band having maximum population of
points is considered as the most probable band and this is resulted as isoelectric line.
MATLAB code for this is given by:
>> isoband = max(nofpoints);
>> for j=1:steps
>> if (nofpoints(j)==isoband)
>> isoline=j;
>> lim_upper=(peakmin1+0.05*(isoline-1)+0.1);
>> lim_lower=(peakmin1+0.05*(isoline-1));
>> end;
>> end
After getting the limits of most probable band, isoelectric level is calculated by averaging
the points in this band and the result gives the level of isoelectric line and this level is
later used for comparison with ST segment level.
MATLAB code for isoelectric level detection is given by:
>> r=1;
>> for pt=1:length(m)-1
>> if (isomat(pt)<lim_upper)&&(isomat(pt)>lim_lower)
>> isomat(r)=isomat(pt);
>> r=r+1;
>> isosum= sum(isomat);
>> isoavg=isosum/isoband;
>> end;

47
>> end
The average level comes out to be -0.135mV which is the amplitude of isoelectric line
which when subtracted from ST segment level gives the deviation of ST segment.
4.4.4 Detection of ST segment level
The ST segment is the most important feature of the ECG for investigating myocardial
ischaemia. The ST interval is measured from the J point to the end of the T wave. The
elevation and depression of ST segment together with the T-wave changes indicate the
zone of ischaemia around the applied lead.
A similar method is developed for the detection of ST segment level. In this method the
small overlapping bands are chosen between the maxima and minima of QRS peak which
is detected by QRS detection method. Each selected band is 0.05mV wide and two
consecutive bands are diffentiated by 0.01mV.
MATLAB code for this is given by:
>> ststeps = floor((rpeak-peakmin1)/0.05);
>> for n = 1:steps+1
>> stnofpoints(n)=0;
>> end
>> p=1;
>> for v=peakmin2:0.05:peak2
>> for i=1:length(stmat)-1
>> if (stmat(i)>v)&&(stmat(i)<(v+0.1))
>> stnofpoints(p)=stnofpoints(p)+1;
>> end;
>> end
>> p=p+1;
>> end
After the selction of bands, the population in each selected band upto 50 points to the
right of maxima is calculated using MATLAB coding. The band having maximum

48
population of points is considered as the most probable band and this is resulted as the ST
segment.
MATLAB code for this is given by:
>> stband = max(stnofpoints);
>> for p=1:steps
>> if (stnofpoints(p)==stband)
>> stseg=p;
>> lim_upper_st=(peakmin1+0.05*(stseg-1)+0.1);
>> lim_lower_st=(peakmin1+0.05*(stseg-1));
>> end;
>> end
After getting the limits of ST segment band, ST segment level is calculated by averaging
the points in this band and the result gives the level of ST segment and this level is used
for ischaemia detection.
MATLAB code for ST segment level detection is given by:
>> r=1;
>> for pt=1:length(stmat)-1
>> if (stmat(pt)<lim_upper_st)&&(stmat(pt)>lim_lower_st)
>> stmat(r)=stmat(pt);
>> r=r+1;
>> stsum= sum(stmat);
>> stavg=stsum/stband;
>> end;
>> end
From the above implementation, it is seen that the average value comes out to be -
0.22mV which is considered as the ST segment amplitude.

49
4.4.5 Comparison of amplitudes of Isoelectric line and ST segment
The last step in the algorithm is to compare the ST segment level with the isoelectric line
level. If this segment is significantly below the isoelectric line it is called ST segment
depression and it suggests that part of the subject‘s myocardium is not getting enough
oxygen (myocardial ischema). This segment is also frequently elevated (ST segment
elevation) above the isoelectric line in the early stages of a myocardial infarction. When
ST deviation is more than 0.08 mV below the isoelectric line and has an angle larger than
65degree measured from vertical line, it is considered as negative ST deviation or ST
depression. The second rule classifies beat as ischemic if ST deviation is more than 0.08
mv above the isoelectric line which is considered as ST elevation.
Consider the results obtained from isoelectric line and ST segment level detection method
which are:
isoavg= -0.135mV and stavg= -0.22mV
When subtracted gives the result -0.085mV which shows that ST segment is deviated
below the isoelectric line and hence it is considered as ST depression or negative ST
deviation.

50
CHAPTER-5
Results And Discussion
Ischemia is a state of heart where supply of blood to heart is obstructed. As a result, if
this status is prolonged, this may result in dying of some of the cells which is also known
as necrosis. This ultimately may lead to heart attack that is also called Myocardial
Infarction. Given the importance of ischemia, it is important that we detect its presence at
an early stage. Many researchers have worked on detection of ischemia and knowing the
features of ECG, ischemia can be detected. It has been reported by many researchers that
one of the important parameter of detecting ischemia is by knowing the level of ST
segment. In most of the ischemic cases, the ST segment is either elevated or depressed.
This elevation or depression of ST segment is taken with respect to isoelectric line.
Table-5.1 Reports the actual and detected number of peaks
Age/Sex Data Number No.Of Peaks FALSE FALSE
Actual Detected Positive Negative
58M 20011 35 35 0 0
55M 20031 39 39 0 0
60M 20041 32 31 2 1
87F 20051 63 63 2 0
62F 20101 36 36 1 0
64M 20111 46 45 2 1
48F 20121 31 31 2 0
82F 20131 42 41 1 1
62M 20151 32 32 0 0
65M 20161 32 32 0 0
44M 20171 44 43 2 1
66M 20181 46 43 0 3
57M 20221 50 49 2 1
Undefined 20261 38 38 0 0
566 558
We define isoelectric line as the kind of level of ECG when there is no cardiac output and
normally it is defined as the level between the end of P-wave and start of QRS complex.
To establish the cases as ischemic, it is important that we understand the relative levels of
ST segment and that of isoelectric line. The important thing in this case becomes that we
detect both isoelectric line as well as the ST segment. As these two segments are

51
occurring immediately before and immediately after the QRS complex respectively, one
of the important steps in identifying the isoelectric line and ST segment line is to identify
QRS complex. In this research work, we have to start with detected QRS complexes in
large number of samples. Table-5.1 reported that algorithm which we have used using
wavelet transforms gives us the accuracy of 98.5% and having identified.
Next aspect was to know the relative position of ST segment and isoelectric line.
Isoelectric line was taken as the most probable voltage level for fifty samples before QRS
complex at the rate of 250samples per second. Similarly, ST segment is taken as the most
probable level for fifty samples after QRS complex. Having found the relative levels, we
take the ST segment to be elevated if it is 0.08mV above the isoelectric line and
depressed if it is 0.08mV below the isoelectric line otherwise it is taken as normal. The
result using this algorithm was compared with the visual inspection and is tabulated
below. We have taken 32seconds data from patient number s20101 and s20041 with
8000samples having sampling frequency 250samples per second.
Table-5.2 Reports the relative position of ST segment w.r.t isoelectric line(LTSTDB_s20101)
Database Age/Sex Data
used 62/F 20101
LTST-DB By Visual Check By Computer Algorithm
Peak 1 Elevated Elevated
Peak 2 Normal Normal
Peak 3 Normal Normal
Peak 4 Normal Normal
Peak 5 Normal Normal
Peak 6 Elevated Elevated
Peak 7 Depressed Depressed
Peak 8 Depressed Depressed
Peak 9 Depressed Depressed
Peak 10 Depressed Depressed
Peak 11 Normal Normal
Peak 12 Depressed Normal
Peak 13 Normal Normal
Peak 14 Depressed Depressed
Peak 15 Depressed Depressed
Peak 16 Depressed Depressed
Peak 17 Depressed Depressed
Peak 18 Depressed Depressed
Peak 19 Depressed Depressed

52
Peak 20 Depressed Depressed
Peak 21 Depressed Depressed
Peak 22 Normal Normal
Peak 23 Normal Normal
Peak 24 Depressed Depressed
Peak 25 Normal Normal
Peak 26 Depressed Depressed
Peak 27 Depressed Depressed
Peak 28 Depressed Depressed
Peak 29 Normal Normal
Peak 30 Depressed Depressed
Peak 31 Depressed Depressed
Peak 32 Normal Normal
Peak 33 Normal Normal
Peak 34 Normal Normal
Peak 35 Normal Normal
Peak 36 Normal Normal
Table-5.3 Reports the relative position of ST segment w.r.t isoelectric line(LTSTDB_s20041)
Database Age/Sex Data
used 62/F 20041
LTST-DB By Visual Inspection By Computer Algorithm
Peak 1 Depressed Depressed
Peak 2 Depressed Normal
Peak 3 Depressed Depressed
Peak 4 Depressed Depressed
Peak 5 Depressed Depressed
Peak 6 Depressed Depressed
Peak 7 Depressed Depressed
Peak 8 Depressed Depressed
Peak 9 Depressed Depressed
Peak 10 Depressed Depressed
Peak 11 Depressed Depressed
Peak 12 Depressed Normal
Peak 13 Depressed Depressed
Peak 14 Depressed Depressed
Peak 15 Depressed Depressed
Peak 16 Depressed Depressed
Peak 17 Depressed Depressed
Peak 18 Depressed Depressed
Peak 19 Depressed Depressed
Peak 20 Depressed Depressed
Peak 21 Depressed Depressed
Peak 22 Depressed Depressed
Peak 23 Depressed Depressed
Peak 24 Depressed Depressed
Peak 25 Depressed Depressed

53
Peak 26 Depressed Depressed
Peak 27 Depressed Depressed
Peak 28 Depressed Depressed
Peak 29 Depressed Depressed
Peak 30 Depressed Depressed
Peak 31 Depressed Depressed
Table-5.4 Comparison of results calculated using algorithm with visual inspection
Database Peaks Detected
Age/Sex LTSTDB By Visual Inspection By Computer Algorithm
Data No. Elevated Depressed Normal Elevated Depressed Normal
58M 20011 0 35 0 0 35 0
62F 20101 2 18 16 2 19 15
60M 20041 0 32 0 0 29 2
55M 20031 39 0 0 39 0 0
64M 20111 5 30 11 5 27 13
48F 20121 0 31 0 0 29 2
62M 20151 32 0 0 32 0 0
82F 20131 0 37 5 0 35 6
65M 20161 32 0 0 32 0 0
44M 20171 0 36 8 0 33 10
57M 20221 0 50 0 0 47 2
Undefined 20261 0 38 0 0 38 0
66M 20181 35 7 4 35 5 3
87F 20051 0 63 0 0 61 2
Reasonable amount of accuracy can be seen in the tables.

54
CHAPTER-6
Conclusion and Future Scope
6.1 Conclusion
Different researchers used different methods to calculate the ST segment level but in this
present work we presented an algorithm that QRS complex on time axis. Detection of
QRS complex is done by Wavelet Transforms. We found that there is reasonable amount
of accuracy given by 98.5% which can be seen in the tables and it can be therefore
concluded that the algorithm which have proposed can be used for most of the practical
purposes.
6.2 Future Scope
In this present work, we have done the analysis with 14 subjects and for the short term
recording of ECG data samples i.e. 32 seconds. The results obtained are satisfactory but
the overall accuracy is not 100%, it is 98.5%. The database used is Long Term ST
Database. For the more precise results this work can be extended with more number of
subjects and with different database.
55
References
[1] C. J. Horne, K. J. Zhang, J. Propst,V. K. Murthy, and L. J. Haywood, ―ST segment
evaluation by discrete cosine and Fourier transforms,‖ Computers in Cardiology,
Los Alamitos, CA: IEEE Comput. Soc. Press, pp. 265–268, 1984
[2] E. Skordalakis, ―Recognition of the Shape of the ST Segment in ECG Waveforms,
IEEE Transactions On Biomedical Engineering‖, Vol. BME-33, No. 10, pp.972-
974, October 1986.
[3] C. Li, C. Zheng, C. Tai, ―Detection of ECG characteristic points using wavelet
transforms‖, IEEE Trans. on Biomedical Engineering, 42(1), pp.21-28, 1995.
[4] J. Presedo, J. Vila, M. Delgado, S. Barro, F. Palacios, and R. Ruiz, ―A proposal for
the fuzzy evaluation of ischemic episodes,‖ Computers in Cardiology, Los
Alamitos, CA: IEEE Comput. Soc. Press, pp.709–712, 1995.
[5] H.Gholam-Hosseini and H.Nazeran, ―Detection And Extraction Of The Ecg Signal
Parameters, IEEE Engineering in Medicine and Biology Society‖, Vol. 20, No.1,
pp.127-130,1998.
[6] T. Stamkopoulos, K. Diamantaras, N. Maglaveras, M. Strintzis, ―ECG Analysis
Using Nonlinear PCA Neural Networks for Ischemia Detection, IEEE Transactions
On Signal Processing‖, Vol. 46, No. 11, pp.3058-3067,November 1998.
[7] A Smrdel, F.Jager, ―Advanced Detection Of ST Segment Episodes In 24-Hour
Ambulatory ECG Data By Automated Tracking Of Transient ST Segment‖
Reference Level, IEEE , 29, pp.325-328., 2002.
[8] C. Papaloudas, D. I. Fotiadis, A. Lika, C. S. Stroumbis and L. K. Michalis, ―Use of
a novel rule-based expert system in the detection of changes in the ST segment and
the T wave in long duration ECGs,‖ Journal of electrocardiology, vol. 35, no. 1,
2002.
[9] F. Jager, A. Taddei, G. B. Moody, M. Emdin, G. Antolic, R. Dorn, A. Smrdel, C.
Marchesi, R. G. Mark, ―Long-term ST database: a reference for the development
and evaluation of automated ischaemia detectors and for the study of the dynamics
of myocardial ischaemia‖, Med. Biol. Eng. Comput., 41, pp.172–182, 2003.
[10] X. Y. Li, T. Wang, P. Zhou, and H.Q. Feng, ―ST-T Complex Automatic Analysis of
the Electrocardiogram Signals Based on Wavelet Transform,‖ Proc. IEEE
Bioengineering Conference, pp.144-145, 2003.
[11] Mary C. MacLachlan , J. Sundnes, and G. Terje Lines, ―Simulation of ST Segment
Changes During Subendocardial Ischemia Using a Realistic 3-D Cardiac
Geometry‖, IEEE Trans. on Biomed. Engineering, Vol. 52, No. 5, pp.799-807,
May 2005.
[12] M.J. Vaessen, ‖ A QRS detection method using analog wavelet transform in ECG‖
pp.1-9.
[13] S. Z. Mahmoodabadi, A. Ahmadian, M. D. Abolhasani, M. Eslami, J. H. Bidgoli,
―ECG Feature Extraction Based on Multiresolution Wavelet Transform‖,
September 1-4, pp.3902-3905, 2005.
[14] R Schneider, A Bauer, P Barthel, G Schmidt, Challenge 2006: QT Interval
Measurement.

56
[15] Fayyaz A. Afsarl and M. Arif2, ―Detection of ST Segment Deviation Episodes in
the ECG using KLT with an Ensemble Neural Classifier‖, IEEE Trans. on Biomed.
Engineering, 2007.
[16] J. Faganeli, F Jager, ―Automatic Distinguishing Between Ischemic and Heart-Rate
Related Transient ST Segment Episodes in Ambulatory ECG Records‖, Computers
in Cardiology,35, pp.381−384, 2008.
[17] K. F. Tan, K. L. Chan‘, and K. Choi, ―Detection Of The QRS Complex, P Wave
And T Wave In Electrocardiogram‖, IEEE Trans Biomed. Engineering, pp.41-47.
[18] Alice de Jesus Kozakevicius, Cesar Ramos Rodrigues, Raul Ceretta Nunes and
Roberto Guerra Filho, ―Adaptive ECG Filtering And QRS Detection Using
Orthogonal Wavelet Transform.‖
[19] M. Mohebbi, H. A. Moghadam, M. Teshnehlab, ―An Automated System for On-line
Monitoring and Detection of ST Changes in ECG Signal‖.