Embed Size (px)
Citation preview

A RULES-BASED PRODUCTION SCHEDULING APPROACH 11
IntroductionProduction planning is based on averages, and does notadequately factor in the variability of the orebody, miningelements, team efficiencies, and the interaction betweenprocesses, especially where variability is concerned.
Current mine planning systems and the mine planningparadigm require a ‘single value’ production output permetric. This necessitates that a ‘single average value’ ischosen for each assumption relating to grade, reef width,
density, stope and excavation sizes, over and underbreaks,and – importantly – the team advance rates for developmentand stoping activities.
This invariably leads to the input assumptions beingeither too optimistic or too pessimistic, with the result thatthe range of uncertainty is not reflected in the output, be itproduction (e.g. tons) or techno-economic analysis (e.g. netpresent value – NPV).
For example, for ore grade, a single value is used as an
LANE, G.R., KRAFFT, G., CAMBITSIS, A., DAYA, K., and VAN DER WESTHUIZEN, A. A rules-based production scheduling approach allowingmultiple scenarios to be generated to test the impact of advance rate variability. The 6th International Platinum Conference, ‘Platinum–Metal for the Future’,The Southern African Institute of Mining and Metallurgy, 2014.
A rules-based production scheduling approach allowingmultiple scenarios to be generated to test the impact of
advance rate variability
G.R. LANE*, G. KRAFFT*, A. CAMBITSIS*, K. DAYA*, and A. VAN DER WESTHUIZEN†
*Cyest Technology†Bentley Systems
‘There is uncertainty in mine planning assumptions which is not reflected in the finaloutput’ (Krafft, 2014)
A valid mine design and corresponding production schedule of all the required mining activitiesto develop and mine ore is critical to effectively manage developed ore reserves and plan theresources required for mining.
Maintaining the appropriate sequence of all the different mining activities – development,construction, equipping, ledging, and stoping – is critical to sustain the mining rate into the future.The advance rates of these different development activities, and therefore the rate at which theoperation is replacing its developed ore reserves, determines the sustainable mining rate of theoperation. Mine faster than the rate at which development is opening up, and the mine runs out ofdeveloped ore reserves; mine slower and working capital is wasted in opening up areas that willonly be mined far in the future.
Mining companies need to effectively manage their long-term stoping development ratio,otherwise they may find themselves in the situation that they cannot sustain current mining rates.Furthermore, the production plan often does not take into account the variability and confidencelevels in the planning assumptions, which impacts the future sustainable mining rate. Mineplanners generally have different levels of confidence in achieving certain advance rates (one mayplan optimistically, another realistically, and another pessimistically) and the overall finalproduction schedule for a shaft is an aggregation of these different confidence levels.
The variability in the development and stoping activity advance rates that are historicallyachieved by different teams has the single biggest impact on the achieved and sustainable miningrate, but is often ignored.
This paper presents a case study from work done at a large platinum mining company thatshowed how a rules-based production scheduling approach allowed for a stochastic model to beapplied to the production schedule that took the variability of the all the underlying advance ratesinto account. This enabled hundreds of production schedules to be generated quickly usingdifferent input assumptions to test the impact of this variability on the final production scheduleachieved.
The case study demonstrates how the mining sequence is impacted by the variability in theadvance rate of different critical path development activities and therefore the long-term impacton timing of subsequent activities in the mining sequence.
A final production schedule could therefore be generated with a chosen confidence level thattakes the variability into account and demonstrates the sustainable mining rate that can beachieved.
‘PLATINUM METAL FOR THE FUTURE’12
assumption for a given planning period. Often there isgeological sampling data that indicates the grade could liewithin a range (i.e. its variability). This uncertainty issimply not reflected in the final output; rather an averagevalue is used for planning purposes that does not reflect theuncertainty.
The development and stoping teams do not all achieve thesame average advance or efficiency. This variability inteam performance impacts the activity schedule relating todevelopment, ledging, equipping and stoping, with a resultthat the risk associated with achieving the schedule is notquantified. The cumulative impact of the variability ofadvance rates on interconnected activities, and especiallythe critical path, has a major impact on the mine’s ability toachieving a sustainable mining rate.
This paper is a case study from a large platinum miningcompany, where the historical variability in performance ofall the underlying variables impacting the schedule wasapplied to generate a probability-adjusted productionschedule. This was achieved by using the Cyest MineScenario Planning Solution together with the CyestStochastic Engine (Monte Carlo simulation) to generatemultiple production schedules. This allowed for thevariability in the production schedule to be quantifiedwithin chosen confidence limits.
The aim of the exercise was to determine the 80%confidence level (C80) of the detailed mine plan that hadbeen produced, in CAE Mining’s Studio 5D planningsoftware, for this particular shaft.
Stochastic modelling (Monte Carlo simulation) Lane (2012) describes stochastic modelling or Monte Carlosimulation as the technique of creating a mathematicalmodel of a project or process that includes uncertainparameters that can and cannot be controlled. Monte Carlomethods rely on random sampling from probabilitydistributions where they are ‘plugged into’ a mathematicalmodel and used to calculate outcomes for each randominstance of each variable.
This process is repeated thousands of times. Computersoftware has made this technique available to most businessusers.
Such a model can help management quantify the impact
of uncertainty of underlying variables and the consequencesof different mitigation decisions.
A stochastic modelling approach to productionscheduling would therefore take into account the variabilityand uncertainty in the underlying assumptions relating toteam advance rates, and result in a probability-adjustedproduction schedule with confidence limits.
An important aspect of stochastic modelling in thecontext of this case study was the ability to generatethousands of iterations of a production schedule that tookinto account the mining sequencing rules and crew andresource allocations.
The Cyest Mine Scenario Planning Solution was utilizedfor this stochastic modelling exercise due to its automaticrules-based scheduling and resource allocation.
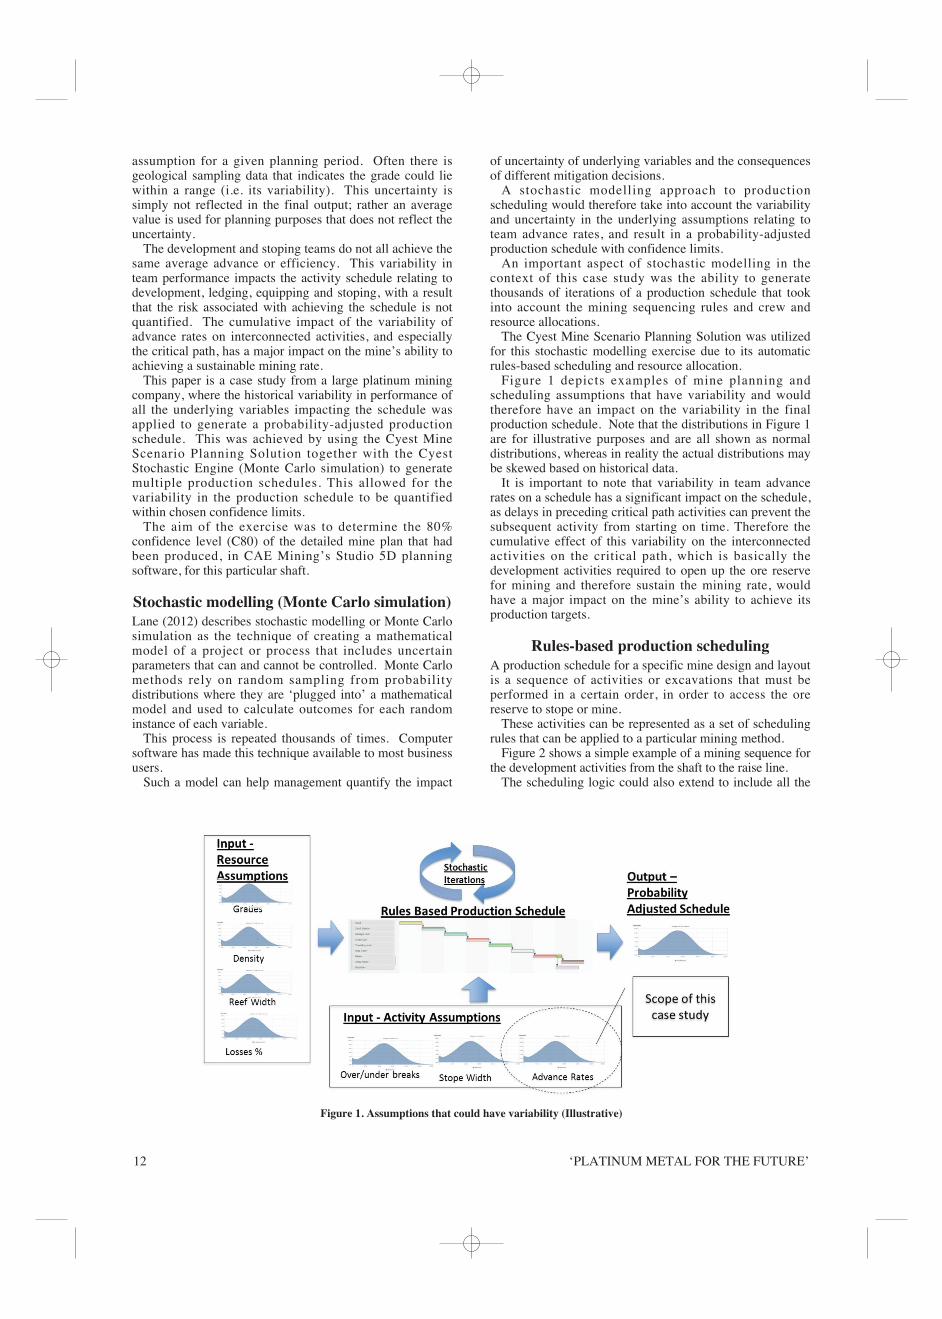
Figure 1 depicts examples of mine planning andscheduling assumptions that have variability and wouldtherefore have an impact on the variability in the finalproduction schedule. Note that the distributions in Figure 1are for illustrative purposes and are all shown as normaldistributions, whereas in reality the actual distributions maybe skewed based on historical data.
It is important to note that variability in team advancerates on a schedule has a significant impact on the schedule,as delays in preceding critical path activities can prevent thesubsequent activity from starting on time. Therefore thecumulative effect of this variability on the interconnectedactivities on the critical path, which is basically thedevelopment activities required to open up the ore reservefor mining and therefore sustain the mining rate, wouldhave a major impact on the mine’s ability to achieve itsproduction targets.
Rules-based production schedulingA production schedule for a specific mine design and layoutis a sequence of activities or excavations that must beperformed in a certain order, in order to access the orereserve to stope or mine.
These activities can be represented as a set of schedulingrules that can be applied to a particular mining method.
Figure 2 shows a simple example of a mining sequence forthe development activities from the shaft to the raise line.
The scheduling logic could also extend to include all the
Figure 1. Assumptions that could have variability (Illustrative)
A RULES-BASED PRODUCTION SCHEDULING APPROACH 13
other development activities such as boxholes, cubbies,travelling ways and ledging, stoping, and all constructionand engineering supporting activities.
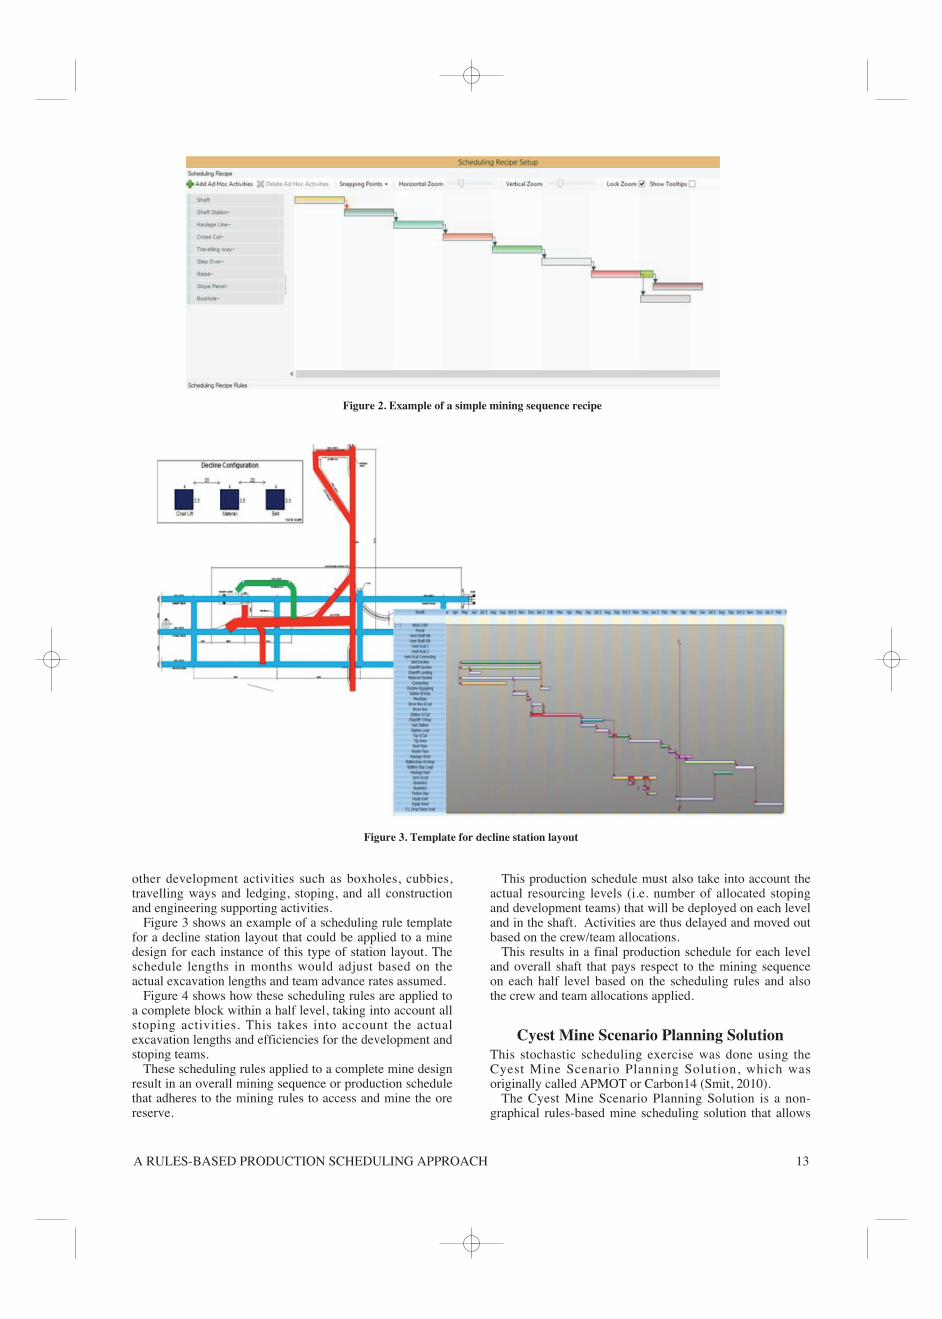
Figure 3 shows an example of a scheduling rule templatefor a decline station layout that could be applied to a minedesign for each instance of this type of station layout. Theschedule lengths in months would adjust based on theactual excavation lengths and team advance rates assumed.
Figure 4 shows how these scheduling rules are applied toa complete block within a half level, taking into account allstoping activities. This takes into account the actualexcavation lengths and efficiencies for the development andstoping teams.
These scheduling rules applied to a complete mine designresult in an overall mining sequence or production schedulethat adheres to the mining rules to access and mine the orereserve.
This production schedule must also take into account theactual resourcing levels (i.e. number of allocated stopingand development teams) that will be deployed on each leveland in the shaft. Activities are thus delayed and moved outbased on the crew/team allocations.
This results in a final production schedule for each leveland overall shaft that pays respect to the mining sequenceon each half level based on the scheduling rules and alsothe crew and team allocations applied.
Cyest Mine Scenario Planning SolutionThis stochastic scheduling exercise was done using theCyest Mine Scenario Planning Solution, which wasoriginally called APMOT or Carbon14 (Smit, 2010).
The Cyest Mine Scenario Planning Solution is a non-graphical rules-based mine scheduling solution that allows
Figure 2. Example of a simple mining sequence recipe
Figure 3. Template for decline station layout
‘PLATINUM METAL FOR THE FUTURE’14
for the rapid generation of a production schedule taking theimportant drivers associated with geology, mine design andmining method into account.
The stochastic inputs for the schedule were generated in astochastic engine from the defined probability distributionsper variable, and each individual value per variablegenerated a specific production schedule scenario.
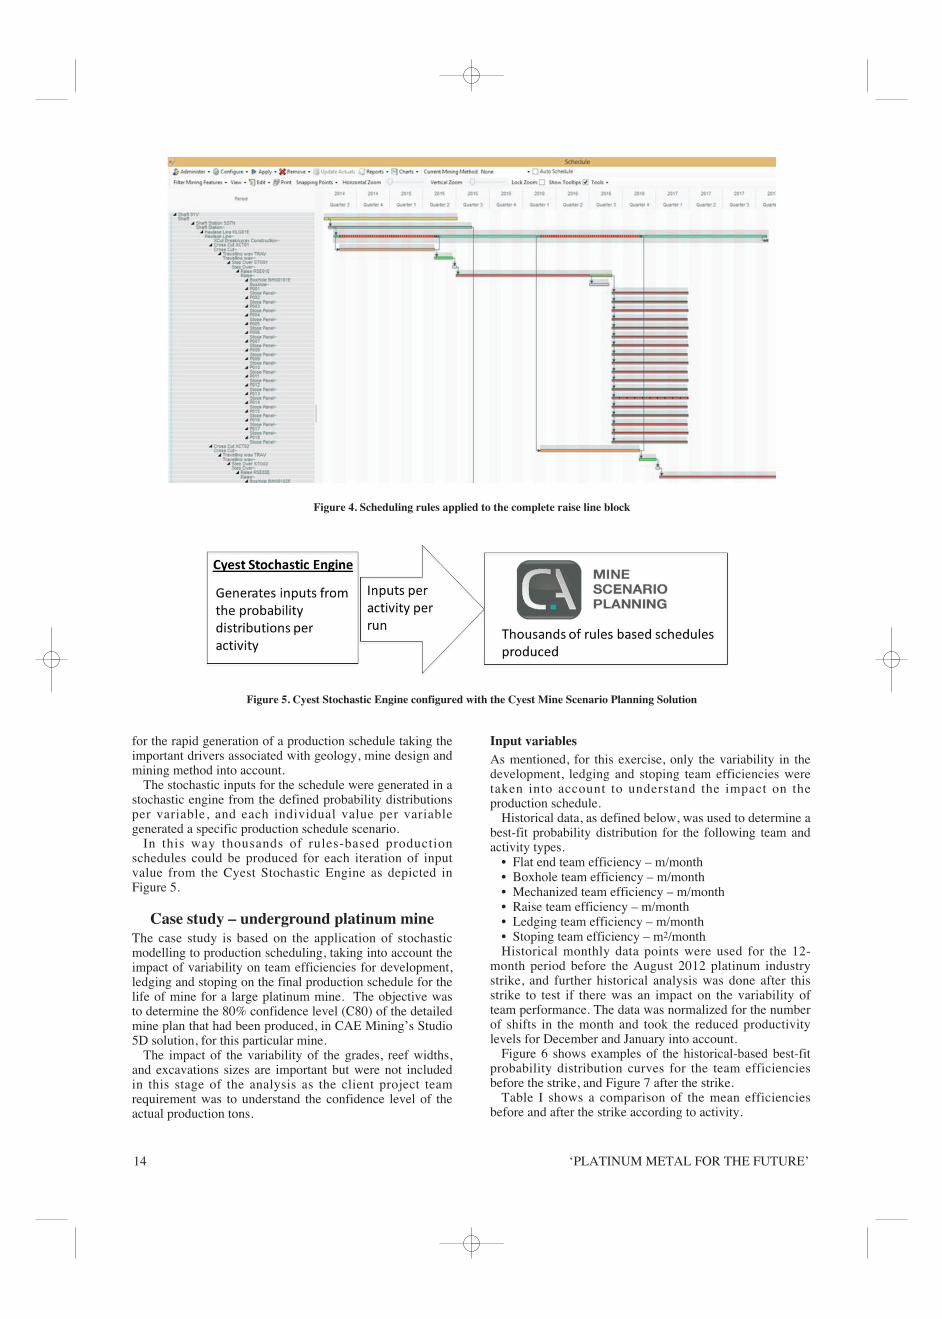
In this way thousands of rules-based productionschedules could be produced for each iteration of inputvalue from the Cyest Stochastic Engine as depicted inFigure 5.
Case study – underground platinum mineThe case study is based on the application of stochasticmodelling to production scheduling, taking into account theimpact of variability on team efficiencies for development,ledging and stoping on the final production schedule for thelife of mine for a large platinum mine. The objective wasto determine the 80% confidence level (C80) of the detailedmine plan that had been produced, in CAE Mining’s Studio5D solution, for this particular mine.
The impact of the variability of the grades, reef widths,and excavations sizes are important but were not includedin this stage of the analysis as the client project teamrequirement was to understand the confidence level of theactual production tons.
Input variables As mentioned, for this exercise, only the variability in thedevelopment, ledging and stoping team efficiencies weretaken into account to understand the impact on theproduction schedule.
Historical data, as defined below, was used to determine abest-fit probability distribution for the following team andactivity types.
• Flat end team efficiency – m/month• Boxhole team efficiency – m/month• Mechanized team efficiency – m/month• Raise team efficiency – m/month• Ledging team efficiency – m/month• Stoping team efficiency – m2/monthHistorical monthly data points were used for the 12-
month period before the August 2012 platinum industrystrike, and further historical analysis was done after thisstrike to test if there was an impact on the variability ofteam performance. The data was normalized for the numberof shifts in the month and took the reduced productivitylevels for December and January into account.
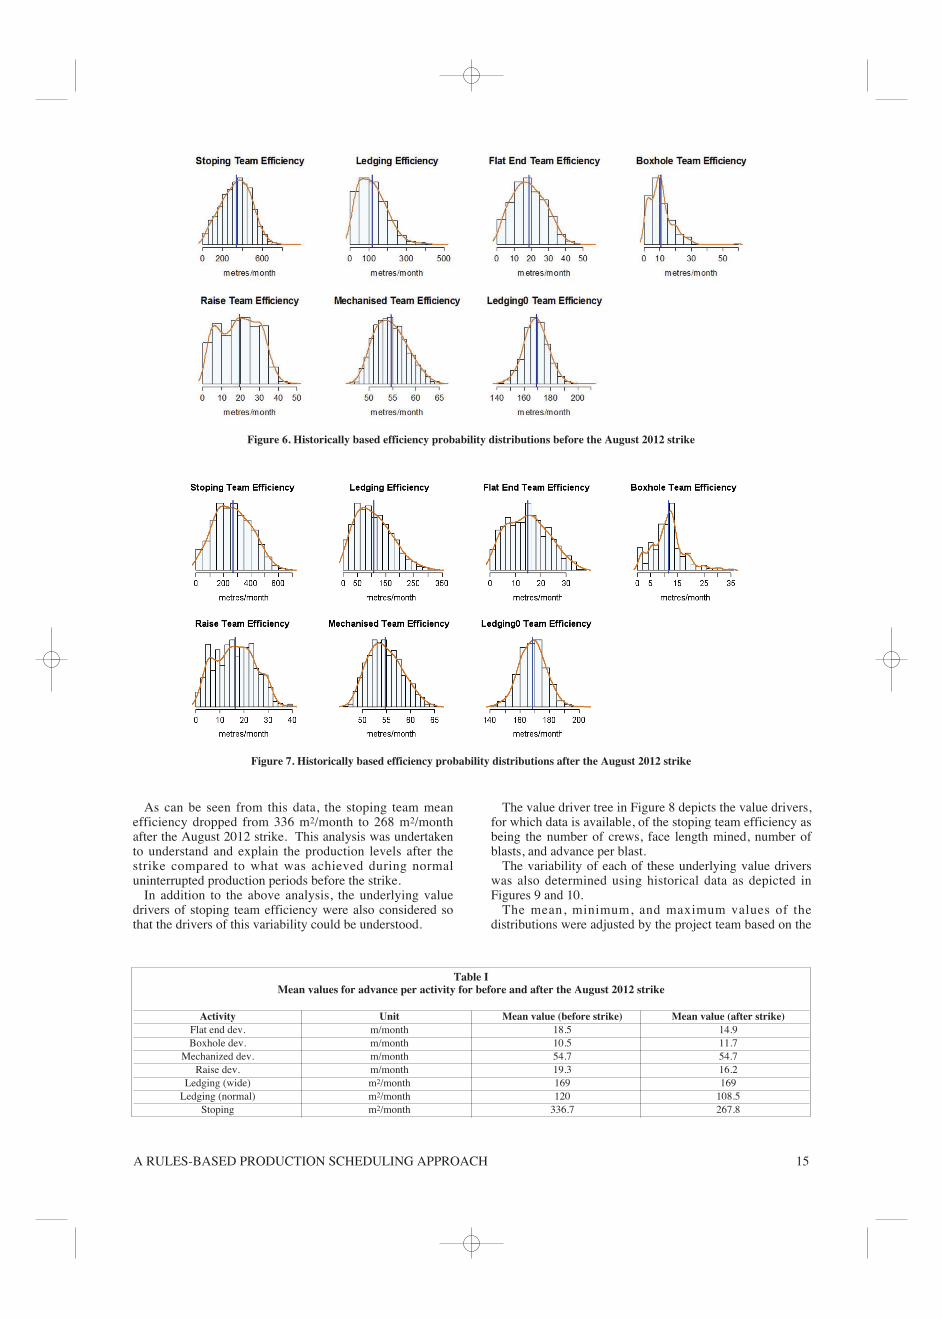
Figure 6 shows examples of the historical-based best-fitprobability distribution curves for the team efficienciesbefore the strike, and Figure 7 after the strike.
Table I shows a comparison of the mean efficienciesbefore and after the strike according to activity.
Figure 4. Scheduling rules applied to the complete raise line block
Figure 5. Cyest Stochastic Engine configured with the Cyest Mine Scenario Planning Solution
A RULES-BASED PRODUCTION SCHEDULING APPROACH 15
As can be seen from this data, the stoping team meanefficiency dropped from 336 m2/month to 268 m2/monthafter the August 2012 strike. This analysis was undertakento understand and explain the production levels after thestrike compared to what was achieved during normaluninterrupted production periods before the strike.
In addition to the above analysis, the underlying valuedrivers of stoping team efficiency were also considered sothat the drivers of this variability could be understood.
The value driver tree in Figure 8 depicts the value drivers,for which data is available, of the stoping team efficiency asbeing the number of crews, face length mined, number ofblasts, and advance per blast.
The variability of each of these underlying value driverswas also determined using historical data as depicted inFigures 9 and 10.
The mean, minimum, and maximum values of thedistributions were adjusted by the project team based on the
Figure 6. Historically based efficiency probability distributions before the August 2012 strike
Figure 7. Historically based efficiency probability distributions after the August 2012 strike
Table IMean values for advance per activity for before and after the August 2012 strike
Activity Unit Mean value (before strike) Mean value (after strike)Flat end dev. m/month 18.5 14.9Boxhole dev. m/month 10.5 11.7
Mechanized dev. m/month 54.7 54.7Raise dev. m/month 19.3 16.2
Ledging (wide) m2/month 169 169Ledging (normal) m2/month 120 108.5
Stoping m2/month 336.7 267.8

‘PLATINUM METAL FOR THE FUTURE’16
specific project design parameters. For example, the projectteam made design changes to improve ore flow from a halflevel by increasing boxhole sizing, designed multi-entrystations, and dual tramming to reduce ore flow congestionand thereby try to reduce lost blasts associated with this.The panel length distributions were also adjusted to takeinto account the final layout and what the project teambelieved could be achieved. The flat end development ratemean was also adjusted based on changing from the minedoing this work to a contractor using mechanizedequipment. This approach is an acceptable means ofadjusting the mean and variability based on justifiabledesign considerations, mining method, and otherinterventions that will be put in place to improve theoperations.
This resulted in significant improvement in thedistributions, which would also be used in some of the runsto assess the impact and confidence levels of what theproject team believed was achievable based on the minedesign and operating assumptions. Figure 8. Example value driver tree for stoping efficiency
Figure 10. Probability distribution for advance per blast
Figure 9. Probability distribution for face length per panel

A RULES-BASED PRODUCTION SCHEDULING APPROACH 17
Figure 11 shows the distributions after the project teammade adjustments relating to the panel lengths, lost blasts,advance per blast, contractor flat end development, andother parameters.
As can be seen from Figure 11 and Table II, there wassignificant improvement in the mean values. For example:
- The stoping mean improved from 336 m2/month to 350m2/month
- The flat end development mean improved from 18.5m/month to 36 m/month.
The largest single contributor to the sustainable miningrate is flat end development and other primarydevelopment, as these activities determine the developedore reserve available for mining. This is how fast the orereserve is being opened up and therefore determines thesustainable mining rate.
Tables I and II show the following the significant changesin the mean rates of flat end and raise line development:
- Before strike: flat end development 18.5 m/month andraise line development 19.3 m/month
- After the strike: flat end development 14.9 m/monthand raise line development 16.2 m/month
- With project team intervention: flat end development36 m/month and raise line development 24 m/month.
The impact of the change on the flat end developmentrate will be demonstrated in the case study results.
The rules-based production scheduleThe mine design criteria used were based on the original
mine design and production scheduling assumptions usedby the mine in CAE Mining Studio 5D.
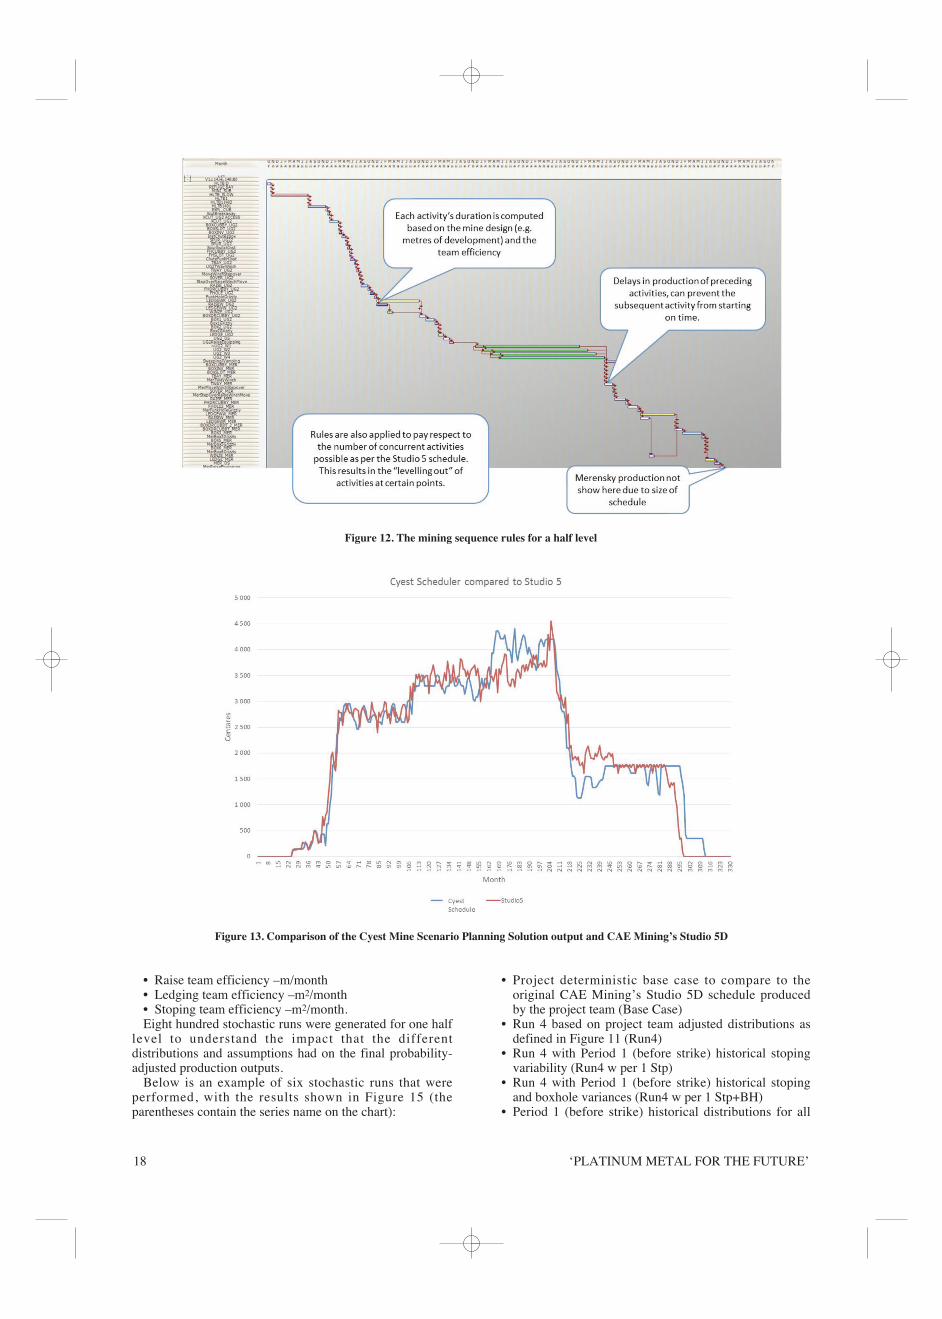
The mining sequence scheduling rules were generated fora typical mining half level and consisted of all thedevelopment and stoping activities required to be executedas depicted in Figure 12.
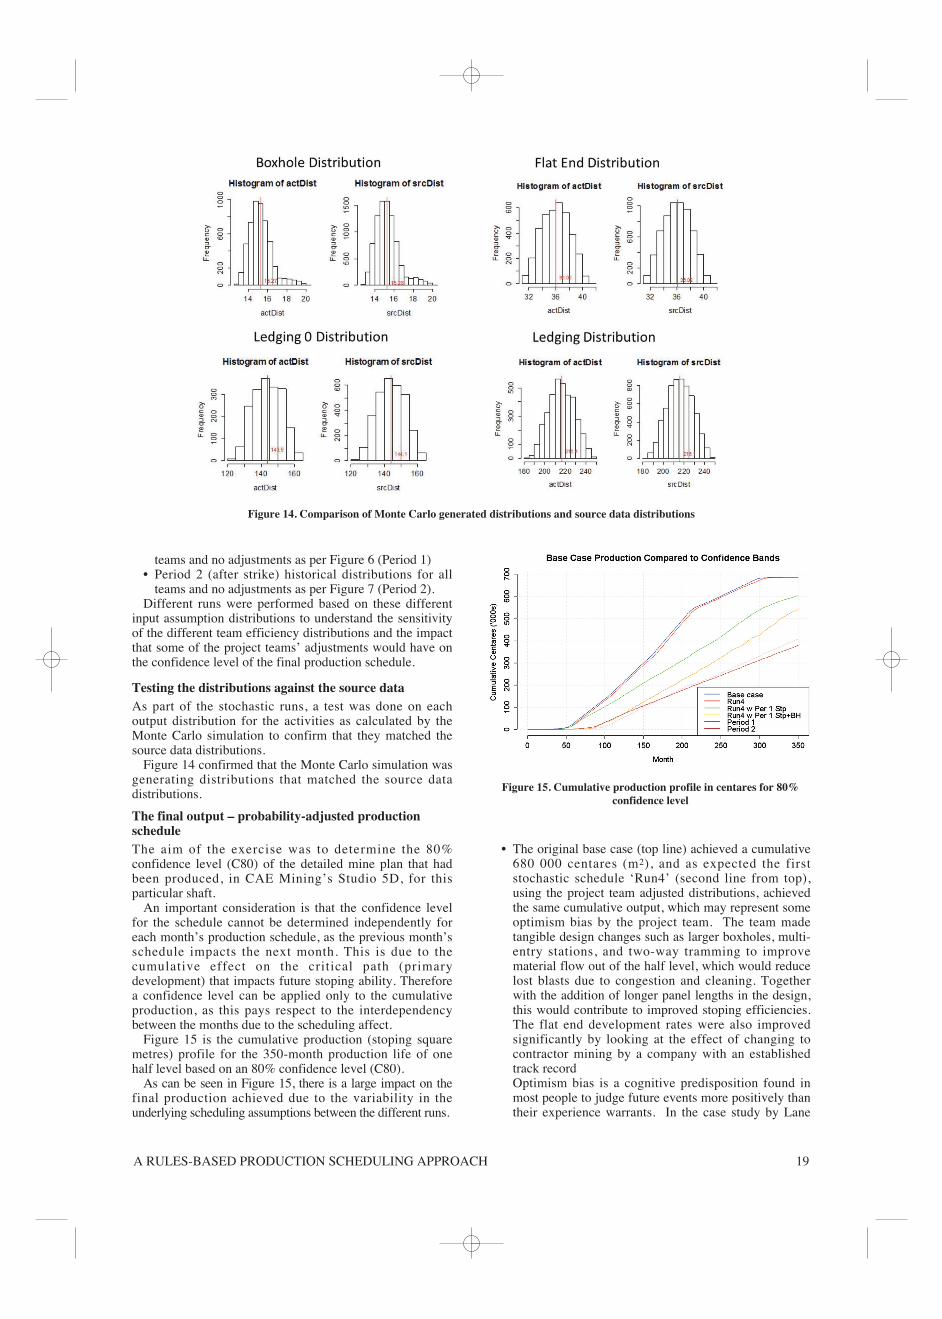
Crews and resourcing were applied to this schedule so asto mimic the actual resourcing the mine would deploy. Theschedule produced was compared to the original productionschedule produced by the mine in CAE Mining’s Studio 5Dto confirm that it matched the detailed mine planning asdepicted in Figure 13.
This base case comparison used the identical mine designcriteria and all advance rate assumptions for all activities,and was used to prove that the rules-based productionschedule done in the Cyest Mine Scenario PlanningSolution was a realistic match to the detailed schedulingdone in CAE Mining’s Studio 5D Solution.
This rules-based production schedule was therefore arealistic representation of the mine’s schedule and would beused for the probability-adjusted scheduling.
Application of variability to the production scheduleThe variances for each variable as defined for the differentcases were applied to the following production schedulingassumptions:
• Flat end team efficiency – m/month• Boxhole team efficiency – m/month• Mechanized team efficiency – m/month
Figure 11. Probability distributions after project team adjustments
Table IIMean values after project team adjustments due to design changes
Activity Unit Mean value (before strike) Project team adjustedFlat end dev. m/month 18.5 36Boxhole dev. m/month 10.5 15.3
Mechanized dev. m/month 54.7 58.9Raise dev. m/month 19.3 24.4
Ledging (wide) m2/month 169 149Ledging (normal) m2/month 120 216
Stoping m2/month 336.7 349.8
‘PLATINUM METAL FOR THE FUTURE’18
• Raise team efficiency –m/month• Ledging team efficiency –m2/month• Stoping team efficiency –m2/month.Eight hundred stochastic runs were generated for one half
level to understand the impact that the differentdistributions and assumptions had on the final probability-adjusted production outputs.
Below is an example of six stochastic runs that wereperformed, with the results shown in Figure 15 (theparentheses contain the series name on the chart):
• Project deterministic base case to compare to theoriginal CAE Mining’s Studio 5D schedule producedby the project team (Base Case)
• Run 4 based on project team adjusted distributions asdefined in Figure 11 (Run4)
• Run 4 with Period 1 (before strike) historical stopingvariability (Run4 w per 1 Stp)
• Run 4 with Period 1 (before strike) historical stopingand boxhole variances (Run4 w per 1 Stp+BH)
• Period 1 (before strike) historical distributions for all
Figure 12. The mining sequence rules for a half level
Figure 13. Comparison of the Cyest Mine Scenario Planning Solution output and CAE Mining’s Studio 5D
A RULES-BASED PRODUCTION SCHEDULING APPROACH 19
teams and no adjustments as per Figure 6 (Period 1)• Period 2 (after strike) historical distributions for all
teams and no adjustments as per Figure 7 (Period 2).Different runs were performed based on these different
input assumption distributions to understand the sensitivityof the different team efficiency distributions and the impactthat some of the project teams’ adjustments would have onthe confidence level of the final production schedule.
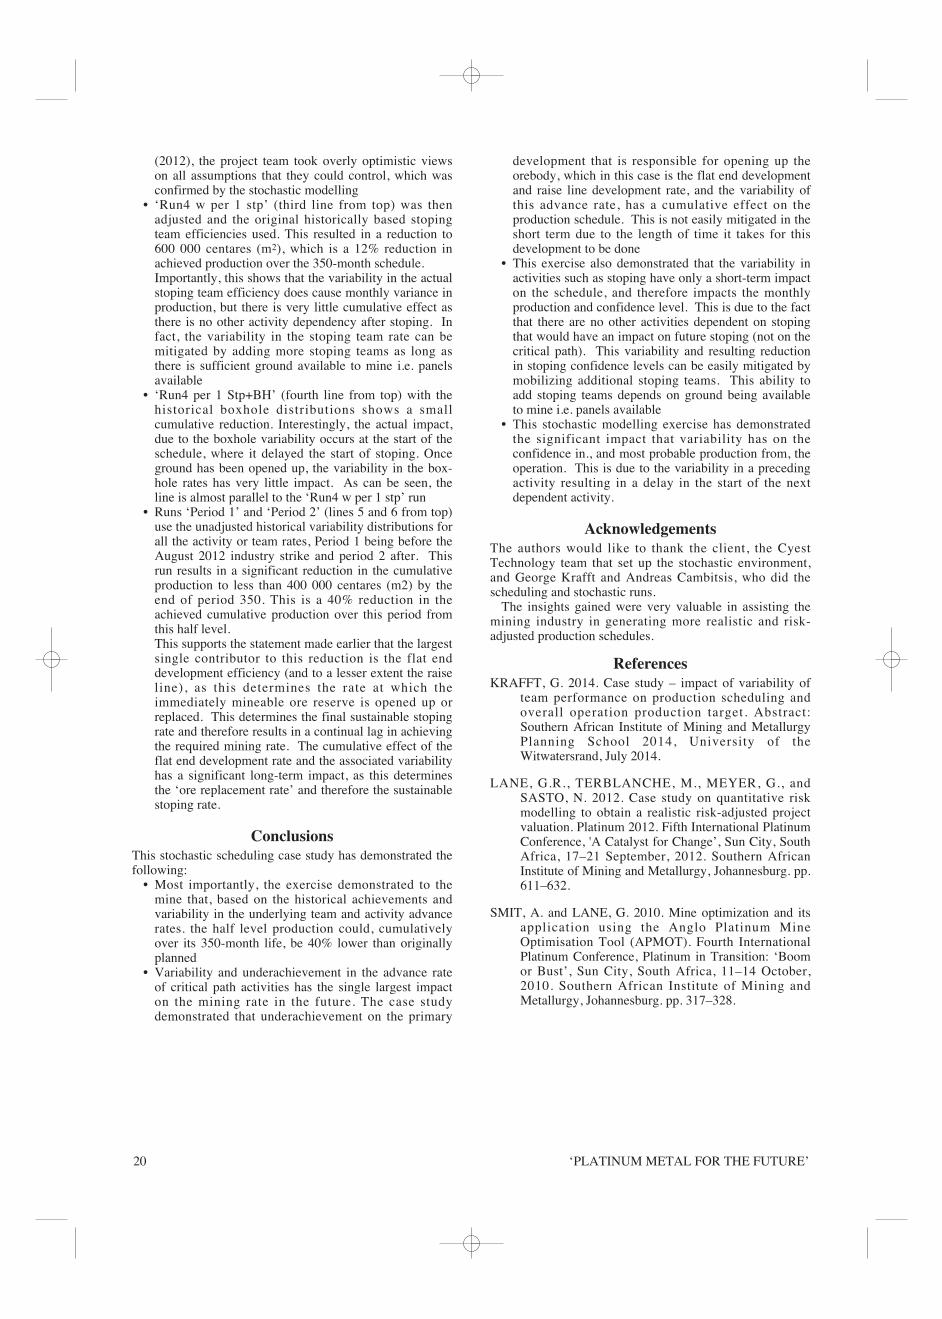
Testing the distributions against the source dataAs part of the stochastic runs, a test was done on eachoutput distribution for the activities as calculated by theMonte Carlo simulation to confirm that they matched thesource data distributions.
Figure 14 confirmed that the Monte Carlo simulation wasgenerating distributions that matched the source datadistributions.
The final output – probability-adjusted productionscheduleThe aim of the exercise was to determine the 80%confidence level (C80) of the detailed mine plan that hadbeen produced, in CAE Mining’s Studio 5D, for thisparticular shaft.
An important consideration is that the confidence levelfor the schedule cannot be determined independently foreach month’s production schedule, as the previous month’sschedule impacts the next month. This is due to thecumulative effect on the critical path (primarydevelopment) that impacts future stoping ability. Thereforea confidence level can be applied only to the cumulativeproduction, as this pays respect to the interdependencybetween the months due to the scheduling affect.
Figure 15 is the cumulative production (stoping squaremetres) profile for the 350-month production life of onehalf level based on an 80% confidence level (C80).
As can be seen in Figure 15, there is a large impact on thefinal production achieved due to the variability in theunderlying scheduling assumptions between the different runs.
• The original base case (top line) achieved a cumulative680 000 centares (m2), and as expected the firststochastic schedule ‘Run4’ (second line from top),using the project team adjusted distributions, achievedthe same cumulative output, which may represent someoptimism bias by the project team. The team madetangible design changes such as larger boxholes, multi-entry stations, and two-way tramming to improvematerial flow out of the half level, which would reducelost blasts due to congestion and cleaning. Togetherwith the addition of longer panel lengths in the design,this would contribute to improved stoping efficiencies.The flat end development rates were also improvedsignificantly by looking at the effect of changing tocontractor mining by a company with an establishedtrack recordOptimism bias is a cognitive predisposition found inmost people to judge future events more positively thantheir experience warrants. In the case study by Lane
Figure 14. Comparison of Monte Carlo generated distributions and source data distributions
Figure 15. Cumulative production profile in centares for 80%confidence level
‘PLATINUM METAL FOR THE FUTURE’20
(2012), the project team took overly optimistic viewson all assumptions that they could control, which wasconfirmed by the stochastic modelling
• ‘Run4 w per 1 stp’ (third line from top) was thenadjusted and the original historically based stopingteam efficiencies used. This resulted in a reduction to600 000 centares (m2), which is a 12% reduction inachieved production over the 350-month schedule. Importantly, this shows that the variability in the actualstoping team efficiency does cause monthly variance inproduction, but there is very little cumulative effect asthere is no other activity dependency after stoping. Infact, the variability in the stoping team rate can bemitigated by adding more stoping teams as long asthere is sufficient ground available to mine i.e. panelsavailable
• ‘Run4 per 1 Stp+BH’ (fourth line from top) with thehistorical boxhole distributions shows a smallcumulative reduction. Interestingly, the actual impact,due to the boxhole variability occurs at the start of theschedule, where it delayed the start of stoping. Onceground has been opened up, the variability in the box-hole rates has very little impact. As can be seen, theline is almost parallel to the ‘Run4 w per 1 stp’ run
• Runs ‘Period 1’ and ‘Period 2’ (lines 5 and 6 from top)use the unadjusted historical variability distributions forall the activity or team rates, Period 1 being before theAugust 2012 industry strike and period 2 after. Thisrun results in a significant reduction in the cumulativeproduction to less than 400 000 centares (m2) by theend of period 350. This is a 40% reduction in theachieved cumulative production over this period fromthis half level. This supports the statement made earlier that the largestsingle contributor to this reduction is the flat enddevelopment efficiency (and to a lesser extent the raiseline), as this determines the rate at which theimmediately mineable ore reserve is opened up orreplaced. This determines the final sustainable stopingrate and therefore results in a continual lag in achievingthe required mining rate. The cumulative effect of theflat end development rate and the associated variabilityhas a significant long-term impact, as this determinesthe ‘ore replacement rate’ and therefore the sustainablestoping rate.
ConclusionsThis stochastic scheduling case study has demonstrated thefollowing:
• Most importantly, the exercise demonstrated to themine that, based on the historical achievements andvariability in the underlying team and activity advancerates. the half level production could, cumulativelyover its 350-month life, be 40% lower than originallyplanned
• Variability and underachievement in the advance rateof critical path activities has the single largest impacton the mining rate in the future. The case studydemonstrated that underachievement on the primary
development that is responsible for opening up theorebody, which in this case is the flat end developmentand raise line development rate, and the variability ofthis advance rate, has a cumulative effect on theproduction schedule. This is not easily mitigated in theshort term due to the length of time it takes for thisdevelopment to be done
• This exercise also demonstrated that the variability inactivities such as stoping have only a short-term impacton the schedule, and therefore impacts the monthlyproduction and confidence level. This is due to the factthat there are no other activities dependent on stopingthat would have an impact on future stoping (not on thecritical path). This variability and resulting reductionin stoping confidence levels can be easily mitigated bymobilizing additional stoping teams. This ability toadd stoping teams depends on ground being availableto mine i.e. panels available
• This stochastic modelling exercise has demonstratedthe significant impact that variability has on theconfidence in., and most probable production from, theoperation. This is due to the variability in a precedingactivity resulting in a delay in the start of the nextdependent activity.
AcknowledgementsThe authors would like to thank the client, the CyestTechnology team that set up the stochastic environment,and George Krafft and Andreas Cambitsis, who did thescheduling and stochastic runs.
The insights gained were very valuable in assisting themining industry in generating more realistic and risk-adjusted production schedules.
ReferencesKRAFFT, G. 2014. Case study – impact of variability of
team performance on production scheduling andoverall operation production target. Abstract:Southern African Institute of Mining and MetallurgyPlanning School 2014, University of theWitwatersrand, July 2014.
LANE, G.R., TERBLANCHE, M., MEYER, G., andSASTO, N. 2012. Case study on quantitative riskmodelling to obtain a realistic risk-adjusted projectvaluation. Platinum 2012. Fifth International PlatinumConference, 'A Catalyst for Change’, Sun City, SouthAfrica, 17–21 September, 2012. Southern AfricanInstitute of Mining and Metallurgy, Johannesburg. pp.611–632.
SMIT, A. and LANE, G. 2010. Mine optimization and itsapplication using the Anglo Platinum MineOptimisation Tool (APMOT). Fourth InternationalPlatinum Conference, Platinum in Transition: ‘Boomor Bust’, Sun City, South Africa, 11–14 October,2010. Southern African Institute of Mining andMetallurgy, Johannesburg. pp. 317–328.

A RULES-BASED PRODUCTION SCHEDULING APPROACH 21
Gary Lane Managing Director, Cyest Technology
Gary Lane graduated with a Bsc Civil Engineering degree in 1990 from WITS University on anAnglo American Scholarship. Gary then spent 10 years working in various project engineeringand project management positions within the group companies for New Mining Business, AngloTechnical Department, Debswana Diamond Mining Company and De Beers.
Gary completed an MBA in 2000 through Bond University in Australia and left AngloAmerican to found Cyest Corporation in 2001 with two colleagues from Monitor Consulting.Gary has built up the mining consulting business that became known as Cyest Analytics whichhas been involved in strategic mine planning and mechanised mining optimisation for miningclient. In January 2014 Gary became the MD of Cyest Technology which focuses on thedevelopment and implementation of mine planning and optimisation solutions for the miningIndustry globally.
Gary played an important role in the vision and overall leadership of the Syndicated DrivenDevelopment Program (SDDP) with Bentley Systems for the New Mining Planning Solution thatis jointly being development by Cyest and Bentley and which brings a new paradigm to effectivemine planning.
Gary’s personal vision is to drive a quantum change in the mining industry by getting them toembrace technology to enhance decision making in mine planning and execution by understandtheir key value drivers that impacts performance.

‘PLATINUM METAL FOR THE FUTURE’22