Embed Size (px)
Citation preview

A review of antiretroviral medicines cost in primary health care clinics in
Lesotho
M Ramathebane

Introduction• HIV/AIDS treatment is costly. Lesotho as a resource-limited
country depends mostly on donor funding for HIV/AIDS treatment and care. Knowledge of how much was spent on treatment of HIV/AIDS was lacking.
• This leads to overstocking of some ART medicines resulting in expiry. Sufficient funds need to be secured for the treatment programme.
• The main objective of the study is to assess the cost of antiretroviral medication treatments, by specifically assessing the cost of antiretroviral regimens, antiretroviral side effects, and the cost of medicines used for prophylaxis and treatment of opportunistic infections as well as the cost of monitoring laboratory tests and dietary supplements.

Methodology Study design• The design of the study was observational retrospective study. Only medical
records were examined for collection of the relevant data.
Study sites• Eight Study sites were chosen because of their vicinity. They were all within the
radius of 35 km from Roma. The Public clinics were Senkatana ART clinic, Bophelong Adult ART clinic, Qoaling ART clinic, and Mabote ART clinic. Private clinics included Healthy Life Style and Diabetes clinic®, Medicare Family clinic®, and Khanya Family clinic®. St. Joseph clinic, a Christian Health Association of Lesotho (CHAL) clinic was also included.
Study population• The researcher retrospectively abstracted data from patient files of 1 423
HIV/AIDS patients, who were on antiretroviral treatment for a minimum of one year. All patients who collected their medicines until 31 August, 2008 and who had been on antiretroviral drugs for one year or more were included in the population.

Inclusion criteria• All patients who had been on antiretroviral therapy for at least
one year (12 months) and who had come for refills at least 4 times in a year (those who received three months supply of antiretroviral drugs), for a maximum of 12 times a year (those who received monthly antiretroviral drugs supply) were included in the population for the study.
• HIV/AIDS patients who were on both antiretroviral first line and second line drugs were included.
• HIV/AIDS patient who further had TB were included in the study.
• HIV/AIDS patients who transferred into the clinic from another clinic, but who had been on treatment for one year in the clinic were included.

Exclusion Criteria• All HIV/AIDS patients who transferred out of the
clinics. • HIV/AIDS patients who defaulted during the study • HIV/AIDS patients who died. • HIV/AIDS paediatric patients (0-14 years) • Sexually transmitted infections were not considered in
the study due to the fact that even though they predispose a patient to HIV/AIDS they had no direct effect on HIV/AIDS treatment and its cost.
• Other medical conditions such as hypertension and its treatment that were not related to HIV/AIDS were not included in the data.

Analysis methods• Cost-prevalence index = percent cost / percent prevalence• Where the cost-prevalence index would be interpreted as
follows:• If cost-prevalence index < 1 then the drug item utilized is
relatively inexpensive.• If cost-prevalence index = 1 then there is an equilibrium
between the cost and prevalence of the drug item.• If cost-prevalence index > 1 then the drug item utilized is
relatively expensive• (Serfontein, 1989: 180)•
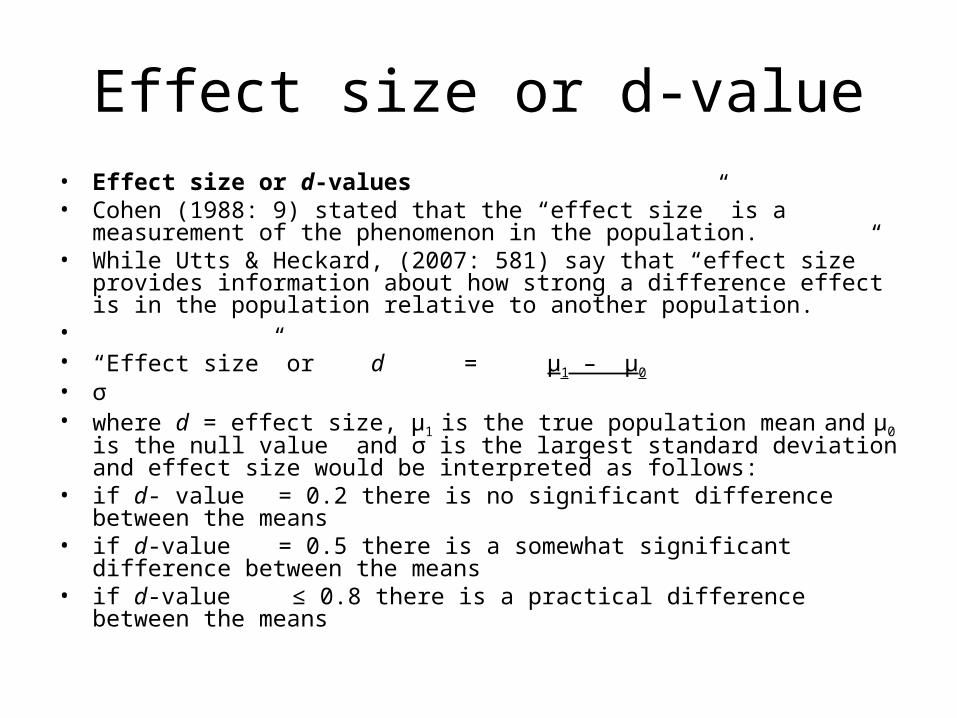
Effect size or d-value• Effect size or d-values• Cohen (1988: 9) stated that the “effect size” is a measurement of the
phenomenon in the population.• While Utts & Heckard, (2007: 581) say that “effect size” provides information
about how strong a difference effect is in the population relative to another population.
• • “Effect size” or d = μ1 – μ0
• σ• where d = effect size, μ1 is the true population mean and μ0 is the null value and σ
is the largest standard deviation and effect size would be interpreted as follows:• if d- value = 0.2 there is no significant difference between the means• if d-value = 0.5 there is a somewhat significant difference between the means• if d-value ≤ 0.8 there is a practical difference between the means

Cost –effectiveness analysis• Cost–effectiveness analysis expresses an average cost-effectiveness ratio for the
alterative treatments being compared.• Cost-effectiveness ratio = average cost of treatment• net outcome of treatment (effectiveness)• (Waning & Montagne, 2001: 151)• • Incremental cost-effectiveness ratio measures if the additional cost of a more
costly therapy would produce an additional value or benefit, or it assesses added cost per net effectiveness and is calculated using the following formula:
• • Incremental cost-effectiveness = C2 - C1
• E2 - E1
• • Where C2 and C1 are the differences in total cost• E2 and E1 are the differences in effectiveness• (Waning & Montagne, 2001: 151)

Input and outputs of HIV/AIDS treatment
• Assumed input
• ARV regimens
• OI prophylaxis
• Lab tests
• Dietary supplements
• Drugs for SE Tx
• Drugs OI Tx
• (Key: OI – opportunistic infection, lab –laboratory, ARV – antiretroviral drugs, SE- side effects, Tx is treatment)
•
• Expected Output
• viral load decrease• OI incidence reduced• CD4 cell increase• Increased body weight• Incidence of drug side
effects

Results of the study

Table 1. Cost contribution of ARVs, for all ART clinics throughout the duration of treatment in Maluti
ARV regimens
Number of patients per regimen
Mean and Std dev cost Minimum cost Maximum cost Median cost Total cost
Cost/
prevalence index
1a 527 2253.8±1622.1 629.5 6530.64 1426.52 1,187,770.25
0.6
1b 437 4621.1±2663.7 1561.62 11263.16 3774.5 2,019,410.58
1.2
1c 109 2509.9±1148.2 1403.56 7734.68 2070.52 273,574.46
0.7
1d 89 6315.5±3611.0 1995.84 16841.36 5286.97 562,064.93
1.7
1s 262 5274.3±4261.5 850.84 30686.38 4304.67 1,381,853.41
1.4
Total cost of antiretroviral drugs 5,424,673.63

interpretation
• shows average cost of ARVs in all the clinics for all regimens including patients who switched regimens. The cost-prevalence index is also calculated.
• The cost/prevalence index included in table 1 reveals that regimens 1a and 1c are inexpensive while regimen 1b and 1d are relatively expensive. 1s indicates a code for all switched regimens, including switching to second line regimens.

Table 2 Comparison of the effect size or d-value of cost of antiretroviral drug regimens
Regimen 1a 1b 1c 1d 1s
1a 0.89 0.16 1.12 0.71
1b 0.89 0.79 0.47 0.15
1c 0.16 0.79 1.05 0.65
1d 1.12 0.47 1.05 0.24
1s 0.71 0.15 0.65 0.24
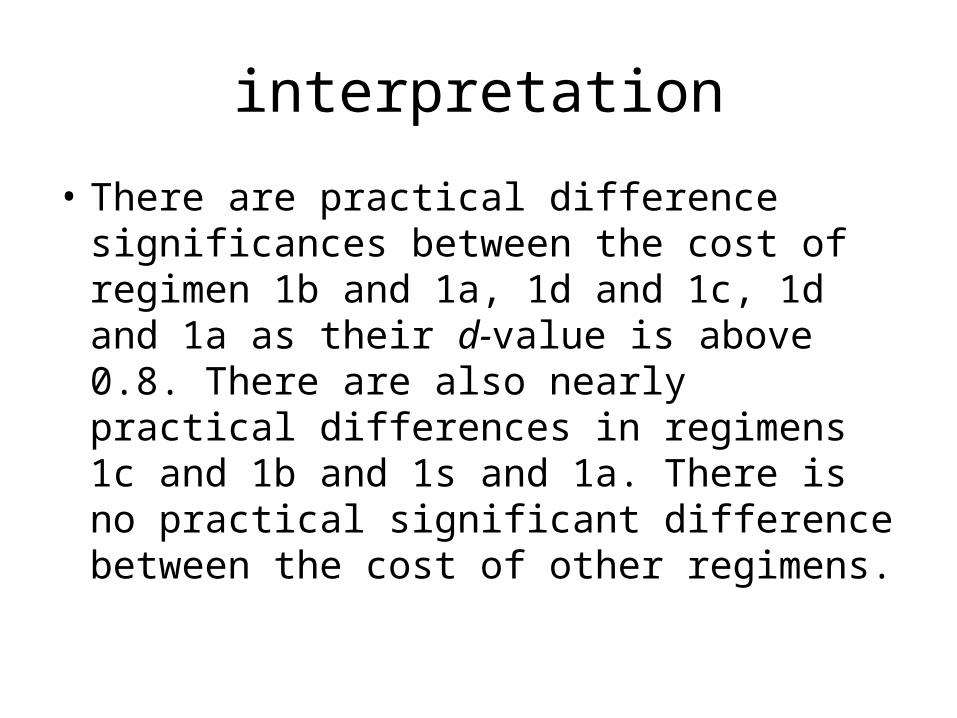
interpretation
• There are practical difference significances between the cost of regimen 1b and 1a, 1d and 1c, 1d and 1a as their d-value is above 0.8. There are also nearly practical differences in regimens 1c and 1b and 1s and 1a. There is no practical significant difference between the cost of other regimens.
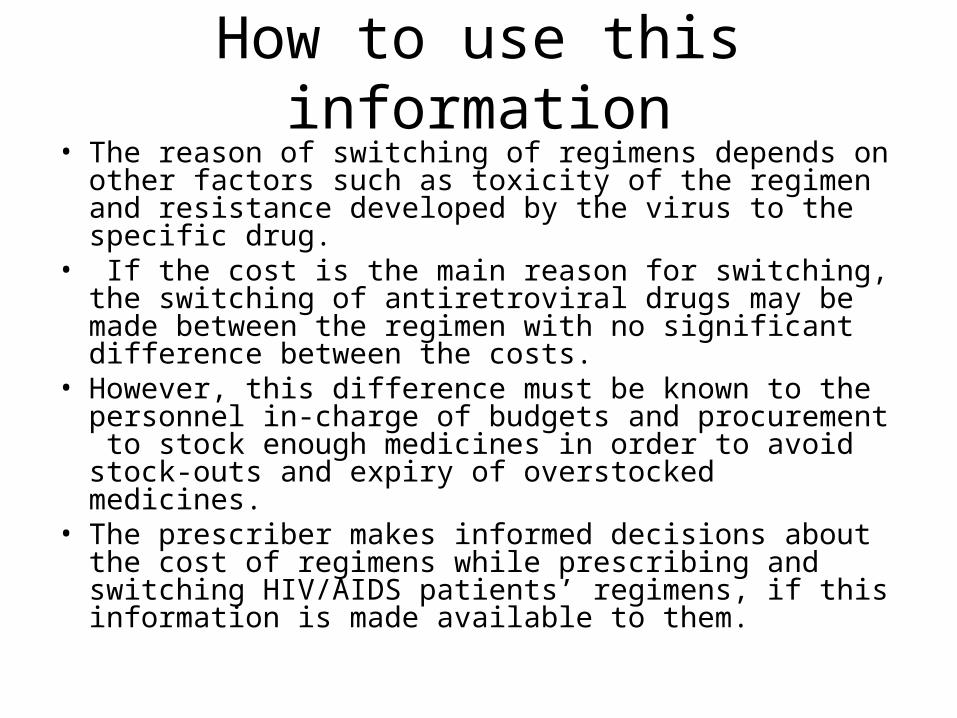
How to use this information• The reason of switching of regimens depends on other
factors such as toxicity of the regimen and resistance developed by the virus to the specific drug.
• If the cost is the main reason for switching, the switching of antiretroviral drugs may be made between the regimen with no significant difference between the costs.
• However, this difference must be known to the personnel in-charge of budgets and procurement to stock enough medicines in order to avoid stock-outs and expiry of overstocked medicines.
• The prescriber makes informed decisions about the cost of regimens while prescribing and switching HIV/AIDS patients’ regimens, if this information is made available to them.

Table 3 Outcome of HIV treatment using CD4 cell count in cells/mm 3
Antiretroviral regimens
CD4 cell count increase
Number of patients on regimen
Mean and standard deviation
Number of patients with CD4 increase Maximum Median
1a 527 239.2 ±238.1 526 1641.0 177.5
1b 437 226.4±184.2 435 1179.0 191.5
1c 109 192.1±194.6 109 847.0 184
1d 89 198.8±169.8 88 675.0 181.5
1s 262 275.0±239.2 259 1106.0 231.0
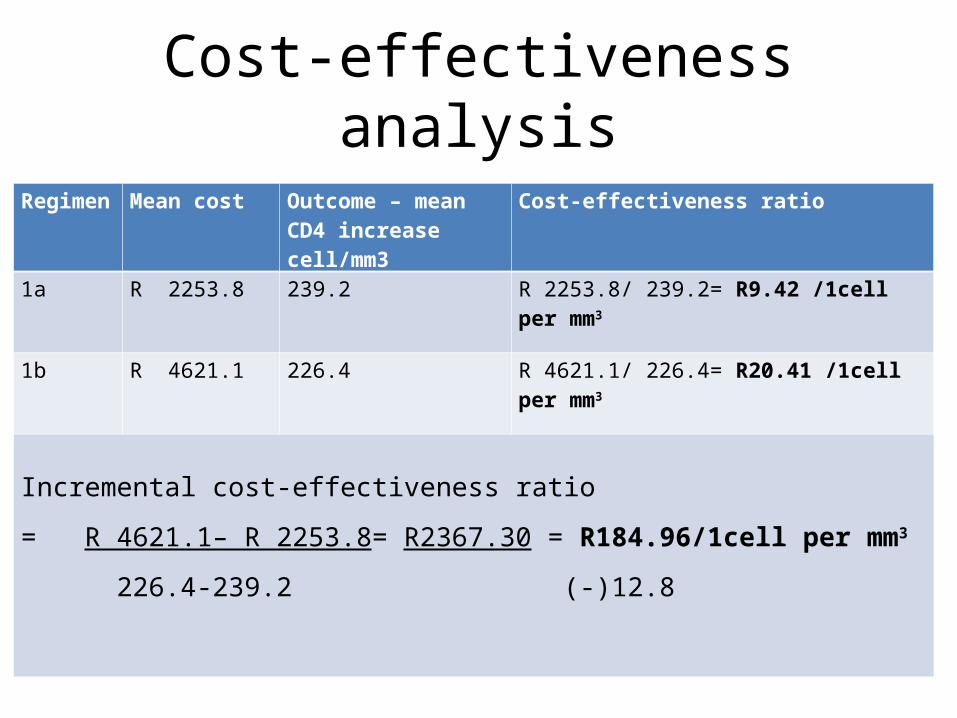
Cost-effectiveness analysis
Regimen Mean cost Outcome – mean CD4 increase cell/mm3
Cost-effectiveness ratio
1a R 2253.8 239.2 R 2253.8/ 239.2= R9.42 /1cell per mm3
1b R 4621.1 226.4 R 4621.1/ 226.4= R20.41 /1cell per mm3
Incremental cost-effectiveness ratio
= R 4621.1– R 2253.8= R2367.30 = R184.96/1cell per mm3
226.4-239.2 (-)12.8

interpretation• • For regimen 1a to increase CD4 cell count by 1
cell/mm3, R9.42 is spent, while for regimen 1b to increase CD4 cell count by 1 cell mm3, a total amount of R20.41 is spent.
• Incremental cost-effectiveness is R184.96 meaning that to get additional CD4 cell increase of 1cell/mm3, this is the amount of money that is supposed to be spent this would enable the patient to receive additional benefit of 1 cell/mm3.

Cost effectiveness analysis of Regimen 1a and 1c
Regimen Mean cost Outcome – mean CD4 increase cell/mm3
Cost-effectiveness ratio
1a R 2253.8 239.2 R 2253.80/ 239.2= R9.42 /1cell per mm3
1c R 2509.9 192.1 R 2509.90/ 192.1= R13.07 /1cell per mm3
Incremental cost-effectiveness ratio
= R 2509.90 – R 2253.80= R256.10 = R4.26/1cell per mm3
192.1- 239.2 (-)60.16

interpretation
• Interpretation• For regimen 1a to increase CD4 cell count by 1
cell/mm3, R9.42 is spent, while for regimen 1c to increase CD4 cell count by 1 cell mm3, R13.07 is spent. Incremental cost-effectiveness is R4.26 this means that to get additional benefit of CD4 cell increase of 1cell/mm3, the amount of R4.26 is supposed to be spent.

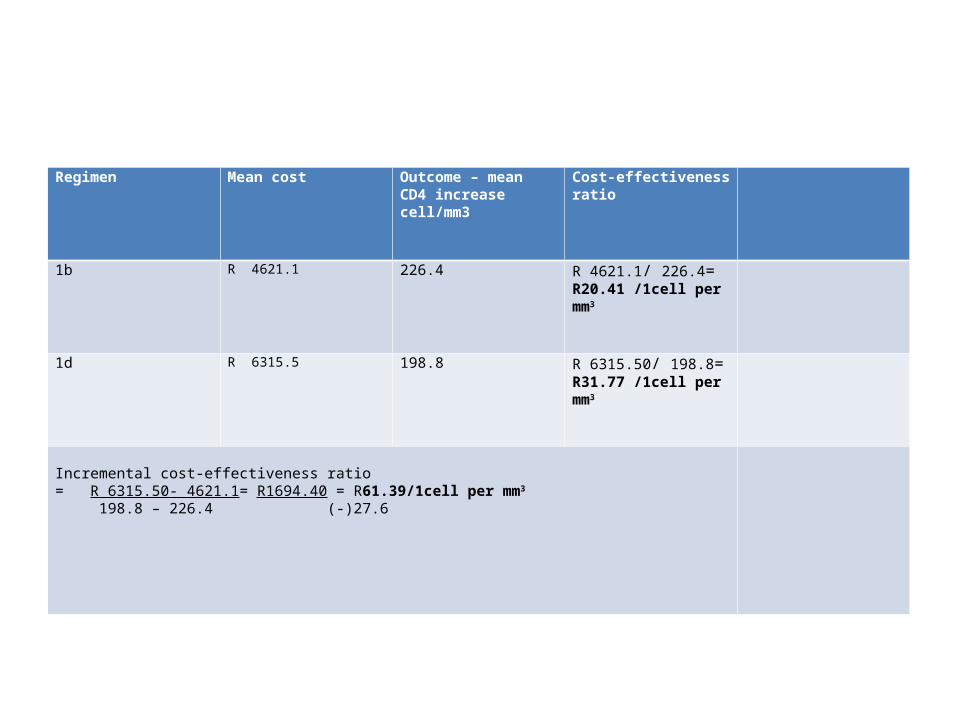
Cost effectiveness analysis between regimen 1b and 1d
Regimen Mean cost Outcome – mean CD4 increase cell/mm3
Cost-effectiveness ratio
1b R 4621.1 226.4 R 4621.1/ 226.4= R20.41 /1cell per mm3
1d R 6315.5 198.8 R 6315.50/ 198.8= R31.77 /1cell per mm3
Incremental cost-effectiveness ratio = R 6315.50- 4621.1= R1694.40 = R61.39/1cell per mm3
198.8 – 226.4 (-)27.6

interpretation
• For regimen 1a to increase CD4 cell count by 1 cell/mm3, R9.42 is spent, while for regimen 1c to increase CD4 cell count by 1 cell mm3, R13.07 is spent. Incremental cost-effectiveness is R4.26 this means that to get additional benefit of CD4 cell increase of 1cell/mm3, the amount of R4.26 is supposed to be spent.
Regimen Mean cost Outcome – mean CD4 increase cell/mm3
Cost-effectiveness ratio
1b R 4621.1 226.4 R 4621.1/ 226.4= R20.41 /1cell per mm3
1d R 6315.5 198.8 R 6315.50/ 198.8= R31.77 /1cell per mm3
Incremental cost-effectiveness ratio = R 6315.50- 4621.1= R1694.40 = R61.39/1cell per mm3
198.8 – 226.4 (-)27.6

• For regimen 1b to increase CD4 cell count by 1 cell/mm3, R20.41 is spent, while for regimen 1d to increase CD4 cell count by 1 cell mm3, R31.77 is spent. Incremental cost-effectiveness is R61.39. The interpretation of this situation is that to get additional benefit of CD4 cell increase of 1cell/mm3, Lesotho is expected to spend.

CEA of regimen 1c and 1dRegimen Mean cost Outcome – mean CD4
increase cell/mm3Cost-effectiveness ratio
1c R 2509.9 192.1 R 2509.90/ 192.1= R13.07 /1cell per mm3
1d R 6315.5 198.8 R 6315.50/ 198.8= R31.77 /1cell per mm3
Incremental cost-effectiveness ratio = R 6315.50 - R 2509.90= R 3805.6 = R568.00/1cell per mm3
198.8 – 192.1 6.7
• In order for regimen 1c to increase CD4 cell count by 1 cell/mm3, Lesotho spends R13.07, while for regimen 1d to increase CD4 cell count by 1 cell mm3, R31.77 is spent. Incremental cost-effectiveness is R 568.00. Therefore, to get additional CD4 cell increase of 1cell/mm3, Lesotho is supposed to spend this amount.
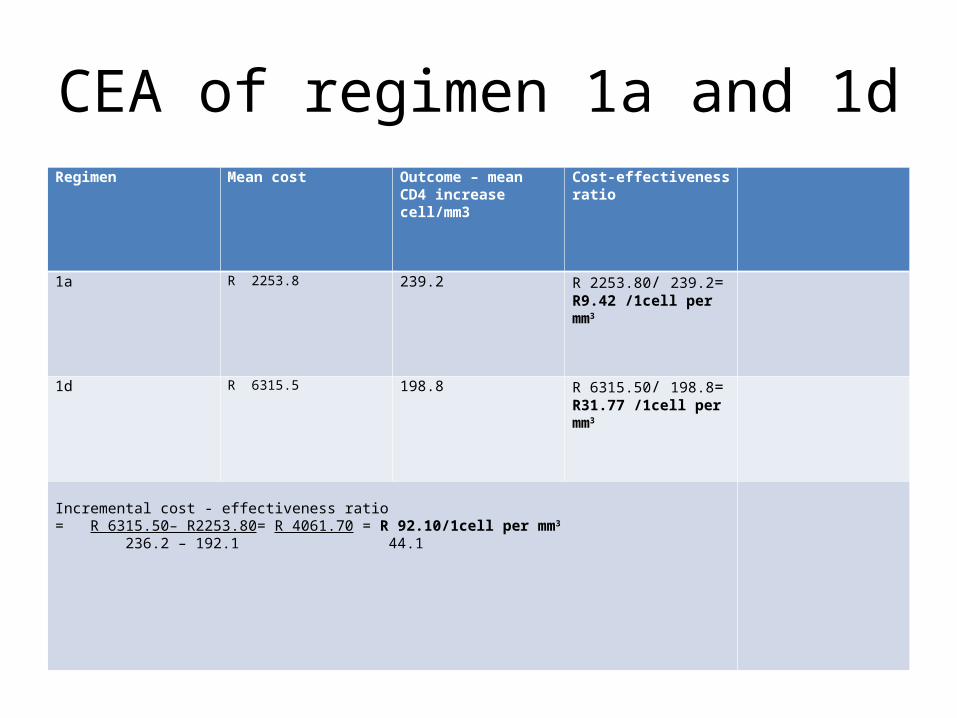
CEA of regimen 1a and 1dRegimen Mean cost Outcome – mean CD4
increase cell/mm3Cost-effectiveness ratio
1a R 2253.8 239.2 R 2253.80/ 239.2= R9.42 /1cell per mm3
1d R 6315.5 198.8 R 6315.50/ 198.8= R31.77 /1cell per mm3
Incremental cost - effectiveness ratio = R 6315.50– R2253.80= R 4061.70 = R 92.10/1cell per mm3
236.2 – 192.1 44.1

• Interpretation• For regimen 1a to increase CD4 cell count by 1
cell/mm3, R9.42 is spent, while the amount to be spent for regimen 1d to increase CD4 cell count by 1 cell mm3, R31.77. Incremental cost-effectiveness was R 92.10. This figure shows that to get additional CD4 cell increase of 1cell/mm3, would be R92.10.

Summary
Antiretroviral regimens
Cost-effectiveness ratio
1a
R 2253.80/ 239.2 = R9.42 /1cell per mm3
1b
R 4621.1/ 226.4 = R20.41 /1cell per mm3
1cR 2509.90/ 192.1 = R13.07 /1cell per mm3
1dR 6315.50/ 198.8 = R31.77 /1cell per mm3

interpretation
• Incremental cost-effectiveness ratio is high between regimens 1c and 1 d and low between 1a and 1c.
• The information can be used when deciding on which regimens to switch to as less money is needed to gain the same benefit in CD4 cell count increase, as opposed to a more expensive regimen with the same benefit in terms of CD4 cell count increase.

conclusion• Assessment of cost–effectiveness of antiretroviral regimens used in
the treatment of HIV/AIDS shows that stavudine-based regimens cost less than zidovudine based. A higher CD4 cell count increase is a response for antiretroviral treatment.
• The stavudine-based regimen is given to the majority of patients and results in cost saving, but a high benefit for HIV/AIDS patients.
• This information may be used for the decision to continue use of stavudine in Lesotho. The cost of drugs is deciding factor for the CD4 cell increase and for the cost-effectiveness ratio.
• Zidovudine-based regimens especially one with Nevirapine, also have a lower cost effectiveness ratio.

Concl. Cont.• Cost-effectiveness ratios for both stavudine and
zidovudine-based regimens with efavirenz as well as the cost/prevalence index, and d value are higher than those with nevirapine.
• This information may be used in major public health decisions on antiretroviral regimens that the country decides to use, bearing in mind that Lesotho has the third highest HIV/AIDS prevalence and is one of the least developed countries. It depends heavily on foreign assistance, especially for HIV/AIDS management.

•Thank you