Embed Size (px)
Citation preview
0
A Reversal of Political Fortune:
The Transitional Dynamics of Conservative Rule in the Brazilian Northeast
Abstract
This study explains the erosion of conservative rule and the rise of leftist oppositions at the
subnational level in the Northeast of Brazil in recent electoral cycles. Compared against
explanations based on economic modernization, social spending, and fiscal reform, the data best
support the hypothesis that the organizational and spatial dimensions of leftist mobilization in
these states have shifted to the detriment of conservative machines. Specifically, urban
mobilization of leftist supporters has determined the electoral success of these oppositions. The
study also explains where conservatives maintain a floor of support based on the continuation of
clientele networks.
1
For most of the period since the transition to democracy in 1985, Brazilian political
institutions have been dominated by right- and center-right political forces. Numerous studies of
the transition, the drafting of the 1988 Constitution, and the presidencies of the New Republic
have underscored the outsize influence of conservatives, some with intimate ties to the
bureaucratic-authoritarian regime of 1964-1985 (cf. Power 1996, 2000; Hagopian 1996;
Mainwaring, Meneguello, and Power 2000). Under both authoritarian and democratic regimes,
conservatives relied on control over the patronage-rich apparatus of state governments to provide
the political leverage they required to mold partisan and legislative programs at the federal level.
And no other region of Brazil exhibited the influence of the right more acutely than the nine
states of the Northeast. Perhaps the epitome of the erstwhile model of conservative rule based on
subnational machines with federal reach were the cases of Antônio Carlos Magalhães (ACM)
from Bahia and former president José Sarney from Maranhão and Amapá. Both exercised
extraordinary influence during the two terms that Fernando Henrique Cardoso held the
presidency (1994-02). Even Cardoso‟s once-center-left party, the Partido da Social Democracia
Brasileira (PSDB), became more conservative by allying with the right-wing Partido da Frente
Liberal (PFL) (now the Democratas, DEM), one of the preferred organizations of the right
(Power 2001).
Given such a long, entrenched position in Brazilian politics at all levels of the federation,
the displacement of conservative machines, especially in the Northeast, during the last few
electoral cycles comes as a surprise. While the election of Inácio Lula da Silva to the presidency
in 2002 and his re-election in 2006 have been well-studied, the erosion of conservative rule at
the subnational level, and particularly losses of gubernatorial offices and shrinking seat shares in
state assemblies in the old redoubts of conservative rule in the Northeast, has been largely
2
ignored.1 And while Lula‟s electoral victories owe much to his ability to adopt some of the
techniques of conservatives to buy the support of the poor (Hunter and Power 2007; Zucco
2008), the marked decline of conservatives in their own bailiwicks and most often to leftist
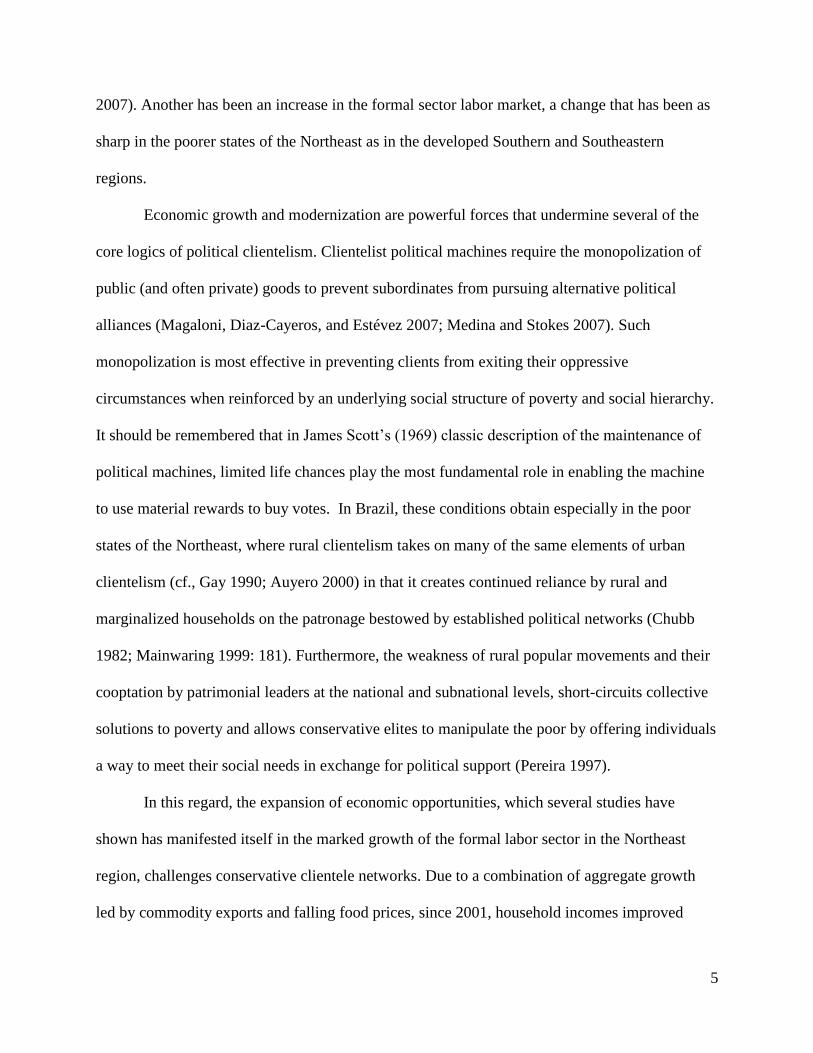
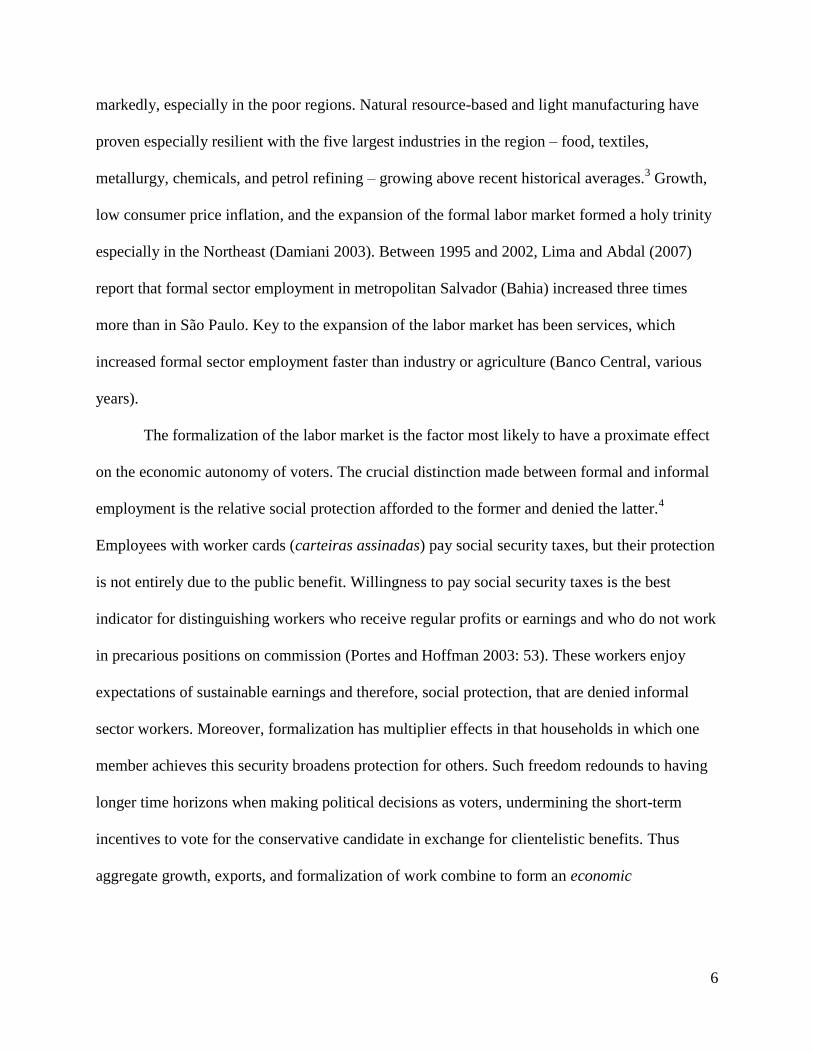
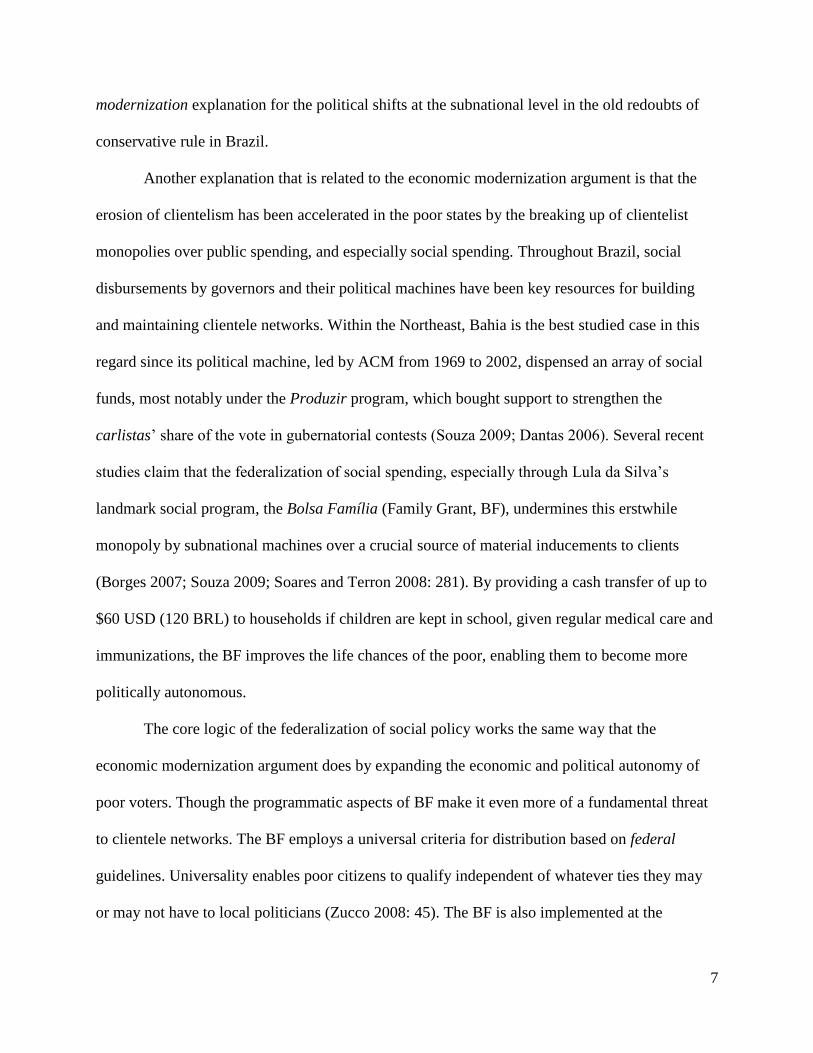
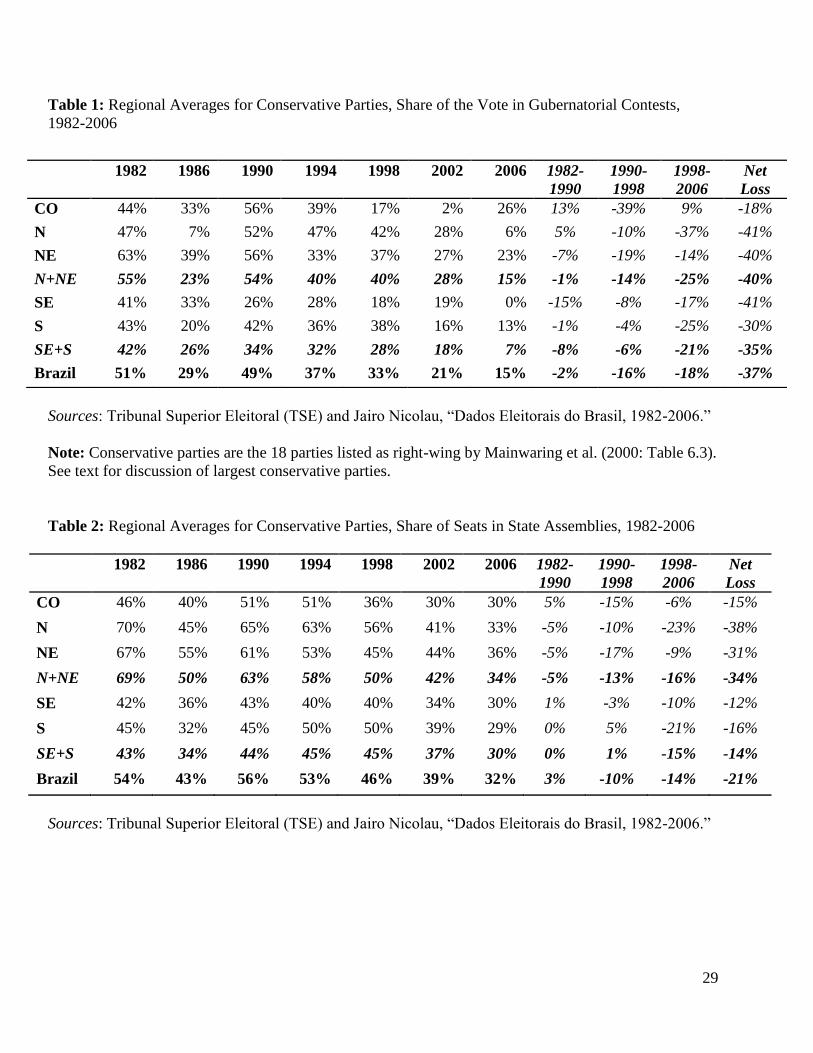
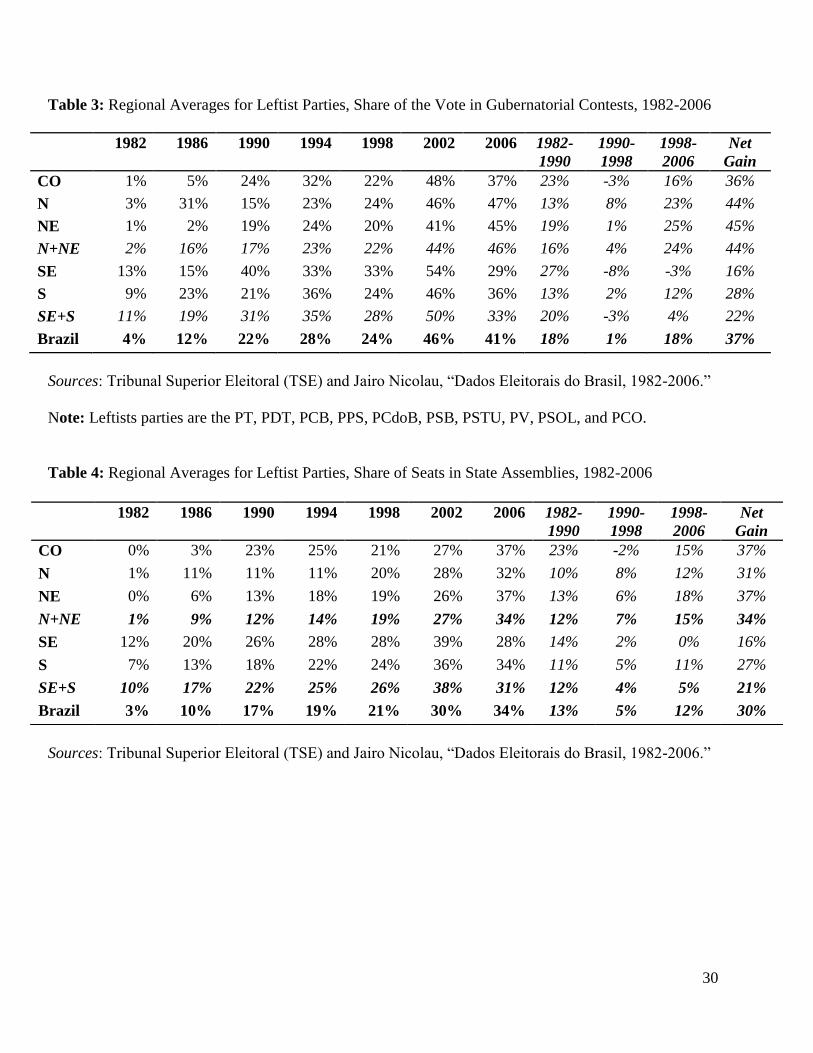
challengers underscores that the model of conservative rule itself is imperiled. Tables 1-4 show
the evolution of conservative and leftist support at the subnational level by region. They are
mirror images in that the right has suffered its most acute declines in the North and Northeast
while the left has made its strongest gains in these same regions. The period of most rapid
change encompasses the eight years including the three electoral cycles of 1998, 2002, and 2006,
most predating Lula‟s presidency. Also notable is the shift of vote shares from right to left at the
gubernatorial level. This is particularly significant because governors control political machines
and shape the careers of deputies and mayors (Samuels 2003a; Mainwaring 1999: 193-94;
Abrúcio 1998: ch. 3), and conservatives tend to value the executive post much more highly than
seat shares in the assembly (Power 1996: 72). Moreover, that a large portion of these losses have
come at the hands of leftists poses an existential threat to the model of conservative rule since
these forces are the least likely to make concessions to the right or to partner with conservatives
as centrists routinely do at both the national and subnational levels.
[Tables 1-4 here]
Unlike the leftist parties that are more ideological and internally disciplined, the
conservative organizations depend upon material incentives to turn out their supporters, who are
mostly poor and undereducated voters in some of the more backward states of Brazil. Traditional
conservatives parochialize politics, especially in their subnational bases, by limiting political
contestation de facto through the control of representation, by mobilizing citizens through vote-
and turnout-buying and de-mobilizing them through turnout-suppression (Hagopian 1996).2
3
Voters can express their choices at the ballot box, but they are influenced ex ante by conservative
elites through material incentives, realized or promised. In this way, traditional incumbents
practice what Gibson (2005) calls “boundary control,” by undercutting the creation of possible
alliances that could otherwise empower an opposition to conservative rule and broaden political
competition (Samuels 2003a, 2006a; Abrúcio 1998; Lewin 1987; Mainwaring 1999; Mainwaring
et al. 2000).
The reversal of the political fortunes of conservatives in recent elections is therefore
puzzling on several dimensions. First, why a decline? Why has the model of conservative rule
that has been so dominant for so long and been the basis for many scholars of Brazil to describe
the essence of the country‟s politics eroded so badly? Second, why has this decline occurred
most recently? For the first decade of the New Republic, scholars of Brazil underscored the
continuity of conservative influence as if it was a more or less permanent fixture of the country‟s
politics (e.g., Weyland 1996; Hagopian 1996; Power 2000). Why has the decline occurred during
the second decade of democracy? Third, why has the decline of the right been most acute in the
regions that have long served as their redoubts? And, lastly, why have conservative losses
seemingly come at the hands of leftists? Leftists have made the strongest gains against traditional
conservatives and in their core bailiwicks in the poor states.
This study finds that the most consistent factor in explaining the erosion of conservative
rule primarily to the benefit of leftist oppositions is the improved capacity of leftist parties to
mobilize in urban centers. This has especially been important in the poor states of the Northeast.
In these urban centers, where populations are larger and more diverse, electoral competition has
historically been higher, affording leftists electoral toeholds in states largely controlled by
traditional elites and their clientele networks. Since the mid-1990s, leftist organizations and
4
especially those statewide parties that moderated once-extreme positions on capitalism and the
market (e.g., PT, PCdoB), have formed more consistent alliances. Their mobilization strategies
have expanded beyond urban clusters in roughly concentric circles. As such, these parties have
failed to penetrate the least urban zones, known in Brazil as os grotões; interior territories still
very much in the control of traditional clientele networks. But the left‟s mobilizational assets
have accumulated over time and paid off most notably in the gubernatorial results of 2006, which
witnessed the most notable electoral shifts in once-conservative states such as Bahia, Ceará,
Pernambuco, and Maranhão.
This leftist-mobilizational hypothesis will, in the next section, be unpacked further, but it
can first be contrasted to several alternative explanations. One is that the states that have for long
been the old redoubts of conservatives have, in the past few years, modernized their economies
and societies in ways that have improved citizens‟ life chances, thereby reducing the control
conservatives exert through clientelism. During this span of time, the most notable change to
happen in Brazil involved a transformation in the economic growth strategy in favor of exports
(Shikida, Monasterio, Araújo Jr., Carraro, and Damé 2009; Silva, Braga, and Costa 2010). After
several lackluster years of low growth and a financial crisis in 1999, Brazil began to recover and
to take full advantage of a strong upsurge in international (especially Chinese) demand for
natural resource manufactures and agricultural commodities. The resulting commodity boom
affected even the poor states of Brazil, as commercial agriculture grew with the expanded
demand for commodity exports. The growth of both agriculture and industry produced
externalities for the service sector, where most Brazilians are employed. These economic
changes created noticeable social transformations. One of these is the much-studied reduction in
inequality as measured by the Gini coefficient (Paes de Barros, Carvalho, Franco, and Mendonça
5
2007). Another has been an increase in the formal sector labor market, a change that has been as
sharp in the poorer states of the Northeast as in the developed Southern and Southeastern
regions.
Economic growth and modernization are powerful forces that undermine several of the
core logics of political clientelism. Clientelist political machines require the monopolization of
public (and often private) goods to prevent subordinates from pursuing alternative political
alliances (Magaloni, Diaz-Cayeros, and Estévez 2007; Medina and Stokes 2007). Such
monopolization is most effective in preventing clients from exiting their oppressive
circumstances when reinforced by an underlying social structure of poverty and social hierarchy.
It should be remembered that in James Scott‟s (1969) classic description of the maintenance of
political machines, limited life chances play the most fundamental role in enabling the machine
to use material rewards to buy votes. In Brazil, these conditions obtain especially in the poor
states of the Northeast, where rural clientelism takes on many of the same elements of urban
clientelism (cf., Gay 1990; Auyero 2000) in that it creates continued reliance by rural and
marginalized households on the patronage bestowed by established political networks (Chubb
1982; Mainwaring 1999: 181). Furthermore, the weakness of rural popular movements and their
cooptation by patrimonial leaders at the national and subnational levels, short-circuits collective
solutions to poverty and allows conservative elites to manipulate the poor by offering individuals
a way to meet their social needs in exchange for political support (Pereira 1997).
In this regard, the expansion of economic opportunities, which several studies have
shown has manifested itself in the marked growth of the formal labor sector in the Northeast
region, challenges conservative clientele networks. Due to a combination of aggregate growth
led by commodity exports and falling food prices, since 2001, household incomes improved
6
markedly, especially in the poor regions. Natural resource-based and light manufacturing have
proven especially resilient with the five largest industries in the region – food, textiles,
metallurgy, chemicals, and petrol refining – growing above recent historical averages.3 Growth,
low consumer price inflation, and the expansion of the formal labor market formed a holy trinity
especially in the Northeast (Damiani 2003). Between 1995 and 2002, Lima and Abdal (2007)
report that formal sector employment in metropolitan Salvador (Bahia) increased three times
more than in São Paulo. Key to the expansion of the labor market has been services, which
increased formal sector employment faster than industry or agriculture (Banco Central, various
years).
The formalization of the labor market is the factor most likely to have a proximate effect
on the economic autonomy of voters. The crucial distinction made between formal and informal
employment is the relative social protection afforded to the former and denied the latter.4
Employees with worker cards (carteiras assinadas) pay social security taxes, but their protection
is not entirely due to the public benefit. Willingness to pay social security taxes is the best
indicator for distinguishing workers who receive regular profits or earnings and who do not work
in precarious positions on commission (Portes and Hoffman 2003: 53). These workers enjoy
expectations of sustainable earnings and therefore, social protection, that are denied informal
sector workers. Moreover, formalization has multiplier effects in that households in which one
member achieves this security broadens protection for others. Such freedom redounds to having
longer time horizons when making political decisions as voters, undermining the short-term
incentives to vote for the conservative candidate in exchange for clientelistic benefits. Thus
aggregate growth, exports, and formalization of work combine to form an economic
7
modernization explanation for the political shifts at the subnational level in the old redoubts of
conservative rule in Brazil.
Another explanation that is related to the economic modernization argument is that the
erosion of clientelism has been accelerated in the poor states by the breaking up of clientelist
monopolies over public spending, and especially social spending. Throughout Brazil, social
disbursements by governors and their political machines have been key resources for building
and maintaining clientele networks. Within the Northeast, Bahia is the best studied case in this
regard since its political machine, led by ACM from 1969 to 2002, dispensed an array of social
funds, most notably under the Produzir program, which bought support to strengthen the
carlistas‟ share of the vote in gubernatorial contests (Souza 2009; Dantas 2006). Several recent
studies claim that the federalization of social spending, especially through Lula da Silva‟s
landmark social program, the Bolsa Família (Family Grant, BF), undermines this erstwhile
monopoly by subnational machines over a crucial source of material inducements to clients
(Borges 2007; Souza 2009; Soares and Terron 2008: 281). By providing a cash transfer of up to
$60 USD (120 BRL) to households if children are kept in school, given regular medical care and
immunizations, the BF improves the life chances of the poor, enabling them to become more
politically autonomous.
The core logic of the federalization of social policy works the same way that the
economic modernization argument does by expanding the economic and political autonomy of
poor voters. Though the programmatic aspects of BF make it even more of a fundamental threat
to clientele networks. The BF employs a universal criteria for distribution based on federal
guidelines. Universality enables poor citizens to qualify independent of whatever ties they may
or may not have to local politicians (Zucco 2008: 45). The BF is also implemented at the
8
municipal level, thereby circumventing governors and their influence over the distribution of
public monies (Fenwick 2009; Borges 2007: 127-8). Municipalization not only frees voters from
gubernatorial pressure, it also releases mayors and city councilors, who are free to credit-claim
off of the benefits of the BF without depending on the largesse of governors (Fenwick 2009:
114). By channeling resources in a targeted way to the poor, and especially those residing in the
backwater grotões of the poorest states of the North and Northeast, the BF undermines clientele
networks where they have historically been strongest.
The effects of economic growth, labor market formalization, and the federalization of
social policy accompanied a process of market-oriented adjustment that was institutionalized
during the two terms of Cardoso‟s presidency. Structural reforms meant to rein in public
spending, especially among the heavily indebted states during the 1990s, evolved from stop-gap
fiscal adjustment legislation such as the Camata and Kandir laws and culminated in the Law of
Fiscal Responsibility (Lei de Responsabilidade Fiscal, LRF) of 2000 (Montero 2004; Eaton and
Dickovick 2004). The LRF established stringent spending ceilings on the states and particularly
on outsize expenditures on civil service payrolls. As a result, this erstwhile source of patronage
(empreguismo) was undermined. Seen from the perspective of Cardoso‟s allies in the
conservative parties, the LRF represented a fundamental threat to the clientele networks of
traditional elites in the Northeast especially (Eaton and Dickovick 2004: 114). There are few
studies of the law‟s effectiveness, though what does exist suggests that it reduced profligacy,
produced primary surpluses, and improved budgetary transparency in the years following its
enactment (Leoni and Rennó 2006). By limiting patronage, it also undercut conservative rule.
The economic modernization, social policy, and fiscal reform explanations each offer
intuitive insights though they do not explain all aspects of the puzzle of the apparent erosion of
9
conservative rule at the state level. The first problem is one of timing. The data on tables 1-4
indicate that the right‟s reversal of fortune began before the commodity boom, the BF, or the
LRF. To be sure, the most acute increases in leftist gains and conservative losses occur between
1998 and 2002, allowing for fiscal reform to play a role, though not the commodity boom or the
BF. Economic modernization may not be sufficient more generally to erode conservative rule
since the right survived and adapted during periods of faster and more sustained economic
growth in the past (Hagopian 1996; Soares 1973). To be sure, these periods did not see intensive
growth in the formalization of labor markets, especially in the Northeast (Jatobá 1986: 238), but
it is not clear how extensive the more recent process of labor market formalization has been in
the poor regions since studies focus on urban areas primarily. If formalization matters, it must
occur in the grotões as well as in the cities, since it is in the interior that clientele networks are
strongest. Traditional conservatives may also not be directly threatened by the BF since voters
may be tempted to maximize their income by taking conditional cash transfers and the material
incentives provided by patrons. Conservatives might even successfully claim credit for BF and
its secondary effects on local economies. At least one recent survey of BF recipients in Recife,
Pernambuco suggests that voters can be fooled. Figueiredo and Hidalgo (2009) report that
respondents were favorably disposed to campaigns that invoked BF whether they came from
Lula‟s Workers‟ Party (PT) or not. And with regards to the LRF, the law failed to recentralize
the collection of revenues or reduce constitutionally mandated fiscal transfers to the states
(Samuels 2003b). The latter increased since the passage of the law, affording governors more
resources to meet both spending ceilings and fund new mandates. Consequently, the size of the
subnational public sector is no smaller than it was before passage of the LRF.
10
The most fundamental weakness in the economic modernization, social policy, and fiscal
reform arguments is that they do not explain why the erosion of conservative rule would be
accompanied by surging support for leftists at the subnational level. As the next section will
show, the mobilization of leftist parties in states dominated by conservatives follows a similar
organizational and spatial pattern than it did in the past in the industrialized states of the South
and Southeast where leftist parties such as the PT first emerged and spread into the interior. The
findings of this study show that, for the left, mobilizational assets in the poor states of the
Northeast are beginning to pay dividends after the prolongation of conservative rule during the
New Republic. Nonetheless, the evidence shows that the clientele networks of conservatives in
the Northeast have not eroded entirely.
The Mobilizational Left, Clientelist Continuity On the Right
The available explanations for the leftist challenge to conservative rule in the poor states
have at their core the assumption that the clientele networks undergirding right-wing dominance
at the state level eroded badly before the 2006 elections. That is not entirely correct as an
explanation for the declining electoral fortunes of conservatives, and it is insufficient to explain
the rise of leftists. Leftist organizations significantly expanded their mobilizational capacity in
the poor states, cutting into former conservative enclaves. But in almost all cases they did so by
extending from urban and coastal bases that are the most developed areas of these generally poor
states. This allowed the left to expand its support base while conservative clientele networks,
especially in the grotões, continued to support the right. Understanding these dynamics requires
first an evaluation of the organizational differences between conservative and leftist parties and
11
then an assessment of how these differences determine the spatial dimensions of political
competition in the poor states.
Organizational Differences
There are notable differences between the way that conservative and leftist parties
organize politically in the poor states. Clientele networks are decentralized, with ties being
delegated to local officials. These ties are also largely informal and long-term, relying on
previous personal and fraternal contacts that are periodically reinforced by the distribution of
patronage (Lewin 1987; Chubb 1982). Because leftist oppositions in Brazil have historically had
to organize support outside of these clientele networks and succeed despite them, they have
pursued alternative mobilizational strategies.
The key historical difference between conservative and catch-all parties on the one hand
and most of the leftist parties on the other is that the former organizations were “internally
created” by political elites in the Congress, while the latter were “externally mobilized” by social
organizations and from the grassroots.5 Unlike the left, which built more disciplined and
ideologically consistent parties from the grassroots due to their struggle against the military
governments, the right enjoyed the patronage of the authoritarian regime to the point that
conservatives never had to worry about building party organizations from the ground up. While
parties such as the PFL reflect elite-based origins, the PT and the other major leftist parties (i.e.,
PPS, PSB, and PCdoB) are examples of externally created organizations (Meneguello 1989;
Keck 1992; Mainwaring 1999: 165-66). Consequently, the leftist parties enjoy a strong
connection between the grassroots and the partisan leadership, albeit with varying degrees of
leverage by rank-and-file partisans over their leaders (Lacerda 2002: 41-42). But this is in sharp
contrast to the lack of any real grassroots connection between the hierarchy of the conservative
12
parties and their bases. In a broader comparative perspective, the parties of the left in Brazil have
avoided the extremes of cartelization and severe decomposition that have afflicted other labor-
and popular-backed parties in Venezuela and Peru (cf. Roberts 2003; Levitsky and Cameron
2003). They have also resisted the option of shifting from participatory to purely patronage-
based politics as mass populist parties such as the Partido Justicialista in Argentina have done
(cf. Levitsky 2003).
Leftist and conservative models of parties in Brazil reflect two distinctive forms of
grassroots integration within party structures that exist not only during electoral cycles but
between them. Leftist parties cultivate activism from below in their organizational structures.
The focus on constant participation in the mission of building the party requires strong and
continual ties to the base and inspiring ideology to “buy” the commitment of partisans cheaply
(Keck 1992: 79). By contrast, conservative parties require only intermittent contact with local
supporters to distribute material rewards in the form of a combination of public and private
goods in payment for past and future support (Mainwaring 1999: 167). Mostly devoid of
ideological appeals, conservatives purchase their support dearly but such payment assures more
predictable results come election day.
As an extension of this contrast in party structure, leftist parties have primarily used
mobilization strategies to build their base of support. The Workers‟ Party is an archetypal case of
the mobilizational party as it is well organized and highly institutionalized but its leadership has
little autonomy from the rank-and-file (Samuels 2004; Mainwaring 1999: 166; Keck 1992).
These characteristics give the PT a highly adaptive capacity, which partially explains why it has
played a key role in the leftist surge in the poor states. But it also suggests that the PT, and
parties like it, can and do rely on mobilization strategies to build support. High levels of internal
13
participation by rank-and-file members of the party coupled with low levels of leadership
autonomy reinforce the use of mobilizational campaign tactics. Local party leaders and
grassroots activists embrace an ethos that increasing popular participation is empowering and
especially in ways that break down clientelistic dependency (Nylen 1997: 430-432; Hunter
2008). Since rank-and-file partisans are involved in the day-to-day business of managing
grassroots support, their influence within the party imprints their tactical preferences onto the
organization‟s campaign strategy. Hence, PT campaigns are heavily focused on the participation
of rank-and-file members of the party in mobilizational efforts to drum up support and turn it out
on election day.
In sum, the leftist parties in Brazil, and particularly the PT, have the organizational
imperatives Strøm (1990) ascribes to unified parties and Shefter (1994) applies to “externally
mobilized” ones: they gather information about the electorate and its interests, they mobilize
supporters during campaigns, and they implement party policy in institutions to which the
organization gains access. The Brazilian leftist parties also fulfill Strøm‟s (1990: 575)
description of organizations that engage in “labor-intensive” forms of campaigning. These
organizations require more extensive networks of supporters and more elaborate organizational
mechanisms linking rank-and-file and the party directorate than is the case of elitist
(conservative) parties. Of course, conservatives rely on extensive pyramids of brokers and
personal connections, but the glue that holds these networks together is targeted patronage rather
than sustained participation on behalf of programmatic policy.
The Spatial Dimensions of Left and Right in the Poor States
The differences in strategy between capital-intensive distribution of patronage by
conservative and catch-all parties and labor-intensive mobilization by leftist parties set up
14
spatially delimited strategies for campaigns and party-building more generally. It should be
recalled that the organization of conservative rule is itself spatially imbedded as the right retains
control over the grotões, making it difficult for leftist parties to mobilize support in a sustainable
fashion in these areas. Small populations, high levels of poverty, and poor communications with
more developed urban centers make it possible for local bosses and conservative party leaders to
isolate clients and tie them into enforceable vote-buying contracts. Leftist politicians will
gravitate towards urban areas where the opposite conditions obtain.
The importance of urban areas for leftists is based on a number of factors. The first is that
larger populations are both harder for conservatives to buy and therefore inherently more
competitive polities for leftists to organize within (Ames 2001: 99-100). Second, most of the
grassroots organizations that have formed the mobilization base for leftist parties are located in
urban areas and their environs. Leftist organizations such as the PT have long depended upon the
support of organized interests such as unions, middle-class professional groups, and intellectuals,
who party leaders view as reliable supporters (Hunter 2007:453). This model served these
organizations well in the developed South and Southeast where urban centers are abundant and
relatively high levels of literacy and economic activity expanded urbanization well into the
interior of states such as São Paulo. Urban areas include the largest concentration of educated
and upwardly mobile populations, which tend to support left-of-center parties, and particularly
the PT (Samuels 2006b). Third, the success of leftist candidates in being elected to municipal
office in the larger urban centers expands these parties‟ resources by making available jobs in the
public sector for supporters. These locations then become strategic hubs for mobilizing state-
wide. Regarding the PT, Samuels (2004: 1016-17) shows that gaining municipal office in the
larger cities of Brazil forged stronger links between the party and its network of activists and
15
supporters. Finally, short average distances and the ease of road transportation as well as the
reliability of telecommunications make the maintenance of frequent and sustained face-to-face
contacts low-cost. This matters more to leftists since their organizations rely on mobilization of
supporters.
The concentration of the mobilizational efforts of leftist parties on urban centers has been
a central strategy of these organizations in the Northeastern states in recent electoral cycles. I
provide a basis for viewing urbanization as a proxy for leftist mobilization by first referring to a
series of interviews I conducted in June-July 2009 with the presidents and general secretaries of
the major parties in the three largest Northeastern states – Bahia, Ceará, and Maranhão.6 Leftist
respondents speak of having a more recent history of expanding their rank-and-file operations
from urban toeholds. Having relied on these centers and organizational allies such as unions and
social movements that are based there, leftist parties must increasingly contend with their limited
history of maintaining a consistent presence in the interior. Leftist organizers complain about
poor communications with these far-flung locations and a history of clientele networks
controlling airwaves and social programs in these localities. They hold out the hope that federal
spending (under Lula) can make voters more receptive to their campaigns on behalf of their
gubernatorial candidates. When prompted to discuss tactics, conservatives focus on the
governor‟s relationship with mayors and other local notables that are capable of delivering votes
on election day. They frame this discussion in terms of loyalty for work done by the incumbent
governor in the locality and presumably on behalf of the mayor politically. The description that
emerges in these conversations is of an already decentralized political network that maintains
only intermittent contacts with the capital where party headquarters are nominally located.
16
The spatial logics of party leaders are reflected in cross-sectional and longitudinal
comparisons of the geographic clustering of the vote in the Northeast. Drawing on Barry Ames‟
The Deadlock of Democracy (2001), it is possible to map the spatial patterns of political
competition between right and left forces based upon the above expectations. Ames defines two
dimensions for doing so: (1) “vertical penetration” (domination) and (2) “horizontal coverage”
(continguity). Domination refers to a given candidate‟s share of the vote per municipality
weighted by the percentage of the candidate‟s total vote the municipality represents.7 Horizontal
coverage is the clustering of support for a candidate across neighboring (contiguous)
municipalities. This is substantively important to the argument in this study because space is
related to the costs of organization. Those costs are lower for conservative incumbents in the
Northeast who can rely on erstwhile, decentralized clientele networks. So conservatives
dominate their bailiwicks, especially in the grotões where managing clientele networks is
facilitated by smaller and more dispersed populations. By contrast, leftist oppositions must build
their parties at the grassroots level, and mostly in urban areas where organizational allies are
located and where the costs of continued mobilization are lower. Like deputies with concentrated
bases of support in Ames‟ original study, leftist oppositions in the poor states move into adjacent
or nearby areas in roughly concentric circles to minimize the costs of mobilization.
[Figure 1 here]
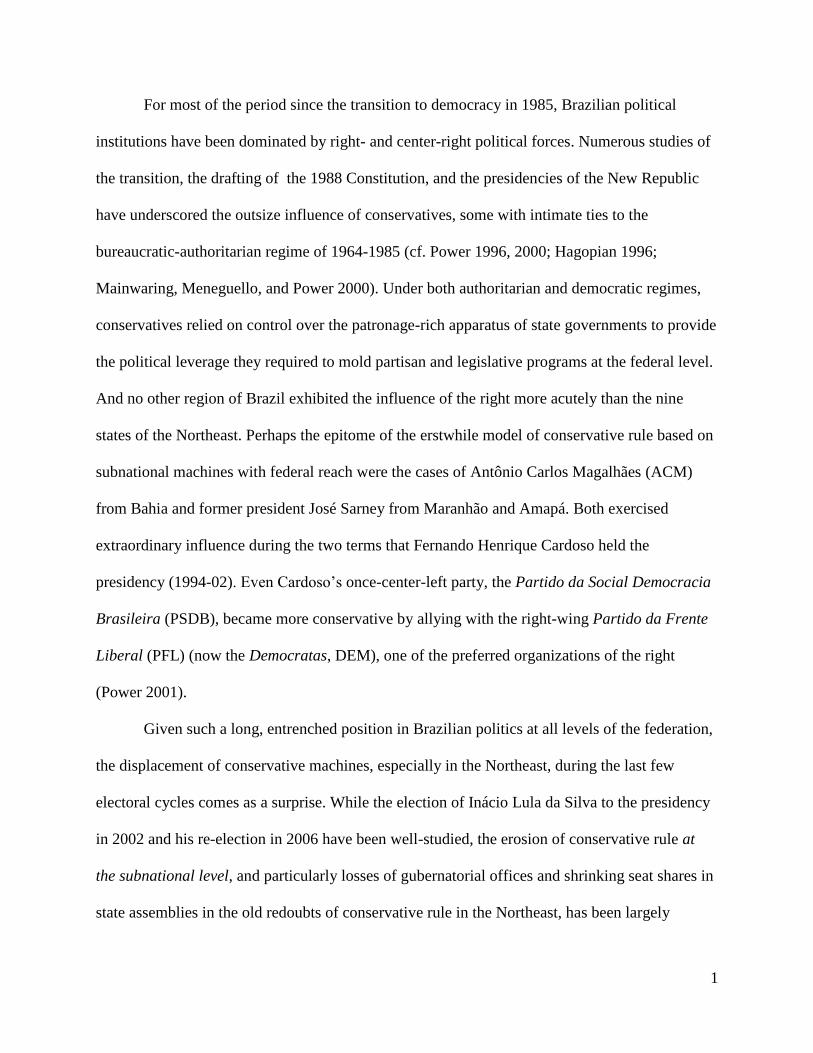
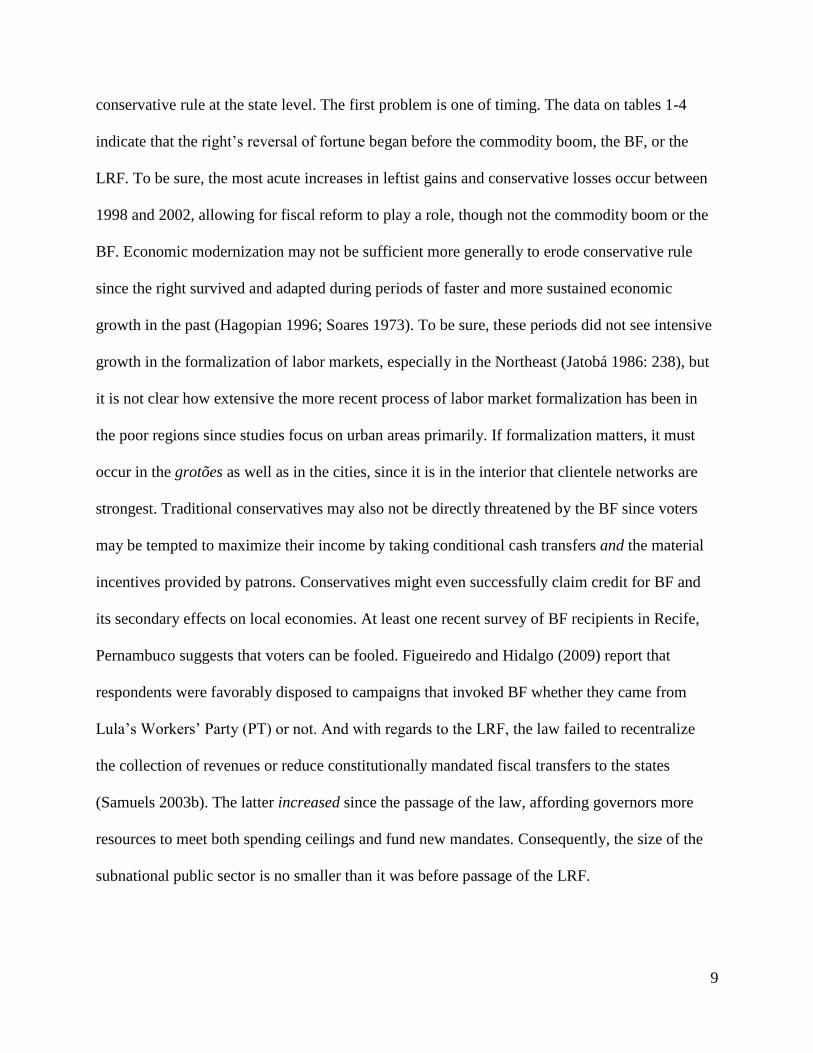
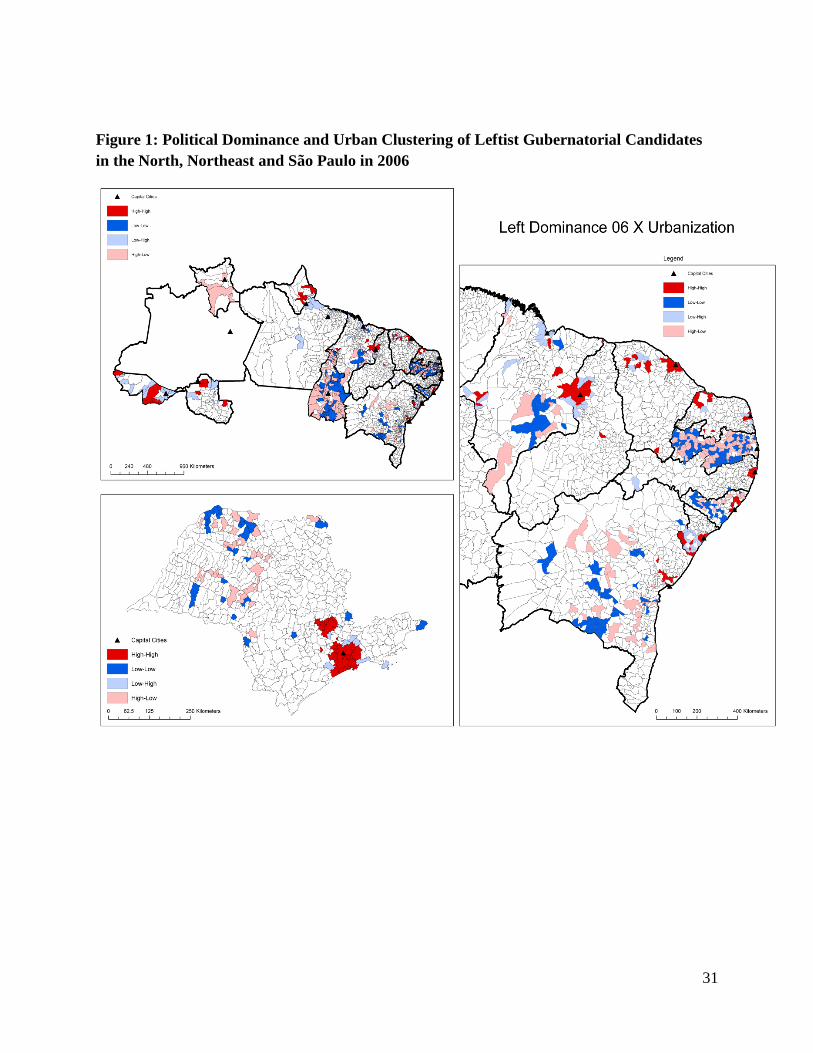
The maps in Figure 1 confirm the spatial patterns expected by the arguments given above
concerning mobilization and urban localization. The figure shows the clustering of the left
candidate for governor‟s political dominance in 2006 and its cross-product with urbanization
among spatial units (“polygons”). The clusters are coded positive (“High-High”/“Low-Low”)
and negative (“High-Low”/“Low-High”) among contiguous neighbors using local indicators of
17
spatial association (LISA) (Mitchell 2005).8 LISA calculates the cross-product of the
standardized value of the first variable at a municipal location i with that of the average for
another variable in contiguous neighbors. Shaded clusters show localized correlations that are
statistically different from spatial randomness. The cluster maps show the location of the cores
of clusters having either high-high or low-low relationships among cross-products. Where values
are inverse (high-low and low-high), clusters are designated as spatial outliers that are the
converse of the linear relationship. As expected, the results show that the left garners
concentrated vote shares in urban and coastal areas within states. The left depended on these
areas to maintain electoral toeholds in previous elections. More important for understanding the
left‟s growing vote shares, the environs around these urban cores were not dominated by
conservatives, making them penetrable by the opposition in subsequent contests. These adjacent
areas were divided or “shared municipalities” that are the logical places for partisans relying on
spatially concentrated voting patterns to fish for votes (Ames 2001: 83).
In the states where leftist opposition in 2006 took larger shares of the gubernatorial vote
and legislative seat shares and won the governorship (e.g., Bahia, Sergipe, Maranhão), the
pattern of urban concentric mobilization is evident. The pattern is less clear in the Northern
states, where neither capitals nor urban cores cluster with concentrations of support for leftists.
This may be due to the sparser distribution of population in this region relative to the Northeast.
Only the nine states of the Northeast region show a clustering pattern consistent with the
expectations of leftist political domination in urban locations. This is noteworthy as it confirms
Ames‟ findings (2001: 74, 100-101) that domination is more acute in the Northeast than in other
regions. Therefore, we should expect a regional effect in assessing the influence of spatial and
mobilizational factors.

18
The clustering of leftist vote shares in São Paulo reflects a more mature organizational
base in which leftist parties have had many elections to mobilize the vote and build their
organization. In this case, the second largest city located in the interior, Campinas, is a center of
leftist domination, in addition to the greater metropolitan area of São Paulo, the city, and the port
of Santos. The comparison of the mature pattern in São Paulo to the more urban-focused pattern
in the Northeast is instructive if we consider the latter representative of an earlier phase of what
we observe in the paulista case. In this regard, it is useful to consider what the spatial
distribution of the leftist vote looked like much earlier in São Paulo‟s political evolution, and
particularly on the eve of the first elections for governor and the federal congress in 1982. Rachel
Meneguello‟s (1989) study of the PT in that election can be employed for the comparison
attempted here. She presents a spatial distribution of the PT candidate‟s vote in all eleven of the
state‟s administrative regions, noting a heavy concentration of support for the party in
metropolitan São Paulo (Meneguello 1989: Map 1, p. 135). She credits the role of organized
social actors such as unions and the strong connection to the original PT leadership to this area
for these results. But in explaining unexpected levels of voting for the PT in the interior, and
particularly in places close to the metropolitan area, she notes that party organization explained
these outcomes in the absence of other predictors known to be influential.9 These spatial patterns
underscore the role of the mobilization strategy of leftist parties and they reflect the patterns
evident in the Northeast during the 2002-2006 period.
The spatial-mobilization argument presented here and tested in the next section provides
several challenges to extant explanations of the reversal of conservative fortunes in the
Northeast. First, neither exclusively structural- nor agent-based approaches are sufficient. Spatial
logics shape mobilizational costs and strategies of leftist oppositions and conservative machines.
19
In this way, urban and rural structures interact with organizational agents. Second, while
economic aspects of modernization are insufficient to cause the political shifts in the Northeast,
social dimensions such as urbanization interact with political agency to provide an explanation.
The study does not attempt to confirm or deny the role of structures or modernization, but to
unpack their elements and to understand better how these might interact with the political agents
that organize themselves to gain power at the subnational level.
The Statistical Analysis
Fully testing the hypotheses discussed above requires both a longitudinal comparison to
explain the distribution of the vote over time as depicted on tables 1-4 and cross-sectional
analysis to account for the geographic patterns. A panel analysis allows for a study at the state
level to assess the performance of the variables we can measure over time. This study begins
with such an analysis of the left‟s and the right‟s share of gubernatorial votes and state assembly
seats in five elections: 1990, 1994, 1998, 2002, and 2006 in 26 states.10
One complication of this
approach is that some of the hypothesized predictors, namely the Bolsa Família, Lula‟s
presidency, and the LRF, might have influenced the 2002 and 2006 elections, but they post-date
the earlier cycles. Including these factors in a panel study introduces bias due to non-random
selection of cases. To correct for that, I employ a cross-sectional comparison including BF,
Lula‟s coattails, and the LRF in a subsequent test. The underlying dataset for the second test uses
municipal units of analysis to allow for much greater degrees of freedom than would be afforded
by the state-level dataset. The data for the cross-sectional analysis are taken from the states of the
North and Northeast where the political shifts of interest were most pronounced, and São Paulo,
as a contrast.11
20
In the panel analysis, the dependent variables are the share of the gubernatorial vote
going to candidates defined as leftists or conservative.12
A second set of models predict seat
shares in state assemblies. One can assume that the configuration of power in the states takes
similar forms in gubernatorial and state assemblies, especially in states with high levels of
political domination.13
Rather than focus on one and not the other, this study analyzes both with
the expectation that the predictors will perform similarly. For both, I employ the same partisan
coding used to construct tables 1-4. The predictors of interest are urbanization – overall and in
the regions of greatest change (the North and the Northeast) – economic performance, and
patterns of public spending. These factors proxy for the mobilization, economic modernization,
and clientelism explanations, respectively.14
Urbanization rates represent the percentage of the
population that lives in urban areas as defined by the Instituto Brasileiro de Geografia e
Estatística (IBGE).15
Economic performance is measured as aggregate growth rates, sectoral
growth in manufacturing and services, and export growth. The density of holders of carteiras
assinadas as a percentage of the economically active population (EAP) is the measure of labor
market formalization. Clientelism is operationalized indirectly through the growth of public
spending during electoral cycles (a control for aggregate spending standardized by state GDP is
included).16
Public sector employees (federal, state, and municipal) as a percentage of the state‟s
electorate is employed as an accepted indicator of a well-organized interest group that may favor
the left due to its support of unions.17
But this factor can also help the right in the poorer states
where unions are weak and the use of public employment to support clientele networks
(empreguismo) is common practice. Additionally, governors can wield patronage resources most
autonomously to protect the incumbent machine where they do not depend on tax revenues and
have discretion over fiscal transfers from the national government (Gervasoni 2010). These
21
conditions are borne out in the Brazilian states, and especially the poor ones that are of greatest
interest to the study. Thus fiscal transfers as a percentage of all revenues per state-election year
are included in the analysis. All economic and fiscal data come from IBGE and IPEA.
The models include a number of controls. Political controls for the relative
competitiveness of subnational elections and re-election rates and dummies for traditional
conservative and leftist incumbents are analyzed. A competitiveness score based on average
margins for the previous gubernatorial contest would predict improved chances for the
opposition in states with a recent history of more competitive elections and lower re-election
rates.18
Conservatives and leftist incumbents should be able to help themselves and like-minded
allies in subsequent contests. Given conservatives‟ heavier reliance on access to patronage,
incumbency effects should be more consistent for them than for leftist opponents. Following
much scholarship on leftist parties in Brazil, candidates from these parties should garner more
support in areas with higher levels of social development (i.e., per capita income, education, life
expectancy, etc.) and lower levels of inequality. These factors are measured through the use of
the United Nation‟s Human Development Index and the Gini coefficient.
Given that the data used are cross-sectionally dominated (i.e., N>T), panel-corrected
standard error (PCSE) techniques are inappropriate for this study. A random effects (RE)
technique for panel data is the most efficient option provided that the assumptions for use of RE
are obtained. Fortunately, the results of Breusch-Pagan Lagrange multiplier (LM) tests on the
models showed that the data could be analyzed with an RE technique. Yet without the benefit of
PCSE, which controls for heteroskedasticity and first-order serial autocorrelation, a random
effects estimation is vulnerable to these problems. For these data we can assume that error terms
are correlated within panels. For example, it is unlikely that the gubernatorial vote and assembly
22
seat share distribution between right and left are independent of one another from election to
election within the same state. 19
Therefore, I use a robust cluster estimator in the models, which
is an effective way of correcting for not only serial but also unit-specific correlation among
disturbance terms (Huber, Nielson, Pribble, and Stephens 2006).
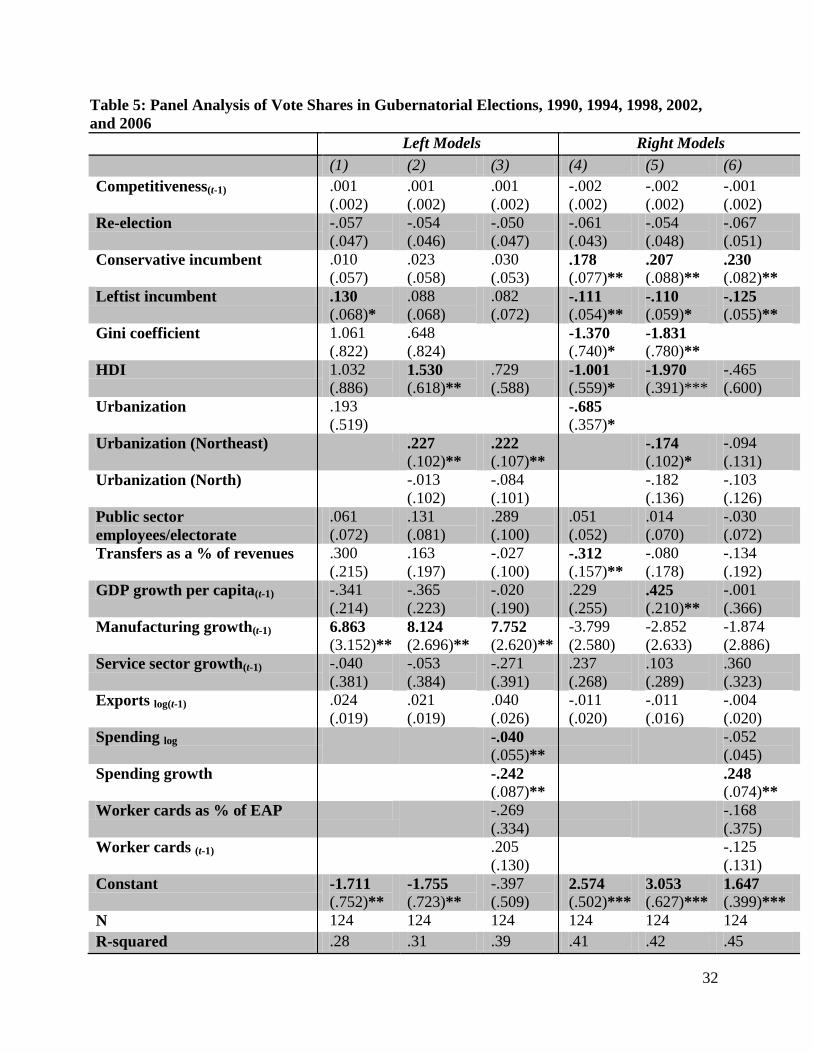
The results of the RE models are presented in Tables 5 and 6. The mobilization proxy is
consistent but, notably, only in the case of urbanization in the Northeast region. Using model 3 in
both tables, a one standard deviation shift in urbanization in the Northeast expands the left‟s
share of the gubernatorial vote an average of seven percentage points and increases the left‟s
average seat shares five percentage points. This predictor is less consistent in estimating
conservative vote and seat shares, as it achieves statistical significance in three of four models
and only at the .1 level. These results underscore the importance of the urban locational pattern
in predicting the left vote, but they suggest that conservatives‟ fortunes are mostly determined by
other factors.
[Tables 5 and 6 here]
The tables provide mixed evidence for economic and clientelism hypotheses. With the
exception of manufacturing growth in the case of the left‟s share of votes for governor, aggregate
as well as sectoral and export growth fail to achieve accepted levels of significance in most of
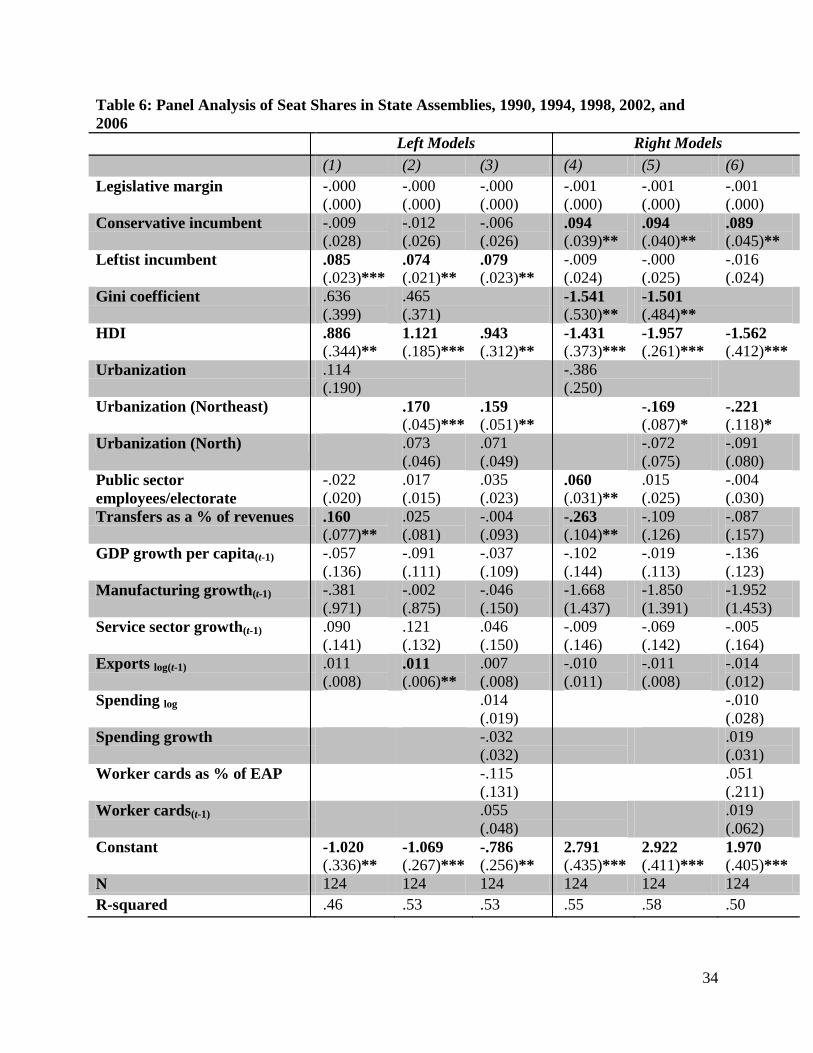
the models. Labor market formalization fails similarly. Regarding clientelism, growth in public
spending during electoral cycles performs as expected in strengthening conservatives and
undermining leftist opposition, but it does so for gubernatorial elections and not for state
legislatures. This is expected since voters in Brazil tend to connect the proceeds from
discretionary spending to the personalities of executives as opposed to state legislators or parties
(Samuels 2003a). The significance of spending also undercuts the idea that access to patronage
23
has been limited over time by legal restraints such as the LRF to the detriment of the right‟s
share of the vote. Additional evidence comes from the fact that incumbency effects are consistent
for the right in both tables, underscoring that conservatives depend more on access to patronage
than does the left. As for dependence on fiscal transfers, the parameter estimates are inconsistent
statistically and the signs run counter to the logic that such dependency should favor right-wing
political machines. Finally, social development as measured by the HDI and inequality as
measured by the Gini coefficient demonstrate that leftists depend on support in more socially
developed areas while conservatives rely on poorer bailiwicks. Inequality has little effect on left
support but the right tends to garner greater gubernatorial vote shares and state legislative seat
shares in more equal areas, an anomaly that may be explained by the faster erosion of support for
conservatives in the poor states compared to São Paulo.20
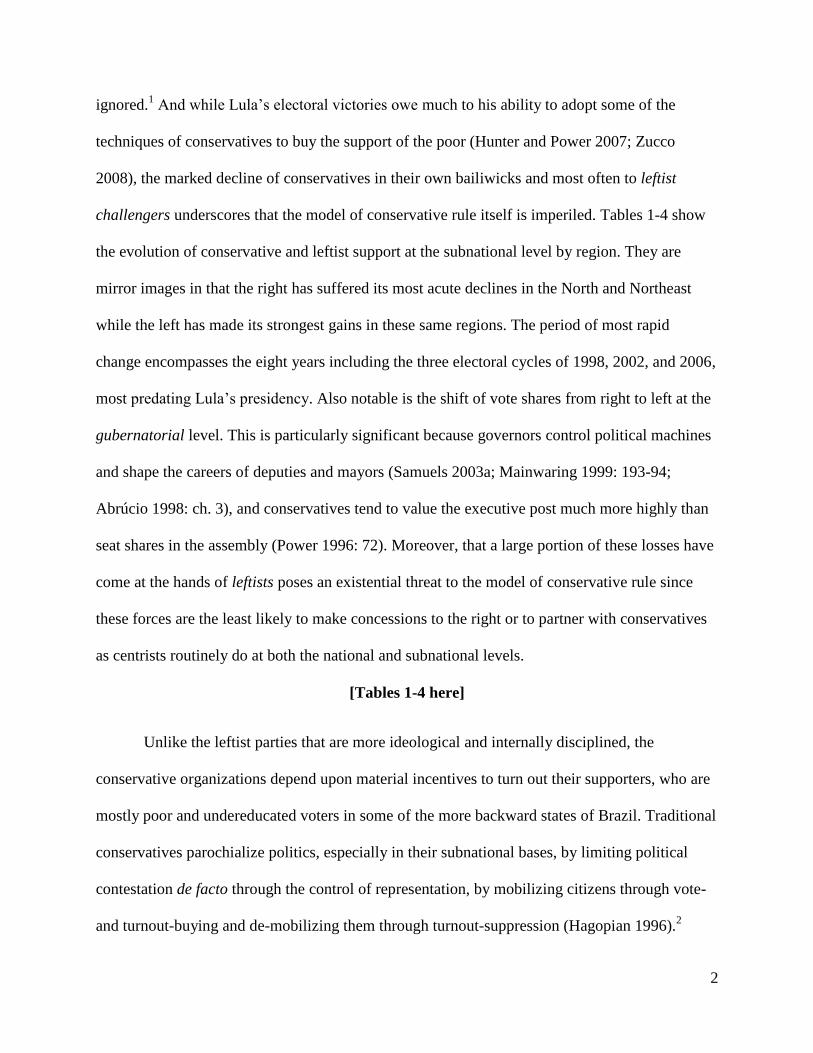
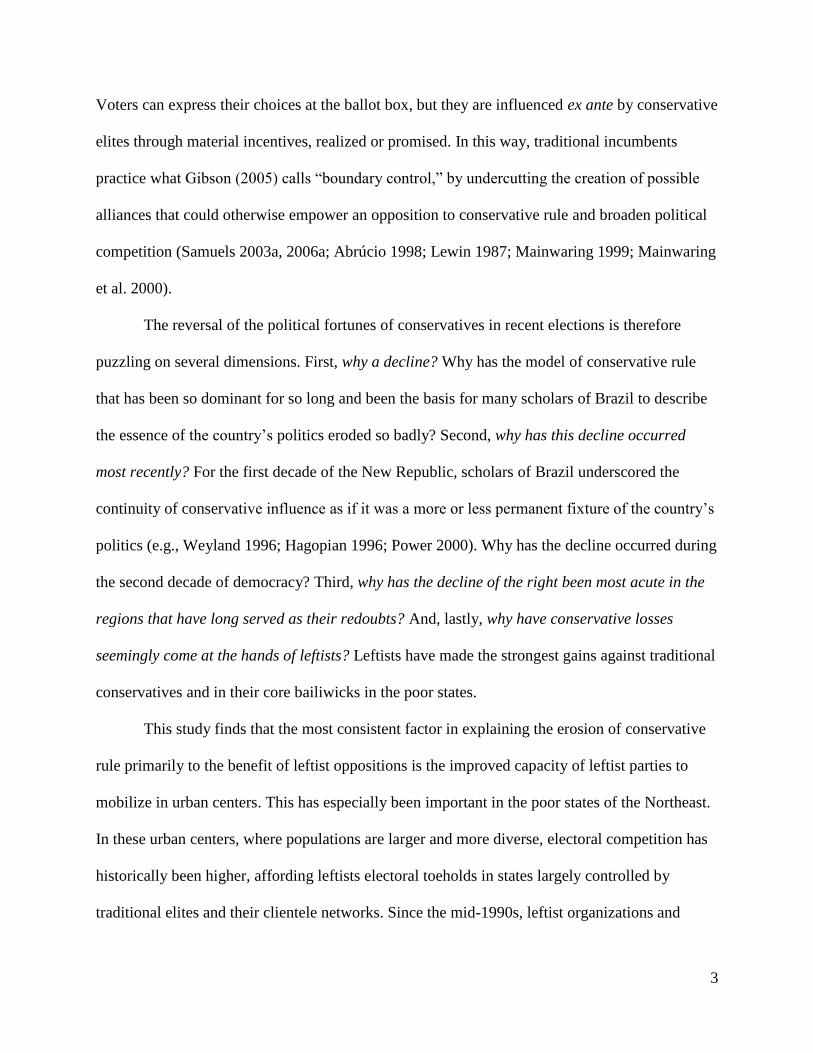
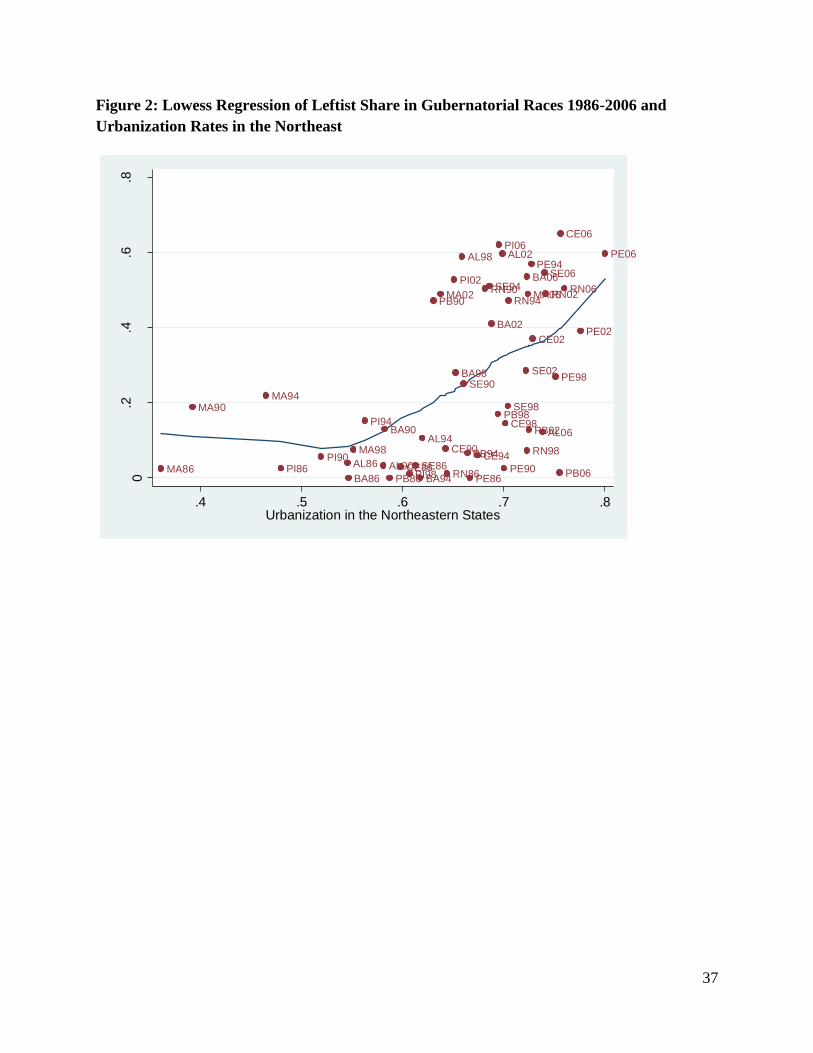
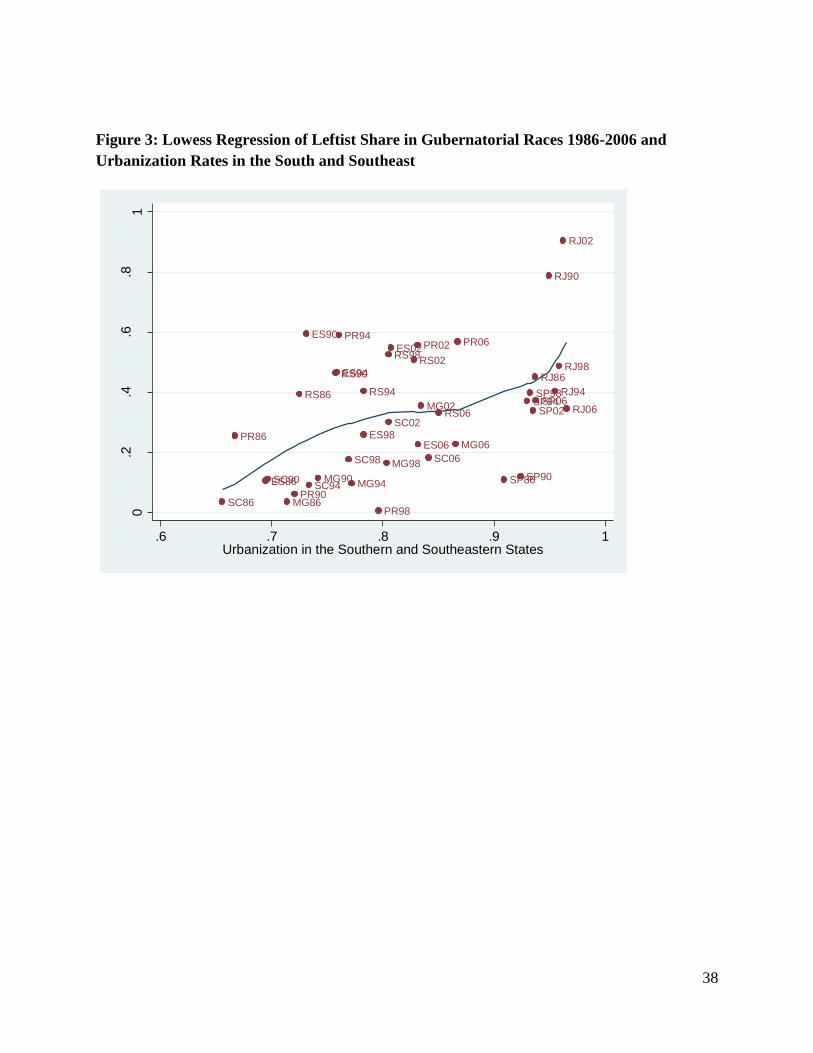
The findings support the spatial-mobilization logic as an explanation for the reversal of
fortune of conservatives and the ascendance of leftists in the Northeast. That the relationship
specified is regional and that it happens over time, particularly in more recent elections leading
up to 2006 can be illustrated using a smoothed lowess curve of the share of the vote for
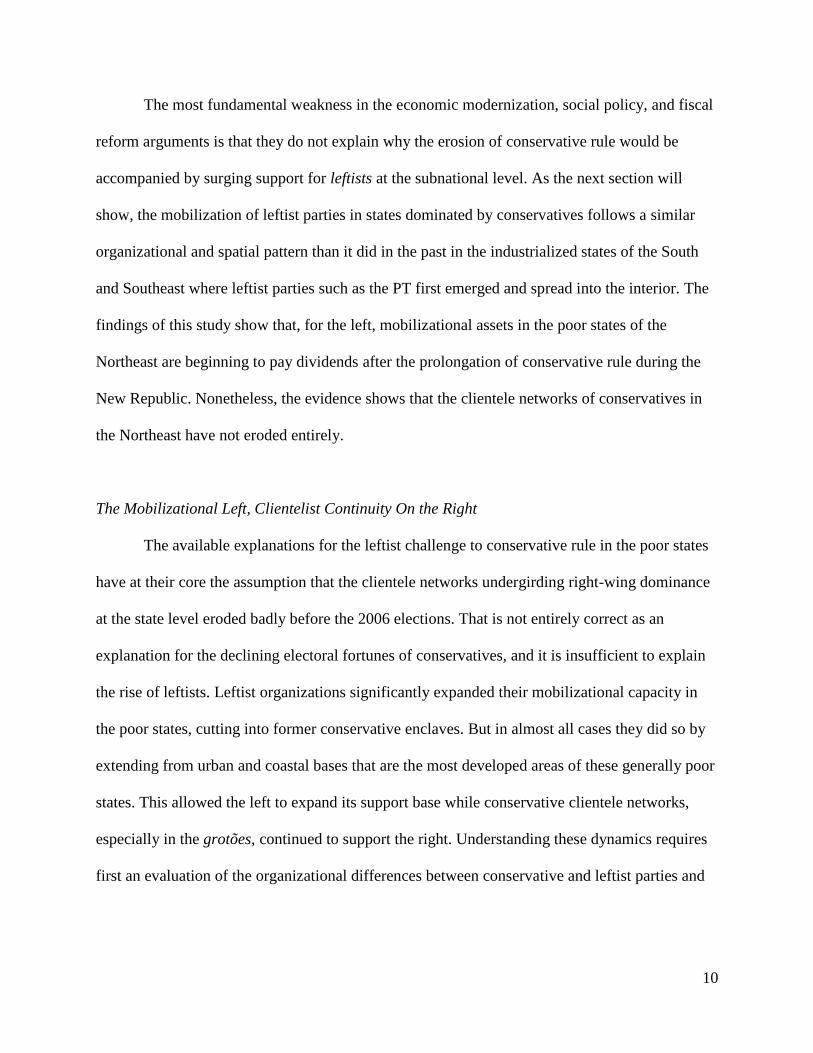
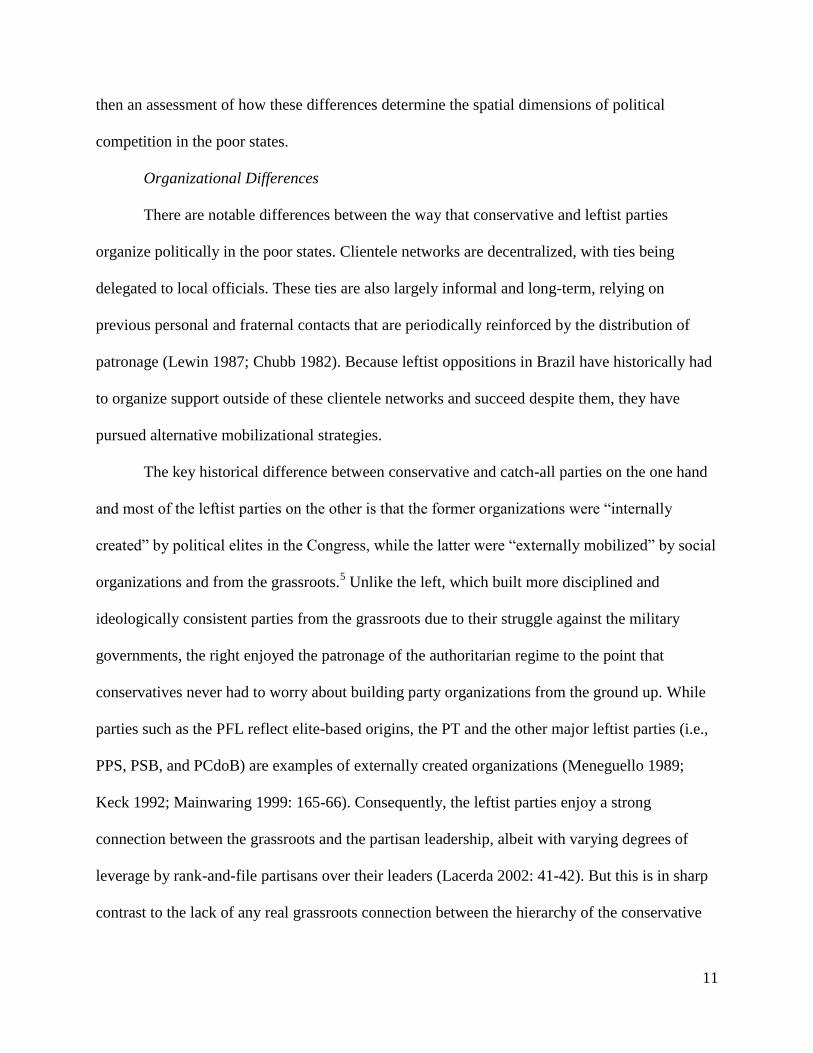
governor. Figures 2 and 3 show different patterns between urbanization and the left‟s share of
votes for governor over time and in geographic comparison.21
Higher levels of urbanization are
clearly associated with greater vote shares for leftist candidates in both graphs, but the
relationship in the northeastern states indicates a sharper upward slope and a clustering at the
high end in the later elections of 2002 and 2006. This is in contrast to the more mixed patterns in
the South and Southeast. The graphs are consistent with the expectation that leftist mobilization
in urban areas built support for the left over time in these states and in ways that resulted in
gubernatorial victories for leftist candidates in more recent elections.
24
[Figures 2 and 3 here]
Drawing on the results in the RE models and focusing on the gubernatorial level, one
might expect that variables omitted from the panel study such as BF coverage and Lula‟s
presidential coattails might be influential. This is especially relevant to the 2006 gubernatorial
elections, which saw several leftist gubernatorial victories in the redoubts of conservative rule.
By shifting the empirical focus to the municipal level, I retest mobilization and economic factors
as well as BF coverage and Lula‟s coattails. Once again, urbanization (overall and regionally-
specific terms) proxy for the spatial dynamics associated with the factors that should facilitate
left party mobilization.
In this part of the study, I analyze 2,815 municipalities in the North and Northeast as well
as São Paulo, a selection that allows for a focus on the most conservative regions of Brazil while
allowing enough variance to assess the overall influence of the predictors on the left‟s and right‟s
share of the vote at the gubernatorial level.22
The scope of BF coverage per municipality is
measured as a percentage of the local population that are designated beneficiaries based on
Ministry of Social Development data for household recipients and actual family size per
municipality as determined by the IBGE.23
Previous electoral support is controlled on the
premise that past voting should affect future choices. Socio-economic controls (GDP per capita,
HDI, and Gini) and Lula‟s share of the vote in 2006 are included in the models. Electoral and
socio-economic data come from the same sources used in the state-level models. The estimation
technique is ordinary least squares (OLS) with robust standard errors to correct for
heteroskedasticity in the disturbance terms.24
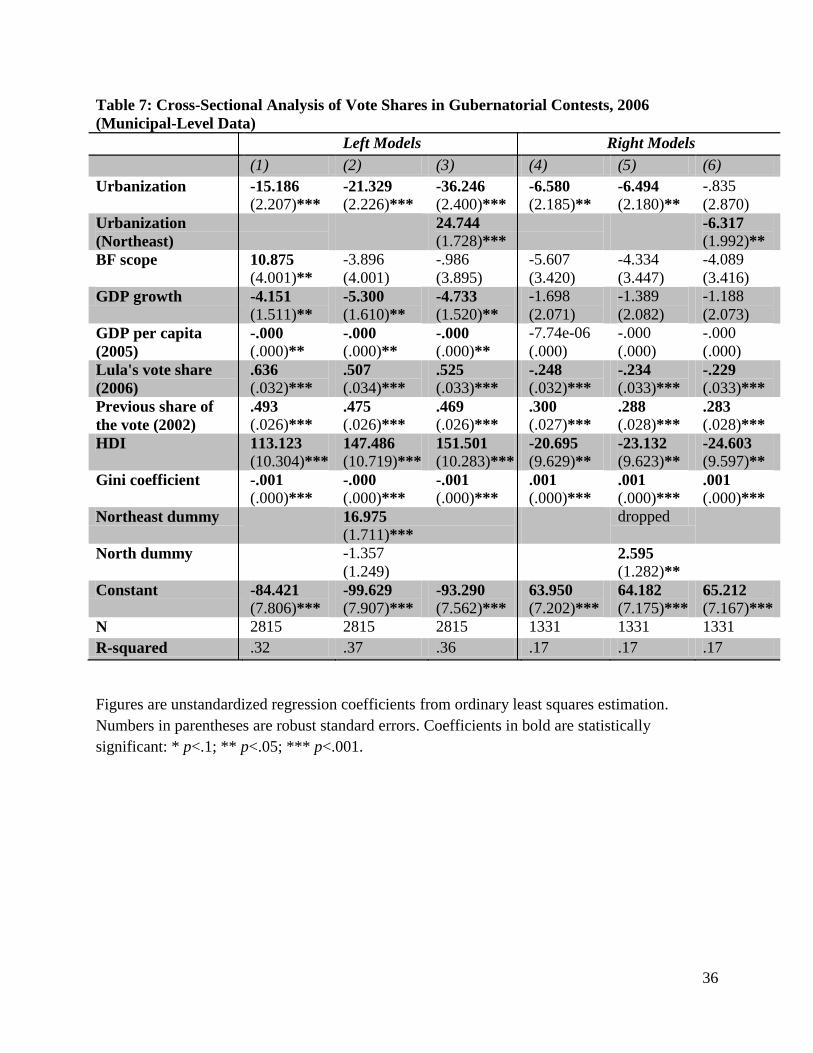
The results of the cross-sectional analysis as presented in Table 7 confirms that
urbanization in the Northeast is a consistent predictor of the left‟s and right‟s share of the
25
gubernatorial vote. Although urbanization overall makes for greater competitiveness, thereby
limiting leftist and conservative vote shares, it plays a different role in the Northeast. Notably,
BF coverage is statistically significant only in the base model. When region and the interaction
term of urbanization in the Northeast are included, BF becomes insignificant. Though support for
the left is higher in more socially developed areas as previous models showed, economic growth
and level of development are correlated negatively with leftist candidates‟ share of the
gubernatorial vote.25
That this remains true when the regional-urban interaction term is tested in
models 3 and 4 suggests that anti-incumbent (anti-conservative) voting in 2006 was particularly
acute in urban areas rather than in rich districts. These two dimensions are not the same as they
offer different mobilizational possibilities to leftist parties in the Northeast who focus their
efforts on organizing the vote of concentrated populations of poor people in urban settings rather
than the poor in more rural areas or generally the more well-to-do. This is also supported by the
fact that the previously anomalous result for inequality disappears in the municipal-level
analysis, showing that greater inequality undermines the left and boosts conservatives‟ vote
shares.
[Table 7 here]
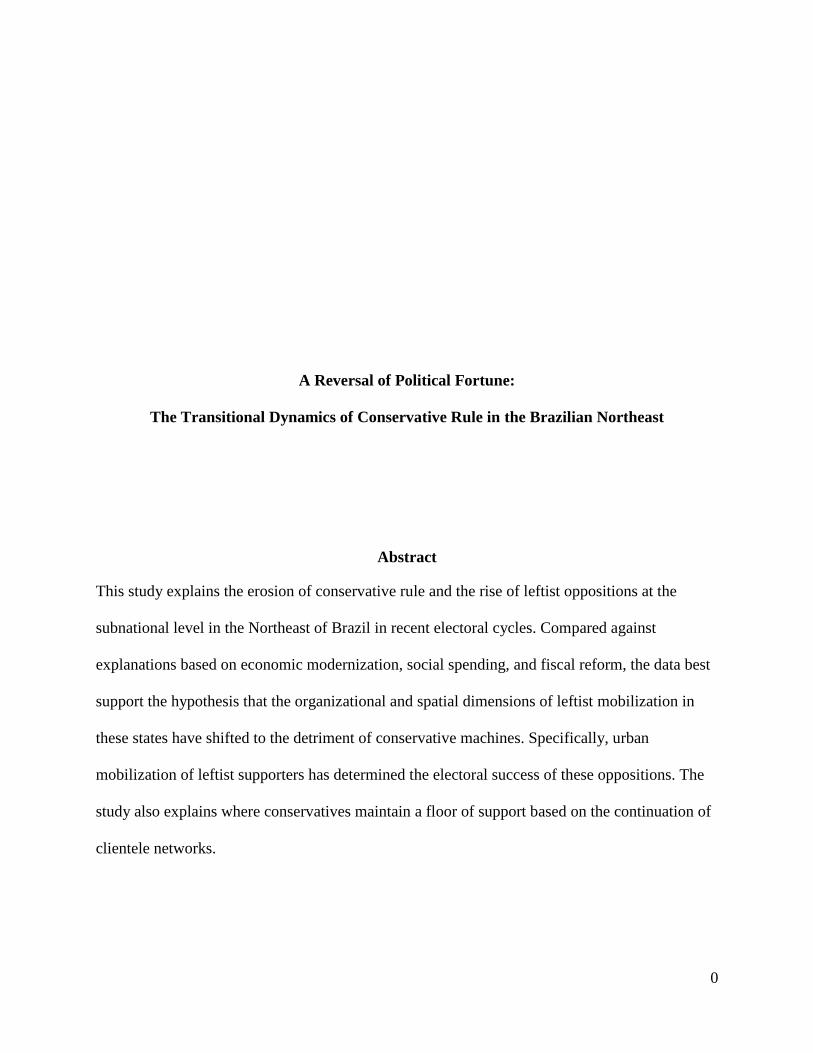
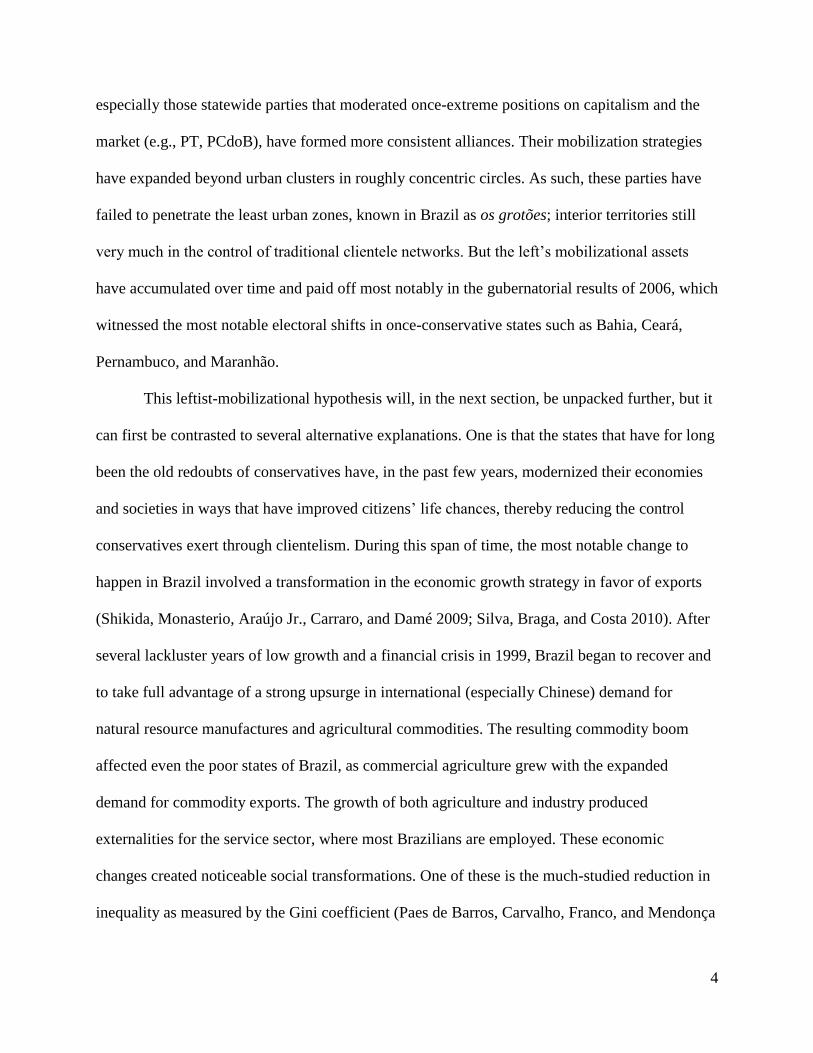
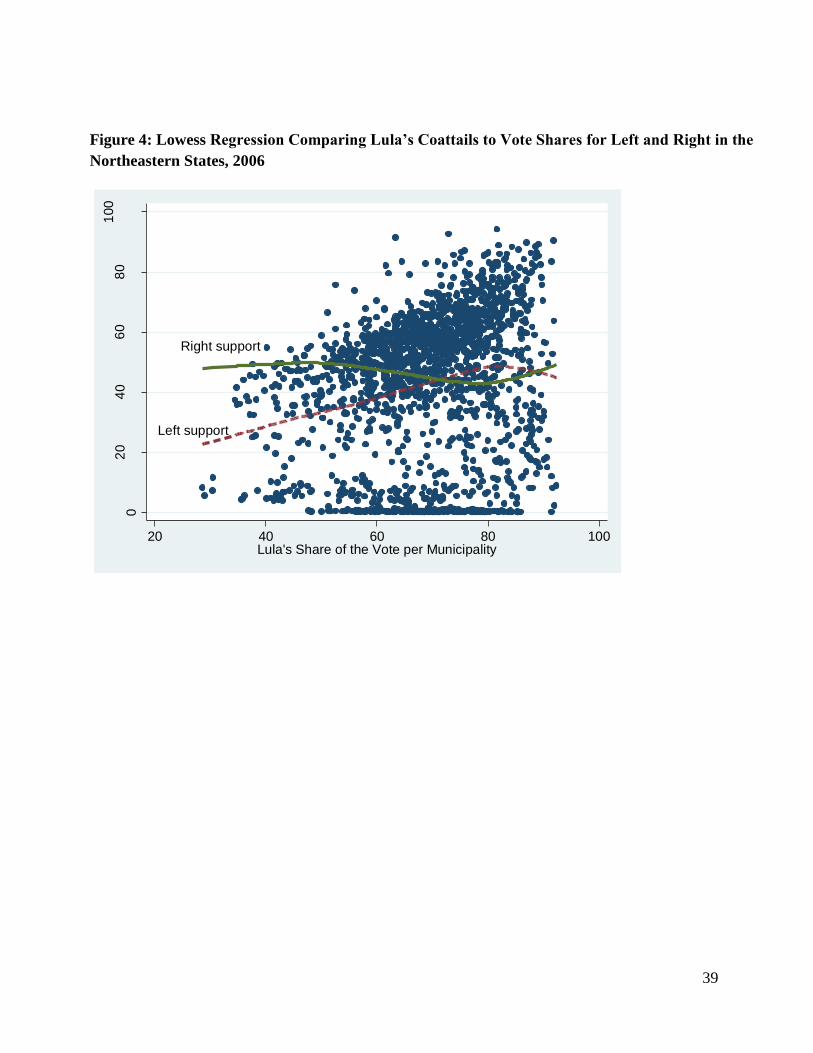
Lula‟s coattails may help to explain why so many down-ticket leftists did well in the
Northeast region.26
One reason may be that the incumbent president enjoyed some of the
advantages of governismo - the tendency for voters to plump for the incumbent (cf. Zucco
2010). But it is also possible that governismo worked to have some of these same voters support
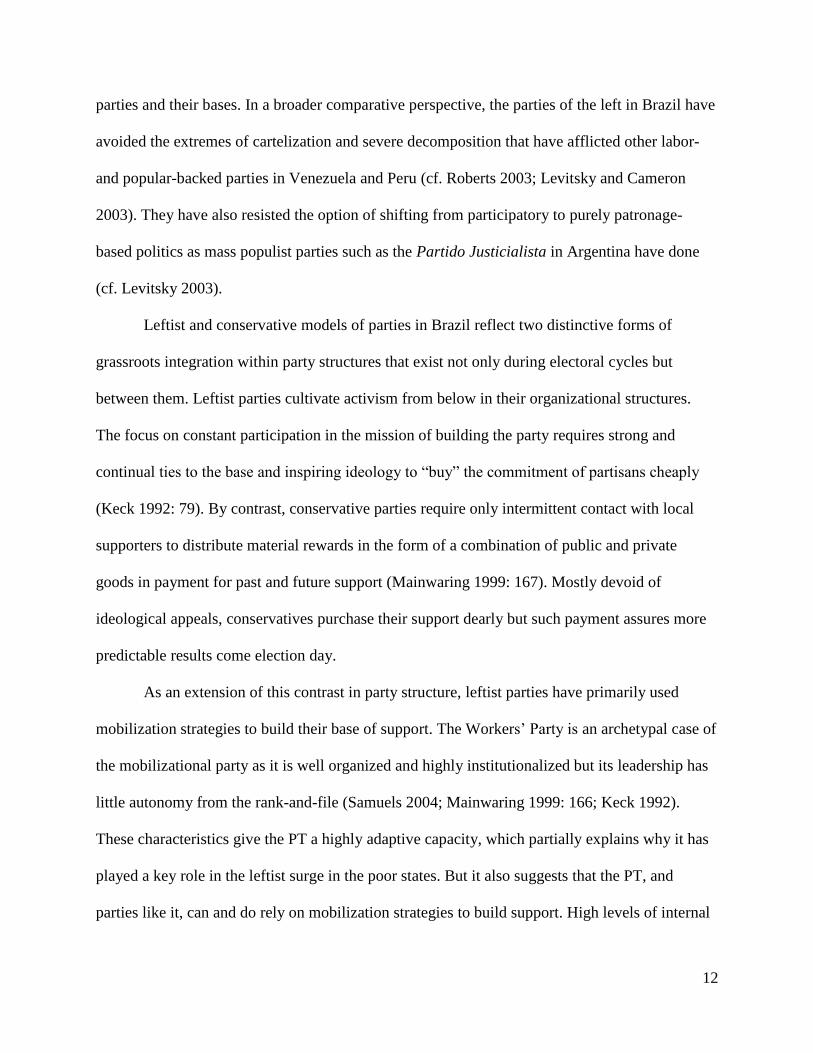
conservative incumbents in the Northeastern states. Figure 4 plots two lowess smoothed lines for
right and left vote shares for governor in the Northeastern states in 2006. Lula‟s coattails aid
down-ticket leftists to a point and then curve downwards while right-wing support curves
26
upwards. The figure shows that at the highest levels of support for Lula, voters were as willing to
vote for conservative incumbents as leftist challengers who were closer to the president on
policy. This suggests that Lula‟s coattails may well have had different effects in distinct
locations, a conjecture that must be left to further hypothesis-testing (cf. Zucco 2010).
[Figure 4 here]
Conclusions
The results of this study suggest that the reversal of political fortunes of conservatives
and their largely leftist oppositions in the Northeast region are the result of the improved
capacity of the latter to mobilize their voters in urban and contiguous areas over time. The right
continues to depend on access to and distribution of patronage before and during electoral cycles.
But as much as the continuity of clientele networks help conservatives, it is not enough to keep
leftists from gaining ground. These factors explain the results of gubernatorial vote and state
assembly seat shares over time and across cases, even when controlling for alternative
explanations such as economic modernization, federalization of social policy, presidential
coattails, and fiscal limitations on subnational spending.
To be sure, the study‟s findings are more useful for understanding political shifts in the
nine states of the Northeast and not the other four regions of Brazil. Given that the concern
motivating this investigation is the erosion of conservative rule and the upsurge of leftist
opposition, the empirical contribution is greatest for the region where these trends are most
prevalent. It should be recalled that Ames (2001: 106) found that the Northeast is unique in the
persistence of high levels of domination. And it should be underscored that the New Republic
has been shaped by the influence of conservatives such as ACM and Sarney (Power 2000), so the
findings are substantively significant in this regard. This study provides an explanation for the
27
dynamics of domination in the Northeast, specifically why conservative establishments eroded to
the benefit of leftist challengers. The results confirm Ames‟ overall finding that spatial
concentration follows demographic patterns of urbanization within the Northeast that deserve
further study.
Several facilitating conditions imbedded in a more “historical institutionalist”
understanding of Brazilian politics bear mentioning, if only to guide future research. Much
attention has focused on the moderation of the PT from a highly ideological party to a vote-
maximizing organization that embraced the market-oriented reform enacted during the 1990s
(Hunter 2007, 2008, 2010; Samuels 2004). This shift has a corollary in the other major Brazilian
leftist parties in that they have all seemingly abandoned their call for radical reorganization of
property rights (Mainwaring and Scully 1995: 466-67). Such change helps to explain the success
of these parties against conservatives in that ideological moderation has reduced the stakes of
leftist electoral victories in conservative redoubts. Second, the move of the PSDB to the right
after 1994 removed the major center-left rival party and opened political space for parties such as
the PT and the PSB to consolidate supporters in the center and expand their alliance possibilities
with other center-left parties.
These factors are most effective when used, as they most often are, to explain Lula‟s
success in the 2002-2010 period, but they do less well in explaining the variance of the PT‟s and
other leftist parties‟ performance at the state level. It must be remembered that even within the
Northeast where leftist parties have done well overall, there are cases of strong success such as
Bahia and cases of abysmal failure such as Alagoas. Moreover, the PT‟s own ideological shift
occurred well after the trends of conservative erosion in gubernatorial vote- and state assembly
seat shares began during the 1990s. Still, the moderation of leftist parties may well have
28
coincided in the Northeastern states with a shift of voters in urban areas to the center-left, a
confluence that may help to explain the success of these parties in recent elections. Assessing
this hypothesis will require much more extensive data analysis at the level of samples of the
voting population across urban and rural areas of selected states.
One interesting implication of the results found in this study is that they confirm more
broadly those of Zucco (2010) who finds a pro-incumbent effect in poor places rather than
among the poor in rich places in regards to Lula‟s vote in 2006. This finding is borne out in the
current study in the continuation of support in the grotões for conservatives in the Northeast, but
the results also suggest that the leftist opposition mobilizes support not in rich places but in
urban places in these states. The data analyzed here indicate that there is more variation to be
explained than the available institutional and demographic factors analyzed thus far have
predicted. Future research should explore how strategic and spatial variables interact to shape
electoral outcomes at the subnational level.
29
Table 1: Regional Averages for Conservative Parties, Share of the Vote in Gubernatorial Contests,
1982-2006
Sources: Tribunal Superior Eleitoral (TSE) and Jairo Nicolau, “Dados Eleitorais do Brasil, 1982-2006.”
Note: Conservative parties are the 18 parties listed as right-wing by Mainwaring et al. (2000: Table 6.3).
See text for discussion of largest conservative parties.
Table 2: Regional Averages for Conservative Parties, Share of Seats in State Assemblies, 1982-2006
1982 1986 1990 1994 1998 2002 2006 1982-
1990
1990-
1998
1998-
2006
Net
Loss
CO 46% 40% 51% 51% 36% 30% 30% 5% -15% -6% -15%
N 70% 45% 65% 63% 56% 41% 33% -5% -10% -23% -38%
NE 67% 55% 61% 53% 45% 44% 36% -5% -17% -9% -31%
N+NE 69% 50% 63% 58% 50% 42% 34% -5% -13% -16% -34%
SE 42% 36% 43% 40% 40% 34% 30% 1% -3% -10% -12%
S 45% 32% 45% 50% 50% 39% 29% 0% 5% -21% -16%
SE+S 43% 34% 44% 45% 45% 37% 30% 0% 1% -15% -14%
Brazil 54% 43% 56% 53% 46% 39% 32% 3% -10% -14% -21%
Sources: Tribunal Superior Eleitoral (TSE) and Jairo Nicolau, “Dados Eleitorais do Brasil, 1982-2006.”
1982 1986 1990 1994 1998 2002 2006 1982-
1990
1990-
1998
1998-
2006
Net
Loss
CO 44% 33% 56% 39% 17% 2% 26% 13% -39% 9% -18%
N 47% 7% 52% 47% 42% 28% 6% 5% -10% -37% -41%
NE 63% 39% 56% 33% 37% 27% 23% -7% -19% -14% -40%
N+NE 55% 23% 54% 40% 40% 28% 15% -1% -14% -25% -40%
SE 41% 33% 26% 28% 18% 19% 0% -15% -8% -17% -41%
S 43% 20% 42% 36% 38% 16% 13% -1% -4% -25% -30%
SE+S 42% 26% 34% 32% 28% 18% 7% -8% -6% -21% -35%
Brazil 51% 29% 49% 37% 33% 21% 15% -2% -16% -18% -37%
30
Table 3: Regional Averages for Leftist Parties, Share of the Vote in Gubernatorial Contests, 1982-2006
1982 1986 1990 1994 1998 2002 2006 1982-
1990
1990-
1998
1998-
2006
Net
Gain
CO 1% 5% 24% 32% 22% 48% 37% 23% -3% 16% 36%
N 3% 31% 15% 23% 24% 46% 47% 13% 8% 23% 44%
NE 1% 2% 19% 24% 20% 41% 45% 19% 1% 25% 45%
N+NE 2% 16% 17% 23% 22% 44% 46% 16% 4% 24% 44%
SE 13% 15% 40% 33% 33% 54% 29% 27% -8% -3% 16%
S 9% 23% 21% 36% 24% 46% 36% 13% 2% 12% 28%
SE+S 11% 19% 31% 35% 28% 50% 33% 20% -3% 4% 22%
Brazil 4% 12% 22% 28% 24% 46% 41% 18% 1% 18% 37%
Sources: Tribunal Superior Eleitoral (TSE) and Jairo Nicolau, “Dados Eleitorais do Brasil, 1982-2006.”
Note: Leftists parties are the PT, PDT, PCB, PPS, PCdoB, PSB, PSTU, PV, PSOL, and PCO.
Table 4: Regional Averages for Leftist Parties, Share of Seats in State Assemblies, 1982-2006
Sources: Tribunal Superior Eleitoral (TSE) and Jairo Nicolau, “Dados Eleitorais do Brasil, 1982-2006.”
1982 1986 1990 1994 1998 2002 2006 1982-
1990
1990-
1998
1998-
2006
Net
Gain
CO 0% 3% 23% 25% 21% 27% 37% 23% -2% 15% 37%
N 1% 11% 11% 11% 20% 28% 32% 10% 8% 12% 31%
NE 0% 6% 13% 18% 19% 26% 37% 13% 6% 18% 37%
N+NE 1% 9% 12% 14% 19% 27% 34% 12% 7% 15% 34%
SE 12% 20% 26% 28% 28% 39% 28% 14% 2% 0% 16%
S 7% 13% 18% 22% 24% 36% 34% 11% 5% 11% 27%
SE+S 10% 17% 22% 25% 26% 38% 31% 12% 4% 5% 21%
Brazil 3% 10% 17% 19% 21% 30% 34% 13% 5% 12% 30%
31
Figure 1: Political Dominance and Urban Clustering of Leftist Gubernatorial Candidates
in the North, Northeast and São Paulo in 2006
32
Table 5: Panel Analysis of Vote Shares in Gubernatorial Elections, 1990, 1994, 1998, 2002,
and 2006
Left Models Right Models
(1) (2) (3) (4) (5) (6)
Competitiveness(t-1) .001
(.002)
.001
(.002)
.001
(.002)
-.002
(.002)
-.002
(.002)
-.001
(.002)
Re-election -.057
(.047)
-.054
(.046)
-.050
(.047)
-.061
(.043)
-.054
(.048)
-.067
(.051)
Conservative incumbent .010
(.057)
.023
(.058)
.030
(.053) .178 (.077)**
.207 (.088)**
.230
(.082)**
Leftist incumbent .130 (.068)*
.088
(.068)
.082
(.072) -.111 (.054)**
-.110 (.059)*
-.125
(.055)**
Gini coefficient 1.061
(.822)
.648
(.824) -1.370 (.740)*
-1.831
(.780)**
HDI 1.032
(.886) 1.530 (.618)**
.729
(.588) -1.001 (.559)*
-1.970 (.391)***
-.465
(.600)
Urbanization .193
(.519)
-.685
(.357)*
Urbanization (Northeast) .227
(.102)**
.222
(.107)**
-.174 (.102)*
-.094
(.131)
Urbanization (North) -.013
(.102)
-.084
(.101)
-.182
(.136)
-.103
(.126)
Public sector
employees/electorate
.061
(.072)
.131
(.081)
.289
(.100)
.051
(.052)
.014
(.070)
-.030
(.072)
Transfers as a % of revenues .300
(.215)
.163
(.197)
-.027
(.100) -.312 (.157)**
-.080
(.178)
-.134
(.192)
GDP growth per capita(t-1) -.341
(.214)
-.365
(.223)
-.020
(.190)
.229
(.255) .425 (.210)**
-.001
(.366)
Manufacturing growth(t-1) 6.863 (3.152)**
8.124 (2.696)**
7.752 (2.620)**
-3.799
(2.580)
-2.852
(2.633)
-1.874
(2.886)
Service sector growth(t-1) -.040
(.381)
-.053
(.384)
-.271
(.391)
.237
(.268)
.103
(.289)
.360
(.323)
Exports log(t-1) .024
(.019)
.021
(.019)
.040
(.026)
-.011
(.020)
-.011
(.016)
-.004
(.020)
Spending log -.040
(.055)**
-.052
(.045)
Spending growth -.242
(.087)**
.248
(.074)**
Worker cards as % of EAP -.269
(.334)
-.168
(.375)
Worker cards (t-1) .205
(.130)
-.125
(.131)
Constant -1.711 (.752)**
-1.755 (.723)**
-.397
(.509) 2.574 (.502)***
3.053 (.627)***
1.647 (.399)***
N 124 124 124 124 124 124
R-squared .28 .31 .39 .41 .42 .45
33
Figures are unstandardized regression coefficients from random effects estimation. Numbers in
parentheses are robust standard errors. Coefficients in bold are statistically significant: * p<.1;
** p<.05; *** p<.001.
34
Table 6: Panel Analysis of Seat Shares in State Assemblies, 1990, 1994, 1998, 2002, and
2006
Left Models Right Models
(1) (2) (3) (4) (5) (6)
Legislative margin -.000
(.000)
-.000
(.000)
-.000
(.000)
-.001
(.000)
-.001
(.000)
-.001
(.000)
Conservative incumbent -.009
(.028)
-.012
(.026)
-.006
(.026) .094 (.039)**
.094
(.040)**
.089
(.045)**
Leftist incumbent .085 (.023)***
.074 (.021)**
.079 (.023)**
-.009
(.024)
-.000
(.025)
-.016
(.024)
Gini coefficient .636
(.399)
.465
(.371) -1.541 (.530)**
-1.501
(.484)**
HDI .886 (.344)**
1.121 (.185)***
.943
(.312)**
-1.431 (.373)***
-1.957 (.261)***
-1.562
(.412)***
Urbanization .114
(.190)
-.386
(.250)
Urbanization (Northeast) .170 (.045)***
.159
(.051)**
-.169
(.087)*
-.221
(.118)*
Urbanization (North) .073
(.046)
.071
(.049)
-.072
(.075)
-.091
(.080)
Public sector
employees/electorate
-.022
(.020)
.017
(.015)
.035
(.023) .060
(.031)**
.015
(.025)
-.004
(.030)
Transfers as a % of revenues .160 (.077)**
.025
(.081)
-.004
(.093) -.263 (.104)**
-.109
(.126)
-.087
(.157)
GDP growth per capita(t-1) -.057
(.136)
-.091
(.111)
-.037
(.109)
-.102
(.144)
-.019
(.113)
-.136
(.123)
Manufacturing growth(t-1) -.381
(.971)
-.002
(.875)
-.046
(.150)
-1.668
(1.437)
-1.850
(1.391)
-1.952
(1.453)
Service sector growth(t-1) .090
(.141)
.121
(.132)
.046
(.150)
-.009
(.146)
-.069
(.142)
-.005
(.164)
Exports log(t-1) .011
(.008) .011 (.006)**
.007
(.008)
-.010
(.011)
-.011
(.008)
-.014
(.012)
Spending log .014
(.019)
-.010
(.028)
Spending growth -.032
(.032)
.019
(.031)
Worker cards as % of EAP -.115
(.131)
.051
(.211)
Worker cards(t-1) .055
(.048)
.019
(.062)
Constant -1.020
(.336)**
-1.069
(.267)***
-.786 (.256)**
2.791
(.435)***
2.922 (.411)***
1.970 (.405)***
N 124 124 124 124 124 124
R-squared .46 .53 .53 .55 .58 .50

35
Figures are unstandardized regression coefficients from random effects estimation. Numbers in
parentheses are robust standard errors. Coefficients in bold are statistically significant: * p<.1;
** p<.05; *** p<.001.
36
Table 7: Cross-Sectional Analysis of Vote Shares in Gubernatorial Contests, 2006
(Municipal-Level Data)
Left Models Right Models
(1) (2) (3) (4) (5) (6)
Urbanization -15.186 (2.207)***
-21.329 (2.226)***
-36.246 (2.400)***
-6.580 (2.185)**
-6.494 (2.180)**
-.835
(2.870)
Urbanization
(Northeast)
24.744
(1.728)***
-6.317 (1.992)**
BF scope 10.875 (4.001)**
-3.896
(4.001)
-.986
(3.895)
-5.607
(3.420)
-4.334
(3.447)
-4.089
(3.416)
GDP growth -4.151 (1.511)**
-5.300 (1.610)**
-4.733 (1.520)**
-1.698
(2.071)
-1.389
(2.082)
-1.188
(2.073)
GDP per capita
(2005)
-.000 (.000)**
-.000 (.000)**
-.000 (.000)**
-7.74e-06
(.000)
-.000
(.000)
-.000
(.000)
Lula's vote share
(2006)
.636
(.032)***
.507
(.034)***
.525
(.033)***
-.248 (.032)***
-.234 (.033)***
-.229 (.033)***
Previous share of
the vote (2002)
.493
(.026)***
.475
(.026)***
.469
(.026)***
.300
(.027)***
.288 (.028)***
.283 (.028)***
HDI 113.123 (10.304)***
147.486 (10.719)***
151.501 (10.283)***
-20.695 (9.629)**
-23.132 (9.623)**
-24.603 (9.597)**
Gini coefficient -.001
(.000)***
-.000
(.000)***
-.001
(.000)***
.001
(.000)***
.001 (.000)***
.001 (.000)***
Northeast dummy 16.975
(1.711)***
dropped
North dummy -1.357
(1.249)
2.595
(1.282)**
Constant -84.421 (7.806)***
-99.629 (7.907)***
-93.290 (7.562)***
63.950 (7.202)***
64.182 (7.175)***
65.212 (7.167)***
N 2815 2815 2815 1331 1331 1331
R-squared .32 .37 .36 .17 .17 .17
Figures are unstandardized regression coefficients from ordinary least squares estimation.
Numbers in parentheses are robust standard errors. Coefficients in bold are statistically
significant: * p<.1; ** p<.05; *** p<.001.
37
Figure 2: Lowess Regression of Leftist Share in Gubernatorial Races 1986-2006 and
Urbanization Rates in the Northeast
AL86 AL90
AL94
AL98 AL02
AL06
BA86
BA90
BA94
BA98
BA02
BA06
CE86
CE90CE94
CE98
CE02
CE06
MA86
MA90MA94
MA98
MA02 MA06
PB86
PB90
PB94
PB98
PB02
PB06PE86
PE90
PE94
PE98
PE02
PE06
PI86PI90
PI94
PI98
PI02
PI06
RN86
RN90RN94
RN98
RN02RN06
SE86
SE90
SE94
SE98
SE02
SE06
0.2
.4.6
.8
Leftis
t P
art
ies' S
hare
of G
ube
rna
toria
l V
ote
.4 .5 .6 .7 .8Urbanization in the Northeastern States
38
Figure 3: Lowess Regression of Leftist Share in Gubernatorial Races 1986-2006 and
Urbanization Rates in the South and Southeast
ES86
ES90
ES94
ES98
ES02
ES06
MG86
MG90MG94
MG98
MG02
MG06PR86
PR90
PR94
PR98
PR02 PR06
RJ86
RJ90
RJ94
RJ98
RJ02
RJ06
RS86
RS90
RS94
RS98RS02
RS06
SC86
SC90SC94
SC98
SC02
SC06
SP86SP90
SP94SP98
SP02SP06
0.2
.4.6
.81
Leftis
t P
art
ies' S
hare
of th
e G
ube
rna
toria
l V
ote
.6 .7 .8 .9 1Urbanization in the Southern and Southeastern States
39
Figure 4: Lowess Regression Comparing Lula’s Coattails to Vote Shares for Left and Right in the
Northeastern States, 2006
Right support
Left support
02
04
06
08
01
00
Su
pp
ort
for
Le
ft o
r C
on
serv
ative C
and
idate
s
20 40 60 80 100Lula's Share of the Vote per Municipality
40
Works Cited
Abrúcio, Fernando. 1998. Os Barões da Federação: Os Governadores e a Redemocratização
Brasileira. São Paulo: USP/Hucitec.
Ames, Barry. 2001. The Deadlock of Democracy in Brazil. Ann Arbor: University of Michigan
Press.
Auyero, Javier. 2000. “The Logic of Clientelism in Argentina: An Ethnographic Account.” Latin
American Research Review 35:3: 55-81.
Avelino, George, David S. Brown, and Wendy Hunter. 2005. “The Effects of Capital Mobility,
Trade Openness, and Democracy on Social Spending in Latin America, 1980-1999.”
American Journal of Political Science 49:3 (July): 625-41.
Banco Central do Brasil. Various years. Boletim Regional do Banco Central do Brasil.
Borges, André. 2007. “Rethinking State Politics: The Withering of State Dominant Machines in
Brazil.” Brazilian Political Science Review 1:2: 108-36.
Cardoso, Adalberto Moreira. 2001. “A Filiação Sindical no Brasil.” Dados 44:1.
Chubb, Judith. 1982. Patronage, Power, and Poverty in Southern Italy. New York: Cambridge
University Press.
Damiani, Octavio. 2003. “Effects on Employment, Wages, and Labor Standards of Non-
Traditional Export Crops in Northeast Brazil.” Latin American Research Review 38:1
(February): 83-112.
Dantas Neto, Paulo Fábio. 2006. “O Carlismo para além de ACM: Estratégias Adaptativas de
uma Elite Política Estadual.” In Governo, Políticas Públicas e Elites Políticas nos
Estados Brasileiros, Celina Souza and Paulo Fábio Dantas Neto, eds. Rio de Janeiro:
Editora Revan.
41
Diniz, Eli. 1982. Voto e Máquina Política: Patronagem e Clientelismo no Rio de Janeiro. Rio de
Janeiro: Paz e Terra.
Djissey Shikida, Cláudio, Leonardo Monteiro Monasterio, Ari Francisco de Araújo Junior,
André Carraro, and Otávio Menezes Damé. 2009. “It is the Economy, Companheiro!”
An Empirical Analysis of Lula‟s Re-election Based on Municipal Data.” Economics
Bulletin 29:2 976-91.
Eaton, Kent and J. Tyler Dickovick. 2004. “The Politics of Re-centralization in Argentina and
Brazil.” Latin American Research Review 39:1: 90-122.
Fenwick, Tracy Beck. 2009. “Avoiding Governors: The Success of Bolsa Família.” Latin
American Research Review 44:1: 102-31.
Figueiredo, Miguel de and F. Daniel Hidalgo. 2009. “Does Targeted Redistribution Create
Partisans? Evidence from Brazil.” Paper presented at the 2009 Annual Meeting of the
Midwest Political Science Association, April 2-4.
Gay, Robert. 1990. “Community Organization and Clientelist Politics in Contemporary Brazil: A
Case Study from Suburban Rio de Janeiro.” International Journal of Urban and Regional
Research 14:4: 648-65.
Gervasoni, Carlos. 2010. “A Rentier Theory of Subnational Regimes: Fiscal Federalism,
Democracy, and Authoritarianism in the Argentine Provinces.” World Politics 62:2
(April): 302-340.
Gibson, Edward. 2005. “Boundary Control: Subnational Authoritarianism in Democratic
Countries.” World Politics 58 (October): 101-32.
Hagopian, Frances. 1996. Traditional Politics and Regime Change in Brazil. New York:
Cambridge University Press.

42
Huber, Evelyn, François Nielsen, Jennifer Pribble, and John D. Stephens. 2006. “Politics and
Inequality in Latin America and the Caribbean.” American Sociological Review 71
(December): 943-963.
Hunter, Wendy. 2010. The Transformation of the Workers’ Party in Brazil, 1989-2009. New
York: Cambridge University Press.
______. 2008. “The Partido dos Trabalhadores: Still a Party of the Left?” In Democratic Brazil
Revisited, Peter R. Kingstone and Timothy J. Power, eds. Pittsburgh: University of
Pittsburgh Press.
______. 2007. “The Normalization of an Anomaly: The Workers‟ Party in Brazil.” World
Politics 59 (April): 440-75.
Hunter, Wendy and Timothy J. Power. 2007. “Rewarding Lula: Executive Power, Social Policy,
and the Brazilian Elections of 2006.” Latin American Politics and Society 49:1 (Spring):
1-30.
Jatobá, Jorge. 1986. “The Labour Market in a Recession-Hit Region: The Northeast of Brazil.”
International Labour Review 125:2 (March-April): 227-41.
Keck, Margaret E. 1992. The Workers’ Party and Democratization in Brazil. New Haven: Yale
University Press.
Lacerda, Alan Daniel Freire de. 2002. “O PT e a Unidade Partidária como Problema.” Dados
45:1: 39-76.
Leoni, Eduardo and Lucio Rennó. 2006. “Reelection and Fiscal Responsibility Law: Reducing
Populist Pressures in Brazil.” Paper presented at the Annual Meeting of the American
Political Science Association, Philadelphia PA.
43
Levitsky, Steve and Maxwell A. Cameron. 2003. “Democracy Without Parties? Political Parties
and Regime Change in Fujimori‟s Peru.” Latin American Politics and Society 45:3 (Fall):
1-33.
Levitsky, Steve. 2003. Transforming Labor-Based Parties in Latin America: Argentine Peronism
in Comparative Perspective. New York: Cambridge University Press.
Lewin, Linda. 1987. Politics and Parentela in Paraíba: A Case Study of Family-Based
Oligarchy in Brazil. Princeton, NJ: Princeton University Press.
Lima, Márcia and Alexandre Abdal. 2007. “Educação e Trabalho: A Inserção dos Ocupados de
Nível superior no Mercado Formal.” Sociologias 9:17 (January/June): 216-38.
Magaloni, Beatriz, Alberto Diaz-Cayeros, and Federico Estévez. 2007. “Clientelism and
Portfolio Diversification: A Model of Electoral Investment with Applications to Mexico.”
In Patrons, Clients, and Policies: Patterns of Democratic Accountability and Political
Competition, Herbert Kitschelt and Steve I. Wilkinson, eds. New York: Cambridge
University Press.
Mainwaring, Scott P. 1999. Rethinking Party Systems in the Third Wave of Democratization: The
Case of Brazil. Stanford: Stanford University Press.
Mainwaring, Scott P. and Timothy R. Scully. 1995. “Parties and Democracy in Latin America –
Different Patterns, Common Challenges.” In Building Democratic Institutions: Party
Systems in Latin America, Scott Mainwaring and Timothy R. Scully, eds. Stanford:
Stanford University Press.
Mainwaring, Scott, Rachel Meneguello, and Timothy J. Power. 2000. “Conservative Parties,
Democracy, and Economic Reform in Contemporary Brazil.” In Conservative Parties,
44
the Right, and Democracy in Latin America, Kevin J. Middlebrook, ed. Baltimore: The
Johns Hopkins University Press.
Medina, Luis Fernando and Susan C. Stokes. 2007. “Monopoly and Monitoring: An Approach to
Political Clientelism.” In Patrons, Clients, and Policies: Patterns of Democratic
Accountability and Political Competition, Herbert Kitschelt and Steve I. Wilkinson, eds.
New York: Cambridge University Press.
Meneguello, Rachel. 1989. PT: A Formação de um Partido. São Paulo: Paz e Terra.
Mitchell, Andy. 2005. The ESRI Guide to GIS Analysis, Volume 2: Spatial Measurements and
Statistics. Redland: ESRI Press.
Montero, Alfred P. 2010a. “Trading Spaces: The Endogenous Dynamics of Subnational
Authoritarianism in Brazil.” Paper delivered at the 2010 Congress of the Latin American
Studies Association, Toronto, Canada October 6-9.
______. 2010b. “No Country for Leftists? Clientelist Continuity and the 2006 Vote in the
Brazilian Northeast.” Journal of Politics in Latin America 2:2: 113-153.
______. 2004. “Competitive Federalism and Distributive Conflict.” In Reforming Brazil,
Mauricio A. Font and Anthony Peter Spanakos, eds. Lanham: Lexington Books.
Nichter, Simeon. 2008. “Vote Buying or Turnout Buying? Machine Politics and the Secret
Ballot.” American Political Science Review 102:1 (February): 19-31.
Nylen, William. 1997. “Reconstructing the Workers‟ Party (PT): Lessons from North-Eastern
Brazil.” In The New Politics of Inequality in Latin America: Rethinking Participation and
Representation, Douglas Chalmers, Carlos Vilas, Katherine Hite, Scott Martin, Kerianne
Piester, and Monique Segarra, eds. New York: Oxford University Press.
45
Paes de Barros, Ricardo, Mirela de Carvalho, Samuel Franco, Rosane Mendonça. 2007. “A
Queda Recente da Desigualdade de Renda no Brasil.” Texto para Discussão No. 1258.
Rio de Janeiro: IPEA.
Pereira, Anthony W. 1997. The End of the Peasantry: The Rural Labor Movement in Northeast
Brazil, 1961-1988. Pittsburgh: University of Pittsburgh Press.
Portes, Alejandro and Kelly Hoffman. 2003. “Latin American Class Structures: Their
Composition and Change During the Neoliberal Era.” Latin American Research Review
38:1 (February): 41-82.
Power, Timothy J. 2001. “Blairism Brazilian Style? Fernando Henrique Cardoso and the „Third
Way‟ in Brazil.” Political Research Quarterly 116:4: 611-36.
______. 2000. The Political Right in Postauthoritarian Brazil. University Park, PA:
Pennsylvania State University Press.
______. 1996. “Elites and Institutions in Conservative Transitions to Democracy: Ex-
Authoritarians in the Brazilian National Congress.” Studies in Comparative International
Development 31:3 (Fall): 56-84.
Roberts, Kenneth M. 2003. “Social Correlates of Party System Demise and Populist Resurgence
in Venezuela.” Latin American Politics and Society 45:3 (Fall): 35-57.
Samuels, David. 2006a.”Informal Institutions When Formal Contracting Is Prohibited: Campaign
Finance in Brazil.” In Informal Institutions and Democracy: Lessons from Latin America,
Gretchen Helmke and Steven Levitsky, eds. Baltimore: The Johns Hopkins University
Press.
______. 2006b. “Sources of Mass Partisanship in Brazil.” Latin American Politics and Society
48:2: 1-27.
46
______. 2004. “From Socialism to Social Democracy: Party Organization and the
Transformation of the Workers‟ Party in Brazil.” Comparative Political Studies 37:9
(November): 999-1024.
______. 2003a. Ambition, Federalism, and Legislative Politics in Brazil. New York: Cambridge
University Press.
______. 2003b. “Fiscal Straitjacket: The Politics of Macroeconomic Reform in Brazil, 1995-
2002.” Journal of Latin American Studies 35:3 (August): 545-69.
Scott, James. 1969. “Corruption, Machine Politics, and Political Change.” American Political
Science Review 63 (December): 1142-58.
Shefter, Martin. 1994. Political Parties and the State: The American Historical Experience.
Princeton: Princeton University Press.
Silva, Pedro Luiz Barros, José Carlos de Souza Braga, and Vera Lúcia Cabral Costa. 2010.
“Lula‟s Administration at a Crossroads: The Difficult Combination of Stability and
Development in Brazil.” In Leftist Governments in Latin America: Successes and
Shortcomings, Kurt Weyland, Raúl L. Madrid, and Wendy Hunter, eds. New York:
Cambridge University Press.
Soares, Gláucio. 1973. Sociedade e Política no Brasil. São Paulo: DIFEL.
Soares, Gláucio Ary Dillon and Sonia Luiza Terron. 2008. “Dois Lulas: A Geografia Eleitoral da
Reeleição (Explorando Conceitos, Métodos e Técnicas de Análise Geospacial.” Opinião
Pública 14:2 (November): 269-301.
Souza, Celina. 2009. “Electoral Politics in Brazil with Evidence from the State of Bahia: State-
led Social Funds versus Federal-led Social Policies.” Paper presented at the 2009
Congress of the Latin American Studies Association, Rio de Janeiro, June 11-14.
47
Strøm, Kaare. 1990. “A Behavioral Theory of Competitive Political Parties.” American Journal
of Political Science 34:2 (May): 565-98.
Telles, Edward E. 1993. “Urban Labor Market Segmentation and Income in Brazil.” Economic
Development and Cultural Change 41:2 (January): 231-49.
Weyland, Kurt. 1996. Democracy Without Equity: Failures of Reform in Brazil. Pittsburgh:
University of Pittsburgh Press.
Zucco, Cesar. 2010. “Poor Voters vs. Poor Places: Persisting Patterns and Recent Changes in
Brazilian Electoral Patterns.” Paper prepared for the Center for Metropolitan Studies
Seminar, São Paulo, March 24-26.
______. 2008. “The President‟s „New‟ Constituency: Lula and the Pragmatic Vote in Brazil‟s
2006 Presidential Elections.” Journal of Latin American Studies 40: 29-49.
48
Notes
1 Two exceptions are Borges (2007) and Souza (2009).
2 On the different strategies used by clientele networks to shape the vote, see Nichter (2008).
3 The details of these changes cannot be presented here. For a complete analysis, see Banco Central do Brasil
(various years).
4 Protection is not the same as income, as mean monthly earnings for informal self-employed workers can be greater
than formal sector workers in the same categories (Telles 1993: 235).
5 On “externally mobilized parties,” see Shefter (1994: 32-34).
6 The survey was conducted with nine leftist and six conservative respondents in three capital cities: Salvador
(Bahia), Fortaleza (Ceará), and São Luís (Maranhão). The author discussed the most common answers across
respondents with academic experts in each state to identify the norms represented by partisans‟ responses.
7 Domination (Di) = Vix where i is the candidate‟s share of all votes cast per municipality x and then weighted by Tix
(percentage of the candidate‟s total vote municipality x contributes).
8 Similar cluster maps for the 2002 vote are available from the author upon request. They are not shown due to space
constraints.
9 Unfortunately, she stopped short of conducting a fuller examination of partisan organization in all of her municipal
cases.
10 The Federal District was removed because it had extreme values on several variables, including size of the public
sector.
11 Modified versions of the hypotheses tested in this article were analyzed earlier in a study of three states of the
Northeast (Bahia, Ceará, and Maranhão) using both OLS and spatial lag modeling. The spatial lag models from that
earlier work confirm the results presented here. See Montero (2010b).
12 All electoral data were taken from the official Tribunal Superior Eleitoral (TSE) figures.
13 This premise is empirically tested by the author elsewhere (see Montero 2010a).
14 Urbanization as a proxy for mobilization is also used by other studies (e.g., Avelino et al. 2005).
15 In the censuses of 1991 and 2000, IBGE defined an “urban situation” in its Manuais de Delimitação de Setores as
the physical space between a perimeter and an urban center as measured by census officials at the time of a
49
municipal survey. Urban populations are those inhabitants of that physical space and they may be compared to those
in “rural situations” located outside the urban perimeter.
16 The lag of this variable produces similar results but is excluded to minimize multicollinearity.
17 This is premised on the relatively strong correlation between public sector employment and union membership.
See Cardoso (2001). The variable used in this study is based on data from TSE and IPEA and was designed by Tim
Power. Lacking complete data for union membership as a percent of the EAP, this term proxies for organized labor.
18 The competitiveness score uses the aggregate percentage of the vote won in the first round by all gubernatorial
candidates other than the top finisher and multiplies it by the margin of the top two finishers. This amount is then
divided by 100 to ease interpretation. The resulting figure gives equal weight to the closeness of the race and the
overall dispersion of the vote. I thank Tim Power for the design of this measure. In the assembly models, a seat
margin score is used as a proxy for competitiveness.
19 The assumption of the lack of independence of observations within panels was confirmed by several one-way
analysis of variance tests for key predictors and the dependent variables.
20 A number of robustness tests were run on the models, including a comparison of random and fixed effects and
seemingly unrelated regressions to determine whether the error terms across specifications are correlated. Results
were similar to those reported here. To ascertain whether the inclusion or exclusion of any one state panel affected
the results, I conducted a modified jackknife procedure by dropping a panel each time and re-estimating the models.
The results of resampling were largely the same.
21 A smoothing bandwith of .8 was used to generate the nearest neighbors algorithm for the regressions. Similar
results were obtained for state assemblies. These graphs are available upon request.
22 There are fewer observations for the right models due to coding of fewer candidacies and parties as conservative.
23 I tested alternative operationalizations, including coverage as the number of households receiving BF (see Zucco
2008; Borges 2007), and did not see different results from those reported here.
24 Some variables were transformed or dropped from certain specifications to avoid multicollinearity. Variance
inflation factor diagnostics indicated that the reported models were all within accepted tolerance levels.
25 Tests isolating the economic factors to the Northeast showed the same effect. Municipal manufacturing growth
rates were unavailable, so the study cannot replicate the findings for this variable at the state level.

50
26
Notably, the Lula coattails factor is not necessary for other significant variables to affect vote shares. The results
remain the same when the coattails variable is dropped or when it is interacted with the BF.