Embed Size (px)
Citation preview
A Resource-Based Perspective on Corporate Environmental Performance and ProfitabilityAuthor(s): Michael V. Russo and Paul A. FoutsSource: The Academy of Management Journal, Vol. 40, No. 3 (Jun., 1997), pp. 534-559Published by: Academy of ManagementStable URL: http://www.jstor.org/stable/257052 .
Accessed: 04/04/2014 16:55
Your use of the JSTOR archive indicates your acceptance of the Terms & Conditions of Use, available at .http://www.jstor.org/page/info/about/policies/terms.jsp
.JSTOR is a not-for-profit service that helps scholars, researchers, and students discover, use, and build upon a wide range ofcontent in a trusted digital archive. We use information technology and tools to increase productivity and facilitate new formsof scholarship. For more information about JSTOR, please contact [email protected].
.
Academy of Management is collaborating with JSTOR to digitize, preserve and extend access to The Academyof Management Journal.
http://www.jstor.org
This content downloaded from 128.223.17.193 on Fri, 4 Apr 2014 16:55:35 PMAll use subject to JSTOR Terms and Conditions
t Academy of Management Journal 1997, Vol. 40, No. 3, 534-559.
A RESOURCE-BASED PERSPECTIVE ON CORPORATE ENVIRONMENTAL PERFORMANCE
AND PROFITABILITY
MICHAEL V. RUSSO University of Oregon
PAUL A. FOUTS Golden Gate University
Drawing on the resource-based view of the firm, we posited that envi- ronmental performance and economic performance are positively linked and that industry growth moderates the relationship, with the returns to environmental performance higher in high-growth indus- tries. We tested these hypotheses with an analysis of 243 firms over two years, using independently developed environmental ratings. Results indicate that "it pays to be green" and that this relationship strengthens with industry growth. We conclude by highlighting the study's aca- demic and managerial implications, making special reference to the social issues in management literature.
Although the basic tenet of corporate social responsibility is that society and business are tightly interwoven (Wood, 1991), scholars are still strug- gling to specify the precise mechanisms linking firms and society. Within this conversation, a central issue has been the economic impact on a firm of its social policies. In this article, we focus on the economic impacts of environmental performance, a specific social issue that has provoked a very public debate. On the one hand, it has been forcefully argued that environ- mental regulation enhances economic performance in an efficiency- producing, innovation-stimulating symbiotic relationship (Gore, 1993; Por- ter, 1991). On the other hand, regulations are assailed as generating costs that businesses will never recover, representing financial diversions from vital productive investments (Gingrich, 1995; Walley & Whitehead, 1994).
A number of empirical studies performed in this area have returned differing verdicts. Several studies have shown no significant link between measures of environmental performance and profitability (Fogler & Nutt, 1975; Rockness, Schlachter, & Rockness, 1986) or between environmental performance and corporate disclosure practices (Freedman & Jaggi, 1982;
We wish to express our appreciation to the Franklin Research and Development Corpora- tion for allowing us to use their proprietary database and to Roger Chope and Steven Matsunaga for assistance with methodological issues. We also thank Thomas Dean, Neil Fargher, David Levy, John Mahon, Alan Meyer, Peter Mills, Richard Mowday, and the anonymous reviewers for helpful comments.
534
This content downloaded from 128.223.17.193 on Fri, 4 Apr 2014 16:55:35 PMAll use subject to JSTOR Terms and Conditions
1997 Russo and Fouts 535
Wiseman, 1982). But other studies have shown that better pollution perfor- mance improved profitability (Bragdon & Marlin, 1972; Spicer, 1978a) and reduced risks (Spicer, 1978b) and that federal compliance liability costs and profitability were negatively related (Holman, New, & Singer, 1985). One can challenge these prior studies on methodological grounds. All but one used small, single-industry samples. More importantly, they have frequently re- lied on self-reported data, failed to control for other predictors of profitabil- ity, and used questionable social responsibility measures (Wood & Jones, 1995). These methodological shortcomings may be responsible for results to date that have shown an equivocal relationship between environmental per- formance and economic performance.1
Wood and Jones (1995) argued that this inconclusiveness is primarily due to a key conceptual shortcoming, failure to carefully trace how the social policies examined directly influence firms' bottom lines. For example, we would expect that any external imposition of fines or additional compliance costs would drive down profits, thus accounting for the significant effects of these costs found in several of the studies just cited. We agree with Wood and Jones that there are conceptual flaws in prior research, but we also suggest that the relationship is more complex than a simple calculus equat- ing higher costs with lower profits. After all, if the sole driving force for a corporate environmental policy is minimizing tangible pollution costs, then any firm going beyond compliance would forfeit the profits it could gain from simply (and legally) continuing to externalize those costs. Our argu- ment, based on the resource-based view of the firm, highlights the role en- vironmental policy plays in generating broader organizational advantages that allow a firm to capture premium profits. In a sense, it could be said that the same policies that internalize negative environmental spillovers can pay off by simultaneously generating greater positive organizational spillovers that accrue internally and privately to the firm. Thus, for both methodologi- cal and conceptual reasons, a careful study of the relationship between en- vironmental performance and economic performance is both timely and potentially of great value.
The resource-based view of the firm offers corporate social responsibil- ity researchers a tool for refining the analysis of how corporate social policy influences the bottom line for two reasons. First, the resource-based view has a strong focus on performance as the key outcome variable. And second, like the social responsibility literature, work adopting the resource-based view explicitly recognizes the importance of intangible concepts, such as know- how (Teece, 1980), corporate culture (Barney, 1986), and reputation (Hall, 1992). These theoretical complementarities offer a significant opportunity
1 Two working papers (Hart & Ahuja, 1994; Cohen, Fenn, & Naimon, 1995) have also addressed the environment-performance relationship, with mixed results. The equivocality of results in this area extends to other social issues, such as corporate philanthropy and commu- nity relations. Ullman (1985), Aupperle, Carroll, and Hatfield (1985), and most recently, Wood and Jones (1995) have offered surveys of empirical work in this area.
This content downloaded from 128.223.17.193 on Fri, 4 Apr 2014 16:55:35 PMAll use subject to JSTOR Terms and Conditions
536 Academy of Management Journal June
that we hoped to exploit in this study, which spotlights the environmental performance-economic performance relationship. Further, we explored in- dustry growth as a moderator of this relationship, theorizing that firms are less likely to reap benefits from increased environmental performance when industry growth is low. But before formally stating these predictions, we briefly outline the resource-based theory of competitive advantage.
A RESOURCE-BASED VIEW OF ENVIRONMENTAL PERFORMANCE AND ECONOMIC PERFORMANCE
The Resource-Based View of Competitive Advantage
The resource-based view of the firm grew out of a frustration with the structure-conduct-performance paradigm of the industrial organization (IO) view of the firm (Bain, 1959; Porter, 1980). The early resource-based theo- rists found the IO view-that a firm's success was wholly determined by its external environment-to be unrealistically limited and turned to the semi- nal work of Penrose (1959) for motivation. To counter the IO view, Werner- felt (1984), Dierickx and Cool (1989), and Prahalad and Hamel (1990) built resource-based theory around the internal competencies of firms. In these contributions to resource-based theory, competitive advantage is rooted in- side a firm, in assets that are valuable and inimitable. A firm's capabilities or competencies and management's abilities to marshal these assets to produce superior performance determine competitive advantage (Grant, 1991). In the drive to add depth and breadth to this internal view, theorists have noted but left somewhat vague the role of a firm's links to its external environment.
Barney's (1986) work addressed this issue by pinpointing the conditions under which a firm's resources become valuable by bringing the external environment into the resource-based picture. In developing the notion of external factor markets, he noted that, contrary to the IO model, external resource analysis alone cannot lead to valuable resources. However, by nur- turing internal competencies and applying them to an appropriate external environment, a firm can develop a viable strategy. Thus, for a firm's resource to become valuable, it must allow the firm to "exploit opportunities or neu- tralize threats" in the firm's environment (Barney, 1991: 106). The link in resource-based theory between the competitive environment and firm capa- bilities was made more explicit by Conner (1991), in her comparison of the resource-based view and the IO and Chicago models. She observed that all three recognize the external constraints of demand conditions and public policy on strategy. For Conner, the task for resource-based theorists is to discern the appropriate rent-generating inputs given both external (e.g., de- mand, public policy, and competitor action) and internal (e.g., past history, resource endowments, and corporate culture) constraints.
Thus, in its current state, the resource-based view addresses the fit be- tween what a firm has the ability to do and what it has the opportunity to do. To quote Collis and Montgomery, "Resources cannot be evaluated in isola- tion, because their value is determined in the interplay with market forces.
This content downloaded from 128.223.17.193 on Fri, 4 Apr 2014 16:55:35 PMAll use subject to JSTOR Terms and Conditions
1997 Russo and Fouts 537
A resource that is valuable in a particular industry or at a particular time might fail to have the same value in a different industry or chronological context" (1995: 120).
In the resource-based view, resources are classified as tangible, intan- gible, and personnel-based (Grant, 1991). Tangible resources include finan- cial reserves and physical resources such as plant, equipment, and stocks of raw materials. Intangible resources include reputation, technology, and human resources; the latter include culture, the training and expertise of employees, and their commitment and loyalty. As these resources are not productive on their own, the analysis also needs to consider a firm's organ- izational capabilities-its abilities to assemble, integrate, and manage these bundles of resources. In our application of the resource-based view, we considered resources and capabilities in the following combinations: (1) physical assets and the technologies and skills required to use them, (2) human resources and organizational capabilities, which include culture, commitment, and capabilities for integration and communication, and (3) the intangible resources of reputation and political acumen.
Previous applications of resource-based theory to evaluation of environ- mental policies and strategy have concentrated on internal analysis of firms (Porter, 1991; Shrivastava, 1995a). However, Hart (1995) expanded the re- source-based view of the firm to include the constraints imposed and op- portunities offered by the biophysical environment. In his theory, he pro- vided a schema that links the imperative of capturing a competitive advan- tage with the goal of securing and enhancing social legitimacy. He viewed external stakeholders as playing a pivotal role in moving corporations to- ward sustainability. The logical extension of this argument is that viewing societal demands as part of the external environment facing a firm trying to develop unique resources leads to expectations about when such resources will be valuable and inimitable. We suggest this is particularly true when society is demanding a cleaner environment.
In developing our theory, we found it useful to bear in mind two modes of environmental policy advanced by Hart (1995). The first is the compliance strategy, wherein firms rely on pollution abatement through a short-term, "end-of-pipe" approach, often resisting the enactment and enforcement of environmental legislation. Firms often fall short of compliance in this mode. The second mode of environmental policy is going beyond compliance to a focus on prevention, a systemic approach that emphasizes source reduction and process innovation (Hart, 1995). Our position is that firms that tend toward the compliance mode will differ in their resource bases from those that tend toward prevention and that this policy choice will affect firms' ability to generate profits.
Corporate Environmental Performance and Profitability
Physical assets and technology. The resources and capabilities required to implement a firm's environmental policy vary radically, depending on whether or not that firm goes beyond compliance to embrace pollution pre-
This content downloaded from 128.223.17.193 on Fri, 4 Apr 2014 16:55:35 PMAll use subject to JSTOR Terms and Conditions
538 Academy of Management Journal June
vention. End-of-pipe compliance policies affect only physical asset re- sources, which consist of the "physical technology used in a firm, a firm's plant and equipment, its geographic location, and its access to raw materi- als" (Barney, 1991). Compliance is achieved primarily by the addition of pollution-removing or filtering devices to the existing assets of a firm and does not require the firm to develop expertise or skills in managing new environmental technologies or processes. The technology is essentially self- contained, off-the-shelf hardware. Once such hardware is installed, it does not fundamentally vary production or service delivery processes. Thus, the implementation of this policy is straightforward and leaves a firm essentially in the same resource and capability situation it was in before it adopted the policy (Groenewegen & Vergragt, 1991; Kemp, 1993).
As a proactive environmental policy takes hold in a firm, we would expect it to redesign its production or service delivery processes. Such a redesign would likely involve the acquisition and installation of new tech- nologies. Within this schema, the resource-based view of the firm provides a solid foundation for the hypothesis that improved environmental perfor- mance can enhance economic performance. Physical resources can be a source of competitive advantage if they "outperform" equivalent assets within competitors. The resource-based prediction would be that, if pur- chased from a third party, a physical asset itself cannot produce premium profits, as that technology is presumably available to competitors. However, if new physical assets are deployed in a way that allows a firm to capitalize on and enhance its internal methods for waste reduction and operational and fuel efficiency, such advantages are less transparent. And this method of deployment is likely to be the case within firms stressing prevention. Indeed, these internal routines represent the type of causally ambiguous resource (Reed & DeFillippi, 1990) that is central to the resource-based view of com- petitive advantage. When internal routines and know-how accumulate, a firm's knowledge of pollution prevention deepens (Dean & Brown, 1995). Such knowledge lessens the risk of spills and other actionable offenses tak- ing place (Groenewegen & Vergragt, 1991; Shrivastava, 1995a).
Human resources and organizational capabilities. Embracing the no- tion of improved environmental performance also requires a fundamental shift in a firm's culture and human resources and the organizational capa- bilities required to manage them. Management, R&D, production, and mar- keting all must be involved and committed if a firm is to implement a policy of using clean technologies (Ashford, 1993; Hart, 1995). Use of clean tech- nologies also adds complexity to production or delivery processes and re- quires increased skills from workers at all levels of the firm (Groenewegen & Vergragt, 1991). So prevention is a more comprehensive and socially com- plex process than compliance, necessitating significant employee involve- ment, cross-disciplinary coordination and integration, and a forward- thinking managerial style (Shrivastava, 1995b). For example, Hart (1995: 996) discussed Xerox's policy of viewing its leased copiers as a source of high-quality inputs for its new copiers. Such a policy ties together design
This content downloaded from 128.223.17.193 on Fri, 4 Apr 2014 16:55:35 PMAll use subject to JSTOR Terms and Conditions
1997 Russo and Fouts 539
and manufacturing functions, along with those units responsible for inter- faces with customers, resulting in company-wide gains. The process of de- veloping a pollution prevention policy thus builds within a firm the re- sources of organizational commitment and learning, cross-functional inte- gration, and increased employee skills and participation, which, we argue, are emerging as prime resources in the modern competitive environment.
A strong environmental stance can be expected to become part of an organization's image and identity and to guide the actions of its members (Dutton & Dukerich, 1991). Such a stance can be expected to influence hu- man resource policies, in turn shaping job design, recruitment and selection, and training and development systems (Starik & Rands, 1995). In general, when a firm adopts a sophisticated human resource management strategy such as this, productivity improvements are captured (Koch & McGrath, 1995). One reason may be that attracting top candidates is easier for firms known for environmental stewardship. According to Dechant and Altman:
Employees' views on a firm's environmental performance and whether it fits their values profile frequently affects their will- ingness to work for that firm. A 1991 McKinsey study of 403 senior executives from around the world revealed that sixty- eight percent of them agreed that "organizations with a poor environmental record will find it increasingly difficult to recruit and retain high caliber staff (McKinsey, 1991, cited in Gladwin, 1993)." This perspective was validated by Mike Joyce, Division Director of Environmental Affairs for Dexter Corporation, who indicated that "college graduates are looking for more than just a paycheck, they are looking for companies with which they can identify morally and philosophically" (1994: 8).
Intangible resources. Two intangible factors suggest that better environ- mental performance will augment profits. The first is that a reputation for leadership in environmental affairs will increase sales among customers who are sensitive to such issues. Indeed, such consumer actions appear to be increasingly frequent: although the phenomenon of consumers tying firms' social responsibility records to purchasing decisions is a relatively new one (Murray & Montanari, 1986), it is reported to be gaining steam (Economist, 1994).2 The publication of popular handbooks, such as The Green Consumer Supermarket Guide, and the implementation of independent rating pro- grams, such as Green Cross and Green Seal, have facilitated environmentally
2 Further evidence of the rise of green consumers abounds. Environmental awareness, after dipping in the mid-1980s, has again emerged as an issue globally and in America. A 1990 study by the Roper Organization found that from 1987 to 1990, public concern about the environment grew faster than concern about any other national problem. During this same period, the num- ber of green product introductions quintupled to nearly 10 percent of all new products (Thayer, 1990), and the Sierra Club's membership rose an average of 13.9 percent annually (Sierra Club, 1993). Finally, nearly a third of consumers have purchased a product specifically for its green labeling or advertising, and a quarter routinely read labels to gain an understanding of the environmental impacts of products (Roper Organization, 1990).
This content downloaded from 128.223.17.193 on Fri, 4 Apr 2014 16:55:35 PMAll use subject to JSTOR Terms and Conditions
540 Academy of Management Journal June
informed buying behavior; these sources convey to consumers the informa- tion they need to make choices among products and firms. Intermediate purchasing behavior also reflects this trend: firms like McDonalds and Pru- dential Insurance are pressuring upstream companies to "get greener" (Ho- lusha, 1995).
As a firm develops an environmental policy, it must also develop a reputation for that policy, since such a reputation is in itself a source of market advantages. We observe such reputation-profit links in the business world. Firms from ARCO to Procter & Gamble generally credit part of their profits to a reputation for pro-environment corporate behavior (Harrison, 1993; Piasecki, 1995). An environmental reputation must be built on top of an overall reputation for quality. Once gained, a pro-environment reputation is itself a valuable inimitable resource. Haagen-Dazs cannot purchase Ben & Jerry's reputation, nor can it effectively replicate that reputation in the short term.
One intangible asset that has received little previous attention in re- source-based theory development is an organization's political acumen, which we define as the ability to influence public policies in ways that confer a competitive advantage. This neglect of corporate political strategy may be a result of managers viewing it as outside of their primary respon- sibilities (Post, 1978). But savvy executives have firmly grasped the worth of political strategy as a strategic resource (Mahon, 1989). Political skills are an inimitable, valuable resource that can be used to neutralize, promote, or otherwise manage external constituencies.
Managers following a compliance policy tend to employ legislative and political lobbying aimed at slowing down the pace of environmental legis- lation (Logsdon, 1985). This externally directed approach stands in contrast to the technical and organizational focus of a prevention policy. Prevention- oriented firms develop skills that help them adopt external technologies to meet the demands of society and even move to "raise the floor" in that regard (Starik & Rands, 1995: 923), but compliance-oriented firms develop political acumen to fend off these imperatives. Such a reactive focus with respect to other elements of firm strategy (e.g., product design or customer service) would clearly be seen as inferior.
In summary, a resource-based analysis of the link between environmen- tal performance and economic performance leads directly to our first hy- pothesis:
Hypothesis 1. High levels of environmental performance will be associated with enhanced profitability.
The Moderating Effect of Industry Growth
In this section, we discuss physical assets and technologies, human resources and organizational capabilities, and intangible resources in turn, arguing that industry context in general, and the growth within an industry in particular, moderate the influence of social performance on economic
This content downloaded from 128.223.17.193 on Fri, 4 Apr 2014 16:55:35 PMAll use subject to JSTOR Terms and Conditions
1997 Russo and Fouts 541
performance. As noted above, the majority of work in this area has stressed issues internal to firms. Here, we try to trace why firms are more likely to reap benefits from increased social performance when they are in high- growth industries rather than low-growth industries.
Physical assets and technology. Movement toward the prevention mode of operation increases a firm's level of risk. Under normal conditions, an investment in redesigning and replacing existing processes in a competitive environment is financially significant and involves substantial risk. How- ever, the decision to adopt clean technologies and to incur the added costs of pollution reduction without governmental action is even more risky for two reasons. First, early in their life cycles, technologies and processes that are on the cutting edge of source reduction may cost more and be of lower quality than they will be when they become off-the-shelf technologies of the type described above (Groenewegen & Vergragt, 1991; Kemp, 1993). Second, the viability of new, clean technologies can be largely unknown, as are the economic consequences of their use (Kemp, 1993; Shrivastava, 1995a).
Regardless of industry context, prevention entails risk, but we argue that for two reasons, industry growth influences how returns to this risk affect profitability. According to discounted cash flow analysis, the level of an industry's growth moderates the expected probabilities of return (Brealey & Myers, 1991), because the expected payoff of any investment risk is higher in high-growth industries. Another factor relates to the technology life cycle (Abernathy & Utterback, 1978). In general, industry growth accelerates the maturation of a technology, which rapidly reduces the levels of risk inherent in investing in a long-lived technology at its emergent point. Thus, firms that invest in a pollution prevention policy, although adding to risk, also have a higher prospective return in a high-growth industry. Firms that fail to invest in newer technologies would suffer comparatively. Likewise, a pollution prevention policy will face a lower prospective return in a low-growth or declining industry. Rapid turnover of technologies in high-growth industries may also promote the learning-based organizational spillovers that were described above.
Organizational capabilities. Another major reason that we expected re- turns to environmental performance to be higher in high-growth industries involves organizational capabilities.3 To make this argument, we refer to the two primary environmental thrusts discussed above: compliance, the so- called end-of-pipe approach, and prevention, the system that stresses source reduction and process innovation (Hart, 1995). Although a bureaucratic
3 We do not address the issue of human resources in this section (as we did in the analogous section on direct effects), as we feel that here most such arguments would be speculative. For example, one line of reasoning might run something like this: in high-growth industries, em- ployee growth is higher, and firms will be less likely to suffer from the organizational inertia that blocks pro-environmental change (Shrivastava, 1995a). Such conditions might also provide "a climate conducive to risk-taking and persistent problem solving" (Drumwright, 1992: 32), which promotes environmental improvement.
This content downloaded from 128.223.17.193 on Fri, 4 Apr 2014 16:55:35 PMAll use subject to JSTOR Terms and Conditions
542 Academy of Management Journal June
management style may be matched to compliance, use of a more organic style is necessary to capture the gains associated with going beyond com- pliance, because the latter generates the type of innovative culture (Aiken & Hage, 1971) that enhances prevention efforts. The likelihood of an organic structure's being in place depends partly on industry growth.
Low-growth industries are more likely to be populated by mature firms selling standardized products (Hofer, 1975). Under such conditions, organ- izational structures can be expected to be hierarchical, inflexible, and bu- reaucratic (Burns & Stalker, 1961). Within such organizations, then, adopt- ing policies and procedures associated with pollution prevention would be difficult, as they require a loosening of organizational structures and norms. Furthermore, such changes might well degrade performance if more mecha- nistic (Burns & Stalker, 1961) structures are associated with high perfor- mance in mature industries (Lawrence & Lorsch, 1967). For higher-growth industries, one would expect more organic structures to be in place, a situ- ation that would facilitate pollution prevention efforts. An organic structure may also allow a firm that has more unabsorbed slack (Singh, 1986) to invest in environmental improvements.
Intangible resources. In this section, we discuss two intangible re- sources, reputation and political acumen. Both resources can work for or against a firm. With respect to reputation, we expect the connection between environmental performance and profitability to be stronger as industry growth rises. Assuming, as above, that consumers respond to reputations for environmental stewardship, the question is why such reputations are easier to construct in high-growth industries.
Growing industries are much more likely to experience entry by new players, and they are subject to methods and rules of competition that are still in flux (Porter, 1980). Initial reputations are still being established. If it is true that "the cumulative investments that firms consistently make in different domains over a long period of time are more likely to influence the cognitive interpretations of stakeholders" (Fombrun & Shanley, 1990: 254), then it follows (1) that an initial reputation is partly a matter of firm choice (for instance, trying to be known for being green versus being known for customer service) and (2) that once established, a reputation is difficult to change. This latter point is important, as firms in older, more mature indus- tries tend to have preexisting reputations on numerous other dimensions. Shrum and Wuthnow (1988), for example, found that the performance- reputation association was tighter in photovoltaics, a growth industry, than in nuclear power, a mature industry. It is also true that when a firm is in an older, basic manufacturing industry, detriments to its reputation tend to affect consumer perceptions of the entire industry, as the Exxon Valdez disaster demonstrated (Jennings & Zandbergen, 1995; Koen, 1992). Such spillovers would tend to dampen the returns to positive environmental per- formance that occur in low-growth industries.
A second intangible asset follows from an examination of political strat- egy. How would the development and use of political resources differ in
This content downloaded from 128.223.17.193 on Fri, 4 Apr 2014 16:55:35 PMAll use subject to JSTOR Terms and Conditions
1997 Russo and Fouts 543
high- and low-growth industries? High-growth industries tend to be younger industries. Yoffie (1988) argued strongly for use, in such a setting, of a political strategy that stresses establishment of an institutional framework amenable to all players. That is, in a young industry the focus tends to be on the industry as a whole, and not on capturing direct firm-specific advantages vis-'a-vis competitors.
In lower-growth industries, the situation is more complex. Political ac- tion in such settings is more proactive (Raelin, 1984). Here, political strate- gies tend to center on so-called rent-seeking (Buchanan, Tollison, & Tullock, 1980), the securing of competitive advantage via political means. Leone (1986) provided many examples of such tactics (generally, in accounts of mature industries), such as firms favoring pollution control regulation whose costs fell disproportionately on their competitors. Independent as- sessments of environmental performance, such as those developed by the Investor Responsibility Research Center (1995), often include expenditures for pollution control. In this case, a high-spending firm may appear to be more environmentally conscious, while actually impairing its cost position in its industry, and hence, its profitability.
In our discussion of the contrasting political tendencies of compliance and prevention firms in the preceding section, we noted that a compliance policy stresses a political strategy for competitive advantage, but a preven- tion policy stresses technical and organizational solutions instead. In a high- growth environment, the political actions associated with a compliance strategy are out of step with the needs and prevailing attitude of the industry and should yield less success. Likewise, success in lower-growth environ- ments often demands reliance on the political strategies characteristic of a compliance policy.
The preceding remarks suggest that the growth rate of an industry mod- erates the connection between environmental performance and profitability. Hence,
Hypothesis 2. The level of an industry's growth will mod- erate the relationship between the environmental perfor- mance and profitability of firms in that industry; the greater the industry growth, the greater the positive im- pact of environmental performance on firm profitability.
EMPIRICAL ANALYSIS
Sample, Methods, and Measures
We began with the group of firms assigned environmental ratings by the Franklin Research and Development Corporation (FRDC). This set of 477 firms spans all industrial classifications. We drew data on the firms for the years 1991 and 1992, using these years (1) because the first FRDC ratings
This content downloaded from 128.223.17.193 on Fri, 4 Apr 2014 16:55:35 PMAll use subject to JSTOR Terms and Conditions
544 Academy of Management Journal June
were made in 1991 and were based on data from that year and previous years4 and (2) because two years seemed to us to represent an adequate period in which to test the influence of environmental performance, without letting too much time lapse between the measurement of the dependent and independent variables. The two-year period and lagging all independent variables that did not represent change scores by one year allowed us to test for causality.
We drew a number of financial statistics from COMPUSTAT for each company. We removed utilities, whose returns are subject to statutory limits; 70 observations per year were removed for this reason. Also removed were firms with missing data for one or more variables, predominantly the adver- tising, industry concentration, and firm sales growth variables. For 1991, 137 firms were excluded because of such missing data, and for 1992 exclusions were roughly the same. We then deleted a small number of observations for firms that had either grown or shrunk by more than 50 percent in either of the two years (3 firms in 1991). We used this procedure because these firms may have experienced major sell-offs, restructurings, or acquisitions that would have made them a source of bias (firms that had themselves been acquired were not rated by the FRDC). The predictive power of the models increased greatly after we removed these firms, which suggests that includ- ing them would have introduced misspecification to our models. Finally, we removed firms for which data were available for 1991 but not 1992, or vice versa (24 firms in 1991). The final sample size was 243 firms.
Environmental ratings were based directly on the scores given to the sample firms by the FRDC. These scores are based on a number of criteria, such as compliance records, expenditures, and other initiatives used to meet new demands, to reduce waste reduction, and to support environmental protection organizations. Thus, the ratings are well-matched to our theory, which explicitly highlights compliance and prevention efforts by firms. Not based on self-reports, the FRDC ratings correlate negatively and significantly with 1989 firm toxic releases per unit of sales (p < .01) and an index devel- oped by the Investor Responsibility Research Center (1995) to track fines and penalties in 1989 (p < .02). The 1989 figures were the most recent figures available during 1991, as there is a lag between the reporting of such infor- mation and its issuance by the federal government. The ratings are internally adjusted for industry conditions, and virtually all industries contain firms with high and low ratings (a more complete description of the FRDC rating system appears in the Appendix). As the FRDC ratings were not systemati- cally updated during this period, we held them constant for the two years.
4 Unfortunately, unlike many social science phenomena, such as product recalls, hostile acquisition attempts, and job changes, for which the number of discrete events in a year can be counted, assessments such as the FRDC ratings are difficult to associate with an exact time frame. This follows from the consideration of data from previous years in the decision calculus in a later year. Thus, we felt that it was proper to include 1991 data in our analysis. However, separate results for 1991 and 1992 are provided in our tabulated results.
This content downloaded from 128.223.17.193 on Fri, 4 Apr 2014 16:55:35 PMAll use subject to JSTOR Terms and Conditions
1997 Russo and Fouts 545
We reverse-coded the FRDC scale to run from 1 to 5, so that high values reflect good environmental performance.
Our dependent variable was a company's return on assets, or ROA, a generally accepted measure of firm performance. In choosing control vari- ables, we began with a list of the seven causal variables most prevalent in prior studies of performance (Capon, Farley, & Hoenig, 1990). These were industry concentration, firm growth rate, firm size, capital intensity, re- search and development intensity, advertising intensity, and market share. We dropped market share from consideration, because of a complete lack of data, and also dropped research and development, because many data were missing and the variable was consistently insignificant in trial regressions. We added industry growth rate, as our hypotheses cast this variable in a moderating role. Drawing on Capon and colleagues' (1990) findings, we expected the signs of these controls (including industry growth) to be posi- tive, except for firm size, which had no consistent effect in that study, and capital intensity, which weighed in negatively when measured at the firm level.
We operationally defined the controls as follows: Industry concentra- tion was measured as the four-firm concentration ratio at the four-digit Stan- dard Industrial Classification (SIC) level and was taken from the 1987 Cen- sus of Manufactures (U.S. Department of Commerce, 1992). Recently pub- lished reports now provide these data for nonmanufacturing firms for the first time (e.g., U.S. Department of Commerce, 1995). Firm growth rate was a firm's annual change in sales, expressed as a percentage. The natural loga- rithm of sales volume served as a proxy for firm size, and capital intensity was defined as the ratio of assets to sales. Industry growth was the average annual increase in sales for four years (1991 observations) or five years (1992 observations); we could not go further back because of the revision of the Standard Industrial Classification system in 1987. For industry growth, we used the most consistent set of data we found, from the U.S. Bureau of the Census, which provided numbers at the three-digit SIC level. Because we pooled two years of data, we included a dummy variable set equal to 1 if an observation was from 1991 and to 0 otherwise. The purpose of this variable was to pick up fixed effects that varied between the two years. All variables except for the FRDC ratings changed between 1991 and 1992.
As noted above, numerous firms had missing values for advertising intensity, so we undertook a special procedure to fill in these data (the figures provided above for missing data refer to conditions obtaining after the following procedure had been carried out). We began by measuring ad- vertising intensity as annual expenses for that function divided by firm size. For a small number of observations, size was not available, so we used annual industry averages printed in Advertising Age.
To test Hypothesis 2, we used an interaction term formed by multiplying the FRDC environmental variable and industry growth. As is often the case, the interaction term was highly correlated with its constituents, a situation that can produce multicollinearity and unstable regression estimates. There-
This content downloaded from 128.223.17.193 on Fri, 4 Apr 2014 16:55:35 PMAll use subject to JSTOR Terms and Conditions
546 Academy of Management Journal June
fore, we employed the procedure suggested by Aiken and West (1991) to confront this problem. The Aiken and West approach calls for "de-meaning" (or centering) the direct terms by subtracting the mean of each variable from the values for each observation. Coefficient estimates for equations without the interaction term are not changed. More importantly, as we show below, the interaction term created by the multiplication of the two de-meaned direct variables displays little correlation with those direct terms when it is inserted thereafter.5 We used ordinary least squares regression techniques. With only two years and 243 firms, we chose not to correct for autocorrela- tion under the assumption that our statistical approach should reflect our data, which look far more like a cross section than a time series.6
RESULTS
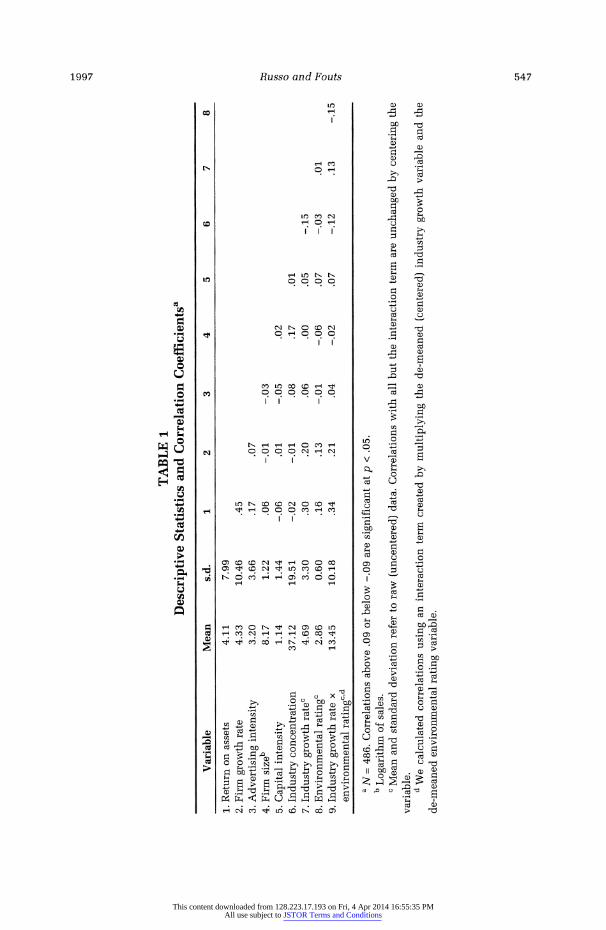
Descriptive statistics appear in Table 1. Correlations are generally low, with the exception of the relationship between the firm growth rate and ROA, and the industry growth and interaction terms, which are strong and positive. The last correlation provides initial support for Hypothesis 2. Of special note is the pattern of correlations between the interaction term and its constituent terms. Because we constructed the interaction term used in the correlations and regressions by multiplying the de-meaned industry growth and environmental ratings variables, correlations with those vari- ables are modest, and one correlation is negative. If we had used an inter- action term formed by simply multiplying together the industry growth and environmental ratings variables, their correlations with the interaction term would have been .95 and .28, respectively. Thus, our goal of constructing a meaningful test of direct and interactive effects by reducing multicollinear- ity was achieved.
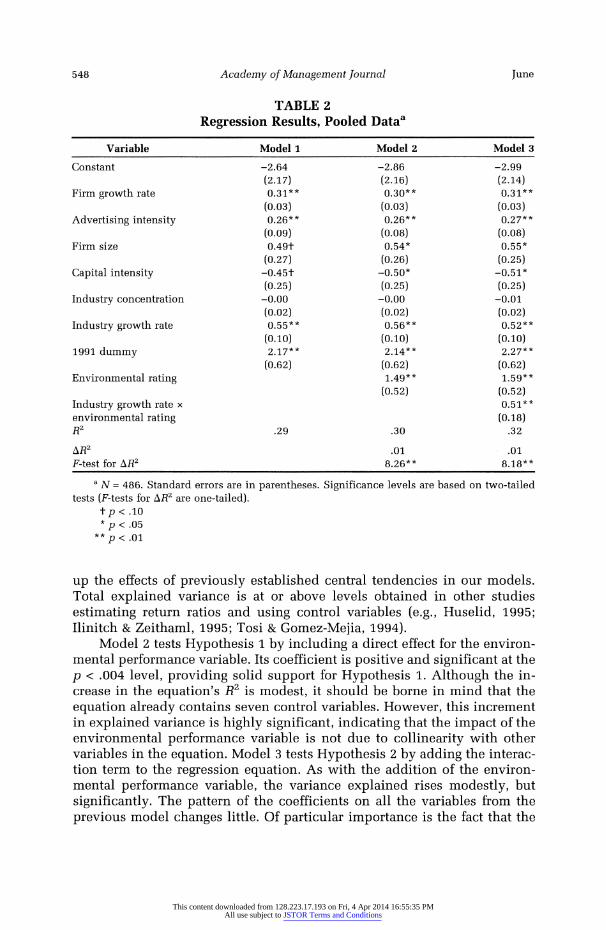
Table 2 shows regression results with 1991 and 1992 data pooled. Model 1 includes the control variables. The coefficient on the firm growth rate is positive and highly significant, as is the coefficient on advertising intensity. Of the remaining control variables, capital intensity is significant and acts in the expected direction, firm size and the 1991 dummy variable are signifi- cant and positive, and the concentration ratio is insignificant. In this equa- tion, industry growth is significant and positive, demonstrating an effect separate from that of firm growth. Thus, of five control variables for which we had prior expectations, four were significant predictors of profitability and acted in the expected direction. This observation added to our confi- dence in the regression modeling, because it indicated that we were picking
5 We thank an anonymous reviewer for suggesting this procedure. e We also checked for the presence of heteroskedasticity in our estimation using an option
available in the statistical package SHAZAM (White, Wong, Whister, & Haum, 1990). There is no single test for heteroskedasticity, and its presence could not be established. To double-check, we generated the regression equations again, employing White's (1980) correction for hetero- skedasticity. Results were very similar to those we present here.
This content downloaded from 128.223.17.193 on Fri, 4 Apr 2014 16:55:35 PMAll use subject to JSTOR Terms and Conditions
1997 Russo and Fouts 547
TABLE 1
Descriptive
Statistics
and
Correlation
Coefficientsa
Variable
Mean
s.d.
1
2
3
4
5
6
7
8
1.
Return
on
assets
4.11
7.99
2.
Firm
growth
rate
4.33
10.46
.45
3.
Advertising
intensity
3.20
3.66
.17
.07
4.
Firm
sizeb
8.17
1.22
.06
-.01
-.03
5.
Capital
intensity
1.14
1.44
-.06
.01
-.05
.02
6.
Industry
concentration
37.12
19.51
-.02
-.01
.08
.17
.01
7.
Industry
growth
ratec
4.69
3.30
.30
.20
.06
.00
.05
-.15
8.
Environmental
ratingc
2.86
0.60
.16
.13
-.01
-.06
.07
-.03
.01
9.
Industry
growth
rate x
13.45
10.18
.34
.21
.04
-.02
.07
-.12
.13
-.15
environmental
ratingc d
a
N =
486.
Correlations
above
.09 or
below
-.09
are
significant at p <
.05.
b
Logarithm of
sales.
c
Mean
and
standard
deviation
refer to
raw
(uncentered)
data.
Correlations
with
all
but
the
interaction
term
are
unchanged
by
centering
the
variable. d
We
calculated
correlations
using
an
interaction
term
created
by
multiplying
the
de-meaned
(centered)
industry
growth
variable
and
the
de-meaned
environmental
rating
variable.
This content downloaded from 128.223.17.193 on Fri, 4 Apr 2014 16:55:35 PMAll use subject to JSTOR Terms and Conditions
548 Academy of Management Journal June
TABLE 2 Regression Results, Pooled Dataa
Variable Model 1 Model 2 Model 3
Constant -2.64 -2.86 -2.99 (2.17) (2.16) (2.14)
Firm growth rate 0.31** 0.30** 0.31** (0.03) (0.03) (0.03)
Advertising intensity 0.26** 0.26** 0.27** (0.09) (0.08) (0.08)
Firm size 0.49t 0.54* 0.55* (0.27) (0.26) (0.25)
Capital intensity -0.45t -0.50* -0.51* (0.25) (0.25) (0.25)
Industry concentration -0.00 -0.00 -0.01 (0.02) (0.02) (0.02)
Industry growth rate 0.55** 0.56** 0.52** (0.10) (0.10) (0.10)
1991 dummy 2.17** 2.14** 2.27** (0.62) (0.62) (0.62)
Environmental rating 1.49** 1.59** (0.52) (0.52)
Industry growth rate x 0.51** environmental rating (0.18) R2 .29 .30 .32
AR2 .01 .01
F-test for AR2 8.26** 8.18**
a N = 486. Standard errors are in parentheses. Significance levels are based on two-tailed tests (F-tests for AR2 are one-tailed).
tp < .10 * p < .05
** p < .01
up the effects of previously established central tendencies in our models. Total explained variance is at or above levels obtained in other studies estimating return ratios and using control variables (e.g., Huselid, 1995; Ilinitch & Zeithaml, 1995; Tosi & Gomez-Mejia, 1994).
Model 2 tests Hypothesis 1 by including a direct effect for the environ- mental performance variable. Its coefficient is positive and significant at the p < .004 level, providing solid support for Hypothesis 1. Although the in- crease in the equation's R2 is modest, it should be borne in mind that the equation already contains seven control variables. However, this increment in explained variance is highly significant, indicating that the impact of the environmental performance variable is not due to collinearity with other variables in the equation. Model 3 tests Hypothesis 2 by adding the interac- tion term to the regression equation. As with the addition of the environ- mental performance variable, the variance explained rises modestly, but significantly. The pattern of the coefficients on all the variables from the previous model changes little. Of particular importance is the fact that the
This content downloaded from 128.223.17.193 on Fri, 4 Apr 2014 16:55:35 PMAll use subject to JSTOR Terms and Conditions
1997 Russo and Fouts 549
coefficients on the environmental performance variable and industry growth variables shift very little in either value or significance level, showing that our strategy of de-meaning those variables produced the desired stability in regression estimation. The interaction term is significant and acts in the hypothesized direction. Thus, our results show that although the contribu- tion to the explained variance in firm performance made by our variables of interest is modest, higher environmental performance is associated with higher financial performance, and the relationship is strengthened as indus- try growth rises.
To explore this effect further, we evaluated model 2 by taking the partial derivative of the regression equation with respect to the environmental per- formance variable, yielding the following:
8(ROA)I8(environmental rating) = 1.59 + (0.51 x de-meaned industry growth).
Setting this expression equal to 0 and solving for industry growth yields a value of -3.14 percent for de-meaned industry growth. That is, increasing environmental performance improved the bottom line in all cases where (de-meaned) industry growth was greater than -3.14 percent, which is true in virtually all of our data. Thus, our results indicate that "it pays to be green" as a rule, and that this relationship strengthens as industry growth increases. The industry context facing a firm is a key determinant of the effect of environmental performance on financial profitability, confirming Hypothesis 2.
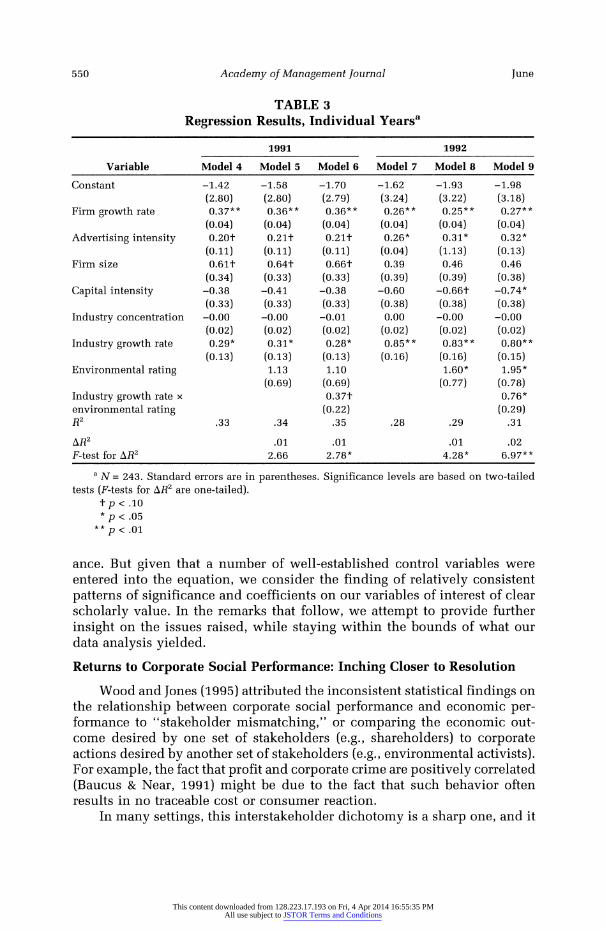
To examine the robustness of our results, we split our data by year and conducted analyses of 1991 (models 4, 5, and 6) and 1992 (models 7, 8, and 9) separately. Results, shown in Table 3, provide support for our findings. In terms of our control variables, the value of the coefficients is quite consistent as we compare analogous models (for example, compare model 1 to models 4 and 7). But there are some shifts in significance levels. The coefficient on the environmental performance variable drops just below generally accepted significance levels in 1991 (p .10 and .11 in models 5 and 6, respectively), perhaps because of the degrees of freedom lost by splitting the data. How- ever, this variable is significant in 1992, as shown in models 8 and 9. The interaction term is significant in both 1991 and 1992. In all cases, the sig- nificance levels of the increases in variance explained follow the signifi- cance levels of the coefficients on the variables added. Our general conclu- sion, therefore, is that support for our hypotheses is robust.
CONCLUSION
In this concluding section, we return to our motivation for this study, review our results, and take a step back to try to place them in perspective. At this point, we feel it necessary to reiterate that our variables of interest do not account for more than a modest level of variation in firm performance. For example, in models 2 and 3 respectively, the variation explained rises by roughly 1 percent of the total variance and 4 percent of the explained vari-
This content downloaded from 128.223.17.193 on Fri, 4 Apr 2014 16:55:35 PMAll use subject to JSTOR Terms and Conditions
550 Academy of Management Journal June
TABLE 3 Regression Results, Individual Yearsa
1991 1992
Variable Model 4 Model 5 Model 6 Model 7 Model 8 Model 9
Constant -1.42 -1.58 -1.70 -1.62 -1.93 -1.98 (2.80) (2.80) (2.79) (3.24) (3.22) (3.18)
Firm growth rate 0.37** 0.36** 0.36** 0.26** 0.25** 0.27** (0.04) (0.04) (0.04) (0.04) (0.04) (0.04)
Advertising intensity 0.20t 0.21t 0.21t 0.26* 0.31* 0.32* (0.11) (0.11) (0.11) (0.04) (1.13) (0.13)
Firm size 0.61t 0.64t 0.66t 0.39 0.46 0.46 (0.34) (0.33) (0.33) (0.39) (0.39) (0.38)
Capital intensity -0.38 -0.41 -0.38 -0.60 -0.66t -0.74* (0.33) (0.33) (0.33) (0.38) (0.38) (0.38)
Industry concentration -0.00 -0.00 -0.01 0.00 -0.00 -0.00 (0.02) (0.02) (0.02) (0.02) (0.02) (0.02)
Industry growth rate 0.29* 0.31* 0.28* 0.85** 0.83** 0.80** (0.13) (0.13) (0.13) (0.16) (0.16) (0.15)
Environmental rating 1.13 1.10 1.60* 1.95* (0.69) (0.69) (0.77) (0.78)
Industry growth rate x 0.37t 0.76* environmental rating (0.22) (0.29) R2 .33 .34 .35 .28 .29 .31
AR2 .01 .01 .01 .02 F-test for AR2 2.66 2.78* 4.28* 6.97**
a N = 243. Standard errors are in parentheses. Significance levels are based on two-tailed tests (F-tests for AR2 are one-tailed).
t p < .10 p < .05
p < .01
ance. But given that a number of well-established control variables were entered into the equation, we consider the finding of relatively consistent patterns of significance and coefficients on our variables of interest of clear scholarly value. In the remarks that follow, we attempt to provide further insight on the issues raised, while staying within the bounds of what our data analysis yielded.
Returns to Corporate Social Performance: Inching Closer to Resolution
Wood and Jones (1995) attributed the inconsistent statistical findings on the relationship between corporate social performance and economic per- formance to "stakeholder mismatching," or comparing the economic out- come desired by one set of stakeholders (e.g., shareholders) to corporate actions desired by another set of stakeholders (e.g., environmental activists). For example, the fact that profit and corporate crime are positively correlated (Baucus & Near, 1991) might be due to the fact that such behavior often results in no traceable cost or consumer reaction.
In many settings, this interstakeholder dichotomy is a sharp one, and it
This content downloaded from 128.223.17.193 on Fri, 4 Apr 2014 16:55:35 PMAll use subject to JSTOR Terms and Conditions
1997 Russo and Fouts 551
generates equivocal findings with respect to how corporate social perfor- mance affects profits. However, we emphasize that the interests of distinct stakeholders are not orthogonal as a rule, or even necessarily aligned un- evenly. Indeed, the Economist has argued that society is entering "the era of corporate image, in which consumers will increasingly make purchases on the basis of a firm's whole role in society: how it treats employees, share- holders, and local neighborhoods" (1994: 71). Thus, to the extent that ac- tions by downstream users and consumers elicit desired corporate behavior, stakeholder interests may parallel one another. As a social issue, environ- mental concerns are somewhat unique in terms of how strongly they appear to be manifested in the marketplace. This occurs because environmental concern correlates strongly with income, and therefore with purchasing lev- els (Roper Organization, 1990). But it should be noted that since the relative influence of consumers is not democratic but is based on what they spend, marketplace outcomes will not always reflect social equity considerations.
Factors internal to firms also result in environmental concerns being a unique social issue. Our theoretical development is in broad agreement with Post (1991) and Post and Altman (1992), who argued that environmental issues are more systemic than other social issues and affect a broader con- stellation of organizational functions. In fact, the recently developed ISO 14000 international environmental management standards aim to institu- tionalize the idea of a systemic approach (Tibor & Feldman, 1996). Through- out our application of the resource-based view of the firm, this systemic dimension of environmentalism underlies our theory of how proactive poli- cies translate into internal competitive advantages. By way of contrast, a good example of a corporate social policy that lacks this systemic nature would be investment in South Africa, which would tend to be more sepa- rable from the core elements of a firm. This observation could help to explain Meznar, Nigh, and Kwok's (1994) finding that announcements of withdraw- als from South Africa resulted in losses in shareholder wealth.
Taken as a whole, our study indicates that the resource-based view of the firm can be applied fruitfully to corporate social responsibility issues. This in turn suggests a greater breadth of application for resource-based theories. Our dependent variable in this case is economic performance, but our overall thrust is consistent with a theoretical framework that could pre- dict corporate social responsiveness or choice of political strategy. Hart (1995) used such an approach, positioning social legitimacy as a perfor- mance criterion when he applied resource-based theory to corporate envi- ronmental performance. To the extent that corporate social policies are sys- temic, this view may explain the type of social complexity underlying some forms of sustainable competitive advantage.
The Moderating Influence of External Conditions on Corporate Strategy
We found evidence that the connection between environmental perfor- mance and economic performance strengthens in higher-growth industries. Although the idea that outcomes of more traditional organizational initia-
This content downloaded from 128.223.17.193 on Fri, 4 Apr 2014 16:55:35 PMAll use subject to JSTOR Terms and Conditions
552 Academy of Management Journal June
tives and strategies are partially contingent on external environments is well-established (Prescott, 1986), our study extends this notion to encom- pass environmental initiatives. The results also square with Collis and Mont- gomery's (1995) assertion that fitting internal resources to external demands is a critical strategic issue.
If in the long run the external constraints on firms are not legal or regulatory, but physical (Hart, 1985), firms will need to be even more atten- tive to those demands. Prospering under such conditions will demand in- novative thinking. Perhaps one avenue open to managers is to use their capabilities and resources to push an industry through what Shrivastava (1995b) called "eco-renewal" and find ways to improve industry growth through environmental initiatives. Such a renewal would benefit a firm not only directly, but also indirectly, by changing the nature of the competition it faces in ways that enhance returns to its resource base.
Our theory led us to believe that industry growth moderates the rela- tionship between corporate social policies and performance. Might other variables also influence this relationship? The answer almost certainly is yes. In studying the complexities of industrial change, Mitchell recognized the necessity "to treat some factors as independent in what we recognize is really a non-linear multi-equation system and probably a chaotic one at that" (1989: 227). We have made simplifying assumptions here, and subsequent research may identify other causal agents that act on our system of variables.
Identifying Research Needs
Although in our analysis, the benefits of improved corporate environ- mental behavior appear to outweigh its costs, the exact calculus of this comparison is by no means clear and demands further examination. One conspicuous research implication is that if superior environmental perfor- mance drives higher returns, researchers need to identify the full chain of variables connecting the end links. If, as we assert, company-initiated poli- cies play a role in improving economic performance, an important study could follow companies before and after important pro-environment changes, to gain insight on which policies yield the most acute bottom-line effects. Researchers are likely to find that better information on these poli- cies is needed. It would also be helpful to understand where returns to environmental performance end. That is, at some point, do resources be- come so focused on environmental issues that a firm shortchanges other key functions, such as customer service?
Research that is explicitly longitudinal would also offer benefits. If one accepts the proposition that industries generally move from high growth to lower or even negative growth (Hofer, 1975), then with respect to environ- mental performance, a logical outcome of our study is that the resource endowment of a firm will have to change accordingly, because the resource base that yields rents in the early stage may be less productive thereafter. For example, the resources represented by political strategy will need to evolve with time. This process of developing new capabilities is fraught with dif-
This content downloaded from 128.223.17.193 on Fri, 4 Apr 2014 16:55:35 PMAll use subject to JSTOR Terms and Conditions
1997 Russo and Fouts 553
ficulty, and we agree with Barney (1986) that how firms recognize the need to change key resources over time and act upon these imperatives is a subject that deserves further development.
Also poorly understood is the precise role of consumption behavior in the social performance-economic performance equation. Empirical analysis of the purchasing behavior of downstream users and consumers with respect to environmental product attributes is clearly warranted. One research proj- ect with great potential returns would be a panel study of downstream users and consumers that followed purchases across time and could track what influenced the change to and continued purchase of green products. It could also confirm how closely actions match attitudes.
Managing for Environmental Quality and Economic Performance
As noted above, a general danger with shaping a firm's resources for the long run is that industry transitions may render previously critical resources of marginal value. If, as Hart (1995) suggested, industrial society will evolve to the point where sustainable development is the norm, then technological, organizational, and human resources that serve a firm's environmental aims now should be even more valuable then. But protecting and enhancing the value of resources requires careful oversight and supportive actions. For example, a firm's pro-environment reputation demands continued invest- ment in consistency of action, so that the firm's advantage does not erode from within. As recent attacks on The Body Shop have shown (Entine, 1995), although there is considerable "unclaimed reputation 'space' with respect to corporate environmental performance" (Hart, 1995: 995), significant risks await firms that do not hold true to expressed principles.
One keystone issue for corporations is how to treat existing environ- mental standards. There is evidence that many corporations regard pollution limits as minimums and try to exceed minimal compliance levels and po- sition themselves for future changes in policy (Business Week, 1990). This would appear to be a wise strategy, as increased popular interest in the environment may translate into a tightening of standards. In fact, in the specific context of environmental regulations, the idea of trying to burden competitors with greater regulatory mandates via the pursuit of regulation that is asymmetric across competitors (Leone, 1986) could actually backfire if consumers reward consistent excellence in this regard. Furthermore, the increasing availability of environmental information "implies that the lag- gards in environmental performance will more likely suffer at the hands of consumers, while those following an effective proactive approach will thrive" (Dean, Fowler, & Miller, 1995: 12).
Another reason to go beyond compliance is that the organizational in- novation with which such a strategy is associated is well matched to the trend in environmental regulation itself. The pattern of regulatory legislation in America appears to be evolving from one of "command and control" to one that uses market-like mechanisms, such as offsets, "bubbles," and trad- able emissions permits, to achieve environmental gains (Hahn & Hester,
This content downloaded from 128.223.17.193 on Fri, 4 Apr 2014 16:55:35 PMAll use subject to JSTOR Terms and Conditions
554 Academy of Management Journal June
1989). Such a trend will benefit firms that have promoted flexibility in their approach to environmental policy, because using market tools to improve the environment allows firms to tailor their responses to their own needs and to seek innovative solutions to meeting their responsibilities. More gener- ally, however, we believe that moving aggressively toward environmental improvement will help firms to become more entrepreneurial on a number of key dimensions that we have noted above.
Cairncross labeled the rise of environmental concern "perhaps the big- gest opportunity for enterprise and invention the industrial world has ever seen" (1992: 177). We have not identified and measured every link in a complex causal chain, but our study suggests that shrewd managers have recognized this possibility and set to work assembling the organizational resources necessary to capitalize on this opportunity. Managers who instead resist and contest pressures for environmental improvement risk not only a profound loss of productive energy, but also a bottom-line loss of equal proportions.
REFERENCES
Abernathy, W. J., & Utterback, J. M. 1978. Patterns of innovation in technology. Technology Review, 80(7): 40-47.
Aiken, M., & Hage, J. 1971. The organic organization and innovation. Sociology, 5: 63-82.
Aiken, L. S., & West, S.G. 1991. Multiple regression: Testing and interpreting interactions. Newbury Park, CA: Sage.
Ashford, N. A. 1993. Understanding technological responses of industrial firms to environmen- tal problems: Implications for government policy. In K. Fischer & J. Schot (Eds.), Environ- mental strategies for industry: 277-307. Washington, DC: Island Press.
Aupperle, K., Carroll, A. B., & Hatfield, J. 1985. An empirical examination of the relationship between corporate social responsibility and profitability. Academy of Management Jour- nal, 28: 446-463.
Bain, J. S. 1959. Industrial organization. New York: Wiley.
Barney, J. 1986. Strategic factor markets: Expectations, luck, and business strategy. Manage- ment Science, 32: 1231-1241.
Barney, J. 1991. Firm resources and sustained competitive advantage. Journal of Management, 17: 771-792.
Baucus, M. S., & Near, J. P. 1991. Can illegal corporate behavior be predicted? An event history analysis. Academy of Management Journal, 34: 9-36.
Bragdon, J. H., & Marlin, J. A. T. 1972. Is pollution profitable? Risk Management, 19(4): 9-18.
Brealey, R. A., & Myers, S. C. 1991. Principles of corporate finance (4th ed.). New York: McGraw-Hill.
Buchanan, J., Tollison, R., & Tullock, G. 1980. Toward a theory of the rent-seeking society. College Station, TX: Texas A&M Press.
Burns, T., & Stalker, G. M. 1961. The management of innovation. London: Tavistock.
Business Week. 1990. The greening of corporate America. April 23: 96-103.
Cairncross, F. 1992. Costing the earth: The challenge for governments, the opportunities for business. Boston: Harvard Business School Press.
This content downloaded from 128.223.17.193 on Fri, 4 Apr 2014 16:55:35 PMAll use subject to JSTOR Terms and Conditions
1997 Russo and Fouts 555
Capon, N., Farley, J. U., & Hoenig, S. 1990. Determinants of financial performance: A meta- analysis. Management Science, 36: 1143-1159.
Cohen, M. A., Fenn, S. A., & Naimon, J. 1995. Environmental andfinancial performance: Are they related? Working paper, Owen Graduate School of Management, Vanderbilt Univer- sity, Nashville.
Collis, D. J., & Montgomery, C. A. 1995. Competing on resources: Strategy in the 1990s. Harvard Business Review, 73(4): 118-129.
Conner, K. R. 1991. A historical comparison of resource-based theory and five schools of thought within industrial organization economics: Do we have a new theory of the firm? Journal of Management, 17(1): 121-154.
Dean, T. J., & Brown, R. L. 1995. Pollution regulation as a barrier to new firm entry: Initial evidence and implications for future research. Academy of Management Journal, 38: 288-303.
Dean, T. J., Fowler, D. M., & Miller, A. 1995. Organizational adaptations for ecological sus- tainability: A resource-based examination of the competitive advantage hypothesis. Working paper, Department of Management, University of Tennessee, Knoxville.
Dechant, K., & Altman, B. 1994. Environmental leadership: From compliance to competitive advantage. Academy of Management Executive, 8(3): 7-20.
Dierickx, I., & Cool, K. 1989. Asset stock accumulation and sustainability of competitive ad- vantage. Management Science, 35: 1504-1511.
Drumwright, M. E. 1992. Socially responsible organizational buying. Working paper 92-132, Marketing Science Institute, Cambridge, MA.
Dutton, J. E., & Dukerich, J. M. 1991. Keeping an eye on the mirror: Image and identity in organizational adaptation. Academy of Management Journal, 34: 517-554.
Economist. 1994. Brand new day. June 19: 71-72.
Entine, J. 1994. Shattered image. Business Ethics Magazine, 8(5): 23-28.
Fogler, H. R., & Nutt, F. 1975. A note on social responsibility and stock valuation. Academy of Management Journal, 18: 155-160.
Fombrun, C., & Shanley, M. 1990. What's in a name? Reputation building and corporate strat- egy. Academy of Management Journal, 33: 233-258.
Franklin Research and Development Corporation. 1989. Asking the ethical questions: A guide to the social assessment ratings of Franklin Research and Development. Boston: Frank- lin Research and Development Corporation.
Freedman, M., & Jaggi, B. 1982. The SEC's pollution disclosure requirements-Are they mean- ingful? California Management Review, 24(2): 60-67.
Gingrich, N. 1995. To renew America. New York: HarperCollins.
Gladwin, T. N. 1993. The meaning of greening: A plea for organizational theory. In K. Fischer & J. Schot (Eds.), Environment strategies for industry: 37-62. Washington, DC: Island Press.
Gore, A. 1992. Earth in the balance. Boston: Houghton-Mifflin.
Grant, R. M. 1991. The resource-based theory of competitive advantage. California Manage- ment Review, 33(3): 114-135.
Groenwegen, P., & Vergragt, P. 1991. Environmental issues as threats and opportunities for technological innovation. Technology Analysis and Strategic Management, 3(1): 43-55.
Hahn, R. W., & Hester, G. L. 1989. Marketable permits: Lessons for theory and practice. Ecology Law Quarterly, 16: 361-406.
This content downloaded from 128.223.17.193 on Fri, 4 Apr 2014 16:55:35 PMAll use subject to JSTOR Terms and Conditions
556 Academy of Management Journal June
Hall, R. 1992. The strategic analysis of intangible resources. Strategic Management Journal, 13: 135-144.
Harrison, E. B. 1993. Going green. Homewood, IL: Irwin One.
Hart, S. L. 1995. A natural resource-based view of the firm. Academy of Management Review, 20: 986-1014.
Hart, S., & Ahuja, G. 1994. Does it pay to be green? An empirical examination of the rela- tionship between pollution prevention andfirm performance. Working paper, University of Michigan, Ann Arbor.
Hofer, C. W. 1975. Toward a contingency theory of business strategy. Academy of Management Journal, 18: 784-810.
Holman, W. R., New, J. R., & Singer, D. 1985. The impact of corporate social responsiveness on shareholder wealth. In L. Preston (Ed.), Research in corporate social performance and policy, vol. 7: 137-152. Greenwich, CT: JAI Press.
Holusha, J. 1995. Companies vow to consider environment in buying paper. New York Times, December 20: D5.
Huselid, M. A. 1995. The impact of human resource management practices on turnover, pro- ductivity, and corporate financial performance. Academy of Management Journal, 38: 635-672.
Ilinitch, A. Y., & Zeithaml, C. P. 1995. Operationalizing and testing Galbraith's center of gravity theory. Strategic Management Journal, 16: 401-410.
Investor Responsibility Research Center. 1995. Corporate environmental profiles. Washing- ton, DC: Investor Responsibility Research Center.
Jennings, P. D., & Zandbergen, P. A. 1995. Ecologically sustainable organizations: An institu- tional approach. Academy of Management Review, 20: 1015-1052.
Kemp, R. 1993. An economic analysis of cleaner technology: Theory and evidence. In K. Fischer & J. Schot (Eds.), Environmental strategies for industry: 79-113. Washington, DC: Island Press.
Koch, M. J., & McGrath, R. G. 1995. Improving labor productivity: Human resource management policies do matter. Strategic Management Journal, 17: 335-354.
Koen, A. D. 1992. How the public perceives the industry. Oil and Gas Journal, 90(52): 17.
Lawrence, P. R., & Lorsch, J. W. 1969. Organization and environment. Homewood, IL: Irwin.
Leone, R. A. 1986. Who profits? Winners, losers, and government regulation. New York: Basic Books.
Logsdon, J. M. 1985. Organizational responses to environmental issues: Oil refining companies and air pollution. In L. Preston (Ed.), Research in corporate social performance and policy, vol. 7: 47-71. Greenwich, CT: JAI Press.
Mahon, J. 1989. Corporate political strategy. Business in the Contemporary World, 2(1): 50-62.
McKinley & Company. 1991. The corporate response to the environmental challenge: Sum- mary report. Amsterdam: McKinsey.
Meznar, M. B., Nigh, D., & Kwok, C. C. 1994. Effect of announcements of withdrawal from South Africa on stockholder wealth. Academy of Management Journal, 37: 1633-1648.
Mitchell, W. G. 1989. Whether and when? Probability and time of incumbents' entry into emerg- ing subfields. Administrative Science Quarterly, 34: 208-230.
Murray, K. B., & Montanari, J. R. 1986. Strategic management of the socially responsible firm. Academy of Management Review, 11: 815-827.
Penrose, E. 1959. The theory of the growth of the firm. New York: Wiley.
This content downloaded from 128.223.17.193 on Fri, 4 Apr 2014 16:55:35 PMAll use subject to JSTOR Terms and Conditions
1997 Russo and Fouts 557
Piasecki, B. W. 1995. Corporate environmental strategy. New York: Wiley.
Porter, M. E. 1980. Competitive strategy. New York: Free Press.
Porter, M. E. 1991. America's green strategy. Scientific American, 264(4): 168.
Post, J. E. 1978. Corporate behavior and social change. Reston, VA: Reston Publishing Co.
Post, J. E. 1991. Managing as if the earth mattered. Business Horizons 34(1): 32-38.
Post, J. E., & Altman, B. W. 1992. Models of corporate greening: How corporate social policy and organizational learning inform leading-edge environmental management. In J.E. Post (Ed.), Research in corporate social performance and policy, vol. 13: 3-29. Greenwich, CT: JAI Press.
Prahalad, C. K., & Hamel, G. 1990. The core competence of the corporation. Harvard Business Review, 68(3): 79-91.
Prescott, J. E. 1986. Environments as moderators of the relationship between strategy and per- formance. Academy of Management Journal, 29: 329-346.
Raelin, J. A. 1984. A discriminant analysis of strategic regulatory response. In L. Preston (Ed.), Research in corporate social performance and policy, vol. 6: 71-92. Greenwich, CT: JAI Press.
Reed, R., & DeFillippi, R. 1990. Causal ambiguity, barriers to imitation, and sustainable com- petitive advantage. Academy of Management Review, 25: 88-102.
Rockness, J., Schlachter, P., & Rockness, H. 0. 1986. Hazardous waste disposal, corporate dis- closure, and financial performance in the chemical industry. In M. Neimark (Ed.), Ad- vances in public interest accounting, vol. 1: 167-191. Greenwich, CT: JAI Press.
Roper Organization. 1990. The environment: Public attitudes and individual behavior. Ra- cine, WI: S. C. Johnson & Son.
Shrivastava, P. 1995a. Environmental technologies and competitive advantage. Strategic Man- agement Journal, 16(Summer): 183-100.
Shrivastava, P. 1995b. Ecocentric management for a risk society. Academy of Management Review, 20: 118-137.
Shrum, W., & Wuthnow, R. 1988. Reputational status of organizations in technical systems. American Journal of Sociology, 93: 882-912.
Sierra Club. 1993. Sierra Club membership growth. Mimeo, Sierra Club, San Francisco.
Singh, J. V. 1986. Performance, slack, and risk taking in organizational decision making. Acad- emy of Management Journal, 29: 562-585.
Spicer, B. H. 1978a. Investors corporate social performance and information disclosure: An empirical study. Accounting Review, 53: 94-111.
Spicer, B. H. 1978b. Market risk, accounting data, and companies' pollution control records. Journal of Business, Finance, and Accounting, 5: 67-83.
Starik, M., & Rands, G. P. 1995. Weaving an integrated web: Multilevel and multisystem per- spectives of ecologically sustainable organizations. Academy of Management Review, 20: 908-935.
Teece, D. J. 1980. Contributions and impediments of economic analysis to the study of strategic management. In J. W. Frederickson (Ed.), Perspectives on strategic management: 39-80. New York: Harper Business.
Thayer, W. 1990. 10 rules for selling "green" products. Progressive Grocer, 69(8): 117-128.
Tibor, T., & Feldman, I. 1996. ISO 14000: A guide to the new environmental management standards. Chicago: Irwin.
Tosi, H. L., Jr., & Gomez-Mejia, L. R. 1994. CEO compensation monitoring and firm perfor- mance. Academy of Management Journal, 37: 1002-1016.
This content downloaded from 128.223.17.193 on Fri, 4 Apr 2014 16:55:35 PMAll use subject to JSTOR Terms and Conditions
558 Academy of Management Journal June
Ullmann, A. 1985. Data in search of a theory: A critical examination of the relationships among social performance, social disclosure, and economic performance. Academy of Manage- ment Review, 10: 540-577.
U.S. Department of Commerce. 1995. 1992 census of retail trade. Washington, DC: U.S. De- partment of Commerce.
U.S. Department of Commerce. 1992. 1987 census of manufactures. Washington, DC: U.S. Department of Commerce.
Walley, N., & Whitehead, B. 1994. It's not easy being green. Harvard Business Review, 72(3): 46-52.
Wernerfelt, B. 1984. A resource-based view of the firm. Strategic Management Journal, 5: 171-180.
White, H. 1980. A heteroscedasticity-consistent covariance matrix estimator and a direct test for heteroscedasticity. Econometrica, 48: 817-838.
White, K. J., Wong, S. D., Whistler, D., & Haun, S. A. 1990. SHAZAM user's reference manual. New York: McGraw-Hill.
Wiseman, J. 1982. An evaluation of environmental disclosures made in corporate annual re- ports. Accounting, Organizations, and Society, 7: 53-63.
Wood, D. J. 1991. Corporate social performance revisited. Academy of Management Review, 16: 691-718.
Wood, D. J., & Jones, R. E. 1995. Stakeholder mismatching: A theoretical problem in empirical research on corporate social performance. International Journal of Organizational Analy- sis, 3: 229-267.
Yoffie, D. B. 1988. How an industry builds political advantage. Harvard Business Review, 66(3): 82-89.
APPENDIX
The Development of the Environmental Ratings Used in This Study
The following are excerpts from the Franklin Research and Development Corporation's 1989 publication, which provides a concise statement of what each rating indicates. The FRDC lists these four specific questions it asks when evaluating companies:
Is the company in compliance with state and federal environmental regulations? Does it have major environmental lawsuits pending? Does it have a record of environmental contro- versy? Has it gone beyond the letter of the law in dealing with pollution problems?
Where comparative environmental studies of an industry have been conducted, how has the company performed relative to others in its industry?
What efforts has the company made in reducing the generation of hazardous wastes and in the proper disposal of those wastes it generates?
Does the company contribute to, or otherwise support, nonprofit environmental protection organizations?
We transformed the FRDC ratings to the following numbering system, under which high numbers mean better environmental performance.
5: The company has taken exceptional initiatives in environmental matters with a reputa- tion for going beyond its peers in pollution control or hazardous waste reduction. The company has shown unusually strong support for environmental organizations.
4: The company has demonstrated a strong concern in limited areas for the environment. It has no major environmental controversies pending. It has been moderately supportive of envi- ronmental organizations.
3: The company has an environmental record that is mixed, distinguishes itself neither
This content downloaded from 128.223.17.193 on Fri, 4 Apr 2014 16:55:35 PMAll use subject to JSTOR Terms and Conditions
1997 Russo and Fouts 559
positively nor negatively on the environment, or is not in an industry with substantial envi- ronmental challenges.
2: The company has an environmental record characterized by occasional major environ- mental controversy or litigation. It has fared poorly in environmental studies of its industry.
1: The company has a consistent history of pollution control or other environmental prob- lems. The company is currently at the center of a major environmental controversy where the responsiveness of its actions are questionable. It has taken few or no steps to support environ- mental organizations.
Michael V. Russo is an associate professor of management at the Charles H. Lundquist College of Business at the University of Oregon. He earned his Ph.D. degree in business administration from the University of California, Berkeley. His current research focuses on the cross influences between business strategy and the sociopolitical domain, with special reference to the management of environmental issues.
Paul A. Fouts is an assistant professor of strategic management at Golden Gate Univer- sity. He received his Ph.D. degree from the University of Oregon. His current research is focused on technology evolution and strategy, interorganizational relationships, and organizational adaptation.
This content downloaded from 128.223.17.193 on Fri, 4 Apr 2014 16:55:35 PMAll use subject to JSTOR Terms and Conditions