Embed Size (px)
Citation preview
Editor: Trond Randøy, Agder University College, Norway
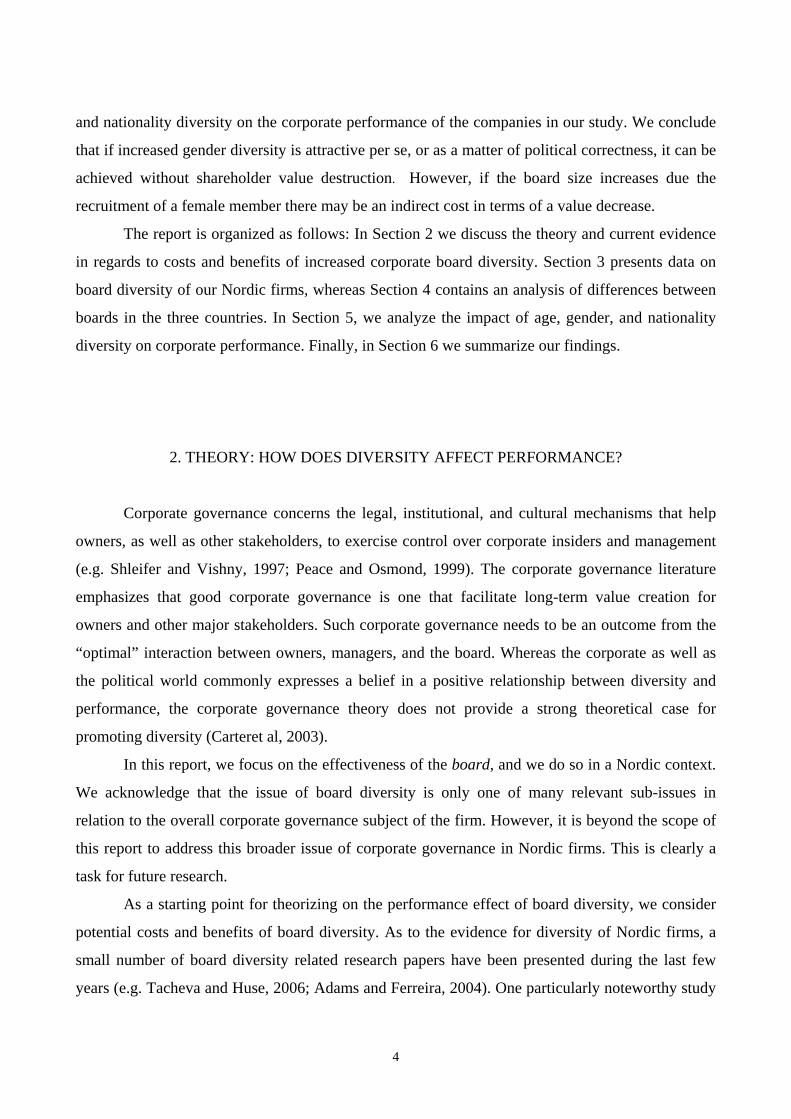
A Nordic perspective on corporate board diversity
November 2006
• Analysis of board diversity and its impact on corporate performance in the 500 largest companies in Denmark, Norway and Sweden
• No significant diversity effect of gender, age, and nationality on stock market performance or on ROA
Authors
Trond Randøy
Agder University College
School of Management
Serviceboks 422, Bygg H
N-4604 Kristiansand, NORWAY
Phone (47) 38141525
Fax (47) 3814 1028
E-mail: [email protected]
Steen Thomsen
Copenhagen Business School
Department of International Economics and
Management
Howitzvej 60, 2000 Copenhagen F, DENMARK.
E-mail: [email protected]
Lars Oxelheim
Lund Institute of Economic Research
Lund University P.O.Box 7080, 220 07 Lund,
Sweden.
E-mail: [email protected]
and
The Research Institute of Industrial Economics
P.O. Box 55665, 102 15 Stockholm, SWEDEN
E-mail: [email protected]
I
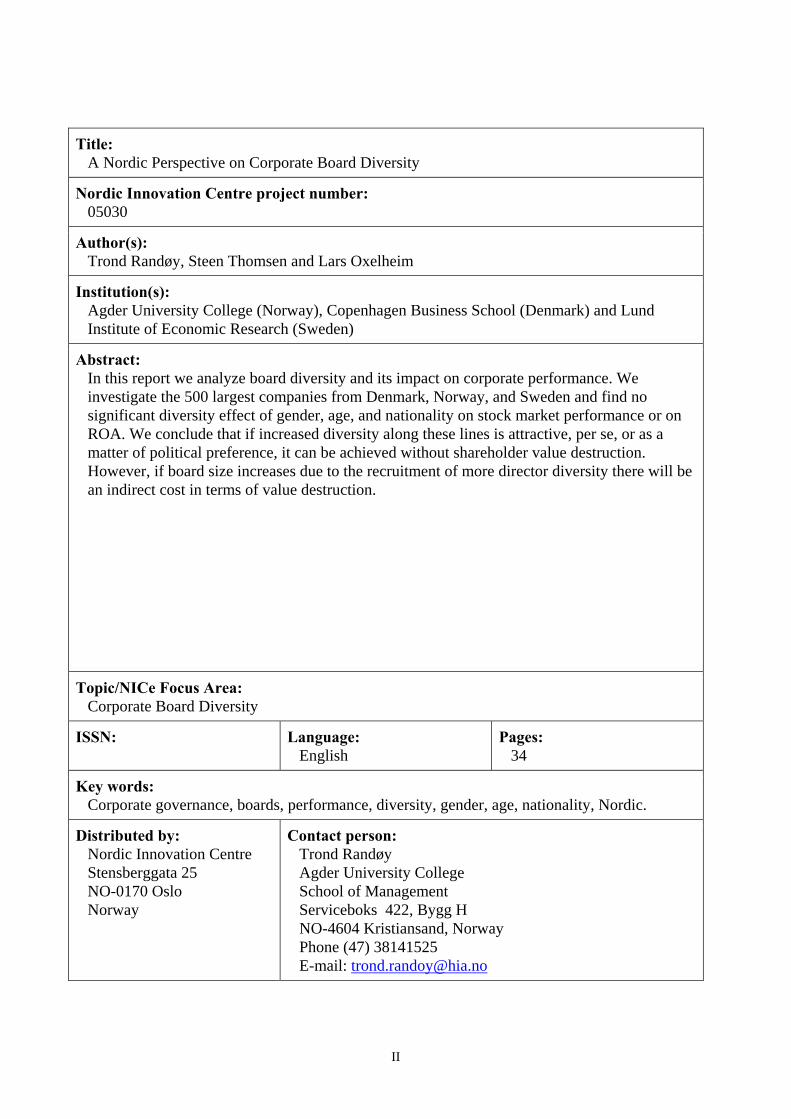
Title: A Nordic Perspective on Corporate Board Diversity
Nordic Innovation Centre project number: 05030
Author(s): Trond Randøy, Steen Thomsen and Lars Oxelheim
Institution(s): Agder University College (Norway), Copenhagen Business School (Denmark) and Lund Institute of Economic Research (Sweden)
Abstract: In this report we analyze board diversity and its impact on corporate performance. We investigate the 500 largest companies from Denmark, Norway, and Sweden and find no significant diversity effect of gender, age, and nationality on stock market performance or on ROA. We conclude that if increased diversity along these lines is attractive, per se, or as a matter of political preference, it can be achieved without shareholder value destruction. However, if board size increases due to the recruitment of more director diversity there will be an indirect cost in terms of value destruction.
Topic/NICe Focus Area: Corporate Board Diversity
ISSN:
Language: English
Pages: 34
Key words: Corporate governance, boards, performance, diversity, gender, age, nationality, Nordic.
Distributed by: Nordic Innovation Centre Stensberggata 25 NO-0170 Oslo Norway
Contact person: Trond Randøy Agder University College School of Management Serviceboks 422, Bygg H NO-4604 Kristiansand, Norway Phone (47) 38141525 E-mail: [email protected]
II
EXECUTIVE SUMMARY
In this report we analyze board diversity and its impact on corporate performance. We
investigate the 500 largest companies from Denmark, Norway, and Sweden. This report reveals that
Scandinavian boards are surprisingly homogenous in terms of gender and nationality, whereas the
age distribution is more diverse. The low level of board diversity in terms of gender and nationality
in the Scandinavian countries seems puzzling given the participation of women in the workforce
and the internationalization of the work force of Nordic firms.
We find substantial differences in board diversity among the Scandinavian countries. Board
members tend to be older and less diverse in Denmark than in the other two Scandinavian countries.
High gender diversity in Norway and Sweden probably reflects political priorities (e.g. the
Norwegian quota). However, the very low fraction of women on Danish boards seems puzzling
given the general perception of a highly egalitarian nation.
Apart from the differences between the Scandinavian countries, board diversity in
Scandinavia is influenced mainly by industry effects and company size. Contrary to a common
popular myth, we must reject the notion that diversity is lacking because of a self-selecting “old
boys’” network. The number of board connections of the Chair (a closed network) and the average
age (older) of the board do not influence board diversity.
This study finds that board diversity is not significantly related to company performance in
2005 (regarding stock market valuation and profitability). This is true for all of our diversity
measures and for an overall diversity index. This suggests that increasing diversity of Nordic
boards is no “quick fix” to enhance firm performance. However, we note that the greater board
diversity of Scandinavian firms do not produce lower firm performance, which suggests that
enhanced board diversity, as a deliberate choice or as forced by law, can be achieve without a
negative effect on firm performance and shareholder return. But, in case it means an expansion of
the size of the board, value destruction may follow.
We consider this project a first effort, and as such, the findings need to be presented and
discussed in the broader international research community. This also implies that our research
findings, at this stage, are premature as a basis for policy making. Further work is particularly
needed on alternative methodological techniques as the result can be sensitive to model
specification. We also see the need to address the effect of board diversity on a broader set of
corporate governance mechanisms, such as ownership and incentive structures of the firm.
III

IV
PREFACE
This research report is a first attempt to empirically address the effect of board diversity in a cross-Nordic
setting. We started the project during the fall of 2005 and this first report should be seen as a point of
departure for further research on this issue in a Nordic context. We acknowledge the support from Nordic
Innovation Centre and our respective research institutions.
Trond Randøy Steen Thomsen Lars Oxelheim
Agderforskning/Agder University College Copenhagen Business School Lund University/RIIE
November 2006.
V
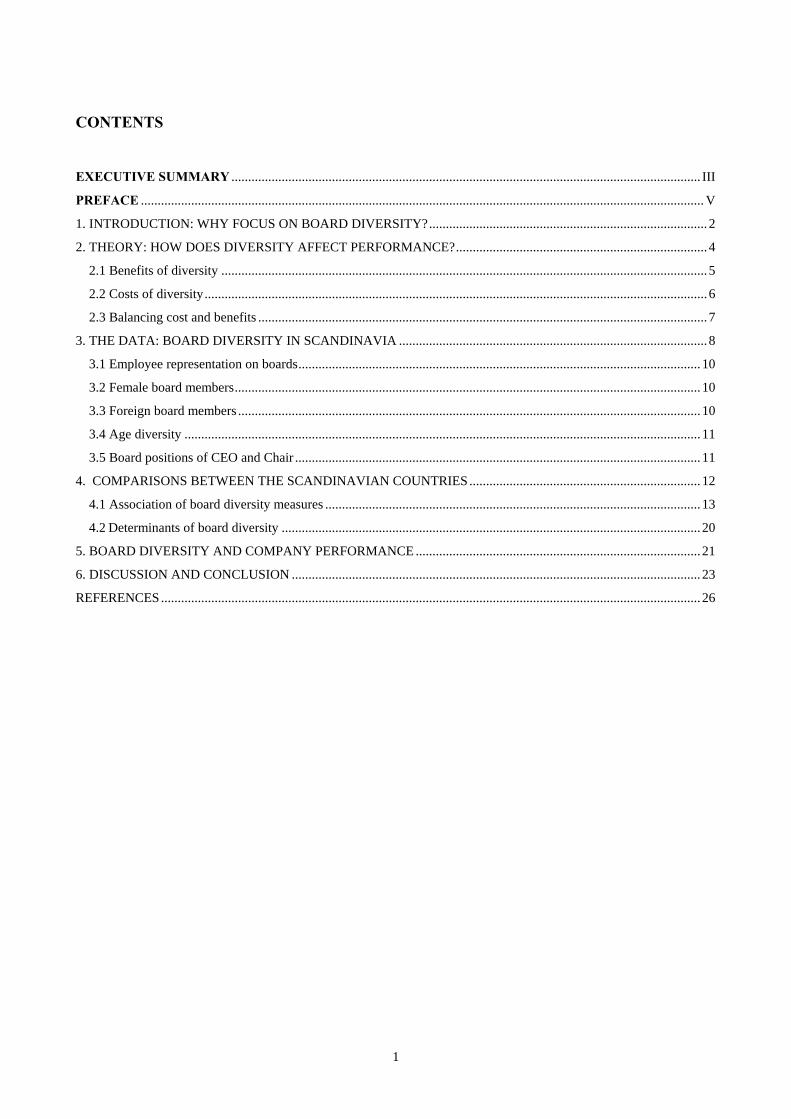
CONTENTS
EXECUTIVE SUMMARY ............................................................................................................................................ III PREFACE ........................................................................................................................................................................ V 1. INTRODUCTION: WHY FOCUS ON BOARD DIVERSITY?................................................................................... 2 2. THEORY: HOW DOES DIVERSITY AFFECT PERFORMANCE?........................................................................... 4
2.1 Benefits of diversity ................................................................................................................................................. 5 2.2 Costs of diversity...................................................................................................................................................... 6 2.3 Balancing cost and benefits ...................................................................................................................................... 7
3. THE DATA: BOARD DIVERSITY IN SCANDINAVIA ............................................................................................ 8 3.1 Employee representation on boards........................................................................................................................ 10 3.2 Female board members........................................................................................................................................... 10 3.3 Foreign board members .......................................................................................................................................... 10 3.4 Age diversity .......................................................................................................................................................... 11 3.5 Board positions of CEO and Chair ......................................................................................................................... 11
4. COMPARISONS BETWEEN THE SCANDINAVIAN COUNTRIES..................................................................... 12 4.1 Association of board diversity measures ................................................................................................................ 13 4.2 Determinants of board diversity ............................................................................................................................. 20
5. BOARD DIVERSITY AND COMPANY PERFORMANCE ..................................................................................... 21 6. DISCUSSION AND CONCLUSION .......................................................................................................................... 23 REFERENCES................................................................................................................................................................. 26
1
A NORDIC PERSPECTIVE ON CORPORATE BOARD DIVERSITY
1. INTRODUCTION: WHY FOCUS ON BOARD DIVERSITY?
In the aftermath of the large corporate scandals during the beginning of this decade (such as
Enron, Worldcom in the US and Parmalat, Ahold in Europe), a number of practitioners have called
for more board diversity. In addition to improved monitoring via board independence, there are also
arguments for greater diversity related to enhanced innovation capability, better global
understanding, and better understanding of diverse customer needs (Daily and Dalton, 2003;
Robinson and Dechant, 1997). Furthermore, public demand for more board diversity, both in the
U.S. (e.g., TIAA-CREF, 1997) and in Europe, has become widespread during the last decade. Thus,
TIAA-CREF, one of the largest pension funds in the U.S. and an opinion leader in corporate
governance, argued nine years back that boards should be filled by “qualified individuals who
reflect diversity of experience, gender, race and age”(TIAA-CREF, 1997).
Whereas the Conference Board (Brancato and Patterson, 1999) and other institutions
emphasize that diversity should make sense from a shareholder point of view, others would
emphasize that diversity is a goal in itself (e.g., Bilimoria and Huse, 1997). A fierce debate has
emerged in the Nordic1 countries concerning the pros and cons for increased gender diversity and
about the potential role of politicians/regulators in achieving it. This makes the region particularly
interesting for empirical testing of the effect of board diversity. Furthermore, the political
implications vary extensively across the region. In Norway the equity argument has become law,
and Norwegian public firms (The “ASA”-firms) are required to have a 40% minimum board
representation (among shareholder appointed board members) from each gender by the end of 2006.
If an individual company does not meet this requirement within due time forced deregistration of
the firm will result. A similar law was proposed in Sweden, but the change of government in the
fall of 2006 led to a withdrawal of the proposed law.
The empirical evidence on the performance effect of board gender diversity is mixed. For
example, one U.S. study identifies a negative relationship between the percentage of female
1 In this first report we focus on Denmark, Norway and Sweden - the Scandinavian countries - leaving Finland and Island outside the scope of it.
2
directors and accounting performance (Shrader, et al 1997), and another study finds for Norwegian
firms a negative relationship between female board membership and market-to-book ratio (Bøhren
and Strøm, 2006). However, other studies find no relationship (e.g., Zahra and Stanton, 1988) or a
positive performance effect from such female board membership (e.g., Carter et al, 2003; Smith et
al 2005). There are number of possible explanations for the inconclusive empirical results. First, the
studies are conducted in different countries and at different points in time, and the effect of board
diversity might be contingent on the timing and the legal/cultural context (which has only partly
been addressed in the research design of past studies). Second, the effect of gender diversity might
be a substitute for other aspects of board diversity, such as age and nationality diversity, which need
to be part of the research design. Third, empirical testing of the performance effect of gender
diversity is methodologically challenging.
In the current study we address these issues when assessing the effect of board diversity
among the 500 largest firms in Scandinavia. In addition to exploring the magnitude of this diversity,
the major objective of this study is to explore the financial implications of board diversity. This
implies that we do not address the issue of equity and board diversity. Our motivation is not that
financial performance is the only or even the most relevant measure, but rather that it is interesting
in its own right to examine whether board diversity passes the market test (e.g. whether the
financial markets encourage or punish board diversity). Thus even when greater diversity is
advocated for moral or political reasons it is still interesting to inquire how it is perceived by the
stock market. Another motivation is that more empirical evidence is needed. A shortcoming of past
research is the dominance of research on strictly Anglo-American markets (i.e. countries with a
“market-based” system of corporate governance that emphasize shareholder primacy). The greater
“stakeholder” orientation of corporate governance in Nordic firms might suggest that corporate
boards, and thus board diversity, play a different and more significant role in these countries.
Moreover, most existing research has relied on simple regression models and thus implicitly relied
on the assumption that board diversity is exogenous (valuable exceptions include Hermalin and
Weisbach, 2000; and Carter et al., 2003). We acknowledge that board diversity may well be an
endogenous variable that is influenced by economic factors and that our results should be
interpreted in light of that.
As for our results, we find significant differences between the magnitude of diversity of
corporate boards in Denmark, Norway, and Sweden. Board members of Danish firms are
significantly older and less diverse than in the two other countries. We find no effect of gender, age,
3
and nationality diversity on the corporate performance of the companies in our study. We conclude
that if increased gender diversity is attractive per se, or as a matter of political correctness, it can be
achieved without shareholder value destruction. However, if the board size increases due the
recruitment of a female member there may be an indirect cost in terms of a value decrease.
The report is organized as follows: In Section 2 we discuss the theory and current evidence
in regards to costs and benefits of increased corporate board diversity. Section 3 presents data on
board diversity of our Nordic firms, whereas Section 4 contains an analysis of differences between
boards in the three countries. In Section 5, we analyze the impact of age, gender, and nationality
diversity on corporate performance. Finally, in Section 6 we summarize our findings.
2. THEORY: HOW DOES DIVERSITY AFFECT PERFORMANCE?
Corporate governance concerns the legal, institutional, and cultural mechanisms that help
owners, as well as other stakeholders, to exercise control over corporate insiders and management
(e.g. Shleifer and Vishny, 1997; Peace and Osmond, 1999). The corporate governance literature
emphasizes that good corporate governance is one that facilitate long-term value creation for
owners and other major stakeholders. Such corporate governance needs to be an outcome from the
“optimal” interaction between owners, managers, and the board. Whereas the corporate as well as
the political world commonly expresses a belief in a positive relationship between diversity and
performance, the corporate governance theory does not provide a strong theoretical case for
promoting diversity (Carteret al, 2003).
In this report, we focus on the effectiveness of the board, and we do so in a Nordic context.
We acknowledge that the issue of board diversity is only one of many relevant sub-issues in
relation to the overall corporate governance subject of the firm. However, it is beyond the scope of
this report to address this broader issue of corporate governance in Nordic firms. This is clearly a
task for future research.
As a starting point for theorizing on the performance effect of board diversity, we consider
potential costs and benefits of board diversity. As to the evidence for diversity of Nordic firms, a
small number of board diversity related research papers have been presented during the last few
years (e.g. Tacheva and Huse, 2006; Adams and Ferreira, 2004). One particularly noteworthy study
4
has been performed by Bøhren and Strøm (2006). They emphasize how board effectiveness is a
product of incentive alignment (boards’ ownership), information access (network), and decisiveness
(board diversity). However, their study was limited to Norway and focused on older data (1989-
2002), but with impressive data coverage for that time period. After 2002, we have witnessed an
increased involvement from governments in Norway and Sweden to make firms, whether
voluntarily or by law enforcement, recruit more female board members, which motivates a study on
recent data in a Nordic context.
2.1 Benefits of diversity
Resource dependency theory addresses how a board might facilitate access to valuable
resources. The emphasis is on a firm’s ability to form links to secure access to critical resources,
such as capital, customers, suppliers, or cooperative partners (Alexander et al., 1993; Mintzberg,
1983; Pfeffer, 1981; Pfeffer and Salancik, 1978). Thus, resource dependence theory addresses the
potential for synergy between managers and owners. Stiles (2001) specifically suggests that board
diversity might boost access to critical resources, which should suggest a positive performance
impact of diversity as it relates to age, gender, and nationality. For example, a more diverse board
could benefit from a greater understanding of its customers (Carter et al., 2003) or other key
stakeholders. Increased diversity means more information sources to tap, but at the expense of
lower decisiveness. Recent management research has highlighted that board diversity might
enhance boards’ task performance, such as the board roles of service/advise, monitoring, and
resource access (Daily and Dalton, 2003). However, for gender diversity, Techeva and Huse (2006)
failed to identify such an effect among Norwegian boards. In fact, they found a significant negative
effect of female board membership on board tasks of service/advise and financial control. On the
other hand, Adams and Ferreira (2004) found that female board membership increased overall
board meeting attendance among U.S. boards.
Research on group performance provides insights that might be applicable to board issues.
Hoffman and Maier (1961) suggest that group diversity would enhance the overall problem-solving
capacity. This indicates that the best performing team (board) should have members that represent
variation in terms of gender, age, and nationality. However, the conclusions from the empirical
research on heterogeneity and performance are not clear (e.g. an overview given by Hambrick,
1994). For example, Distefano and Maznevski (2000) find that cross-cultural teams are more
creative and generate additional and better alternative solutions, but the average performance is not
5
significantly higher for more cross-cultural teams. In fact, the performance variation is higher for
teams with greater cultural diversity.
Agency theory addresses how board composition might help to align the interest of more or
less absent owners (the typical share owner in Scandinavia) with that of powerful and sometime
opportunistic executives (e.g. Eisenhardt, 1989; Fama and Jensen, 1983). In order to reduce the
conflicts of interest between absent owners and insightful CEOs, agency theory suggests a number
of indirect ways to alleviate agency costs. These remedies can take the form of smaller boards
(Yermack, 1996), a higher degree of board independence (Rosenstein and Wyatt, 1990; Cotter &
Shivdasani, 1997), board ownership (Schleifer and Vishny, 1997; Bøhren and Strøm, 2006), or
CEO part-ownership (McConnell and Servaes, 1990). The CEO is a member of the board in only
1/3 of Norwegian firms whereas in Sweden such a membership is more of a rule than an exception.
An agency rationale for diversity is that board diversity may increase board independence,
which is needed to reduce the potential problems of CEO-dominated boards (Mace, 1971).
Specifically, the CEO may be less able to manipulate a more heterogeneous board. This issue is
particularly important in small Nordic countries with a limited pool of board candidates, in which
conflicts of interest can easily arise in connection with interlocking board membership (Oxelheim
and Randøy, 2003). By increasing the independence of the board, through the inclusion of foreign
board members, one should expect to see reduced CEO entrenchment. With many outside board
members sitting on several boards, a number of companies may have been experiencing or even
expecting conflicts of interest among their board members. This makes it more difficult to achieve a
well-functioning domestic labor market for board members. In light of the above argument, we
suggest that the inclusion of foreign board members signals that the power of the “old-boys’”
network is being eroded, which in turn will manifest itself in a growing inclination on the part of
the board to emphasize truth and frankness in serving their shareholders.
2.2 Costs of diversity
Studies in social psychology have found that the level of group loyalty depends on the
similarity of group members. Thus, board diversity may reduce teamwork effectiveness because of
lower group loyalty. Athey, Avery, and Zemsky (2000) emphasize that mentoring is more likely to
occur between similar individuals. Kanter (1977) proposed that trust is facilitated by similarity in
top management teams. She emphasized that team member trust may be more advantageous when
6
environmental uncertainty is high (see also Adams and Ferreira, 2002), but more difficult to
achieve. The implication could be that board diversity is more “costly” among high-tech firms and
firms in transition, but also potentially more valuable.
Likewise the social choice literature has found higher costs of collective decision making
when the decision-makers are heterogeneous (Arrow, 1951). Board diversity may necessitate
longer, less efficient board meetings, the probability of ambiguities, misunderstandings and
decision errors may increase, and conflicts of interest may be more likely to occur.
In addition to lowering the decisiveness of boards, increased diversity can also make boards
less efficient and resolute in monitoring. Thus, the grandfather of agency theory, Michael Jensen
(1993), argues that “suggestions to model the board after a democratic political model in which
various constituencies are represented are likely to make the process even weaker.”
2.3 Balancing cost and benefits
An efficient board nomination committee may be expected to balance costs and benefits of
diversity in order to include a suitable mix of new members that can provide valuable information,
but maintain sufficient homogeneity for effective decision-making. This balance would depend on
industry- and firm-specific conditions, such as information needs, efficient use of authority
(willingness to accept hierarchies), performance-related pay, or board culture (Adams and Ferreira
2002). In general, if firms tend to adopt efficient board structures we would not expect to observe
any significant relationship between board structure and economic performance. For example, if
firms could increase their market value by nominating more diverse boards, they would tend to do
so. Expectations concerning observable relationships between board diversity and a firm’s value
must therefore rely on factors that could cause deviations from efficiency.
One such factor could be inertia based on prejudice. Sociological institutional theories
suggest that organizations may, for long periods of time, operate according to myths or business
recipes that are not founded on financial efficiency (Meyer and Rowan, 1977). If boards
discriminate against certain groups based on pure prejudice or other grounds not motivated by
economic performance, this implies possibilities for arbitrage since valuable human capital is not
put to efficient use. Ceteris Paribus, firms that break the ice should therefore have an advantage,
which could be reflected in higher expected returns.
Another important factor in this respect is possible conflicts of interest between
organizational performance and board group goals (Jensen and Meckling, 1976; Peled, 1997).
7
Board diversity may make board work more complex, unsettle existing power structures, and
weaken the bargaining power of the board vis-à-vis shareholders and other influential stakeholders.
The incumbent board may therefore resist increasing diversity even in cases where this might
improve organizational and financial performance.
Another potential explanation for the “lack of diversity” might be the lack of information on
the effect of diversity. Whereas the concept of board diversity has been championed in the business
literature, nomination committees have had to make the difficult choice of the specific kind of
diversity that is being promoted (gender, age, educational background, nationality, immigrants,
etc.). Given the uncertainty of their task, nomination committees might be reluctant to press
forward with more board diversity.
3. THE DATA: BOARD DIVERSITY IN SCANDINAVIA
The data for this report is taken from the 459 largest publicly traded firms in Scandinavia, of which
we have 154 firms from Denmark, 144 firms from Norway, and 161 firms from Sweden. In a
univariate context we will present data in accordance with these numbers. Due to non-response on
some of our variables, we only have complete observations from 100 firms from Denmark, 86 from
Norway, and 157 from Sweden. Hence, in a multivariate context, we may sometimes have to base
the calculation on 343 observations. We have found no systematic pattern for non-responding firms
that may matter to the interpretation of our results.
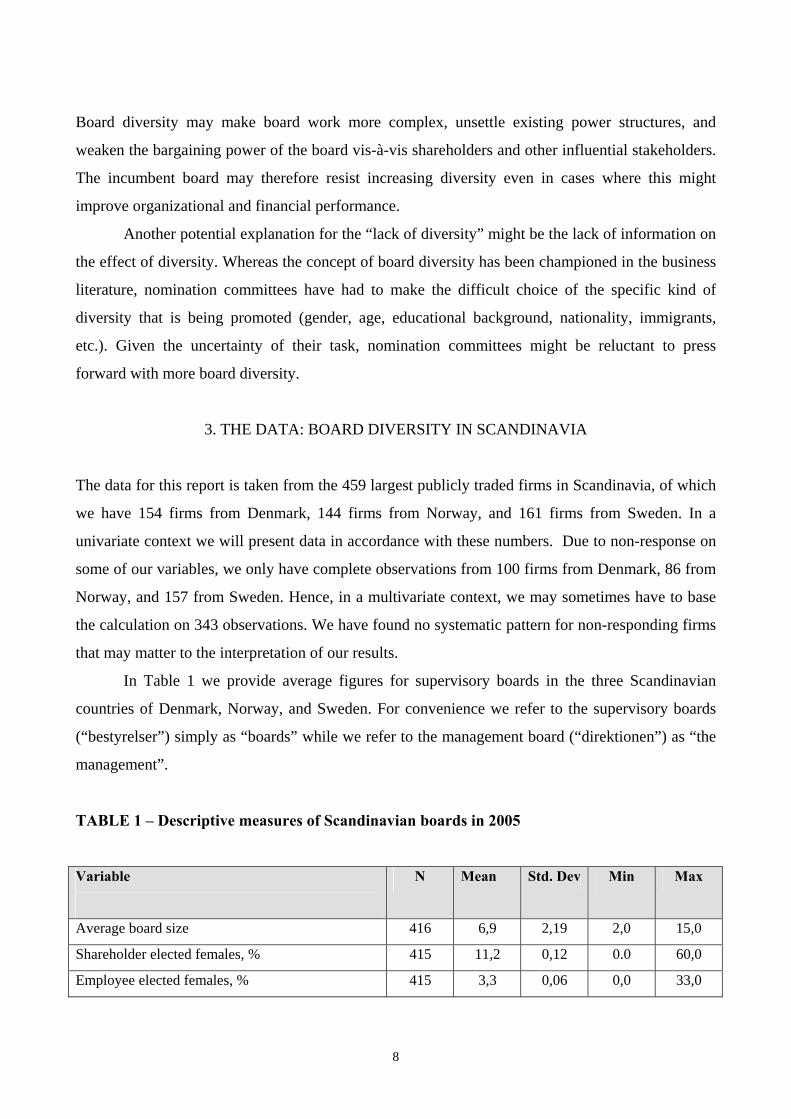
In Table 1 we provide average figures for supervisory boards in the three Scandinavian
countries of Denmark, Norway, and Sweden. For convenience we refer to the supervisory boards
(“bestyrelser”) simply as “boards” while we refer to the management board (“direktionen”) as “the
management”.
TABLE 1 – Descriptive measures of Scandinavian boards in 2005
Variable
N Mean Std. Dev Min Max
Average board size 416 6,9 2,19 2,0 15,0
Shareholder elected females, % 415 11,2 0,12 0.0 60,0
Employee elected females, % 415 3,3 0,06 0,0 33,0
8
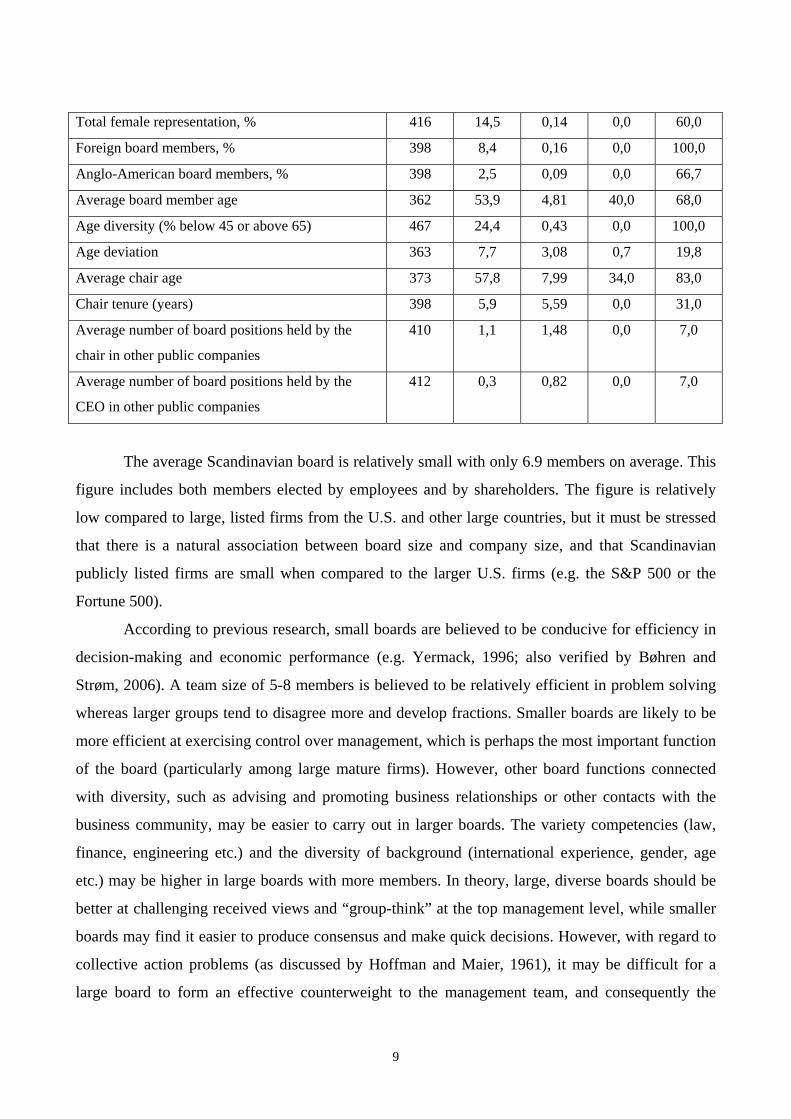
Total female representation, % 416 14,5 0,14 0,0 60,0
Foreign board members, % 398 8,4 0,16 0,0 100,0
Anglo-American board members, % 398 2,5 0,09 0,0 66,7
Average board member age 362 53,9 4,81 40,0 68,0
Age diversity (% below 45 or above 65) 467 24,4 0,43 0,0 100,0
Age deviation 363 7,7 3,08 0,7 19,8
Average chair age 373 57,8 7,99 34,0 83,0
Chair tenure (years) 398 5,9 5,59 0,0 31,0
Average number of board positions held by the
chair in other public companies
410 1,1 1,48 0,0 7,0
Average number of board positions held by the
CEO in other public companies
412 0,3 0,82 0,0 7,0
The average Scandinavian board is relatively small with only 6.9 members on average. This
figure includes both members elected by employees and by shareholders. The figure is relatively
low compared to large, listed firms from the U.S. and other large countries, but it must be stressed
that there is a natural association between board size and company size, and that Scandinavian
publicly listed firms are small when compared to the larger U.S. firms (e.g. the S&P 500 or the
Fortune 500).
According to previous research, small boards are believed to be conducive for efficiency in
decision-making and economic performance (e.g. Yermack, 1996; also verified by Bøhren and
Strøm, 2006). A team size of 5-8 members is believed to be relatively efficient in problem solving
whereas larger groups tend to disagree more and develop fractions. Smaller boards are likely to be
more efficient at exercising control over management, which is perhaps the most important function
of the board (particularly among large mature firms). However, other board functions connected
with diversity, such as advising and promoting business relationships or other contacts with the
business community, may be easier to carry out in larger boards. The variety competencies (law,
finance, engineering etc.) and the diversity of background (international experience, gender, age
etc.) may be higher in large boards with more members. In theory, large, diverse boards should be
better at challenging received views and “group-think” at the top management level, while smaller
boards may find it easier to produce consensus and make quick decisions. However, with regard to
collective action problems (as discussed by Hoffman and Maier, 1961), it may be difficult for a
large board to form an effective counterweight to the management team, and consequently the
9
positive potential of board diversity never materializes.
Let us now turn to various types of corporate board diversity.
3.1 Employee representation on boards
Early on, the Nordic countries did force increased diversity by introducing laws about
employee representation in boards. In Norway, employees in firms with more than two hundred
employees have the right to elect 1/3 of the directors. The other two countries’ similar rules
illustrate one way to increase the female representation on the board of Nordic firms. Employee
representation adds both to the size and the diversity of boards. In addition to this direct effect,
employee board members may also produce indirect effects on board composition. Shareholders
may feel that the “social” functions of the board are already filled by employee representation, and
employee representation may make them more reluctant to an increased size of the board. On the
other hand, it may also be that employee representation fosters more acceptance of diversity among
shareholder elected board members.
3.2 Female board members
In our 448 Scandinavian firms 14.5% of the board members are women, most of them
(11.3%) elected by shareholders. Therefore, the ratio of female to male board members is roughly
1:7, which is of course a significant deviation from equality, or 1:1. This finding, which is in
accordance with previous studies, is surprising given the progressive and equality-seeking self-
image of the Scandinavian countries. In terms of corporate governance, inequality is a problem if it
implies a biased selection of board members in which the most competent members are not elected.
3.3 Foreign board members
The fraction of foreign board members, 8.4%, is also relatively low, particularly given that
most of the publicly listed firms in Scandinavia do most of their business internationally, and that a
significant number of their employees are international. Despite the importance of the English
speaking world to international business and finance, only 2.5% of the board members are Anglo-
American. As will be seen in the next section, Norway stands out with 5% of the board members
from Anglo-American countries. It should also be noted that the employee representation system, in
which employee representatives are elected by the domestic employees only, discriminates against
foreign board membership.
10
The potential advantages of foreign board membership are numerous. First, a larger stock of
qualified candidates would be available for the board (i.e. with broader industry experience).
Second, because of their different backgrounds, foreign members can add valuable and diverse
expertise which domestic board members do not posses. Foreign board members can also help
assure foreign minority investors that the company is managed professionally in their best interests
(as suggested by Oxelheim and Randøy, 2003). However, there are, of course, counter-arguments.
For example, foreign board members may be less informed about domestic affairs and therefore be
less effective. Moreover, most Nordic board members possess considerable international business
expertise. Finally, changing the board language to fit foreign board members may be costly and add
to adjustment problems. It is therefore an empirical question whether the low fraction of
international board members presents a problem in itself.
3.4 Age diversity
Our surveys show considerable age diversity among Scandinavian firms. The average
Scandinavian board member in a listed firm was 53.9 years old, while the typical Chair was a few
years older (57.8 years old). The age dispersion (standard deviation) was 7.7 indicating that the
typical board member was in the span of 7.7 years older or younger than the average. Almost a
quarter of the boards (24.4%) are younger than 45 or older than 65, on average. Given that solid
business experience is believed to contribute to board members’ competencies, it is not surprising
that board members tend to be in their fifties.
Chairs will usually be older than ordinary board members as they often come into their
position by being a promoted board member. The average board membership tenure for a Chair is
5.4 years, which is not surprisingly high, since board members realistically require a few years of
experience to get to know the company. In some cases, the Chair has been in the same position for a
very long time, up to a maximum tenure of 25 years, but the average figures do not seem alarming.
3.5 Board positions of CEO and Chair
Finally, the average number of board positions in other listed companies held by the Chair
and the CEO are quite limited – 1.1 for the Chair and 0.3 for the CEO. The maximum number of
positions is seven for both categories. Typically CEOs or Chairs have only one other board
position. In other words, the formal ties between listed companies in Scandinavia tend to be quite
weak. Bøhren and Strøm (2006) identified a positive performance effect from having well
11
connected board members, which might indicate that Scandinavian firms can benefit from more
inter-connected boards.
Summing up, Scandinavian boards are surprisingly homogenous in terms of gender and
nationality, whereas the age distribution seems reasonable. We do not find evidence of a strong “old
boys’” network or of excessive inertia among the board chairs.
4. COMPARISONS BETWEEN THE SCANDINAVIAN COUNTRIES
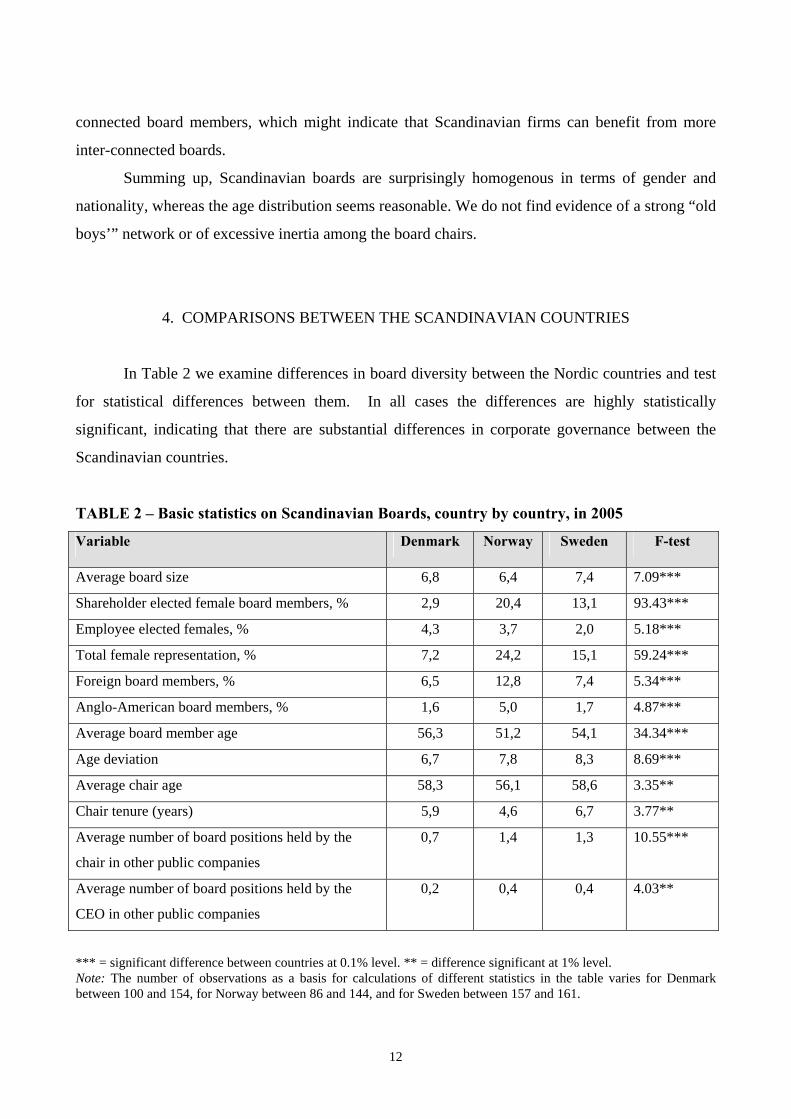
In Table 2 we examine differences in board diversity between the Nordic countries and test
for statistical differences between them. In all cases the differences are highly statistically
significant, indicating that there are substantial differences in corporate governance between the
Scandinavian countries.
TABLE 2 – Basic statistics on Scandinavian Boards, country by country, in 2005
Variable Denmark Norway Sweden F-test
Average board size 6,8 6,4 7,4 7.09***
Shareholder elected female board members, % 2,9 20,4 13,1 93.43***
Employee elected females, % 4,3 3,7 2,0 5.18***
Total female representation, % 7,2 24,2 15,1 59.24***
Foreign board members, % 6,5 12,8 7,4 5.34***
Anglo-American board members, % 1,6 5,0 1,7 4.87***
Average board member age 56,3 51,2 54,1 34.34***
Age deviation 6,7 7,8 8,3 8.69***
Average chair age 58,3 56,1 58,6 3.35**
Chair tenure (years) 5,9 4,6 6,7 3.77**
Average number of board positions held by the
chair in other public companies
0,7 1,4 1,3 10.55***
Average number of board positions held by the
CEO in other public companies
0,2 0,4 0,4 4.03**
*** = significant difference between countries at 0.1% level. ** = difference significant at 1% level. Note: The number of observations as a basis for calculations of different statistics in the table varies for Denmark between 100 and 154, for Norway between 86 and 144, and for Sweden between 157 and 161.
12
In terms of board size, we find relatively small systematic differences between the three
countries. Swedish boards are a little larger reflecting the larger size of the average publicly traded
Swedish company.
As is found in the table above, gender diversity varies significantly. At the end of 2005, the
fraction of shareholder elected female board members was around 20% in Norway, partly as a
result of the gender quota imposed by the government. In Sweden it was considerably lower at
13.1%, and in Denmark as low as 2.9%. The mysteriously low figure for Denmark invites several
corporate governance questions, one of which, for example, concerns the efficiency of the
nomination processes for new board members.
Denmark is also in at the bottom in terms of foreign board membership with 6.5%, which is
less than in Sweden (7.4%) but roughly only half of the Norwegian figure (12.8%). Since all three
countries are highly internationalized, these country differences also invite further research. The
low figure of foreign board membership is striking given the evidence that, in particular, Anglo-
American board membership might lead to lower agency costs and higher firm value (Oxelheim
and Randøy, 2003).
The age deviation is also lower in Denmark than in the other two Scandinavian countries.
Moreover, the board members in Denmark are, on average, typically 5 years older than in Norway.
The gender quota imposed in Norway is part of the explanation for the lower age of Norwegian
board members as nomination committees have limited number of experienced female board
members to choose from.
Board ties tend to be very similar in Norway and Sweden, but much weaker in Denmark. It
is somewhat surprising, yet consistent with previous research, that Danish boards are less
connected.
Altogether, we find substantial differences in board diversity among the Scandinavian
countries. Particularly, board members tend to be older and less diverse in Denmark than in the
other two Scandinavian countries.
4.1 Association of board diversity measures
In Tables 4.1-4.4 we examine associations between board diversity measures by means of
correlation coefficients. We provide such coefficients and statistical significance for the
13
Scandinavian countries as a whole as well as for the individual countries.
One highly pertinent question is whether diversity or homogeneity is self-reinforcing. This
would be the case if a greater tolerance for board diversity with regard to gender leads to greater
tolerance for other kinds of diversity in terms of nationality or age. The same will be the case if
greater homogeneity is self-reinforcing, for example if boards composed of men of the same age
group and nationality tend to increase the likelihood that other board members will be similar. In
both cases board diversity measures will co-vary.
However, Tables 4.1-4.4 provide no robust correlation between the percentage of females
on boards, the percentage of foreign board members, and age dispersion. Hence, while there is
some association between these variables in the Scandinavian countries as a whole, the correlations
are not robust. We do not find the same correlations in the individual countries and therefore
attribute most overall correlations to country differences. For example, we see no significant
correlation between the percentage of female board members and the percentage of foreign board
members in Sweden and Denmark. Apparently the decision to appoint a foreign board member is
unrelated to gender, and greater diversity in terms of nationality does not necessarily lead to greater
diversity in terms of gender.
In Norway, however, we find a negative correlation which can be interpreted as an
indication of substitution or competition between different kinds of diversity. For example,
companies with substantial government ownership may be more likely to appoint a greater fraction
of women, whereas companies with more international ownership are more likely to appoint foreign
board members. Similarly, gender diversity appears to be positively related to age diversity in
Sweden, but not in Denmark and Norway. For the most part, therefore, the age profile and gender
profiles are unrelated.
Neither is international diversity (measured by the percentage of foreigners on board)
systematically related to gender diversity or age diversity. Age diversity tends to be negatively
correlated to the average age of the board in Scandinavia as a whole, but especially in Denmark and
Sweden. Since many boards have age limits, a higher average age will automatically tend to reduce
age diversity. Age limits (an example of officially sanctioned discrimination) are of course
questionable from a diversity viewpoint.
The correlation matrices also examine the direct association between board diversity and three
possible drivers of diversity:
- Other positions held by the Chair (a test off network effects – e.g. “old boys’” network).
14
15
- Average age of the board (are older boards more conservative?) - Board size (is there more room for diversity in large boards?)
We find no support for either of these associations in terms of strong correlations. Board
diversity turns out not to be correlated with Chair positions. This indicates that the density of the
hypothetical “old boys’” network does not necessarily lead to a preference for “the usual suspects”.
However, we do find a weak tendency in this direction in Norway.
Although gender diversity is negatively correlated with average board age in Scandinavia as
a whole, we do no find any indication that older boards are less likely to have female members in
any of the three countries. Thus the overall correlation probably reflects a nation effect (Denmark
has older boards and less gender diversity).
Finally, the prediction that large boards tend to be more diverse turns out to be relevant in
Sweden, but not in Norway or Denmark. One likely explanation is that large Swedish boards
actively seek greater diversity. If the board is expanded as a result of the voluntarily or
involuntarily inclusion of a female board member, this can lead to negative performance effects due
to increased board size.
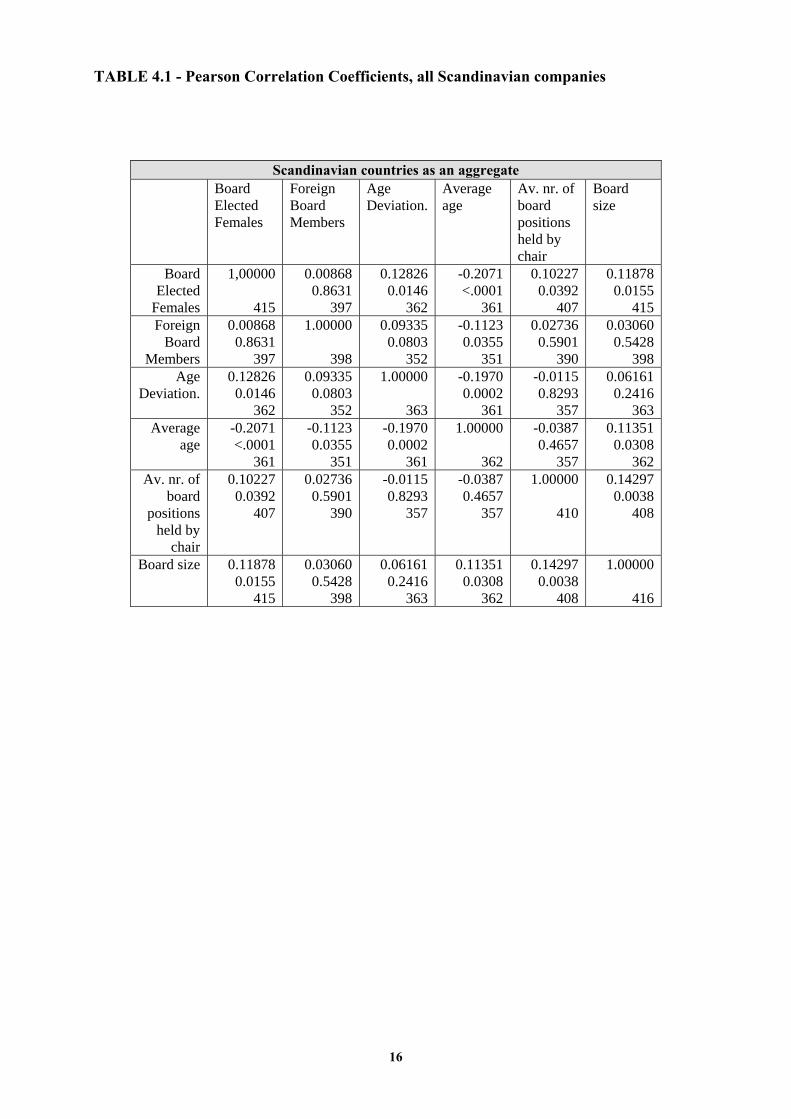
TABLE 4.1 - Pearson Correlation Coefficients, all Scandinavian companies
Scandinavian countries as an aggregate Board
Elected Females
Foreign Board Members
Age Deviation.
Average age
Av. nr. of board positions held by chair
Board size
Board Elected
Females
1,00000
415
0.00868 0.8631
397
0.12826 0.0146
362
-0.2071 <.0001
361
0.10227 0.0392
407
0.11878 0.0155
415Foreign
Board Members
0.00868 0.8631
397
1.00000
398
0.09335 0.0803
352
-0.1123 0.0355
351
0.02736 0.5901
390
0.03060 0.5428
398Age
Deviation. 0.12826
0.0146 362
0.09335 0.0803
352
1.00000
363
-0.1970 0.0002
361
-0.0115 0.8293
357
0.06161 0.2416
363Average
age -0.2071 <.0001
361
-0.1123 0.0355
351
-0.1970 0.0002
361
1.00000
362
-0.0387 0.4657
357
0.11351 0.0308
362Av. nr. of
board positions
held by chair
0.10227 0.0392
407
0.02736 0.5901
390
-0.0115 0.8293
357
-0.0387 0.4657
357
1.00000
410
0.14297 0.0038
408
Board size 0.11878 0.0155
415
0.03060 0.5428
398
0.06161 0.2416
363
0.11351 0.0308
362
0.14297 0.0038
408
1.00000
416
16
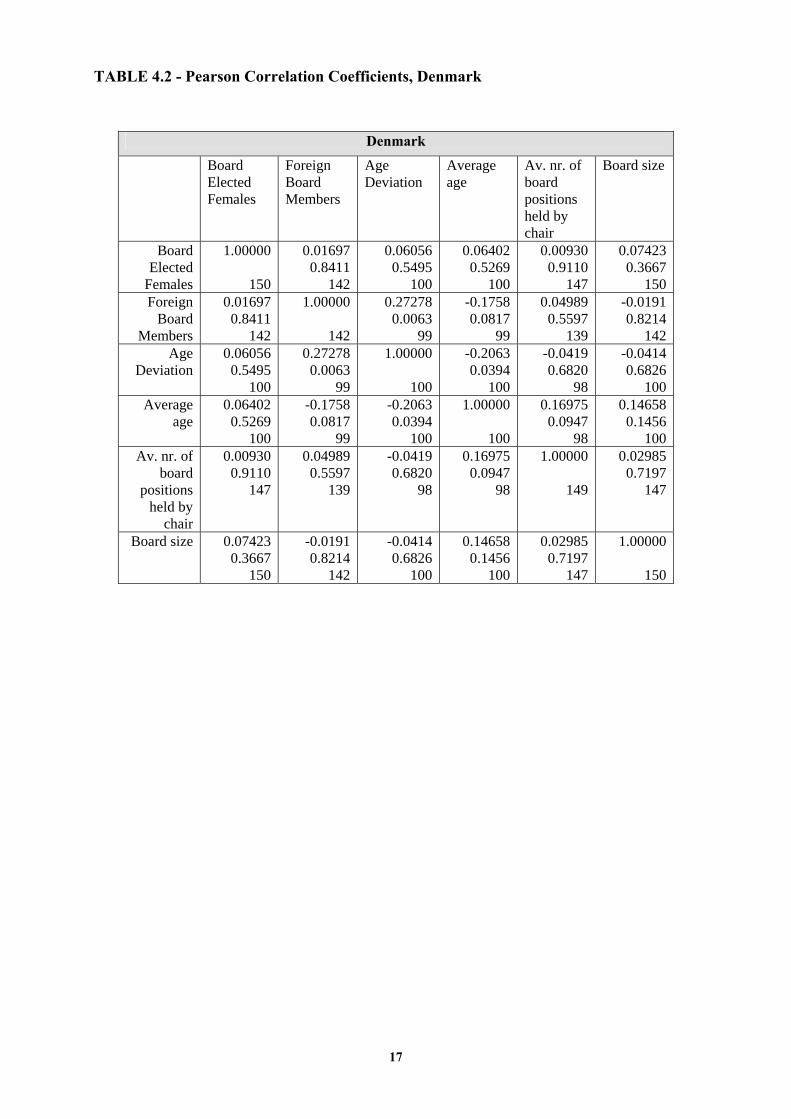
TABLE 4.2 - Pearson Correlation Coefficients, Denmark
Denmark
Board Elected Females
Foreign Board Members
Age Deviation
Average age
Av. nr. of board positions held by chair
Board size
Board Elected
Females
1.00000
150
0.01697 0.8411
142
0.06056 0.5495
100
0.06402 0.5269
100
0.00930 0.9110
147
0.07423 0.3667
150Foreign
Board Members
0.01697 0.8411
142
1.00000
142
0.27278 0.0063
99
-0.1758 0.0817
99
0.04989 0.5597
139
-0.0191 0.8214
142Age
Deviation 0.06056
0.5495 100
0.27278 0.0063
99
1.00000
100
-0.2063 0.0394
100
-0.0419 0.6820
98
-0.0414 0.6826
100Average
age 0.06402
0.5269 100
-0.1758 0.0817
99
-0.2063 0.0394
100
1.00000
100
0.16975 0.0947
98
0.14658 0.1456
100Av. nr. of
board positions
held by chair
0.00930 0.9110
147
0.04989 0.5597
139
-0.0419 0.6820
98
0.16975 0.0947
98
1.00000
149
0.02985 0.7197
147
Board size 0.07423 0.3667
150
-0.0191 0.8214
142
-0.0414 0.6826
100
0.14658 0.1456
100
0.02985 0.7197
147
1.00000
150
17
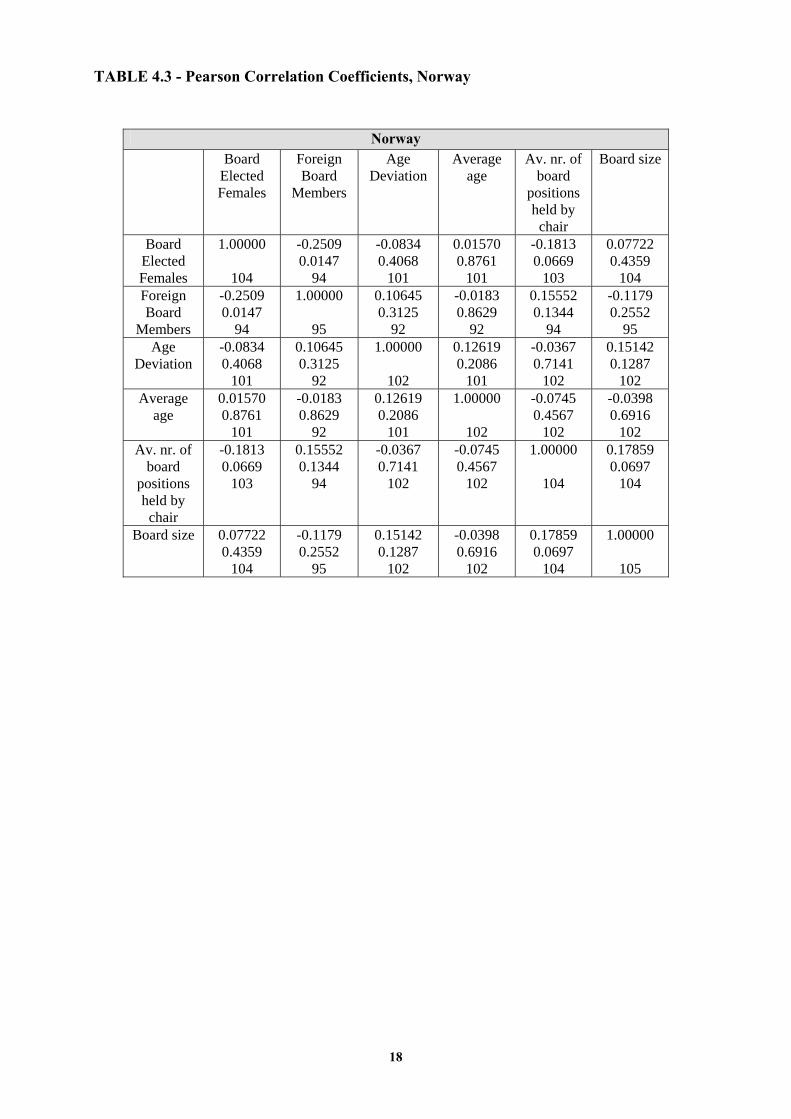
TABLE 4.3 - Pearson Correlation Coefficients, Norway
Norway Board
Elected Females
Foreign Board
Members
Age Deviation
Average age
Av. nr. of board
positions held by chair
Board size
Board Elected Females
1.00000
104
-0.2509 0.0147
94
-0.0834 0.4068
101
0.01570 0.8761
101
-0.1813 0.0669
103
0.07722 0.4359
104 Foreign Board
Members
-0.2509 0.0147
94
1.00000
95
0.10645 0.3125
92
-0.0183 0.8629
92
0.15552 0.1344
94
-0.1179 0.2552
95 Age
Deviation -0.0834 0.4068
101
0.10645 0.3125
92
1.00000
102
0.12619 0.2086
101
-0.0367 0.7141
102
0.15142 0.1287
102 Average
age 0.01570 0.8761
101
-0.0183 0.8629
92
0.12619 0.2086
101
1.00000
102
-0.0745 0.4567
102
-0.0398 0.6916
102 Av. nr. of
board positions held by chair
-0.1813 0.0669
103
0.15552 0.1344
94
-0.0367 0.7141
102
-0.0745 0.4567
102
1.00000
104
0.17859 0.0697
104
Board size 0.07722 0.4359
104
-0.1179 0.2552
95
0.15142 0.1287
102
-0.0398 0.6916
102
0.17859 0.0697
104
1.00000
105
18
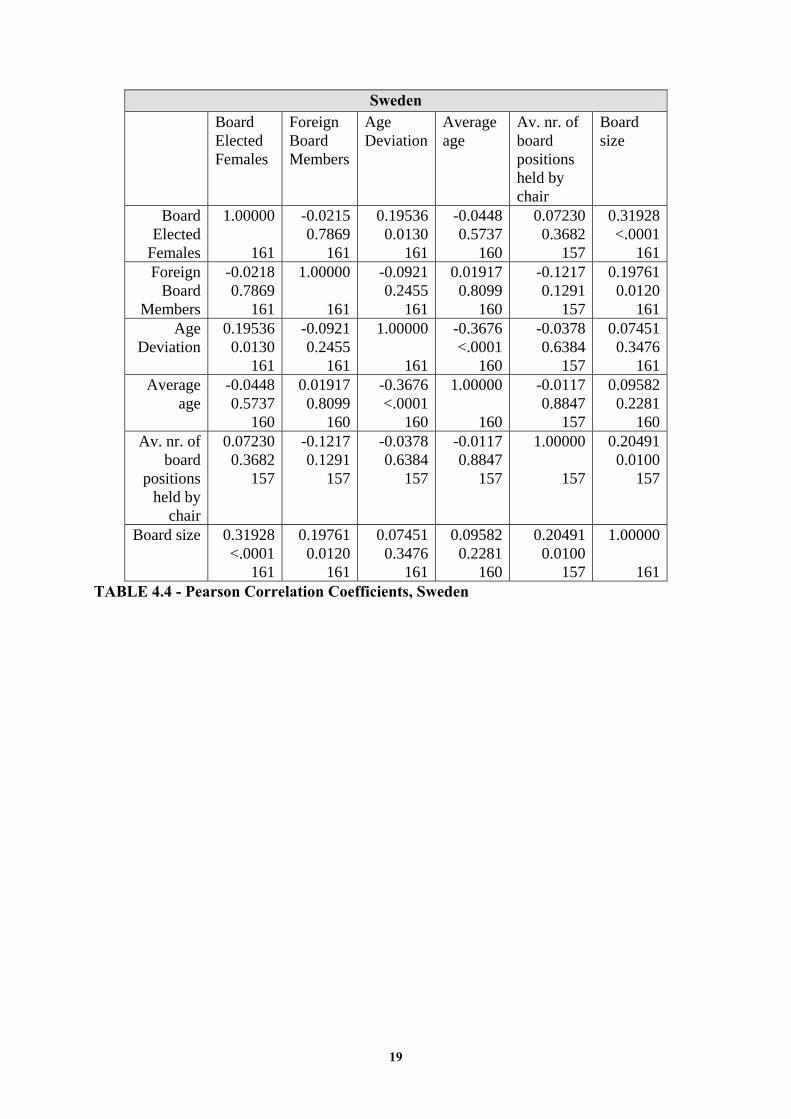
TABLE 4.4 - Pearson Correlation Coefficients, Sweden
Sweden Board
Elected Females
Foreign Board Members
Age Deviation
Average age
Av. nr. of board positions held by chair
Board size
Board Elected
Females
1.00000
161
-0.02150.7869
161
0.195360.0130
161
-0.04480.5737
160
0.07230 0.3682
157
0.31928<.0001
161Foreign
Board Members
-0.0218 0.7869
161
1.00000
161
-0.09210.2455
161
0.019170.8099
160
-0.1217 0.1291
157
0.197610.0120
161Age
Deviation 0.19536 0.0130
161
-0.09210.2455
161
1.00000
161
-0.3676<.0001
160
-0.0378 0.6384
157
0.074510.3476
161Average
age -0.0448 0.5737
160
0.019170.8099
160
-0.3676<.0001
160
1.00000
160
-0.0117 0.8847
157
0.095820.2281
160Av. nr. of
board positions
held by chair
0.07230 0.3682
157
-0.12170.1291
157
-0.03780.6384
157
-0.01170.8847
157
1.00000
157
0.204910.0100
157
Board size 0.31928 <.0001
161
0.197610.0120
161
0.074510.3476
161
0.095820.2281
160
0.20491 0.0100
157
1.00000
161
19
4.2 Determinants of board diversity
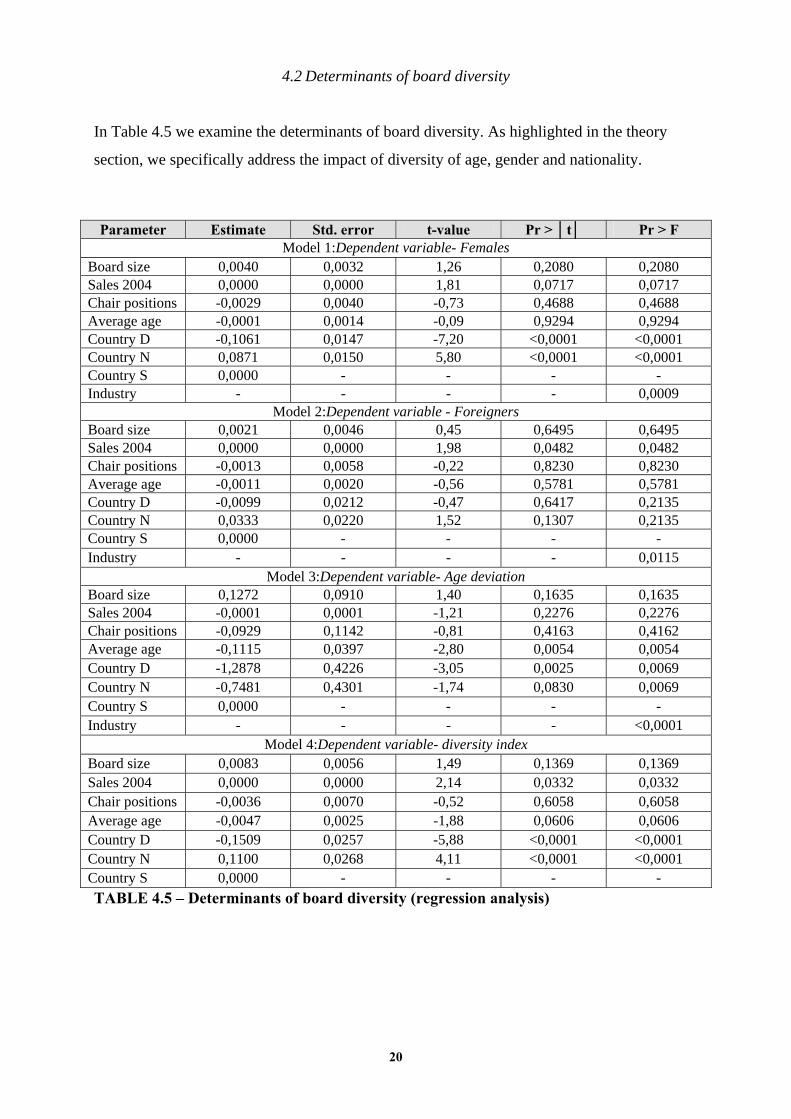
In Table 4.5 we examine the determinants of board diversity. As highlighted in the theory
section, we specifically address the impact of diversity of age, gender and nationality.
TABLE 4.5 – Determinants of board diversity (regression analysis)
Parameter Estimate Std. error t-value Pr > │t│ Pr > F Model 1:Dependent variable- Females
Board size 0,0040 0,0032 1,26 0,2080 0,2080 Sales 2004 0,0000 0,0000 1,81 0,0717 0,0717 Chair positions -0,0029 0,0040 -0,73 0,4688 0,4688 Average age -0,0001 0,0014 -0,09 0,9294 0,9294 Country D -0,1061 0,0147 -7,20 <0,0001 <0,0001 Country N 0,0871 0,0150 5,80 <0,0001 <0,0001 Country S 0,0000 - - - - Industry - - - - 0,0009
Model 2:Dependent variable - Foreigners Board size 0,0021 0,0046 0,45 0,6495 0,6495 Sales 2004 0,0000 0,0000 1,98 0,0482 0,0482 Chair positions -0,0013 0,0058 -0,22 0,8230 0,8230 Average age -0,0011 0,0020 -0,56 0,5781 0,5781 Country D -0,0099 0,0212 -0,47 0,6417 0,2135 Country N 0,0333 0,0220 1,52 0,1307 0,2135 Country S 0,0000 - - - - Industry - - - - 0,0115
Model 3:Dependent variable- Age deviation Board size 0,1272 0,0910 1,40 0,1635 0,1635 Sales 2004 -0,0001 0,0001 -1,21 0,2276 0,2276 Chair positions -0,0929 0,1142 -0,81 0,4163 0,4162 Average age -0,1115 0,0397 -2,80 0,0054 0,0054 Country D -1,2878 0,4226 -3,05 0,0025 0,0069 Country N -0,7481 0,4301 -1,74 0,0830 0,0069 Country S 0,0000 - - - - Industry - - - - <0,0001
Model 4:Dependent variable- diversity index Board size 0,0083 0,0056 1,49 0,1369 0,1369 Sales 2004 0,0000 0,0000 2,14 0,0332 0,0332 Chair positions -0,0036 0,0070 -0,52 0,6058 0,6058 Average age -0,0047 0,0025 -1,88 0,0606 0,0606 Country D -0,1509 0,0257 -5,88 <0,0001 <0,0001 Country N 0,1100 0,0268 4,11 <0,0001 <0,0001 Country S 0,0000 - - - -
20
21
In Table 4.5, Model 1, we find that gender diversity is influenced by country and industry
effects as well as firm size. Predictably, we find a negative “Denmark effect” and a positive
“Norway effect”, which partly reflects that firm size (sales) tends to have a positive effect on
gender diversity of the board. This is not just because larger firms tend to have larger boards,
as we control for board size. We conjecture that large firms are more sensitive to social and
political concerns, including gender issues, and therefore consciously promote more gender
diversity. Many other plausible factors, such as board size, average age of the board, or the
number of other board positions held by the Chair, appear not to matter.
In Table 4.5, Model 2, we find that international diversity is basically only influenced
by firm size (sales), whereas industry, country, and the above mentioned diversity drivers do
not appear to matter significantly. The low international diversity of Danish boards appears to
be driven mainly by a small-firm effect.
In Table 4.5, Model 3, we find that age diversity is influenced by average board age,
industry, and country effects, but not by firm size (sales), board size, and Chair positions.
Again we see that Danish boards are more homogenous than Norwegian or Swedish boards.
Finally, in Table 4.5, Model 4, we construct a diversity index (% shareholder elected
female board members + % foreign board members + Age diversity % of mean age of the
board) to analyze the determinants of overall variations in diversity. As before, we find that
general board diversity is driven by firm size, industry, and country effects. In addition,
average board age has a negative effect on diversity, but is most likely attributable to the
above-mentioned effect on age diversity.
The positive “Norway effect” on board diversity is partly attributable to the deliberate
policies to increase female board participation, but it is notable that Norwegian company
boards are also more international than boards in other Scandinavian countries. The strongly
negative “Denmark-effect” remains significant after controlling for firm size, industry, and
other relevant variables. Hence, regarding board diversity, we have found significant cross-
border difference in our Nordic sample.
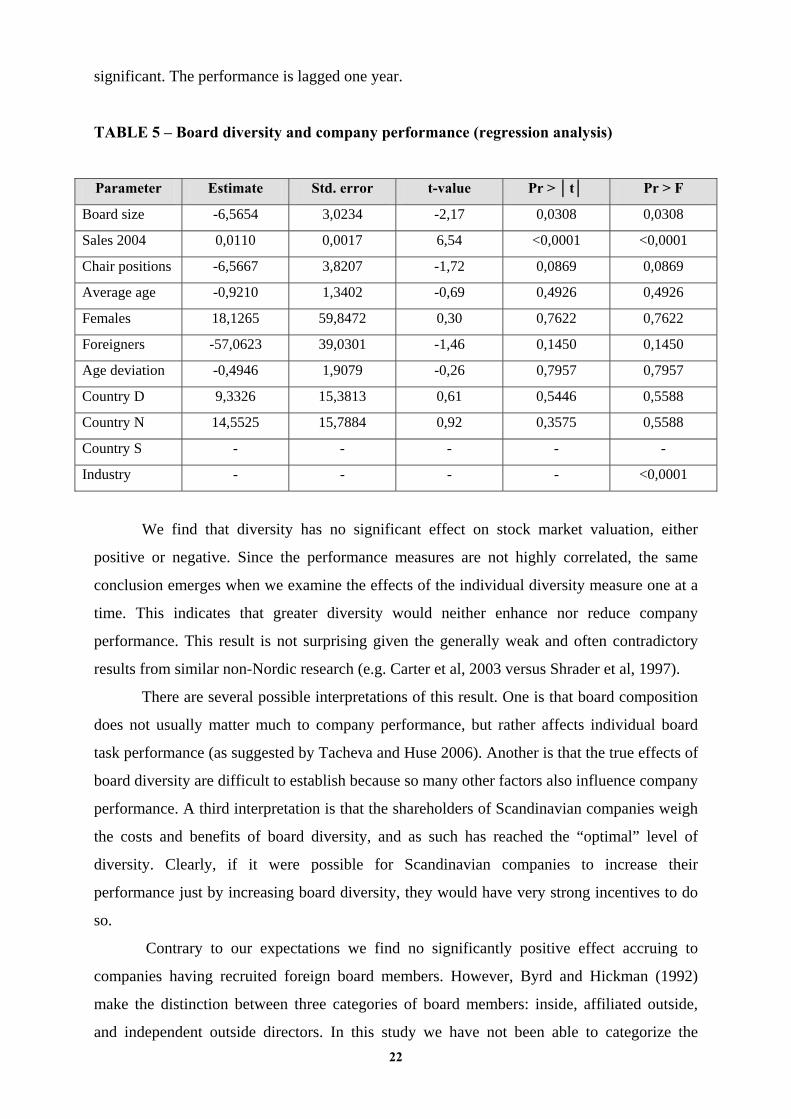
5. BOARD DIVERSITY AND COMPANY PERFORMANCE
In Table 5 we examine the effect of board diversity on the stock market value (market
to book) of companies. Stock market valuations may be said to represent investors’ best
estimate of the future earnings of the company and may therefore be regarded as a market
based performance measure. We control for firm size and industry, which both turn out to be
22
significant. The performance is lagged one year.
TABLE 5 – Board diversity and company performance (regression analysis)
Parameter Estimate Std. error t-value Pr > │t│ Pr > F
Board size -6,5654 3,0234 -2,17 0,0308 0,0308
Sales 2004 0,0110 0,0017 6,54 <0,0001 <0,0001
Chair positions -6,5667 3,8207 -1,72 0,0869 0,0869
Average age -0,9210 1,3402 -0,69 0,4926 0,4926
Females 18,1265 59,8472 0,30 0,7622 0,7622
Foreigners -57,0623 39,0301 -1,46 0,1450 0,1450
Age deviation -0,4946 1,9079 -0,26 0,7957 0,7957
Country D 9,3326 15,3813 0,61 0,5446 0,5588
Country N 14,5525 15,7884 0,92 0,3575 0,5588
Country S - - - - -
Industry - - - - <0,0001
We find that diversity has no significant effect on stock market valuation, either
positive or negative. Since the performance measures are not highly correlated, the same
conclusion emerges when we examine the effects of the individual diversity measure one at a
time. This indicates that greater diversity would neither enhance nor reduce company
performance. This result is not surprising given the generally weak and often contradictory
results from similar non-Nordic research (e.g. Carter et al, 2003 versus Shrader et al, 1997).
There are several possible interpretations of this result. One is that board composition
does not usually matter much to company performance, but rather affects individual board
task performance (as suggested by Tacheva and Huse 2006). Another is that the true effects of
board diversity are difficult to establish because so many other factors also influence company
performance. A third interpretation is that the shareholders of Scandinavian companies weigh
the costs and benefits of board diversity, and as such has reached the “optimal” level of
diversity. Clearly, if it were possible for Scandinavian companies to increase their
performance just by increasing board diversity, they would have very strong incentives to do
so.
Contrary to our expectations we find no significantly positive effect accruing to
companies having recruited foreign board members. However, Byrd and Hickman (1992)
make the distinction between three categories of board members: inside, affiliated outside,
and independent outside directors. In this study we have not been able to categorize the
23
foreign directors in such groups. Moreover, for the company to benefit fully from recruiting a
foreign board member, the member should not only be independent but also be recruited from
a superior governance regime, such as the Anglo-American regime (see Oxelheim and
Randøy, 2003). In this study, we have not been able to separate independent Anglo-American
board members from other foreign members.
In contrast, board size and the Chair’s number of other board positions appear to have
a negative impact on company performance. The implication is that shareholders regard
companies with smaller, less connected boards as having better future prospects. There may
be understandable reasons why shareholders do not limit board size or chair board
connections. For example, large boards may emerge as more or less unavoidable by-products
of mergers and acquisitions, and the Chair may be reluctant to give up other board positions.
Moreover, social conventions may restrict changes in board fee structures. In principle, large
severance payments for retiring board members and higher pay for board Chairs should make
it possible to compensate board members. But higher fees may be difficult to reconcile with
an egalitarian Scandinavian board culture. As for other control variables, both industry and
company size turn out to have a significant effect on market valuation.
The effects of board diversity on accounting profitability (ROA) are no different from
the effects on stock market value (and therefore not reported here). We find no significant
effects of any of our diversity variables after controlling for industry, country, and size
effects. In a simple regression, there is a significant negative effect of gender diversity, but
this appears to be attributable to the effects of other variables on gender diversity.
We reach the same result when we estimate models which regard diversity as
endogenous, for example regarding the diversity index as a function of size and nation effects,
while performance is regarded as a function of diversity, company size, and other board
variables. Board diversity appears to have no significant effect on performance.
6. DISCUSSION AND CONCLUSION
This report reveals that Scandinavian boards are surprisingly homogenous in terms of
gender and nationality, whereas the age distribution is more diverse. The low level of board
diversity in terms of gender and nationality in the Scandinavian countries seems puzzling
given the participation of women in the workforce and the internationalization of the work
force of Nordic firms. It is particularly paradoxical that firm from these countries have lower
level of board diversity than similar publicly traded firms in Anglo-American markets (e.g.
24
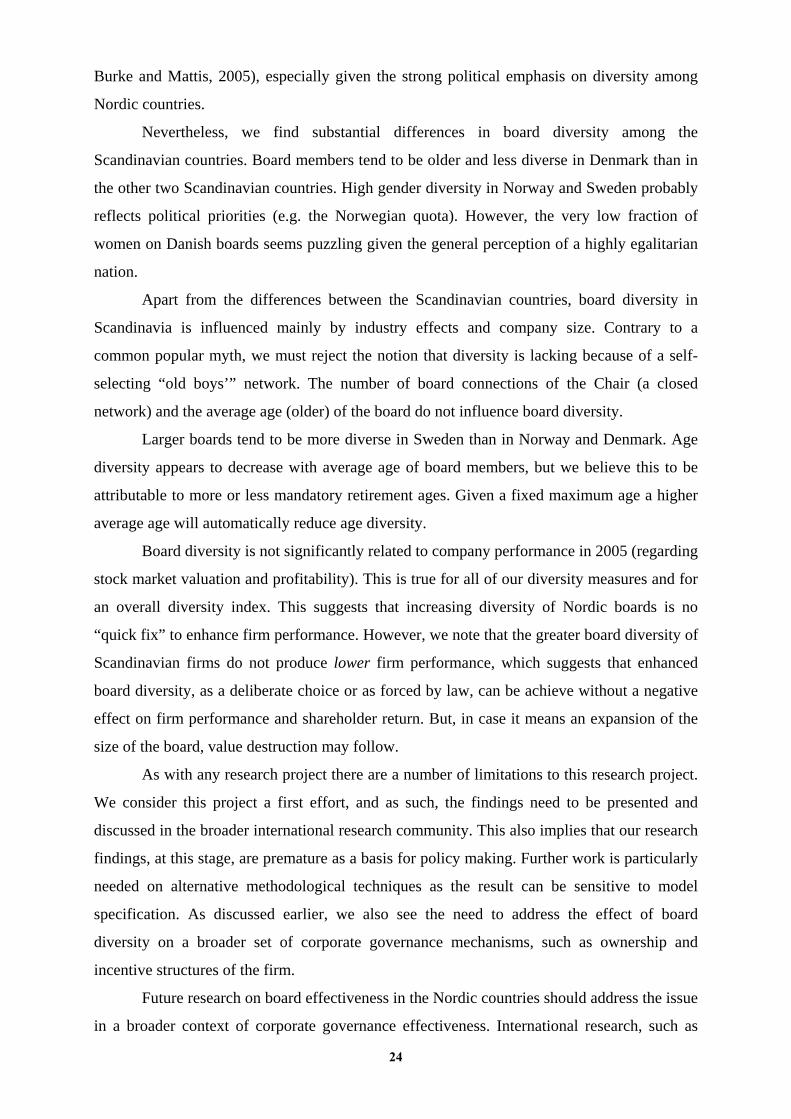
Burke and Mattis, 2005), especially given the strong political emphasis on diversity among
Nordic countries.
Nevertheless, we find substantial differences in board diversity among the
Scandinavian countries. Board members tend to be older and less diverse in Denmark than in
the other two Scandinavian countries. High gender diversity in Norway and Sweden probably
reflects political priorities (e.g. the Norwegian quota). However, the very low fraction of
women on Danish boards seems puzzling given the general perception of a highly egalitarian
nation.
Apart from the differences between the Scandinavian countries, board diversity in
Scandinavia is influenced mainly by industry effects and company size. Contrary to a
common popular myth, we must reject the notion that diversity is lacking because of a self-
selecting “old boys’” network. The number of board connections of the Chair (a closed
network) and the average age (older) of the board do not influence board diversity.
Larger boards tend to be more diverse in Sweden than in Norway and Denmark. Age
diversity appears to decrease with average age of board members, but we believe this to be
attributable to more or less mandatory retirement ages. Given a fixed maximum age a higher
average age will automatically reduce age diversity.
Board diversity is not significantly related to company performance in 2005 (regarding
stock market valuation and profitability). This is true for all of our diversity measures and for
an overall diversity index. This suggests that increasing diversity of Nordic boards is no
“quick fix” to enhance firm performance. However, we note that the greater board diversity of
Scandinavian firms do not produce lower firm performance, which suggests that enhanced
board diversity, as a deliberate choice or as forced by law, can be achieve without a negative
effect on firm performance and shareholder return. But, in case it means an expansion of the
size of the board, value destruction may follow.
As with any research project there are a number of limitations to this research project.
We consider this project a first effort, and as such, the findings need to be presented and
discussed in the broader international research community. This also implies that our research
findings, at this stage, are premature as a basis for policy making. Further work is particularly
needed on alternative methodological techniques as the result can be sensitive to model
specification. As discussed earlier, we also see the need to address the effect of board
diversity on a broader set of corporate governance mechanisms, such as ownership and
incentive structures of the firm.
Future research on board effectiveness in the Nordic countries should address the issue
in a broader context of corporate governance effectiveness. International research, such as
25
Adams and Ferreira (2004), suggests that board diversity affects board behavior directly and
then performance only indirectly. The role of nomination committees should also be
considered in this context. Ruigrok et al (2006) find that nomination committee composition
matters in the nomination of foreign and independent board members, but not on female
directorship. Furthermore, board diversity impacts other corporate governance mechanism
within the firm – such as the effectiveness of CEO pay incentives and board incentives. This
is also in line with recent research in management (Tacheva and Huse, 2006), which
emphasizes how board diversity has a moderating effect on board effectiveness. We can
conclude that board diversity affects how boards work, and changes in board diversity
demands a rethinking of the corporate governance applied by Nordic firms.
26
REFERENCES
Adams, R.B. and D.Ferreira, 2004. Diversity and Incentives in Teams: Evidence From Corporate Boards. Working Paper. Social Science Research Network.Alexander JA, Fennell ML, and M.T. Halpern, 1993. Leadership instability in hospitals: The influence of board-CEO relations and organizational growth and decline. Administrative Science Quarterly 38: 74-99.
Argyris C. 1999. Tacit knowledge and management. In R. S. Sternberg & J. A. Horvath (Eds.), Tacit
Knowledge in Professional Practice: 123-140. Lawrence Erlbaum Associates: Mahwah NJ. Athey, S., Avery, C. and P. Zemsky, 2000. Mentoring and Diversity. American Economic Review,
90(4):765-787. Bekaert G. and C. Harvey,2000. Foreign speculators and emerging equity markets. Journal of Finance
5: 565-613. Bettis R. and C. Prahalad,1995. The dominant logic: A retrospective and extension. Strategic
Management Journal 16: 5-14. Bilimoria, D. and M. Huse,. 1997. A qualitative comparison of the boardroom experience of U.S. and
Norwegian women directors. International Review of Women and Leadership 3 (2); 63-76. Brancato C.K. and D. J. Patterson, 1999. Board diversity in U.S. corporations: Best practices for
broadening the profile of corporate boards. The Conference Board, Research Report 1230-99-RR.
Burke, R. and M. Mattis, 2005. Supporting women’s career advancement: Challenges and
opportunities. Elgar: Chetlenham, UK. Bøhren, Ø. and R.Ø. Strøm, 2006. Aligned, informed and decisive: Characteristics of value-creating
boards. Working paper, Norwegian School of Management. Byrd, J.W. and K.A. Hickman, 1992. Do outsider directors monitor managers, Journal of Financial
Economics 32: 195-221. Carter, D.A., B.J. Simkins, and W.G Simpson, 2003. Corporate governance, board diversity, and firm
performance. Financial Review 38 (1). Conyon M.J. and S.I. Peck, 1998. Board size and corporate governance: Evidence from European
countries. European Journal of Finance 4: 291-304. Cotter J.F. and A. Shivdasani, 1997, Independent boards enhance target shareholder wealth.
Directorship 23(10): 3-6. Daily C.M. and D.R.Dalton, 2003. Women in the boardroom: A business imperative, Journal
of Business Strategy, 24 (5): 8-9. Dalton D.R., Daily C.M., Johnson J.L. and A.E. Ellstrand, 1999. Number of directors and financial
performance: A meta-analysis. Academy of Management Journal 42: 674-687. Directorship, 2002. Governance issues for the New Year: Interview with Mike Cook, professional
director, 28 (1): 1-5. Distefano, J.J. and M.L. Maznevski, 2000. Creating value with diverse teams in global management,
Organizational Dynamics 29, 48-66. Eisenhardt K.M. 1989. Agency theory: An assessment and review. Academy of Management Review
27
14: 57-74. Fama E. and M. Jensen, 1983. Separation of ownership and control. Journal of Law and Economics
26: 301-25. Forbes D.P. and F.J. Milliken, 1999. Cognition and corporate governance: Understanding boards of
directors as strategic decision-making groups. Academy of Management Review 24: 489-505. Gomez-Mejia L.R., Nunez-Nickel M. and I. Gutierrez, 2001. The role of family ties in agency
contracts. Academy of Management Journal 44: 81-95. Halme, M. and M. Huse, 1997,The Influence of Corporate Governance, Industry and Country Factors
on Environmental Reporting, Scandinavian Journal of Management 13: 137-157. Hambrick, D.C., 1994. Top management groups: A conceptual integration and reconsideration of the
“team” label. In B.M.Straw and L.L.Cummings (Eds.), Research in organizational behavior 16: 171-214. Greenwich, CT.: JAI Press.
Hoffman, L.R. and R.F. Maier, 1961. Quality and acceptance of problem solutions by members of
homogeneous and heterogeneous groups. Journal of Abnormal and Social Psychology 62: 401-407.
Huse, M. and D. Eide, 1996. Stakeholder Management and the Avoidance of Corporate Control,
Business & Society 35: 211-243. Huse M., 2000. Board of directors in SMEs: A review and research agenda. Entrepreneurship and
Regional Development 12: 271-290. Kanter, R., 1977. Men and Women of the Corporation. Basic Books. Kmenta, J., 1997. Elements of Econometrics. New York: Macmillan. Lipton M. and J. Lorsch,1992. A modest proposal for improved corporate governance. Business
Lawyer 59: 59-77. Mace, M., 1971. Directors, Myth, and Reality. Harvard Business School Press: Boston. Mayer, C., 1997. Corporate governance, competition and performance. Journal of Law and Society,
24: 152-176. McConnell, J. and H. Servaes: 1990, “Additional Evidence on Equity Ownership and Corporate
Value,” Journal of Financial Economics 27: 595-612. Mintzberg H., 1983. Power in and around organizations. Prentice-Hall: Englewood Cliffs, NJ. Oxelheim, L. and T. Randøy. The Impact of Foreign Membership on Firm Valuation. Journal of
Banking and Finance 27(12): 2369-2392. Pelled, L.H., 1996. Demographic diversity, conflict, and work group outcomes: An intervening
process theory. Organization Science, 7(6): 615-631. Pelled, L. , Eisenhardt, K., and K. Xin, 1999. Exploring the black box: An analysis of work group
diversity, conflict and performance, Administrative Science Quarterly, 44(1): 1-28. Pfeffer J., 1981. Power in Organizations. Pitman Publishing: Marchfield, MA. Pfeffer J. and G.R. Salancik,1978. The External Control of Organizations: A Resource-Dependence
28
Perspective. Harper & Row: New York. Randøy, T. and J. Down,2002. Good Corporate Governance: A Firm’s Life Cycle Perspective.
Conference Paper presented at Western Academy of Management 44th Annual Conference, Santa Fe, New Mexico, March 2002.
Robinson, G. and K. Dechant, 1997. Building a business case for diversity, Academy of Management
Executive 11 (3): 21-30. Rosenstein, S. and J. Wyatt, 1990.Outside Directors, Board Independence and Shareholder Wealth,
Journal of Financial Economics 26: 175-191. Ruigrok, W., Peck, S., Tacheva, S., Greve, P. and Y. Hu, 2006. The determinants and Effects of Board
Nomination Committees, Journal of Management Governance 10: 119-148. Sharader, C.B. . Blackburn, V.B. and P. Iles, 1997. Women in management and firm financial
performance: An exploratory study. Journal of Managerial Issues, 9 (3) 355-372. Schleifer, A. and R.W. Vishny, 1997. A survey of Corporate Governance, Journal of Finance 52: 737-
783. Stiles, P. 2001. The impact of boards on strategy. Journal of Management Studies 38 (5): 627-650. Tacheva, S. and M. Huse 2006. Women directors and board task performance: mediating and
moderating effects of board working style. Conference Paper presented at European Academy of Management, Oslo, Norway.
TIAA-CREF, 1997. Policy Statement on Corporate Governance. New York. Yermack D., 1996. Higher market values of companies with a small board of directors. Journal of
Financial Economics 40: 185-211. Zahra S. and J. Pearce, 1989. Board of directors and corporate governance financial performance: A
review and integrative model. Journal of Management 15: 291-334. Zahra, S and W. W Stanton, 1988. The implication of board of directors’ composition for corporate
strategy and performance. International Journal of Management 5 (2): 229-236.

29

Nordic Innovation Centre
The Nordic Innovation Centre initiates and finances activities that enhance innovation col-laboration and develop and maintain a smoothly functioning market in the Nordic region.
The Centre works primarily with small and medium-sized companies (SMEs) in the Nordic countries. Other important partners are those most closely involved with innovation and market surveillance, such as industrial organisations and interest groups, research institutions and public authorities.
The Nordic Innovation Centre is an institution under the Nordic Council of Ministers. Its secre-tariat is in Oslo.
For more information: www.nordicinnovation.
Nordic Innovation CentreStensberggata 25NO-0170 OsloNorway
Phone: +47-47 61 44 00Fax: +47-22 56 55 65