Embed Size (px)
Citation preview
A PROFILE OF THE SOUTH AFRICAN CARROT MARKET VALUE CHAIN
2019
Directorate Marketing Tel: 012 319 8455 Private Bag X 15 Fax: 012 319 8131 Arcadia E-mail:[email protected] 0007 www.daff.gov.za
2
TABLE OF CONTENT
1.DESCRIPTION OF THE INDUSTRY 3
1.1 Production areas 4
1.2 Production Trends 4
1.3 Production vs. Consumption of carrots 5
2. MARKET STRUCTURE 5
2.1 Domestic market and prices 6
2.2 South Africa’s Carrots Exports 7
2.3 Share Analysis 18
2.4 South Africa’s Carrot Imports 23
Processing 26
2.6 Market value chain for carrots 28
3. MARKET INTELLIGENCE 30
3.1 Tariffs 30
3.1 Non tariff barriers 32
4. GENERAL DISTRIBUTION CHANNELS 34
5. LOGISTICAL ISSUES 35
5.1 Mode of transport 35
5.2 Cold chain management 35
5.3 Packaging 35
6. COMPETITIVENESS OF SOUTH AFRICA CARROTS EXPORTS 36
7. OPPORTUNITIES AND CHALLENGES 39
7.1 Opportunities 39
7.2 Challenges 39
8. ACKNOWLEDGEMENTS 40
3
1. DESCRIPTION OF THE INDUSTRY
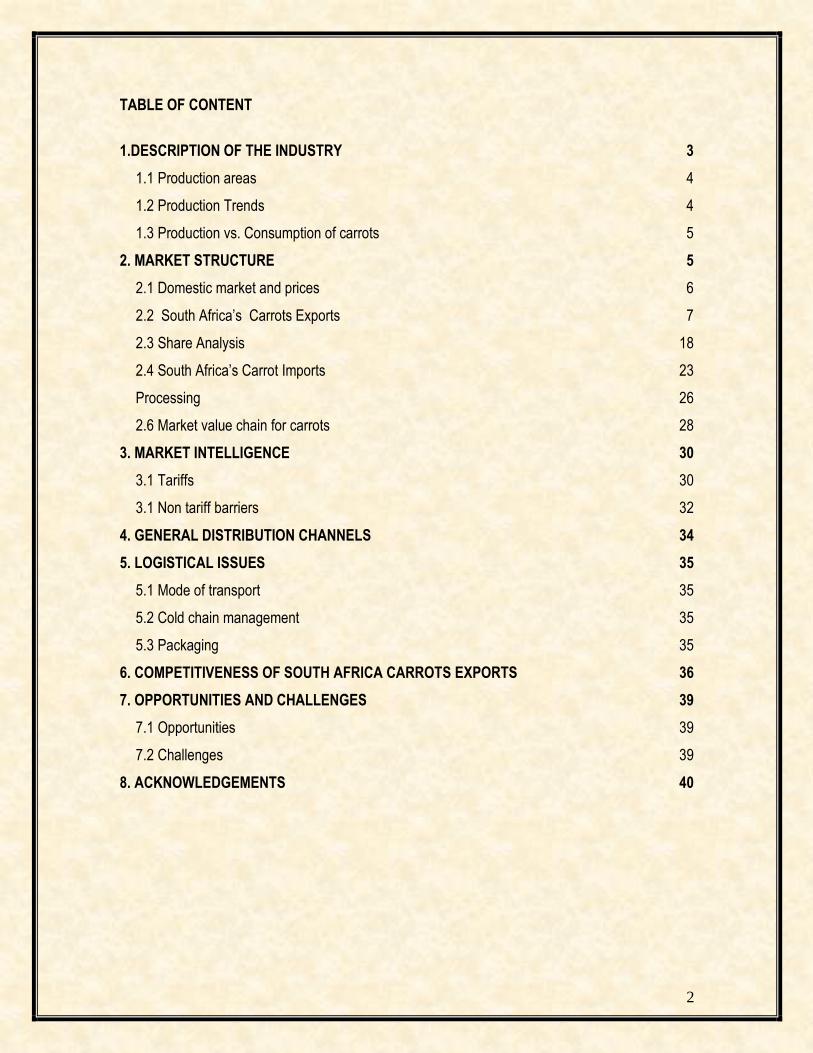
Carrot is a root vegetable usually orange, white or red, white blend in colour with a crisp texture when fresh. These colours still exist, with orange-red colour being by far the most popular today. The carrot has originated in Asia. The edible part of a carrot is the tap root. Carrots are considered one of the major vegetables consumed in South Africa. It is among the top ten most economically important vegetables crops in the world in terms of both area of production and market value. Rich in Vitamin C, B1 and B2 and particularly rich in carotene (pro-vitamin A), they can be eaten raw, whole, chopped, grated or added to salads, for colour or texture. Carrot has a crisp texture when fresh. They are also often chopped and boiled, fried or steamed and cooked in soups and stews, as well as fine baby foods and selected pet foods. Carrots are also widely used in many cuisines, especially in preparation of salads. The greens are edible as a leaf vegetable, but are rarely eaten by humans. Some sources suggest that the greens contain toxic alkaloids. Large quantities are also processed either alone or in mixture with other vegetables, by canning, freezing or dehydration.
Source: Statistics and Economic Analysis, DAFF
Figure 1 above illustrates the contribution of the carrot industry to the gross value of agricultural production over 10 years. During 2010, the gross value eased higher by 11% when compared to 2009 gross value of production. As of 2011, the gross value dropped by 0.9% relative to the previous year. This can be attributed to a drop in producer prices in the same year. The higher gross value was recorded during 2012 and the increase was 14.9%, when compared to the 2011 gross value. In 2013, gross value has gone up by 20.8% when compared to previous year gross value and this can be attributed to 1.3% increase in production output in the same year. Carrots gross value grew by 12.6% during 2014 period in comparison to the previous year gross value and this can be ascribed to the increase in producer price during the same year. In 2015, there was a sharp decrease of 26% in carrot gross value, when compared to 2014 gross value, and this can be ascribed to 36.7% drop in producer price. Carrot gross value increased by 24.8% during 2016 and the gross value was a record high over a ten year period.This can be ascribed to a 25% increase in the
0
100000000
200000000
300000000
400000000
500000000
600000000
700000000
800000000
Val
ue
(Ran
d)
Years
Figure 1: Gross value of carrot production
4
producer price during the same season. During 2017, there was a slight increase of 0.78% in carrot gross value, relative to 2016 gross value and this can be attributed to 2% increment in carrot production output. As of 2018, carrot gross value grew by 6% in comparison to 2017 gross value of production and can be ascribed to favourable prices that occurred during the same period.
1.1 Production areas
Although carrots can endure summer heat in many areas, they grow best when planted in cooler climates. It is difficult to establish carrots in summer because heat, rain and early blights are major causes of crop failure and quality reduction. Carrot production is concentrated in the Western Cape, Gauteng, Free State, North West, KwaZulu Natal and Mpumalanga. Globally, China is still the largest producer of carrots, followed by, Russian Federation, United States of America, Uzbekistan Poland, Ukraine, and Morocco is the only African countries, which is among the top ten world carrot producers.
1.2 Production Trends
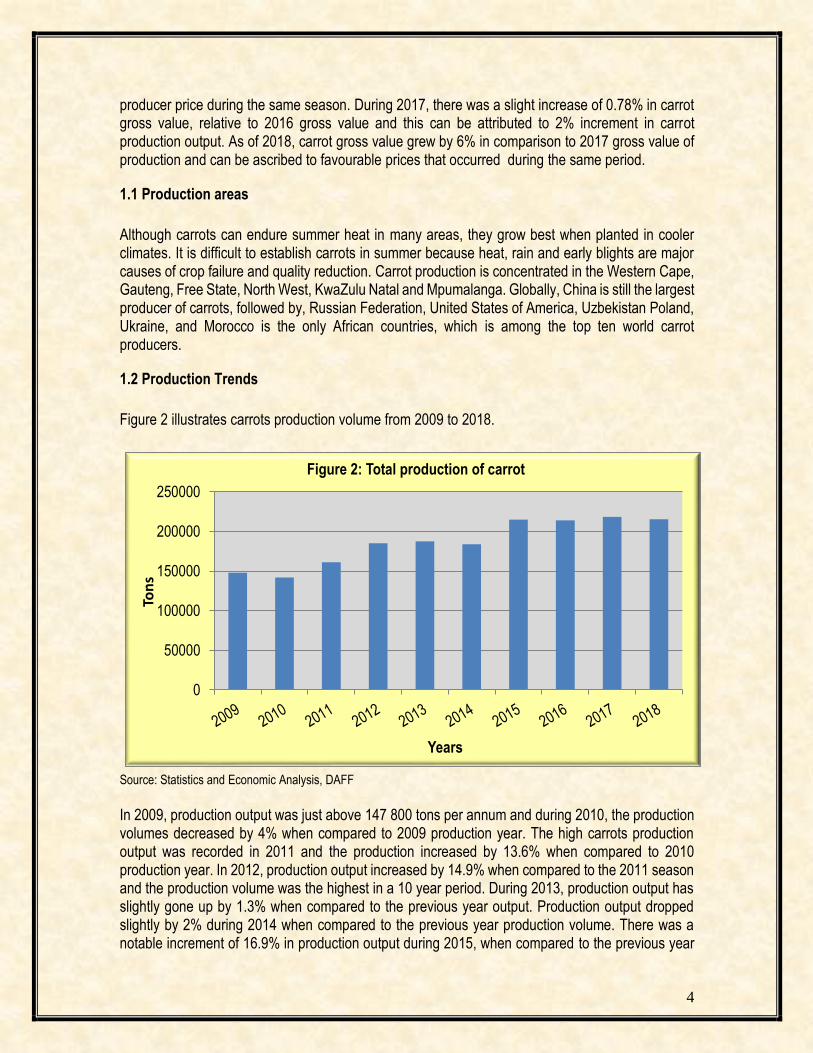
Figure 2 illustrates carrots production volume from 2009 to 2018.
Source: Statistics and Economic Analysis, DAFF
In 2009, production output was just above 147 800 tons per annum and during 2010, the production volumes decreased by 4% when compared to 2009 production year. The high carrots production output was recorded in 2011 and the production increased by 13.6% when compared to 2010 production year. In 2012, production output increased by 14.9% when compared to the 2011 season and the production volume was the highest in a 10 year period. During 2013, production output has slightly gone up by 1.3% when compared to the previous year output. Production output dropped slightly by 2% during 2014 when compared to the previous year production volume. There was a notable increment of 16.9% in production output during 2015, when compared to the previous year
0
50000
100000
150000
200000
250000
Tons
Years
Figure 2: Total production of carrot
5
output. Production output was stable above 120 000 tons during the 10 year period. During 2016, there was a slight decline of 0.5% in production output, when compared to 2015 production. In 2017, carrot production output has expanded by slightly by 2% in comparison to 2016 production output. As of 2018, there was a slight decline of 1.3% in production output relative to the previous (2017) year production output.
1.3 Production vs. Consumption of carrot
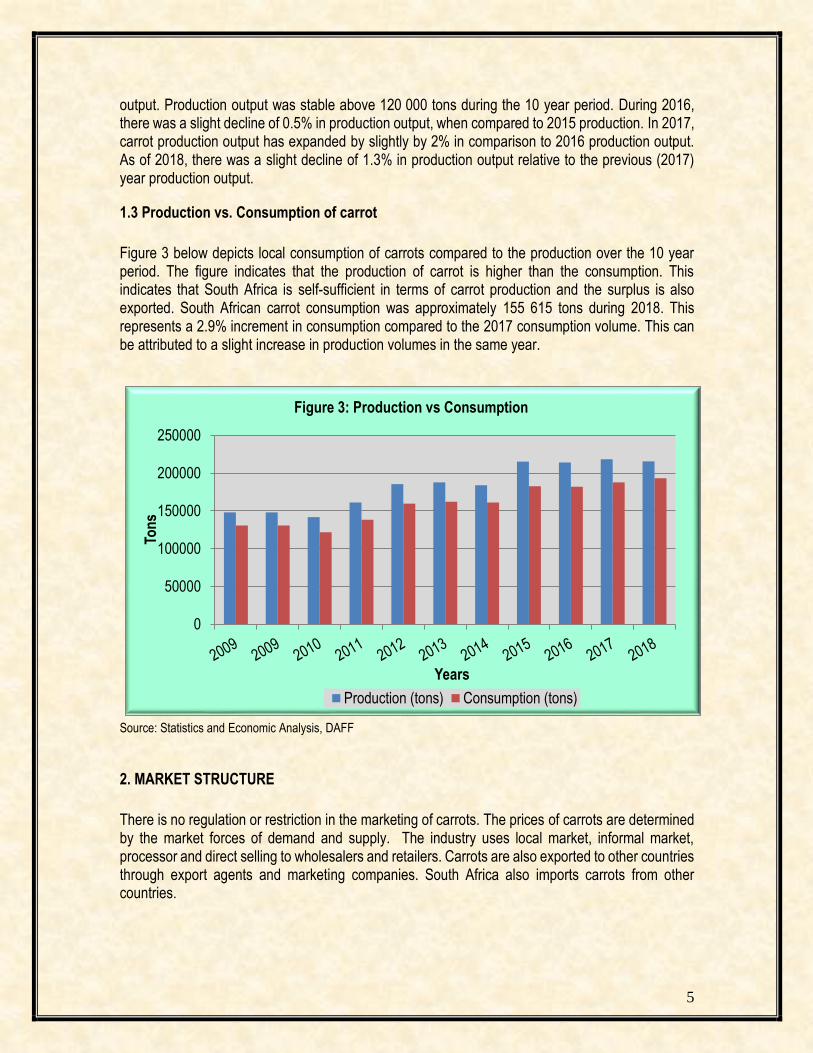
Figure 3 below depicts local consumption of carrots compared to the production over the 10 year period. The figure indicates that the production of carrot is higher than the consumption. This indicates that South Africa is self-sufficient in terms of carrot production and the surplus is also exported. South African carrot consumption was approximately 155 615 tons during 2018. This represents a 2.9% increment in consumption compared to the 2017 consumption volume. This can be attributed to a slight increase in production volumes in the same year.
Source: Statistics and Economic Analysis, DAFF
2. MARKET STRUCTURE
There is no regulation or restriction in the marketing of carrots. The prices of carrots are determined by the market forces of demand and supply. The industry uses local market, informal market, processor and direct selling to wholesalers and retailers. Carrots are also exported to other countries through export agents and marketing companies. South Africa also imports carrots from other countries.
0
50000
100000
150000
200000
250000
Ton
s
Years
Figure 3: Production vs Consumption
Production (tons) Consumption (tons)
6
2.1 Domestic market and prices
Table 1 gives the various channels of distribution through which carrots are marketed in South Africa. Table 1: Carrots sold through different market channels
Years National fresh produce markets
(Tons) Processing (Tons)
2009 91 369 13 337
2010 85 062 16 104
2011 96 405 16 993
2012 111 526 17 939
2013 113 355 17 680
2014 112 623 14 979
2015 127 352 19 643
2016 127 256 21 951
2017 131 333 21 277
2018 135 130 11 368 Source: Statistics and Economic Analysis, DAFF
Table 1 above shows that in 2018, there was a 46.5% decrement in processed carrots compared to the previous year and the drop in processed carrot can be ascribed to increase in fresh consumption and 1.3% decrement in domestic production output . National Fresh Produce Markets (NFPMs) remain an important channel for sale of fresh carrots in South Africa. During 2016, 62.7% of all carrots were distributed through fresh produce markets. The remaining 37.2% represents direct sales from producers to wholesalers, exports, retailers, processors, informal traders and consumers. Sales at the market have slightly gone up by 2.9% in comparison to 2017 sales.
Source: Statistics and Economic Analysis, DAFF
0
500
1 000
1 500
2 000
2 500
3 000
3 500
4 000
0
20000
40000
60000
80000
100000
120000
140000
160000
Ran
d/t
on
Ton
s
Years
Figure 4: Sales of carrots at fresh produce markets
Volume (Tons) Value (Rand/ton)
7
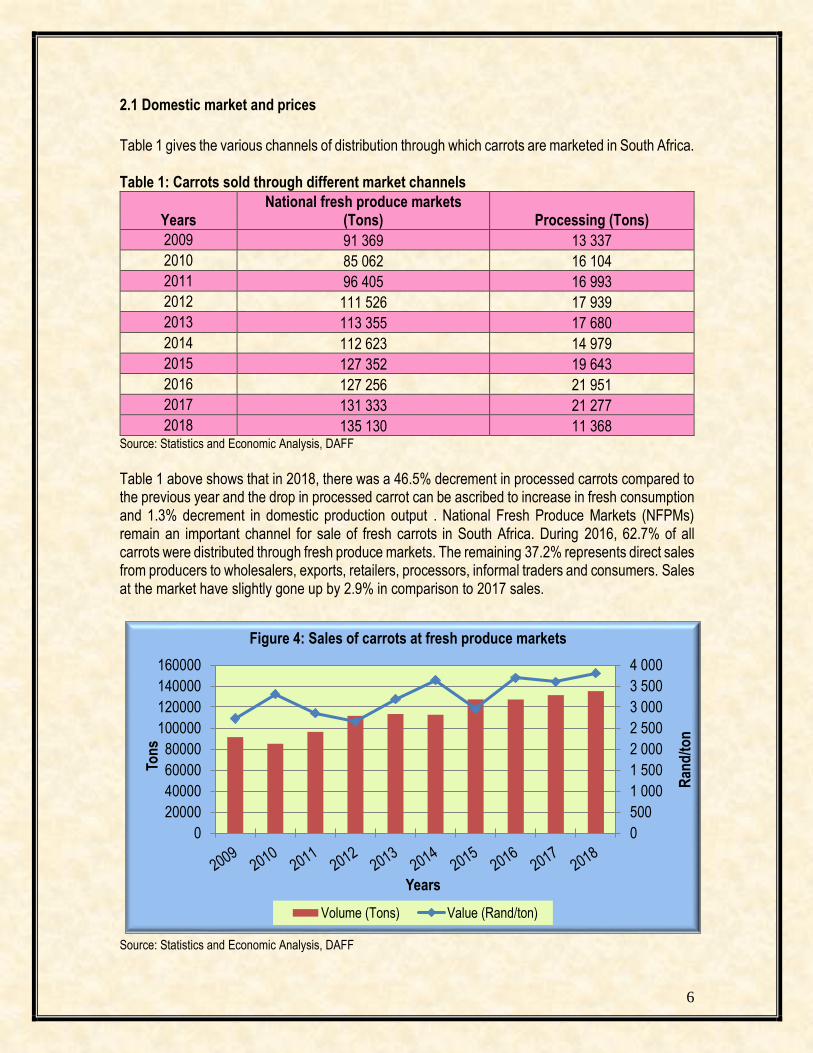
Figure 4 above illustrates the sales of carrots in the national fresh produce markets over the period of 10 years. Carrot volumes and prices were moderately unstable. During 2009, carrot volume supplied at the market was just above 91 300 tons. In 2010 carrots prices increased by 21% as carrots volume dropped by 6.9% across the markets. During 2011, market prices dropped by 13.7% due to a 13.3% increase in volumes supplied across the markets. In 2012, carrot price dropped further by 7.5% as a result of 15.6% increase in carrots supplied across the market. During 2013, market price has gone up by 20.1%, despite a 1.6% increase in carrots at the market and this can be attributed to strong demand of carrots in the same year. In 2014 the volume supplied at the market has dropped by 0.6% and this impacted positively to the market price and the price has gone up by 14% in comparison to the 2013 market price. A notable higher volume of 127 352 tons were supplied at the market in 2015, and this has negatively impacted the market price by 18.8%. The was a slight drop of 0.1% in volume supplied at the markets during 2016 and this resulted in a notable 25% increase in market price. In 2017, carrot volume supplied at the market has eased higher by 3.2% and as a subsequent the market price dropped by 2.4% relative to 2016 price. As of 2018, carrot volume supplied at the market rose slightly by 2.9% in comparison to 2017 volume and the market price has increased by 5.6%. The increment in market price can be ascribed to good carrot uptake in the same season.
2.2 South Africa’s Carrots Exports
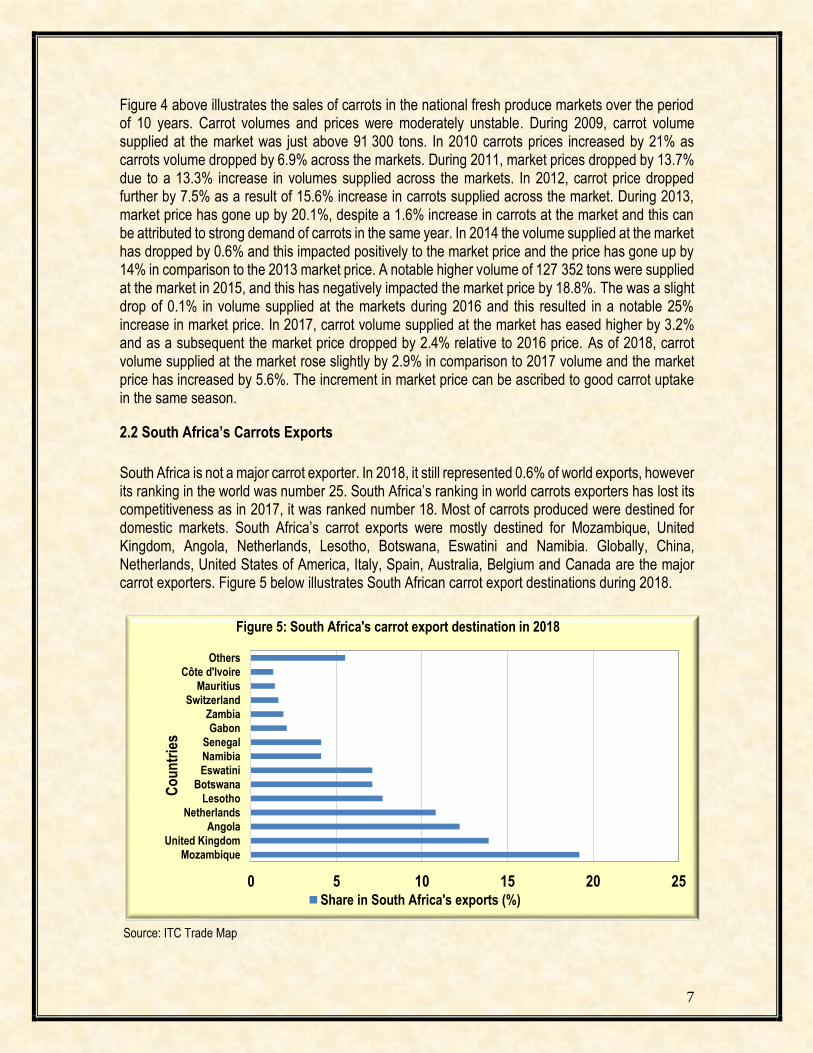
South Africa is not a major carrot exporter. In 2018, it still represented 0.6% of world exports, however its ranking in the world was number 25. South Africa’s ranking in world carrots exporters has lost its competitiveness as in 2017, it was ranked number 18. Most of carrots produced were destined for domestic markets. South Africa’s carrot exports were mostly destined for Mozambique, United Kingdom, Angola, Netherlands, Lesotho, Botswana, Eswatini and Namibia. Globally, China, Netherlands, United States of America, Italy, Spain, Australia, Belgium and Canada are the major carrot exporters. Figure 5 below illustrates South African carrot export destinations during 2018.
Source: ITC Trade Map
0 5 10 15 20 25
Mozambique
United Kingdom
Angola
Netherlands
Lesotho
Botswana
Eswatini
Namibia
Senegal
Gabon
Zambia
Switzerland
Mauritius
Côte d'Ivoire
Others
Co
un
trie
s
Figure 5: South Africa's carrot export destination in 2018
Share in South Africa's exports (%)

8
Further details relating to the exports of carrots from South Africa in 2018 are presented in Table 2. Table 2: South Africa carrot exports in 2018
Importers
Value
exported
in 2018
(USD
thousand)
Trade
balance
2018
(USD
thousand)
Share
in
South
Africa's
exports
(%)
Quantity
exported
in 2018
(tons)
Growth in
exported
value
between
2014-2018
(%, p.a.)
Growth in
exported
quantity
between
2014-2018
(%, p.a.)
Growth in
exported
value
between
2017-2018
(%, p.a.)
World 9166 9163 100 17831 4 0 3
Mozambique 1763 1763 19.2 5737 15 11 76
United
Kingdom 1276 1276 13.9 167 7 8 7
Angola 1118 1118 12.2 2407 -10 -11 -32
Netherlands 989 989 10.8 133 80 62 75
Lesotho 708 708 7.7 1641 7 13 -7
Botswana 652 652 7.1 1043 -16 -21 -32
Eswatini 651 649 7.1 3675 2 10 3
Namibia 378 378 4.1 596 -18 -20 -20
Senegal 377 377 4.1 674 140 148 55
Gabon 191 191 2.1 334 55 58 -31
Zambia 177 177 1.9 396 22 32 48
Switzerland 143 143 1.6 21 113 62 -26
Mauritius 131 131 1.4 201 11 18 138
Côte d'Ivoire 119 119 1.3 228 60 Source: ITC Trade MAP
Table 2 indicates that during 2018, South Africa exported higher quantities of carrots to Mozambique, United Kingdom, Angola, Netherlands, Lesotho, Botswana and Eswatini. Mozambique commanded a 19.2% share of South Africa’s carrots export, followed by the United Kingdom which commanded 13.9% share and Angola has commanded 12.2% share. South African carrot exports to Angola have decreased by 10% in value and 11% in quantity during 2014 to 2018 period. South Africa’s carrot exports to United Kingdom have increased by 7% in value and 8% in quantity during 2014 and 2018 periods. South Africa’s carrot export to the Mozambique has increased by 15% in value and 11% in quantity between 2014 and 2018 period.
9
Source: Quantec Easydata * Quantec easy data has revised export data to include export to SACU countries from 2010.
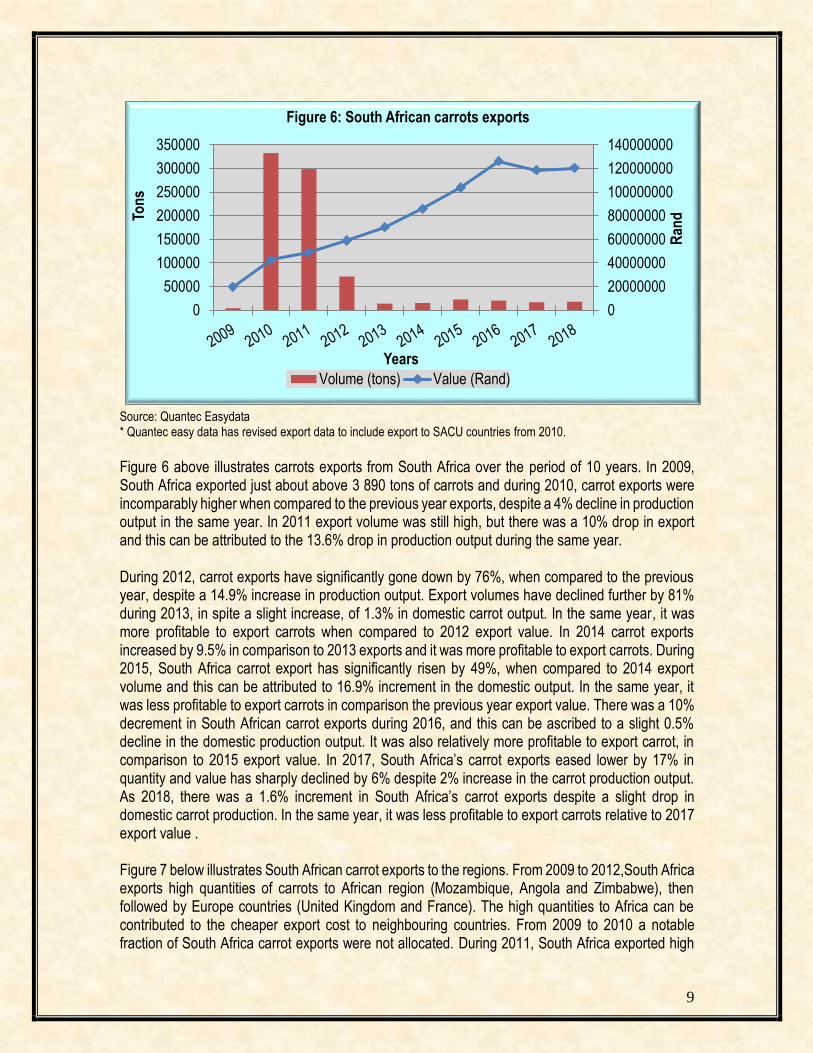
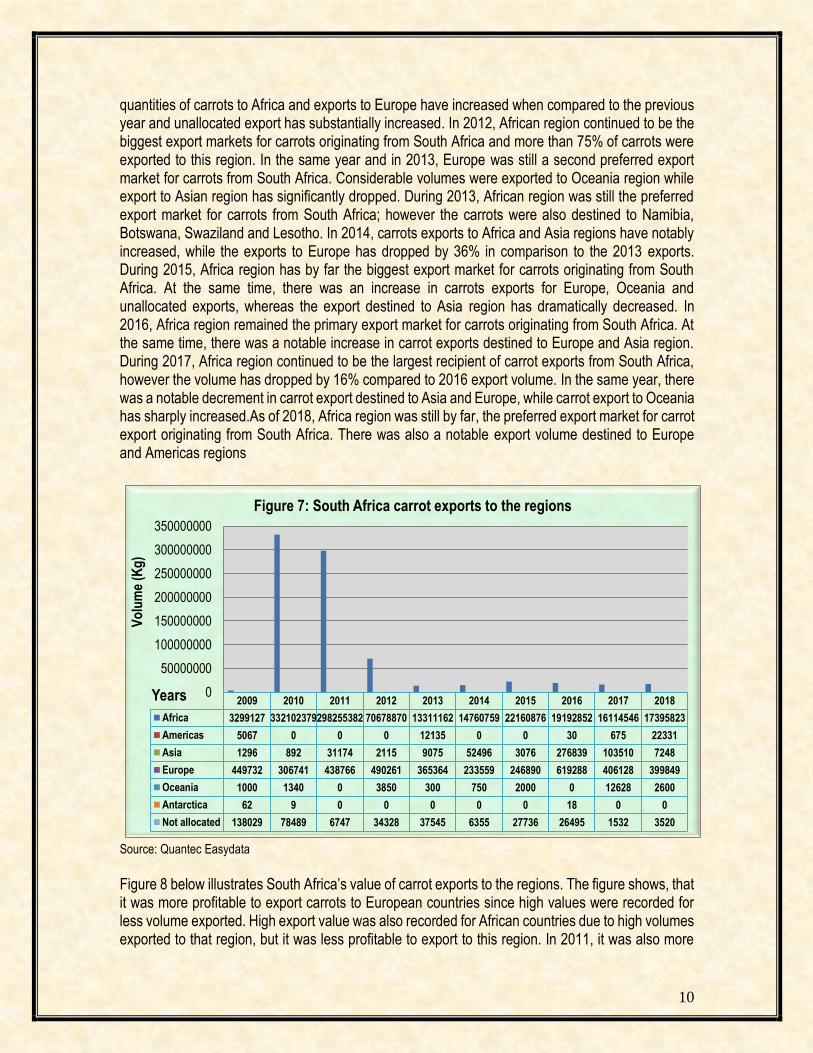
Figure 6 above illustrates carrots exports from South Africa over the period of 10 years. In 2009, South Africa exported just about above 3 890 tons of carrots and during 2010, carrot exports were incomparably higher when compared to the previous year exports, despite a 4% decline in production output in the same year. In 2011 export volume was still high, but there was a 10% drop in export and this can be attributed to the 13.6% drop in production output during the same year. During 2012, carrot exports have significantly gone down by 76%, when compared to the previous year, despite a 14.9% increase in production output. Export volumes have declined further by 81% during 2013, in spite a slight increase, of 1.3% in domestic carrot output. In the same year, it was more profitable to export carrots when compared to 2012 export value. In 2014 carrot exports increased by 9.5% in comparison to 2013 exports and it was more profitable to export carrots. During 2015, South Africa carrot export has significantly risen by 49%, when compared to 2014 export volume and this can be attributed to 16.9% increment in the domestic output. In the same year, it was less profitable to export carrots in comparison the previous year export value. There was a 10% decrement in South African carrot exports during 2016, and this can be ascribed to a slight 0.5% decline in the domestic production output. It was also relatively more profitable to export carrot, in comparison to 2015 export value. In 2017, South Africa’s carrot exports eased lower by 17% in quantity and value has sharply declined by 6% despite 2% increase in the carrot production output. As 2018, there was a 1.6% increment in South Africa’s carrot exports despite a slight drop in domestic carrot production. In the same year, it was less profitable to export carrots relative to 2017 export value . Figure 7 below illustrates South African carrot exports to the regions. From 2009 to 2012,South Africa exports high quantities of carrots to African region (Mozambique, Angola and Zimbabwe), then followed by Europe countries (United Kingdom and France). The high quantities to Africa can be contributed to the cheaper export cost to neighbouring countries. From 2009 to 2010 a notable fraction of South Africa carrot exports were not allocated. During 2011, South Africa exported high
0
20000000
40000000
60000000
80000000
100000000
120000000
140000000
0
50000
100000
150000
200000
250000
300000
350000
Ran
dTon
s
Years
Figure 6: South African carrots exports
Volume (tons) Value (Rand)
10
quantities of carrots to Africa and exports to Europe have increased when compared to the previous year and unallocated export has substantially increased. In 2012, African region continued to be the biggest export markets for carrots originating from South Africa and more than 75% of carrots were exported to this region. In the same year and in 2013, Europe was still a second preferred export market for carrots from South Africa. Considerable volumes were exported to Oceania region while export to Asian region has significantly dropped. During 2013, African region was still the preferred export market for carrots from South Africa; however the carrots were also destined to Namibia, Botswana, Swaziland and Lesotho. In 2014, carrots exports to Africa and Asia regions have notably increased, while the exports to Europe has dropped by 36% in comparison to the 2013 exports. During 2015, Africa region has by far the biggest export market for carrots originating from South Africa. At the same time, there was an increase in carrots exports for Europe, Oceania and unallocated exports, whereas the export destined to Asia region has dramatically decreased. In 2016, Africa region remained the primary export market for carrots originating from South Africa. At the same time, there was a notable increase in carrot exports destined to Europe and Asia region. During 2017, Africa region continued to be the largest recipient of carrot exports from South Africa, however the volume has dropped by 16% compared to 2016 export volume. In the same year, there was a notable decrement in carrot export destined to Asia and Europe, while carrot export to Oceania has sharply increased.As of 2018, Africa region was still by far, the preferred export market for carrot export originating from South Africa. There was also a notable export volume destined to Europe and Americas regions
Source: Quantec Easydata
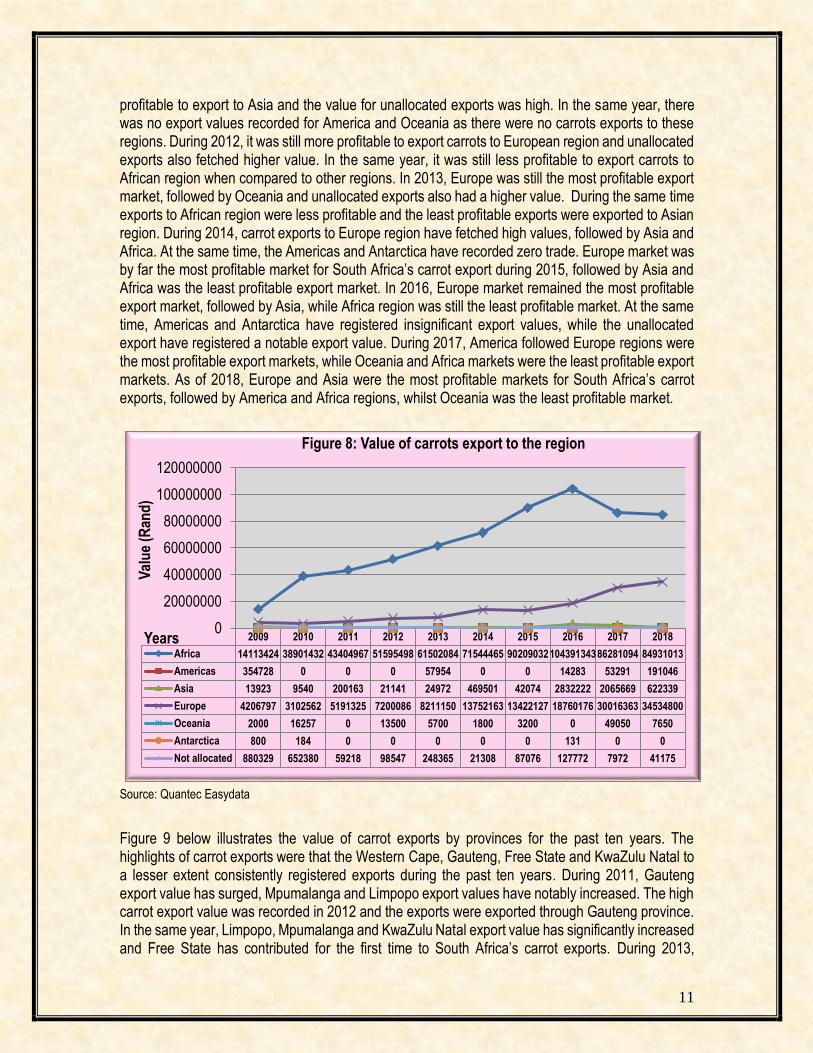
Figure 8 below illustrates South Africa’s value of carrot exports to the regions. The figure shows, that it was more profitable to export carrots to European countries since high values were recorded for less volume exported. High export value was also recorded for African countries due to high volumes exported to that region, but it was less profitable to export to this region. In 2011, it was also more
2009 2010 2011 2012 2013 2014 2015 2016 2017 2018
Africa 3299127 332102379298255382 70678870 13311162 14760759 22160876 19192852 16114546 17395823
Americas 5067 0 0 0 12135 0 0 30 675 22331
Asia 1296 892 31174 2115 9075 52496 3076 276839 103510 7248
Europe 449732 306741 438766 490261 365364 233559 246890 619288 406128 399849
Oceania 1000 1340 0 3850 300 750 2000 0 12628 2600
Antarctica 62 9 0 0 0 0 0 18 0 0
Not allocated 138029 78489 6747 34328 37545 6355 27736 26495 1532 3520
0
50000000
100000000
150000000
200000000
250000000
300000000
350000000
Vo
lum
e (K
g)
Years
Figure 7: South Africa carrot exports to the regions
11
profitable to export to Asia and the value for unallocated exports was high. In the same year, there was no export values recorded for America and Oceania as there were no carrots exports to these regions. During 2012, it was still more profitable to export carrots to European region and unallocated exports also fetched higher value. In the same year, it was still less profitable to export carrots to African region when compared to other regions. In 2013, Europe was still the most profitable export market, followed by Oceania and unallocated exports also had a higher value. During the same time exports to African region were less profitable and the least profitable exports were exported to Asian region. During 2014, carrot exports to Europe region have fetched high values, followed by Asia and Africa. At the same time, the Americas and Antarctica have recorded zero trade. Europe market was by far the most profitable market for South Africa’s carrot export during 2015, followed by Asia and Africa was the least profitable export market. In 2016, Europe market remained the most profitable export market, followed by Asia, while Africa region was still the least profitable market. At the same time, Americas and Antarctica have registered insignificant export values, while the unallocated export have registered a notable export value. During 2017, America followed Europe regions were the most profitable export markets, while Oceania and Africa markets were the least profitable export markets. As of 2018, Europe and Asia were the most profitable markets for South Africa’s carrot exports, followed by America and Africa regions, whilst Oceania was the least profitable market.
Source: Quantec Easydata
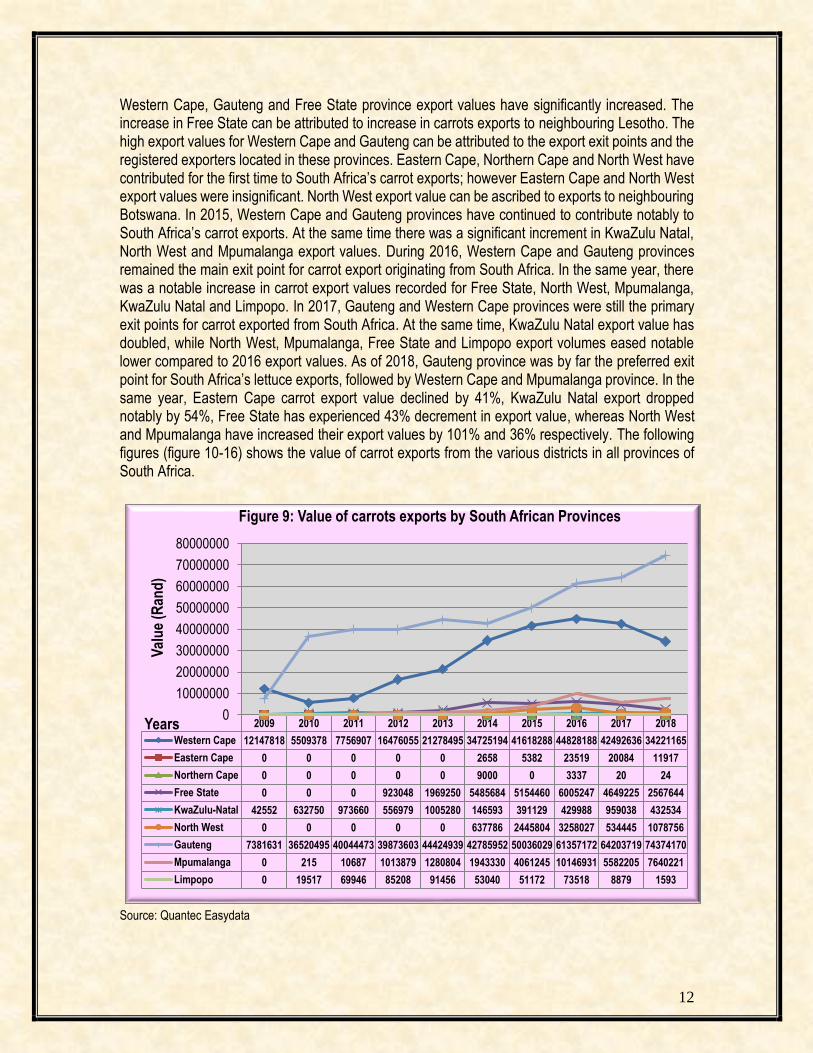
Figure 9 below illustrates the value of carrot exports by provinces for the past ten years. The highlights of carrot exports were that the Western Cape, Gauteng, Free State and KwaZulu Natal to a lesser extent consistently registered exports during the past ten years. During 2011, Gauteng export value has surged, Mpumalanga and Limpopo export values have notably increased. The high carrot export value was recorded in 2012 and the exports were exported through Gauteng province. In the same year, Limpopo, Mpumalanga and KwaZulu Natal export value has significantly increased and Free State has contributed for the first time to South Africa’s carrot exports. During 2013,
2009 2010 2011 2012 2013 2014 2015 2016 2017 2018
Africa 14113424 38901432 43404967 51595498 61502084 71544465 9020903210439134386281094 84931013
Americas 354728 0 0 0 57954 0 0 14283 53291 191046
Asia 13923 9540 200163 21141 24972 469501 42074 2832222 2065669 622339
Europe 4206797 3102562 5191325 7200086 8211150 13752163 13422127 18760176 30016363 34534800
Oceania 2000 16257 0 13500 5700 1800 3200 0 49050 7650
Antarctica 800 184 0 0 0 0 0 131 0 0
Not allocated 880329 652380 59218 98547 248365 21308 87076 127772 7972 41175
0
20000000
40000000
60000000
80000000
100000000
120000000
Val
ue
(Ran
d)
Years
Figure 8: Value of carrots export to the region
12
Western Cape, Gauteng and Free State province export values have significantly increased. The increase in Free State can be attributed to increase in carrots exports to neighbouring Lesotho. The high export values for Western Cape and Gauteng can be attributed to the export exit points and the registered exporters located in these provinces. Eastern Cape, Northern Cape and North West have contributed for the first time to South Africa’s carrot exports; however Eastern Cape and North West export values were insignificant. North West export value can be ascribed to exports to neighbouring Botswana. In 2015, Western Cape and Gauteng provinces have continued to contribute notably to South Africa’s carrot exports. At the same time there was a significant increment in KwaZulu Natal, North West and Mpumalanga export values. During 2016, Western Cape and Gauteng provinces remained the main exit point for carrot export originating from South Africa. In the same year, there was a notable increase in carrot export values recorded for Free State, North West, Mpumalanga, KwaZulu Natal and Limpopo. In 2017, Gauteng and Western Cape provinces were still the primary exit points for carrot exported from South Africa. At the same time, KwaZulu Natal export value has doubled, while North West, Mpumalanga, Free State and Limpopo export volumes eased notable lower compared to 2016 export values. As of 2018, Gauteng province was by far the preferred exit point for South Africa’s lettuce exports, followed by Western Cape and Mpumalanga province. In the same year, Eastern Cape carrot export value declined by 41%, KwaZulu Natal export dropped notably by 54%, Free State has experienced 43% decrement in export value, whereas North West and Mpumalanga have increased their export values by 101% and 36% respectively. The following figures (figure 10-16) shows the value of carrot exports from the various districts in all provinces of South Africa.
Source: Quantec Easydata
2009 2010 2011 2012 2013 2014 2015 2016 2017 2018
Western Cape 12147818 5509378 7756907 16476055 21278495 34725194 41618288 44828188 42492636 34221165
Eastern Cape 0 0 0 0 0 2658 5382 23519 20084 11917
Northern Cape 0 0 0 0 0 9000 0 3337 20 24
Free State 0 0 0 923048 1969250 5485684 5154460 6005247 4649225 2567644
KwaZulu-Natal 42552 632750 973660 556979 1005280 146593 391129 429988 959038 432534
North West 0 0 0 0 0 637786 2445804 3258027 534445 1078756
Gauteng 7381631 36520495 40044473 39873603 44424939 42785952 50036029 61357172 64203719 74374170
Mpumalanga 0 215 10687 1013879 1280804 1943330 4061245 10146931 5582205 7640221
Limpopo 0 19517 69946 85208 91456 53040 51172 73518 8879 1593
0
10000000
20000000
30000000
40000000
50000000
60000000
70000000
80000000
Val
ue
(Ran
d)
Years
Figure 9: Value of carrots exports by South African Provinces
13
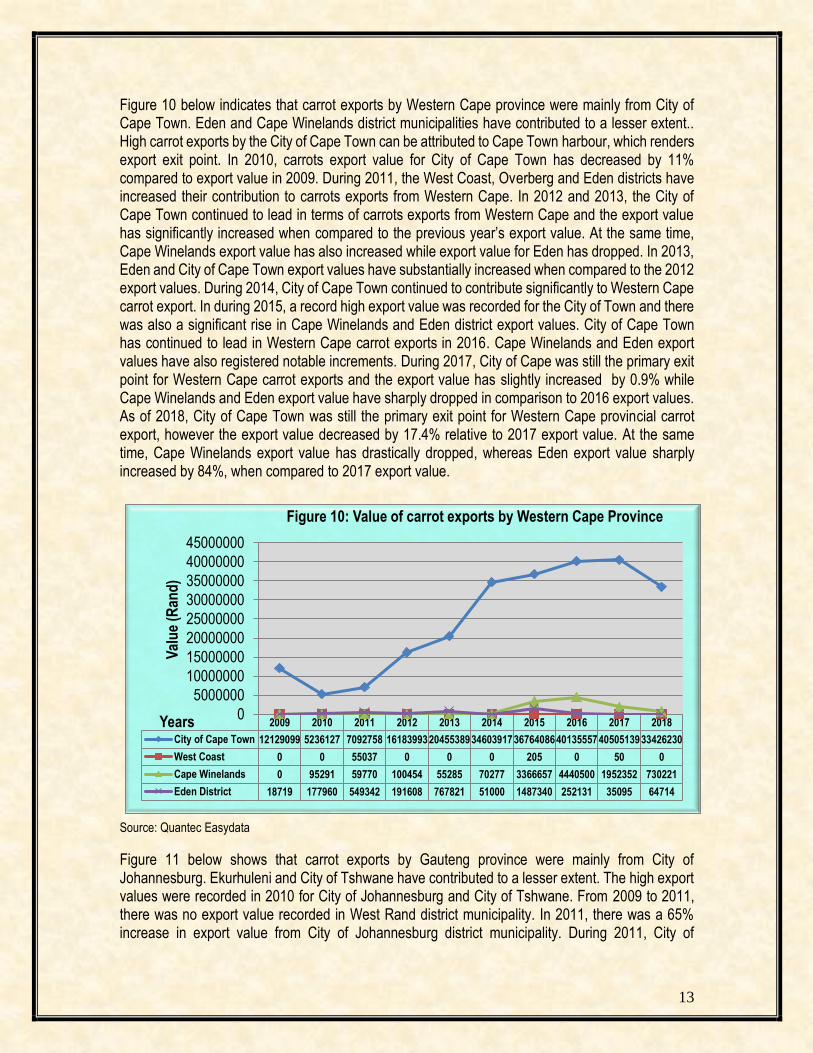
Figure 10 below indicates that carrot exports by Western Cape province were mainly from City of Cape Town. Eden and Cape Winelands district municipalities have contributed to a lesser extent.. High carrot exports by the City of Cape Town can be attributed to Cape Town harbour, which renders export exit point. In 2010, carrots export value for City of Cape Town has decreased by 11% compared to export value in 2009. During 2011, the West Coast, Overberg and Eden districts have increased their contribution to carrots exports from Western Cape. In 2012 and 2013, the City of Cape Town continued to lead in terms of carrots exports from Western Cape and the export value has significantly increased when compared to the previous year’s export value. At the same time, Cape Winelands export value has also increased while export value for Eden has dropped. In 2013, Eden and City of Cape Town export values have substantially increased when compared to the 2012 export values. During 2014, City of Cape Town continued to contribute significantly to Western Cape carrot export. In during 2015, a record high export value was recorded for the City of Town and there was also a significant rise in Cape Winelands and Eden district export values. City of Cape Town has continued to lead in Western Cape carrot exports in 2016. Cape Winelands and Eden export values have also registered notable increments. During 2017, City of Cape was still the primary exit point for Western Cape carrot exports and the export value has slightly increased by 0.9% while Cape Winelands and Eden export value have sharply dropped in comparison to 2016 export values. As of 2018, City of Cape Town was still the primary exit point for Western Cape provincial carrot export, however the export value decreased by 17.4% relative to 2017 export value. At the same time, Cape Winelands export value has drastically dropped, whereas Eden export value sharply increased by 84%, when compared to 2017 export value.
Source: Quantec Easydata
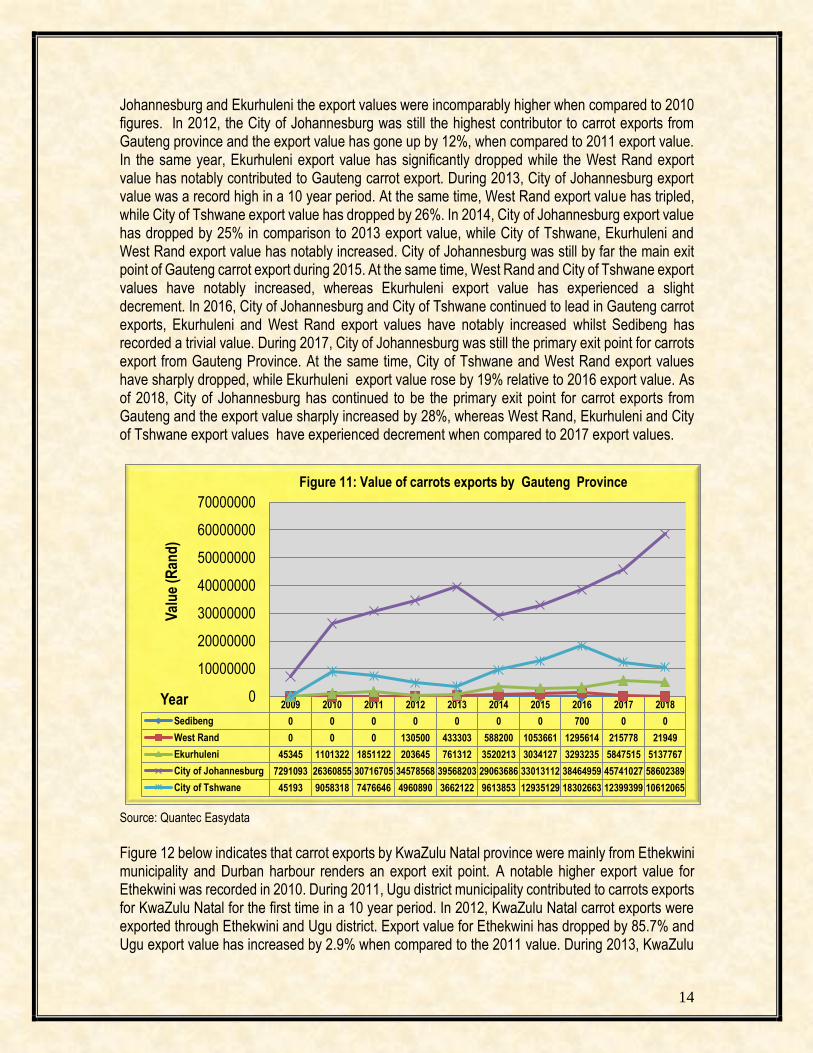
Figure 11 below shows that carrot exports by Gauteng province were mainly from City of Johannesburg. Ekurhuleni and City of Tshwane have contributed to a lesser extent. The high export values were recorded in 2010 for City of Johannesburg and City of Tshwane. From 2009 to 2011, there was no export value recorded in West Rand district municipality. In 2011, there was a 65% increase in export value from City of Johannesburg district municipality. During 2011, City of
2009 2010 2011 2012 2013 2014 2015 2016 2017 2018
City of Cape Town 12129099 5236127 7092758 16183993204553893460391736764086401355574050513933426230
West Coast 0 0 55037 0 0 0 205 0 50 0
Cape Winelands 0 95291 59770 100454 55285 70277 3366657 4440500 1952352 730221
Eden District 18719 177960 549342 191608 767821 51000 1487340 252131 35095 64714
0
5000000
10000000
15000000
20000000
25000000
30000000
35000000
40000000
45000000
Val
ue
(Ran
d)
Years
Figure 10: Value of carrot exports by Western Cape Province
14
Johannesburg and Ekurhuleni the export values were incomparably higher when compared to 2010 figures. In 2012, the City of Johannesburg was still the highest contributor to carrot exports from Gauteng province and the export value has gone up by 12%, when compared to 2011 export value. In the same year, Ekurhuleni export value has significantly dropped while the West Rand export value has notably contributed to Gauteng carrot export. During 2013, City of Johannesburg export value was a record high in a 10 year period. At the same time, West Rand export value has tripled, while City of Tshwane export value has dropped by 26%. In 2014, City of Johannesburg export value has dropped by 25% in comparison to 2013 export value, while City of Tshwane, Ekurhuleni and West Rand export value has notably increased. City of Johannesburg was still by far the main exit point of Gauteng carrot export during 2015. At the same time, West Rand and City of Tshwane export values have notably increased, whereas Ekurhuleni export value has experienced a slight decrement. In 2016, City of Johannesburg and City of Tshwane continued to lead in Gauteng carrot exports, Ekurhuleni and West Rand export values have notably increased whilst Sedibeng has recorded a trivial value. During 2017, City of Johannesburg was still the primary exit point for carrots export from Gauteng Province. At the same time, City of Tshwane and West Rand export values have sharply dropped, while Ekurhuleni export value rose by 19% relative to 2016 export value. As of 2018, City of Johannesburg has continued to be the primary exit point for carrot exports from Gauteng and the export value sharply increased by 28%, whereas West Rand, Ekurhuleni and City of Tshwane export values have experienced decrement when compared to 2017 export values.
Source: Quantec Easydata
Figure 12 below indicates that carrot exports by KwaZulu Natal province were mainly from Ethekwini municipality and Durban harbour renders an export exit point. A notable higher export value for Ethekwini was recorded in 2010. During 2011, Ugu district municipality contributed to carrots exports for KwaZulu Natal for the first time in a 10 year period. In 2012, KwaZulu Natal carrot exports were exported through Ethekwini and Ugu district. Export value for Ethekwini has dropped by 85.7% and Ugu export value has increased by 2.9% when compared to the 2011 value. During 2013, KwaZulu
2009 2010 2011 2012 2013 2014 2015 2016 2017 2018
Sedibeng 0 0 0 0 0 0 0 700 0 0
West Rand 0 0 0 130500 433303 588200 1053661 1295614 215778 21949
Ekurhuleni 45345 1101322 1851122 203645 761312 3520213 3034127 3293235 5847515 5137767
City of Johannesburg 7291093 26360855 30716705 34578568 39568203 29063686 33013112 38464959 45741027 58602389
City of Tshwane 45193 9058318 7476646 4960890 3662122 9613853 12935129 18302663 12399399 10612065
0
10000000
20000000
30000000
40000000
50000000
60000000
70000000
Val
ue
(Ran
d)
Year
Figure 11: Value of carrots exports by Gauteng Province

15
Natal carrots were mainly from Ethekwini and the export value has increased by 187%. In the same year, export value for Ugu has dropped by 5.5%. During 2014, Ugu and EThekwini export values have drastically dropped, when compared to 2013 export values. In 2015, KwaZulu Natal carrot was exported mainly through Ugu and Ethekwini. At the same Umgungundlovu and Sisonke have contributed for the first time to the KwaZulu Natal export value, however the export value were trivial. During 2016, Ethekwini export value increased by 10.3% and Ugu export value has gone up by 10.7% in comparison to 2015 values. In 2017, Ethekwini district was still the main exit point for carrot export from KwaZulu Natal province and the export value was incomparably higher relative to 2016 value. At the same time, Zululand has recorded its first export value, but the value was insignificant. As of 2018, Ethekwini carrot export value has marginally dropped by 55.6% and Zululand export value was incomparably higher when compared to 2017 export value.
Source: Quantec Easydata
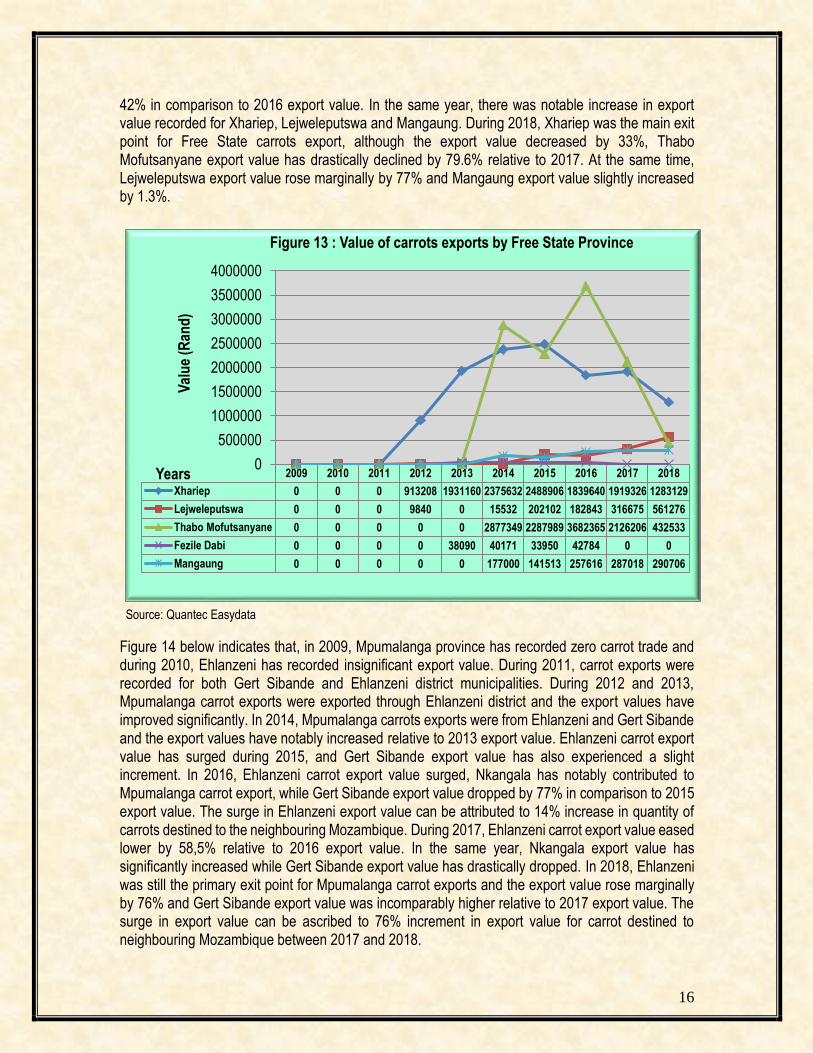
Figure 13 below shows that carrot exports by Free State province were mainly from Xhariep Municipality. From 2009 to 2011, there was no carrot export values recorded for Free State province. During 2012, Xhariep and Lejweleputswa contributed for the first time to Free State province carrot exports, however Lejweleputswa district export value was less significant. In 2013, Xhariep has significantly increased its export value and this can be attributed to an increase in carrots exports to neighbouring Lesotho. In the same year, Fezile Dabi has notably contributed to Free State carrot exports. Free State exports were from the Xhariep, Thabo Mofutsanyane, Fezile Dabi and Mangaung districts during 2014. Free State province has exported carrots primarily through Xhariep and Thabo Mofutsanyane during 2015. There was a surge in Thabo Mofutsanyane carrot export value during 2016, Mangaung, Fezile Dabi have also registered a notable increments in export values. The surge in Thabo Mofutsanyane export value can be ascribed to 26% increase in quantity of exports destined to neighbouring Lesotho. In 2017, Thabo Mofutsanyane was still the primary exit point for carrots export from Free State province, however the export value has sharply dropped by
2009 2010 2011 2012 2013 2014 2015 2016 2017 2018
Ugu 0 0 278950 308690 291600 105375 157490 174480 0 0
Umgungundlovu 0 0 0 0 0 0 1140 0 0 0
Zululand 0 0 0 0 0 0 0 0 902 7252
ILembe 0 0 0 0 0 699 0 0 0 0
Sisonke 0 0 0 0 0 0 1050 0 0 0
Ethekwini 42552 632750 694710 248289 713680 40519 231449 255508 958136 425282
0
200000
400000
600000
800000
1000000
1200000
Val
ue
(Ran
d)
Years
Figure 12: Value of carrots exports by KwaZulu Natal Province
16
42% in comparison to 2016 export value. In the same year, there was notable increase in export value recorded for Xhariep, Lejweleputswa and Mangaung. During 2018, Xhariep was the main exit point for Free State carrots export, although the export value decreased by 33%, Thabo Mofutsanyane export value has drastically declined by 79.6% relative to 2017. At the same time, Lejweleputswa export value rose marginally by 77% and Mangaung export value slightly increased by 1.3%.
Source: Quantec Easydata
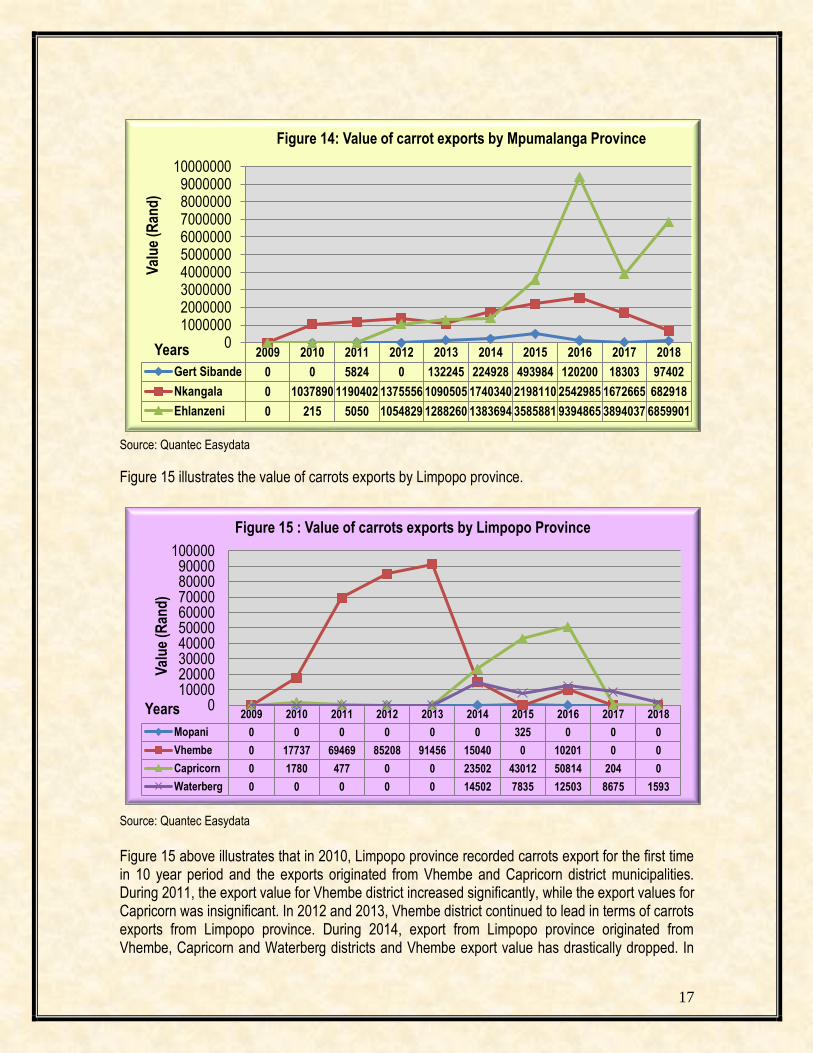
Figure 14 below indicates that, in 2009, Mpumalanga province has recorded zero carrot trade and during 2010, Ehlanzeni has recorded insignificant export value. During 2011, carrot exports were recorded for both Gert Sibande and Ehlanzeni district municipalities. During 2012 and 2013, Mpumalanga carrot exports were exported through Ehlanzeni district and the export values have improved significantly. In 2014, Mpumalanga carrots exports were from Ehlanzeni and Gert Sibande and the export values have notably increased relative to 2013 export value. Ehlanzeni carrot export value has surged during 2015, and Gert Sibande export value has also experienced a slight increment. In 2016, Ehlanzeni carrot export value surged, Nkangala has notably contributed to Mpumalanga carrot export, while Gert Sibande export value dropped by 77% in comparison to 2015 export value. The surge in Ehlanzeni export value can be attributed to 14% increase in quantity of carrots destined to the neighbouring Mozambique. During 2017, Ehlanzeni carrot export value eased lower by 58,5% relative to 2016 export value. In the same year, Nkangala export value has significantly increased while Gert Sibande export value has drastically dropped. In 2018, Ehlanzeni was still the primary exit point for Mpumalanga carrot exports and the export value rose marginally by 76% and Gert Sibande export value was incomparably higher relative to 2017 export value. The surge in export value can be ascribed to 76% increment in export value for carrot destined to neighbouring Mozambique between 2017 and 2018.
2009 2010 2011 2012 2013 2014 2015 2016 2017 2018
Xhariep 0 0 0 913208 1931160 2375632 2488906 1839640 1919326 1283129
Lejweleputswa 0 0 0 9840 0 15532 202102 182843 316675 561276
Thabo Mofutsanyane 0 0 0 0 0 2877349 2287989 3682365 2126206 432533
Fezile Dabi 0 0 0 0 38090 40171 33950 42784 0 0
Mangaung 0 0 0 0 0 177000 141513 257616 287018 290706
0
500000
1000000
1500000
2000000
2500000
3000000
3500000
4000000
Val
ue
(Ran
d)
Years
Figure 13 : Value of carrots exports by Free State Province
17
Source: Quantec Easydata
Figure 15 illustrates the value of carrots exports by Limpopo province.
Source: Quantec Easydata
Figure 15 above illustrates that in 2010, Limpopo province recorded carrots export for the first time in 10 year period and the exports originated from Vhembe and Capricorn district municipalities. During 2011, the export value for Vhembe district increased significantly, while the export values for Capricorn was insignificant. In 2012 and 2013, Vhembe district continued to lead in terms of carrots exports from Limpopo province. During 2014, export from Limpopo province originated from Vhembe, Capricorn and Waterberg districts and Vhembe export value has drastically dropped. In
2009 2010 2011 2012 2013 2014 2015 2016 2017 2018
Gert Sibande 0 0 5824 0 132245 224928 493984 120200 18303 97402
Nkangala 0 1037890 1190402 1375556 1090505 1740340 2198110 2542985 1672665 682918
Ehlanzeni 0 215 5050 1054829 1288260 1383694 3585881 9394865 3894037 6859901
0100000020000003000000400000050000006000000700000080000009000000
10000000V
alu
e (R
and
)
Years
Figure 14: Value of carrot exports by Mpumalanga Province
2009 2010 2011 2012 2013 2014 2015 2016 2017 2018
Mopani 0 0 0 0 0 0 325 0 0 0
Vhembe 0 17737 69469 85208 91456 15040 0 10201 0 0
Capricorn 0 1780 477 0 0 23502 43012 50814 204 0
Waterberg 0 0 0 0 0 14502 7835 12503 8675 1593
0100002000030000400005000060000700008000090000
100000
Val
ue
(Ran
d)
Years
Figure 15 : Value of carrots exports by Limpopo Province
18
2015, Capricorn export value has drastically increased, Waterberg export value has decreased by 45% and Mopani carrot export value was insignificant. During 2016, Limpopo carrot exports were sent through Capricorn, Waterberg and Vhembe districts. In 2017, there was a sharp decline in Limpopo carrot export relative to 2016 export value, and this can be ascribed to 77% decrement in carrot value destined to the neighbouring Zimbabwe. During 2018, Limpopo carrot was exported through Waterberg, however the export value has sharply dropped by 81.6% relative to 2017 export value.
2.3 Share Analysis
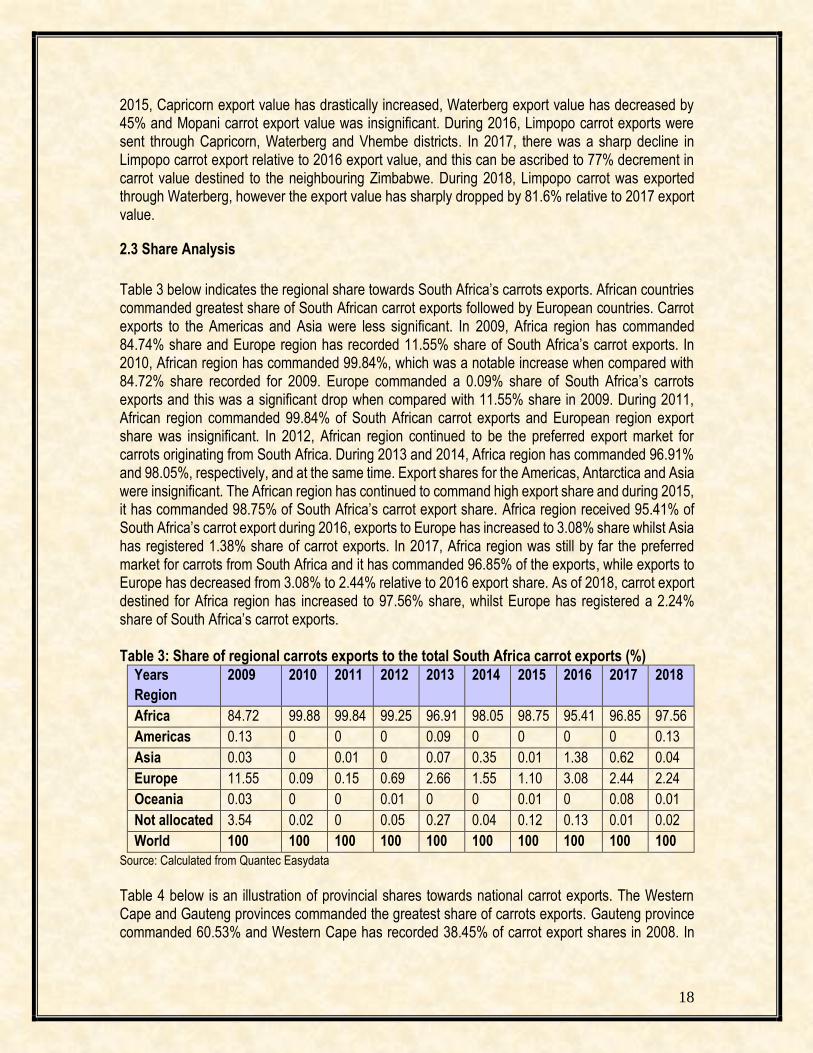
Table 3 below indicates the regional share towards South Africa’s carrots exports. African countries commanded greatest share of South African carrot exports followed by European countries. Carrot exports to the Americas and Asia were less significant. In 2009, Africa region has commanded 84.74% share and Europe region has recorded 11.55% share of South Africa’s carrot exports. In 2010, African region has commanded 99.84%, which was a notable increase when compared with 84.72% share recorded for 2009. Europe commanded a 0.09% share of South Africa’s carrots exports and this was a significant drop when compared with 11.55% share in 2009. During 2011, African region commanded 99.84% of South African carrot exports and European region export share was insignificant. In 2012, African region continued to be the preferred export market for carrots originating from South Africa. During 2013 and 2014, Africa region has commanded 96.91% and 98.05%, respectively, and at the same time. Export shares for the Americas, Antarctica and Asia were insignificant. The African region has continued to command high export share and during 2015, it has commanded 98.75% of South Africa’s carrot export share. Africa region received 95.41% of South Africa’s carrot export during 2016, exports to Europe has increased to 3.08% share whilst Asia has registered 1.38% share of carrot exports. In 2017, Africa region was still by far the preferred market for carrots from South Africa and it has commanded 96.85% of the exports, while exports to Europe has decreased from 3.08% to 2.44% relative to 2016 export share. As of 2018, carrot export destined for Africa region has increased to 97.56% share, whilst Europe has registered a 2.24% share of South Africa’s carrot exports. Table 3: Share of regional carrots exports to the total South Africa carrot exports (%)
Years
Region
2009 2010 2011 2012 2013 2014 2015 2016 2017 2018
Africa 84.72 99.88 99.84 99.25 96.91 98.05 98.75 95.41 96.85 97.56
Americas 0.13 0 0 0 0.09 0 0 0 0 0.13
Asia 0.03 0 0.01 0 0.07 0.35 0.01 1.38 0.62 0.04
Europe 11.55 0.09 0.15 0.69 2.66 1.55 1.10 3.08 2.44 2.24
Oceania 0.03 0 0 0.01 0 0 0.01 0 0.08 0.01
Not allocated 3.54 0.02 0 0.05 0.27 0.04 0.12 0.13 0.01 0.02
World 100 100 100 100 100 100 100 100 100 100
Source: Calculated from Quantec Easydata
Table 4 below is an illustration of provincial shares towards national carrot exports. The Western Cape and Gauteng provinces commanded the greatest share of carrots exports. Gauteng province commanded 60.53% and Western Cape has recorded 38.45% of carrot export shares in 2008. In
19
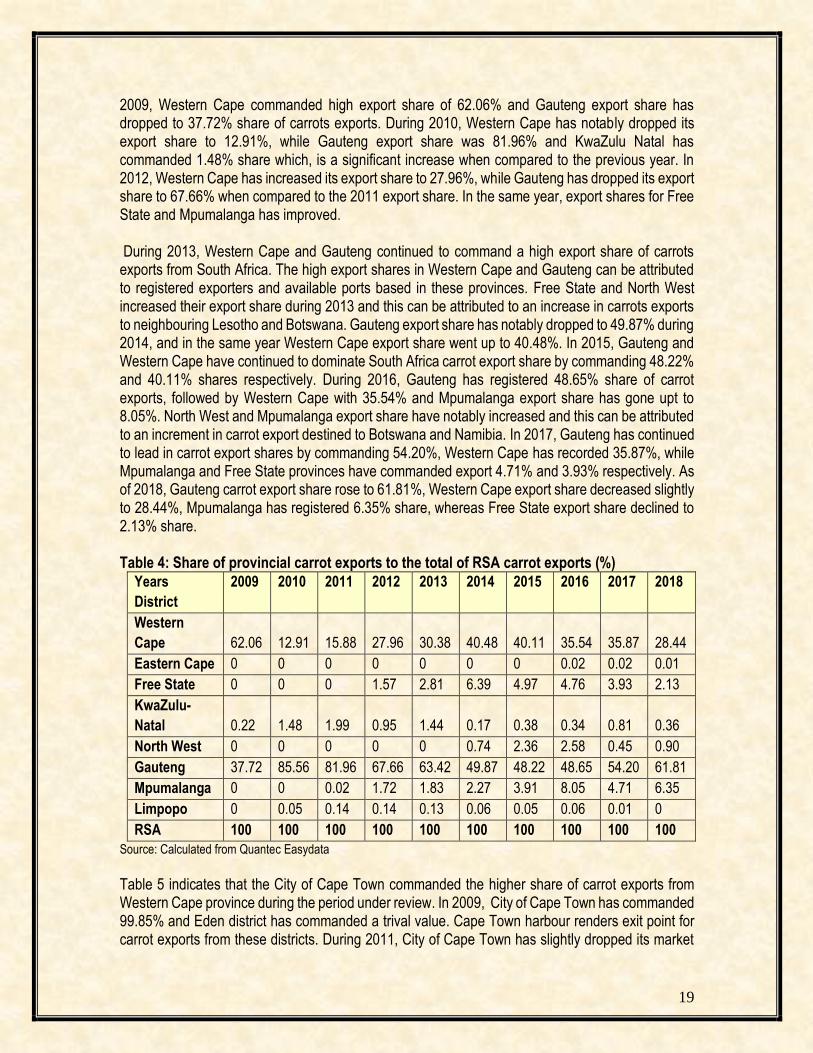
2009, Western Cape commanded high export share of 62.06% and Gauteng export share has dropped to 37.72% share of carrots exports. During 2010, Western Cape has notably dropped its export share to 12.91%, while Gauteng export share was 81.96% and KwaZulu Natal has commanded 1.48% share which, is a significant increase when compared to the previous year. In 2012, Western Cape has increased its export share to 27.96%, while Gauteng has dropped its export share to 67.66% when compared to the 2011 export share. In the same year, export shares for Free State and Mpumalanga has improved. During 2013, Western Cape and Gauteng continued to command a high export share of carrots exports from South Africa. The high export shares in Western Cape and Gauteng can be attributed to registered exporters and available ports based in these provinces. Free State and North West increased their export share during 2013 and this can be attributed to an increase in carrots exports to neighbouring Lesotho and Botswana. Gauteng export share has notably dropped to 49.87% during 2014, and in the same year Western Cape export share went up to 40.48%. In 2015, Gauteng and Western Cape have continued to dominate South Africa carrot export share by commanding 48.22% and 40.11% shares respectively. During 2016, Gauteng has registered 48.65% share of carrot exports, followed by Western Cape with 35.54% and Mpumalanga export share has gone upt to 8.05%. North West and Mpumalanga export share have notably increased and this can be attributed to an increment in carrot export destined to Botswana and Namibia. In 2017, Gauteng has continued to lead in carrot export shares by commanding 54.20%, Western Cape has recorded 35.87%, while Mpumalanga and Free State provinces have commanded export 4.71% and 3.93% respectively. As of 2018, Gauteng carrot export share rose to 61.81%, Western Cape export share decreased slightly to 28.44%, Mpumalanga has registered 6.35% share, whereas Free State export share declined to 2.13% share. Table 4: Share of provincial carrot exports to the total of RSA carrot exports (%)
Years
District
2009 2010 2011 2012 2013 2014 2015 2016 2017 2018
Western
Cape 62.06 12.91 15.88 27.96 30.38 40.48 40.11 35.54 35.87 28.44
Eastern Cape 0 0 0 0 0 0 0 0.02 0.02 0.01
Free State 0 0 0 1.57 2.81 6.39 4.97 4.76 3.93 2.13
KwaZulu-
Natal 0.22 1.48 1.99 0.95 1.44 0.17 0.38 0.34 0.81 0.36
North West 0 0 0 0 0 0.74 2.36 2.58 0.45 0.90
Gauteng 37.72 85.56 81.96 67.66 63.42 49.87 48.22 48.65 54.20 61.81
Mpumalanga 0 0 0.02 1.72 1.83 2.27 3.91 8.05 4.71 6.35
Limpopo 0 0.05 0.14 0.14 0.13 0.06 0.05 0.06 0.01 0
RSA 100 100 100 100 100 100 100 100 100 100
Source: Calculated from Quantec Easydata
Table 5 indicates that the City of Cape Town commanded the higher share of carrot exports from Western Cape province during the period under review. In 2009, City of Cape Town has commanded 99.85% and Eden district has commanded a trival value. Cape Town harbour renders exit point for carrot exports from these districts. During 2011, City of Cape Town has slightly dropped its market

20
share while Eden has commanded 7.08% share of Western Cape carrots exports. In 2012, the City of Cape Town continued to lead in Western Cape carrots export and it has increased its export share from 91.89% to 98.23%. In the same time the export share for Eden has dropped from 7.08% to 1.16%. In 2013, export share for the City of Cape Town has slightly dropped while Eden has increased its carrot export share. During 2014, City of Cape Town has commanded 99.65% share of Western Cape carrot export. There was a notable decline in City of Cape Town export share in 2015, while Cape Winelands and Eden export share have experienced a notable increment. During 2016, City of Cape Town continued to lead in Western Cape carrot export and it has commanded 89.53%, Cape Winelands has recorded 9.91% share, whereas Eden export share has dropped to 0.56%. In 2017, City of Cape Town has increased its export share from 89.53% to 95.32%, while Cape Winelands export share has dropped from 9.91% to 4.59%. As of 2018, City of Cape Town carrot export share rose to 97.68%, whilst Cape Winelands export share declined to 2.13% share. Table 5: Share of district carrots exports to total Western Cape provincial carrot exports (%)
Year District
2009 2010 2011 2012 2013 2014 2015 2016 2017 2018
City of Cape Town 99.85 95.04 91.89 98.23 96.13 99.65 88.34 89.53 95.32 97.68
West Coast 0 0 0.71 0 0 0 0 0 0 0
Cape Winelands 0 1.73 0.32 0.61 0.26 0.20 8.09 9.91 4.59 2.13
Eden 0.15 3.23 7.08 1.16 3.61 0.15 3.57 0.56 0.08 0.19
Western Cape 100 100 100 100 100 100 100 100 100 100 Source: Calculated from Quantec Easydata
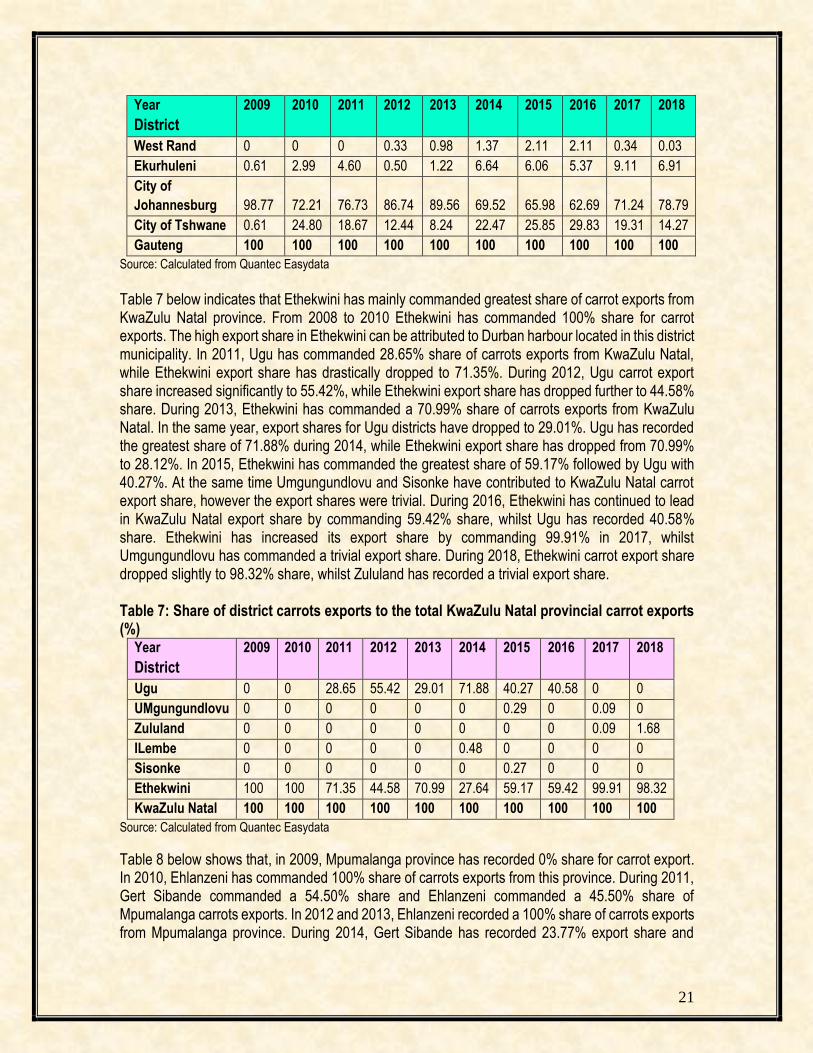
Table 6 below shows that City of Johannesburg commanded the greatest share of carrot exports from Gauteng province. In 2009, City of Johannesburg has commanded more than 90% share of Gauteng carrot exports. During 2010, City of Tshwane municipality has commanded 24.80% export share, this was an improvement when compared to 0.61% share in 2009, while City of Johannesburg has also decreased its export share from 98.77% to 72.21%. City of Johannesburg and Ekurhuleni are located near OR Tambo International Airport, which renders exit point for carrot exports. During 2012, City of Johannesburg continued to lead in Gauteng carrot exports by commanding 86.74% share. In the same year, West Rand export has commanded its first export share, but the share was insignificant. Carrot export share for the City of Johannesburg has slightly increased to 89.56% in 2013. During 2014, City of Johannesburg export share has dropped to 69.52%, while City of Tshwane and Ekurhuleni export shares went up to 22.47% and 6.64% respectively. In 2015, City of Johannesburg has continued to record higher export share of Gauteng provincial carrot export, followed by City of Tshwane with 25.85%, Ekurhuleni with 6.06% and West Rand with 2.11%. During 2016, City of Johannesburg export share has dropped to 62.69%, City of Tshwane export share has increased to 29.83%, whilst Ekurhuleni export share has slightly dropped to 5.37%. City of Johannesburg has continued to lead in Gauteng carrot export share and in 2017, it has commanded 71.24% share. At the same time, Ekurhuleni export share has gone up to 9.11%, whereas the City of Tshwane export share has notably dropped from 29.83% to 19.31%. As of 2018, City of Johannesburg has commanded 78.79% share, City of Tshwane export share has dropped to 14.27%, Ekurhuleni export share has gone down to 6.91% relative to 2017 export share. Table 6: Share of district carrots exports to the total Gauteng provincial carrot exports (%)
21
Year
District
2009 2010 2011 2012 2013 2014 2015 2016 2017 2018
West Rand 0 0 0 0.33 0.98 1.37 2.11 2.11 0.34 0.03
Ekurhuleni 0.61 2.99 4.60 0.50 1.22 6.64 6.06 5.37 9.11 6.91
City of
Johannesburg 98.77 72.21 76.73 86.74 89.56 69.52 65.98 62.69 71.24 78.79
City of Tshwane 0.61 24.80 18.67 12.44 8.24 22.47 25.85 29.83 19.31 14.27
Gauteng 100 100 100 100 100 100 100 100 100 100
Source: Calculated from Quantec Easydata
Table 7 below indicates that Ethekwini has mainly commanded greatest share of carrot exports from KwaZulu Natal province. From 2008 to 2010 Ethekwini has commanded 100% share for carrot exports. The high export share in Ethekwini can be attributed to Durban harbour located in this district municipality. In 2011, Ugu has commanded 28.65% share of carrots exports from KwaZulu Natal, while Ethekwini export share has drastically dropped to 71.35%. During 2012, Ugu carrot export share increased significantly to 55.42%, while Ethekwini export share has dropped further to 44.58% share. During 2013, Ethekwini has commanded a 70.99% share of carrots exports from KwaZulu Natal. In the same year, export shares for Ugu districts have dropped to 29.01%. Ugu has recorded the greatest share of 71.88% during 2014, while Ethekwini export share has dropped from 70.99% to 28.12%. In 2015, Ethekwini has commanded the greatest share of 59.17% followed by Ugu with 40.27%. At the same time Umgungundlovu and Sisonke have contributed to KwaZulu Natal carrot export share, however the export shares were trivial. During 2016, Ethekwini has continued to lead in KwaZulu Natal export share by commanding 59.42% share, whilst Ugu has recorded 40.58% share. Ethekwini has increased its export share by commanding 99.91% in 2017, whilst Umgungundlovu has commanded a trivial export share. During 2018, Ethekwini carrot export share dropped slightly to 98.32% share, whilst Zululand has recorded a trivial export share. Table 7: Share of district carrots exports to the total KwaZulu Natal provincial carrot exports (%)
Year
District
2009 2010 2011 2012 2013 2014 2015 2016 2017 2018
Ugu 0 0 28.65 55.42 29.01 71.88 40.27 40.58 0 0
UMgungundlovu 0 0 0 0 0 0 0.29 0 0.09 0
Zululand 0 0 0 0 0 0 0 0 0.09 1.68
ILembe 0 0 0 0 0 0.48 0 0 0 0
Sisonke 0 0 0 0 0 0 0.27 0 0 0
Ethekwini 100 100 71.35 44.58 70.99 27.64 59.17 59.42 99.91 98.32
KwaZulu Natal 100 100 100 100 100 100 100 100 100 100
Source: Calculated from Quantec Easydata
Table 8 below shows that, in 2009, Mpumalanga province has recorded 0% share for carrot export. In 2010, Ehlanzeni has commanded 100% share of carrots exports from this province. During 2011, Gert Sibande commanded a 54.50% share and Ehlanzeni commanded a 45.50% share of Mpumalanga carrots exports. In 2012 and 2013, Ehlanzeni recorded a 100% share of carrots exports from Mpumalanga province. During 2014, Gert Sibande has recorded 23.77% export share and
22
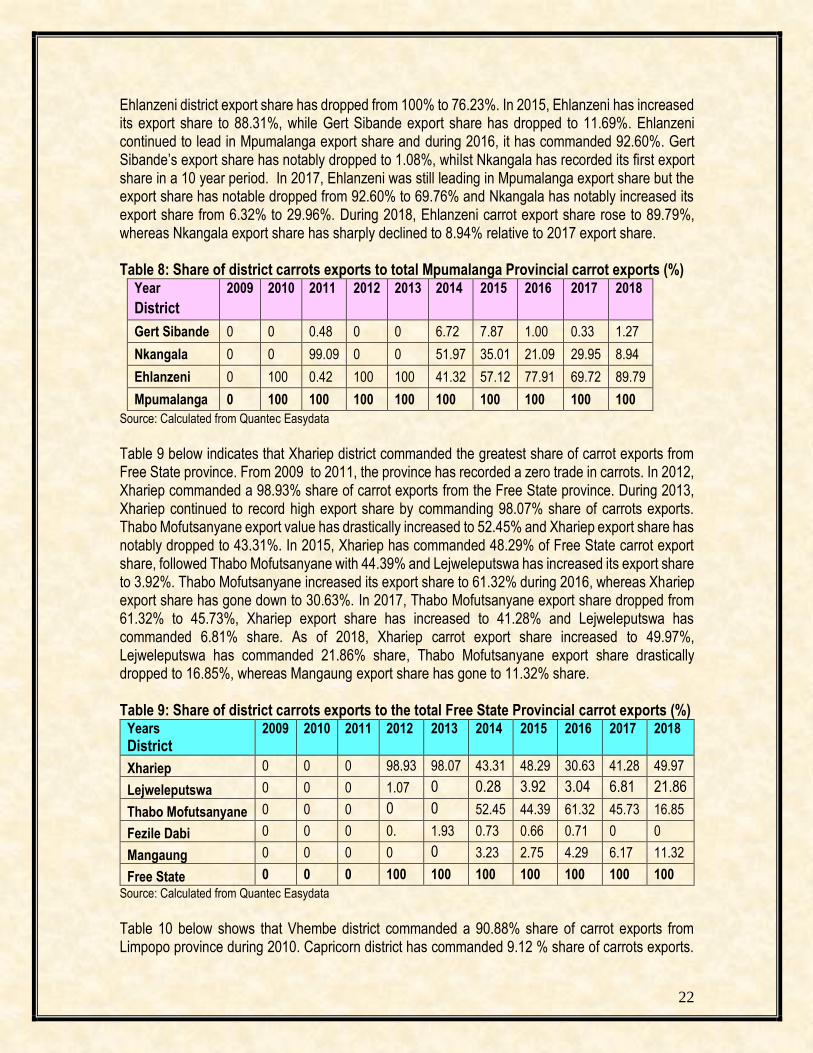
Ehlanzeni district export share has dropped from 100% to 76.23%. In 2015, Ehlanzeni has increased its export share to 88.31%, while Gert Sibande export share has dropped to 11.69%. Ehlanzeni continued to lead in Mpumalanga export share and during 2016, it has commanded 92.60%. Gert Sibande’s export share has notably dropped to 1.08%, whilst Nkangala has recorded its first export share in a 10 year period. In 2017, Ehlanzeni was still leading in Mpumalanga export share but the export share has notable dropped from 92.60% to 69.76% and Nkangala has notably increased its export share from 6.32% to 29.96%. During 2018, Ehlanzeni carrot export share rose to 89.79%, whereas Nkangala export share has sharply declined to 8.94% relative to 2017 export share. Table 8: Share of district carrots exports to total Mpumalanga Provincial carrot exports (%)
Year
District
2009 2010 2011 2012 2013 2014 2015 2016 2017 2018
Gert Sibande 0 0 0.48 0 0 6.72 7.87 1.00 0.33 1.27
Nkangala 0 0 99.09 0 0 51.97 35.01 21.09 29.95 8.94
Ehlanzeni 0 100 0.42 100 100 41.32 57.12 77.91 69.72 89.79
Mpumalanga 0 100 100 100 100 100 100 100 100 100
Source: Calculated from Quantec Easydata
Table 9 below indicates that Xhariep district commanded the greatest share of carrot exports from Free State province. From 2009 to 2011, the province has recorded a zero trade in carrots. In 2012, Xhariep commanded a 98.93% share of carrot exports from the Free State province. During 2013, Xhariep continued to record high export share by commanding 98.07% share of carrots exports. Thabo Mofutsanyane export value has drastically increased to 52.45% and Xhariep export share has notably dropped to 43.31%. In 2015, Xhariep has commanded 48.29% of Free State carrot export share, followed Thabo Mofutsanyane with 44.39% and Lejweleputswa has increased its export share to 3.92%. Thabo Mofutsanyane increased its export share to 61.32% during 2016, whereas Xhariep export share has gone down to 30.63%. In 2017, Thabo Mofutsanyane export share dropped from 61.32% to 45.73%, Xhariep export share has increased to 41.28% and Lejweleputswa has commanded 6.81% share. As of 2018, Xhariep carrot export share increased to 49.97%, Lejweleputswa has commanded 21.86% share, Thabo Mofutsanyane export share drastically dropped to 16.85%, whereas Mangaung export share has gone to 11.32% share. Table 9: Share of district carrots exports to the total Free State Provincial carrot exports (%)
Years District
2009 2010 2011 2012 2013 2014 2015 2016 2017 2018
Xhariep 0 0 0 98.93 98.07 43.31 48.29 30.63 41.28 49.97
Lejweleputswa 0 0 0 1.07 0 0.28 3.92 3.04 6.81 21.86
Thabo Mofutsanyane 0 0 0 0 0 52.45 44.39 61.32 45.73 16.85
Fezile Dabi 0 0 0 0. 1.93 0.73 0.66 0.71 0 0
Mangaung 0 0 0 0 0 3.23 2.75 4.29 6.17 11.32
Free State 0 0 0 100 100 100 100 100 100 100
Source: Calculated from Quantec Easydata
Table 10 below shows that Vhembe district commanded a 90.88% share of carrot exports from Limpopo province during 2010. Capricorn district has commanded 9.12 % share of carrots exports.
23
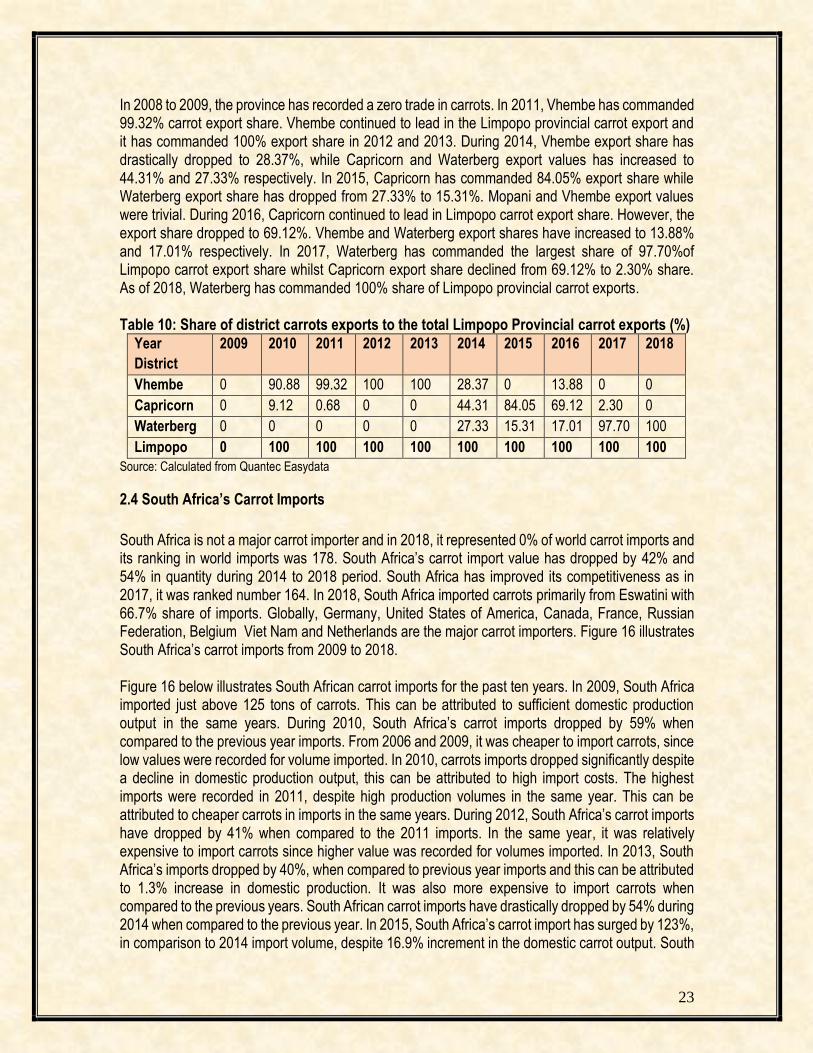
In 2008 to 2009, the province has recorded a zero trade in carrots. In 2011, Vhembe has commanded 99.32% carrot export share. Vhembe continued to lead in the Limpopo provincial carrot export and it has commanded 100% export share in 2012 and 2013. During 2014, Vhembe export share has drastically dropped to 28.37%, while Capricorn and Waterberg export values has increased to 44.31% and 27.33% respectively. In 2015, Capricorn has commanded 84.05% export share while Waterberg export share has dropped from 27.33% to 15.31%. Mopani and Vhembe export values were trivial. During 2016, Capricorn continued to lead in Limpopo carrot export share. However, the export share dropped to 69.12%. Vhembe and Waterberg export shares have increased to 13.88% and 17.01% respectively. In 2017, Waterberg has commanded the largest share of 97.70%of Limpopo carrot export share whilst Capricorn export share declined from 69.12% to 2.30% share. As of 2018, Waterberg has commanded 100% share of Limpopo provincial carrot exports. Table 10: Share of district carrots exports to the total Limpopo Provincial carrot exports (%)
Year
District
2009 2010 2011 2012 2013 2014 2015 2016 2017 2018
Vhembe 0 90.88 99.32 100 100 28.37 0 13.88 0 0
Capricorn 0 9.12 0.68 0 0 44.31 84.05 69.12 2.30 0
Waterberg 0 0 0 0 0 27.33 15.31 17.01 97.70 100
Limpopo 0 100 100 100 100 100 100 100 100 100
Source: Calculated from Quantec Easydata
2.4 South Africa’s Carrot Imports
South Africa is not a major carrot importer and in 2018, it represented 0% of world carrot imports and its ranking in world imports was 178. South Africa’s carrot import value has dropped by 42% and 54% in quantity during 2014 to 2018 period. South Africa has improved its competitiveness as in 2017, it was ranked number 164. In 2018, South Africa imported carrots primarily from Eswatini with 66.7% share of imports. Globally, Germany, United States of America, Canada, France, Russian Federation, Belgium Viet Nam and Netherlands are the major carrot importers. Figure 16 illustrates South Africa’s carrot imports from 2009 to 2018. Figure 16 below illustrates South African carrot imports for the past ten years. In 2009, South Africa imported just above 125 tons of carrots. This can be attributed to sufficient domestic production output in the same years. During 2010, South Africa’s carrot imports dropped by 59% when compared to the previous year imports. From 2006 and 2009, it was cheaper to import carrots, since low values were recorded for volume imported. In 2010, carrots imports dropped significantly despite a decline in domestic production output, this can be attributed to high import costs. The highest imports were recorded in 2011, despite high production volumes in the same year. This can be attributed to cheaper carrots in imports in the same years. During 2012, South Africa’s carrot imports have dropped by 41% when compared to the 2011 imports. In the same year, it was relatively expensive to import carrots since higher value was recorded for volumes imported. In 2013, South Africa’s imports dropped by 40%, when compared to previous year imports and this can be attributed to 1.3% increase in domestic production. It was also more expensive to import carrots when compared to the previous years. South African carrot imports have drastically dropped by 54% during 2014 when compared to the previous year. In 2015, South Africa’s carrot import has surged by 123%, in comparison to 2014 import volume, despite 16.9% increment in the domestic carrot output. South
24
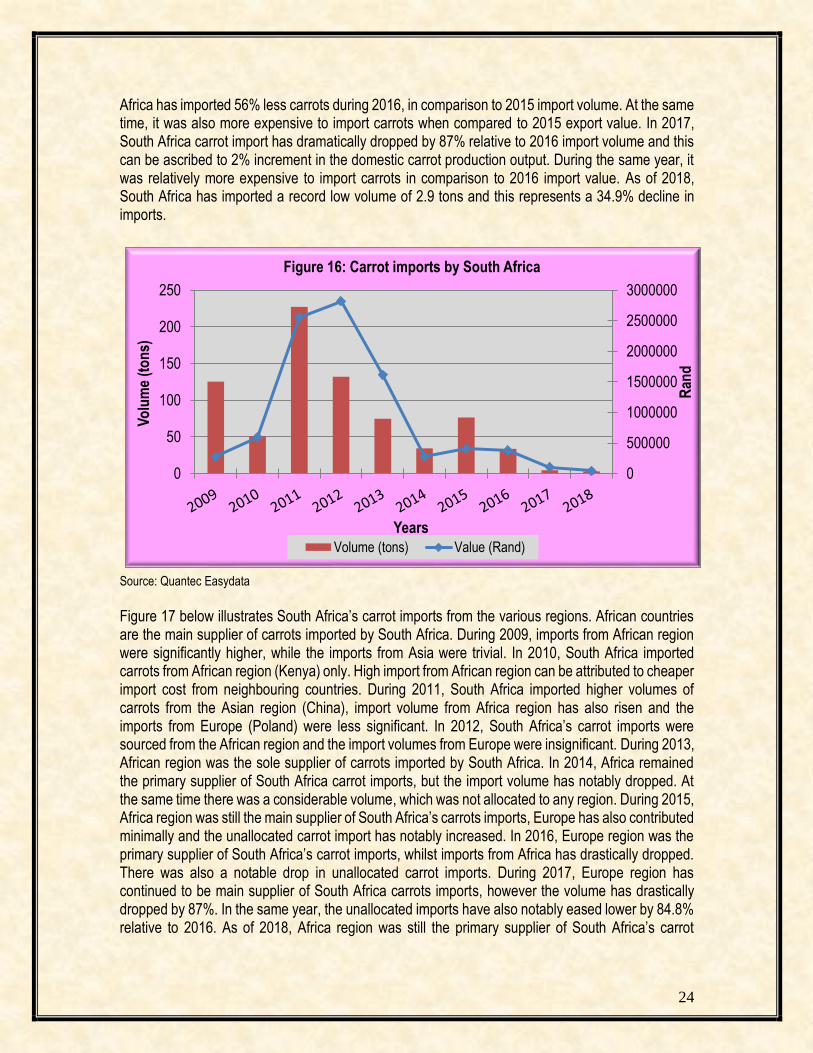
Africa has imported 56% less carrots during 2016, in comparison to 2015 import volume. At the same time, it was also more expensive to import carrots when compared to 2015 export value. In 2017, South Africa carrot import has dramatically dropped by 87% relative to 2016 import volume and this can be ascribed to 2% increment in the domestic carrot production output. During the same year, it was relatively more expensive to import carrots in comparison to 2016 import value. As of 2018, South Africa has imported a record low volume of 2.9 tons and this represents a 34.9% decline in imports.
Source: Quantec Easydata Figure 17 below illustrates South Africa’s carrot imports from the various regions. African countries are the main supplier of carrots imported by South Africa. During 2009, imports from African region were significantly higher, while the imports from Asia were trivial. In 2010, South Africa imported carrots from African region (Kenya) only. High import from African region can be attributed to cheaper import cost from neighbouring countries. During 2011, South Africa imported higher volumes of carrots from the Asian region (China), import volume from Africa region has also risen and the imports from Europe (Poland) were less significant. In 2012, South Africa’s carrot imports were sourced from the African region and the import volumes from Europe were insignificant. During 2013, African region was the sole supplier of carrots imported by South Africa. In 2014, Africa remained the primary supplier of South Africa carrot imports, but the import volume has notably dropped. At the same time there was a considerable volume, which was not allocated to any region. During 2015, Africa region was still the main supplier of South Africa’s carrots imports, Europe has also contributed minimally and the unallocated carrot import has notably increased. In 2016, Europe region was the primary supplier of South Africa’s carrot imports, whilst imports from Africa has drastically dropped. There was also a notable drop in unallocated carrot imports. During 2017, Europe region has continued to be main supplier of South Africa carrots imports, however the volume has drastically dropped by 87%. In the same year, the unallocated imports have also notably eased lower by 84.8% relative to 2016. As of 2018, Africa region was still the primary supplier of South Africa’s carrot
0
500000
1000000
1500000
2000000
2500000
3000000
0
50
100
150
200
250
Ran
d
Vo
lum
e (t
on
s)
Years
Figure 16: Carrot imports by South Africa
Volume (tons) Value (Rand)
25
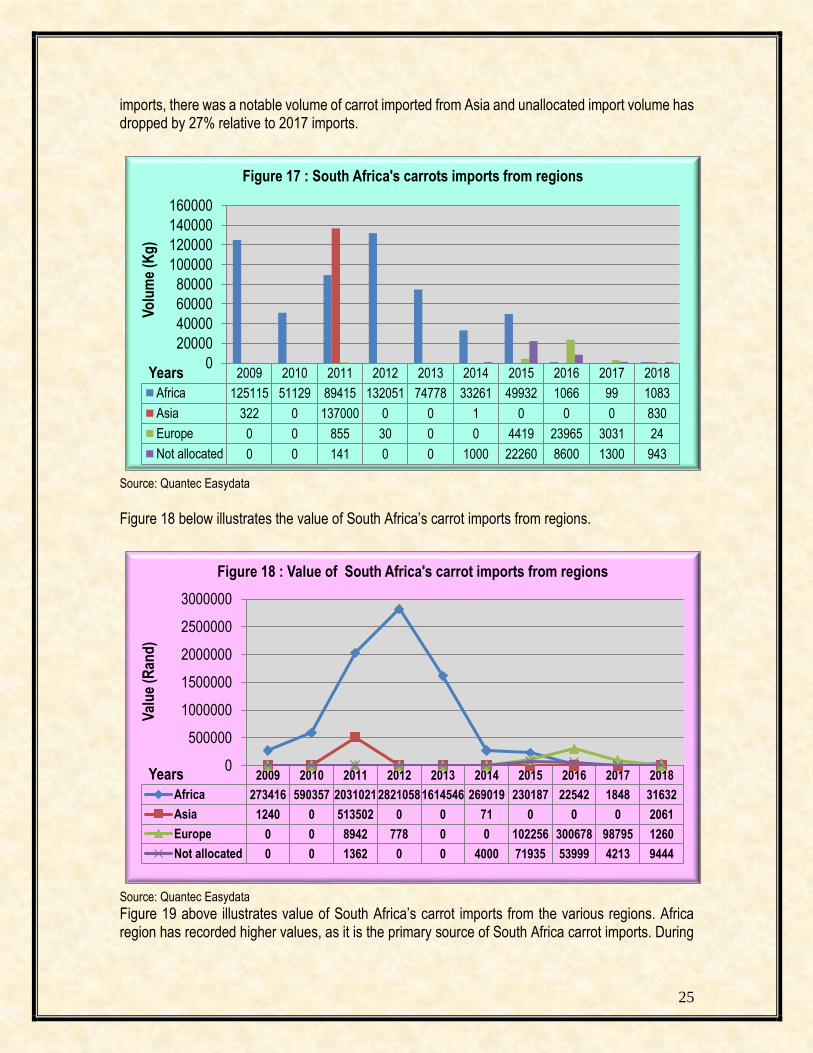
imports, there was a notable volume of carrot imported from Asia and unallocated import volume has dropped by 27% relative to 2017 imports.
Source: Quantec Easydata
Figure 18 below illustrates the value of South Africa’s carrot imports from regions.
Source: Quantec Easydata
Figure 19 above illustrates value of South Africa’s carrot imports from the various regions. Africa region has recorded higher values, as it is the primary source of South Africa carrot imports. During
2009 2010 2011 2012 2013 2014 2015 2016 2017 2018
Africa 125115 51129 89415 132051 74778 33261 49932 1066 99 1083
Asia 322 0 137000 0 0 1 0 0 0 830
Europe 0 0 855 30 0 0 4419 23965 3031 24
Not allocated 0 0 141 0 0 1000 22260 8600 1300 943
0
20000
40000
60000
80000
100000
120000
140000
160000
Vo
lum
e (K
g)
Years
Figure 17 : South Africa's carrots imports from regions
2009 2010 2011 2012 2013 2014 2015 2016 2017 2018
Africa 273416 590357 203102128210581614546 269019 230187 22542 1848 31632
Asia 1240 0 513502 0 0 71 0 0 0 2061
Europe 0 0 8942 778 0 0 102256 300678 98795 1260
Not allocated 0 0 1362 0 0 4000 71935 53999 4213 9444
0
500000
1000000
1500000
2000000
2500000
3000000
Val
ue
(Ran
d)
Years
Figure 18 : Value of South Africa's carrot imports from regions
26
2011, it was by far more expensive to import carrots from the African region in comparison to Asian imports. In 2013, South Africa has imported carrots in Africa and the imports were more expensive compared to 2012 imports. During 2013, carrot imports from Africa region were relatively cheaper, in comparison to the previous year imports. In 2015, carrots sourced from Europe region were relatively more expensive compared to imports from Africa region. It was more expensive to import carrots from Africa region during 2016, when compared to carrots imported from Europe region. In 2017, it was relatively more expensive for South Africa to import carrots from Europe region relative to 2016 imports. As of 2018, it was still more expensive to import carrots from Europe region, followed by Africa region and unallocated import had registered lower import value.
Source: Quantec Easydata
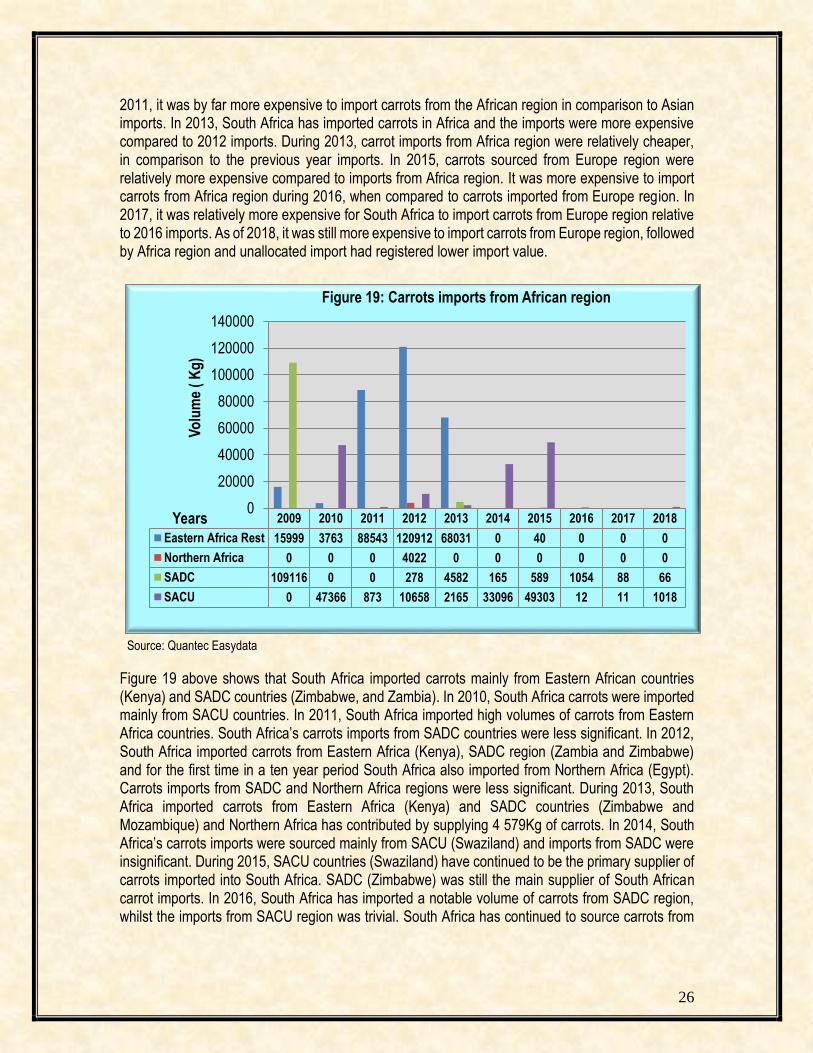
Figure 19 above shows that South Africa imported carrots mainly from Eastern African countries (Kenya) and SADC countries (Zimbabwe, and Zambia). In 2010, South Africa carrots were imported mainly from SACU countries. In 2011, South Africa imported high volumes of carrots from Eastern Africa countries. South Africa’s carrots imports from SADC countries were less significant. In 2012, South Africa imported carrots from Eastern Africa (Kenya), SADC region (Zambia and Zimbabwe) and for the first time in a ten year period South Africa also imported from Northern Africa (Egypt). Carrots imports from SADC and Northern Africa regions were less significant. During 2013, South Africa imported carrots from Eastern Africa (Kenya) and SADC countries (Zimbabwe and Mozambique) and Northern Africa has contributed by supplying 4 579Kg of carrots. In 2014, South Africa’s carrots imports were sourced mainly from SACU (Swaziland) and imports from SADC were insignificant. During 2015, SACU countries (Swaziland) have continued to be the primary supplier of carrots imported into South Africa. SADC (Zimbabwe) was still the main supplier of South African carrot imports. In 2016, South Africa has imported a notable volume of carrots from SADC region, whilst the imports from SACU region was trivial. South Africa has continued to source carrots from
2009 2010 2011 2012 2013 2014 2015 2016 2017 2018
Eastern Africa Rest 15999 3763 88543 120912 68031 0 40 0 0 0
Northern Africa 0 0 0 4022 0 0 0 0 0 0
SADC 109116 0 0 278 4582 165 589 1054 88 66
SACU 0 47366 873 10658 2165 33096 49303 12 11 1018
0
20000
40000
60000
80000
100000
120000
140000
Vo
lum
e (
Kg
)
Years
Figure 19: Carrots imports from African region
27
SADC and SACU, but the volumes were insignificant. During 2018, SACU region was the primary supplier of South Africa’s carrot imports and import volume from SADC was trivial.
Source: Quantec Easydata
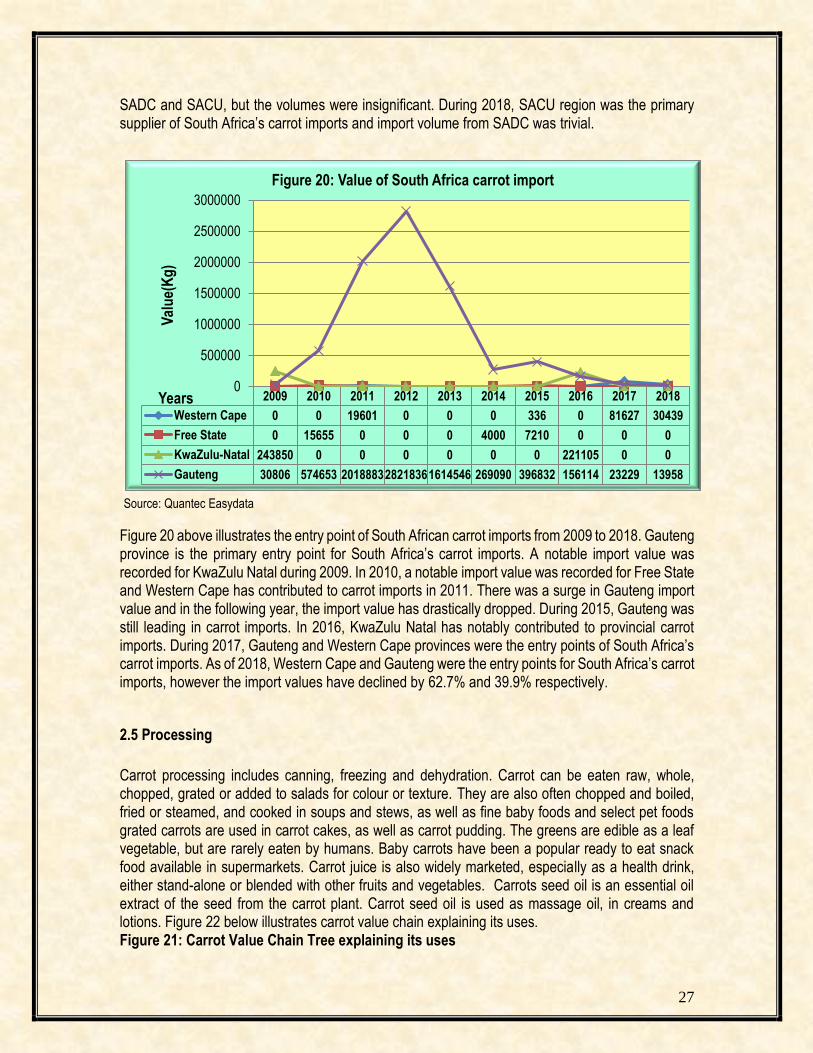
Figure 20 above illustrates the entry point of South African carrot imports from 2009 to 2018. Gauteng province is the primary entry point for South Africa’s carrot imports. A notable import value was recorded for KwaZulu Natal during 2009. In 2010, a notable import value was recorded for Free State and Western Cape has contributed to carrot imports in 2011. There was a surge in Gauteng import value and in the following year, the import value has drastically dropped. During 2015, Gauteng was still leading in carrot imports. In 2016, KwaZulu Natal has notably contributed to provincial carrot imports. During 2017, Gauteng and Western Cape provinces were the entry points of South Africa’s carrot imports. As of 2018, Western Cape and Gauteng were the entry points for South Africa’s carrot imports, however the import values have declined by 62.7% and 39.9% respectively.
2.5 Processing
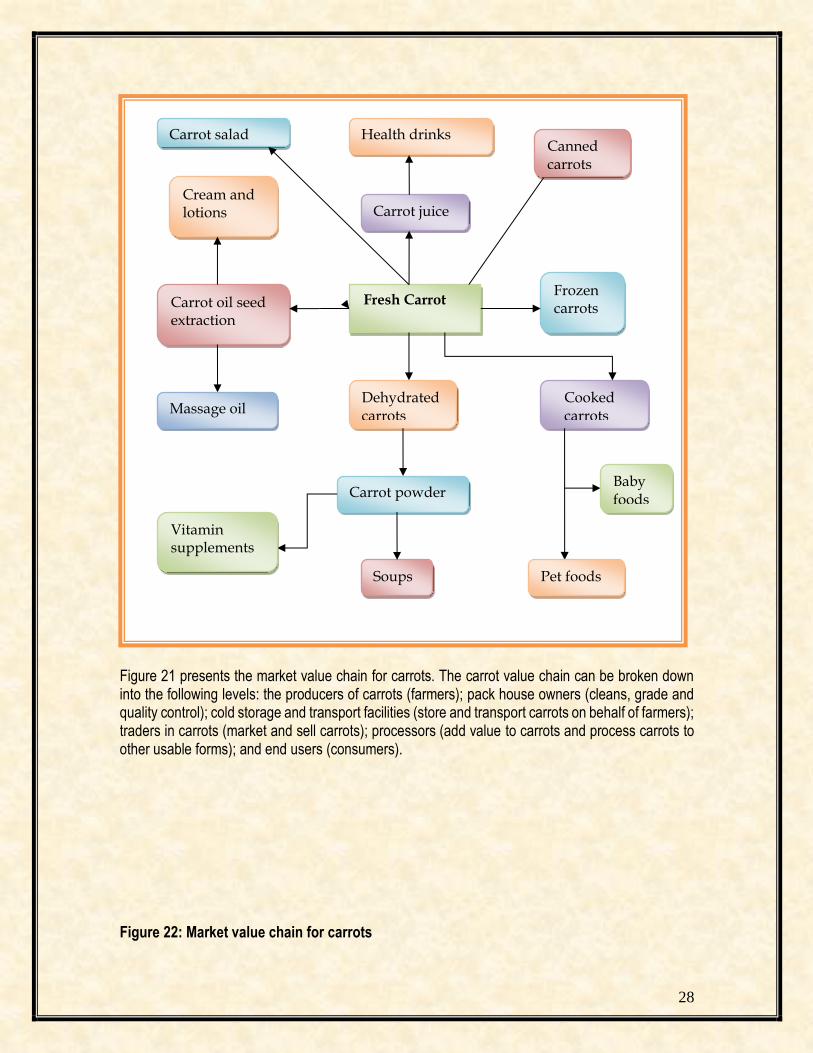
Carrot processing includes canning, freezing and dehydration. Carrot can be eaten raw, whole, chopped, grated or added to salads for colour or texture. They are also often chopped and boiled, fried or steamed, and cooked in soups and stews, as well as fine baby foods and select pet foods grated carrots are used in carrot cakes, as well as carrot pudding. The greens are edible as a leaf vegetable, but are rarely eaten by humans. Baby carrots have been a popular ready to eat snack food available in supermarkets. Carrot juice is also widely marketed, especially as a health drink, either stand-alone or blended with other fruits and vegetables. Carrots seed oil is an essential oil extract of the seed from the carrot plant. Carrot seed oil is used as massage oil, in creams and lotions. Figure 22 below illustrates carrot value chain explaining its uses. Figure 21: Carrot Value Chain Tree explaining its uses
2009 2010 2011 2012 2013 2014 2015 2016 2017 2018
Western Cape 0 0 19601 0 0 0 336 0 81627 30439
Free State 0 15655 0 0 0 4000 7210 0 0 0
KwaZulu-Natal 243850 0 0 0 0 0 0 221105 0 0
Gauteng 30806 574653 201888328218361614546 269090 396832 156114 23229 13958
0
500000
1000000
1500000
2000000
2500000
3000000
Val
ue(
Kg
)
Years
Figure 20: Value of South Africa carrot import
28
Figure 21 presents the market value chain for carrots. The carrot value chain can be broken down into the following levels: the producers of carrots (farmers); pack house owners (cleans, grade and quality control); cold storage and transport facilities (store and transport carrots on behalf of farmers); traders in carrots (market and sell carrots); processors (add value to carrots and process carrots to other usable forms); and end users (consumers). Figure 22: Market value chain for carrots
Fresh Carrot
Carrot juice
Dehydrated carrots
Carrot oil seed extraction
Frozen carrots
Cream and lotions
Health drinks
Carrot powder
Massage oil
Vitamin supplements
Soups
Canned carrots
Cooked carrots
Pet foods
Baby foods
Carrot salad

29
Input Suppliers Farmers/Producers
Harvesting
Cleaning /Handling
Imports Quality grade standards and packaging
Storage, transportation and distribution
Exports Fresh Produce Markets,
Wholesalers, Supermarkets, Retailers and Informal Market
Processors: Dehydration, Freezing and Juice extraction
Consumer
30
3. MARKET INTELLIGENCE
3.1 Tariffs
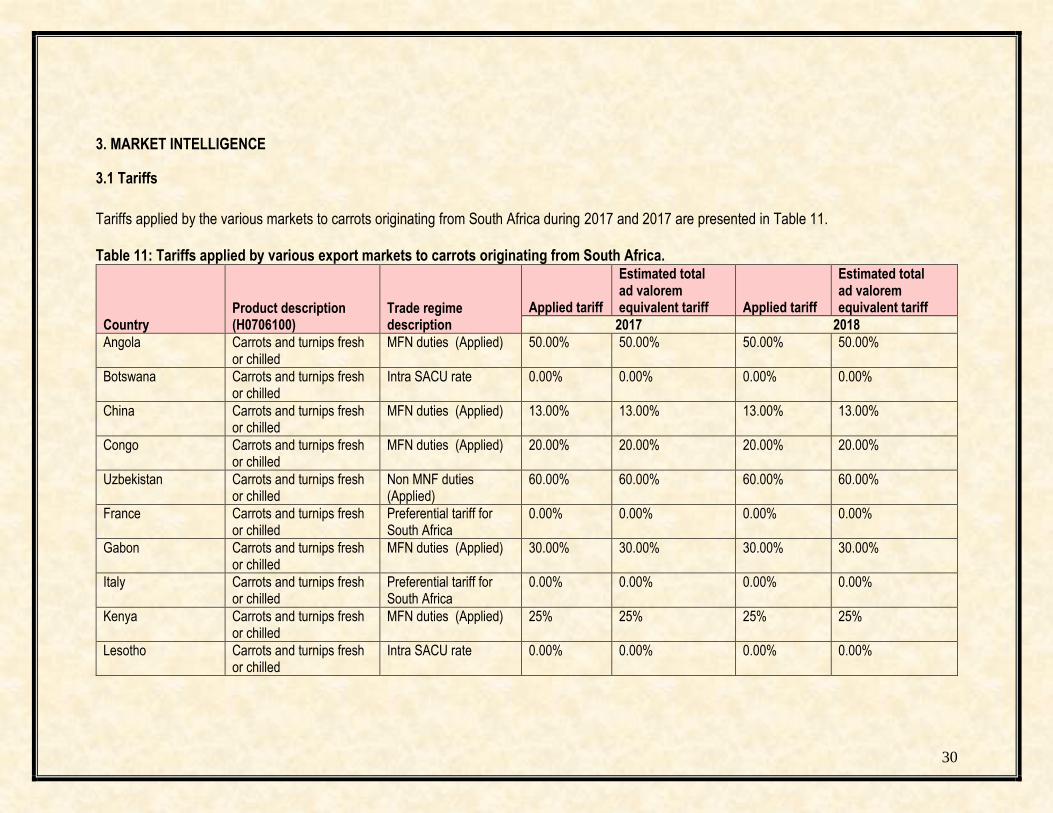
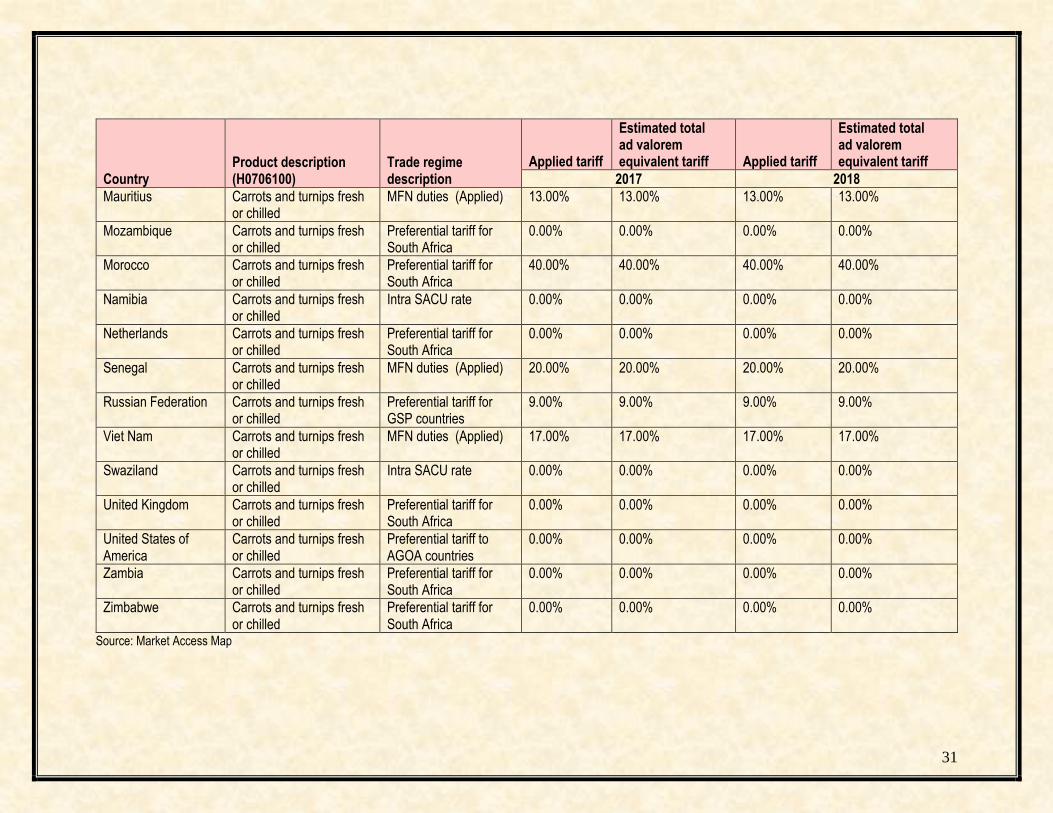
Tariffs applied by the various markets to carrots originating from South Africa during 2017 and 2017 are presented in Table 11. Table 11: Tariffs applied by various export markets to carrots originating from South Africa.
Country Product description (H0706100)
Trade regime description
Applied tariff
Estimated total ad valorem equivalent tariff Applied tariff
Estimated total ad valorem equivalent tariff
2017 2018
Angola Carrots and turnips fresh or chilled
MFN duties (Applied) 50.00% 50.00% 50.00% 50.00%
Botswana Carrots and turnips fresh or chilled
Intra SACU rate 0.00% 0.00% 0.00% 0.00%
China Carrots and turnips fresh or chilled
MFN duties (Applied) 13.00% 13.00% 13.00% 13.00%
Congo Carrots and turnips fresh or chilled
MFN duties (Applied) 20.00% 20.00% 20.00% 20.00%
Uzbekistan Carrots and turnips fresh or chilled
Non MNF duties (Applied)
60.00% 60.00% 60.00% 60.00%
France Carrots and turnips fresh or chilled
Preferential tariff for South Africa
0.00% 0.00% 0.00% 0.00%
Gabon Carrots and turnips fresh or chilled
MFN duties (Applied) 30.00% 30.00% 30.00% 30.00%
Italy Carrots and turnips fresh or chilled
Preferential tariff for South Africa
0.00% 0.00% 0.00% 0.00%
Kenya Carrots and turnips fresh or chilled
MFN duties (Applied) 25% 25% 25% 25%
Lesotho Carrots and turnips fresh or chilled
Intra SACU rate 0.00% 0.00% 0.00% 0.00%
31
Country Product description (H0706100)
Trade regime description
Applied tariff
Estimated total ad valorem equivalent tariff Applied tariff
Estimated total ad valorem equivalent tariff
2017 2018
Mauritius Carrots and turnips fresh or chilled
MFN duties (Applied) 13.00% 13.00% 13.00% 13.00%
Mozambique Carrots and turnips fresh or chilled
Preferential tariff for South Africa
0.00% 0.00% 0.00% 0.00%
Morocco Carrots and turnips fresh or chilled
Preferential tariff for South Africa
40.00% 40.00%
40.00% 40.00%
Namibia Carrots and turnips fresh or chilled
Intra SACU rate 0.00% 0.00% 0.00% 0.00%
Netherlands Carrots and turnips fresh or chilled
Preferential tariff for South Africa
0.00% 0.00% 0.00% 0.00%
Senegal Carrots and turnips fresh or chilled
MFN duties (Applied) 20.00% 20.00% 20.00% 20.00%
Russian Federation Carrots and turnips fresh or chilled
Preferential tariff for GSP countries
9.00% 9.00% 9.00% 9.00%
Viet Nam Carrots and turnips fresh or chilled
MFN duties (Applied) 17.00% 17.00% 17.00% 17.00%
Swaziland Carrots and turnips fresh or chilled
Intra SACU rate 0.00% 0.00% 0.00% 0.00%
United Kingdom Carrots and turnips fresh or chilled
Preferential tariff for South Africa
0.00% 0.00% 0.00% 0.00%
United States of America
Carrots and turnips fresh or chilled
Preferential tariff to AGOA countries
0.00% 0.00% 0.00% 0.00%
Zambia Carrots and turnips fresh or chilled
Preferential tariff for South Africa
0.00% 0.00%
0.00% 0.00%
Zimbabwe Carrots and turnips fresh or chilled
Preferential tariff for South Africa
0.00% 0.00%
0.00% 0.00%
Source: Market Access Map
32
In 2018, Mozambique, United Kingdom, Angola, Netherlands, Lesotho, Botswana and Eswatini were the primary export market for carrots originating from South Africa. Mozambique, United Kingdom and Angola accounted for 45.3% carrot exports. Angola is still protected by 50% tariff, in spite of the existence of the SADC-FTA. Mozambique tariff has changed its tariff from 15% to 0% preferential tariff. Carrot exports to SACU countries (Namibia, Botswana, Eswatini and Lesotho) accounted for 26% of South Africa’s carrot exports. These countries apply 0% Intra SACU rate to carrot exports originating from South Africa. The most lucrative export markets for carrots from South Africa are in European markets (United Kingdom, Netherlands and France) since these countries apply zero tariff to exports of carrots originating from South Africa due to an EU-SA Free Trade Agreement (FTA). The African market in Senegal apply 20% and Gabon apply 30% MNF tariff to carrots originating from South Africa. China, Russian Federation and Uzbekistan are the largest carrot producers and their domestic markets are still protected by a 13%, 9% and 60% tariff respectively. Morocco is the only African country, which is among the top ten world carrot producers, and its domestic market is still highly protected by 40% tariff.
3.1 Non-tariff barriers
3.1 The European Union Non-tariff barriers can be divided into those that are mandatory and laid out in the EU Commission’s legislature, and those that are as a result of consumers, retailers, importers and other distributions’ preferences. 3.1.1 Product legislation: quality and marketing There are a number of pieces of EU legislation that govern the quality of produce that may be imported, marketed and sold within the EU. General Food Law covers matters in procedures of food safety and hygiene (micro-biological and chemical), including provisions on the traceability of food (for example, Hazard Analysis and Critical Control Points, of HACCP). EU Marketing Standards, which govern the quality and labelling of vegetables, are laid out in the CAP framework under regulation EC 2200/96. These regulations include diameter, weight and class specifications, and any produce that does not comply with these standards are not allowed to be sold on the EU markets (detailed lists of products and their standards can be found in the annexes to the directive). The legislation (under EU 1148/2001) also dictates that a Certificate of Conformity must be obtained by anyone wishing to export and sell vegetables in the EU, if that particular vegetable falls under the jurisdiction on the EU marketing standards, Vegetables to be used in further processing needs a Certificate of Industrial Use, whilst another legislative directive covers the Maximum Residue Limits (MRL) of various pesticides allowed. 3.1.2 Product legislation: phytosanitary regulations The international standard for phytosanitary measures was set up by the International Plant Protection Committee (IPPC) to protect against the spreading of diseases or insects through the
33
importation of certain agricultural goods. The EU has its own particular rules formalized under EC 2002/89, which attempts to prevent contact of EU crops with harmful organisms from elsewhere in the world. The crux of the directive is that it authorizes the Plant Protection Services to inspect a large number of vegetable products upon arrival in the EU. This inspection consists of a physical examination of a consignment deemed to have a level of phytosanitary risk, identification of any harmful organisms and certification of the validity of any phytosanitary certificate covering the consignment. If the consignment does not comply with the requirements, it may not enter the EU, although certain organisms can be fumigated at the expense of the exporter. 3.1.3 Product legislation: packaging The EU commission lays downs rules for materials that come into contact with food and which may endanger people’s health or bring about an unacceptable change in the composition of the foodstuffs. The framework legislation for this EC 1935/2004. Recycling packaging materials are also emphasized under 94/62/EC, whereby member states are required to recycle between 50% and 65% of packaging waste. If exporters do not ship produce in packaging which is reusable, they may be liable for the costs incurred by the importing companies. Wood packaging is subject to phytosanitary controls (see Directive EC 2002/89) and may need to undergo heat treatment, fumigation, etc. 3.1.4 Non-legal market requirements: social and environmental accountability To access a market, importers must not only comply with the legal requirements set out above, but also with market requirement s and demands. For the most part, these revolve around quality and the perceptions of European consumers about the environmental, social, health and safety aspects of both the products and the production techniques. Whilst supplying vegetables that complies with these issues may not be mandatory in the legal sense, they are becoming increasingly important in Europe and cannot be ignored by existing or potential exporters. (i) Social responsibility is becoming important in the industry, not only amongst consumers, but also for retail outlets and wholesalers. The Social Accountability 8000 (SA8000) certification is a management system based on International Labour Organization (ILO) conventions, and deals with issues such as a child labour, health and safety, and freedom of association, and requires an on-site audit to be performed annually. The certificate is seen as necessary for accessing any European market successful. The major retailers in the EU also play an important role in tackling environmental issues, which means that exporters have to take these into account when negotiating exporting arrangements.
(ii) Environmental issues are becoming increasingly important with European consumers. Consumer movements are lobbying against purchasing non-environmental friendly or non-sustainable produce. To this end, both governments and private partners have created standards (such as ISO 14001 and EUREPGAP) and labels to ensure produce adhere to particular specifications. Labels are an absolute must for exporters attempting to enter the rapidly expanding organic produce market. The EU Commission has recently adopted and EU label for identifying food produced according to EU organic standards in the directive EEC 209/91
34
3.1.5 Consumer health and safety requirements Increasing consumer conscience about health and safety issues has prompted a number of safety initiatives in Europe, such as EUREPGAP on good agricultural practices (GAP) by the main European retailers, the international management system of HACCP, which is independently certified and required by legislation for European producers as well as food imported into Europe (EC 852/2004), and the ISO 9000 management standards system (for procedures and working methods), which is certified by the International Standards Organization (ISO). 3.2 The United States The USDA has quality standards for vegetables that provide a basis for domestic and international trade and promote efficiency in marketing and procurement. At the same time the USDA issues quality certificates based on these standards and a comprehensive grading system. Graders are located around the country at terminal markets. These certification services, which facilitate the ordering and purchasing of products by large-volume buyers, assure these buyers that the product they purchase will meet the terms of the contract in terms of quality, processing, size, packaging and delivery. 3.3 Asian Market Access Japan’s agricultural sector is heavily protected, with calculations from the Organization for Economic Co-operation and Development (OECD) estimating that almost 60% of the value of Japan’s farm production comes from trade barriers or domestic subsidies. Japan uses tariff rate quotas (TRQ) to protect its most sensitive products, and reserves the right for trading many of these products (within the quota) for one or two state trading enterprises. However, these extremely protective measures apply only to some products; others are able to compete more effectively with outside competition, often on the grounds of higher quality. Perhaps the biggest barrier to trade with Japan in vegetable markets is its strict phytosanitary requirements, which have often been challenged in the WTO as having little or no scientific justification. Other measures that are being challenged include Japan’s use of fumigation on agricultural products when cosmopolitan pests (already found in Japan) are detected. Japan is also increasing its labelling requirements
4. GENERAL DISTRIBUTION CHANNELS
There are roughly three distinct sales channels for exporting vegetables. One can sell directly to an importer with or without the assistance of an agent (usually larger, more established commercial farms/orchards). One can supply a vegetable combine, which will then contract out importers/marketers and try to take advantage of economies of scale and increased bargaining power. At the same time vegetable combines might also supply large retail chains. One can also be a member of a private or co-operate export organization (including marketing boards) which will find agents or importers and market the produce collectively. Similar to a vegetable combine, an export organization can either supply wholesale markets or retail chains depending on particular circumstances. Export organizations and marketing boards will wash, sort and package the produce.

35
5. LOGISTICAL ISSUES
5.1 Mode of transport
The transportation of vegetables falls within two categories – ocean cargo and air cargo – with ocean cargo taking much longer to reach the desired location but costing considerably less. Of course, the choice of transportation method depends, for the most part, on the fragility of the produce and how long it can remain relatively fresh. With the advent of technology and container improvements, the feasibility, cost and attractiveness of sea transportation have improved considerably. As more developing countries begin to export and supply major developed countries markets, so the number and regularity of maritime routes, and the container vessels travelling these routes, increase. Presently South American countries like Peru benefit from the asparagus trade, which has led to some level of economies of scale with other vegetable products, and this has enabled cheaper transport prices for their other vegetable varieties. Such economic of scale could benefit SADC countries if more producers became exporters and took advantage of the various ports which have special capabilities in handling vegetable produce (for example, the proposed terminal in Maputo). For some products, in order to reach the destination market with an acceptable degree of freshness, air transport is the only option (asparagus, for example, is flown from Peru to the sufficient to cover the transport costs, and collective agreements between farmers of different commodities with different harvest periods can become particularly important. 5.2 Cold chain management Cold chain management is crucial when handling perishable products, from the initial packing houses to the refrigerated container trucks that transport the produce to the shipping terminals, through to the storage facilities at these terminals (and their pre-cooling capability), onto the actual shipping vessels and their containers, and finally on to the importers and distributors that must clear the produce and transport it to the markets/retail outlets, etc. For every 10oC increase above the recommended temperature, the rate of respiration and ripening of produce can increase twice or even thrice. Related to this are the increasingly important traceability standards, which require an efficiently controlled supply chain and internationally accepted business standards. 5.3 Packaging Packaging also plays a vital role in ensuring safe and efficient transport of a product and conforming to handling requirements, uniformity, recyclable materials specifications, phytosanitary requirements, proper storage needs and even attractiveness (for marketing purposes).

36
6. COMPETITIVENESS OF SOUTH AFRICAN CARROTS EXPORTS
Figure 23 below shows that South African carrot exports are growing faster than the world imports into Senegal, Netherlands, Congo, Zambia, Germany and Gabon. South Africa’s performance in those markets can be regarded as gains in dynamic markets. South Africa’s carrots exports are growing slower than the world imports into Malawi, United Kingdom, Lesotho, Mauritius and Eswatini. These are dynamic market and South Africa has lost market share. South African carrot exports are declining faster than the world imports into Namibia. South African exports into Zimbabwe, Botswana, Switzerland, Mozambique and Angola are growing while world imports are declining into these countries. South Africa’s performance in these countries can be regarded as a gain in a declining market. Figure 24 below, shows that the prospective export markets for carrot from South Africa. During 2018, Mozambique and United Kingdom holds a bigger share of South African carrot exports. Prospective markets exist in Senegal, Gabon and France. Other African markets exist in Côte d'Ivoire
and Zambia. However, if South Africa is to diversify its carrots exports the most lucrative markets exists in Mauritius and Malawi which have increased their carrot imports by 21% from the world between 2014-2018 period. Carrot imports from the world to Switzerland, Botswana, Namibia Zimbabwe and Angola have declined and these countries have recorded a negative growth rate between 2014 and 2018 period.
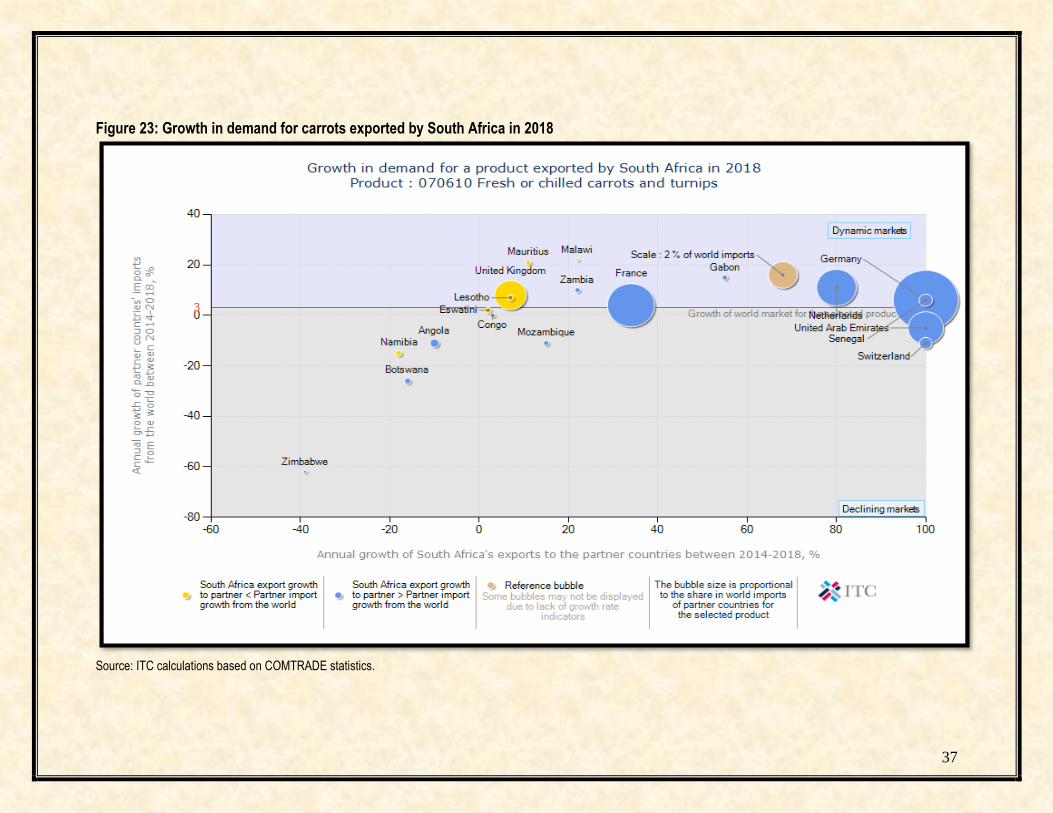
37
Figure 23: Growth in demand for carrots exported by South Africa in 2018
Source: ITC calculations based on COMTRADE statistics.
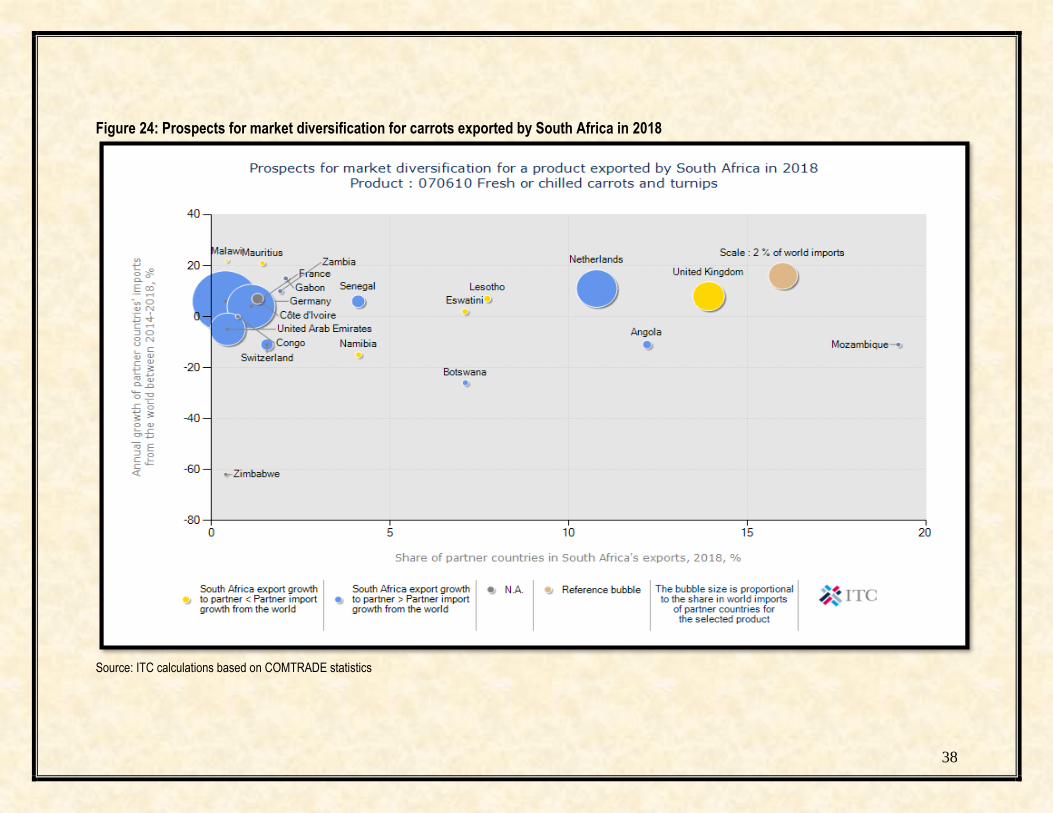
38
Figure 24: Prospects for market diversification for carrots exported by South Africa in 2018
Source: ITC calculations based on COMTRADE statistics
39
7. OPPORTUNITIES AND CHALLENGES
7.1 Opportunities
Carrots have found increasing favour among consumers. Several health benefits have promoted marketing this vegetable as a convenient and good tasting snack food or juice product. Carrots are popular as snacks, side dishes, salads ingredients, juice mixtures and dessert mixtures (e.g. carrot cake and carrot pudding). The rise of the fresh cut industry has meant some of the misshapen and otherwise imperfect carrots have an alternative profitable outlet. Carrot that would not have made the grade in a standard pack of fresh carrots do not have to be sent to freezers or canners to be cut, diced or juiced. Today, the cutting and peeling process for various fresh-cut carrot products allows a majority of the raw carrots destined for the fresh market to become fresh market products. As a way of minimizing post-harvest losses carrots are also utilized as animal fodder. A greenway farm is producing 100% natural carrot juice, which is a first successful innovation in the world. Research is being conducted to establish the benefits of carrot juice in fighting the chronic diseases like HIV.
7.2 Challenges
The major concern is the production of a disease-free high quality clean carrot root. Other essential part of carrot production and marketing is the need to define the quality standards necessary for consumer acceptance. Product physical defects can be readily measured, but the flavour and sweetness characteristics must be defined and the parameters affecting these important factors understood. Numerous root diseases affect carrot but proper cultural practices can keep them under control. Carrot growers also face strong market competition from the national and international producers.
40
8. ACKNOWLEDGEMENTS
The following organizations are acknowledged National Department of Agriculture, Forestry and Fisheries Directorate: Statistics and Economic Analysis Private Bag X246 Pretoria 0001 Tel (012) 930 1134 Fax (012) 319 8031 Trade and Industrial Policy Strategies (TIPS) P.O. Box 11214 Hatfield 0028 Tel (012) 431 7900 Fax (012) 431 7910 Greenway Farms Plot 193 Vlaakplaats Tarlton, Gauteng 1749 Tel: (011) 952 1493 Quantec Easy Data www.easydata.co.za Market Access Map www.macmap.org www.trademap.org Economic Research Service/USDA www.wikipedia.co.za Food and Agriculture organization of the United Nations www.fao.org Disclaimer: this document and its contents have been compiled by the Department of Agriculture, Forestry and Fisheries for the purpose of detailing the carrot industry. Anyone who uses this information does so at his/her own risk. The views expresses in this document are those of the Department of Agriculture, Forestry and Fisheries with regard to agricultural industry, unless otherwise stated. The Department of Agriculture, Forestry and Fisheries, accepts no liability that can be incurred resulting from the use of this information.