Embed Size (px)
Citation preview

1
A PROFILE OF THE SOUTH AFRICAN MUTTON MARKET VALUE CHAIN
2014
Directorate Marketing Private Bag X 15
Arcadia 0007
Tel: 012 319 8455 Fax: 012 319 8131
Email: [email protected]

2
1. DESCRIPTION OF THE INDUSTRY ............................................................................................ 3
1.1. PRODUCTION AREAS ............................................................................................................... 4 1.3. EMPLOYMENT ......................................................................................................................... 5
2. MARKET STRUCTURE................................................................................................................ 5
2.1. DOMESTIC MARKET AND PRICES ............................................................................................... 5 2.2. EXPORTS OF MUTTON ............................................................................................................. 6 2.3. SHARE ANALYSIS .................................................................................................................. 14 2.4. IMPORTS OF MUTTON ............................................................................................................ 18
3. MARKETING CHANNELS ......................................................................................................... 21
4. ORGANIZATIONAL ISSUES ..................................................................................................... 23
4.2. OPPORTUNITIES ................................................................................................................... 23 4.3. CHALLENGES........................................................................................................................ 24
5. MARKET INTELLIGENCE ......................................................................................................... 25
5.1. EXPORT TARIFFS .................................................................................................................. 25 5.2. IMPORT TARIFFS ................................................................................................................... 26
6. COMPETITIVENESS OF THE SHEEP INDUSTRY.................................................................... 27
6.1. COMPETITIVENESS OF SHEEP INDUSTRY IN EXPORTS................................................................ 27
7. ACKNOWLEDGEMENTS ........................................................................................................... 41

3
1. DESCRIPTION OF THE INDUSTRY
Sheep farming is practiced throughout the country but concentrated in the more arid parts of the country, i.e Northern Cape, Eastern Cape, Western Cape, Free State and Mpumalanga. There are approximately 8 000 commercial sheep farms throughout the country and about 5 800 communal farmers. The estimated number of sheep in South Africa is 24.3 million. Sheep farmers are represented by organizations with Dorper Sheep Breeders’ Society of South Africa and Merino SA being the most prominent. Dorper is a highly successful South African-bred mutton breed developed specially for the more arid areas of South Africa. Today they are widely spread throughout the country. The Dorper’s excellent carcass qualities in terms of conformation and fat distribution, generally qualify it for top classification. They are especially concentrated in more arid parts of the country. Other mutton breeds which can also produce wool are Damara, Meatmaster, Ille de France, Dormer, Suffolk, Van Rooy and Vandor. The gross value of mutton production is dependent on the price and quantity of meat produced. Over the past ten years, the average gross production value amounted to R 4.3 billion per annum. The total gross value for the past 10 years amounted to R 42.9 billion. The gross value of mutton production increased continuously from 2004 until 2013. Declining sheep numbers and rapid population growth in South Africa have led to an increase in demand and subsequent shortages in the supply of mutton. The declining of sheep numbers is mainly through the predation and stock theft. Figure 1 below show the gross value of mutton production from 2004 to 2013.
Source: Statistics and Economic Analysis, DAFF
0
1 000
2 000
3 000
4 000
5 000
6 000
7 000
Mil
lio
n K
ilo
gra
ms
Years
Figure 1: Gross value of mutton production

4
1.1. Production Areas
Sheep numbers in South Africa is estimated at 24.3 million distributed in all nine provinces. Approximately 29% of the sheep are in Eastern Cape followed by Northern Cape with 25%, Free State by 20% and Western Cape by 11%. These four Provinces constitute 85% and the other five Provinces share the 15% of the country’s sheep numbers. Percentage distribution is illustrated in Figure 2.
Source: Statistics and Economic Analysis, DAFF 1.2. Production trends Sheep and lamb are slaughtered in abattoirs that are distributed all over South Africa. Slaughtering outside the abattoirs is not easy to record. Most of the mutton produced in South Africa is consumed locally. Figure 3 below shows the comparison between the mutton produced in South Africa and its consumption.
Western Cape 11%
Northern Cape 25%
Free State 20%
Eastern Cape 29%
Kwazulu-Natal 3%
Mpumalanga 7%
Limpopo 1%
Gauteng 1%
North-West 3%
Figure 2: Distribution of sheep per Province in 2013

5
Source: Statistics and Economic Analysis and Quantec Easydata
Figure 3 above shows that the amount of mutton consumed is more than what was domestically produced during the period under review. The amount of mutton consumed reached its peak of 169 million Kg during 2007 and the production peak of 153 million kilograms was reached in 2013. There is an increase of 22 million Kg (28 %) of mutton production in 2013 compare to 2004 and a slight increase of mutton consumption of 13 million Kg (14 %) in 2013 compare to beginning of the analysis in 2004. This shows that South Africa will still remain a net importer of mutton to satisfy the local demand.
1.3. Employment
There are approximately 8 000 commercial sheep farms around the country employing approximately 35 000 workers.
2. MARKET STRUCTURE
2.1. Domestic market and prices
The prices are determined by forces of demand and supply. Figure 4 below show the price of mutton from 2004 to 2013.
0
40
80
120
160
200
Mil
lio
n K
ilo
gra
ms
Years
Figure 3: Production vs consumption of mutton
Production Consumption

6
Source: Statistics and Economic Analysis, DAFF
The price of mutton increased continuously from 2004 to 2012 mainly due to inflation factor, change of consumer’s lifestyles and insufficient supply. There was a significant decrease in price of mutton in 2013. In 2004 the price of mutton was R 20.13/Kg but in 2013 it was R 41.59/Kg, this means in a period of 10 years there was an increase of R 21.46/kg.
2.2. Exports of mutton
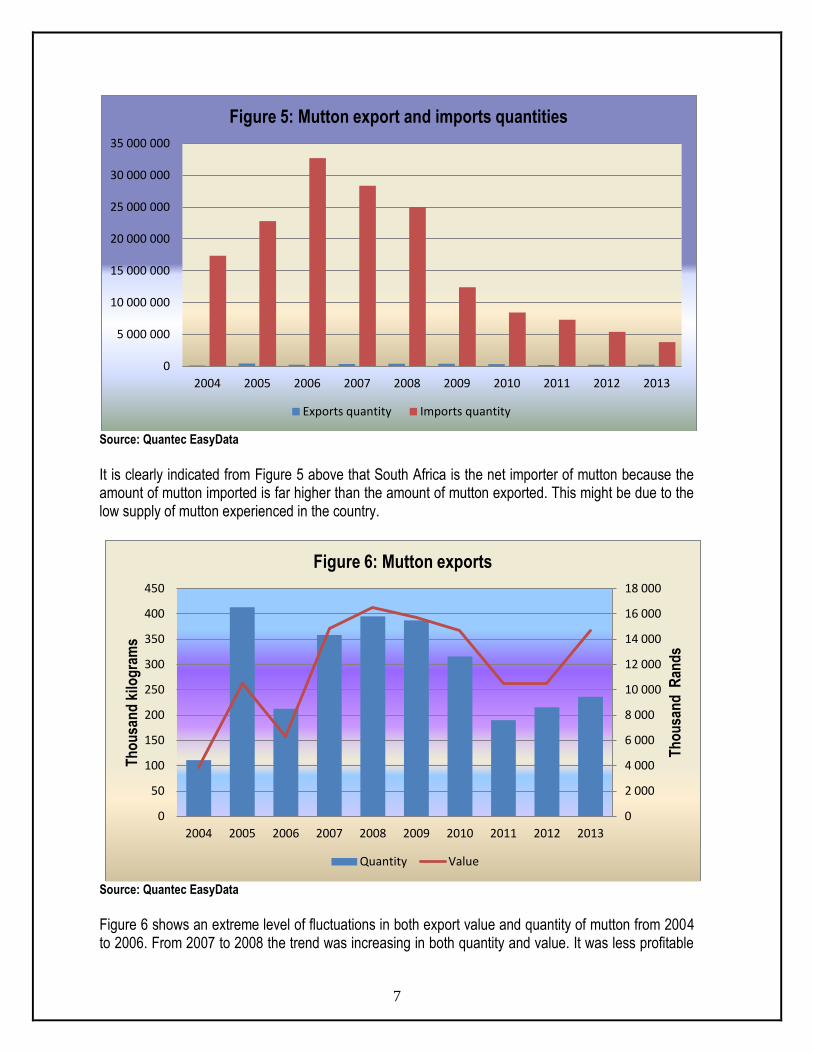
Figure 5 below shows the comparison between mutton imports and exports.
10.00
15.00
20.00
25.00
30.00
35.00
40.00
45.00
50.00
Ran
ds/ K
g
Years
Figure 4: Price of mutton
7
Source: Quantec EasyData
It is clearly indicated from Figure 5 above that South Africa is the net importer of mutton because the amount of mutton imported is far higher than the amount of mutton exported. This might be due to the low supply of mutton experienced in the country.
Source: Quantec EasyData
Figure 6 shows an extreme level of fluctuations in both export value and quantity of mutton from 2004 to 2006. From 2007 to 2008 the trend was increasing in both quantity and value. It was less profitable
0
5 000 000
10 000 000
15 000 000
20 000 000
25 000 000
30 000 000
35 000 000
2004 2005 2006 2007 2008 2009 2010 2011 2012 2013
Figure 5: Mutton export and imports quantities
Exports quantity Imports quantity
0
2 000
4 000
6 000
8 000
10 000
12 000
14 000
16 000
18 000
0
50
100
150
200
250
300
350
400
450
2004 2005 2006 2007 2008 2009 2010 2011 2012 2013
Th
ou
san
d R
and
s
Th
ou
san
d k
ilog
ram
s
Figure 6: Mutton exports
Quantity Value

8
to export mutton from 2004 to 2006 as more quantity was exported for less value but the worse scenario was experienced in 2005. It became profitable to export mutton from 2007 to 2013 because fewer quantities were exported with high values. The highest quantities (413 145 kg) of mutton was exported in 2005 and highest value of R 16 .5 million was received in 2008. This might be due to the weaker rand.
Source: Quantec EasyData
South African mutton is mainly exported to Angola and Mozambique in SADC. Angola commanded the highest exports from 2004 to 2006 and Mozambique took over the first position from 2007 to 2013. Democratic Republic of Congo (DRC) became the second highest commander of mutton from South Africa during 2008 to 2010,2012 and in 2013.
0
30 000
60 000
90 000
120 000
150 000
2004 2005 2006 2007 2008 2009 2010 2011 2012 2013
Kilo
gra
ms
Figure 7: Mutton export to SADC
Angola DRC Mauritius Malawi Mozambique
Seychelles Tanzania Zambia Zimbabwe

9
Source: Quantec EasyData
Figure 8 above shows that Nigeria and Gabon competed for the highest importer of mutton from South Africa. Nigeria commanded the greatest shares of South African mutton during the periods 2004; 2007 to 2009 and 2011 while Gabon was the greatest in 2005 – 2006 and in 2010. Ghana commanded the greatest shares in 2012 and 2013. Averagely Nigeria commanded 19 549 kg per annum of mutton from South Africa during the past decade followed by Gabon by 17.764 kg.
Source: Quantec EasyData
0
10 000
20 000
30 000
40 000
50 000
60 000
2004 2005 2006 2007 2008 2009 2010 2011 2012 2013
Kilo
gra
ms
Figure 8: Mutton exports to middle and west Africa
Côte d'Ivoire Ghana Nigeria Saint Helena
Congo Gabon Mauritiana
Angola 6% DRC
21%
Gabon 4%
Ghana 6%
Mauritius 5%
Mozambique 36%
Nigeria 4%
Qatar 1%
Zambia 6%
Mauritiana 2% Malawi
2%
Seychelles 3%
Saint helena 2%
Zimbambwe 2%
Figure 9: Mutton exports destination 2013
10
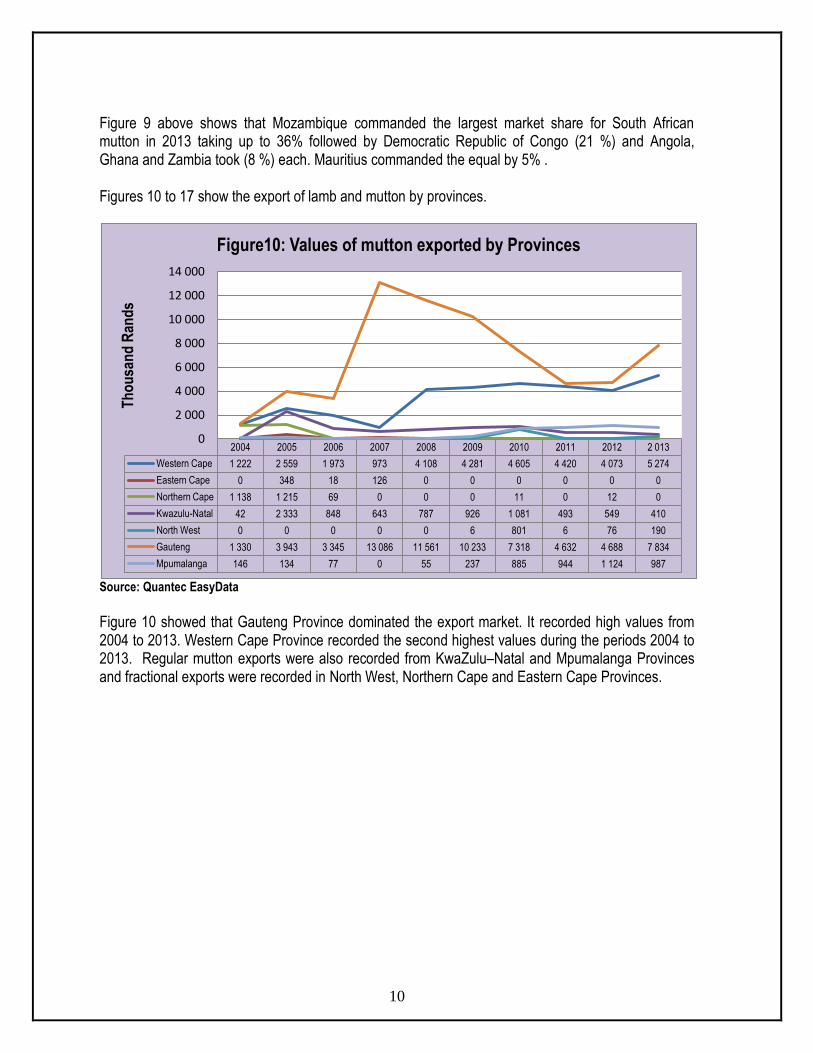
Figure 9 above shows that Mozambique commanded the largest market share for South African mutton in 2013 taking up to 36% followed by Democratic Republic of Congo (21 %) and Angola, Ghana and Zambia took (8 %) each. Mauritius commanded the equal by 5% . Figures 10 to 17 show the export of lamb and mutton by provinces.
Source: Quantec EasyData
Figure 10 showed that Gauteng Province dominated the export market. It recorded high values from 2004 to 2013. Western Cape Province recorded the second highest values during the periods 2004 to 2013. Regular mutton exports were also recorded from KwaZulu–Natal and Mpumalanga Provinces and fractional exports were recorded in North West, Northern Cape and Eastern Cape Provinces.
2004 2005 2006 2007 2008 2009 2010 2011 2012 2 013
Western Cape 1 222 2 559 1 973 973 4 108 4 281 4 605 4 420 4 073 5 274
Eastern Cape 0 348 18 126 0 0 0 0 0 0
Northern Cape 1 138 1 215 69 0 0 0 11 0 12 0
Kwazulu-Natal 42 2 333 848 643 787 926 1 081 493 549 410
North West 0 0 0 0 0 6 801 6 76 190
Gauteng 1 330 3 943 3 345 13 086 11 561 10 233 7 318 4 632 4 688 7 834
Mpumalanga 146 134 77 0 55 237 885 944 1 124 987
0
2 000
4 000
6 000
8 000
10 000
12 000
14 000
Th
ou
san
d R
and
s
Figure10: Values of mutton exported by Provinces

11
Source: Quantec EasyData
From the Western Cape Province, City of Cape Town metropolitan municipality recorded high values from the year 2004 to 2013 and some intermittent values were recorded from Cape Winelands and Eden district municipalities. This may be due to the fact that the City of Cape Town is the major exit point for the province.
Source: Quantec EasyData
2004 2005 2006 2007 2008 2009 2010 2011 2012 2013
City of Cape Town 1 221 8 2 559 2 1 972 8 973 136 4 017 9 4 281 0 4 605 3 4 420 1 4 073 1 5 273 6
Cape Winelands 0 0 0 0 90 360 0 0 0 0 0
Eden 176 0 0 0 0 0 0 0 0 0
0
1 000 000
2 000 000
3 000 000
4 000 000
5 000 000
6 000 000 R
and
s Figure 11: Value of mutton exported by Western Cape Province
2003 2004 2005 2006 2007 2008 2009 2010 2011 2012 2013
Cacadu District 0 0 347 916 0 0 0 0 0 0 0 0
Nelson Mandela 0 0 0 18 290 126 070 0 0 0 0 0 0
0
50 000
100 000
150 000
200 000
250 000
300 000
350 000
400 000
Ran
ds
Figure 12: Value of mutton exported by Eastern Cape province

12
From the Eastern Cape Province, intermittent reports of mutton exports were recorded from Cacadu and Nelson Mandela district municipalities. Cacadu district municipality recorded the export values in 2005 and Nelson Mandela district municipality recorded its exports of mutton in 2006 and2007.
Source: Quantec EasyData
In the Northern Cape Province, Siyanda district municipality recorded export values during the periods 2004 until 2006, 2009 to 2010 and again in 2012.
Source: Quantec EasyData
In KwaZulu–Natal Province, eThekwini metropolitan municipality recorded high values from 2005 to 2013 except in 2004 were it diminished. It is therefore the greatest exporter of mutton in the province
2004 2005 2006 2007 2008 2009 2010 2011 2012 2013
Siyanda 1 138 401 1 214 684 69 174 0 0 0 10 684 0 12 351 0
0
200 000
400 000
600 000
800 000
1 000 000
1 200 000
1 400 000
Ran
ds
Figure 13: Value of mutton exported by Northern Cape Province
2004 2005 2006 2007 2008 2009 2010 2011 2012 2013
Ugu 100 0 0 0 0 0 0 0 0 0
Uthukhela 0 0 0 0 0 0 0 0 0 149 940
Uthungulu 41 599 5 781 0 0 0 0 0 0 0 0
eThekwini 0 2 327 661 848 043 643 232 786 619 925 929 1 080 569 493 167 549 220 260 016
0
500 000
1 000 000
1 500 000
2 000 000
2 500 000
Ran
ds
Figure 14: Value of mutton exported by Kwazulu natal

13
mainly because it is an exit point of exports. Fractional mutton exports were also recorded in UGu, UThukela and UThungulu district municipalities from 2004 to 2005 and in 2013.
Source: Quantec EasyData
North West Province recorded intermittent exports of mutton during the period under review. Bojanala district municipality recorded export values of mutton during 2009 and Bophirima district municipality recoded in 2010 & 2012 and Southern district municipality recorded exports in 2011, 2012and in 2013.
2004 2005 2006 2007 2008 2009 2010 2011 2012 2013
Bojanala 0 0 0 0 0 5 546 0 0 0 0
Bophirima 0 0 0 0 0 0 801 099 0 69 574 0
Southern 0 0 0 0 0 0 0 5 576 5 944 189 948
0
100 000
200 000
300 000
400 000
500 000
600 000
700 000
800 000
900 000
Ran
ds
Figure 15: Value of mutton exported from North West Province
2004 2005 2006 2007 2008 2009 2010 2011 2012 2013
Sedibeng 80 0 177 0 0 0 0 0 0 0
Metsweding 0 0 0 0 0 0 0 186 76 46
West Rand 1 32 0 0 0 0 1 488 129 324 60
Ekurhuleni 420 302 348 1 189 114 822 1 779 378 1 574 2 281
City of Johannesburg 828 3 609 2 816 11 883 11 447 9 401 3 903 3 728 2 289 5 058
City of Tshwane 1 0 4 14 0 10 148 212 424 3 897
0
2 000
4 000
6 000
8 000
10 000
12 000
14 000
Th
ou
san
d R
and
s
Figure 16: Value of mutton exported from Gauteng Province

14
Source: Quantec EasyData
In Gauteng Province, City of Johannesburg metropolitan municipality recorded high export values of mutton for the past ten years with the highest values recorded in 2007, followed by Ekurhuleni district municipality. Irregular exports of mutton were recorded from Sedibeng, Metsweding, West Rand and City of Tshwane municipalities.
Source: Quantec EasyData
From Mpumalanga Province, the value of mutton exports was mainly through Ehlanzeni district municipality which recorded the highest value in 2004 to 2005, 2008 and 2010 to 2013. Irregular exports were also recorded from Gert Sibande and Nkangala district municipalities. There were no records of mutton exports in 2007.
2.3. Share analysis
Tables 1 to 7 show the export share analysis of mutton and lamb by provinces and districts.
2004 2005 2006 2007 2008 2009 2010 2011 2012 2013
Gert Sibande 0 5 500 76 586 0 0 54 077 0 12 800 254 802 0
Nkangala 0 0 0 0 0 182 614 86 316 0 49 100 0
Ehlanzeni 146 491 128 617 0 0 54 509 0 799 062 931 336 820 593 986 610
0
200 000
400 000
600 000
800 000
1 000 000
1 200 000
Ran
ds
Figure 17: Value of mutton exported by Mpumalanga Province
15
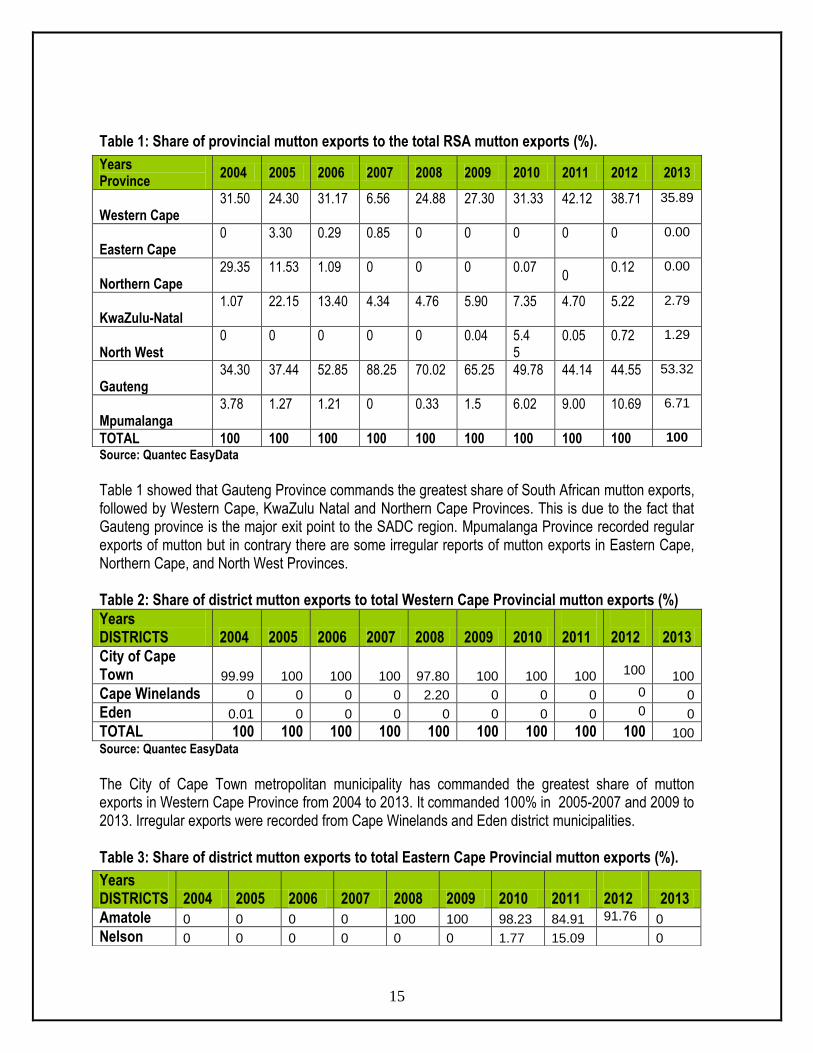
Table 1: Share of provincial mutton exports to the total RSA mutton exports (%).
Source: Quantec EasyData Table 1 showed that Gauteng Province commands the greatest share of South African mutton exports, followed by Western Cape, KwaZulu Natal and Northern Cape Provinces. This is due to the fact that Gauteng province is the major exit point to the SADC region. Mpumalanga Province recorded regular exports of mutton but in contrary there are some irregular reports of mutton exports in Eastern Cape, Northern Cape, and North West Provinces. Table 2: Share of district mutton exports to total Western Cape Provincial mutton exports (%)
Years DISTRICTS 2004 2005 2006 2007 2008 2009 2010
2011
2012 2013
City of Cape Town 99.99 100 100 100 97.80 100 100 100
100 100
Cape Winelands 0 0 0 0 2.20 0 0 0 0 0
Eden 0.01 0 0 0 0 0 0 0 0 0
TOTAL 100 100 100 100 100 100 100 100 100 100 Source: Quantec EasyData
The City of Cape Town metropolitan municipality has commanded the greatest share of mutton exports in Western Cape Province from 2004 to 2013. It commanded 100% in 2005-2007 and 2009 to 2013. Irregular exports were recorded from Cape Winelands and Eden district municipalities. Table 3: Share of district mutton exports to total Eastern Cape Provincial mutton exports (%).
Years Province
2004 2005 2006 2007 2008 2009 2010 2011 2012 2013
Western Cape 31.50
24.30
31.17
6.56
24.88
27.30
31.33
42.12
38.71 35.89
Eastern Cape 0
3.30
0.29
0.85
0
0
0
0
0 0.00
Northern Cape 29.35
11.53
1.09
0
0
0
0.07
0 0.12 0.00
KwaZulu-Natal 1.07
22.15
13.40
4.34
4.76
5.90
7.35
4.70
5.22 2.79
North West 0
0
0
0
0
0.04
5.4 5
0.05
0.72 1.29
Gauteng 34.30
37.44
52.85
88.25
70.02
65.25
49.78
44.14
44.55 53.32
Mpumalanga 3.78
1.27
1.21
0
0.33
1.5
6.02
9.00
10.69 6.71
TOTAL 100 100 100 100 100 100 100 100 100 100
Years DISTRICTS 2004 2005 2006 2007 2008 2009 2010 2011
2012 2013
Amatole 0 0 0 0 100 100 98.23 84.91 91.76 0
Nelson 0 0 0 0 0 0 1.77 15.09 0

16
Source: Quantec EasyData
The export shares of mutton were recorded in Amatole and Nelson Mandela district municipalities. Amatole district municipality commanded the greatest share from 2008 to 2012 and Nelson Mandela district municipality recorded some exports from 2010 to 2012. There were no exports of mutton in the Eastern Cape Province during 2004 to 2007. Table 4: Share of district mutton exports to the total Northern Cape Provincial mutton exports (%).
Years DISTRICTS 2004 2005 2006 2007 2008 2009 2010 2011
2012 2013
Pixley ka Seme 0 0 0 0 0 0 0 0 0 0
Siyanda 100 100 100 0 0 100 100 0 100 0
TOTAL 100 100 100 0 0 100 100 0 100 0
Source: Quantec EasyData
In Northern Cape Province, the greatest share of mutton exports was recorded from the Siyanda district municipality from 2004 to 2006 and again in 2009, 2010 and 2012. Table 5: Share of district mutton exports to the total KwaZulu–Natal Provincial mutton exports (%).
Source: Quantec EasyData
From Kwazulu–Natal Province, eThekwini municipality commanded the greatest share of mutton exports from the year 2004 to 2013 but diminished in 2004. It commanded the highest values from 2005 to 2013. Mutton shares were also recorded in UThungulu district municipality from 2004 to 2005; and in Ugu district municipality in 2004. UThungulu district municipality commanded the highest shares in 2004. Table 6: Share of district mutton exports to the total North West provincial mutton exports (%).
Mandela 8.24
TOTAL 0 0 0 0 100 100 100 100 100 0
Years DISTRICTS
2004 2005 2006 2007 2008 2009 2010 2011 2012 2013
Ugu 0.24
0 0
0 0 0 0 0 0
0
UThukela 0 0 0 0 0 0 0 0 0 37
UThungulu 99.76
0.25
0 0 0 0 0 0 0 0
eThekwini 0
99.75
100
100
100
100
100
100
100 63
TOTAL 100 100 100 100 100 100 100 100 100 100

17
Years DISTRICTS 2004 2005 2006 2007 2008 2009 2010 2011
2012 2013
Bojanala 0 0 0 0 0 100 0 0 0 0
Bophirima 0 0 0 0 0 0 100 0 92.13 0
Southern 0 0 0 0 0 0 0 100 7.87 100
TOTAL 0 0 0 0 0 100 100 100
100 100
Source: Quantec EasyData
Bojanala, Bophirima and Southern district municipalities in North West Province recorded mutton exports during 2009 to 2013. There were no export records before 2009 in the province. Table 7: Share of district mutton exports to the total Gauteng Provincial mutton exports (%).
Source: Quantec EasyData
In Gauteng Province, the greatest shares of mutton exports were recorded from City of Johannesburg municipality from 2004 to 2013 followed by Ekurhuleni municipality. Fractional exports were recorded in Sedibeng, Metsweding, West Rand and City of Tshwane district municipality. Table 8: Share of district mutton exports to the total Mpumalanga Provincial mutton exports (%).
Years DISTRICTS 2004 2005 2006 2007 2008 2009 2010 2011
2012 2013
Gert Sibande 0 4.10 100 0 0 22.85 0 1.36 22.66 0.0
Nkangala 0 0 0 0 0 77.15 9.75 0 4.37 0.0
Ehlanzeni 100 95.90 0 0 100 0 90.25 98.64 72.97 100.0
TOTAL 100 100 100 0 100 100 100 100 100 100.0
Source: Quantec EasyData
Years DISTRICTS 2004 2005 2006 2007 2008 2009 2010 2011
2012 2013
Sedibeng 6.05
0
5.25
0
0 0 0 0 0
0.00
Metsweding 0 0 0 0 0 0 0 4.01 1.63 0.41
West Rand 0.07
0.82
0 0 0 0 20.33
2.80
6.92 0.53
Ekurhuleni
31.54
7.65
10.4
0
9.09
0.98
8.04
24.3
1
8.15
33.5
7 20.11
City of Johannesburg
62.24
91.5
4
84.18
90.81
99.0
2
91.87
53.33
80.47
48.83
44.59
City of Tshwane
0.10 0 0.11 0.11 0 0.10 2.03 4.57 9.04 34.36
TOTAL 100 100 100 100 100 100 100 100 100 100

18
From Mpumalanga Province, the greatest shares of mutton exports were recorded from Ehlanzeni district municipality. Intermittent export shares of mutton were recorded in Gert Sibande and Nkangala district municipalities. There were no exports values recorded in Mpumalanga Province during 2007.
2.4. Imports of mutton
South Africa imported an average of 16.3 million kilograms per annum of mutton during the past decade at a value of R 146.9 million per annum. Figure 18 below show the imports of mutton from 2004 to 2013.
Source: Quantec EasyData
Import quantities of mutton started low in 2004 and continued on an increasing rate from 2005 until it reached the peak in 2006 then decreased thereafter to the lowest in 2013. It has been profitable to import mutton during 2004 to 2007 as more quantities were imported at a low rate and became expensive to import mutton from 2008 to 2013 because less quantity was imported with high values.
2004 2005 2006 2007 2008 2009 2010 2011 2012 2013
Quantity 17 23 33 28 25 12 8 7 5 4
Value 88 132 232 232 258 121 114 133 92 67
0
50
100
150
200
250
300
0
5
10
15
20
25
30
35
Mill
ion
Ran
ds
Mill
ion
Kilo
gra
ms
Figure 18: Mutton Imports

19
Source: Quantec EasyData
Most of South African mutton imports were from Oceania (Australia & New Zealand). Australia commanded the greatest shares of South African import market throughout the decade except in 2010 followed by New Zealand. The peak of R 25 million was reached in 2006. The two countries are the main suppliers of mutton to the South African import market.
Source: Quantec EasyData
0
5
10
15
20
25
30
2004 2005 2006 2007 2008 2009 2010 2011 2012 2013
Mill
ion
Kilo
gra
ms
years
Figure 19: Quantity of mutton imported from Oceania
Australia New Zealand
0
20 000
40 000
60 000
80 000
100 000
120 000
2004 2005 2006 2007 2008 2009 2010 2011 2012 2013
Kilo
gra
ms
Years
Figure 20: Quantity of mutton imported from South America
Argentina Brazil

20
From South America, mutton imports were from Argentina and Brazil. Argentina commanded the great shares in2004 and 2010, while Brazil was the highest from 2005 to 2008 and in 2011. There were no imports of mutton from South America during 2009, 2012 and 2013. Figure 21 below show the countries of origin of mutton from the world in 2012.
Source: Quantec Easydata
Australia 82%
singapore 1%
New Zealand 17%
Figure 21:Countries of origin for mutton imports in 2013
21
Figure 11 clearly indicate that the majority of mutton imported to South Africa was from Oceania in 2013. Australia commanded a South African market share of 82% while New Zealand commanded 17%. Both of them contributed 100% share of South African import market.
3. MARKETING CHANNELS
The Marketing Channel (see Figure 22) begins with the farmer who produces sheep and lamb. Most sheep farming practiced in South Africa is for wool and mutton/lamb. After about five to six years of shearing the sheep are sold directly to feedlot (small number) or abattoir; or sold through auctions. Live sheep and lambs can be imported by the farmer or the feedlot or the abattoir. Meat from abattoir is distributed through wholesalers, retailers and butcheries. Some is exported or processed. Import of meat is done by retailers and wholesalers and processors while exports are mainly by abattoirs. The final stages of the marketing channel end with the consumer.

22
Figure 22: Sheep Supply Chain
Primary Producers - Farmers
Abattoirs (meat)
Wholesalers
Retailers Butcheries
Processors
Imports
Skin & Wool
Feedlots Auctions
Exports
CONSUMERS

23
4. ORGANIZATIONAL ISSUES 4.1 EMPOWERMENT PLANS The communal wool farmers are formally represented in all structures of the National Wool Growers Association Board. Sinthema Mafama Wool Brokers is a BEE company affiliated to the Cape Mohair and Wool SA. When BKB (Boere Kooperative Beperk) purchases the wool from the informal producers a portion of the value is allocated to shares in the company. These producers then receive dividends based on the number of shares that they hold. The Sheep Forum of South Africa comprising of the major role players is the body responsible for driving the process for the sheep industry strategy. The following five working groups have been established: Resource Management Marketing and value adding Enabling Environment/ Infrastructure Development Human Resource development/training Research and development (Genetic improvement to improve the herd in the communal sector)
The three main pillars for the sheep strategy are as follows: Equitable market access and participation Global competitiveness and profitability Sustainable resource management
4.2. Opportunities
Important supplier of quality protein for human health. The A4 lamb carcass according to research is
low in fat content and complies with the standards of the Heart Foundation. Industry has tremendous growth potential in the informal sector which could assist in addressing the
shortage of mutton Niche markets and exports – Through the use of the South African EU-accredited abattoirs
mutton/lamb can be exported to niche markets.

24
4.3. Challenges
Stiff competition both nationally and
internationally Health, safety and traceability issues Phytosanitary issues
Climatic conditions
Smaller abattoirs do not comply with the
Meat, Health and Safety Acts. Livestock agents are corrupt and are often
not part of the organized marketing structure.
Stock theft Research and Development is a problem
Financial constraints
Predators account for large losses in
sheep herds Lack of infrastructure
Veterinary services in South Africa are
uncoordinated and insufficient Insufficient extension services
Safety and Security
25
5. MARKET INTELLIGENCE
5.1. Export Tariffs
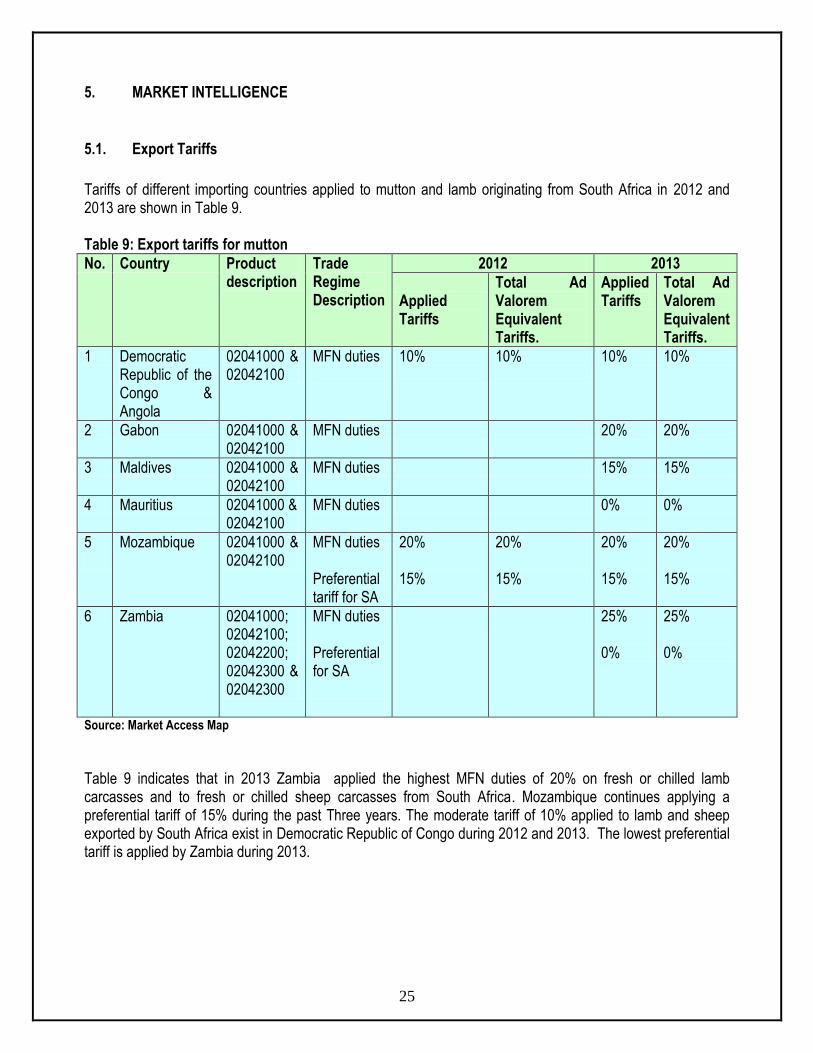
Tariffs of different importing countries applied to mutton and lamb originating from South Africa in 2012 and 2013 are shown in Table 9. Table 9: Export tariffs for mutton
No. Country Product description
Trade Regime Description
2012 2013
Applied Tariffs
Total Ad Valorem Equivalent Tariffs.
Applied Tariffs
Total Ad Valorem Equivalent Tariffs.
1 Democratic Republic of the Congo & Angola
02041000 & 02042100
MFN duties
10%
10%
10% 10%
2 Gabon 02041000 & 02042100
MFN duties 20% 20%
3 Maldives 02041000 & 02042100
MFN duties 15% 15%
4 Mauritius 02041000 & 02042100
MFN duties
0%
0%
5
Mozambique 02041000 & 02042100
MFN duties Preferential tariff for SA
20% 15%
20% 15%
20% 15%
20% 15%
6 Zambia 02041000; 02042100; 02042200; 02042300 & 02042300
MFN duties Preferential for SA
25% 0%
25% 0%
Source: Market Access Map
Table 9 indicates that in 2013 Zambia applied the highest MFN duties of 20% on fresh or chilled lamb carcasses and to fresh or chilled sheep carcasses from South Africa. Mozambique continues applying a preferential tariff of 15% during the past Three years. The moderate tariff of 10% applied to lamb and sheep exported by South Africa exist in Democratic Republic of Congo during 2012 and 2013. The lowest preferential tariff is applied by Zambia during 2013.

26
5.2. Import Tariffs
Tariffs that South Africa applied to imports of mutton originating from all possible countries in 2012 and 2013 are shown in table 10. Table 10: Import tariffs for mutton
No Country Product
code
Trade Regime
Description
2012 2013
Applied Tariffs
Total Ad Valorem
Equivalent Tariffs.
Applied Tariffs
Total Ad Valorem
Equivalent Tariffs.
1 New Zealand & Australia
02042100; 02042100: 02042300 & 02043000 02042200
MFN duties MFN duties
40% or 240$/Ton whichever is the greater 40% or 240$/Ton whichever is the greater
OTQR: 40% ITQR: 19% OTQR: 40% ITQR: 13.2%
40% or 186.19$/Ton whichever is the greater 40% or 186.19$/Ton whichever is the greater
OTQR: 40% ITQR: 19% OTQR: 40% ITQR: 13.2%
Source: Market Access Map
Table 10 indicates that tariffs applied by South Africa on imported mutton in 2012 changed from 40% or $ 240.10/Ton whichever is greater and decreased to 40% or 186.19$/Ton whichever is the greater during 2013. The total ad valorem tariff for 2012 was at 40%. In order to discourage imports above quota limit in 2013 the total ad valorem applied by South Africa to New Zealand and Australia was 40% and 40% for lamb and sheep respectively imported in excess tariff quota but imports within the limit of a quota was at 19% and 13.2% respectively.

27
6. COMPETITIVENESS OF THE SHEEP INDUSTRY
6.1. Competitiveness of sheep industry in exports
Table 11: List of importing markets for the lamb carcasses and half carcasses, fresh or chilled exported by South Africa in 2013
Importers
Trade Indicators
Tariff (estimated) faced by South Africa (%)
Exported value 2013 (USD thousand)
Trade balance 2013 (USD thousand)
Share in South Africa's exports (%)
Exported quantity 2013
Quantity unit
Unit value (USD/unit)
Exported growth in value between 2009-2013 (%, p.a.)
Exported growth in quantity between 2009-2013 (%, p.a.)
Exported growth in value between 2012-2013 (%, p.a.)
Ranking of partner countries in world imports
Share of partner countries in world imports (%)
Total import growth in value of partner countries between 2009-2013 (%, p.a.)
World 114 -16,400 100 18 Tons 6,333 15 21 68 100 20
Mauritius 57 57 50 7 Tons 8,143 0
Mauritania 34 34 29.8 5 Tons 6,800 20
Swaziland 16 16 14 4 Tons 4,000 -41 -43 48 0 0
Lesotho 3 3 2.6 2 Tons 1,500 -19 -81 62 0 0
Mozambique 3 3 2.6 0 Tons 27 0.1 15
Gabon 1 1 0.9 0 Tons -53 67 0 -53 20

28
South Africa’s exports represent 0.19% of world exports for lamb; its ranking in world export is 19. Table 11 shows that during 2013 South Africa exported a total of 464 tons of lamb carcasses and half carcasses at an average value of US$ 3 761/unit. South Africa exported greater quantities of lamb to Lesotho, Botswana, Swaziland, Mozambique and Namibia. The greatest share of South African mutton exports were destined to Lesotho which commanded 44.5% share during the year 2013 followed by Botswana by 27.2% and Swaziland by 19%. South Africa’s mutton exports (value & quantity) increased by 34% and 26% respectively between the periods 2009 and 2013. Exports of mutton to Mozambique increased by 25% in value and 31% in quantity during the periods 2008 to 2012. During the period 2011 to 2012 South Africa’s exports to the rest of the world increased by 55% in value and exports to Mozambique increased by 67% during the same period.

29
Figure 23: Growth in demand for lamb exported by South Africa in 2013
Source: Trademap, ITC

30
Figure 23 shows that between 2009 and 2013 South Africa’s lamb exported to Angola were growing at a rate that is greater than its import growth from the rest of the world. During the same period, South Africa’s mutton exports to Democratic Republic of Congo and Angola were growing at a rate that is less than their imports from the rest of the world. They were all representing losses in the declining market. DRC’s annual import growth has declined drastically by 33%, Angola by 68% The most growing demand of South African fresh or chilled lamb carcasses exist in Mozambique. South Africa’s mutton export growth to Mozambique is 26%
31
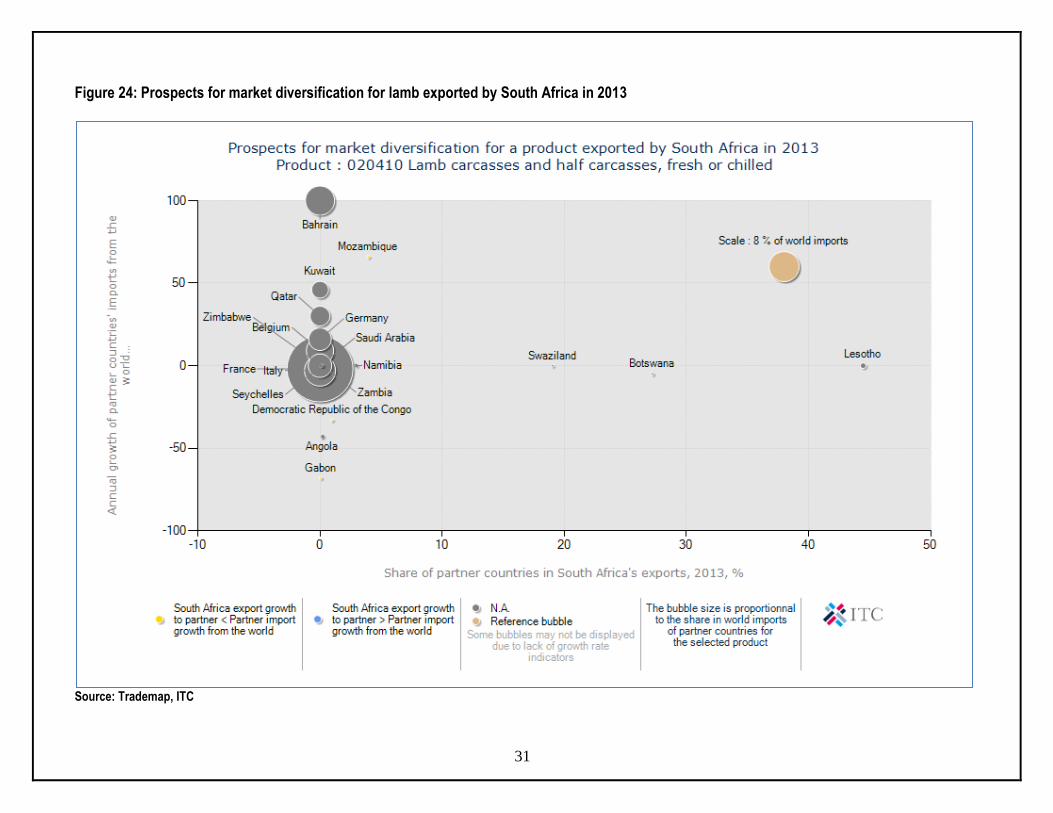
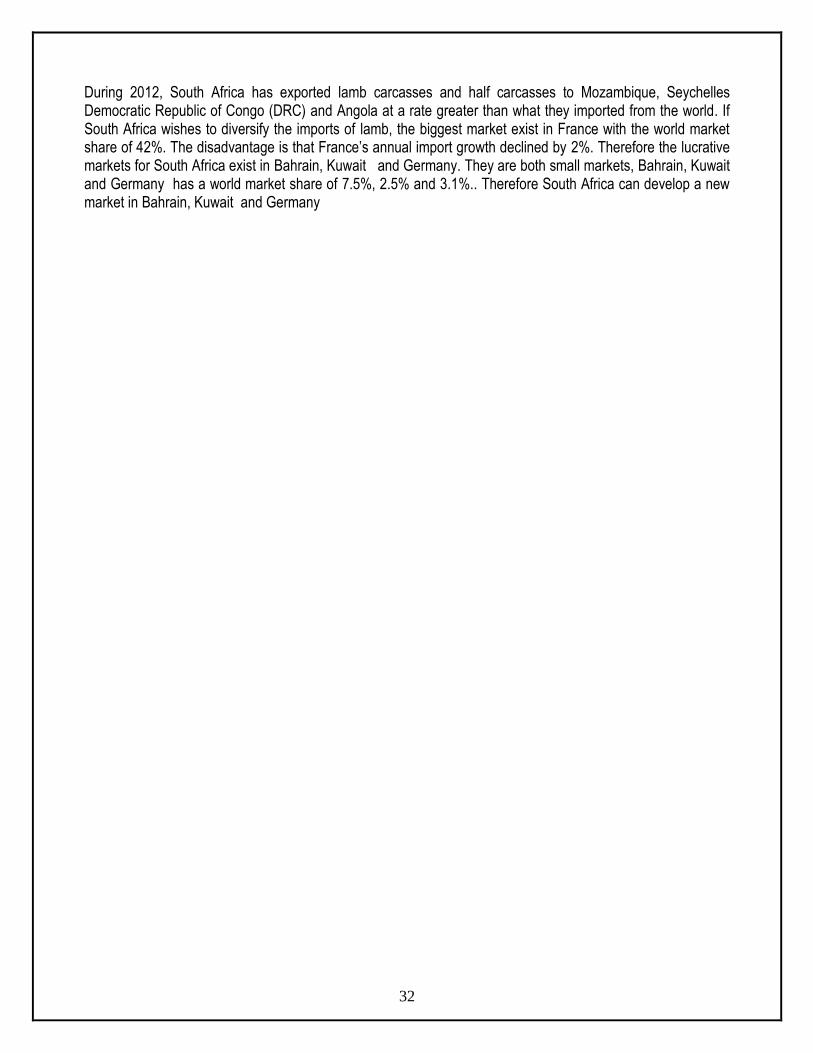
Figure 24: Prospects for market diversification for lamb exported by South Africa in 2013
Source: Trademap, ITC
32
During 2012, South Africa has exported lamb carcasses and half carcasses to Mozambique, Seychelles Democratic Republic of Congo (DRC) and Angola at a rate greater than what they imported from the world. If South Africa wishes to diversify the imports of lamb, the biggest market exist in France with the world market share of 42%. The disadvantage is that France’s annual import growth declined by 2%. Therefore the lucrative markets for South Africa exist in Bahrain, Kuwait and Germany. They are both small markets, Bahrain, Kuwait and Germany has a world market share of 7.5%, 2.5% and 3.1%.. Therefore South Africa can develop a new market in Bahrain, Kuwait and Germany
33
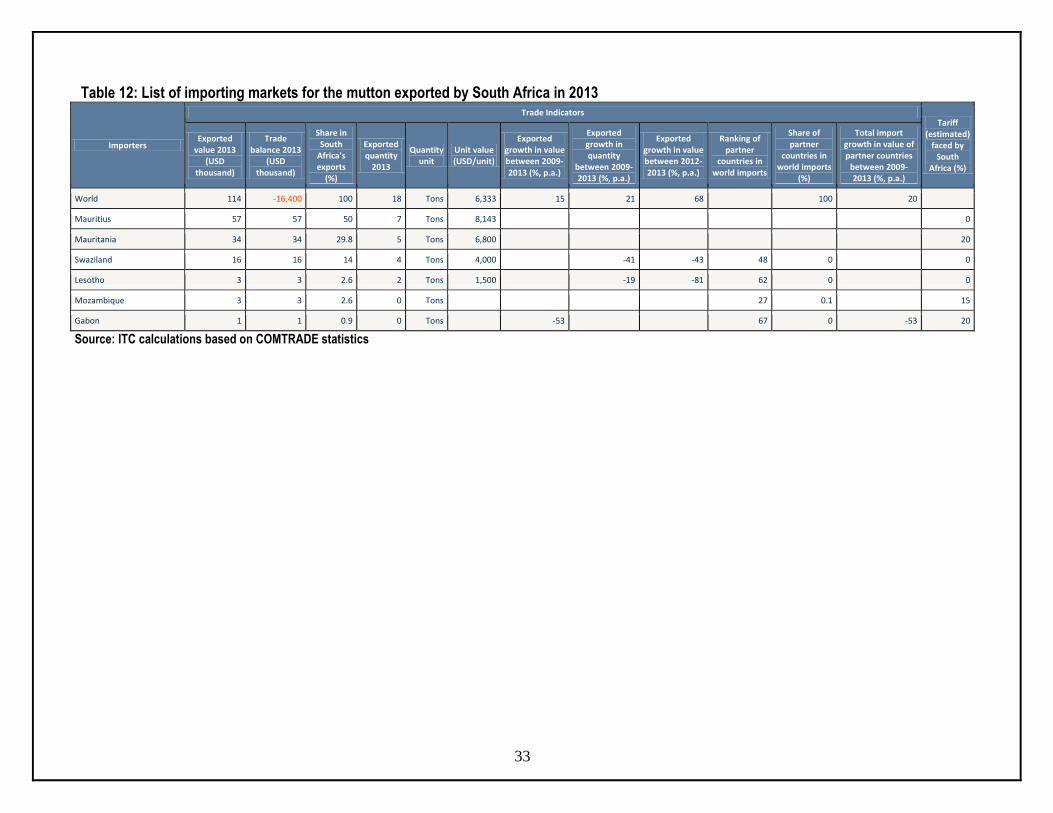
Table 12: List of importing markets for the mutton exported by South Africa in 2013
Importers
Trade Indicators Tariff
(estimated) faced by
South Africa (%)
Exported value 2013
(USD thousand)
Trade balance 2013
(USD thousand)
Share in South
Africa's exports
(%)
Exported quantity
2013
Quantity unit
Unit value (USD/unit)
Exported growth in value between 2009-2013 (%, p.a.)
Exported growth in quantity
between 2009-2013 (%, p.a.)
Exported growth in value between 2012-2013 (%, p.a.)
Ranking of partner
countries in world imports
Share of partner
countries in world imports
(%)
Total import growth in value of partner countries
between 2009-2013 (%, p.a.)
World 114 -16,400 100 18 Tons 6,333 15 21 68 100 20
Mauritius 57 57 50 7 Tons 8,143 0
Mauritania 34 34 29.8 5 Tons 6,800 20
Swaziland 16 16 14 4 Tons 4,000 -41 -43 48 0 0
Lesotho 3 3 2.6 2 Tons 1,500 -19 -81 62 0 0
Mozambique 3 3 2.6 0 Tons 27 0.1 15
Gabon 1 1 0.9 0 Tons -53 67 0 -53 20
Source: ITC calculations based on COMTRADE statistics

34
South Africa’s exports represent 0.04% of world exports for sheep carcasses and half carcasses fresh or chilled; its ranking in world export is 24. Table 12 shows that during 2013 South Africa exported a total of 18 ton of sheep carcasses and half carcasses at an average value of US$ 6 333 /unit. 7 tons exported by South Africa during 2013 were exported to Mauritius,5 to Mauritania, 4 tons to Swaziland and 2 tons to Lesotho . Mauritious commanded a share of 50%% of South African mutton followed by Mauritania with 30%, Swaziland with 14% and Lesotho with33% . South Africa’s mutton exports (value & quantity) increased by 15% and 21% respectively during the periods 2009 and 2013. Between the periods 2012 and 2013 South African fresh or chilled sheep carcasses increased by 68% in value.

35
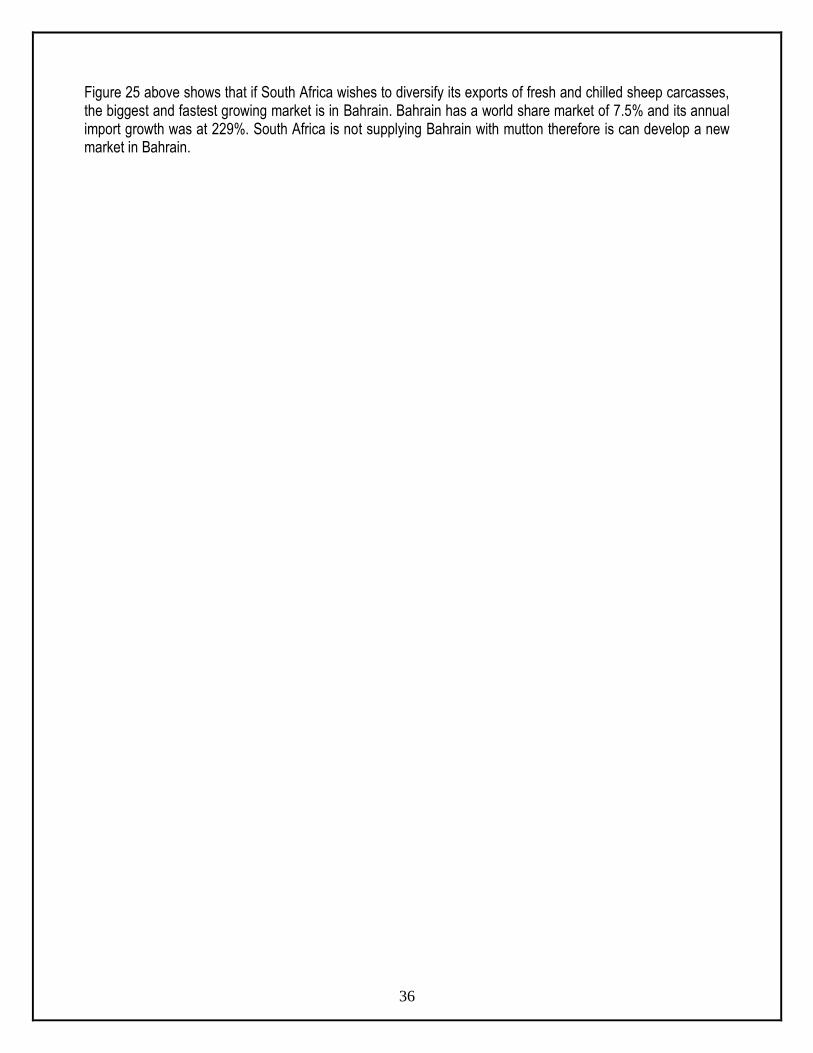
Figure 25: Prospects for market diversification for sheep carcasses exported by South Africa in 2012
Source: Trademap, ITC
36
Figure 25 above shows that if South Africa wishes to diversify its exports of fresh and chilled sheep carcasses, the biggest and fastest growing market is in Bahrain. Bahrain has a world share market of 7.5% and its annual import growth was at 229%. South Africa is not supplying Bahrain with mutton therefore is can develop a new market in Bahrain.

37
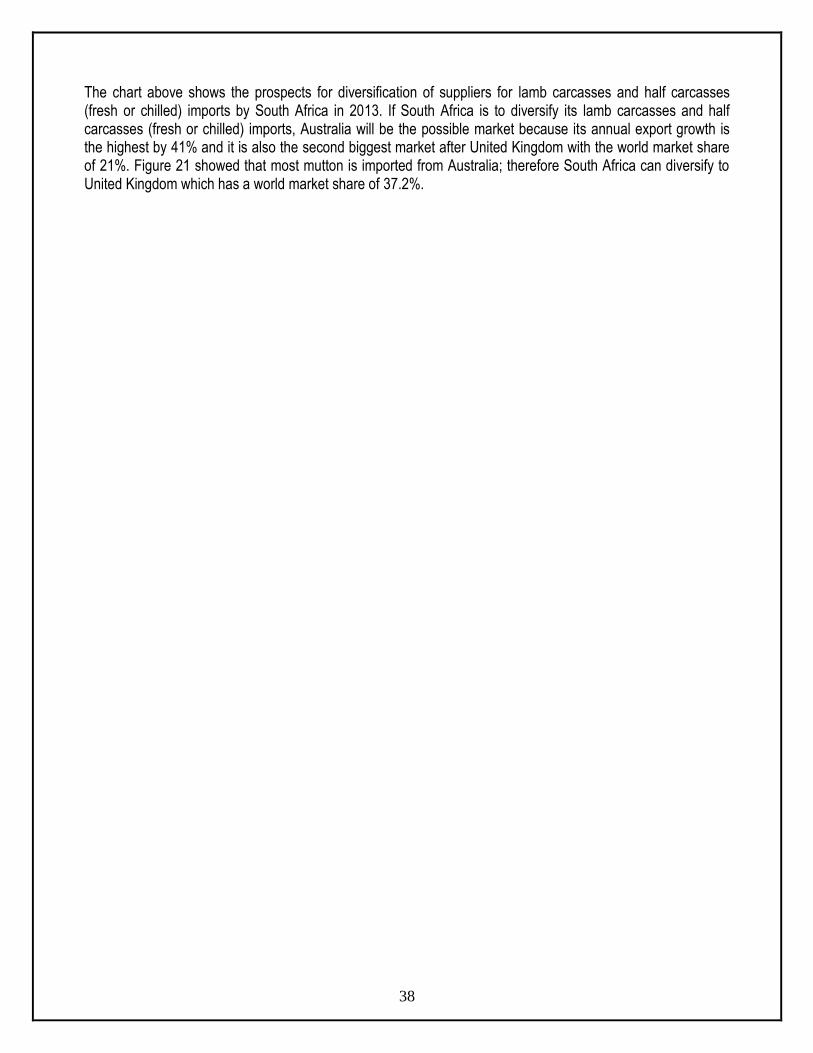
6.2. Competitiveness of sheep industry in imports There are no records on the list of exporting markets for lamb and sheep carcasses and half carcasses imported to South Africa in 2013. Figure 26: Prospects for diversification of suppliers for lamb imported by South Africa in 2013
Source: Trademap, ITC
38
The chart above shows the prospects for diversification of suppliers for lamb carcasses and half carcasses (fresh or chilled) imports by South Africa in 2013. If South Africa is to diversify its lamb carcasses and half carcasses (fresh or chilled) imports, Australia will be the possible market because its annual export growth is the highest by 41% and it is also the second biggest market after United Kingdom with the world market share of 21%. Figure 21 showed that most mutton is imported from Australia; therefore South Africa can diversify to United Kingdom which has a world market share of 37.2%.

39
Figure 27: Prospects for diversification of suppliers for sheep carcasses imported by South Africa in 2013
Source: Trademap, ITC

40
The chart above shows the prospects for diversification of suppliers for sheep carcasses and half carcasses (fresh or chilled) imports by South Africa in 2013. If South Africa is to diversify its sheep carcasses and half carcasses (fresh or chilled) imports, Ireland will be the possible market because its annual export growth is incomparable at a rate of 185% and it has a world share market of 7.2%.

41
7. ACKNOWLEDGEMENTS
a. National Wool Growers Association (NWGA)
www.nwga.co.za b. SAMIC
www.samic.co.za
c. Cape Wools www.capewools.co.za
d. Department of Agriculture, Forestry and Fisheries
www.daff.gov.za.
e. TradeMap www.trademap.org.
f. Quantec
www.quantec.co.za g. Market Access Map.
www.macmap.org.za.
h. NERPO www.nerpo.org.za
Disclaimer: This document and its contents have been compiled by the Department of Agriculture, Forestry and Fisheries for the purpose of detailing the sheep industry. The views expressed in this document are those of the Department of Agriculture, Forestry and Fisheries with regard to agricultural industry, unless otherwise stated and, therefore the Department of Agriculture, Forestry and Fisheries does not accept responsibility for any errors in such information and anyone acting on such information does so entirely at his or her own risk.