Embed Size (px)
Citation preview

1
A PROFILE OF THE SOUTH AFRICAN TOMATO MARKET VALUE CHAIN
2017
Directorate Marketing Tel: 012 319 8455 Private Bag X 15 Fax: 012 319 8131 Arcadia E-mail:[email protected] 0007 www.daff.gov.za

2
TABLE OF CONTENTS 1. DESCRIPTION OF THE INDUSTRY 3
1.1 Production areas 4
1.2 Production 4
1.3 Employment 5
1.4 Consumption 5
2. MARKET STRUCTURE 6
2.1 Domestic market and prices 6
2.2 Exports 7
2.3 Provincial and district export values of South African tomatoes 12
2.4 Share analysis 20
2.5 Tomato imports by South Africa 25
2. 6 Processing 28
3. MARKET INTELIGENCE 29
3.1 Competitiveness of South African tomato exports 29
4. MARKET ACCESS 33
4.1 Tariff, quotas and the price entry system 33
5. DISTRIBUTION CHANNELS 36
6. LOGISTICS 36
6.1 Mode of transport 36
6.2 Cold chain management 37
6.3 Packaging 37
7. SIMPLIFIED TOMATO FOOD VALUE CHAIN 37
7.1 Wholesalers 39
7.2 Wholesale-retailers 39
7.3 Retailers 39
7.4 Processors 39
7.5 Intermediaries 40
8. STRATEGIC CHALLENGES 40
9. TRANSFORMATION 40
10. ACKNOWLEDGEMENTS 41

3
1. DESCRIPTION OF THE INDUSTRY The tomato (Solanum lycopersicum) is the second most important and popular vegetable crop after potatoes in South Africa. It is not only cultivated commercially, but also commonly grown by subsistence, resource poor farmers and home gardeners. It contributed approximately 18.3% (excluding potatoes) to the gross value of vegetable production in 2015. Tomato is consumed in diverse ways including raw, as an ingredient in many dishes and sauces and also in drinks. Tomatoes are a rich source of vitamins A and C and folic acid. In South Africa tomatoes are used in stews to complement the staple diet of maize meal. As a result, it is also one of the main vegetables used for hawking by small-scale entrepreneurs in the informal sector. Interestingly, although tomatoes are nutritionally categorized as vegetables, they are botanically classed as fruits. Figure 1 below illustrates the contribution of the tomato industry to the gross value of agricultural production from 2007 to 2016.
Source: Statistics and Economic Analysis, DAFF
Tomato contribution has increased by 11.9% in 2008 and this can be attested to an increase in the producer prices during the same year. In 2009 the industry’s contribution surged by 42%, when compared to the previous year. This can be attributed to 11% increase in production and favourable producer prices at the same year. The contribution increased further in 2010 and the contribution was 3% higher when compared to 2009. The increase in contribution can be attributed to high production volume, which occurred while the producer prices were still favourable. During 2011, the contribution dropped by 2% when compared 2010, and this can be attributed to a 6.6% decrease in production output in the same year. In 2012, tomato gross value increased by 10% when compared to the previous year. During 2013, gross value has gone up by 8.8%, when compared to the previous year gross value and this can be attributed to favourable producer price in the same year. In 2014, tomato industry gross was a record high in a 10 year period and an
0
500000000
1000000000
1500000000
2000000000
2500000000
Val
ue
(Ran
d)
Years
Figure 1: Gross value of tomato production

4
increase in gross value was 12% more when compared to 2013 gross value. The increase in 2014 can be ascribed to 22% increase in producer price. A notable higher gross value was recorded in 2015 and the increase was 8.6% more than 2014 gross value. This can be ascribed to 18.7% rise in the producer price during the same year. There was a slight increase of 3.2% in 2016 gross value, when compared to 2015 value and this can be attested to 4% increase in the tomato production output.
1.1 Production areas
Tomatoes are produced in all South African provinces, but Limpopo province with its warm climate is best suited for production of tomatoes. Limpopo province is the major production area with 3 590 ha (Northern Lowveld at 2 700 ha and far Northern areas of Limpopo at 890 ha). The province account for more than 75% of the total area planted with tomatoes in South Africa. The other main producing areas are Onderberg area of Mpumalanga province at 770 ha and Border area of Eastern Cape province at 450 ha. Production is very limited in the winter months and tomatoes can only be produced in frost–free areas during winter or under protection like tunnels.
1.2 Production
There are approximately 695 producers in both commercial and emerging sectors. The commercial sector contributes 95% of the total produce while the emerging sector contributes only 5%. According to FAOSTAT, China is the largest producer of tomatoes in the world, followed by India, United States, Turkey, Egypt, Iran and Italy. These countries represent more than 80% of world tomato production. Egypt is still the only African countries amongst top ten world tomato producers. The tomato producing countries with the highest yields per hectare are the United Kingdom (UK), Netherlands, Belgium and Sweden. Figure 2 below shows South Africa’s total production of tomatoes from 2007 to 2016.
Source: Statistics and Economic Analysis, DAFF
0
100000
200000
300000
400000
500000
600000
700000
Ton
s
Years
Figure 2 : Total production of tomatoes

5
In 2007, tomato production output was just above 418 600 tons. From 2008 to 2010, production output increased steadily until 2011. The production output dropped by 6.7% during 2011, when compared to the previous year. The high production output was recorded in 2012, and the increase was 9% from the 2011 figures (see Figure 2 below). During 2013, production output dropped by 5.1%, in comparison to the 2012 production output. Over the past decade tomato production was stable above 400 000 tons per annum. The drop in production in 2007 and 2011 can be attributed to unfavourable climatic conditions and high production costs. In 2014, production output dropped by 8% in comparison to the previous year production output. The production of tomatoes has gone up by 8.7% in 2015 as compared to 2014 production period. During 2016, tomato production output was 4% more, in comparison to previous year production output.
1.3 Employment
The industry employs approximately 22 500 people with at least 135 000 dependents. Multipliers in the supply chains are the transport of the tomatoes to the fresh produce markets and processing plants, processing factories, fresh produce markets, independent traders, supermarket groups, packaging factories, informal traders and fast food outlets. A significant proportion of this total workforce is composed of low skilled, minimum wage labourers.
1.4 Consumption
The per capita consumption of tomatoes in South Africa is 12 kg per annum, compared to 32 kg in Europe. This 12 kg per capita consumption is only for metropolitan areas. Population growth, urbanization, per capita income and the income elasticity of demand for tomatoes are important factors influencing the demand for tomatoes. The average household in South Africa consumes between five and ten tomatoes per week.
Source: Statistics and Economic Analysis, DAFF
0
100000
200000
300000
400000
500000
600000
700000
Ton
s
Years
Figure 3: Production vs Consumption of tomatoes
Production (Tons) Consumption (Tons)

6
Figure 3 above depicts local consumption of tomatoes compared to the production over the period of 10 years. The figure indicates that the production of tomatoes is fairly higher than consumption. This indicates that South Africa is self-sufficient in terms of tomato production and surplus is also exported. The low consumption figure was recorded in 2007, due to low production output and the increase in tomato prices in the same year. In 2016, South Africa’s average annual fresh tomato consumption was approximately 392 064 tons per annum. In the same year, the consumption volume of tomatoes has increased by 1.5% and this can be attributed to increment in the tomato production output.
2. MARKET STRUCTURE
The industry uses four existing channels for the marketing of their product. The channels are as follows: local market through fresh produce markets, exports, processing and direct marketing.
2.1 Domestic market and prices
National Fresh Produce Markets (NFPMs) remain an important channel for the sale of tomatoes in South Africa. As a result the NFPMs prices are the benchmark used in all national tomato sales. The NFPMs are regarded as the preferred marketing channel for tomatoes. The Johannesburg Fresh Produce Market is the biggest market, followed by Tshwane, Cape Town and Durban markets. In 2016, Johannesburg market share has slightly declined to 49%, Tshwane market share has increased to 17%, Cape Town market share remained at 11% and Durban remained at 7% of tomato market shares sold at major fresh produce markets. Figure 4 below illustrates tomato share by major fresh produce markets in 2016.
Source: Statistics and Economic Analysis, DAFF
Figure 5 below illustrates sales of tomatoes at the major fresh produce markets between 2007 and 2016. During 2007, volume supplied across the markets was just above 249 100 tons and lowest
Johannesburg49%
Cape Town11%
Durban7%
Other15%
Tshwane17%
Figure 4: Tomato share by major fresh produce markets in 2016

7
market price was recorded in the same year. In 2008, the market price surged by 55%, when compared to the 2007 price. The quantity of tomatoes sold on the major NFPMs markets have increased by 1.7% in 2010 when compared to tons sold in 2009. At the same time, there was a 1.3% increase in tomato prices at the NFPMs. Tomato prices eased higher in 2011, despite a slight increase in volumes supplied across the markets. During 2012, market price increased by 3% despite a 5.9% increase in tomato supplied at the markets. This can be attributed to strong demand of tomatoes in the same years. In 2013, tomato price eased higher by 11.9% and this can be attributed to 1.54% decline in volumes supplied across the markets. During 2014, a 4.6% drop in volume supplied at the markets had a positive impact and the market price went up by 20% in comparison to 2013 market price. In 2015, there was a 3.4% increment in the tomato price despite 1.8% increase in tomato supplied at the markets and this can be ascribed to strong tomato uptake in the same year. During 2016, tomato supplied at the markets grew by 6.3%, which resulted in 4.6% drop in tomato market price. Figure 5 below illustrates sales of tomatoes at the major fresh produce markets between 2007 and 2016.
Source: Statistics and Economic Analysis, DAFF
2.2 Exports
South Africa is not a major exporter of tomatoes with just above 29 000 tons exported in 2016. South Africa’s tomato exports still represents 0.1% of world exports and its still ranked number 40 in world tomato exports. South Africa competitiveness has not changed, despite an increase in the volume of tomato exported. Most tomatoes produced are destined for the domestic market and very little percentage of raw tomatoes and processed tomatoes are exported to other countries. In terms of processed tomatoes, less than one percentage is exported to the other countries. Globally, Mexico was still the biggest exporter of tomatoes in 2016, exporting over
0
1000
2000
3000
4000
5000
6000
7000
0
50000
100000
150000
200000
250000
300000
Ran
d/t
on
Ton
s
Years
Figure 5: Sales of tomatoes at the national fresh produce markets
Volume (tons) Price (Rand/tons)

8
7,745,243 tons a year and accounting for 25% of the world export market in tomatoes. Second was the Netherlands with 18.9% market share, followed by Spain (12.6%) and Morocco (6.1%). In 2016, Morocco was the fourth largest exporter of tomatoes in the world, the only significant exporter of tomatoes in Africa. Morocco has annual growth of 17% in value between 2015 and 2016. Figure 6 below shows tomato exports from South Africa over the period of 10 years. During 2007, South Africa has exported just above 11 200 tons of tomatoes. In 2008, export volumes notably dropped by 31% despite a 11.8% increase in domestic production output. Tomato exports grew by 10.8% during 2010 and this can be ascribed to 1.9% increment in domestic production output. High tomato exports were recorded in 2010 and 2011. A record high export volume was recorded in 2012 and this can be attested to a 9% increase in domestic production output. In 2013, export volume significantly dropped by 85.6%, which can be ascribed to a 5.1% decline in the domestic production output. During 2014, South African tomato exports have slightly dropped by 1.7% in comparison to the 2013 exports. South Africa’s tomato exports grew by 14.6% in 2015, despite 8.5% drop in the domestic tomato output. As of 2013 to 2016, it was more profitable to export tomatoes since higher export values were recorded for volumes exported. During other years, it was less profitable to export tomatoes since low export values were recorded for higher volumes exported. In 2016, South Africa tomato export increased by 6.7% in comparison to 2015 tomato exports and this can be ascribed to 4% increase in the domestic production output.
Source: Quantec Easydata
* Quantec Easy data has revised its export data to reflect SACU export from 2010 According to Figure 7 below, South Africa exports most of its tomatoes to the African countries. During 2016, Botswana was the biggest recipient of South African tomato exports with 34.8% share, followed by Lesotho with 20%, Mozambique with 17.8% share and Namibia with 4.3% share. South Africa has diversified its tomato exports from its traditional markets (Angola, Mozambique and Zimbabwe) to Southern African Customs Union (SACU) members (Botswana,
0
20000000
40000000
60000000
80000000
100000000
120000000
140000000
0
20000
40000
60000
80000
100000
120000
140000
160000
180000
Ran
d
Ton
s
Years
Figure 6: South Africa tomato exports
Volume (tons) Value (Rand)

9
Namibia, Lesotho and Swaziland). In 2016, South African tomato exports, which remained in the ship stores and bunkers has notably increased in comparison to 2015 export volume (This is the place where products without proper documents are held).
Source: International Trade Centre (ITC)
The performance of the South African tomato exports during the year 2016 is further illustrated in Table 1 below. Table 1: South Africa’s tomato exports in 2016
Importers
Value exported in 2016 (USD thousand)
Trade balance 2016 (USD thousand)
Share in South Africa's exports (%)
Quantity exported in 2016 (Tons)
Growth in exported value between 2012-2016 (%, p.a.)
Growth in exported quantity between 2012-2016 (%, p.a.)
Growth in exported value between 2015-2016 (%, p.a.)
World 8339 7885 100 29074 -7 -31 29
Botswana 2900 2900 34.8 5400 -1 -48 8
Lesotho 1670 1670 20 4845 -11 19 101
Mozambique 1483 1483 17.8 15461 -12 -3 37
Namibia 1167 738 14 1594 -12 -4 0
Swaziland 357 337 4.3 976 -5 1 65
Zambia 187 187 2.2 285 29 27 1770
Angola 158 158 1.9 188 -4 4 -18
Nigeria 97 97 1.2 20 18 19
0 5 10 15 20 25 30 35 40
Botswana
Lesotho
Mozambique
Namibia
Swaziland
Zambia
Angola
Nigeria
Malawi
USA
Seychelles
Mauritius
Other
Co
un
trie
s
Figure 7: South Africa tomato export destinations in 2016
Share in South Africa's exports (%)

10
Importers
Value exported in 2016 (USD thousand)
Trade balance 2016 (USD thousand)
Share in South Africa's exports (%)
Quantity exported in 2016 (Tons)
Growth in exported value between 2012-2016 (%, p.a.)
Growth in exported quantity between 2012-2016 (%, p.a.)
Growth in exported value between 2015-2016 (%, p.a.)
Malawi 75 75 0.9 73 79 102 142
USA 72 72 0.9 46
Seychelles 56 56 0.7 26 -22 -27 273
Mauritius 48 48 0.6 24 15 21 4
Area Nes 26 25 0.3 102 114 164 767 Source: International Trade Centre (ITC)
Table 1 above indicates that during 2016, South Africa exported higher quantities of tomatoes to Botswana, Namibia, Mozambique and Lesotho. Tomato export to Botswana has dropped by 1% in value and 48% in quantity between 2012 to 2016 period. South Africa’s tomato exports to Lesotho have decreased by 11% in value and have increased by 19% in quantity between 2012-2016 period. South Africa’s tomato exports to Mozambique have decreased by 12% in value and by 3% in quantity during 2012- 2016 period. South Africa’s tomato exports to Swaziland have declined by 5% of value during the 2012 - 2016 periods. Figure 8 below illustrates South Africa’s tomato exports to the different regions from 2007 to 2016. South Africa exported high quantities of tomatoes to the African region (Angola, DRC, Mauritius, Mozambique, Seychelles, Zambia, Zimbabwe, Nigeria, Ghana and Saint Helena). South Africa also exported tomatoes to Europe (France, United Kingdom, Germany and Netherlands) and Asia. Considerable volumes of tomato exports were not allocated to any region while from 2007 to 2012, a sizeable amount of tomatoes were exported to Oceania region. During 2011, there were no tomato exports to Americas region while exports to Europe were less significant. In 2012, countries in African region (Mozambique, Zimbabwe and Angola) continued to be the preferred tomato export market from South Africa. South Africa also exported considerable volumes of tomatoes to Oceania region (Papua New Guinea). During 2013, African region was still the main export market for tomato originating from South Africa. However the exports were diversified to Botswana, Namibia, Lesotho and Swaziland. In the same year considerable exports were destined to Oceania (Melanesia) and Asian (United Arab Emirates, Saudi Arabia and Hong Kong) region while the export to Americas (Colombia) region was less significant. During 2014, African region remained the primary export market for tomatoes originating from South Africa. SACU countries have accounted for 76.6% share of South Africa tomato exports. At the same time, exports to Asia (United Arab Emirates) have notably increased, whereas exports to Europe were insignificant. In 2015, Africa region has remained the biggest recipient of South Africa’s tomato export, followed by Asia. During the same year, a notable share of South Africa tomato export was destined to Asia region and there was also a significant increase in unallocated tomato export. During 2016, Africa region was still the primary export market for tomato originating from South Africa. A notable volumes were also exported to Americas (United States of America) region and the unallocated volume has also notably increased, in comparison to

11
2015 exports. At the same time, there was a notable drop in tomato volume exported to Oceania region.
Source: Quantec Easydata
Figure 9 below illustrates the value of tomato exports to the regions from 2007 to 2016. Africa region has recorded high export values since high quantities of tomatoes were exported to that region. In 2010, it was less profitable to export to Oceania region since low values were recorded for high volumes exported. It was more profitable to export to the European region since high values were recorded for low volumes exported. During 2011, it was more profitable to export to Europe and Asia. In 2012, it was more profitable to export tomatoes to Asia and unallocated exports recorded higher value while, Oceania region was the least profitable market. During 2013, an export to African region was least profitable while the Asia was the most profitable export market followed by America region. In 2014, tomato exports to Africa were more profitable, followed by exports to Europe and exports to Asia were least profitable in comparison to the other regions. During 2015, Europe market was by far the most profitable market for tomatoes originating from South Africa, followed by Asia and tomato exports to Africa region had fetched lower values. At the same time, the unallocated tomato exports had a lesser export value. In 2016, it was relatively more profitable to export tomatoes to Americas region, whilst Africa region has remained least profitable market.
2007 2008 2009 2010 2011 2012 2013 2014 2015 2016
Africa 10971390 7486285 8334804 39144325 68434080 167720686 24133655 23758132 27157076 28931637
Americas 1287 244 92 3050 0 0 57 0 0 45890
Asia 20641 612 846 236 700 3427 2310 13043 63540 0
Europe 54620 1350 0 9474 126 0 0 54 235 0
Oceania 3000 17316 15607 18484 60000 30800 8106 0 12000 3300
Antarctica 833 25 107 42 4 0 0 0 0 0
Not allocated 202413 236964 233400 136802 17075 33491 27686 4056 20292 102191
0
20000000
40000000
60000000
80000000
100000000
120000000
140000000
160000000
180000000
Vo
lum
e (K
g)
Years
Figure 8: South Africa's tomato exports to the regions

12
Source: Quantec Easydata
2.3 Provincial and district export values of South African tomatoes
A review of provincial level trade data presents an interesting but somewhat misleading view of the sources of tomatoes destined for the export markets. Firstly, the fact that R64 739 456 worth of tomatoes exported in 2016 was from Gauteng province does not imply that the tomatoes were produced there but that the registered exporters were based in Gauteng. Secondly provinces like Kwa-Zulu Natal and the Western Cape serves as exit points for tomato exports through the Durban and Cape Town harbours respectively. Highlights of the tomato exports in Figure 10 were that of Gauteng followed by the Western Cape, and KwaZulu Natal provinces of South Africa over the last decade. Other provinces featured intermittently, but usually registered zero trade. During 2007, Eastern Cape has recorded a notable export value, whereas Limpopo has recorded a notable value in 2009. In 2010, Limpopo export value has significantly increased while North West has recorded its first export value but the value was insignificant. In the same year Gauteng export value was incomparably higher when compared to 2009 export value. During 2011, Limpopo, Eastern Cape, Northern Cape, Free State, North West and Mpumalanga recorded no trade in tomatoes. In 2012, considerable tomato export values were recorded for Free State, North West, Mpumalanga and Limpopo. High export value for Mpumalanga and Limpopo can be attributed to high export to neighbouring countries (Mozambique and Zimbabwe). In the same year the export value for Western Cape and KwaZulu Natal have dropped. During 2013, Free State, Eastern Cape, KwaZulu Natal and North West exports value have significantly increased, when compared to the previous year. The increase in exports to Free State and North West provinces can be attributed to the substantial increase in export to the neighbouring Lesotho, Namibia and Botswana. In 2014, tomato exports for Gauteng notably dropped, whereas the export values for Western Cape, Eastern Cape, Free State, North West, Mpumalanga and Limpopo have significantly increased when compared to 2013. There was a
2007 2008 2009 2010 2011 2012 2013 2014 2015 2016
Africa 8444050 11027631 15294211 70119598 78253630 81528326 87682166 101238446115328407121171718
Americas 8979 2516 1025 5490 0 0 863 0 0 1059062
Asia 101970 3287 7448 3177 6212 66498 46120 206353 907859 0
Europe 548606 14830 0 78722 1380 0 0 507 8650 0
Oceania 2000 249267 497368 20152 70550 29900 14040 0 12000 7210
Antarctica 14497 600 1619 513 54 0 0 0 0 0
Not allocated 1829024 2205228 2752213 1585236 208268 309192 292783 17036 59872 387845
0
20000000
40000000
60000000
80000000
100000000
120000000
140000000
Val
ue
(Ran
d)
Years
Figure 9: Value of South Africa's tomato exports to the regions

13
notable increment in Gauteng, Western Cape, North West, Free State and Limpopo provincial tomato export values during 2015. High export values for North West and Free State can be attributed to notable share of South Africa tomato exports to the neighbouring Botswana and Lesotho. In 2016, Gauteng was still leading in South Africa provincial tomato export, followed by Western Cape. In the same year, there has been a notable increase in Free State, Mpumalanga, North West, Limpopo and Northern Cape tomato export values. High export value by Free State province can be ascribed to the increase in tomato export share to the neighbouring Lesotho.
Source: Quantec Easydata
The following figures (Figures 11 - 17) show the value of tomato exports from the various districts in all the provinces of South Africa. From Figure 11 below, it is clear that tomato exports from the Western Cape province are mainly from the City of Cape Town Metropolitan Municipality. During 2009, City of Cape Town export value has gone up by 17% in comparison to 2008 export value and in the following year, the export value has drastically dropped. During 2010, Cape Winelands also contributed to tomato exports from Western Cape province. In 2011, there was a 23.4% decrease in value of tomato exports the City of Cape Town municipality, whereas the export value for Eden has increased and Cape Winelands has a recorded zero trade. In 2012, there was a further 4.9% decline in export value recorded for the City of Cape Town Municipality. In the same year, the export value recorded for Eden has also dropped by 26%. During 2013, City of Cape Town, Cape Winelands and Eden export value for has notably gone up, in comparison to the 2012 export value. A record high export value for the City of Cape Town was recorded in 2014. At the same time, Cape Winelands and Eden have also increased their export values. In 2015, City of Cape Town export value has
2007 2008 2009 2010 2011 2012 2013 2014 2015 2016
Western Cape 5801163 10435427 12252352 2588188 2196804 2080142 2291403 17931485 22145069 23014784
Eastern Cape 395656 0 0 0 0 0 28500 60680 22243 14080
Northern Cape 0 0 0 0 0 0 0 356 100 20690
Free State 0 0 0 0 0 554163 2515021 16362863 18780659 18770755
KwaZulu-Natal 699777 79920 741691 1944924 626020 615137 714898 416151 713000 1643240
North West 0 0 0 1420 0 0 0 328236 1180611 2308021
Gauteng 4040843 2988012 5315468 66529613 75717270 77061746 76426142 58737669 66191065 64739456
Mpumalanga 11687 0 0 21078 0 1278358 5987732 6680349 5313469 9332248
Limpopo 0 0 244373 727665 0 344370 72276 878125 1987773 2782105
0
10000000
20000000
30000000
40000000
50000000
60000000
70000000
80000000
90000000
Val
ue
(Ran
d)
Years
Figure 10: Value of tomato exports by SA Provinces

14
increased by 16.8%. Cape Winelands and Eden export values were incomparably higher in comparison to 2014 export values. During 2016, Cape Town has continued to lead in Western Cape tomato exports and the export value has gone up by 8.5%, Eden export value surged, whilst Cape Winelands export value has drastically decreased in comparison to 2015 values.
Source: Quantec Easydata
. Values of tomato exports from the Gauteng province are shown in Figure 12.
Source: Quantec Easydata
2007 2008 2009 2010 2011 2012 2013 2014 2015 2016
City of Cape Town 5789996 10435427 12242877 2554476 2160609 2053360 2233220 17791149 20787247 22554709
West Coast 11167 0 0 0 0 0 0 0 90 12635
Cape Winelands 0 0 0 18330 0 132 15000 96456 1179235 123789
Eden 0 0 9475 15382 36195 26650 43183 43880 178497 323651
0
5000000
10000000
15000000
20000000
25000000
Val
ue
(Ran
d)
Years
Figure 11: Value of tomato exports by Western Cape Province
2007 2008 2009 2010 2011 2012 2013 2014 2015 2016
Sedibeng 0 0 0 0 0 0 0 0 0 160
West Rand 0 0 0 0 0 6500 0 1268445 1922648 1054512
Ekurhuleni 461486 17010 169328 312017 207795 647040 604512 6046566 6609038 8624845
City of Johannesburg 3579357 2971001 5145678 44723814 56308895 62334328 67472148 27276016 33548136 26417042
City of Tshwane 0 0 461 21493782 19200580 14073878 8349482 24146641 24111243 28642898
0
10000000
20000000
30000000
40000000
50000000
60000000
70000000
80000000
Val
ue
(Ran
d)
Years
Figure 12: Value of tomato exports by the Gauteng Province

15
In the Gauteng province, there have been fluctuations in tomato export values for the past ten years (see Figure 12 above). The leading role players are City of Johannesburg and City of Tshwane has contributed from 2010. High export values were recorded in 2011 (for the City of Johannesburg) and 2010 (for City of Tshwane). At the same time, Ekurhuleni export value has also doubled. From 2011 to 2013, City of Johannesburg export value has steadily increased and at the same period City of Tshwane export value has steadily declined. In 2012, West Rand municipality recorded the export value for the first time in a ten year period and in the same year export values for Ekurhuleni has doubled. City of Johannesburg municipality export value was a record high during 2013. In the same year, export value for Ekurhuleni has increased by 26.6% in comparison to 2012 export value. During 2014, City of Tshwane, Ekurhuleni and West Rand export values have considerably increased whereas City of Johannesburg export value has drastically decreased. During 2015, City of Johannesburg and City of Tshwane have continued to be the primary exit points for tomato exported from Gauteng province and the export values recorded for these districts have notably increased. At the same time, West Rand export value has increased by sharply increased by 51% in comparison to 2014 export value. In 2016, City of Tshwane was the main contributor to Gauteng provincial tomato exports, Ekurhuleni export value increased by 30%, whereas West Rand and City of Johannesburg tomato export values have considerably decreased.
Source: Quantec Easydata
From figure 13 above, it is clear that tomato exports from the Kwa-Zulu Natal province are mainly from the Ethekwini Metropolitan Municipality. High export values for the leading municipality were recorded in 2007. During 2008 there was an 88.5% decrease in tomato export value from Ethekwini and during 2009, the export value was incomparably higher when compared to the previous year. In 2010, UGu has registered a considerable value for tomato exports and the export value for Ethekwini was a record high in a ten year period. The use of the Durban harbour as an exit point may have played a major role in the Ethekwini municipality being a leader in the export of
2007 2008 2009 2010 2011 2012 2013 2014 2015 2016
Ugu 0 0 0 108600 13100 32580 0 0 2980 0
Uthukela 0 0 0 0 0 0 0 0 0 1059062
Umzinyathi 0 0 0 0 0 0 0 0 0 120
Zululand 0 0 0 0 0 0 0 0 17100 68890
Umkhanyakude 0 0 0 0 0 0 0 0 0 2725
Uthungulu 0 0 0 0 0 0 0 0 5750 0
ILembe 0 0 0 0 0 0 0 0 15500 0
EThekwini 699777 79920 741691 1836324 612920 582557 714898 416191 671241 512443
0200000400000600000800000
100000012000001400000160000018000002000000
Val
ue
(Ran
d)
Year
Figure 13: Value of KwaZulu Natal tomato exports

16
tomatoes from the Kwa-Zulu Natal province. During 2012, Ethekwini continued to lead in tomato exports from KwaZulu Natal, at the same time the export value for Ugu has considerably increased, when compared to 2011 export value. In 2013 and 2014, KwaZulu Natal tomato exports were solely from Ethekwini district and the export value has increased by 27%, when compared to 2012 export value. Ethekwini export value has gone down by 41.8% during 2014, when compared to the previous year export value. In 2015, Ethekwini district has continued to lead in KwaZulu Natal tomato exports and the export value has gone up by 61%. At the same time, Ugu, Zululand, Uthungulu and ILembe have recorded insignificant tomato export values. Uthukela and Zululand districts have substantially contributed to KwaZulu Natal tomato exports during 2016. At the same time, Ethekwini export value has dropped by 23%, Umkhanyakude and Umzinyathi districts have registered trivial tomato export values.
Source: Quantec Easydata
Figure 14 above illustrates that tomato exports from the Limpopo province during the ten year period. In 2007 to 2008 and 2011, the province has recorded a zero trade. In 2010, Capricorn recorded a considerable export value for the Limpopo province. This is in spite of the fact that the province is one of the leading producers of tomatoes. During 2009, Vhembe as recorded its first tomato export value. During 2010, Limpopo province has recorded the highest export value and tomatoes were exported through Capricorn district. In 2012, Waterberg have recorded considerable export values. This is a good development as Limpopo province is one a leading producer of tomatoes. During 2013, Limpopo overall tomato export value has dropped significantly, when compared to the 2012 tomato exports. The province exported tomatoes through Vhembe and Waterberg districts. Vhembe export value was less significant. In 2014, Capricorn and Waterberg export values have notably increased. At the same time Mopani district has contributed to Limpopo tomato exports for the first time in ten years but the export value was less significant. In 2015, Capricorn district was the primary exit point for tomato export from Limpopo province and the
2007 2008 2009 2010 2011 2012 2013 2014 2015 2016
Mopani 0 0 0 0 0 0 0 9042 8440 10540
Vhembe 0 0 244373 44100 0 44150 1200 0 0 0
Capricorn 0 0 0 683565 0 1960 0 479058 1580165 2227460
Waterberg 0 0 0 0 0 298260 71076 390408 398327 544106
0
500000
1000000
1500000
2000000
2500000
Val
ue
(Ran
d)
Years
Figure 14: Value of tomato exports by Limpopo Province

17
export value recorded for this district was incomparably higher when compared to 2014 export value. In the same year, Waterberg tomato export value has increased by 2%, while Mopani export value has dropped by 7%. In 2016, Capricorn tomato export value has significantly increased by 41%, Waterberg export value grew by 36.6% and Mopani export value has risen by 24.8%, when compared to the previous year export values.
Source: Quantec Easydata
From Figure 15, it is clear that tomato exports from the Mpumalanga province are primarly exported from Ehlanzeni District Municipality. In 2007 and 2010, Ehlanzeni export values were less significant. In 2008, 2009 and 2011 the province has recorded a zero trade. In 2012, Ehlanzeni district has registered notable tomato export value. During 2013, Ehlanzeni export value was incomparably higher in comparison to the previous year export value. Gert Sibande has contributed to Mpumalanga tomato export while Ehlanzeni export value was a record high during the period under review. High export value for Mpumalanga can be attributed to high export destined to neighbouring Mozambique. In 2015, Ehlanzeni district was still by far the main contributor to tomato exports from Mpumalanga province however the export value has notably dropped by 25% in comparison to 2014 value. At the same time, Gert Sibande tomato export value was incomparably higher when compared to the previous year export value. During 2016, the overall Mpumalanga tomato export value surged and it was exported through Ehlanzeni, Nkangala and Gert Sibande. The surge in Mpumalanga tomato exports can be attributed to 37% increase in value of exports destined to the neighbouring Mozambique during 2015 and 2016 period.
2007 2008 2009 2010 2011 2012 2013 2014 2015 2016
Gert Sibande 0 0 0 0 0 0 0 34832 343093 143080
Nkangala 0 0 0 0 0 0 0 0 0 842320
Ehlanzeni 11687 0 0 21078 0 1278358 5987732 6645918 4967103 8346848
0
1000000
2000000
3000000
4000000
5000000
6000000
7000000
8000000
9000000
Val
ue
(Ran
d)
Years
Figure 15: Value of tomato exports by Mpumalanga Province

18
Source: Quantec Easydata
Figure 16 above shows that tomato exports from the Eastern Cape province were from Buffalo City district municipality in 2007. In 2009 to 2012, there were no export values recorded for Eastern Cape province. In 2013, Eastern Cape has recorded a notable tomato export value through Cacadu district, after five years of recording a zero trade. During 2014, Alfred Nzo has registered a notable export value, while Cacadu and Nelson Mandela Bay export values were less significant. In 2015, Alfred Nzo export value has significantly dropped by 69.5% in comparison to 2014 export value. Cacadu and Nelson Mandela Bay export values were less significant. During 2016, Eastern Cape exported tomatoes through Alfred Nzo, Cacadu and Nelson Mandela Bay, however the export values were less significant.
Source: Quantec Easydata
2007 2008 2009 2010 2011 2012 2013 2014 2015 2016
Cacadu 0 0 0 0 0 0 28500 400 900 3000
Alfred Nzo 0 0 0 0 0 0 0 56589 17233 10525
Nelson Mandela Bay 0 0 0 0 0 0 0 3692 4110 555
Buffalo City 395656 0 0 0 0 0 0 0 0 0
0
50000
100000
150000
200000
250000
300000
350000
400000
450000
Val
ue
(Ran
d)
Years
Figure 16: Value of tomato exports by the Eastern Cape Province
2007 2008 2009 2010 2011 2012 2013 2014 2015 2016
Xhariep 0 0 0 0 0 554163 2515021 1876971 1991691 2065677
Lejweleputswa 0 0 0 0 0 0 0 1740361 4291364 1727249
Thabo Mofutsanyane 0 0 0 0 0 0 0 11672116 11620490 13142008
Fezile Dabi 0 0 0 0 0 0 0 28954 33060 64536
Mangaung 0 0 0 0 0 0 0 1071803 842697 1771285
0
2000000
4000000
6000000
8000000
10000000
12000000
14000000
Val
ue
(Ran
d)
Years
Figure 17: Value of tomato exports by Free State Province

19
Figure 17 above shows that tomato exports from the Free State province were mainly from the Xhariep District Municipality. From 2007 to 2011, the province has recorded a zero trade. In 2012, Free State province exported tomatoes from Xhariep municipality for the first time in a ten year period. During 2013, Free State export value has significantly increased, in comparison to the 2012 export value and this can be assigned to an increase in tomato export to the neighbouring Lesotho which occurred in the same year. In 2014, Free State exported tomatoes through Thabo Mofutsanyane, Xhariep, Mangaung and Fezile Dabi district municipalities. However, Fezile Dabi export value was less significant. During 2015, Xhariep has continued to lead in Free State tomato export. Lejweleputswa export value has notably increase while Mangaung export value has dropped by 21% in comparison to 2014 export value. South Africa has exported 19.9% of tomato to the neighbouring Lesotho. Free State overall tomato export value has surged and tomatoes were exported through Xhariep, Lejweleputswa, Thabo Mofutsanyane, Fezile Dabi and Mangaung. The surge in Free State tomato export can be attributed to 19% increase in tomato quantity exported to the neighbouring Lesotho.
Source: Quantec Easydata
Figure 18 below illustrates that, North West recorded its first tomato export in 2010 through Bojanala district, but the export value was less significant. From 2006 to 2009 and in 2011 to 2013, the province has recorded a zero tomato trade. In 2014, North West has recorded a substantial increase in tomato export value through Ngaka Modiri Molema. During 2015, Bojanala district export value has surged and this can be attributed to 35.4% share of tomato exports destined to the neighbouring Botswana. Bojanala tomato export value has surged by 97%, Ngaka Modiri Molema export value has gone up by 51%, whereas Dr Ruth Segomotsi Mompati has registered a notable tomato export value for the first time in a ten year period. Tomato export to the neighbouring Botswana increased by 8% in terms of value between 2015 and 2016 period.
2007 2008 2009 2010 2011 2012 2013 2014 2015 2016
Bojanala 0 0 0 1420 0 0 0 1542 1108283 2179653
Ngaka Modiri Molema 0 0 0 0 0 0 0 325996 71253 107567
Dr Ruth Segomotsi Mompati 0 0 0 0 0 0 0 0 0 20561
Dr Kenneth Kaunda 0 0 0 0 0 0 0 771 1075 240
0
500000
1000000
1500000
2000000
2500000
Val
ue
(Ran
d)
Years
Figure 18: Value of tomato exports by North West province

20
2.4 Share analysis
Table 2 is an illustration of provincial shares towards national tomato exports. It shows that, Gauteng and Western Cape provinces have commanded the greatest share of tomato exports for the past ten years. This is in spite of the fact that Limpopo, Mpumalanga and the Eastern Cape provinces are the leading producers of tomatoes. As explained earlier, this means that the leading export provinces (Western Cape and Gauteng) derive their advantage from the fact that the registered exporters are based in their provinces and they also have exit points for tomato exports. The above scenario raises concerns about the availability of marketing infrastructure and agro-logistics in the major tomato producing provinces of South Africa. In 2011, Western Cape commanded 60.20% and Gauteng commanded 38.37% of the total South African tomato exports. During 2012, Western Cape export share dropped to 21.75% and at the same time, Gauteng export share has increased to 45.55%. Free State commanded 9.01% export share after eight years of recording zero trade. North West also commanded a 1% share of tomato exports for the first time in a ten year period. In 2013, Western Cape export share dropped further to 10.30% and Limpopo has also dropped its share, when compared to 2012 share. In the same year, Gauteng has slightly gained export share to 47.40%, and Free State, KwaZulu Natal and North West have also increased their export shares. During 2014, Gauteng tomato exports have notably dropped from 86.81% to 57.93% and Western Cape export share has gone up from 2.60% to 17.68%. At the same time Free State export value has notably increased from 2.86% to 16.14%. In 2015, Gauteng has continued to lead in South Africa provincial export share, however the export share has dropped slightly to 56.90% whilst Free State has recorded 16.14% share. In the same year, Western Cape export share has increased to 19.04%, North West and Limpopo has increased their export share however the export share were less significant. During 2016, Gauteng export share dropped slightly to 52.79%, Western Cape has commanded 18.77%, Mpumalanga has registered a 7.61% share, whilst Northern Cape and Eastern Cape have registered a trivial export shares. Table 2: Share of provincial tomato exports to the total RSA tomato exports (%)
Year Province
2007 2008 2009 2010 2011 2012 2013 2014
2015 2016
Western Cape 52.98 77.28 66.04 3.55 2.80 2.54 2.60 17.68 19.04 18.77 Eastern Cape 3.61 0 0 0 0 0 0.03 0.06 0.02 0.01 Northern Cape 0 0 0 0 0 0 0 0 0 0.02 Free State 0 0 0 0 0 0.68 2.86 16.13 16.14 15.31 KwaZulu-Natal 6.39 0.59 4.00 2.71 0.80 0.75 0.81 0.41 0.61 1.34 North West 0 0 0 0 0 0 0 0.33 1.01 1.88 Gauteng 36.91 22.13 28.65 92.70 96.41 94.05 86.81 57.93 56.90 52.79 Mpumalanga 0.11 0 0 0.03 0 1.56 6.80 6.59 4.57 7.61 Limpopo 0 0 1.32 1.01 0 0.42 0.08 0.87 1.71 2.27 RSA 100 100 100 100 100 100 100 100 100 100 Source: Calculated from Quantec Easydata
The following tables (Table 3 -8) show the share of provincial tomato exports to the total national tomato exports.

21
Table 3: Share of district tomato exports to total Western Cape provincial tomato exports (%)
Year District
2007 2008 2009 2010 2011 2012 2013 2014 2015 2016
City of Cape Town 99.81 100 99.92 98.68 98.35 98.71 97.46 99.22 93.87 98.00
Cape Winelands 0 0 0 0.72 0 0.01 0.65 0.54 5.33 0.05
Eden 0 0 0.08 0.60 1.65 1.28 1.88 0.24 0.81 0.54
West Coast 0.19 0 0 0 0 0 0 0 0 1.41
Western Cape 100 100 100 100 100 100 100 100 100 100 Source: Calculated from Quantec Easydata
Table 3 above shows that the City of Cape Town commanded the greatest share of tomato exports from Western Cape province during the period under review. Eden and Cape Winelands district’s contributions were less significant. High export share by City of Cape Town can be attributed to the Cape Town harbour which serves as an exit point. In 2008, City of Cape Town has commanded 100% share for Western Cape tomato export. In 2011 and 2012, the City of Cape Town continued to be a leading municipality in tomato exports from Western Cape. During 2012, Eden district tomato export share has dropped from 1.65% to 1.28%. During 2013, City of Cape Town slightly dropped its export share while the export share for Eden has increased, in comparison to 2012 export share. The city of Cape Town export share has gone up to 99.22% in 2014, whereas Cape Winelands and Eden export shares have decreased. In 2015, City of Cape Town export share has dropped slightly to 93.87% share, whereas Cape Winelands has increased from 0.54% to 5.33% share. During 2016, City of Cape Town has increased its export share to 98%, Cape Winelands and Eden have registered insignificant export shares. Table 4: Share of district tomato exports to the total Gauteng provincial tomato exports (%) Year
District
2007 2008 2009 2010 2011 2012 2013 2014 2015 2016
West Rand 0 0 0 0 0 0.01 0 2.16 2.90 1.63
Ekurhuleni 11.42 0.57 3.19 0.47 0.21 0.29 0.37 10.29 9.98 13.32
City of
Johannesburg 88.58 99.36 96.81 67.24 74.43 81.44 88.70 46.44 50.68 40.81
City of
Tshwane 0 0 0.01 32.29 25.36 18.26 10.92 41.11 36.43 44.24
Gauteng 100 100 100 100 100 100 100 100 100 100
Source: Calculated from Quantec Easydata
Table 4 above indicates that City of Johannesburg and Ekurhuleni municipalities commanded the greatest share of tomatoes exported from Gauteng province. During 2007, Ekurhuleni has registered 11.42% share of Gauteng tomato exports. In 2010, City of Tshwane commanded 32.29% share of tomatoes exported in Gauteng province, whereas City of Johannesburg export share has dropped from 98.81% to 67.24%. Export share for the City of Johannesburg has decreased during 2011, when compared to 2010. The City of Johannesburg export share has increased to 74.43% in 2011. During 2012, City of Johannesburg municipality commanded the

22
greatest share of 81.44% of the Gauteng tomato export share. At the same year export share for the City of City of Tshwane has dropped from 25.36% to 18.26%. During 2013, City of Johannesburg continued to increase its export share while the City of Tshwane export share continued to decline from 18.26% to 10.92%. In 2014, City of Tshwane export share has notably increased from 10.92% to 41.11%, whereas City of Johannesburg export share has notably dropped from 88.70% to 46.60% and Ekurhuleni Export share has gone up from 0.37% to 10.13%. City of Johannesburg has remained the main contributor to Gauteng tomato export share and in 2015, it has commanded 50.68% share while City of Tshwane export share has dropped to 36.43%. OR Tambo International Airport serves as an export exit point for exports from these municipalities. In 2016, City of Tshwane has commanded the greatest share of Gauteng tomato export share, City of Johannesburg export share has dropped to 40.81%, whereas Ekurhuleni export share increased to 13.32% share.

23
Table 5: Share of district tomato exports to total Kwa-Zulu Natal provincial tomato exports (%)
Year
District
2007 2008 2009 2010 2011 2012 2013 2014 2015 2016
Ugu 0 0 0 5.58 2.09 5.30 0 0 0.42 0
Uthukela 0 0 0 0 0 0 0 0 0 64.45
Umzinyathi 0 0 0 0 0 0 0 0 0 0.01
Zululand 0 0 0 0 0 0 0 0 2.40 4.19
Umkhanya
kude 0 0 0 0 0 0 0 0 0 0.17
Uthungulu 0 0 0 0 0 0 0 0 0.81 0
ILembe 0 0 0 0 0 0 0 0 2.18 0
EThekwini 100 100 100 94.42 97.91 94.70 100 100 94.20 31.18
KwaZulu Natal 100 100 100 100 100 100 100 100 100 100
Source: Calculated from Quantec Easydata
Table 5 above indicates that Ethekwini municipality commanded the greatest share of all tomato exports from KwaZulu Natal province during the ten year period. From 2007 to 2009, Ethekwini has commanded 100% share of KwaZulu Natal tomato export share. In 2010, UGu district has commanded 5.58% and Ethekwini export share has slightly dropped from 100% to 94.42% share of tomato exports from KwaZulu Natal. During 2012, Ethekwini export share has dropped slightly to 94.70%, while Ugu district export shares have increased from 2.09% to 5.30%. In 2013 and 2014, Ethekwini continued to lead in KwaZulu Natal export share and it has commanded 100% share from this province. Durban Harbour serves as an exit point for exports from this municipality. Ethekwini has commanded 94.20% of KwaZulu Natal tomato export share during 2015, while Zululand and ILembe has commanded 2.40% and 2.18% shares respectively. In 2016, Uthukela has commanded the greatest share of KwaZulu Natal export share, followed by Ethekwini and Zululand export share has gone up to 4.19%. Table 6: Share of district tomato exports to the total Limpopo provincial tomato exports (%)
Year District
2007 2008 2009 2010 2011 2012 2013 2014 2015 2016
Mopani 0 0 100 0 0 0 0 1.03 0.42 0.38 Vhembe 0 0 0 6.06 0 12.82 1.66 0 0 0 Capricorn 0 0 0 93.94 0 0.57 0 54.54 79.54 80.06 Waterberg 0 0 0 0 0 86.61 98.34 44.43 20.04 19.56 Limpopo 0 0 100 100 0 100 100 100 100 100 Source: Calculated from Quantec Easydata
Table 6 illustrates that in 2009, Vhembe commanded a 100% of all tomato exports in Limpopo province. From 2007 to 2008, there were no tomato exports from Limpopo province. In 2010 Capricorn district has commanded the greatest share of tomato exports from Limpopo province. During 2011, Limpopo province has recorded a zero trade in tomatoes. In 2012, Waterberg district commanded the greatest share of 86.61% and Vhembe district has recorded 12.82% of tomato export from Limpopo Province. In 2013, Vhembe export share has dropped from 12.82% to 1.66%

24
and this can be attributed to the drop in tomato export to the neighbouring Zimbabwe. At the same time Waterberg export share has notably increased, when compared to 2012 export share. In 2014, Capricorn has commanded the greatest share of 54.55% and Waterberg export share has gone down to 44.43% share. Capricorn district has dominated Limpopo provincial tomato exports by commanding 79.54% share in 2015, while Waterberg export share has decreased to 20.04% share. During 2016, Capricorn commanded the greatest share of 80.06%, followed by Waterberg with 19.56% and Mopani has registered an insignificant share. Table 7: Share of district tomato exports to total Mpumalanga provincial tomato exports (%)
Year District
2007 2008 2009 2010 2011 2012 2013 2014 2015 2016
Gert Sibande 0 0 0 0 0 0 0 0.52 6.46 1.53
Nkangala 0 0 0 0 0 0 0 0 0 9.03 Ehlanzeni 100 0 0 100 0 100 100 99.5 93.54 89.44
Mpumalanga 100 0 0 100 0 100 100 100 100 100 Source: Calculated from Quantec Easydata
Table 7 shows that Ehlanzeni district municipality commanded greatest share for all tomatoes exported in Mpumalanga during the period under review. In 2007, 2010, 2012 and 2013, Ehlanzeni has commanded 100% share of tomato exports recorded for Mpumalanga province. In 2008, 2009 and 2010, Mpumalanga province has recorded a zero tomato trade, while Nkangala export share was insignificant. In 2014, Ehlanzeni export share has slightly dropped to 99.5%, while Gert Sibande has commanded its first export share but the share was insignificant. Ehlanzeni has continued to lead in Mpumalanga tomato export share, however in 2015, the export share has declined slightly to 93.54% whereas Gert Sibande export share has increased to 6.46% in comparison to 2014 export share. Ehlanzeni export share dropped further to 89.44% during 2016, Nkangala has commanded a notable share of 9.03% whereas, Gert Sibande export share has dropped to 1.53%. Table 8: Share of district tomato exports to total Free State provincial tomato exports (%) Year District
2007 2008 2009 2010 2011 2012 2013 2014 2015 2016
Xhariep 0 0 0 0 0 100 100 11.47 10.61 11.00
Lejweleputswa 0 0 0 0 0 0 0 10.62 22.85 9.20
Thabo Mofutsanyane 0 0 0 0 0 0 0 71.20 61.87 70.01
Fezile Dabi 0 0 0 0 0 0 0 0.18 0.18 0.34
Mangaung 0 0 0 0 0 0 0 6.54 4.49 9.44
Free State 0 0 0 0 0 100 100 100 100 100 Source: Calculated from Quantec Easydata
Table 8 above illustrates that, from 2007 to 2011, there was no tomato exports recorded for the Free State province. In 2012 and 2013, Xhariep district municipality commanded a 100% share of tomato exports from Free State province. During 2014, Thabo Mofutsanyane has commanded the highest export share of 71.20%, Mangaung has recorded 17.15% and Xhariep has commanded 11.47% share of Free State provincial tomato export share. In 2015, Thabo Mofutsanyane tomato export share has notably dropped to 61.87% whilst Lejweleputswa export share has gone up to

25
22.85%. Thabo Mofutsanyane tomato export share rose to 70.01%, Mangaung export share increased to 9.44% while Lejweleputswa export share has notably dropped to 9.20%.
2.5 Tomato imports by South Africa
Figure 18 below shows that, South Africa is self-sufficient in tomato production. From 2007 to 2009, there were comparatively low levels of tomato imports. In 2016, South Africa’s tomato imports represented 0% of world imports and its ranking was 100. South Africa has gained its competitiveness as in 2015, it was ranked number 93 in the world importers. During 2016, Namibia has supplied 94.5% of South Africa tomato import and 4.4% of tomatoes were sourced from Swaziland. Globally, the United States America with 27.7% share, Germany with 15.2%, France with 7.4%, United Kingdom with 7.1% and Russian Federation with 5.7% were top countries importing tomatoes during 2016. Figure 18 below illustrates South Africa’s tomato imports. Figure 18 below shows that in 2007, South Africa’s tomato imports were record low in 10 year period, despite the lowest production output in the same year. In 2009, tomato import volumes were incomparably higher when compared to the previous year imports, despite high domestic production in the same year. This can be attributed to cheaper tomato import in the same year. In 2011, the import volume grew by 172% when compared to 2010 imports. During 2012, tomato import has slightly gone up by 1% despite a 9% increase in domestic tomato production. It was also more expensive to import tomatoes from 2006 to 2008, 2010 and 2014, when compared to the other years, since low volumes were imported at high values. In 2013, tomato import has increased by 6.2%, in comparison to 2012 import volumes, and this can be ascribed to the 5.1% decline in the domestic production output in the same year. Tomato import increased slightly by 2.2% during 2014, and this can be attested to 8% drop in domestic production output. In 2015, South African tomato imports have dropped by 8.3% in comparison to 2014 import volume, despite 8.5% decrease in the domestic production output. It was also cheaper to import tomatoes when compared to the 2014 import value. During 2016, South Africa imported 36% more tomatoes, in comparison to 2015 tomato import, despite 4% increase in domestic production. In the same year, it was cheaper to import tomatoes, when compared to 2015 imports values.

26
Source: Quantec Easydata Figure 19 below illustrates South Africa’s tomato imports from the regions from 2007 to 2016 period.
Source: Quantec Easydata
Figure 19 above illustrates South Africa’s tomato imports from the various regions in a period of 10 years. From 2008, South Africa imported tomatoes from the African region and Americas region, but the volumes from Americas were insignificant. During 2009, South Africa’s tomato imports were sourced from African region. In 2010, African region was still the main source of South African tomato imports followed by European region. During 2011, to 2014 South Africa’s tomato import
0
1000000
2000000
3000000
4000000
5000000
6000000
7000000
8000000
9000000
0
1000
2000
3000
4000
5000
6000
2007 2008 2009 2010 2011 2012 2013 2014 2015 2016
Ran
d
Ton
s
Figure 18: South Africa's tomato imports
Volume (tons) Value (Rand)
2007 2008 2009 2010 2011 2012 2013 2014 2015 2016
Africa 34 4317 158545 1435673 3923321 3956471 4163573 4386786 4007465 5469176
Americas 0 83 0 0 0 0 0 0 0 0
Asia 0 0 0 0 40 0 513 0 0 0
Europe 0 0 13 21968 54195 5477 0 0 0 201
Not allocated 0 0 0 0 819 57670 104896 700 16800 22000
0
1000000
2000000
3000000
4000000
5000000
6000000
Vo
lum
e (K
g)
Years
Figure 19: South Africa's tomato imports from the regions

27
increased steadily and they were mainly sourced from African region. In 2011, imports from Europe region have notably increased, whereas imports from Asia were insignificant. During 2013, South African tomato imports were sourced from Asia regions and a notable volume of tomatoes were recorded as unallocated. In 2015, Africa region is still the main supplier of South Africa’s tomato import. Namibia has supplied 89.6% of South Africa’s tomato imports, while Namibia has supplied 8.8%. At the same time, there was a notable increase on unallocated imports. Africa region remained the primary supplier of tomato imported by South Africa during 2016, tomato imports from Europe was insignificant while the unallocated tomato imports grew by 31% ,when compared to 2015 imports.
Figure 20 below illustrates South Africa tomato import values from the various regions from 2007 to 2016 period.
Source: Quantec Easydata
During 2009 and 2010, it was less expensive to import from African region since low values were recorded for high volume imported. It was also expensive to import tomatoes from Americas region during 2008. In 2010 and 2011, it was expensive for South Africa to import tomatoes from European region. During 2012, it was more expensive to import tomatoes from Europe when compared to 2011 imports from this region. In 2013, it was by far still cheaper to import tomatoes from the African region in comparison to the import from Asia. During 2014, it was expensive to import tomatoes from African region when compared to 2013. During 2015, it was cheaper to import tomatoes from Africa region when compared to 2014 imports from the same region. In 2016, it was more cheaper to import tomatoes from Africa region, in comparison to tomato imports sourced from Europe. Figure 21 below shows South Africa’s provincial tomato imports from 2007 to 2016. Gauteng followed by KwaZulu Natal was the main provinces used to import tomatoes into South Africa. Gauteng province has recorded high import value during 2009. In 2010 and 2011, Gauteng and KwaZulu Natal import values have notably increased and in 2012 the import values for both
2007 2008 2009 2010 2011 2012 2013 2014 2015 2016
Africa 73 8036 154733 3002191 5831735 5248772 6066577 7849628 6843854 6642757
Americas 0 1152 0 0 0 0 0 0 0 0
Asia 0 0 0 0 40 0 3729 0 0 0
Europe 0 0 351 108415 289673 61681 0 30 0 6561
Not allocated 0 0 0 0 5920 43800 139148 1575 107200 20900
0100000020000003000000400000050000006000000700000080000009000000
Val
ue
( R
and
)
Years
Figure 20: Value of tomato imports by South Africa

28
provinces have dropped. Highest import value was recorded for Gauteng province during 2013. In 2014, Gauteng import value has drastically dropped, while Western Cape, Northern Cape and Mpumalanga import values have notably increased when compared to the previous years. Western Cape was the primary entry point for South Africa tomato imports and the import value has sharply increased by 53% during 2015, while Gauteng and Mpumalanga import values have dropped by 50% and 79% respectively. In 2016, Western Cape was still the main entry point of South Africa’s tomato imports, whilst Gauteng and Mpumalanga import values have dropped by 46.7% and 65% respectively.
Source: Quantec Easydata
2.6 Processing
Processing of tomatoes consists of canning, freezing, dehydration and juice production. Tomatoes are processed into tomato sauce, whole pealed, tomato and onion bruises, paste, shredded, puree and paste concentrate. The industry experienced an increase in growth mainly from canning. In the 2015 production season, 122 998 tons of tomatoes were canned (see Table 9 below). That represents a 41% increment from the 72 263 tons canned in 2014. During the same year, there was a significant increase in volume and value in tomato freezing. This can be attributed to increasing consumer demand of convenient ready to eat vegetables. In 2010, there were no volumes recorded for freezing activities. During 2012, there were no volumes recorded for juice and in the same year, 56 tons were recorded for freezing activities. During 2013, there was a 48% drop in tomato volumes recorded for freezing activities. At the same time, total processing accounted for 17.9% and 5% of the tomato’s total volume and value respectively. In 2014, total processed has accounted for 15% of total production volume and 4.3% of total tomato gross value. During 2015, the total volume that was processed has accounted for 28.7% of total production output. In 2016, canning activities increased by 5.5%, while 7 582 tons were processed into juice and total processed volume has accounted for 23.7% of the total tomato production.
2007 2008 2009 2010 2011 2012 2013 2014 2015 2016
Western Cape 0 0 351 0 0 0 0 408443862649186332782
Northern Cape 0 0 0 0 0 0 0 1921396 0 0
KwaZulu-Natal 0 0 0 108415 289673 60811 0 0 0 0
Gauteng 73 9188 154733 30021915837695529344262094541070936 534496 284936
Mpumalanga 0 0 0 0 0 0 0 730904 151640 52500
0
1000000
2000000
3000000
4000000
5000000
6000000
7000000
Val
ue
(Ran
d)
Year
Figure 21: South Africa's tomato provincial imports

29
Table 9: Processed tomatoes
Year
Canning Juices Freezing Total processing
Volume Value Volume Value Volume Value Volume Value
(Ton) (Rand) (Ton) (Rand) (Ton) (Rand) (Ton) (Rand)
2007 99 445 61 098 928 0 0 0.4 195 99 445 61 099 123
2008 144 524 103 058 063 0 0 53 53691 144 578 103 111 753
2009 135 782 150 828 518 0 0 110 412 54446 135 892 151 241 064
2010 124 384 128 242 634 0 0 0 0 124 384 128 242 634
2011 86 853 78 067 003 6 6 442 134 174 249 86 994 78 247 694
2012 111 845 109 083 075 0 0 56 97 198 111 902 109 180 273
2013 94 270 94 355 487 0 0 29 52 280 94 299 94 407 767
2014 72 263 90 624 230 0 0 427 945 696 72 690 91 570 199
2015 122 998 166 306 830 0 0 178 1 305 784 123 177 167 612 614
2016 129 844 R190338605 7 582 10195624 275 1622815 137 701 R202 157 044
Source: Statistics and Economic Analysis, DAFF
3. MARKET INTELIGENCE
3.1 Competitiveness of South African tomato exports
Competitiveness is described as an industry’s capacity to create superior value for its customers and improved profits for the stakeholders in the value chain. The driving force in sustaining a competitive position is productivity that is output efficiency in relation to specific inputs with regard to human, capital and natural resources. In 2016, South African tomato exports represent 0.1% of world exports and its ranking on the world exports were number 40. South Africa competitiveness has not change despite an increase in quantity exported. As depicted in Figure 22 below, South African tomato exports are growing faster than the world imports into Mauritius and Malawi. South Africa’s performance in this country is regarded as a gain in the dynamic market. South Africa tomato exports to Seychelles, Botswana and Angola are growing slower than the world imports into these countries and South Africa’s performance is regarded as a loss in dynamic markets. South Africa tomato exports are growing while world imports are declining into Zimbabwe. South Africa tomato exports are declining while world imports are growing into Democratic Republic of Congo, Lesotho, Mozambique , Saint Helena, Swaziland, Namibia, and Lesotho. Figure 23 below, illustrates prospects for market diversification by South African exporters of tomatoes. Botswana holds a bigger market share of South African tomato exports with 34.8% share of exports. South Africa has exported 20% of tomatoes to Lesotho and Mozambique has received 17.8% of the exports. In terms of market size, United States of America (USA), Germany,

30
France, United Kingdom (UK), Canada and Russian Federation are still the leading markets/importers of tomatoes. Whilst six countries dominate world tomato imports, it is interesting to note that countries like Uganda has experienced higher annual growth rate in value from 2012– 2016. Uganda experienced an annual growth rate of 79% and Tanzania has experienced an annual growth of 69% annual growth rate. Seychelles has experienced 34% annual growth between 2012 and 2016. These countries represent possible lucrative markets for South African tomato producers. South Africa’s regular trading partner (Lesotho and Swaziland) have experienced negative annual growth between 2012 and 2016.

31
Figure 22: Growth in demand for tomatoes exported by South Africa in 2016
Source: International Trade Map (ITC)

32
Figure 23: Prospects for market diversification for tomatoes exported by South Africa in 2016
Source: International Trade Map (ITC)

33
4. MARKET ACCESS
Barriers to trade can be divided into tariff barriers (including quotas, ad valorem tariffs, specific tariffs and entry price systems) and non-tariff barriers (sanitary and phytosanitary measures, labels, etc.). The main markets for vegetables (including tomatoes) employ various measures, both tariff and non-tariff to protect the domestic industries. Whilst many of the non-tariff measures can be justified under the auspices of issues such as health and standards, the tariff measures are increasingly under the scrutiny of the World Trade Organization (WTO), and as such are gradually being phased out. Nevertheless, exporters need to be aware of all the barriers that they may encounter when trying to get their produce on foreign shelves.
4.1 Tariff, quotas and the price entry system
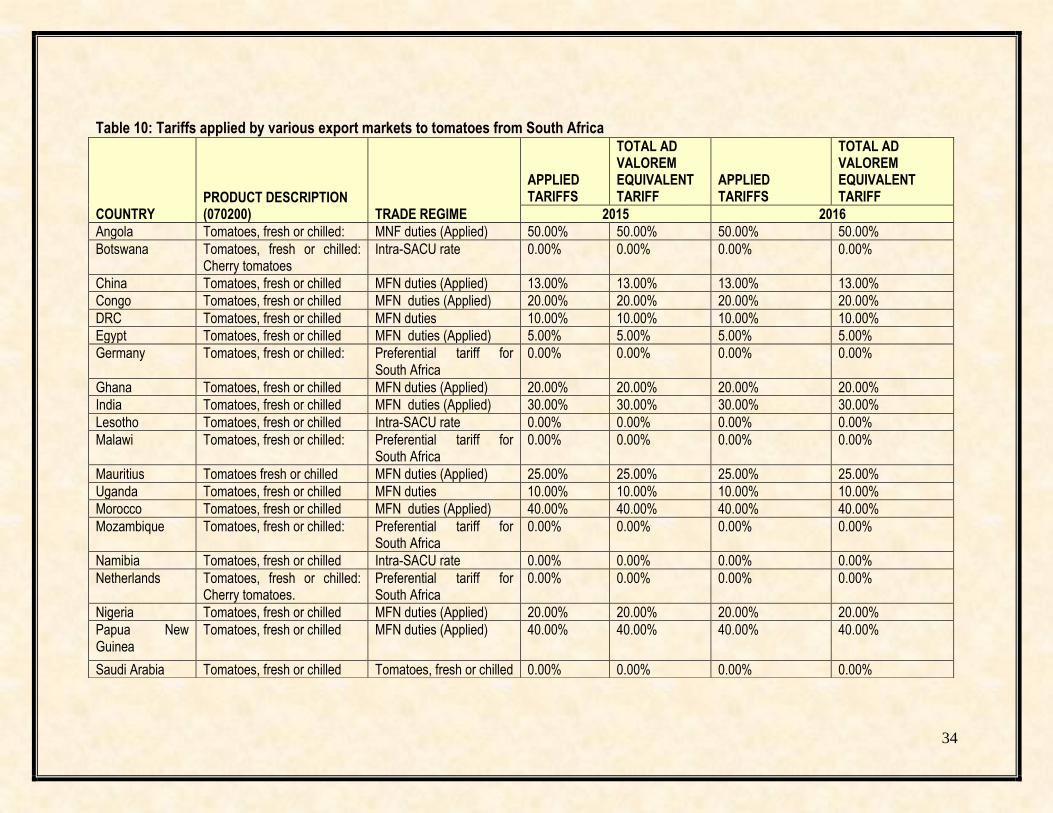
Tariffs are either designed to earn government revenue from products being imported or to raise the price of imports so as to render local produce more competitive and protect domestic industries. Quotas can be used to protect domestic industries from excessive imports originating from areas with some form of competitive advantage (which can therefore produce lower cost produce). Tariffs and quotas are often combined, allowing the imports to enter at a certain tariff rate up to a specified quantity. Thereafter, imports from that particular region will attract higher tariffs, or will not be allowed at all. The entry price system, which is used in many northern hemisphere markets, makes use of multiple tariff rates during different periods when domestic producers are trying to sell their produce, and lower the tariffs during their off-season. Alternatively, the tariff rate can be a function of a market price – if the produce enters at a price which is too low (and therefore likely to be too competitive), it qualifies for a higher tariff schedule. Whilst tariff regulations can be prohibitive and result in inferior market access, it is often the non-tariff barriers that restrict countries like South Africa from successfully entering the large developed markets. Many of these barriers revolve around different types of standards, including sanitary and phytosanitary standards (SPS), food health and safety issues, food labelling and packaging, organic produce certification, quality assurance and other standards and grades. Tariffs applied by the various markets to tomatoes originating from South Africa during 2015 and 2016 are shown in Table 10 below.
34
Table 10: Tariffs applied by various export markets to tomatoes from South Africa
COUNTRY PRODUCT DESCRIPTION (070200) TRADE REGIME
APPLIED TARIFFS
TOTAL AD VALOREM EQUIVALENT TARIFF
APPLIED TARIFFS
TOTAL AD VALOREM EQUIVALENT TARIFF
2015 2016
Angola Tomatoes, fresh or chilled: MNF duties (Applied) 50.00% 50.00% 50.00% 50.00%
Botswana Tomatoes, fresh or chilled: Cherry tomatoes
Intra-SACU rate 0.00% 0.00% 0.00% 0.00%
China Tomatoes, fresh or chilled MFN duties (Applied) 13.00% 13.00% 13.00% 13.00%
Congo Tomatoes, fresh or chilled MFN duties (Applied) 20.00% 20.00% 20.00% 20.00%
DRC Tomatoes, fresh or chilled MFN duties 10.00% 10.00% 10.00% 10.00%
Egypt Tomatoes, fresh or chilled MFN duties (Applied) 5.00% 5.00% 5.00% 5.00%
Germany Tomatoes, fresh or chilled: Preferential tariff for South Africa
0.00% 0.00% 0.00% 0.00%
Ghana Tomatoes, fresh or chilled MFN duties (Applied) 20.00% 20.00% 20.00% 20.00%
India Tomatoes, fresh or chilled MFN duties (Applied) 30.00% 30.00% 30.00% 30.00%
Lesotho Tomatoes, fresh or chilled Intra-SACU rate 0.00% 0.00% 0.00% 0.00%
Malawi Tomatoes, fresh or chilled: Preferential tariff for South Africa
0.00% 0.00% 0.00% 0.00%
Mauritius Tomatoes fresh or chilled MFN duties (Applied) 25.00% 25.00% 25.00% 25.00%
Uganda Tomatoes, fresh or chilled MFN duties 10.00% 10.00% 10.00% 10.00%
Morocco Tomatoes, fresh or chilled MFN duties (Applied) 40.00% 40.00% 40.00% 40.00%
Mozambique Tomatoes, fresh or chilled: Preferential tariff for South Africa
0.00% 0.00%
0.00% 0.00%
Namibia Tomatoes, fresh or chilled Intra-SACU rate 0.00% 0.00% 0.00% 0.00%
Netherlands
Tomatoes, fresh or chilled: Cherry tomatoes.
Preferential tariff for South Africa
0.00% 0.00% 0.00% 0.00%
Nigeria Tomatoes, fresh or chilled MFN duties (Applied) 20.00% 20.00% 20.00% 20.00%
Papua New Guinea
Tomatoes, fresh or chilled MFN duties (Applied) 40.00% 40.00% 40.00% 40.00%
Saudi Arabia Tomatoes, fresh or chilled Tomatoes, fresh or chilled 0.00% 0.00% 0.00% 0.00%

35
Source: Market Access Map
During 2016, Botswana, Lesotho, Mozambique and, Namibia were still the primary export market for tomato originating from South Africa. Botswana. Namibia and Lesotho apply 0% Intra-SACU tariff and Mozambique has reduce its 15% tariff to 0% preferential tariff tomato exported from South Africa .South Africa also exported to Angola, Zambia, Nigeria, Malawi and United States of America. Angola market is highly protected by 50% tariff despite SADC-Free Trade Agreement (FTA). Zambia and Malawi apply 0% preferential tariff to tomato originating from South Africa. Morocco is ranked number four in the world tomato exporters and its domestic market is highly protected by a tariff of 40%. Zimbabwe has reduced its tariff from 40% to 0% preferential tariff for tomatoes originating from South Africa. Lucrative export markets for tomatoes from South Africa are the EU countries (Germany, Netherlands, and United Kingdom) since they apply a preferential tariff of 0% to tomato imports originating from South Africa due to EU-SA Free Trade Agreement (FTA). Furthermore, South Africa has access to the US market under the AGOA, with 0% for South African tomatoes. In reality, the tariffs are likely to be far lower for South Africa when considering the preferential agreements, but at the same time, most tariff structures are particularly complex, with quotas, seasonal tariffs and specific tariffs (an amount per unit rather than a percentage of value) all contributing to many different tariff lines and often higher duties payable than one might have anticipated initially. One must also bear in mind that most tariffs are designed to protect domestic industries, and as such are likely to discriminate against those attempting to compete with the domestic producers of that country. China and India are the largest producer of tomatoes in the world and their producers are still protected by 13% and 30% tariff.
Seychelles Tomatoes, fresh or chilled: General tariff 15.00% 15.00% 15.00% 15.00%
Spain Tomatoes, fresh or chilled: Preferential tariff for South Africa
0.00% 0.00% 0.00% 0.00%
Swaziland Tomatoes, fresh or chilled Intra-SACU rate 0.00% 0.00% 0.00% 0.00%
United Arab Emirates
Tomatoes, fresh or chilled MFN duties 0.00% 0.00% 0.00% 0.00%
United Kingdom Tomatoes, fresh or chilled: Preferential tariff for South Africa
0.00% 0.00% 0.00% 0.00%
USA Tomatoes, fresh or chilled Preferential tariff for AGOA countries
0.00% 0.00% 0.00% 0.00%
Zambia Tomatoes, fresh or chilled: Preferential tariff for South Africa
0.00% 0.00% 0.00% 0.00%
Zimbabwe Tomatoes, fresh or chilled: Preferential tariff for South Africa
0.00% 0.00% 0.00% 0.00%

36
5. DISTRIBUTION CHANNELS
There are roughly three distinct sales channels for exporting vegetables. One can sell directly to an importer with or without the assistance of an agent. One can supply vegetables combined, which will then contract out importers/marketers and try to take advantage of economies of scale and increased bargaining power. At the same time combined vegetables might also supply large retail chains. One can also be a member of a private or cooperative export organization which will find agents or importers and market the produce collectively. Similar to combined vegetables, an export organization can either supply wholesale market or retail chains, depending on particular circumstances. Export organizations will wash, sort and package the produce. They will also market the goods under their own name or on behalf of the member, which includes taking care of labelling, bar-coding, etc. Most of the time, export organizations will enter into a collective agreements with freight forwarders, negotiating better prices and services (more regular transport, lower peak season prices, etc.). Some countries have institutions that handle all the produce (membership compulsory) and sell only to a restricted number of selected importers. Agents will establish contacts between producers/export organizations and buyers in the importing country, and will usually take between 2% and 3% commission. In contrast, an importer will buy and sell in his/her own capacity, assuming the full risk (unless on consignment). They will also be responsible for clearing the produce through customs, packaging and assuring label/quality compliance and distribution of the produce. Their margins lie between 5% and 10%. The contract importers of fruit combines market and distribute the produce of the combines, clear it through customs and in some cases treat and package it. Only few exporters have long term contracts with wholesale grocers who deliver directly to retail shops, but with the increasing importance of standards (EUREGAP, etc.) and the year round availability of fruit, the planning of long term contractual relationship is expected to increase.
6. LOGISTICS
6.1 Mode of transport
The transport of vegetables falls into two categories namely ocean cargo and air cargo. Ocean cargo takes much longer to reach the desired location, but costing considerably less. The choice of transportation method depends, for most parts on the fragility of the produce and how long it can remain relatively fresh. With the advent of technology and container improvements, the feasibility, cost and attractiveness of sea transport have improved considerably. With the increased exports by South Africa, the number and the regularity of maritime routes have increased. These economies of scale could benefit South Africa if more producers were to become exporters and take advantage of the various ports which have special capabilities in handling fruit and vegetable produce.

37
6.2 Cold chain management
Cold chain management is crucial when handling perishable products, from the initial packing houses to the refrigerated container trucks that transport the produce to the shipping terminals, through to the storage facilities at these terminals, onto actual shipping vessels and containers, and finally on to the importers and distributors that must clear the produce and transport it to the markets/retail outlets. For every 10 Degree Celsius increase above the recommended temperature, the rate of respiration and ripening of produce can increase twice or even thrice. Related to this are increasing important traceability standards which require an efficient controlled supply chain and internationally accepted business standards.
6.3 Packaging
Packaging can also play an important role in ensuring safe and efficient transport of a product and conforming to handling requirements, uniformity recyclable material specifications, phytosanitary requirements, proper storage needs and even attractiveness for marketing purposes.
7. SIMPLIFIED TOMATO FOOD VALUE CHAIN
The simplified tomato food value chain diagram (see Figure 24) is referred to as a simplified model because numerous interconnections were omitted and the size, levels of control and importance of each of the links and flows could not possibly be shown in a single diagram. Also of note is that horticultural produce value chains have a similar structure. The following discussion will focus on the main segments of the tomato value chain i.e. wholesale, wholesale-retail, retail, processing and intermediaries.

38
Figure 24: Simplified tomato food value chain
39
7.1 Wholesalers
FPMs are the dominant player and form of wholesaling in the South African tomato and fresh fruit and vegetable (FFV) sector. However other wholesale forms do exist including independent wholesalers, contract buyers, supermarket wholesaling subsidiaries, as well as farmer sales direct to retailers and to consumers. Being the largest wholesalers, the FPMs have emerged as the FFV price-setters or, as nicknamed, the "fresh produce stock exchange. The prices at the FPMs are arrived at through a bargaining process mediated by market agents who have a dual objective to collect the best prices (and hence commission) for sales while ensuring that the highly perishable stocks are cleared. These prices are then used as reference prices even in private transactions outside the FPMs. In the wholesale environment tomatoes are typically sold in bulk with a minimum of 10kg cartons and because price is negotiable, high volume buyers generally secure better deals than their small-scale counterparts.
7.2 Wholesale-retailers
These businesses operate in the niche between wholesaler and retailer format stores and are classified as wholesale-retailers because their clientele include both final consumers and smaller retailers and food outlets (e.g. restaurants and caterers). Wholesale-retailing is relatively new in FFV with examples including the Fruit and Veg City chain (established in 1993), Evergreens in Pretoria (since 1994) and FPM satellite markets. Being one of the top FFV lines, tomatoes form a major part of wholesale-retailers’ businesses and are sold in a variety of packages from bulk packs to loose singles. Tomato sales here are at predetermined prices.
7.3 Retailers
South African tomato retailers exist in both the formal and informal sectors. In the former this includes formally registered retail chains, supermarkets and neighbourhood stores. The latter covers tuck shops (sphaza), and hawkers. In this environments tomato sales are at predetermined prices and typically individually or in small packages.
7.4 Processors
As explained in 2.6, processing of tomatoes consists of canning, freezing, dehydration and juice. Tomatoes are processed into whole pealed, tomato and onion bruises, pasta, shredded, puree and pasta concentrate. The leading players in the tomato processing industry are Tiger Brands, Nestle and Giants Canning. There is also a set of further processors not captured in the group above. These entities use tomatoes (and tomato products) in food preparations. This includes caterers, hospitality and other institutions such as corporate, government institutions like hospitals, prisons, etc.

40
7.5 Intermediaries
Intermediaries occur throughout the tomato value chain and perform the important function of facilitating transactions. Prominent examples include export agents, van buyers, contract buyers and market agents. The common element in these businesses is that for a fee, they enable other market players such as farmers or restaurateurs to focus on their core functions (tomato production and food preparation in this case) rather than on the often complex processes of exchange or international trade.
8. STRATEGIC CHALLENGES
With the opening up of markets, tomatoes like all other commodities are influenced by international factors such as:
Competing against subsidized products from the developed countries; The strengthening of the Rand against other major trading currencies like the Euro and the
US dollar; and Poor climatic conditions over many tomato producing areas.
9. TRANSFORMATION
In Limpopo province, tomato farmers with the assistance of provincial department of agriculture have organized themselves successfully into Limpopo Tomato Growers Association (LTGA). LTGA is a business association committed in transforming small holder farmers to commercial producers for creation of wealth, employment and ownership of the industry. LTGA facilitates the growth and development of its members through unique training, mentorship programmes, access to finance, access to markets and business exposure.
10. RECENT DEVELOPMET IN THE TOMATO INDUSTRY
A Dusts-All Joy tomato processing plant was launch during 2016 in Greater Letaba municipality district. The factory is expected to assist in addressing the increased demand of tomato paste in South Africa while ensuring business for farmers. The factory intends to source 15 000 tons of tomatoes, but it has a capacity to receive 30 000 tons. Farmers have welcomed the processing plant as it has created a huge market for the tomatoes. Farmers can also increase their area of production, thereby creating more jobs
In a first for South Africa, ZZ2 and Rugani Juice have launched the country’s first and only fresh produced tomato juice made from tomatoes that are grown in line with ZZ2’s strict Nature Farming health philosophy. The ZZ2 100% Romanita Tomato Juice is made from fresh tomatoes that go directly from the fields into convenient juice boxes, available in ready to drink 330ml or family sized 750ml sizes. The ZZ2 100% Romanita Tomato Juice is not made from concentrate and is made hours from picking. The ZZ2 100% Romanita Tomato Juice provides health conscious consumers with bio-availability of carotenoids and lycopene, both anti cancer agents. The juice is available all year round and no sugars or taste-enhancers are added.
41
10. ACKNOWLEDGEMENTS
10.1 The following industries are acknowledged 10.1.1 Tomato Producers’ Organization
Inkwazi Building Block A Embankment Street 1249, Zwatkop X7 Tel (014) 717 1194
10.1.2 Directorate: Statistics and Economic Analysis
National Department of Agriculture, Forestry and Fisheries Private X 246 Pretoria 0001 Tel (012) 319 84 54 Fax (012) 319 8031
10.1.3 Limpopo Tomato Growers Association (LTGA) Chairperson: Mr. Walter Moketla Tel (015) 305 3261 Fax: 015 305 3177 Cell No: 083 770 7878 Email: [email protected] 10.1.4 ZZ2
P.O. Box 19 Mooketsi 0825 Tel (015) 395 2040 www.zz2.co.za
10.1.4 International Trade Centre
www.trademap.org 10.1.5 Quantec Easy Data
www.easydata.co.za 10.2 TOMATO PROCESSORS 10.2.1 Tiger Food Brand Limited
P.O Box 78056 Sandton Tel (011) 840 4000 Fax (011) 514 0460

42
10.2.2 Giants Canning P.O Box 86406 City Deep 2049 Tel (011) 623 2929 Fax (011) 623 2986 10.2.3 Ashton Canning Company (Pty) Ltd Private Bag x 3 Ashton 6715 Tel (023) 615 1140 Fax (023) 615 1992 Disclaimer: This document and its contents have been compiled by the Department of Agriculture, Forestry and Fisheries for the purpose of detailing tomato industry. Anyone who uses this information does so at his/her own risk. The views expressed in this document are those of the Department of Agriculture, Forestry and Fisheries with regard to agricultural industry, unless otherwise stated. The Department of Agriculture, Forestry and Fisheries therefore, accepts no liability that can be incurred resulting from the use of this information.