Embed Size (px)
Citation preview
The Pennsylvania State University
The Graduate School
Department of Mechanical Engineering
A PLATFORM-BASED METHODOLOGY FOR THE REDESIGN OF LOW
VOLUME HIGHLY CUSTOMIZED PRODUCTS
A Thesis in
Mechanical Engineering
by
Ronald Scott Farrell
© 2007 Ronald Scott Farrell
Submitted in Partial Fulfillment of the Requirements
for the Degree of
Doctor of Philosophy
August 2007
The thesis of Ronald Scott Farrell was reviewed and approved* by the following:
Timothy W. Simpson Professor of Mechanical and Industrial Engineering Thesis Advisor Chair of Committee
Mary I. Frecker Professor of Mechanical Engineering
Russell R. Barton Professor of Supply Chain and Information Systems
Martin W. Trethewey Professor of Mechanical Engineering
Karen Thole Professor of Mechanical Engineering Head, Department of Mechanical and Nuclear Engineering
*Signatures are on file in the Graduate School

iii
ABSTRACT
The new paradigm of mass customization has emerged in industry and is
transforming markets by making product variety affordable with the ultimate goal of
achieving mass production costs of individually customized goods and services.
Achieving this goal requires a methodology for providing product variety without losing
the commonality of parts needed to maintain the economies of scale inherent in mass
production. In addition to the use of modularity, an emerging complementary approach
is to develop a product platform consisting of common components and processes from
which a family of variant products is generated. Although product platforms have
successfully improved economies of scale and scope for large companies, it is
questionable whether similar success can be achieved within small companies that
produce highly customized products at low volume, and the focus of this research is to
develop a product platform and design methodology for low volume, highly customized
products. An additional focus is to determine if the ubiquitous World Wide Web can
facilitate customization and improve the marketing of such products.
The dissertation presents a methodology that addresses research embodied by
three fundamental questions: (1) in what ways can platform-based product development
benefit small companies who produce highly customized products at low volumes?, (2)
how should product platform design differ from current methods for such products, and
what factors are important for defining the best platform design strategy?, and (3) how
can the World Wide Web be used to facilitate customized product design for low volume
products? The methodology addresses these questions by building upon existing research

iv
regarding product platform portfolio design utilizing so called bottom-up platform design
techniques. A detailed methodology is presented for transforming an existing product
line of low volume highly customized product into a virtual product platform portfolio
through targeted component redesign. In addition, an algorithm is presented for
implementing a virtual product platform portfolio through a web-based interface that
allows the early incorporation of custom design requirements into the design process and
includes strategies for designing custom features on demand through an engineer-to-order
approach. Implementing a virtual product platform portfolio improves the specification
of low volume highly customized product as it avoids the premature ordering of
inventory yet allows for quick response to custom requests.
The design of yokes for mounting motor actuators on valves for use in the nuclear
power industry is used as the example throughout the research. This example is highly
representative of the type of product that is the focus of the methodology. The example
is presented in detail such that all aspects of the methodology are demonstrated.

v
TABLE OF CONTENTS
LIST OF FIGURES .....................................................................................................viii
LIST OF TABLES.......................................................................................................x
ACKNOWLEDGEMENTS.........................................................................................xii
Chapter 1 Introduction ................................................................................................1
1.1 The Benefits of Mass Customization and Product Families...........................3 1.2 Product Family Approaches and Examples ....................................................6 1.3 Research Objectives........................................................................................7 1.4 Overview of Dissertation................................................................................10
Chapter 2 Literature Review.......................................................................................14
2.1 Modular Product Architecture ........................................................................14 2.2 Product Platform Design.................................................................................19 2.3 Commonality, Variety, and Other metrics......................................................21 2.4 PPCEM and the Compromise Decision Support Problem .............................23 2.5 Product Platform Portfolio Optimization........................................................27 2.6 Collaborative Design Using the World Wide Web ........................................29 2.7 Chapter Summary ...........................................................................................30
Chapter 3 Bottom-Up Product Platform Design Methodology ..................................31
3.1 Component Product Platform Development...................................................32 3.1.1 Existing Knowledge, Databases, and Methodology.............................34 3.1.2 The Baseline Standard..........................................................................37 3.1.3 Component Class Development ...........................................................39
3.2 Valve Yoke Component Design Example......................................................41 3.2.1 Valve Fundamentals .............................................................................41 3.2.2 The Targeted Market Segmentation Grid.............................................45 3.2.3 The Yoke Leg Targeted Component ....................................................47 3.2.4 The Baseline Standard..........................................................................49 3.2.5 New Performance Functions ................................................................53 3.2.6 Baseline Standard Redesign Strategy...................................................54 3.2.7 Yoke Leg Cross-Section Optimization.................................................57
3.3 Chapter Summary ...........................................................................................63
Chapter 4 Component-Based Product Platform Portfolio Optimization ....................66
4.1 The Four-Step Process....................................................................................68 4.1.1 Step1 .....................................................................................................69
vi
4.1.2 Step 2 ....................................................................................................70 4.1.3 Step 3 ....................................................................................................73 4.1.4 Step 4 ....................................................................................................75
4.2 Maximum Commonality Component Product Platform Portfolio Example ..75 4.2.1 Step 1: Determine Optimal Yoke Leg Cross-Sections .........................76 4.2.2 Step 2, Feasibility Testing ....................................................................77 4.2.3 Step 3: Optimization Problem Formulation .........................................80 4.2.4 Step 4: Solving the Optimization Problem...........................................81
4.3 Minimum Cost Component Product Platform Portfolio Example .................85 4.3.1 ABC for Low Volume Highly Customized Product ............................86 4.3.2 Flange Interface Design........................................................................93 4.3.3 Module and Stretched Strategy Product Platform Portfolios ...............97
4.4 Chapter Summary ...........................................................................................107
Chapter 5 Web-Based Product Platform Portfolio Implementation ...........................110
5.1 The Web-Based Interface Algorithm..............................................................112 5.1.1 The Compromise Engineer-to-Order Strategy .....................................116 5.1.2 The Customize Engineer-to-Order Strategy.........................................118
5.2 The Web-Based Valve Virtual Product Line..................................................120 5.2.1 The Compromise Input Strategy ..........................................................125 5.2.2 The Reinforcement Rib Sizing Customization Strategy ......................130
5.3 Chapter Summary ...........................................................................................135
Chapter 6 Conclusion and Future Work .....................................................................137
6.1 Dissertation Summary ....................................................................................137 6.1.1 Bottom-Up Platform Design Methodology ..........................................138 6.1.2 Component Product Platform Portfolio Optimization..........................139 6.1.3 Web-Based Product Platform Portfolio Implementation .....................141 6.1.4 The Valve Yoke Redesign Example Problem ......................................141
6.2 Research Contributions...................................................................................143 6.3 Research Limitations ......................................................................................145 6.4 Potential Future Research ...............................................................................147
Bibliography ................................................................................................................151
Appendix A Seismic Analysis Example .....................................................................162
A.1 Discussion......................................................................................................162 A.2 Extended Structure Cross-Section Properties ................................................167 A.3 Required Stem Thrust ....................................................................................171 A.4 Extended Structure Minimum Natural Frequency.........................................173 A.5 Extended Structure Reaction Forces..............................................................176 A.6 Yoke Legs Stress Analysis ............................................................................178

vii
Appendix B Artifact Bounds Constraints and Candidate Component Platforms .......182
B.1 Artifact-Specific Bounds Constraints............................................................184 B.2 Candidate Component Platform Solutions ....................................................185
Appendix C Product Platform Portfolio Example Supporting Tables........................186
C.1 Example Performance Feasibility Test Matrix..............................................186 C.2 Example Candidate Arrays and Solution Details ..........................................187

viii
LIST OF FIGURES
Figure 1-1: Customization Contribution for Reactive and Proactive Modes, Adapted from (Anderson and Pine, 1997)............................................................5
Figure 2-1: DSM Portion for a Mug Design (Baldwin and Clark, 2000) ...................16
Figure 2-2: Modular Function Deployment (Ericsson and Erixon, 1999)..................18
Figure 2-3: The Product Platform Concept Exploration Method ................................24
Figure 2-4: Market Segmentation Grid and Platform Leveraging Strategies (Meyer, 1997) .......................................................................................................25
Figure 3-1: Typical Gate Valves (Courtesy of Flowserve Corporation): (a) Size 6, Class 900 Flex Wedge, (b) Size 8, Class 150 Flex Wedge, (c) Size 4, Class 150 Double Disc ...................................................................................................42
Figure 3-2: Flex Wedge Gate Valve Sealing ..............................................................43
Figure 3-3: Four-Piece Double Disc Gate Wedging Mechanism ...............................44
Figure 3-4: Valve Quantities by Type, Size, and Class ..............................................46
Figure 3-5: Solid Model Views of a Typical Yoke.....................................................48
Figure 3-6: Module and Stretched Yoke Component Platform Models .....................55
Figure 3-7: Generalized Yoke Legs Cross-Section ....................................................56
Figure 3-8: Excel Solver Automatic Setup Subroutine...............................................62
Figure 4-1: The Unconstrained Leveraging Strategy...................................................68
Figure 4-2: Yoke Flange Interface Model ..................................................................94
Figure 5-1: Web-based Interface Algorithm...............................................................113
Figure 5-2: An Example Pareto Frontier Plot Adapted from (Messac et al., 2003) ....117
Figure 5-3: Valve Custom Specification Input Form .................................................122
Figure 5-4: Example Valve Result Details .................................................................123
Figure 5-5: Compromise Question for the Valve Example ........................................124
Figure 5-6: Example Output Showing a Noted Criteria Failure .................................125

ix
Figure 5-7: Valve Example Pareto Frontier Plot ........................................................126
Figure 5-8: Example Compromise Input Selection ....................................................128
Figure 5-9: Posted Output for the Compromise Input Example .................................129
Figure 5-10: Cross-Section Rib Design Strategy........................................................130
Figure 5-11: Automatic Rib Design Example Key Results ........................................134
Figure 5-12: Automatic Rib Design Example Cross-Section Parameters ..................135
Figure A-1: Extended Structure Model.......................................................................164
Figure A-2: Arc Yoke Legs Cross-Section.................................................................167
Figure A-3: Single Ribbed Circular Neck ..................................................................168
Figure A-4: Oval Neck................................................................................................169
Figure A-5: Beam Mode Reactions ............................................................................179
Figure A-6: Frame Mode Reactions to T, V, & M ......................................................180

x
LIST OF TABLES
Table 1-1: Research Questions and Objectives Summary...........................................9
Table 3-1: Component Platform Redesign Methodology for Existing Highly Customized Product..................................................................................33
Table 3-2: Market Segmentation Grid Artifact Ordinals............................................47
Table 3-3: Gate Valve Design Structure Matrix .........................................................49
Table 3-4: Portion of a Sample Analysis Input Form for Artifact 2: Size 4, Class 150 Double Disc Gate .....................................................................51
Table 3-5: Example Spreadsheet Portion Showing Design Variables and Objective Function................................................................................................60
Table 3-6: Example Spreadsheet Portion Showing Constraints .................................61
Table 3-7: Bottom-Up Component-Based Platform Redesign Methodology.............64
Table 4-1: Instantiated portion of the Sample Input Form (Artifact 2: Size 4, Class 150 Double Disc Gate).................................................77
Table 4-2: Instantiated portion of the Sample Input Form (Artifact 2: Size 4, Class 150 Double Disc Gate).................................................77
Table 4-3: Five Examples of Step 2 Testing For Artifact 15......................................80
Table 4-4: Platform Portfolio Solution 1 ....................................................................83
Table 4-5: Platform Portfolio Solution 2 ....................................................................83
Table 4-6: Example Simple Cost Models ...................................................................92
Table 4-7: Example Costing Rates .............................................................................93
Table 4-8: Determination of the Yoke Mounting Flange Volume (VMTG) .................96
Table 4-9: Market Segmentation Grid Artifact Ordinals With Exclusions ................99
Table 4-10: Sample Solution SA Algorithm Iteration History ...................................101
Table 4-11: Optimal Module Cost Model Statistics ...................................................102
Table 4-12: Optimal Stretched Cost Model Statistics.................................................102

xi
Table 4-13: Optimal Module Cost Model Pivot Table ...............................................103
Table 4-14: Optimal Stretched Cost Model Pivot Table ............................................103
Table 4-15: Optimal Portfolio Statistics Considering Commonality Only.................106
Table 5-1: Cross-Section Rib Database ......................................................................131
Table 5-2: Rib ABC Model Parameters......................................................................132
Table 6-1: Summary of Research Contributions .........................................................145
Table A-1: Aggregate Specification Input Parameters ...............................................163
Table A-2: Summary of Performance.........................................................................163
Table A-3: Extended Structure Model Parameters .....................................................165
Table A-4: Section Property Results...........................................................................170
Table A-5: Required Stem Thrust Results ..................................................................172
Table A-6: Extended Structure Natural Frequency Results........................................175
Table A-7: Reaction Force Results .............................................................................177
Table A-8: Yoke Legs Analysis Results.....................................................................181

xii
ACKNOWLEDGEMENTS
I thank Dr. Timothy W. Simpson for advising me in this research, for providing
the necessary guidance keeping me on track toward completion of this work, and for
patience and understanding during unusual circumstances. I also thank my committee:
Dr. Mary Frecker, Dr. Russell R. Barton, and Dr. Martin W. Trethewey for their interest,
instruction, and valuable feedback.
I also thank the management of the Raleigh, North Carolina office of Flowserve
Corporation, as well as my colleagues from the now defunct Williamsport, Pennsylvania
office for allowing me to reference valve design information that forms the basis of the
example problems presented in this work. In addition, I thank my colleagues at
Flowserve for their encouragement.
Finally and mostly, I thank my family for their encouragement, patience, and
understanding during the preparation and completion of this work. I thank you Elliott,
Zebulun, and Hadley for sacrificing the time away from your father. I thank you Sherry
for your love, patience, sacrifice, and encouragement even under difficult circumstances.
Sherry, the degree is yours as much as it is mine.

Chapter 1
Introduction
The new paradigm of mass customization has emerged in industry and is
transforming the marketplace by making product variety affordable to the masses. Pine
(1993) defines mass customization as “At its limit, it is mass production of individually
customized goods and services”. Mass customization developed out of the customer’s
“push” for variety. Pine discusses the evolution of this push for United States markets
since the early 1900’s, where evolving class distinctions and maturing markets created
increasing demand for differentiation in product offerings. He describes five steps that a
firm can implement to gradually shift to mass customization: (1) customize services
around existing standardized products or services, (2) embed customizability into mass
produced products, (3) create point-of-delivery customization, (4) provide quick
response, and (5) modularize. He concludes that “It is therefore important for new
products to meet customer needs more completely, to be of higher quality, and simply to
be different from what is already in the marketplace”.
Today, companies realize that the modern consumer demands variety and that
market share is best maintained through a wide range of product offerings. In addition, it
is widely recognized that the failure to address even small market niches could give
competitors opportunities to steal market share. One consumer may choose a product
based on its brand, while another may be only interested in cost, while yet another may
look for aesthetics.

2
However, variety comes at a price: mass customization techniques are being
developed, used, and improved that provide cost savings through economies of scale and
scope while still providing the necessary product differentiation. Commonality is
recognized as an effective way to achieve economies of scale and scope, and successful
implementation of mass customization involves optimizing the tradeoff between variety
and commonality. In addition, methods are being developed for providing variety in
derivative products that will efficiently meet future demand.
A common approach for providing variety without losing commonality is to
employ a modular architecture (Baldwin and Clark 2000) where different product
“chunks” (or modules) can be pieced together in various ways. Employing modules
helps increase commonality, which results in economies of scale and scope, yet provides
seemingly endless variety. However, a possible disadvantage to a modular architecture is
that a product line could be easily copied.
Another approach that is becoming popular is the development of a product
platform from which a family of products can be generated (Simpson, et al. 2005). A
product family is a group of related products that share common features, components,
and subsystems yet satisfies a variety of market niches. The set of common parameters,
features, or components that remain constant from product to product within a given
product family is referred to as a product platform. The product platform provides the
basis for the product family, which is derived through the addition, substitution, or
exclusion of one or more modules from the platform (Dahmus, et al. 2000; Gonzalez-
Zugasti and Otto 2000; Martin and Ishii 2000; Ulrich 1995; Zamirowksi and Otto 1999)

3
or by scaling the platform in one or more dimensions (Dai and Scott 2006; Fellini, et al.
2005b; Messac, et al. 2002; Nayak, et al. 2002; Simpson, et al. 2001).
A company’s product line could be based totally or in part on a product platform
portfolio, which is a collection of product platforms. The combination of a management
style centered on the mass customization paradigm with a design process centered on a
product platform portfolio could result in a cost-effective product development system
that can provide the variety demanded by the market. An agile manufacturing system
combined with a well-designed portfolio can efficiently and proactively change to meet
future demand.
1.1 The Benefits of Mass Customization and Product Families
Is the adoption of mass customization techniques and product platform
development a good strategy for all products and services? Like any change, it comes
with a cost, and it requires a major shift in a company’s business strategy. Obviously, a
payback must be foreseen before a company would implement the required changes. For
many large companies, implementation of product families has already proven
successful, and some examples are discussed in Section 1.2. However, many small
manufacturers may be hesitant to commit resources as they do not have the “deep
pockets” or “financial float” of larger firms (Maupin and Stauffer 2000). Nevertheless,
there may be a huge hidden cost for not committing to change, which entails increased
competition and pricing pressures from those firms who successfully adopt the new
paradigm.

4
Can a product line require so much customization that a product family is
infeasible? Heavy industrial equipment used for material processing, manufacturing, or
power production are good examples of products that are highly customized. These types
of products can be one of a kind and can have unique design requirements. Some
attempts at designing product platforms for such products are documented in the
literature. For instance, Seepersad, et al. (2000; 2002) describe absorption chillers as a
highly customized product, and a product platform is developed for them to satisfy a
range of customer requirements. Custom equipment is also prevalent in the highly
regulated nuclear power industry, and preliminary work involved with this dissertation
(Farrell and Simpson 2003, 2006; Farrell, et al. 2003) describes the development of a
product platform for actuator mounting yokes on nuclear grade valves.
It can be difficult to achieve and maintain commonality for companies involved
with low volume highly customized products with strict customer design requirements
that may vary greatly from contract-to-contract or from piece-to-piece. When a product
is unique, it results in high development and production costs that are difficult to predict,
and in long and uncertain production times. A manufacturer of these products may
eventually develop a quasi-standard product line, but since the line is designed one
custom product at a time, the full spectrum of product offerings is rarely reviewed to
ensure that it is optimal for the business (Mather 1995). Focusing on custom products
can result in “a failure to embrace commonality, compatibility, or standardization”
(Martin and Ishii 1997), leading to a proliferation of products and parts with increasing
costs and overhead. The failure potential increases by degree for highly customized
product lines and is even greater for small firms.

5
As expressed by Anderson and Pine (1997), some companies are able to
manufacture custom products somewhat quickly, but they sacrifice cost and control in the
process. This is a “reactive” approach to customization, which can be very expensive. In
contrast, mass customization advocates a “proactive” approach where the challenge is to
achieve timely and efficient mass customization of products. This reactive verses
proactive approach is illustrated in Figure 1-1.
100 Percent
Easily Customizable
Change or Modify "Standard" designs and Processes
Custom Engineering
Standard Parts and Modules
Reactive Proactive(mass customization)
Cus
tom
izat
ion
Con
tribu
tion
Figure 1-1: Customization Contribution for Reactive and Proactive Modes, Adapted from Anderson and Pine (1997)

6
1.2 Product Family Approaches and Examples
There are two recognized approaches to product line design using product
platforms: top-down and bottom-up. With the top-down approach, a company starts with
a ‘clean slate’ and strategically manages and develops a family of products based on a
product platform and its derivatives. In the 1990’s for instance, Sony strategically
managed the development of their Walkman® products using carefully designed product
platforms and derivatives (Sanderson and Uzumeri 1997). Meanwhile, with the bottom-
up approach, a company redesigns or consolidates a group of distinct products to
standardize components to improve economies of scale. As an example, after working
with customers to individually develop over 100 lighting control products, Lutron
redesigned its product line around 15 to 20 standard components that can be configured
into the same over 100 models from which customers could initially choose (Pessina and
Renner 1998). Another bottom-up example in the literature is the redesigned hydraulic
cylinders at John Deere (Shirley 1990). Product line redesign is a major motivation for
this research, and the cost savings benefits of employing the bottom-up product platform
approach are investigated in detail.
Product platforms exhibit two common types of architecture. The most prominent
is a module-based family where family members result from adding, substituting, and/or
removing one or more modules from the platform. For example, Hewlett Packard
successfully developed several of their ink jet and laser jet printers around modular
components to gain benefits of postponing the point of differentiation in their
manufacturing and assembly processes (Feitzinger and Lee 1997). An alternative

7
architecture is with a scale-based product family where one or more scaling variables are
used to “stretch” or “shrink” the platform in one or more dimensions to satisfy a variety
of market niches. For instance, Boeing developed many of its commercial airplanes by
“stretching” the aircraft to accommodate more passengers, carry more cargo, and/or
increase flight range (Sabbagh 1996).
1.3 Research Objectives
Today’s consumers are demanding increased variety in the products and services
that they buy, and platform-based product development is essential to provide that variety
in a cost-effective way. By means of product platforms, companies are able to
strategically implement mass customization and plan future product offerings. As this
trend continues, there may be huge hidden costs for firms that do not adopt the new
product platform paradigm, especially those involved with high volume sales (Simpson,
et al. 2006). If companies refuse to adapt, they may lose market share to firms that can
and that have successfully reduced costs while providing the variety that market niches
demand.
However, what about small firms and especially those who produce highly
customized products at low volumes? In what ways can this new design approach benefit
such a firm? Is there a danger of losing market share to larger firms who have learned
how to meet custom requirements more efficiently? Assuming implementing product
platforms for such firms is important, how should their approach be different from that of

8
larger firms? It is generally assumed that commonality translates into cost savings
through economies of scale and scope, but is this achievable with low volume products?
Consequently, two primary questions are addressed in this research:
1. In what ways can platform-based product development benefit small companies who
produce highly customized products at low volumes?
2. How should product platform design differ from current methods for such products,
and what factors are important for defining the best platform design strategy?
Assuming limited resources, as with many small companies, the bottom-up
platform design approach is advocated in this research. Thus, a more focused research
question is “How should the bottom-up platform design approach for a small company
differ from that for a large company?” The goal of product platform design is an optimal
tradeoff between production cost, product performance, and customer perceived variety.
However, the optimal tradeoff can be uncertain, especially with low volume products,
because of uncertain future demand, unknown customer requirements, and/or inaccurate
cost modeling. The major task in the proposed research is to address this uncertainty
with the development of a strategic platform design methodology that realistically
captures future demand, customer requirements, and production costs through the use of
appropriate metrics. The major research goal is to develop a systematic approach for
designing and maintaining a product platform portfolio that is optimal for a low volume
highly custom product line.
For low volume products, it is often uncertain what products will be demanded
next, and an important aspect of platform portfolio implementation is to properly
incorporate the voice of the customer into the process as early as possible. The research
9
proposes using the World Wide Web to facilitate customer interaction. Then, a third
research question is “how can the Web be used to facilitate customized product design for
low volume products?”
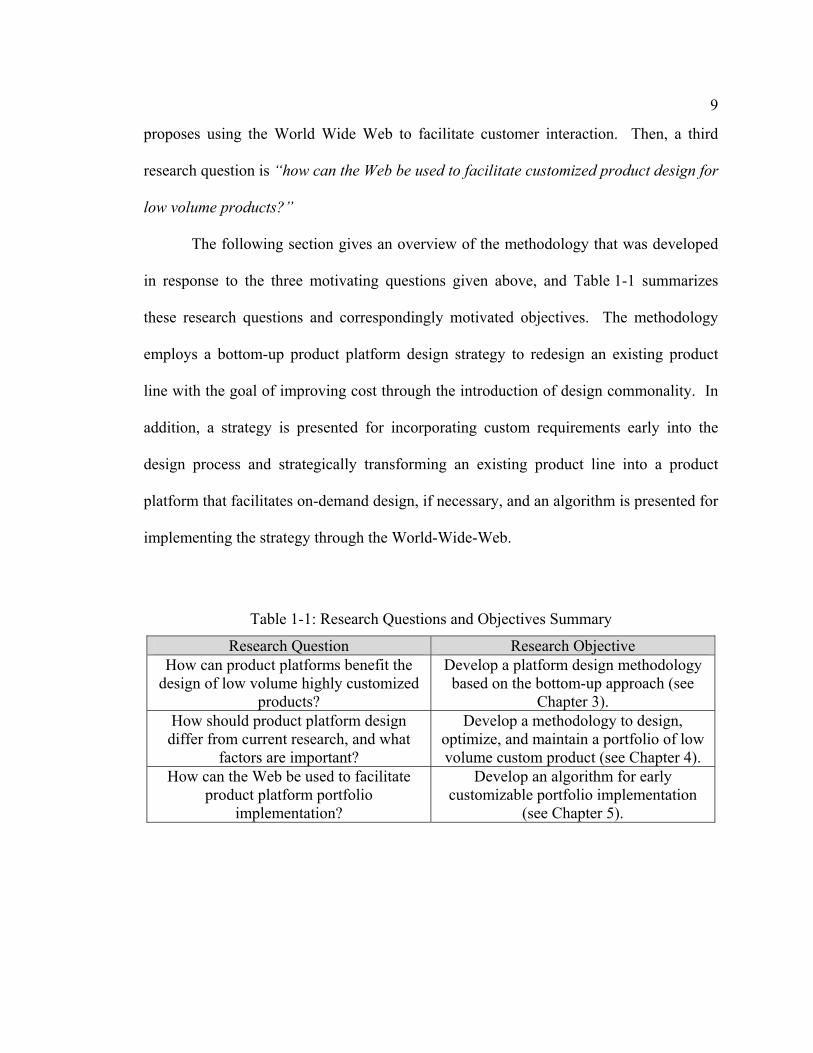
The following section gives an overview of the methodology that was developed
in response to the three motivating questions given above, and Table 1-1 summarizes
these research questions and correspondingly motivated objectives. The methodology
employs a bottom-up product platform design strategy to redesign an existing product
line with the goal of improving cost through the introduction of design commonality. In
addition, a strategy is presented for incorporating custom requirements early into the
design process and strategically transforming an existing product line into a product
platform that facilitates on-demand design, if necessary, and an algorithm is presented for
implementing the strategy through the World-Wide-Web.
Table 1-1: Research Questions and Objectives Summary
Research Question Research Objective How can product platforms benefit the
design of low volume highly customized products?
Develop a platform design methodology based on the bottom-up approach (see
Chapter 3). How should product platform design differ from current research, and what
factors are important?
Develop a methodology to design, optimize, and maintain a portfolio of low volume custom product (see Chapter 4).
How can the Web be used to facilitate product platform portfolio
implementation?
Develop an algorithm for early customizable portfolio implementation
(see Chapter 5).

10
1.4 Overview of Dissertation
The methodology presented in this dissertation is motivated by the need to
improve commonality in a highly customized low volume product line whose members
were originally developed one-at-a-time to meet specific customer requirements, as it can
be difficult to achieve and maintain commonality under this scenario. Redesign of a
‘one-at-a-time’ product line can be cost prohibitive, especially for a small firm.
However, what may be justifiable is a strategic redesign of a limited set of component
parts that have the highest potential for cost saving. A component part redesign effort
can employ the product platform approach, and when applied across the market segment,
a component-based product platform portfolio results.
A methodology is presented for optimizing the cost of implementing a product
platform portfolio through the introduction of common design features to address the
demands of a given market. It assumes that a product line already exists and that the
objective is to redesign individual components that are common to all members of the
product line but lack commonality between the members. The goal is to minimize
manufacturing cost by minimizing the number of component product platforms required
to address the market without sacrificing product performance or customer perceived
variety, but this can be challenging because it involves a tradeoff between minimum cost
and maximum performance. In order to incorporate custom design requirements early
into the design process, the methodology proposes implementing any resulting product
platform portfolios through a web-based user interface. What results is a web-based
interface that implements a virtual product platform portfolio in that inventory is not

11
stocked but the product is designed and produced on-demand in response to custom
requests.
Chapter 2 gives an overview of existing research that forms the technology base
upon which the proposed methodology is built. The developed methodology focus is a
bottom-up product line redesign strategy for low volume custom products and is based on
product platform design techniques. With inspiration from existing research on
collaborative design using the World Wide Web as an interface, the methodology
advocates a web-based implementation of any developed product platform portfolio to
quickly respond to custom requests without the need to stock inventory.
In Chapter 3, this methodology is presented in detail for redesigning an existing
line of low volume custom product using a bottom-up component redesign strategy and
using product platforms, and the components targeted for redesign are those with the
highest potential for cost savings. The steps of the methodology are outlined in detail,
and the process is described by three phases of design activity including (1) collecting
knowledge of the existing product line that is needed throughout the redesign process, (2)
building a baseline standard product line with which to compare any redesign effort, and
(3) the development of component classes that are instantiated to yield candidate
component platforms. The resulting product platform portfolio is created using a subset
of the candidate component platforms.
Applying the methodology described in Chapter 3 results in a set of candidate
component platforms from which a product platform portfolio is created, and a process is
required to create a platform portfolio that is the most cost effective to implement.
Chapter 4 presents an optimization process that yields the most cost effective portfolio

12
from a subset of the candidate component platforms. The process goal is to minimize
manufacturing cost without sacrificing product performance or customer perceived
variety.
In Chapter 5, an algorithm is presented for strategically transforming an existing
product line into a virtual product platform that is instantiated on demand in response to
custom specification requests. In addition, a strategy for implementing engineer-to-order
customization is included where key design features are engineered on-demand. The
algorithm also includes a strategy for inviting a user to consider a performance
compromise in exchange for cost and/or lead-time savings, which further adds to design
flexibility. As a result, custom design requirements are addressed early, the potential for
overlooked requirements and misunderstandings is greatly reduced, and the design
process is improved overall.
A single example problem is employed throughout the dissertation regarding the
design of yokes for mounting motor actuators on valves for use in the nuclear power
industry. The example is very representative of a low volume highly customized product
line, and it is presented in much detail to demonstrate implementation of the important
aspects of the proposed methodology. In Chapter 3, a yoke component class is created
and instantiated to yield a set of candidate yoke component platforms. In Chapter 4, a
valve product platform portfolio is created from a subset of the candidate yoke
component platforms. In Chapter 5, a web-based interface is described that implements a
virtual valve product platform portfolio that allows a user or sales engineer to provide a
custom design specification, compromise design requirements in exchange for cost or
lead-time savings, and design yoke ribs on-demand if necessary. The web-based

13
interface demonstrates the potential for early inclusion of custom requirements into the
design process, and the implementation of a virtual product family that provides true
engineer-to-order customization.
The dissertation is concluded in Chapter 6 with an overall summary of the
developed methodology and the contributions to the research community. In addition,
the methodology’s limitations are discussed along with potential opportunities for further
work.
14
Chapter 2
Literature Review
To determine how best to design low volume, highly customized products, the
following areas of research are investigated: modularity, product platform design and
related metrics, and collaborative design using the Word Wide Web. The first two topics
are a precursor to the focus on product platform design and web-based collaboration.
These topics form a technology base for addressing the proposed three basic areas of
study: (1) the bottom-up product platform design approach, (2) optimal platform
portfolio design, and (3) the use of the Word Wide Web as a design interface tool.
2.1 Modular Product Architecture
The most popular approach in the literature for implementing mass customization
is through modular product architectures. A well-designed modular architecture is
considered an effective way to achieve economies of scale and scope, and considerable
research has focused on defining and improving the architecture. Ulrich (1995) defines a
modular architecture as one that “includes a one-to-one mapping from functional
elements in the function structure to the physical components of the product, and
specifies de-coupled interfaces between components”.
Zamirowksi and Otto (1999) describe function structure diagrams and how a
monolithic function structure, which is one that includes all members of a family of
products, can be used to identify a product platform and potential modules. Dahmus, et
15
al. (2000) present an approach for architecting a new family of products that advocates
creating a generalized function structure for each product in a family, after which a
modularity matrix is constructed, and then the matrix is used to identify potential
modules and platforms. Siddique and Rosen (2000) propose using design spaces that
model connectivity, functionality, and assemblability; consider common constraints and
different viewpoints (i.e., intent, assembly, connections); and make use of the constrained
Cartesian product to evaluate the modularity scheme.
Blackenfelt and Sellgren (2000) propose that the connecting interface between
modules should be specified early to allow for parallel design activities. Their proposed
approach starts with an expanded physical feasible region between interfaces, and later
when more information is known, topological and shape optimization are employed to
“shrink” the feasible region. The shape optimization is complemented with Robust
Design techniques.
Baldwin and Clark (2000) give a thorough overview of modular design. They
give a widely used definition of a module as “a unit whose structural elements are
powerfully connected among themselves and relatively weakly connected to elements in
other units”. They look at design as an evolutionary process, describing the objects that
result from design as artifacts, and the design process as a type of complex adaptive
system. A set of six modular operators are defined: splitting, substituting, augmenting,
excluding, inverting, and porting. Splitting is the most fundamental operator as it
considers the splitting apart of an integrated design into modules or the further splitting of
an existing module into sub-modules. Once a modular structure exists the other
operations can be performed. Substituting, augmenting, and excluding denote the various

16
switching that is possible with an existing modular architecture to create design variants.
The last two usually occur as a design evolves. Inversion involves creating a single new
module that performs a function that was previously performed internally by several
modules. Porting is when a module is designed to function in two or more systems that
are incompatible among themselves. The discussion focuses on the computer industry,
and on the specific example of the IBM System 360 design architecture. It is shown how
the structure of individual enterprises and ultimately the entire computer industry is
shaped by the modular architecture of the computer artifact.
Baldwin and Clark (2000) demonstrate the use of the closely related design
structure matrix (DSM) and task structure matrix (TSM). The DSM characterizes both
component hierarchical dependencies and design parameter interdependencies within a
design. Whereas the DSM deals with the topology of the design, the TSM characterizes
the design process as it focuses on the tasks and resources involved in creating the design.
Figure 2-1 gives an example DSM that addresses a portion of the parameters associated
with a mug design.
1 2 3 4 5 6 7 8 9 10
Material 1 o x x x x x xTolerance 2 x o x x x x x xMfr. Process 3 x x o x x x x xHeight 4 x o x x xVessel Diameter 5 x x x o x x xWidth of Walls 6 x x x x x o x xType of Walls 7 x x x x x o x xWeight 8 x x x x x x o xHandle Material 9 x x x x x o xHandle Shape 10 x x x x x o
Design Parameter
Figure 2-1: DSM Portion for a Mug Design (Baldwin and Clark, 2000)

17
Ericsson and Erixon (1999) give practical aspects of applying modularity to a
product platform. They define the modular function deployment (MFD) approach, and
Figure 2-2 illustrates its five major steps. The approach involves common methods and
tools such as quality function deployment (QFD), design for manufacture and assembly
(DFMA), and the use of a Pugh matrix, a functions and means tree, a module indication
matrix (MIM), and a interface matrix. In addition, many metrics and rules are discussed
that involve aspects of the design such as costs, lead time, quality, and flexibility. The
input to the MFD is an infinite number of product possibilities, and the output is a
modular product. Several industry examples of applying MFD are discussed, and the
companies involved include Volvo Car Corporation, Atlas Copco Controls, VGG
(manufacturer of the “fifth wheel” that connects to the kingpin of a semi-trailer), and
Sepson (manufacturer of small winches).

18
Gu and Watson (2001) present a modular design method called the House of
Modular Enhancement (HOME) for product redesign with the goal of enhancing
modularity. The method consists of three main phases: (1) generate a modular design
information matrix, (2) create modules, and (3) analyze the module design. Input
includes life cycle characteristics, product architecture, and function structure, and
employment of a modular grouping algorithm results in the enhanced modularity.
Lipson, et al. (2001) promote modularity in evolutionary design. They define
modularity as “the separability of a design into units that perform independently”, they
propose that designs that exhibit modularity have higher adaptabilty and consequently
Figure 2-2: Modular Function Deployment (Ericsson and Erixon, 1999)

19
have better survival rates under changing requirements, and they quantify modularity as
inversely proportional to the amount of coupling in the system.
Also regarding evolutionary modular design, Allada and Lan (2002) employ a
dynamic programming method for planning the launch of new modules in an evolving
product family. The goal of this method is to determine (1) when to replace the modules
in a product family, (2) what modules need to be replaced, and (3) what modules will
serve as replacements. Both deterministic and stochastic model formulations are
presented.
Ishii, et al. (2003) present results of a survey of international companies regarding
their perception, definition, and use of modularity. Modularity practice in various
industries is benchmarked, and it is concluded that “the form and the extent of modularity
practice depend on industry specific drivers, which are largely affected by strategic
preference, external uncertainties and tactical alternatives.
Similar to the focus of the proposed research, Berti, et al. (2001) advocate that
small- and medium-sized enterprises employ modular design methodology in order to
improve their competitiveness in global markets. They employ commercially available
software to provide a flexible, inexpensive and easy to handle framework for the design
of product families.
2.2 Product Platform Design
Product platform and portfolio design is the main focus of the proposed research.
As discussed previously, there are two basic approaches to product family design in the

20
literature, the top-down and bottom-up approaches; however, most research deals with
the top-down approach.
Gonzalez-Zugasti, et al. (1998) present a basic platform design approach where
the platform is designed from a performance valuation and team re-negotiation heuristic.
A follow-up paper discusses when to introduce future platform variations based on ‘real
options’ in lieu of traditional discounted cash flow or net present value functions
(Gonzalez-Zugasti, et al. 1999).
Product platform design typically involves an attempt to optimize performance
based on an objective function, and some specific examples follow. In Gu, et al. (2000),
the platform problem is decomposed into business and engineering decisions, and a
technique is given to minimize the deviation from system goals rather than optimize
performance per se. Gonzalez-Zugasti and Otto (2000) give a method for optimizing a
family with a known modular architecture using a Genetic Algorithm (GA). Siddique
and Rosen (1998) use a weighted-sum of commonality indices as an objective function,
and for products that are completely modular, they use the constrained Cartesian product
to generate potential family members (Siddique and Rosen 2000). Farrell and Simpson
(2003) attempt a bottom-up approach using the traditional Generalized Reduced Gradient
method as an optimizer in conjunction with the Product Platform Concept Exploration
Method to design a platform.
Simpson (2004) discusses the status of research on product platform design and
optimization. He categorizes several research papers in terms of their formulation of the
optimization problem (i.e., are resulting product families module-based or scale-based, is
the objective function single or multiple objective, what kind of cost model is used, etc.),

21
number of solution stages, and optimization algorithm (e.g., Sequential Linear
Programming, Non-Linear Programming, Genetic Algorithms, etc.).
Sanderson and Uzumeri (1997) discuss how proper management of product
families can make product evolution smooth and efficient. The concept of a virtual
product platform is presented, which is defined as “a representation of the product that is
common to a family of different models and common to a series of successive changes in
their functionality.”
2.3 Commonality, Variety, and Other metrics
Product family design is best achieved through a strategic tradeoff between
commonality and customer perceived variety, and researchers have attempted to measure
this tradeoff by means of indices. For instance, Martin and Ishii (1997; 2000) define
three indices involved with design for variety, commonality, setup, generation variety,
and module coupling. Maupin and Stauffer (2000) define simplicity, standardization,
direct cost, and differentiation indices. Zamirowksi and Otto (1999) combine product
variety heuristics with function structures to yield potential modules.
Delayed differentiation is a concept closely related to the commonality-variety
tradeoff. Siddique and Rosen (1998) propose that cost savings can be achieved by
delaying distinguishing features between closely related products until a late as possible
into the manufacturing process. Maupin and Stauffer (2000) give simplified techniques
that could be useful for small firms to reengineer a product family; delayed
differentiation is advocated, and a delayed differentiation graph is defined.

22
Robertson and Ulrich (1998) stress the need to balance product distinguishing
attributes with commonality and define metrics to measure improvement in customer
satisfaction and flexibility. Measurements can help management decide on future
change. However, once given a direction, a company must be committed to change for
the better, but it is often a challenge to overcome long instilled paradigms that impose
great inertia. A company committing to change can be like a person committing to a diet,
where only a small percentage find the discipline to succeed.
Another important factor to consider in product platform design is production
costs, and several recent works directly address the topic (Fujita, et al. 1999; Fujita, et al.
1998; Fujita and Yoshida 2001; Hernandez, et al. 2001; Park 2003; Seepersad, et al.
2000). Rather than rely on the traditional material, labor, and overhead model to estimate
production costs, these works advocate the use of Activity-Based Costing (ABC) models
that associate production cost to a set of production activities and how resources are
consumed by these activities. A significant problem with the traditional costing approach
is that overhead cost is allocated to all products equally, usually by a percentage markup,
which can mask production inefficiencies, making it difficult to see the need for
improvement because it is difficult to link overhead cost with critical design variables.
The goal of the ABC approach is to capture the true production cost for individual
products, for instance, Park and Simpson (2003) propose a production cost model based
on a production cost framework associated with manufacturing activities that can be
easily integrated within an optimization framework because production costs are properly
linked with critical design variables. In addition, Anderson and Pine (1997) and

23
Galsworth (1994) discuss the cost of variety within the context of mass customization
along with traditional costing approaches.
2.4 PPCEM and the Compromise Decision Support Problem
An important foundation of the proposed research is the Product Platform
Concept Exploration Method (PPCEM) first presented by Simpson and his colleagues
(1999). Application of the PPCEM involves solving a Compromise Decision Support
Problem (C-DSP), which is a multiobjective optimization problem based on goal
programming and math programming.
The input to the PPCEM is the overall design requirements, and the output is the
product platform and resulting product family. The PPCEM consists of five steps that
prescribe how to formulate the product family design problem and describe how to solve
it; the actual implementation of each step is likely to vary from problem to problem. The
five steps are shown in Figure 2-3 along with their associated tools/methods, and a brief
overview of each step follows.

24
Step 1: Create the Market Segmentation Grid – This step involves mapping the
overall design requirements into an appropriate market segmentation grid (Meyer 1997),
as shown in Figure 2-4. The grid allows for identification of potential leveraging
opportunities for the product platform to effectively satisfy a variety of market segments.
As shown in Figure 2-4, horizontal, vertical, and beachhead approaches can enable
effective platform leveraging both within and across different market segments.
Step 1Create market segmentation grid
Step 2Classify factors and ranges
Step 3Build and validate metamodels
Step 4Aggregate product platform specifications
Step 5Develop product platform and family
Overall design requirements
Product platform and product family specifications
PPCEM steps PPCEM tools
Market segmentation
grid
Robust design principles
Metamodeling techniques
Compromise decision support
problem
Figure 2-3: The Product Platform Concept Exploration Method

25
Step 2: Classify the Factors and Ranges – This step involves mapping the overall
design requirements and market segmentation grid into appropriate factors and
identifying corresponding ranges for each scaling variable. Scaling variables are the
design variables that vary from product to product within a given product family and are
used to “stretch” or “shrink” members of the product family to instantiate their individual
performance. Scaling variables facilitate the platform leveraging strategies identified in
Step 1.
Low
(a) Horizontal Leveraging
A B C
High
Mid-Range
Cos
t & P
erfo
rman
ce
Market Segmenet
High End Platform
Low End Platform Low
(b) Vertical Leveraging
A B C
High
Mid-Range
Cos
t & P
erfo
rman
ce
Market Segmenet
Scal
ed D
own
PlatformA
PlatformC
Scal
ed U
p
Low
(c) Beachhead Approach
A B C
High
Mid-Range
Cos
t & P
erfo
rman
ce
Market Segmenet
Platform
Figure 2-4: Market Segmentation Grid and Platform Leveraging Strategies (Meyer, 1997)

26
Step 3: Build and Validate Metamodels – This step includes modeling
computationally expensive computer simulation codes using computationally inexpensive
metamodels (e.g., response surfaces, kriging (Simpson, et al. 1997b)).
Step 4: Aggregate Product Family and Product Platform Specifications – This
step includes formulating the product platform and product family design problem based
on the market segmentation grid, the factors and ranges, and the overall design
requirements.
Step 5: Develop the Product Platform and Product Family – This step involves
solving the product family design problem formulated in Step 4 to obtain the product
platform and corresponding family of products, which best satisfy the overall design
requirements. Farrell and Simpson (2003) formulate the optimization problem using an
Excel spreadsheet that involves continuous non-linear functions, and the generalized
reduced gradient (GRG) algorithm from (Belegundu and Chandrupatla 1999) is employed
to solve it. Other algorithms could be used to perform the optimization of the non-linear
problem; for instance, a simulated annealing algorithm was utilized by Farrell (1999) to
optimize the bolted pressurized flange designs, which involves a similar non-linear
optimization formulation.
In related work, researchers have replaced or modified the C-DSP formulation.
Nayak, et al. (2000) employ a variation-based objective function where the design
variables are formulated in terms of a mean and standard deviation and then the C-DSP is
solved to find the best mean and deviation, and one result is the best design variables to
use as platform variables. Physical Programming is incorporated into the PPCEM by
Messac, et al. (2000) who claim better results than the PPCEM and also that the solution

27
of the C-DSP does not guarantee a Pareto-optimal solution. Seepersad, et al. (2000) also
consider Physical Programming and detailed product costs, and they also add utility
theory to the PPCEM.
2.5 Product Platform Portfolio Optimization
In most research, the product platform portfolio and the design and platform
variables are established prior to detailed design; however, there has been research
involving optimization prior to detailed platform design (Seepersad, et al. 2002). Some
research endeavors to distinguish between design variables, which change with each
family member, and platform variables, which are constant within the family (D'Souza
and Simpson 2002; Nayak, et al. 2000; Simpson, et al. 1997a). For instance, D'Souza and
Simpson (2003) employ a non-dominated sorting genetic algorithm to optimize the
balance between commonality and performance. Effectively, this optimizes the extent to
which the design variables cover the targeted market segments. Because the genetic
algorithm can be expensive, a “screening” experiment is employed to determine the
significant design variables and hence reduce problem size.
In recent work by de Weck, et al. (2003), a method is presented to determine the
optimal number of product platforms to maximize overall product family profit with
simplifying assumptions. The methodology is demonstrated for a hypothetical
automotive vehicle line that is required to fill seven market segments. Then, the portfolio
can vary from one to seven platforms: the seven platform case corresponds to no
leveraging, and the one platform case corresponds to maximum possible leveraging. The

28
method simply examines the profit for each portfolio from the set of seven, and chooses
the one that yields the highest profit as the optimal one; a three platform portfolio is
determined to be optimal for their example.
Fujita and Yoshida (2001) advocate the simultaneous design of multiple products.
Assuming module architecture, they propose a simultaneous optimization method for
both module combination and module attributes of multiple products. The method
models cost, profit, commonality, and similarity, and hybridizes a genetic algorithm, a
mixed-integer programming method with a branch-and-bound technique, and a
constrained nonlinear programming method. This is an extension of earlier work (Fujita
2002) where optimization of module combination and module attributes are treated
separately.
In other research, product family selection is optimized based on a performance
loss function (Fellini, et al. 2002), or optimization is based on combining business and
engineering decisions (Georgiopoulos, et al. 2002). In a paper involving modular
architecture artifacts, a GA-based method is used to optimize module sharing and
creation of new modules (Gonzalez-Zugasti and Otto 2000). In work by Hernandez, et
al. (2002), the goal is to minimize the impact of commonality on performance using the
concept of space of customization. Farrell and Simpson (2006) employ an arbitrary un-
constrained leveraging strategy to introduce commonality into an existing product line.

29
2.6 Collaborative Design Using the World Wide Web
Significant work exists regarding the utilization of the World Wide Web for
distributed design and manufacturing involving collaboration among colleagues and
partners (Balakrishnan, et al. 1999; Benami and Jin 2000; Coutinho, et al. 1998; Gerhard,
et al. 2000; Gobinath, et al. 2006; Jayaram, et al. 2001; Parkinson, et al. 2004; Tumkor
2000; Wang, et al. 2006). For instance, Wright and his colleagues have pioneered a
network manufacturing service called CyberCutTM for design and fabrication on the
Internet (Ahn, et al. 2001; Wright 2001). Wallace and his co-authors are developing a
Distributed Object-based Modeling Environment to link distributed and heterogeneous
design “services” over the Internet to enable tradeoff analysis during production design
(Abrahamson, et al. 1999; Senin, et al. 2003; Wallace, et al. 1999). Some work
concentrates on Internet-based CAD/CAM services (Ahn, et al. 2001; Flores, et al. 2002;
Han, et al. 1999; Satish, et al. 2006; Szykman and Sriram 1998).
There are many web-based expert systems that allow users to customize their
products. Most are based on assemble-to-order customization (Duray, et al. 2000), and
these are typically for high volume products for which the possible variety has been
strategically targeted in advance to meet the needs of specific market segments. For
example, assemble-to-order web-based customization is prevalent with the personal
computer (Prince 2006), and automobile industries (Simison 2000). Alternatively,
engineer-to-order systems are emerging (Chen, et al. 2001; Farrell, et al. 2007; Siddique
and Shao 2001; Simpson, et al. 2003; Zhang, et al. 2007), where the end user is allowed
direct involvement in the product design process.

30
2.7 Chapter Summary
This chapter presents a technology base from which a methodology for the
redesign and implementation of a low volume, highly customized product line is built.
The developed methodology is an extension of the PPCEM focused toward bottom-up
platform development with special consideration for low volume custom products. The
basic redesign methodology is presented next in Chapter 3 and builds upon the existing
research regarding market segmentation grid leveraging, modularity, stretching and
scaling, and Activity-Based Costing. This basic methodology requires supporting
methodology for optimizing cost in a product platform portfolio, and Chapter 4 presents
an optimization process that requires a zero-order optimizer such as provided by the
Genetic Algorithm or the Simulated Annealing Algorithm. Overall, the proposed
methodology advocates implementing the resulting product platform portfolio through a
web-based interface to allow user interaction within the design process and to introduce
custom design specifications early into the design process, and the existing research
regarding collaboration using the World Wide Web provides inspiration. An algorithm is
presented in Chapter 5 for implementing the portfolio using the web.

31
Chapter 3
Bottom-Up Product Platform Design Methodology
The Product Platform Concept Exploration Method (PPCEM) introduced in
(Simpson, et al., 1999) was developed as a general top-down approach for product
platform and product family design. This research focuses on employing the PPCEM as
a bottom-up approach for the redesign of an existing product line with the goal of
increasing cost effectiveness while meeting custom design specifications. A specific
focus is toward the redesign of highly customized low volume products such as heavy
industrial equipment used for material processing, manufacturing, or power production.
Rather than redesign an entire product line, a methodology is proposed for the
redesign of specific components of an existing product line that have the highest potential
for cost savings. Its implementation results in a product platform portfolio that is a
hybrid between original product designs and redesigned targeted components. The
methodology recognizes that the redesign effort must consider existing designs and
existing design methodologies, and may require additional methodologies for adequately
modeling cost.
After presenting the proposed methodology, it is applied to a detailed example
involving the design of a set of valves for the highly regulated nuclear power industry.

32
3.1 Component Product Platform Development
Redesign of a highly customized low volume product line can be cost prohibitive,
especially for a small firm. However, what may be justifiable is a strategic redesign of a
limited set of component parts that have the highest potential for cost saving. A
component part redesign effort can employ the product platform approach, and when
applied across the product line, a component-based product platform portfolio results.
With the five steps of the PPCEM as a starting point, a design methodology is
presented here for designing component platforms for low volume highly customized
products. Although the ‘top-down’ approach may result in more efficient platforms in
terms of cost and performance, the PPCEM assumes a clean slate, and small firms
typically do not have the financial float and resources to implement such a radical
approach. If even a rudimentary standard product line currently exists, the ‘bottom-up’
approach may be more feasible for them, and the proposed methodology focuses on this
approach.
The proposed methodology is presented as an extension to the generalized
PPCEM, and Table 3-1 outlines the generalized five-step top-down PPCEM methodology
and alongside the corresponding and specific bottom-up methodology targeted toward
redesigning component platforms for highly customized product from an existing product
line. Implementing this bottom-up approach starts with gathering detailed design
information about the existing product line and results in a component-based product
platform portfolio.

33
It is further proposed to implement the methodology through a redesign team
represented by every facet of the development process, and it is convenient to discuss the
five-step methodology in terms of three basic phases of redesign team activity. Table 3-2
gives names for the phases (data collection, baseline standard development, and platform
portfolio development) and associates methodology steps to the phases. In the first
phase, the team collects design information about the existing product line, establishes a
target market segmentation grid, and targets components for redesign. In the next phase,
the team defines baseline standard product line members that span the established market
Table 3-1: Component Platform Redesign Methodology for Existing Highly Customized Product
Step General Top-Down PPCEM
Bottom-Up Component-Based Platform Redesign Methodology
1 Create the market segmentation grid.
Create the market segmentation grid based on past sales and sales projections, target portions of the existing product line with the highest sales potential.
2 Classify factors and ranges.
Target common components for redesign that often require modification. Classify critical design parameters from existing design data, and determine design inputs from an aggregate of known custom design specifications. Define a baseline standard product line from existing designs that span the target grid.
3 Develop metamodels as applicable.
Define component critical performance functions from existing and new design methodology as appropriate. Screening experiments may help reduce the number of required factors.
4 Aggregate Product Family and Product Platform specifications.
Develop a baseline standard redesign strategy around common component classes and corresponding standard optimization problems.
5 Develop the Product Platform and Product Family
Develop candidate component platforms by instantiating the component classes across the market segmentation grid, and then define a product platform portfolio by scaling/stretching a subset of the candidate component platforms.

34
segmentation grid. The baseline is where redesign begins, and the success of any
redesign effort is judged against it. In the third phase, target component redesign
strategies are developed around standard optimization problems resulting in target
component class definitions, and instantiating the component classes into the baseline
standard effectively yields a revised product line with improved design consistency
among members. The resulting component designs form a set of candidate component
platforms, and the resulting product platform portfolio is obtained by stretching and
scaling a subset of the candidates.
The remainder of this section further describes the three phases. The final process
of creating a component-based product platform portfolio is not addressed in detail here;
however, a methodology for creating an optimal product platform portfolio from a set of
candidate component platforms is discussed in Chapter 4.
3.1.1 Collection of Existing Knowledge, Databases, and Methodology
Critical first steps in starting any redesign project are (1) obtain a strong
commitment of company resources from the highest level of upper management, (2) give
the redesign team leadership authority to commit resources toward the project, and (3)
Table 3-2: The Three Phases of Redesign Activity
Phase Redesign Activity Phase Table 3-1 Steps Involved 1 Data Collection Steps 1, 2, 3 & 4 2 Baseline Standard Development Steps 1, 2 & 3 3 Platform Portfolio Development Steps 3, 4 & 5

35
include employees as redesign team members who represent every segment of the
company such as sales, marketing, accounting, engineering, and manufacturing. A strong
commitment is essential as the design team will likely have distracting concurrent
production-related duties, and the danger of distraction is likely more probable with a
small firm of limited resources.
Implementing the component-based platform methodology starts with collecting
detailed knowledge of the targeted product line regarding sales history, sales projections,
design methodologies, manufacturing techniques, and any known design and
manufacturing challenges. Any data source can be useful, and all available sources
should be considered. With a custom product line, the design process can be informal,
and as such, information can be scattered among key employees, including those not part
of the design team, who are holders of knowledge regarding past projects, and who are
maintainers of ‘grass-roots’ databases that are used daily to efficiently carry out
production. In addition, customer representatives may be willing to provide useful data if
they sense potential for a better product and better service. Some of this information may
be in paper form, and some may be digital, and a typical project will provide ample
opportunity for data mining.
In the early stages of the redesign process (Steps 1 and 2), the design team
consults the collected data and forms a consensus regarding the basic component-based
product platform design strategy. Targeted portions of the company’s product line are
established through market segmentation grids, and specific components targeted for
redesign are established. Since a highly customized low volume product is involved,

36
information can be limited, as with sales projections for instance, and some subjective
decisions may be required regarding the design strategy.
Existing design data is also required in the middle steps when critical design
variables and critical design inputs are defined (Steps 3 and 4). Design variables come
from the study of existing design details contained in design drawings for raw forms and
machining details. The most likely source for critical design input is design
specifications from past projects, and past engineering and manufacturing design
evaluations such as design analysis reports and manufacturing specifications.
An existing product line is a constraint on the redesign process, which is
fundamentally different from the top-down design approach that starts unconstrained.
Although this constraint can add difficulty to the design team’s decision process, any
existing product line structure, or any existing design, marketing, and manufacturing
strategies can make some decisions obvious and natural. In fact, it is important to work
with natural product line constraints, which can define obvious natural market
segmentations, such as basic product size, performance capacity, or industry focus. In
addition, it may be important to continue to follow certain basic and existing design and
marketing strategies to the extent that gross product line design changes do not occur.
Finally, uncertainty is inherent in any business, and if this uncertainty can be
quantified in terms of probability statistics, it can be included in the methodology by
applying robust design techniques.

37
3.1.2 The Baseline Standard Development
The second phase of the proposed methodology involves the establishment of a
baseline standard product line, which consists of a set of existing product line artifacts
that span the targeted market segment grid. In this work, an artifact is considered an
established design that has been manufactured successfully in the past. There is a
twofold purpose for the baseline standard: (1) it forms a baseline from which to start any
redesign project, and (2) it provides a reference against which to compare any redesign
effort, as any change deemed successful should result in a cost improvement over the
baseline (Maupin and Stauffer 2000). The baseline standard is derived from source
artifact design details such as bills of materials, design drawings, and manufacturing
processes, and from existing design methodology and custom design specifications.
Since component redesign is the methodology’s focus, it is important that the
baseline standard focus on defining targeted components and their interface and
interaction with the targeted product line. Design experience, obtained from interviews
with design engineering staff members for instance, can help define candidate target
components, i.e., those often requiring modification. Otherwise, use of a development
tool such as a Design Structure Matrix (Baldwin and Clark 2000) can help define and
isolate candidates.
Since the goal of the methodology is to reduce cost yet still meet custom design
specifications, and since the methodology advocates a baseline standard redesign,
baseline standard construction should consider known custom design specifications and
include existing design methodology. Then, baseline standard development involves

38
aggregating (1) design inputs from custom specifications, (2) design performance
assessment methodology, and (3) a list of design parameters important in defining cost
and performance. The list of parameters can become large, and it is important to focus
only on those that affect the cost, performance, and interfacing of targeted components.
It may be possible to reduce the required number of parameters through screening
experiments (Meyers and Montgomery 2002; Montgomery 2001).
Because custom design requirements are involved, it can be challenging to
determine design input that will envelop future performance requirements without
resulting in over-designed components. Design input should be studied and aggregated
to determine reasonable, perhaps average, design input. The resulting aggregate input
specification should be defined as a function of market segmentation grid defining
attributes; for instance, an input force may be a function of the artifact’s ‘size’, where
‘size’, is a market segmentation attribute.
In order to overcome the potential for inappropriately proportioned components, a
multi-tiered platform strategy may be necessary. The better multi-tiered strategies are
those where a chosen component can be manufactured flexibly for each tier. In addition,
recognizing that it is impossible to predict all future design requirements, the best
redesign strategies will include an engineer-to-order methodology that is flexible and fits
well within a multi-tiered strategy.
With highly customized products, existing design artifacts may have been created
one-at-a-time, and a well-defined product line may not currently exist. This can
challenge baseline standard development, requiring tradeoff between baseline standard
members, the targeted market segmentation grid, components targeted for redesign, and

39
redesign strategy. For instance, a scenario may require that the redesign team choose as a
baseline member a single artifact that best meets the redesign strategy from multiple and
varied artifacts.
3.1.3 Component Class and Platform Development
The proposed methodology centers on devising a component redesign strategy
that introduces commonality into the targeted product line, and this is accomplished
through the definition of component classes. Then, existing targeted components from
the baseline standard are replaced by instantiations of a component class, and required
component performance is achieved by assigning appropriate values to design variables
for each instantiation.
A component class is similar in concept to a class construct in object-oriented
programming languages such as C++ for instance, where multiple objects can be created
from a single class (Eckel 2000). For example, multiple text box objects can be created,
or instantiated, from the text box class for use in a user input form, and each text box
object can be assigned unique attributes such as border outline thickness, and each can be
used to collect different user input. In the same way, a component class can be
instantiated to create multiple components to span the targeted product line.
In this work, a component class is defined by a standard optimization problem
consisting of a collection of design variables, objective functions, constraint equations,
and the aggregate performance specification. For each instantiation, the objective
functions and constraint equations remain the same, but performance input changes, and

40
problem solution results in optimal design variable values that become component
defining attributes. The common objective functions and constraint equations are
determined from aggregating the performance assessment methodology of the baseline
standard, and performance input depends on the artifact’s place within the market
segmentation grid.
The methodology proposes that the resulting component class instantiations
define a set of candidate component platforms, a subset of which is used to create a
product platform portfolio that spans the targeted market segmentation grid. The
portfolio is created by replacing baseline standard components with strategically selected
component platforms. A single component platform may replace multiple baseline
standard components, and this is accomplished through stretching and/or scaling key
component platform parameters. Chapter 4 discusses a process for strategically selecting
component platforms from the candidates using optimization techniques. Inherent in the
process is an assessment of any proposed product platform portfolio regarding its total
implementation cost relative to the baseline standard.
The component class objective functions must adequately address aggregate
performance and cost. Although a methodology probably already exists that adequately
addresses performance, manufacturers typically use traditional costing based on the
material, labor, and overhead model. As discussed in Chapter 2, this traditional costing
approach does not adequately addresses the relationship between design parameters and
cost. Alternatively, it is proposed to apply Activity Based Costing (ABC), which is based
on production process steps more readily associated with design parameters. Section

41
4.3.1 presents a cost model based on ABC that is customized to the example used
throughout this thesis, which is formally introduced next.
3.2 Valve Yoke Component Design Example
Implementation of the bottom-up component platform design methodology is
demonstrated using an example involving the redesign of yokes from a targeted market
segmentation grid consisting of nuclear-grade valves. The subject valve product line is
an excellent representative of the type that is the focus of the research, i.e., low volume
highly customized products. Although the example addresses a real product line, a
formal redesign team has not been assembled as advocated by the methodology, and thus
the example redesign team decisions are strictly based on the opinion of the author. In
the example then, the word ‘redesigner’ is used as a surrogate for ‘redesign team’.
However, although the redesign team is lacking, the presentation does adequately
demonstrate implementation of the proposed methodology, and it potentially provides a
valuable starting point for a proper redesign team.
Before demonstrating implementation of the bottom-up product platform design
methodology, the fundamentals of valve operation and valve design are discussed.
3.2.1 Valve Fundamentals
Valves are common components in nuclear plant piping systems, and many of
them are custom built to respond to specific design and accident scenarios. The example

42
considers a product line consisting of automatically actuated gate valves such as those
shown in Figure 3-1. This product line is chosen by the redesigner because it is a
principal product line for the company and could benefit from redesign using component
platforms. Gate valves are used to isolate flow, and they can accomplish this better than
most other valve types because (1) they are reliable due to their simple design, (2) they
require less actuator force while closing against flow, (3) they introduce minimal flow
resistance while open, and (4) differential pressure across the gate aids in sealing off
flow.
Figure 3-1: Typical Gate Valves (Courtesy of Flowserve Corporation): (a) Size 6, Class 900 Flex Wedge, (b) Size 8, Class 150 Flex Wedge, (c) Size 4, Class 150 Double Disc
(b)
(a) (c)
Yoke
Body
Yoke/ Bonnet
Body
Bonnet
Actuators
Body NeckSegment
Yoke Segment

43
As an example, Figure 3-2 shows a flex wedge gate in the closed position. Flow
isolation and sealing are achieved through bearing contact between the gate and the seat
ring that is welded into the valve body. The actuator, which can be manually,
electrically, pneumatically, or hydraulically energized, provides thrust to the gate and
must provide enough force to overcome frictional and flow induced drag and to wedge
the gate into the seat. Once closed, differential pressure can develop that forces the gate
against the seat on the downstream side of the valve. Then, both differential pressure and
wedging forces are available to affect a seal between the gate and seat. Often, differential
pressure alone provides adequate bearing stress to seal. Due to design symmetry, a flex
wedge gate valve is bi-directional in that it can isolate flow moving in either direction.
Gate
Body
Seat
Thrust
∆P
DownstreamSide
Figure 3-2: Flex Wedge Gate Valve Sealing
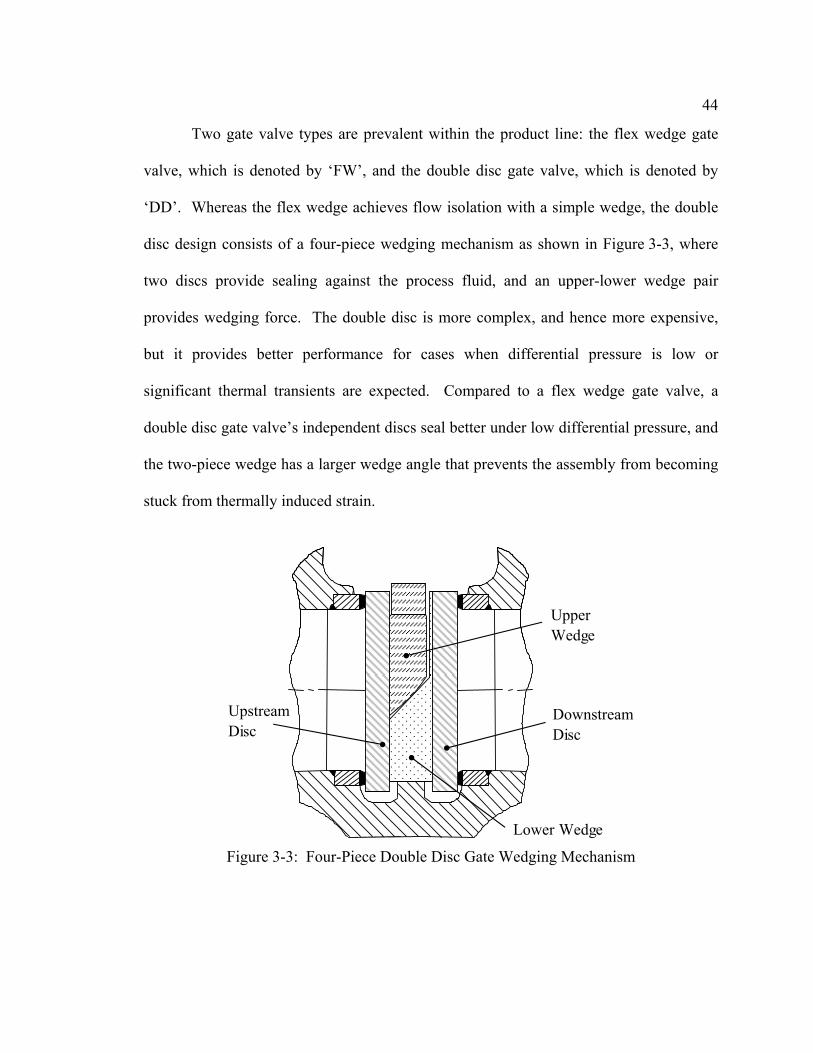
44
Two gate valve types are prevalent within the product line: the flex wedge gate
valve, which is denoted by ‘FW’, and the double disc gate valve, which is denoted by
‘DD’. Whereas the flex wedge achieves flow isolation with a simple wedge, the double
disc design consists of a four-piece wedging mechanism as shown in Figure 3-3, where
two discs provide sealing against the process fluid, and an upper-lower wedge pair
provides wedging force. The double disc is more complex, and hence more expensive,
but it provides better performance for cases when differential pressure is low or
significant thermal transients are expected. Compared to a flex wedge gate valve, a
double disc gate valve’s independent discs seal better under low differential pressure, and
the two-piece wedge has a larger wedge angle that prevents the assembly from becoming
stuck from thermally induced strain.
UpstreamDisc
Lower Wedge
Upper Wedge
Downstream Disc
Figure 3-3: Four-Piece Double Disc Gate Wedging Mechanism

45
3.2.2 The Targeted Market Segmentation Grid
The market segmentation grid for the targeted portion of the product line (i.e., flex
wedge (FW) and double disc (DD) gate valves) is constructed based on available
information from past design analyses performed to support past projects, although one
must realize that with a formal project, a redesign team must consider all available
information sources. The gate valve product line is naturally segmented in terms of valve
type (FW or DD), valve pressure class, and connecting piping nominal size. Both
pressure class and pipe size are unit-less quantities that manufactures use to identify
valves. Although unit-less, pressure class, which denotes a valve’s internal pressure
containing capacity, is roughly in psig, and nominal pipe size is roughly in inches.
Figure 3-4 is a chart of valve quantity per segment from the available data, and this is an
example of data collection task that a redesign team might perform. Appendix B includes
the source data for the charts.

46
Of the valve sizes included in the Figure 3-4, valves smaller than size 3 were
designed as a group with common design features, and it is decided to exclude these from
the project because reinvestigating this commonality it is not cost effective. Then, based
on the given quantities for the remaining FW and DD valves, the target market
segmentation grid depicted in Table 3-3 is created. Each member of the grid is given a
sequential artifact ordinal number that will be helpful during future process steps, and the
grid consists of 60 valve artifacts as can be seen. Then, given the defined targeted market
segmentation grid, implementation of Step 1 of the proposed methodology per Table 3-1
is demonstrated.
Figure 3-4: Valve Quantities by Type, Size, and Class

47
3.2.3 The Yoke Leg Targeted Component
Step 2 of the methodology involves targeting components for redesign that are
common to all member artifacts of the targeted market segmentation grid. Based on
previous redesign experience, the yoke is the major valve component that often requires
modification to respond to specific customer requirements such as loading associated
with an anticipated seismic event, the installation of sensors or controls, and mounting
and support for the specific actuator size and type. As shown in Figure 3-5, the yoke
consists of top and bottom mounting flanges joined by two legs. This example has a
transition neck between the legs and the actuator mounting flange.
Table 3-3: Market Segmentation Grid Artifact Ordinals

48
Step 2 also involves classifying critical design variables and design inputs, which
requires knowledge of the interface of the targeted component with the artifact. A
Design Structure Matrix (DSM) can help define the interface, and Table 3-4 provides a
DSM for a typical gate valve with sufficient detail for defining interfaces. Cells marked
with ‘x’ indicate a structural relationship between the corresponding row and column
parameter entities. The matrix divides the valve into external components, including the
yoke, and internal components. The square boxes identify existing modules, including
the yoke, and the overlapping of the yoke box/module with other boxes/modules help
define important design parameters involved. For instance, the actuator and yoke have a
common flange interface. In addition, x-cells show that the stem and packing assembly
internal components interface with the yoke.
Figure 3-5: Solid Model Views of a Typical Yoke

49
3.2.4 The Baseline Standard
Given the yoke as the single target component, Step 2 continues with the
classification of design variables and the determination of an aggregate design input
specification. For the example, study of the existing design analysis reports, the
underlining analysis methodology, and known specific customer design specifications,
results in a collection of critical design parameters. With respect to yoke design,
specifications generally are concerned with the ability of the valve, and hence the yoke,
Table 3-4: Gate Valve Design Structure Matrix
Para
met
erA
ctua
tor
Act
uato
r-Yok
e B
oltin
gA
ctua
tor-Y
oke
B.C
.Y
oke
Top
Flan
geY
oke
Cro
ss-S
ecto
pmY
oke
Win
dow
Yok
e Le
ngth
Yok
e Bo
ttom
Fla
nge
Yok
e-B
onne
t B.C
.Y
oke-
Bon
net B
oltin
gB
onne
t Top
Fla
nge
Bon
net N
eck/
Shel
lB
onne
t Bot
tom
Fla
nge
Bon
net G
aske
tB
ody-
Bon
net B
.C.
Bod
y-B
onne
t Bol
ting
Bod
y Fl
ange
Bod
y N
eck
Pac
king
Ass
embl
yS
tem
Nut
Ste
m T
hrea
dsS
tem
Len
gth
(stro
ke)
Ste
m-D
isc
Inte
rface
Ste
m B
asic
Dia
met
er
Parameter 1 2 3 4 5 6 7 8 9 10 11 12 13 14 15 16 17 18 19 20 21 22 23 24Actuator 1 o x x x
Actuator-Yoke Bolting 2 x o x x x xActuator-Yoke B.C. 3 x x o x x x
Yoke Top Flange 4 x x o x x xYoke Cross-Section 5 x x x o x x x x x
Yoke Window 6 x x x x o x x x x xYoke Length 7 o x x
Yoke Bottom Flange 8 x x o x x x xYoke-Bonnet B.C. 9 x x x o x x
Yoke-Bonnet Bolting 10 x x x x o x xBonnet Top Flange 11 x x o x xBonnet Neck/Shell 12 x o x x x
Bonnet Bottom Flange 13 x o x x x xBonnet Gasket 14 x o x x x
Body-Bonnet B.C. 15 x x o x xBody-Bonnet Bolting 16 x x x o x
Body Flange 17 x x x x o xBody Neck 18 x o x
Packing Assembly 19 x x x x x x o x xStem Nut 20 x o x x
Stem Threads 21 x o xStem Length (stroke) 22 x x x x x o x Stem-Disc Interface 23 x o
Stem Basic Diameter 24 x x x x x x o
Ext
erna
l Stru
ctur
eIn
tern
al S
truct
ure
External Structure Internal Structure

50
to survive plant vibration and accident scenarios, and the most severe loading is
associated with a seismic event. Typically, valves must be designed rigid with respect to
attached piping, and this imposes a natural frequency requirement. In addition, many
valves are classified as ‘active’ in that the actuator must be capable of operating the valve
during a seismic event, and thus actuator induced loading is considered. Therefore, the
project focus is with yoke strength (i.e., stress) under combined seismic and actuator
induced loading and natural frequency. Another focus is toward motor actuated valves,
as they have been specified in a majority of past projects.
The current design analysis methodology employs Microsoft Excel™
spreadsheets and Microsoft’s Visual Basic for Applications macros, and Table 3-5 shows
a portion of one such spreadsheet. Critical input associated with the yoke component
design are noted, and these include (1) input associated with the actuator including
weight and center of gravity, (2) input associated with yoke geometry including yoke leg
cross-section geometry and leg length, (3) input associated with the valve pressure class,
which is a market segmentation grid distinction, including pressure and differential
pressure, and (4) input associated with the aggregate of custom design specification
requirements including seismic loading, natural frequency limit, temperature, and yoke
material.

51
Table 3-5: Portion of a Sample Analysis Input Form for Artifact 2: Size 4, Class 150 Double Disc Gate
LOAD CASE pressure class 150 (3) calc pressure [psi] 290 (3) default temp. [OF] 100 (4) Actuator Torque [in-lb]
1000 (1)
Actuator Thrust [lb] 8000 (1) Seismic Load [g’s] 11. (4) frequency limit [Hz] 33 (4)
Actuator Yoke Legs
Bonnet Neck
Body Neck
MODEL ELEMENTS
Flange, Stem
Packing Assy.
Flange, Disc Pack
W [lb] 149 (1) 20 25 35 W' [lb] 30 5 45 L [in] 7 (1) 7.5 (2) 4.5 9 E [msi] X [in] 4.6 (1) CROSS-SECTIONS 1 2 3 Code 1 (2) 12 14 A [in] 2.625 (2) 1.5 3.469 B [in] 3.5 (2) 0.75 2.25 C [in] 0.611 (2) 2.375 2.938 D [in] 1.125 1.719 COMPONENT CASE
section or node 1 component code 5 9 23 51 45 Analysis Code R R R RZ R 1: Description Yoke Stem DD Drawing Mat'l Funct. 8 (4) 21 A 1 4.4 B 4 1 C 2 0.35 D 320 E F 290 (3) G 2 290 (3)

52
It is well known by experience that the noted parameters significantly affect
required yoke leg size, and although the parameters are segregated into categories, all
requirements have their origin from design specifications in practice. The segregation is
convenient for defining the source of the parameters with respect to the process of
classifying input. For instance, the actuator must be properly sized to operate the valve,
and the redesign effort employs existing sizing methodology to determine aggregate
actuator parameters, including the basic actuator size; this process is automated for the
project, and the given sample input form includes resulting actuator parameters of weight,
center of gravity, and thrust and torque. In addition, the sample spreadsheet includes the
four chosen aggregated custom specification inputs, which are judged to reasonably meet
past project requirements yet not result in ill proportioned yokes.
Appendix A provides a sample design analysis that describes the underlying
methodology and presents calculation details. This sample uses the parameters of
Table 3-5 as input, and further describes aggregated custom specification input, actuator
sizing methodology, stress and natural frequency determination, and generally describes
input and results parameters. In addition, aggregate custom specification acceptance
criteria are described that includes allowable stress criteria and minimum natural
frequency limit.
The baseline standard is developed by preparing a spreadsheet similar to the given
example for each artifact of the targeted market segmentation grid per Table 3-3.
Although the artifacts are chosen based on those judged to best meet the developed
aggregate performance requirements, this is not a strict requirement. In fact, it is
important to permit artifacts that are infeasible (i.e., that do not meet the aggregate

53
specification) because there is no guarantee that a feasible artifact exists in every case.
Note that in the sample spreadsheet, parameters without an attached note are static as
they are associated with valve components other than the yoke. However, they can affect
the yoke design; for instance, the weight and length of other components can affect
overall valve natural frequency which is a consideration when designing a yoke.
Spreadsheet data is condensed with respect to what might normally be addressed
with a production valve. Input associated with component analysis unrelated to the core
objective of yoke redesign is removed. For instance, the input associated with the
analysis of flanges, the stem, and the wedge is removed. However, it is important to
address actuator and yoke mounting interfaces in the baseline standard redesign strategy.
3.2.5 New Performance Functions
Step 3 of the proposed methodology involves defining critical performance
functions from existing and new design processes as appropriate. In this example, most
critical performance functions were defined previously during the baseline standard
development. However, the existing design process lacks an adequate costing procedure,
which is important for any redesign strategy since the goal is to improve cost. Then, as
proposed by the component-based platform redesign methodology, a new Activity-Based
Costing model is developed.
For this example, the cost model is needed during the final step of the
methodology (Step 5) when the product platform portfolio is created by stretching and
scaling a subset of candidate component product platforms. The methodology is

54
presented in the next chapter for product platform portfolio optimization, and creation of
a portfolio for the example problem is saved until then. Therefore, presentation of the
cost model is also reserved until the next chapter.
Although creation of the product platform portfolio is the last part of Step 5,
strategy for redesigning the baseline standard, which is the beginning part of Step 4, must
look forward to portfolio creation and the corresponding strategy for stretching and
scaling component platforms.
3.2.6 Baseline Standard Redesign Strategy
The redesign strategy consists of two parts as described below. The first part is a
strategy for stretching and scaling a component platform so that it can be used on
multiple artifacts, which is required for the final part of Step 5. The second part is a
strategy for creating a yoke component class, which is part of Step 4.
3.2.6.1 Component Platform Stretching and Scaling Strategy
A candidate yoke component platform must be capable of interfacing with
multiple artifacts, i.e., stretched and/or scaled, and the part of the component platform
redesign strategy that addresses this is a yoke casting pattern modular architecture. Two
potential architectures are proposed as shown in Figure 3-6, and these are similar except
for the yoke mounting flange interface. With the module model, it is proposed to employ

55
multiple casting pattern change pieces, which is a common casting pattern modification
technique, and with the stretched model, the flanges are machined out of common stock.
Both models assume the yoke leg length is stretched to accommodate the practical
need of the valve artifact using casting pattern change pieces, and both assume the pre-
existence of actuator mounting flange yoke casting pattern change piece modules.
Although it is appropriate to study the cost of implementing different actuator mounting
schemes, the example is kept simple and does not address this. Notice that when only
one artifact is involved, both models reduce to the same scheme. Which model is best
will be decided by cost analysis, and as stated earlier, this is addressed in the next chapter
using ABC.
MODULE MODEL
STRETCHED MODEL
Modular Actuator Mounting Flanges
Scaled Yoke Legs
Stretched Base Flange
Modular Base Change Pieces
Figure 3-6: Module and Stretched Yoke Component Platform Models

56
3.2.6.2 Component Class Design Strategy
The baseline standard artifacts contain yoke legs with variously shaped cross-
sections, and it is desired to design the legs around the common shape shown in
Figure 3-7. The figure shows the design variables, a, b, c, that effect critical
performance, including valve fundamental natural frequency of vibration and yoke leg
stress.
Then, a yoke component class consists of yoke legs shaped as shown in
Figure 3-7 and a yoke casting pattern modular architecture that can be stretched and
scaled to interface with multiple artifacts. The three parameters a, b, c given in
Figure 3-7 are the design variables for a standard optimization problem, which is solved
for each baseline standard artifact resulting in component class instantiations.
ab
c
Figure 3-7: Generalized Yoke Legs Cross-Section

57
3.2.7 Yoke Leg Cross-Section Optimization
For this example, the goal is to minimize yoke leg cross-section area yet satisfy
aggregate performance constraints consisting of allowable stress limits and minimum
allowed natural frequency, and the corresponding optimization problem is given by
Eq. 3.1.
Minimize: F = A(X) + (f1(X) + f2(X)) – (σ1(X) + σ2(X))
Subject to: P1 = (1 - f1(X) / fMIN) < 0 P2 = (1 - f2(X) / fMIN) < 0 P3 = (σ1(X) / SA - 1) < 0
P4 = (σ2(X) / SA - 1) < 0 B1 = aMIN – a < 0 B2 = a - aMAX < 0
B3 = a+b - rMAX < 0 X > 0
Where: F = Objective Function
X = Design Variables (a, b, c) per Figure 3-7 A = Yoke Leg Cross-Section Area
f1, f2, = Beam/Frame Mode Natural Frequencies σ1, σ2 = Beam/Frame Mode Principal Stress
fMIN = Natural Frequency Limit (33 Hz) SA = Allowable Stress Limit (26.25 ksi)
P = Performance Constraint B = Bounds Constraint
a = Yoke Leg Inside Radius (see Figure 3-7) b = Yoke Leg Thickness (see Figure 3-7)
rMAX = Maximum Allowed Yoke Leg Outside Radius
3.1

58
All parameters except fMIN and SA, which are common aggregate performance
constraint parameters, are different for each artifact, and are therefore all functions of the
artifact ordinal as defined in Table 3-3. For each artifact, the natural frequency
constraint, fMIN, is 33 Hz, and the maximum allowable stress limit, SA, is 26.25 ksi. The
presence of the performance parameters f and σ in the objective function force the
solution to satisfy the aggregate performance constraints as close as possible to their
limits. When cross-section area is expressed in square inches, natural frequencies are
expressed in Hertz, and yoke leg stresses are in ksi, each term in the objective function
are approximately equal in magnitude, which implies that area, natural frequency, and
stress have equal importance with respect to objective function value. Meanwhile, the
bounds constraints on the design variables, B, ensure proper fit of the yoke on the
corresponding artifact and vary as summarized in Appendix B.1. Fit is governed by the
size and type of the connection such as a flanged or clamped connection, and the
optimized yoke must conform to the artifact’s existing connection design.
The optimization problem is solved for each artifact of the targeted market
segmentation grid, and what results is a collection of candidate component platforms, and
the design variables (a, b, and c), which define the candidate component platforms, are
given in Appendix B.2. Details regarding the solution phase follow, and this completes
the first part of Step 5. The final part of Step 5 is the creation of a product platform
portfolio consisting of a subset of the candidate component platforms; however, this is
not presented here as Chapter 4 presents the methodology for this. At this point, though,

59
it is helpful to realize that any developed candidate component-based platform can be
used potentially as a platform for any market segmentation grid artifact.
Each artifact’s yoke leg cross-section size is optimized using the Solver Add-in
from Microsoft Excel™. It is desired that the resulting cross-section dimensions have a
specified precision, i.e., lengths in eighth-inch increments and angles in five-degree
increments, and the integer programming capabilities of the Excel Solver add-in make
this possible. In addition, Microsoft Excel™ is used to perform calculations and store
platform design parameters, and a Microsoft Access™ database is used to track
optimization statistics. A single workbook contains a collection of spreadsheets, with
each similar to the Table 3-5 example presented previously, and other workbooks contain
macros used to access performance and to conduct the optimizations.
Although the source of the data that defines the baseline standard is primarily
from spreadsheets similar to the example in Table 3-5, a significant amount of data
manipulation is required to build the collection of baseline standard spreadsheets and to
setup the Excel Solver optimization problems. Some manual manipulation is involved,
but a significant portion was performed using a Microsoft Access™ database under the
control of Microsoft Visual Basic for Applications™ macros, which can access both
databases and spreadsheets through object-oriented programming. Although the data
manipulation and programming effort is somewhat laborious, the details do not contribute
significant insight into the example problem. However, it is worth noting that the
manipulation was performed using readily available tools and standard programming
techniques.

60
The Excel Solver optimization is performed through a combination of user
defined spreadsheet functions and automatic setup of Solver’s parameters. Table 3-6 and
Table 3-7 demonstrate how setup data appears in sheet cells, and also how the
corresponding user functions are applied for the objective function, design variables, and
constraints. For consistency, the presented data is based on the same artifact that is
addressed in Table 3-5 (i.e. Artifact 2: Size 4, Class 150 Double Disc Gate Valve). Note
that range names are employed, and column headings give column range names in
parentheses.
Table 3-6: Example Spreadsheet Portion Showing Design Variables and Objective Function
Design Variable and Objective Function Objective
Function (F) Design
Variables (X) DV Integer
Conversion (XI) Lower Bound on XI (XL)
Upper Bound on XI (XU)
76.84895527 2.375 19 10.5 21 0.625 5 5 20 0.523596 6 5.993170436 17.99097052
Design Variable/Objective Underlying Formulae
Objective Function (F) Design Variables (X) DV Integer Conversion
(XI)
Lower Bound on XI (XL)
Upper Bound on XI (XU)
=engine1.xls!Fsolver(X) =INDEX(X,1)*0.125 19 10.5 21 =INDEX(X,2)*0.125 5 5 20 =INDEX(X,3)*0.087266 6 5.9932 17.991

61
The Solver Add-In can be accessed through object-oriented programming, and
Figure 3-8 is a subroutine listing that is employed to perform the setup. In this routine,
‘Xrange’, ‘Grange’, and ‘Frange’ correspond to the ‘X’, ‘G’, and ‘F’ range names
defined above, ‘Optx’ is an implementation of a class construct that manages the database
for a market segmentation grid artifact. The optimization is conducted as follows: for
each artifact, an Optx object is created, the optimization is performed by calling the listed
Table 3-7: Example Spreadsheet Portion Showing Constraints
Constraints
Constraints (G) Limits on G (Z) Description of G
-0.331809524 <= 0 beam stress -0.108571429 <= 0 frame stress -0.716666667 <= 0 beam frequency -0.799393939 <= 0 frame frequency -0.05681363 <= 0 minimum window width
0 <= 0 max. inside rad. -1.0625 <= 0 min. inside rad. -0.4375 <= 0 max. inside rad.
0 <= 0 max. outside rad.
Constraints Underlying Formulae
Constraints (G) Limits on G (Z) Description of G
=engine1.xls!Gsolver(1,X) <= 0 beam stress =engine1.xls!Gsolver(2,X) <= 0 frame stress =engine1.xls!Gsolver(3,X) <= 0 beam frequency =engine1.xls!Gsolver(4,X) <= 0 frame frequency
=-INDEX(X,1) * COS(INDEX(X,3)) + 2 <= 0 minimum window width =0 <= 0 max. inside rad.
=-INDEX(X,1)+1.3125 <= 0 min. inside rad. =+INDEX(X,1)-2.8125 <= 0 max. inside rad.
=0 <= 0 max. outside rad.

62
routine, results are saved to the management database through the Optx object, and then
the Optx object is destroyed in preparation for the next artifact.
The optimization of all baseline standard artifacts yields a set of candidate
component platforms, and each candidate is defined by the resulting optimal cross-
section design variables and the baseline standard redesign strategy discussed previously.
As the last part of the final step (Step 5), a product platform portfolio is created from a
subset of the candidates. As mentioned previously, however, the next chapter provides
additional methodology for determining an optimal subset of component platforms, and
thus, detailed discussion of product platform portfolio creation is delayed until then along
with further detail regarding creation of the example candidate component platforms.
Sub Do_Solver(Xrange As Range, Grange As Range, Frange As Range, Optx As Object, MSG As String) SOLVER.SolvReset 'setup basics(F And X) SolverOk SetCell:=Frange.Cells(1, 1).Address, MaxMinVal:=2, ByChange:=Xrange.Address 'setup natural constraints For i = 1 To Optx.nG SolverAdd CellRef:=Grange.Cells(i, 1).Address, Relation:=1, FormulaText:=Grange.Cells(i, 3).Address Next 'setup DV bounds For i = 1 To Optx.nX SolverAdd CellRef:=Xrange.Cells(i, 1).Address, Relation:=1, FormulaText:=Xrange.Cells(i, 3).Address SolverAdd CellRef:=Xrange.Cells(i, 1).Address, Relation:=3, FormulaText:=Xrange.Cells(i, 2).Address Next 'setup precision conversion (integer constraints) For i = 1 To optx.nX If Optx.precision(i) Then SolverAdd CellRef:=Xrange.Cells(i, 1).Address, Relation:=4 Next 'solve it! SolverSolve True MSG = "SOLVER OK" End Sub
Figure 3-8: Excel Solver Automatic Setup Subroutine

63
3.3 Chapter Summary
This chapter presents a methodology for redesigning an existing line of low
volume highly customized product using a bottom-up product platform development
approach that is based on the PPCEM. Rather than redesign an entire product line, the
focus is toward the redesign of a limited set of components with the highest potential for
cost savings, and when applied across the product line, a component-based product
platform portfolio results.
A five-step method is presented in Table 3-1 where the generalized Top-Down
PPCEM is presented along side the Bottom-Up methodology specific to component-
based product platform portfolio redesign. The five-step methodology is presented on its
own in Table 3-8, and it is best described by three phases of redesign team activity: (1)
the data collection phase, (2) the baseline standard development phase, and (3) the
platform portfolio development phase. In Phase 1, design knowledge and history is
collected about every aspect of the existing product line, and this information is needed to
carry out all five steps of the methodology. Phase 2 is the development of a baseline
standard product line that provides a reference to compare with any redesign effort, and
this involves defining a targeted market segmentation grid, which is Step 1, and defining
targeted components for redesign, aggregating design inputs, and defining the baseline
standard, which is Step 2. Phase 3 is the development of targeted component classes that
are then instantiated to yield candidate component platforms, which is part of Step 5, and
as precursors, Step 3 involves the definition of critical component performance functions,

64
and Step 4 involves developing a baseline standard redesign strategy around common
component classes.
Given a set of candidate component platforms, a product platform portfolio is
created by replacing baseline standard components with a select subset of candidate
platforms by stretching and/or scaling key platform parameters. Although no strategy is
given in this chapter for determining the subset of candidate platforms, Chapter 4
provides a methodology for creating a product platform portfolio from a subset of
component platforms that optimizes the cost effectiveness of the portfolio.
The methodology is illustrated with an example involving the redesign of yokes
on a product line of nuclear-grade valves. The valve product line is introduced and
component platform redesign methodology is applied step-by-step. A targeted market
Table 3-8: Bottom-Up Component-Based Platform Redesign Methodology
Phases Step Step Description
1 & 2 1 Create the market segmentation grid based on past sales and sales projections, target portions of the existing product line with the highest sales potential.
1 & 2 2
Target common components for redesign that often require modification. Classify critical design parameters from existing design data, and determine design inputs from an aggregate of known custom design specifications. Define a baseline standard product line from existing designs that span the target grid.
1, 2 & 3 3
Define component critical performance functions from existing and new design methodology as appropriate. Screening experiments may help reduce the number of required factors.
1 & 3 4 Develop a baseline standard redesign strategy around common component classes and corresponding standard optimization problems.
3 5
Develop candidate component platforms by instantiating the component classes across the market segmentation grid, and then define a product platform portfolio by scaling/stretching a subset of the candidate component platforms.

65
segmentation grid is defined, a baseline standard product line is defined from existing
artifacts and from existing product knowledge, a redesign strategy is presented involving
a yoke component class and two alternative yoke mounting interface models, and finally,
the yoke component class is instantiated for each member of the targeted market
segmentation grid to yield a set of candidate component platforms. The example is
continued in Chapter 4 where a valve product platform portfolio is created based on a
subset the candidate platforms, and further detail is given regarding creation of the
candidate platforms.

66
Chapter 4
Component-Based Product Platform Portfolio Optimization
Application of the component platform design methodology presented in
Chapter 3 results in a set of candidate component platforms, and the final step is to define
a component-based product platform portfolio by scaling/stretching a subset of the
candidate designs, but no methodology is presented there for choosing the subset. In this
chapter, this final step is addressed with a proposed product platform portfolio
optimization procedure for determining a component platform subset that spans the
targeted market segmentation grid most cost effectively.
The goal of the component-based product platform portfolio optimization
procedure is to minimize manufacturing cost without sacrificing product performance or
customer perceived variety. The proposed methodology is a four-step process that is
described in detail in the next section. Then, the yoke leg component platform redesign
example from Section 3.2 is continued, and several component-based product platform
portfolios are created. An example is given in Section 4.2 that is kept simple in order to
demonstrate the four-step process in clear detail, and a portfolio is created that minimizes
the number of component platforms required to span the market segmentation grid, thus
maximizing commonality. This example is considered simple because no component
stretching or scaling is required, and no cost model is required. In Section 4.3, a cost
model is developed prior to portfolio creation based on the ABC methodology presented
in Section 4.3.1, which is customized to the example, and then two portfolios are created

67
with the realistic objective of minimizing manufacturing cost. The two developed
portfolios address the two stretching/scaling strategies proposed in Section 3.2.6, and the
winning strategy is revealed as the one that is most cost efficient. Finally, Section 4.4
presents a chapter summary.
The methodology does not rely on the traditional vertical, horizontal, or
beachhead market segmentation grid leveraging strategies illustrated in Figure 2-4.
Rather, it employs an unconstrained leveraging strategy, which is especially beneficial
when applied to an existing product line that was develop one-at-a-time time such that
artifact designs are inconsistent from one to another. For example, a simple twelve-
artifact valve yoke component platform is illustrated in Figure 4-1, which demonstrates
how a single component platform from sample artifact 5 is leveraged three times. The
three variants can be placed anywhere in the market segmentation grid by
stretching/scaling the component platform, and it is the task of the four-step optimization
process to determine both the number of component platforms to use and their placement
within the grid that is most cost effective.

68
4.1 The Four-Step Process
As a precursor, we assign an ordinal (i) to each artifact in the market
segmentation grid. Then, the grid is symbolized by an array (S) with n members, and the
elements of S contain sequential numbers from 1 to i to n. At a minimum, a design
strategy must exist that can be implemented on artifact i to determine optimal critical
component design parameters (Xi*) that yield an optimal objective function (Fi
*).
Although the four-step process is used as a product platform portfolio solver for
the component-based platform redesign methodology, it is presented generically as a
stand-alone procedure. Then, any procedure assumptions are inherently met by the
Figure 4-1: The Unconstrained Leveraging Strategy
MARKET SEGMENT GRID ARTIFICAT NUMBERS
1 2 3 4
5 6 7 8
Perf
orm
ance
T
ier
9 10 11 12
Market Segment USED COMPONET PLATFORMS
3 11 3 4
5 3 5 8
Perf
orm
ance
T
ier
5 10 11 4
Market Segment YOKE COMPONENT PLATFORM #5
GRID ARTIFACT #5
Tier Pressure ClassMarket Segment Valve Size
STRECHED/SCALED VARIANTS
MARKET SEGMENTATION GRID ARTIFACT NUMBERSMARKET SEGMENT GRID ARTIFICAT NUMBERS
1 2 3 4
5 6 7 8
Perf
orm
ance
T
ier
9 10 11 12
Market Segment USED COMPONET PLATFORMS
3 11 3 4
5 3 5 8
Perf
orm
ance
T
ier
5 10 11 4
Market Segment YOKE COMPONENT PLATFORM #5
GRID ARTIFACT #5
Tier Pressure ClassMarket Segment Valve Size
STRECHED/SCALED VARIANTSSTRECHED/SCALED VARIANTS
MARKET SEGMENTATION GRID ARTIFACT NUMBERS

69
component-based platform redesign methodology. For instance, component-based
platform redesign also requires the definition of market segmentation grid artifacts and a
component redesign strategy.
Description of the four steps of the proposed optimization procedure follows.
4.1.1 Step1: Determine Optimal Component Solutions
The first step is to determine an optimal component solution for each member (i)
of the market segment grid. Each solution is a candidate component platform and
consists of an optimal objective function (Fi*), an array of optimal design variables (Xi
*),
an array of design value constraints associated with performance (Pi), and an array of
constraints (Bi) associated with the upper and lower bounds on Xi. The Xi* array, and the
means to reformulate the constraint equations Bi and Pi are saved for subsequent steps.
The method assumes that the optimal product platform portfolio consists of a subset of
the resulting optimal designs. This step mimics the two-step approach first advocated by
Nelson, et al. (2001) and then refined by Fellini, et al. (2005a; 2005b) who first optimize
the individual products – to determine what the best possible performance is for each
product when there is no commonality – before optimizing the family of products (i.e.,
their commonality), which is performed in Steps 3 and 4 of this methodology.
It is not necessary that the resulting designs are globally optimal, as this can be
difficult to achieve and prove in general practice because of problem complexity such as
ill-behaved functionality or quickly changing market needs. Rather, what are required
are feasible designs along with a methodology for assessing feasibility of design variable

70
constraints and performance constraints. For instance, it is acceptable to start with
existing artifact component designs as long as the methodology exists, or is developed,
and the existing designs are feasible. Generally, the goal of any engineering design
problem is to obtain and employ the best available solution, and in this paper, the term
‘optimal design’ is considered synonymous with ‘the best available solution’.
Application of the component platform redesign methodology from Chapter 3
yields a set of candidate component platforms that meet the requirements of Step 1.
Specifically, component class development described in Section 3.1.3 includes a standard
optimization problem with design variables, an objective function, and performance and
bounds constraints that meet the criteria described above. The resulting candidate
component platforms have a potential advantage over other candidate designs, such as
components from a baseline standard product line, because they were created from a
common component class that includes a stretching/scaling strategy for instantiating the
component on multiple artifacts, which greatly enhances the potential for leveraging
opportunities.
4.1.2 Step 2: Feasibility Testing
For each optimal component, Step 2 is to test the feasibility of using it as a
platform on each market segment member. Assuming the bounds and performance
constraints are in standard form, i.e., the value of the constraint function is less than or
equal to zero when the constraint is satisfied, an optimal component (component j) is a

71
candidate component product platform for a market segment member (member i) when
Eq. 4.1 is satisfied.
Given the n market segment members and the corresponding n optimal
components, (n2 – n) tests are required, where n-1 component feasibility tests are
associated with each of the n market segment members. Notice that testing a component
against its own source member is not required as its feasibility is assured in advance.
Then, any one test involves inserting each component’s optimal solution design variables
Xj* into each market segment member i’s constraint equations Bi and Pi, and assessing
whether the constraints are satisfied. That is, Step 2 involves testing whether Xj* is a
feasible solution to member i’s optimization problem for all j not equal to i.
The best approach that results in efficient feasibility testing is to examine each
artifact (i) in turn so that each optimization problem from Step 1 is reformulated just
once. In order to further save computing effort, each component (j) is tested in two
phases. In Phase 1, test only the bounds constraints (Bi), and in Phase 2, test the
remaining constraints (Pi). The two-phase testing procedure can save effort because
bounds constraint equations are typically simpler than performance constraint equations,
which may involve complex analyses. For instance, performance constraint evaluation
may require solving a complex finite element model to determine some physical
parameter such as a stress level, a flow rate, or a frequency response to name just a few.
It is likely that the required number of more expensive tests (Phase 2) is only a fraction of
the required number of Phase 1 tests, which is n-1. Then, despite the (n2 – n) required
Xj* ∈ { Xi | Bi(Xi) < 0 and Pi(Xi) < 0 } 4.1

72
tests, the methodology has potential for successful application on problems with a large
number of artifacts. Similar two-phase approaches are used in other disciplines when the
computational expense of some analyses is high. In the aerospace community, for
instance, lower fidelity models that are inexpensive to compute are first used to reduce
the design space or identify a “reasonable” design space before invoking higher fidelity
models that are much more expensive to compute to perform analyses in that reduced
region (Balabanov, et al. 1999; Knill, et al. 1999).
4.1.2.1 Step 2, Phase 1: Bounds Feasibility Test
In Phase 1, the bounds constraints are tested for feasibility without regard for
performance feasibility, and this postpones reformulation of the complete optimization
problem until needed during the Phase 2. For each artifact, n-1 bounds tests are
required, and what results is a collection of bounds-feasible candidate component
platforms. Let the resulting number of bounds-feasible candidates equal nB, then this
number can range from one (i.e. only the artifact’s own platform is feasible) to n (i.e all
candidate platforms are bounds-feasible), but it is probable that the resulting number is
significantly less than n.
4.1.2.2 Step 2, Phase 2: Performance Feasibility Test
In Phase 2, only the bounds-feasible candidate component platforms from Step 1
are tested for performance constraint feasibility. Although evaluation of performance

73
constraints may involve costly computations, the effort is reduced since Phase 1 testing
has eliminated bounds-infeasible candidates. Performance constraint equations need to
be formulated only once for each artifact, and each bounds-feasible candidate test is a
load case that is solved for performance feasibility. What results is a further reduced set
of candidates, let the set quantity equal nP, that are both bounds-feasible and
performance-feasible, and nP can range from one (i.e., only the artifact’s own platform is
feasible) to nB (i.e., all bounds-feasible platforms are also performance-feasible). Notice
that if nP equals one, any product platform portfolio must include this artifact’s
component platform.
4.1.3 Step 3: Optimization Problem Formulation
For Step 3, an optimization problem is formulated, and its solution is a
component-based product platform portfolio. From the previous step’s results, we
construct arrays of candidate platforms (Cj) for each optimal component (j), and then
each Cj contains the grid member ordinals (i) for which the component (j) satisfies
constraints. Then, the component portfolio platform design variables (XP) consist of n
elements, one for each component (j). The value of a portfolio platform design variable
(XPj) equals the index into the component’s Cj array. Each element of XP is bounded
from one to the size of Cj. The design variables define which component is used as a
platform for each grid member such that the n used platforms are given by C(XP).
The goal in the optimization process is to minimize the cost of implementing the
resulting component product platform portfolio without jeopardizing its ability to meet

74
performance objectives. In general then, achieving this goal involves a tradeoff between
cost and performance, and the methodology assumes that a single tradeoff metric (T) can
be formulated that adequately measures this objective. Given the assumption from Step 1
that the component product platform portfolio consists of a subset of the optimal artifact
component designs, T can be expressed as a function of the used component platforms
given by C(XP). The generalized optimization problem is thus stated in Eq. 4.2.
The majority of product platform design methodology assumes that maximizing
commonality is a surrogate for minimizing cost (Simpson 2005). If this assumption is
employed, then any of the commonality indices available in the literature (see Thevenot
and Simpson (2006) for a recent review) can be used for the tradeoff metric (T) when a
more sophisticated metric or cost model is not available. In fact, Khajavirad and
Michalek (2007) recently argued that the commonality index (CI) introduced by Martin
and Ishii (1997) captures the tooling cost savings of component commonality better than
other commonality metric. If we use this index as our starting point, then an effective
tradeoff metric (T) for our problem is N – where N is the number of unique ordinals in
C(XP) – since we are dealing with a component platform (i.e., a single component that is
standardized across as many market segments as possible. For instance, if C(XP) equals
{1, 2, 1, 3, 2}, then N equals 3.
Minimize T(XP)
Subject to the upper and lower bounds on XP. 4.2

75
4.1.4 Step 4: Optimization Problem Solution
In Step 4, the optimization problem is solved. Finding a solution requires a zero-
order algorithm such as the Simulated Annealing (SA) Algorithm or the Genetic
Algorithm (GA), which is capable of addressing integer design variables. Given the
optimal solution (T*), the components to use as platforms are given by the unique
ordinals in C(XP*), and the platforms to use for each grid member is given by C(XP*).
The solution to Eq. 4.2, which is denoted as T*, can have two extremes depending
on the tradeoff metric employed. If T is taken as a commonality index as discussed in the
previous step, then the solution, N*, denotes the number of component platforms needed
to span the market segmentation grid. The other extreme occurs when T is so biased
toward performance constraints that no commonality is achievable. In this case, the
resulting component platform portfolio is defined by C(XP*)=i for every artifact i, which
is referred to as the null platform (Nelson, et al. 2001) in that there is no suitable level of
commonality within the product family for the market.
4.2 Maximum Commonality Component Product Platform Portfolio Example
Implementation of the four-step process is demonstrated using the yoke
component platform redesign example from Section 3.2. The example is kept simple in
order to demonstrate the four-step process in clear detail in that no component stretching
or scaling is included, and as such, no cost model is required. What results is a
component-based product platform portfolio that minimizes the number of component

76
platforms required to span the market segmentation grid, thus maximizing commonality
in the portfolio.
The market segmentation grid ordinals from Table 3-3 define artifact ordinal
numbers from 1 to 60, and the optimization problem defined in Section 3.2.7 is a design
strategy for determining critical yoke leg design variables for the yoke redesign strategy,
and these provide the required precursors for the four-step process.
4.2.1 Step 1: Determine Optimal Yoke Leg Cross-Sections
As described in Section 3.2.7, each artifact’s yoke leg cross-section size (defined
by the variables a, b, and c) was optimized using Excel’s Solver Add-in, which results in
the collection of candidate component platforms given in Appendix B.2. Then, resulting
optimal designs are instantiated on each artifact of the baseline standard. What results is
a collection of 60 spreadsheets similar to the example given in Table 3-5 except yoke leg
input, which is noted by ‘(2)’ in the table, is replaced with the optimal solution.
Table 4-1 shows the portion of the Table 3-5 example baseline standard
spreadsheet that is instantiated with the resulting optimal cross-section data, and
Table 4-2 gives corresponding results needed to determine the value of the objective
function F2*. Notice that design variables a, b, and c are as denoted in Figure 3-7,
whereas parameters A, B, and C in Table 4-1 are as denoted in Figure A-2 according to
the Appendix 2 cross-section property calculation methodology. In addition, notice that
design variable b equals yoke leg thickness, whereas parameter B equals the yoke leg
outside radius (i.e., B = a + b), and using thickness as the design variable assures positive

77
yoke leg area solutions. Finally, notice that the results needed to determine the objective
function for the baseline standard artifact 2 are contained in Appendix A. For
comparison, the objective function value for the baseline standard equals 110.0 and for
the candidate component platform, the value is 81.8.
4.2.2 Step 2, Feasibility Testing
For any given artifact, only the candidate yoke component platforms that satisfy
performance and bounds constraints for that artifact are feasible platforms for
Table 4-1: Instantiated portion of the Sample Input Form (Artifact 2: Size 4, Class 150 Double Disc Gate)
CROSS-SECTIONS 1 Code 1 A [in] 2.625 B [in] 3.375
C [rad] 0.5236
Table 4-2: Instantiated portion of the Sample Input Form (Artifact 2: Size 4, Class 150 Double Disc Gate)
Analysis Criteria Calculated Limit Units Beam Mode Natural Frequency FN>33. 57.56 60. Hz Frame Mode Natural Frequency FN>33. 63.91 60. Hz Beam Mode Yoke Legs σMAX<1.5SA 17.03 26.25 ksi Frame Mode Yoke Legs σMAX<1.5SA 24.97 26.25 ksi Yoke Cross-Section Area n/a 2.356 n/a in2

78
instantiation on that artifact. In Step 2, each of the 60 candidate yoke component
platforms are tested for potential (i.e., feasible) instantiation on each of the 60 artifacts.
As proposed by the methodology, the testing is conducted in two steps.
4.2.2.1 Step 2, Phase 1: Bounds Feasibility Test
During the optimization process in Step 1, optimal yoke leg parameters (a, b, and
c) are instantiated in the 60 spreadsheets, and bounds constraints (B1, B2, and B3) for the
60 valves are stored in a database table for use in this step. For the first test phase, each
member is tested in turn for bounds constraint feasibility with cross-section parameter
input equal to the optimal parameters from all other members. Each member requires 59
tests (the member’s own optimal parameters are feasible by definition), and so a total of
3540 tests are required (= 602 - 60). If the bounds constraints are satisfied, then that
cross-section represents a candidate platform, and a one "1" is assigned to a test result
variable; otherwise, zero "0" is assigned. A star “*” is assigned to the test variable for a
member’s self-parameter test. For each member, test results are stored in a character
string of length 60, and the sequential row upon row combined results for the 60 valve
members yields a square matrix of dimension 60, with ones or zeros off diagonal, and
stars along the diagonal. Although many tests are required (3540), this sub-step takes
little time because reformulation of the optimization problem is not required.

79
4.2.2.2 Step 2, Phase 2: Performance Feasibility Test
In Phase 2, each candidate (i.e., those corresponding to a "1" from the matrix) is
tested to determine if the performance constraints (P1 through P4 in Eq. 3.1) are satisfied.
Because performance constraints are involved, reformulation of the optimization problem
is required, but only once for each artifact. Although the reformulation can be time
consuming, the test needs to be conducted over only these candidates – not every entry in
the matrix. If the candidate meets the constraints, then the test matrix entry is marked
with "2". Once complete, the final candidates are those marked with "2" or “*”.
For this example, the resulting matrix is shown in Appendix D.1. Note that of the
3540 required Phase 1 feasibility tests, only 1250 tests are required during Phase 2; thus,
only 35% of the candidates need to be evaluated with the more expensive analyses in
Phase 2. Phase 2 testing yields 734 feasible candidates (those marked with either “2”
or *”).
Table 4-3 shows five examples of Step 2 feasibility tests for artifact 15, which
corresponds to the size 6 class 600 double disc gate valve according to the numbering
scheme from Table 3-3. These sample tests correspond to the boxed and shaded region
shown in Appendix C. The table includes data to verify the given bounds constraints, but
notice that constraint B2 is not applicable for this artifact (i.e., design variable a is
unconstrained in the upper limit). As can be seen, candidate component platforms 2 and
5 fail to meet the bounds constraints, and thus these two candidates are no longer
considered. Evaluation of the performance constraints for the remaining candidates 1, 3,
and 4 involve determining valve extended structure natural frequencies and yoke leg
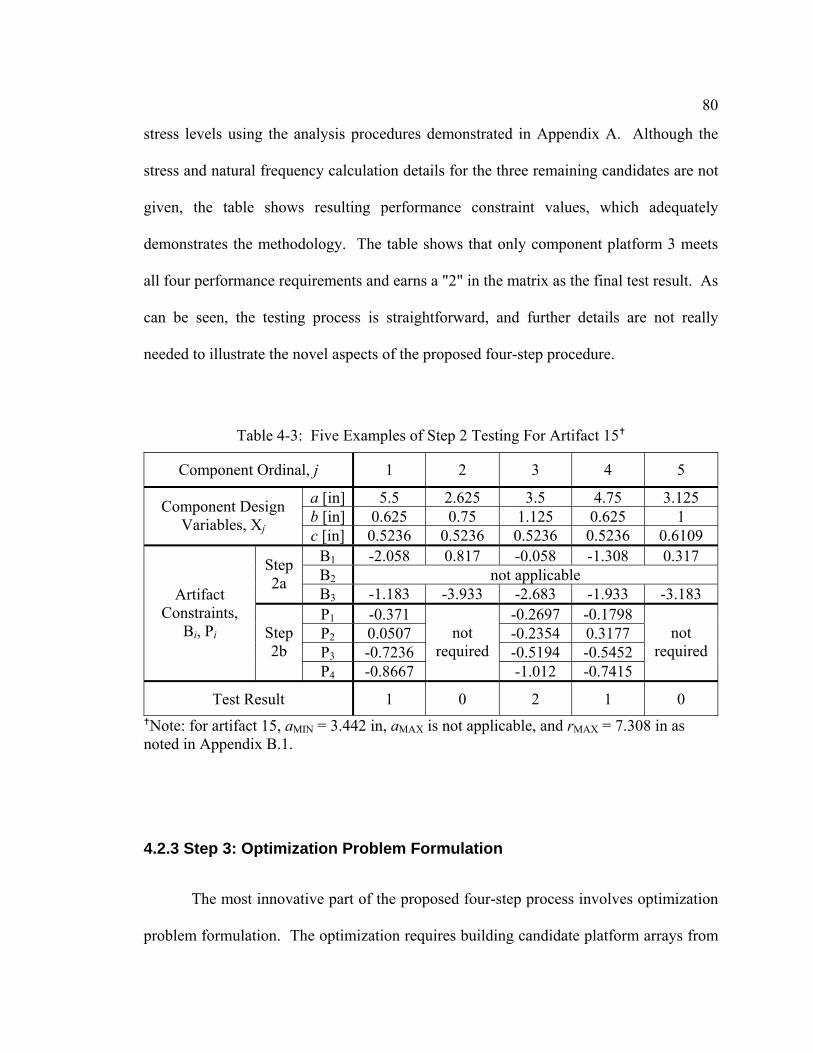
80
stress levels using the analysis procedures demonstrated in Appendix A. Although the
stress and natural frequency calculation details for the three remaining candidates are not
given, the table shows resulting performance constraint values, which adequately
demonstrates the methodology. The table shows that only component platform 3 meets
all four performance requirements and earns a "2" in the matrix as the final test result. As
can be seen, the testing process is straightforward, and further details are not really
needed to illustrate the novel aspects of the proposed four-step procedure.
4.2.3 Step 3: Optimization Problem Formulation
The most innovative part of the proposed four-step process involves optimization
problem formulation. The optimization requires building candidate platform arrays from
Table 4-3: Five Examples of Step 2 Testing For Artifact 15
Component Ordinal, j 1 2 3 4 5
a [in] 5.5 2.625 3.5 4.75 3.125 b [in] 0.625 0.75 1.125 0.625 1 Component Design
Variables, Xj c [in] 0.5236 0.5236 0.5236 0.5236 0.6109 B1 -2.058 0.817 -0.058 -1.308 0.317 B2 not applicable Step
2a B3 -1.183 -3.933 -2.683 -1.933 -3.183 P1 -0.371 -0.2697 -0.1798 P2 0.0507 -0.2354 0.3177 P3 -0.7236 -0.5194 -0.5452
Artifact Constraints,
Bi, Pi Step 2b
P4 -0.8667
not required
-1.012 -0.7415
not required
Test Result 1 0 2 1 0
Note: for artifact 15, aMIN = 3.442 in, aMAX is not applicable, and rMAX = 7.308 in as noted in Appendix B.1.

81
the matrix in Appendix D.1. Using the first row as an example, fourteen cross-sections
satisfy all valve ordinal 1 constraints; therefore, 14 is the size of the C1 array as well as
the upper bound on XP1. As another example, the last row in the matrix (60) has four
feasible cross-sections such that the upper bound for XP60 is 4, and the candidate array
(C60) is {29, 30, 59, 60}; notice that the valve’s own cross-section is included (60 in this
case), which should always be a condition.
The first three columns of the table in Appendix D.2 give candidate arrays and the
maximum allowed XP values for each artifact, which is the complete input required to set
up the component-based platform portfolio optimization problem. As discussed
previously, minimizing N is the objective (to maximize commonality), where N is
computed as the number of unique members of C(XP), where C(XP) defines the
component platform ordinals used to span the market segments. The next step is to solve
the optimization problem.
4.2.4 Step 4: Solving the Optimization Problem
The optimization is solved using a Simulated Annealing (SA) algorithm that is
presented in Belegundu and Chandrupatla (1999). The starting temperature was 10000,
the temperature reduction factor was 0.7, the number of temperature reductions was 5, the
number of search cycles per temperature reduction was 120, and the convergence
criterion was set to 0.0001. The SA algorithm consistently converges to a feasible
solution, but the resulting optimal number of component platforms (N*) can vary from 7
to 12. Because of this result inconsistency, more than 50 runs were performed before

82
declaring N*=7 the maximum achievable commonality. The nature of this inconsistency
requires additional investigation; however, it does not diminish the utility of the proposed
four-step methodology since all of the solutions offer improved commonality over the
existing product line.
In addition to the inconsistency, use of the SA algorithm is computationally
expensive, but the expense is offset by the simplicity of the example portfolio objective
function. One run for this example takes about six minutes on a 1.8 GHz PC running
Windows XP Professional™ and requires about 1,500,000 function calls, which could be
reduced by using less conservative parameter settings in the SA. For comparison, the
number of function calls required by an exhaustive search equals the product of all the
upper bounds of the XP array, which, for this example, is greater than 2.7E+58
evaluations based on the maximum XP column in Appendix D.2. Additional work is
needed to reduce the number of function calls by the SA algorithm, in particular, and for
solving this optimization problem, in general. Parallel computing techniques could also
be employed as the problem is easily parallelizable for different market segments.
The last two columns from the table in Appendix D.2 give two N*=7 optimal
solutions, where the optimal XP array and the corresponding used platforms C(XP) are
given. In addition, Table 4-4 and Table 4-5 contain pivot tables on the left that
graphically define the solutions, and the numbers in the tables correspond to the unique
source component platform ordinals and descriptions listed on the right. The tables help
reveal patterns: for instance, both solutions employ platforms 30, 37, and 47, which are
shown shaded, and platform 30 can be used in at least 10 different artifacts, which
represents a significant gain in commonality.

83
Table 4-4: Platform Portfolio Solution 1
Size Type Class 3 4 6 8 10 12
150 23 37 48 29 48 30 300 29 29 29 23 47 23 600 37 48 29 47 30 30 900 23 37 29 23 23 30
DD
1500 37 23 30 30 29 30
150 37 37 48 48 47 29 300 37 37 29 48 48 47 600 37 44 48 47 47 48 900 44 44 48 47 30 30
FW
1500 48 47 29 48 29 30
Ordinal Cross-Section Source
Qty
23 10-900-DD 7 29 10-1500-DD 11 30 12-1500-DD 10 37 3-300-FW 9 44 4-600-FW 3 47 10-600-FW 8 48 12-600-FW 12
Table 4-5: Platform Portfolio Solution 2
Size Type Class 3 4 6 8 10 12
150 47 20 51 26 51 47 300 26 26 26 26 47 47 600 37 26 26 30 30 30 900 47 20 26 47 30 30
DD
1500 37 26 30 30 30 30
150 20 20 45 45 26 47 300 37 20 45 26 26 47 600 37 51 45 47 47 51 900 37 51 51 47 30 30
FW
1500 51 47 47 51 30 30
Ordinal Cross-Section Source
Qty
20 4-900-DD 5 26 4-1500-DD 12 30 12-1500-DD 13 37 3-300-FW 5 45 6-600-FW 4 47 10-600-FW 13 51 6-900-FW 8

84
In addition to the multiple solutions noted earlier, the corresponding platform
ordinals can vary widely between solutions; however, all of the results are feasible. A
good reason for the varied results is this: given that a certain platform is suitable for a
given valve, that valve’s cross-section may be suitable for the platform’s valve and also
for many of the valves that use the platform. In other words, the platforms can have a
‘reflexive’ property in that it may be possible to switch a used platform for the platform
of one of its users. Table 4-6 gives the two example solutions side-by-side and
demonstrates this reflexive property in that component platform 20 is interchangeable
with platform 37 in the exact same set of market segments.
At first glance, some of the leveraging apparent in the solutions does not seem
viable. For instance, use of platform 48 (from the size 12, class 600 flex wedge gate
Table 4-6: Demonstration of the Component Platform Use ‘Reflexive’ Property
Size Class 3 4 6 8 10 12 150 23 37 48 29 48 30 300 29 29 29 23 47 23 600 37 48 29 47 30 30 900 23 37 29 23 23 30 1500 37 23 30 30 29 30
150 37 37 48 48 47 29 300 37 37 29 48 48 47 600 37 44 48 47 47 48 900 44 44 48 47 30 30 1500 48 47 29 48 29 30
Size Class 3 4 6 8 10 12150 47 20 51 26 51 47300 26 26 26 26 47 47600 37 26 26 30 30 30900 47 20 26 47 30 301500 37 26 30 30 30 30
150 20 20 45 45 26 47300 37 20 45 26 26 47600 37 51 45 47 47 51900 37 51 51 47 30 301500 51 47 47 51 30 30

85
valve) on valve 55 (the size 3, class 1500, flex wedge gate valve) seems discrepant;
however, this is a verified feasible fit. A reason for the discrepancy is that the underlying
valve artifacts are currently lacking in commonality, as no smooth transition in yoke
mounting parameters exists among valve sizes, pressure classes, or types. In fact, this
demonstrates the advantage of employing the arbitrary leveraging strategy that does not
rely on the traditional horizontal, vertical, or beachhead market segmentation grid
leveraging strategies.
4.3 Minimum Cost Component Product Platform Portfolio Example
Any realistic component-based product platform portfolio solution must contain
properly stretched/scaled yoke component platforms, and the associated manufacturing
cost must be captured. The yoke component platform redesign strategy proposes two
potential architectures as shown in Figure 3-6, and implementation of this strategy
requires a corresponding model for capturing associated manufacturing cost. Section
4.3.1 presents a general model based on ABC methodology and describes details on how
the general model is customized to the example. The customized cost model includes
automatic yoke mounting flange design methodology for specifying the interface between
the yoke and the rest of the valve extended structure, and this is presented in Section
4.3.2. The flange interface methodology determines required interface flange volume
which is an ingredient of the ABC model.

86
In Section 4.3.3, two component product platform portfolios are developed that
model the two stretching/scaling strategies: the module and stretch strategies as described
in Section 3.2.6.1. The winning strategy is revealed as the one that is most cost efficient.
4.3.1 ABC for Low Volume Highly Customized Product
Use of Activity Based Costing (ABC) methodology is advocated that provides a
realistic model of manufacturing cost including cost due to new tooling and other capital,
raw material, machining time, setup, plant operation, and labor. The ABC model should
consider fixed cost that is independent of the quantity of artifacts manufactured, and
variable cost that is a function of production volume. Important fixed costs include new
tooling and other capital costs, plant operation, and indirect labor cost due to such
activities as engineering design and research, whereas important variable costs include
raw material, machining time and labor, tool wear, machine maintenance, and other direct
labor costs for activities such as material handling.
An ABC model must sufficiently capture every important cost driver related to a
specific problem, which can result in book keeping details that can seem overwhelming.
In order to enhance clarity, methodology details are presented in two parts: first, general
considerations are discussed for application to any redesign project in Section 4.3.1.1,
and second, example-specific details are presented in Section 4.3.1.2 that addresses both
the module and stretched yoke mounting flange options.

87
4.3.1.1 General Considerations
How costs are divided between fixed and variable can depend on the scenario, and
the choice can be subjective. The goal is to realistically model the cost of doing business
so that any change in manufacturing techniques or product volume is accurately reflected
in the cost model. For instance, the division of cost can be different depending on
production volume. In a high volume operation, it is probably appropriate to consider all
setup cost as fixed, but in a very low volume situation, where components are typically
produced one-at-a-time, some setup cost should be considered variable.
With respect to component product platform design, the cost model should be
capable of capturing the cost benefit of implementing the platform. It should include
sales volume projections as input so that payback time may be assessed. The component-
based product platform portfolio optimization methodology assumes that cost
improvement is achievable through part commonality resulting from leveraging
component platforms across portions of the market segmentation grid, and the cost model
must be capable of accurately capturing the savings. Because cost savings due to the
leveraging typically requires significant sales volume, such cost savings may be difficult
to achieve for low volume products, which is the focus of this thesis.
Eq. 4.3 defines a generalized ABC model for an artifact, where AT is the artifact
total manufacturing cost, AF is its fixed cost, and AV is its variable cost. The fixed cost
consists of tooling cost (FT), and fixed overhead (FOH), while the variable cost consists of
raw material cost (VRAW), machining cost (VMACH), and variable overhead (VOH).

88
This artifact cost model is used in the formulation of the platform tradeoff
metric (T), which is given by Eq. 4.4, and which captures the potential cost savings from
implementing a component-based product platform portfolio. It equals the difference in
cost between the product platform portfolio and baseline standard manufacture of all
member artifacts of the targeted market segmentation grid. The subscripts F and V are as
used in Eq. 4.3, and the subscripts P and B refer to the platform and baseline
implementation of the market segmentation, respectively. The turns parameter (t) is the
assumed number of times the members of the market segmentation grid are produced and
gives a means for capturing market volume. In general t can be different for individual
members of the market segmentation grid, and thus, t is inside the summations. The first
two terms apply to the portfolio implementation, where N denotes the number of
component platforms required to span the market segmentation grid, and q denotes the
number of times a given platform is used in the grid. The last terms apply to the baseline
implementation, where n is the number of members in the market segmentation grid.
OHMACHRAWV
OHTOOLF
VFT
VVVAFFAAAA
++=+=
+= 4.3
( )∑∑ ∑ +−⎟⎟⎠
⎞⎜⎜⎝
⎛+=
nVBFB
NVP
qFP tAAAtAT 4.4

89
4.3.1.2 Example-Specific Details
In order to decide on the better solution between the module and stretched
models, the cost model must capture the cost differences between the approaches. On the
one hand, both require flange machining, but the module approach requires less. On the
other hand, the module approach requires change pieces while the stretched model does
not. The better solution will be determined by studying the manufacturing activity
required to produce a result, and this is precisely the focus of the ABC approach.
Eq. 4.5 gives the employed cost model based on the generalized model presented
previously in Section 4.3.1.1; however, the tradeoff metric is simplified in that it is
assumed that each artifact has equal probability of production. Then, the turns parameter
(t) does not depend on the artifact as with the generalized model.
The notation of Eq. 4.5 is the same as per the general model: AFP is a platform
artifact fixed cost, AVP is a platform artifact variable cost, AFB is a baseline artifact fixed
cost, AVB is a baseline standard artifact variable cost, N is the required number of
component platforms, n is the total number of artifacts, and q is number of times a given
component platform is used.
For a single turn (i.e., t equal to one), Eq. 4.5 yields the difference in
manufacturing cost between a completely instantiated portfolio and a complete set of
baseline standard artifacts. It is implied that all platform artifacts and all baseline
( ) ( )∑∑ +−+=n
VBFBN
VPFP tAAtqAAT 4.5

90
standard artifacts must satisfy the aggregate performance requirements presented in
Section 3.2.4. In addition, as discussed in Section 3.2.4, it is possible that a baseline
standard artifact is infeasible, and the model includes the cost of making it feasible,
which is just as the modification would be required in practice if a custom specification
equaled the aggregate specification. Therefore, in the discussion that follows, there is a
distinction between an infeasible and a feasible baseline standard artifact.
A significant portion of total yoke manufacturing cost is associated with raw
material, which is directly related to material volume. Then, yoke metal volume is
required for both yoke platform instantiations and for baseline standard yokes. An
important volume component is for a yoke mounting flange, and Section 4.3.2 gives
mounting flange design methodology, including equations for determining its volume.
Yoke volumes for needed options are given by Eq. 4.6, and each equals the sum
of yoke leg and yoke mounting flange volumes. The actuator mounting flange is not
considered as no distinction exists between platform and baseline actuator mounting
flanges. However, a distinction is made between the volume of a feasible (VBF), and
infeasible (VBI) baseline standard yoke leg. In addition, there is a distinction between
volumes for a modular platform yoke (VPM) and stretched platform yoke (VPS) according
to the yoke casting pattern schemes presented previously.
MTGSTDBF VVV +=
MTGOPTBI VVV +=
MTGPOPTPM
MAXMTGPOPTPS
VVVVVV
+=+=
,
,,
4.6

91
In Eq. 4.6, VOPT,P, VOPT, and VSTD are associated with yoke leg volume and are
different between a component platform yoke and a baseline standard yoke. For a given
artifact, yoke leg length must be the same for both the baseline and platform, and
therefore volume differences are due to area differences. The term VOPT,P is the yoke leg
area for an instantiated platform and equals the platform’s yoke leg area times the artifact
yoke leg length. If the baseline standard yoke leg meets the established performance
criteria, the baseline yoke leg volume (VSTD) equals the baseline yoke volume. However,
if the baseline yoke is infeasible, a yoke leg modification is required and it is assumed
that its candidate platform yoke leg cross-section is used (see Section 3.2.6.2 for the
definition of a candidate platform), which is denoted as VOPT. In addition, as described
later, an extra setup cost is assigned when a baseline is infeasible that accounts for
required yoke casting pattern modifications.
Table 4-7 defines the elements of the simple cost model used in the example, and
Table 4-8 gives numerical values for costing rates involved. Although costs are given in
dollars ($), true cost magnitudes are masked somewhat to protect confidential sources;
however, the data does meet the important objective of capturing the relative cost among
the various activities. An interesting aspect is that some setup costs, including jig reuse
and jig setup costs, which are traditionally considered as fixed costs, are considered here
as variable costs. These are variable because a low volume custom product is the focus
where the yokes would be typically manufactured one-at-a-time. In addition, the jig
reuse cost for a platform is less then for a baseline, and this reflects cost savings from
improved yoke casting pattern design in accordance with the scheme discussed in Section
3.2.6.1. Then, this distinction helps reduce the cost of implementing a platform and

92
increases the potential of successful implementation. Another interesting aspect of the
model is that the platform fixed costs for yoke casting pattern creation (CF, CP, and CJ)
are high relative to the baseline standard casting pattern modification cost (CB), and
therefore sufficient commonality must be introduced by the platform portfolio in order to
overcome the casting pattern creation cost.
Table 4-7: Example Simple Cost Models
Relative Fixed Cost Variable Cost Artifact Type Description Equation Description Equation Infeasible Baseline
Design Overhead, Modify Pattern
AFB= CO+CB
Jig Setup and Raw Material AVB = CJB+VBICR
Feasible Baseline Design Overhead AFB = CO Jig Setup
Raw Material AVB = CJB+VBFCR
Modular Platform
Design Overhead, New Pattern, Jig
Fixture, and Flange Modules
AFP = CO+CP+CJ +(q-1)CF
Jig Reuse and Raw Material
AVP = CJP+VPMCR
Stretched Platform
Design Overhead, New Pattern and
Jig Fixture
AFP = CO+CP+CJ
Jig Reuse, Raw Material, and Machining
AVP = CJP+VPSCR +(VMTG,MAX -
VMTG)CM

93
4.3.2 Flange Interface Design
A plan view for the assumed yoke mounting interface flange geometry is given in
Figure 4-2, and the parameter w is determined from Eq. 4.7, and rO and rI are defined in
Table 4-9. Eq. 4.7 is based on the standard stress analysis methodology employed by the
manufacturer, with conservatism; however, whereas bending stress is normally
determined, the equation is posed in terms of thickness required to reach a target stress
level equal to a conservative allowable. Flange stress is largely a function of a moment
arm (x) and external Moment and Thrust from the aggregate specification. Table 4-9
Table 4-8: Example Costing Rates
Symbol Variable or Fixed Cost Module Stretch Description
CO Fixed 100 100 Design Database Overhead Cost [$/design]
CF Fixed 200 n/a Flange Module Pattern Creation Cost [$/flange]
CP Fixed 1000 1000 Platform Pattern Creation Cost [$/pattern]
CB Fixed 500 500 Pattern Modification Cost for an Infeasible Baseline Standard Yoke [$/pattern]
CJ Fixed 300 300 Jig Fixture Creation Cost for a Platform Yoke [$/jig]
CJP Variable 200 200 Jig Fixture Reuse Cost for a Platform Yoke [$/reuse]
CJB Variable 500 500 Jig Fixture Reuse Cost for a Baseline Standard Yoke [$/reuse]
CR Variable 2 2 Raw Material Cost per Unit Volume [$/in3]
CM Variable n/a 1 Machining Cost per Unit Volume of Removed Material [$/in3]

94
gives flange section views for three possible interface models and corresponding
equations that determine required final machined yoke mounting flange volume VMTG.
Two models addresses possible clamped flange configurations, and one address a bolted
configuration. The procedure in Table 4-9 is applied to the module platform mountings
and to the baseline mountings. It is conservative to apply this model to the baseline
standard because no penalty results if the existing baseline flange is too thick (i.e., more
raw material cost), or it does not satisfy target stress criteria requiring design
modification. For a stretch platform yoke, which by definition may be instantiated on
multiple artifacts, raw material volume equals the maximum resulting volume among the
associated instantiations, and this is denoted as VMTG,MAX in Eq. 4.6.
r Ow
r I
Figure 4-2: Yoke Flange Interface Model

95
26wtxFSσ
rMomentThrustF
==
+=
SwxFt
CBAw
6
)sin()(2
=∴
+=
where: Thrust = External Thrust
Moment = External Moment x = Bending Moment Arm
r = Moment Equivalent Contact Force Location S = Allowable Bending Stress
w = flange width
4.7

96
Table 4-9: Determination of the Yoke Mounting Flange Volume (VMTG)
Yoke Mounting Sketch Flange Volume Equation C
lam
ped
Join
t, In
side
Fla
nge
t
x
ab
r
( )π22 artVbarx
arrr
MTG
I
O
−=−−=
==
Cla
mpe
d Jo
int ,
O
utsi
de F
lang
e t
xab
r
hB
( )( )π
π22
21
22
)(
)()(
Brrh
BrbatVraxBrrbar
MTG
I
O
−−+
−−+=−=−=+=
Bol
ted
Join
t, In
side
Fla
nge
t
a
r
xd N
b
( )π2212
21
)()( NMTG
NI
O
drbatVraxdrrbar
−−+=−=
−=+=

97
4.3.3 Module and Stretched Strategy Product Platform Portfolios
The four-step process presented in Section 4.1 is used to determine the optimal
component product platform portfolio for the two proposed platform yoke models. The
objective function is given by Eq. 4.8. A large penalty P is included that is added when
any component platform is not used on its own artifact, i.e., Ci ≠ i using the notation
defined previously in Section 4.1. Although the examples consider it necessary that the
artifact associated with the platform use its own platform, this is not mandatory for
implementing the methodology; however, imposing this necessity is reasonable as it
assures that the instantiation involving the platform’s source artifact will optimally meet
the target design criteria.
An interesting fixed cost is the design database overhead fixed cost, CO, which is
common to all artifact types. It denotes the cost required to maintain the database of
design information such as design drawings and the paperwork required to order raw
material and manufacture a yoke. Since it is common to all types, its net cost for the
platform portfolio is a direct function of the number of required platforms (N). Then, this
cost could be removed from the tradeoff metric and instead applied as a weight on the
PTF += where:
P= 10(AFP+AVP) if Ci ≠ i P = 0 otherwise
4.8

98
platform quantity (N) in the general four-step optimization process objective function.
Then, Eq. 4.9 is an alternative objective function that could be employed.
The simple cost model is applied to the optimized yoke valve artifacts of the
example market segmentation grid. In preparation for applying the four-step process,
each market segmentation grid artifact is assigned an ordinal as shown in Table 4-10. In
order to demonstrate the flexibility of the process, it is assumed that several artifacts
should not be included in the optimization, and twelve gaps exist corresponding to the
excluded artifacts. Such artifact exclusions may be desired for several reasons: because
they do not currently exists, are not worth salvaging as a portfolio member, or involve
fundamentally different design philosophies. This grid considers only gasketed bolted
flanges (the un-shaded artifact numbers) and clamped type bonnet joints (the shaded
black artifact numbers) as reflected in Table 4-9. For three of the excluded artifacts, the
bonnet joint is the threaded type, and for the other nine, the design is not available for
production at the target manufacturing facility. The threaded joint artifacts could be
included by adding a forth option to Table 4-9. Alternatively, a platform could be created
separately for the threaded joint artifacts using the presented methodology. Similarly, the
bolted bonnet and clamped valve artifacts could be separated, and a component-based
product platform portfolio created for each.
PTNCF O ++= 4.9

99
Although the employed Simulated Annealing (SA) Algorithm optimizer yields
good results, the global optimal solution is not guaranteed. In an attempt to reach the best
solution in a reasonable time and without interaction, the optimization process is
performed twenty times in succession automatically. The twenty-run sequence was
conducted several times during the search for the best solution. For about half of the
sequences, the initial design variables were set so that the initial used platform ordinals
equal their corresponding artifacts; in equation form, using the notation developed during
the definition of the four-step optimization process, C(XP(1))=1, C(XP (2))=2, and so on,
noting that the design variables are given by the vector Y, which contains the indices into
the platform matrix C such that C(XP ) defines the artifact ordinals to use as platforms.
For the other sequences, the initial design variables were set at random. There was no
noticeable difference in solution time or process performance due to the initial starting
point.
Table 4-10: Market Segmentation Grid Artifact Ordinals With Exclusions
Size Type Class 3 4 6 8 10 12
150 1 3 4 5 6 300 7 8 9 10 11 12 600 13 14 15 16 17 18 900 19 21 22 23 24
DD
1500 26 27 28 29 30
150 33 34 35 300 39 40 41 600 43 44 45 46 47 900 49 50 51 52 53 54
FW
1500 55 57 59 60

100
The following tables and figure summarize the optimization results for the best
solutions (i.e., maximum commonality and maximum relative cost savings). Table 4-11
gives a sample iteration history from the best solution for the module cost model, and this
table shows that a single optimization takes about 3 minutes to complete and requires
about 600,000 function calls. Figure 4-3 shows how the SA temperature parameter, the
objective function and the number of function calls trend with time for the Table 4-11
iteration history. Table 4-12 and Table 4-13 give cost statistics from the best solutions
for the module and stretched cost models, respectively, and Table 4-14 and Table 4-15
are corresponding pivot tables that provide a good visualization of the respective platform
distributions.
0
0.25
0.5
0.75
1
0 0.5 1 1.5 2 2.5 3
Elapsed Time [minutes]
Nor
mal
ized
Mag
nitu
de
TemperatureObjectiveFunction Calls
Figure 4-3: Sample Iteration History Trends

101
Table 4-11: Sample Solution SA Algorithm Iteration History
Temperature Objective, F Elapsed Minutes
Total Function Calls
10000 -1976.868 .12 28801 7000 -3541.752 .24 57601 4900 -8167.545 .36 86401 3430 -9447.786 .48 115201 2401 -10316.7 .6 144001
1680.7 -10323.51 .71 172801 1176.49 -12070.08 .83 201601 823.543 -14077.82 .94 230401 576.4801 -15426.23 1.05 259201 403.5361 -19596.79 1.16 288001 282.4753 -19965.3 1.26 316801 197.7327 -20072.82 1.36 345601 138.4129 -20072.82 1.47 374401 96.88901 -20072.82 1.57 403201 67.8223 -20072.82 1.67 432001 47.47562 -20072.82 1.78 460801 33.23293 -20072.82 1.88 489601 23.26305 -20072.82 1.98 518401 16.28414 -20072.82 2.08 547201 11.3989 -20072.82 2.19 576001 7.979227 -20072.82 2.29 604801 5.585459 -20072.82 2.39 633601

102
Table 4-12: Optimal Module Cost Model Statistics
Platform Cost ($) Baseline Cost ($) Used
Platform Quantity
Used Fixed Cost
Subtotal Variable
Cost
Subtotal Fixed Cost
Subtotal Variable
Cost
Savings ($)
13 4 2000 920.89 1400 2550.15 1029.26 15 8 2800 1846.59 3300 5339.40 3992.82 26 6 2400 2028.89 1100 4316.58 987.69 28 3 1800 2543.84 800 4156.54 612.70 30 8 2800 11862.64 3800 16460.59 5597.94 47 10 3200 6493.03 2500 10985.89 3792.86 51 9 3000 3820.01 2900 7979.55 4059.54
Totals 7 platforms
18000 29516 15800 51789 20073
Table 4-13: Optimal Stretched Cost Model Statistics
Platform Cost ($) Baseline Cost ($) Used
Platform Quantity
Used Fixed Cost
Subtotal Variable
Cost
Subtotal Fixed Cost
Subtotal Variable
Cost
Savings ($)
5 3 1400 1600.75 800 2227.71 26.96 15 3 1400 1027.53 1300 1923.65 796.12 22 5 1400 3898.23 1500 4790.98 992.75 26 5 1400 2768.87 1500 3535.82 866.95 28 2 1400 2602.48 200 2892.35 -910.13 29 2 1400 3641.09 700 3721.31 -619.78 30 3 1400 7787.18 1300 7109.21 -777.96 40 5 1400 2053.30 2000 3608.52 2155.21 44 4 1400 1117.53 1400 2431.38 1313.85 47 3 1400 2751.63 300 2366.18 -1485.45 51 6 1400 4431.31 1600 6031.54 1800.24 52 3 1400 1911.47 1300 4332.30 2320.83 54 3 1400 4363.62 1300 4386.92 -76.69 60 1 1400 2130.84 600 2430.84 -500
Totals 14 platforms
19600 42086 15800 51789 5903

103
Table 4-14: Optimal Module Cost Model Pivot Table
Size Type Class 3 4 6 8 10 12
150 47 51 26 51 28 300 15 15 15 26 47 47 600 13 15 15 47 47 30 900 26 26 47 28 30
DD
1500 26 47 28 30 30
150 51 51 26 300 15 15 51 600 13 13 15 47 47 900 13 51 51 47 30 30
FW
1500 51 51 30 30
Ordinal Cross-Section Source Qty
13 3-600-DD 4 15 6-600-DD 8 26 4-1500-DD 6 28 8-1500-DD 3 30 12-1500-DD 8 47 10-600-FW 10 51 6-900-FW 9
Table 4-15: Optimal Stretched Cost Model Pivot Table
Size Type Class 3 4 6 8 10 12
150 22 51 26 5 51 300 40 15 15 47 22 22 600 5 5 15 47 54 30 900 26 26 22 28 30
DD
1500 26 22 28 29 30
150 40 51 40 300 40 40 51 600 44 44 26 52 47 900 44 44 51 52 54 54
FW
1500 51 52 29 60
Ordinal Cross-Section Source Qty
5 10-150-DD 3 15 6-600-DD 3 22 8-900-DD 5 26 4-1500-DD 5 28 8-1500-DD 2 29 10-1500-DD 2 30 12-1500-DD 3 40 8-300-FW 5 44 4-600-FW 4 47 10-600-FW 3 51 6-900-FW 6 52 8-900-FW 3 54 12-900-FW 3 60 12-1500-FW 1

104
These results show that the module cost model mandates seven platforms to span
the market segmentation grid, and the stretched model requires fourteen platforms.
Although both models yield a relative cost savings over the baseline standard, the savings
for the module model is significantly greater ($20073 verses $5903). Then, the module
model is the clear winner, given the assumed relative costs from Table 4-8. For this
example (1) the commonality introduced by the platforms results in a platform portfolio
fixed cost comparable to the baseline standard fixed cost, (2) due to the use of the optimal
yoke leg cross-sections and to the more efficient setup cost, platform portfolio variable
cost is significantly less than for the baseline standard, but (3) the extra artifact mounting
flange machining variable cost in the stretched cost model must tradeoff with the fixed
cost savings. In addition, it is evident that, because the platform portfolio variable cost is
less than the total baseline standard variable cost, an increase in turns (t) would further
increase cost savings.
If the module strategy is employed, Table 4-12 gives the cost savings ($20073)
for the production of one complete set of market segmentation grid artifacts (i.e., one turn
as described in Section 4.3.1.2). Notice that a cost savings is realized even though the
fixed cost for the platform portfolio is greater than that for the baseline standard, and this
cost difference ($2200 for the module model) represents the maximum risk in not
realizing the production volume assumption inherent in the turns parameter, t, which is
not significant in this case. The current cost model does not include the cost of
developing the methodology, as this is considered a sunk cost (i.e., the methodology
exists as of this writing). The cost (e.g., man-hours) to assemble and implement a

105
redesign team is included in the design database overhead cost coefficient (CO) from
Table 4-8, and for this example, the database overhead cost is the same for both the
platform and the baseline standard. This is reasonable given the premise that the baseline
standard will require modification, and in addition, it is very probable that the proactive
redesign effort (i.e., man-hours) required to create a component platform yoke is
comparable to the effort required to reactively modify a baseline standard. In fact, it may
be argued that reactive modification is inefficient (i.e., more costly) compared to
proactive redesign due to the “emergency atmosphere” that often develops during the
reactive approach, which requires special treatment (e.g., overtime). Therefore, the
results show that implementing the platform methodology is feasible given the cost and
turns assumptions.
It is possible that the project cannot be justified in some cases. For instance,
Marion, et al. (2007) describe an example where the cost of outsourcing saves more
money than implementing a product platform in-house. If the yoke redesign project had
not shown a cost savings, then the project would be aborted, and the redesign team effort
to date would be a loss; however, the effort may not be a complete loss as some of the
work may still have value. For example, a baseline standard product line may emerge
that did not formally exist previously, or a developed ABC model could improve future
cost estimation. In general, the risk is acceptable given the potential benefits, either in
full or only partial. In addition, the effort required to reach this critical decision point is
not excessive, even for a small company with limited resources. In particular, the
redesign team’s required tasks, except perhaps for ABC model development, are not
significantly different from their normal job functions, and since an entire product line is

106
involved, there is potential for batching their effort, e.g., if four man-hours are required to
evaluate a single yoke, then the cost of evaluating ten yokes might be twenty hours or
less, a savings of nearly half the effort in terms of man-hours.
For comparison, the optimization process was performed while considering
commonality alone without cost. This is accomplished by setting CO equal to unity and
setting all other cost parameters to zero. This effectively makes the objective function as
per Eq. 4.10. Table 4-16 gives the resulting platform portfolio statistics and shows that
the required number of platforms equals seven. It is interesting that this number is the
same as for the module cost model. This shows that, although platform-artifact usage is
different, the module model results make maximum use of commonality.
PNF += 4.10
Table 4-16: Optimal Portfolio Statistics Considering Commonality Only
Platform Used Quantity Used23 9 29 12 30 7 46 8 49 4 54 4 55 4
Totals 7 platforms

107
Obviously, the given results are sensitive to the assumed relative cost model
employed, and it is possible that a small change in the model could significantly change
the optimal platform portfolio solution. Therefore, it is recommended that any real-world
design team should consider relative cost sensitivity, as results of a sensitivity analysis
could influence design decisions. In the example problem for instance, small changes in
relative costs could significantly influence the cost difference between the module and
stretched models, even to the extent that implementing a product platform portfolio
cannot be justified. However, the strategy and analysis involved with a sensitivity
analysis is left for future work as data regarding cost variability is not readily available
for the example problem.
4.4 Chapter Summary
This chapter presents a methodology for determining an optimal product platform
portfolio from a subset of candidate component platforms that were developed using the
component-based platform redesign methodology presented in Chapter 3. The
methodology is presented as a four-step process centered on an optimization procedure
with the goal of minimizing manufacturing cost without sacrificing product performance
or customer perceived variety.
With a targeted market segmentation grid as a precursor, the process proceeds in
four steps. In Step 1, a set of candidate component platforms is developed, and
application of the methodology presented in Chapter 3 meets the requirements of this
step. In Step 2, the feasibility of using each candidate on each artifact is tested, and what

108
results is a collection of candidates, one collection for each artifact, that satisfy
constraints for that artifact. In Step 3, the optimization problem is formulated with one
design variable associated with each artifact, and the value of the variable points to the
candidate to use as a platform for that artifact. In Step 4, the optimization problem is
solved to yield a product platform portfolio, and a zero-order method is required because
the design variables are constrained to integers and the objective function is not
guaranteed to be a continuous function.
Although the generalized objective function from Step 3 involves the tradeoff
between cost and performance, an example is presented using the valve yoke example
from Chapter 3 that simply minimizes commonality to clearly demonstrate the basic
procedure step-by-step. It is concluded that 7 is the minimum number of platforms
required to span the 60-member market segmentation grid, based on commonality alone.
The valve yoke example is revisited, but this time, the objective function includes
manufacturing cost including the cost associated with implementing the
stretching/scaling strategy described in Section 3.2.6.1. This requires a custom ABC
model and an automatic yoke mounting flange design methodology, and these are
presented before implementing the four-step process. The stretching/scaling strategy
includes two alternatives, the module and stretched models, and one goal of the example
is to determine which is better. Some artifacts from the original market segmentation
grid are removed in the revisited example before proceeding with the optimization, and
this demonstrates some flexibility inherent in the process. It is concluded that the module
model is better, as it requires only 7-platforms whereas the stretched model requires 14.
In addition, it is shown that 7-platforms is the minimum number required considering

109
commonality alone when considering the reduced number of candidate platforms, and
thus, it is concluded that the module model is capable of achieving maximum possible
commonality.
The proposed four-step product platform portfolio optimization methodology
shows promise for creating a product platform portfolio from a set of candidate
component platforms that is most cost effective within an existing product line. The
methodology allows for arbitrary leveraging as it does not rely on the traditional vertical,
horizontal, or beachhead strategies advocated for the market segmentation grid, and this
is especially beneficial when applied to an existing product line that was develop one-at-
a-time time such that artifact designs are inconsistent from one to another.
In the next chapter, an algorithm is presented for implementing a product platform
portfolio through a web-based interface, and the optimal module model portfolio
developed in this chapter is used there as an example implementation.

110
Chapter 5
Web-Based Product Platform Portfolio Implementation
This chapter presents an algorithm for implementing a web-based interface to
facilitate the implementation of a product platform portfolio for low volume highly
customized products such as what results from applying the procedure discussed in
Chapter 4. What results is a web-based virtual product family, which does not require the
existence of a physical product line. Rather, a product platform variant is produced on-
demand from a product platform portfolio that meets the customer’s specific
requirements. Using a strategic design process, the web-based interface queries a design
parameter database, which represents a virtual product platform portfolio, and determines
a portfolio instantiation that meets the user’s custom request. The web-based interface
could be used directly by a customer - or more realistically by a sales engineer - to
interactively specify custom design requirements, and it would provide a valuable sales
and marketing tool.
There are currently many web-based interfaces that allow a user to customize a
product; however, these are typically for high volume products for which the possible
variety has been strategically targeted in advance to meet the needs of specific market
segments, and for which substantial product inventory exists. For these products, the
manufacture remains in control of the product specification such as a specific color
palette or a choice of a limited number of option packages or modules. For example, Dell
Computer allows customers to custom design a computer from a limited set of add-ons,

111
and most automobile companies allow a web user to select from a limited set such as
colors, interior styles, and suspension packages. This is assemble-to-order customization.
The web-interface proposes a different approach. Rather than assemble-to-order,
the algorithm includes a strategy for engineer-to-order customization, where key features
of the product are designed on-demand to meet custom requirements. In addition, the
algorithm includes strategy that invites the user to compromise performance requirements
in exchange for cost and/or lead-time savings. The resulting design flexibility can benefit
the marketing of highly customized products with low volume where the product
specification is not known in advance, and it is not practical to stock inventory.
The combination of a web-based product platform portfolio implementation and
an engineer-to-order design and compromise strategy streamlines the design process
overall and can reduce manufacturing cost and lead-time by taking full advantage of the
savings inherent in platform leveraging and the flexibility inherent in engineer-to-order
customization. In addition, an implementation introduces custom requirements at the
initial stages of the product ordering process, which has potential benefits of avoiding
costly rework due to overlooked requirements, and of increased customer goodwill due to
improved performance overall. A goal is to give the user or sales engineer full control
over the design specification, which is fundamentally different from the typical custom
design web site. What can result is a powerful sales and marketing tool that improves
customer good will through a streamlined and interactive product procurement process.
112
5.1 The Web-Based Interface Algorithm
The proposed algorithm for the web-based interface is outlined in Figure 5-1, and
is organized as a hierarchy of options. It assumes the existence of a product platform
portfolio, an engineer-to-order design strategy and an algorithm for modifying a basic
product platform member to flexibly meet custom requirements, and possibly a baseline
standard product line. The algorithm starts with user supplied custom specification input
that defines performance requirements and then proceeds with a series of tests and user
dialogues to determine option feasibility.
Part of the strategy is to transform the baseline standard product line into a fully
instantiated product platform portfolio, and parts of the algorithm involving this
transformation are highlighted with dashed lines. The transformation occurs over time as
the need for product platform instantiation arises in order to meet custom specifications,
and once the transformation is complete, the highlighted portion is no longer
implemented. In addition, it is optional to abandon the baseline standard from the start,
in which case, the highlighted portion may drop out from the start. However, it may be
useful to retain the baseline standard implementation to allow in-service evaluation of
artifacts that are produced using the baseline standard.

113
The user input must be constrained, with drop-down boxes for instance, such that
only a single product platform member is targeted at any time. Then on request, three
Figure 5-1: Web-based Interface Algorithm
Custom Specification Input Targeting a Single Product
Yes. (2) Is the baseline standard feasible?
(3) Is the instantiation feasible?
Engineer-to-Order Dialogue Decision
Instantiate a platform.
(a) User chooses to compromise input.
(b) User chooses to customize the design.
No.
Yes.
Provide design details.
No.
Yes.
Note failures & suggest alternatives.
(1) Is a suitable product platform instantiated?
No.
Compromise Dialogue Decision
No Compromise.
Fails. Succeeds.
X
X
X (c) User
chooses to cancel.
Done or Restart

114
possible tests are performed, as numbered in Figure 5-1. Test (1) determines whether the
applicable product platform was previously instantiated, Test (2) checks the feasibility of
using the baseline standard artifact if no previous instantiation occurred, and Test (3)
checks the feasibility of using an instantiated platform when the opportunity presents
itself. Production history regarding the product platform portfolio instantiation must be
tracked to support the testing at least until the entire portfolio is instantiated. If the
baseline standard is feasible, then it is presented as the design choice, and design details
are output to the user, and the algorithm is done. In the same way, if the instantiated
platform meets requirements, then details are presented to the user. However, an
engineer-to-order process must be implemented when requirements are extreme and
neither is feasible.
The engineer-to-order portion of the algorithm contains three options: (a)
compromise, (b) customize, or (c) cancel, as labeled in Figure 5-1, and the choice is
presented to the user through a dialogue box. With the compromise option, which is
described in Section 5.1.1, the user is requested to compromise on input requirements in
order to make a basic design feasible, whereas with the customize option, which is
described in Section 5.1.2, key design features are changed or added through a flexible
design strategy. The user may choose to cancel either the engineer-to-order process or
the baseline standard compromise, which triggers the presentation of design details for
the infeasible design including information regarding associated failures, and this
presentation can provide a useful reference that (1) can help decide on how to proceed
toward a feasible solution, (2) allows the user to explore the design space fully, and (3)
allows for the assessment of unexpected in-service overload of production artifacts. A

115
user is invited to invoke the compromise option when either the baseline standard is
infeasible or when the instantiated platform is infeasible. The customize option is
presented only when the instantiated platform is infeasible because it is difficult to
implement on a baseline standard that does not include a consistent design strategy like a
product platform portfolio.
As indicated by the ‘succeeds’ box in Figure 5-1, if the chosen engineer-to-order
option succeeds in determining a feasible design, details for that design are provided.
The amount of detail must be sufficient to completely define the resulting design so that
it can be manufactured when required. For completeness, marketing details should be
included such as a sales price and instructions on placing an order. Presented results
represent an instantiated member of the virtual product family that can be potentially
manufactured.
It is possible that the custom specification input is so severe that it is impossible
to compromise input or customize design features. When the engineer-to-order process
fails, which is indicated by the ‘fails’ box, the failures are noted and alternative options
are given. For instance, the user could be invited to contact a sales representative for help
in collaborating on a radical redesign or on a completely new design. This presentation
leg of the algorithm is similar to that for the cancel option discussed above; however,
with the cancel option, it is not necessary to present alternatives, but this subtle difference
is not indicated in Figure 5-1.
In summary, a web-based interface can (1) introduce the voice of the customer
early into the design process, (2) implement a virtual product family, (3) achieve
engineer-to-order customization, and (4) provide an integrated design and marketing tool.

116
Implementation of the algorithm is demonstrated in Section 5.2 through an example
involving the valve yoke component product platform portfolio discussed in Section 4.3.
5.1.1 The Compromise Engineer-to-Order Strategy
With the compromise option, the user is invited to select replacement custom
specification input, which is based on a feasible design point from the selected platform’s
feasible design space. Since the choice requires the user to sacrifice desired performance,
an incentive to compromise must be offered, and the most natural and common incentives
are reduced price and reduced production lead-time. In addition, a compromise is
beneficial to the producer if (1) an instantiated platform with no modifications can be
manufactured with a better profit margin than one that requires modification and/or (2)
there is evidence that offering this option increases good will with the customer, which
may lead to increased sales. Conversely, the compromise option should not be offered if
a benefit cannot be justified, and it is a job for the redesign team to make an informed
decision as to whether to offer it, and the decision can be subjective since intangibles
such as good will are involved. As advocated in Chapter 3, an ABC model should be part
of the component-based product platform portfolio development, and it is further
advocated here to include this model in the procedure for determining price and profit
margin. Then, the keys to successful implementation of the compromise option are, as a
minimum, (1) a method for the user to perceive the feasible design space, which is further
discussed below, (2) a method to determine price, lead-time, and profit margin, and (3)
evidence that a compromise is sufficiently beneficial to both the buyer and seller.

117
The compromise problem is similar to a multi-objective optimization (MO)
problem, where the custom specification input variables involved in the compromise may
be considered objective functions within a MO problem. The solution to the MO
problem is often called the Pareto frontier, which is defined as the set of solutions where
any improvement in one objective (a compromise input) can only take place if at least
one other objective (a compromise input) worsens. A Pareto Frontier Plot (Abbass, et al.
2001; Messac, et al. 2003) can be useful for visualization, and Figure 5-2 illustrates a
simple example involving two objectives showing both the feasible design space and the
Pareto frontier.
When more than two variables are involved, it is more difficult to present the
design space and the Pareto frontier, and specialized algorithms may be required. For
example, Stump, et al. (2002) discuss the glyph plot and the scatter matrix, and Yukish
and Simpson (2004) critique the divide & conquer algorithm for displaying Pareto points.
When many compromise inputs are involved, the complexity of the presentation can
Figure 5-2: An Example Pareto Frontier Plot Adapted from Messac et al. (2003)

118
become overwhelming to the user, and therefore, it is best to limit the number of
compromise variables, and perhaps the user can be given the choice of which few from
the many to include in the compromise.
It is important to realize that, since the user’s selected platform was design a
priori, it is possible to create a Pareto frontier plot a priori, and this could significantly
improve processing time over creating plots in situ. Similarly, as mentioned in (Yukish
and Simpson 2004) many thousands of Pareto-optimal solutions could be generated a
priori and stored in a database for a posteriori choosing by the user.
5.1.2 The Customize Engineer-to-Order Strategy
Choosing the customize option invokes an automatic procedure that determines
the value of key design parameters to transform the user’s selected platform, which is
initially infeasible, into a feasible design. The customization process presents an
opportunity to implement a multi-tiered platform strategy as advocated in the discussion
near the end of Section 3.1.2. The best customization procedure is one that starts with a
basic platform, i.e., one that can meet the majority of expected custom design
specifications, and then adds design features through a strategy consisting of the addition
of modules, and/or the stretching and/or scaling of design parameters. In order to
minimize the effort of determining the features to add that yields a feasible design, all
potential design features can be designed in advance, and a select collection of them can
be considered a platform tier. Employing such a multi-tiered strategy can avoid over-

119
designed components yet provide a flexible design strategy capable of responding to a
super-majority of expected or even unexpected custom design specifications.
The process of determining added design features needed to achieve feasibility
can be automated by employing an optimization algorithm. The objective for the
optimization problem is to achieve a feasible design at minimal cost, the design space for
the problem is the collection of potential design features that make up platform tiers, and
the design variables consist of indices into the collections and possibly parameters that
define stretching/scaling of certain features. A zero-order optimization algorithm is
recommended, such as the Simulated Annealing (SA) or Genetic algorithms (GA), as
these can easily implement the indices with integers. In addition, these algorithms are
good at finding an optimum for ill-behaved objective functions. By definition, the
customization process starts with an infeasible design, which presents a challenge for
some optimization algorithms, but both SA and GA can address an infeasible start with a
penalty function. Although the a priori design of added features and the use of
optimization techniques make the customization process efficient, it could still require
significant processing time, and is courteous to warn the user when solution times are
long.
Assuming the design space of the potential added features is small, say one
hundred or fewer, the potential for finding a feasible design at minimal cost is generally
excellent. However, as mentioned previously, it could be impossible to find a feasible
solution when the custom specification input is extremely severe. Since failure is a
possibility, a final step of the customization strategy is to check for feasibility of the
120
resulting solution, and if feasible, the ‘succeed’ leg of the web-based interface algorithm
is followed, and if infeasible, then the ‘failed’ leg is followed.
5.2 The Web-Based Valve Virtual Product Line
The example web-based interface implements a virtual product line based on a
valve component product platform portfolio described in Section 4.3. The interface was
developed using Microsoft’s Visual Web Developer 2005 Express Edition Version 8.0,
which employs Microsoft’s ASP .NET Version 2.0 that is a set of web application
development technologies. A single web page provides the interface and changes
interactively upon user action under the control of a system of Microsoft Visual Basic
routines.
For simplicity, the baseline standard product line is not considered in the example,
and only the module-model product platform portfolio is implemented, which is the
winner over the stretched-model as described in Section 4.3. In addition, platform
instantiation is not tracked, as this is a simple book-keeping function that would not
contribute to understanding the example better. The stretched portfolio is created from
the collection of spreadsheets for the baseline model by changing the baseline yoke leg
cross-section parameters to the appropriate yoke component platform parameters in
accordance with Table 4-14, and what results is a new collection of spreadsheets, i.e., a
workbook, that defines the portfolio.
In addition to the portfolio workbook, the implementation employs a supporting
Microsoft Access database, and although Excel and Access are not robust web-server

121
databases, the .NET framework makes it simple to work with them and helps avoid this
weakness. The implementation also requires Visual Basic for Applications macros to
perform design evaluations, and these are part of the baseline standard design analysis
methodology. These macros require conversion to the .NET version of Visual Basic, and
although this takes some effort, the effort is greatly reduced by turning off the explicit
variable definition compiler option, which is acceptable since the converted code is well
established.
Figure 5-3 is a screenshot of the example valve custom specification input form.
The top portion consists of a drop-down list of all artifacts of the targeted market
segmentation grid. The middle portion, which contains three segments, allows the user to
input the custom specification roughly corresponding to the parameters from Table 3-5
noted by (1), (3), and (4). For simplicity, component materials cannot be specified as this
would unnecessarily complicate the example with the need to define user-defined
material (e.g., with a sub form). The middle segment defines the actuator, which may be
specified three ways: (1) by direct user input, (2) by selecting a standard motor actuator
from the provided drop-down list, and (3) by an automatic sizing procedure from the
standard design methodology. Given a complete form, the ‘Evaluate’ button starts the
algorithm, and in this case, the platform member does not meet the specification without
engineer-to-order customization, which is described in Section 5.2.2.
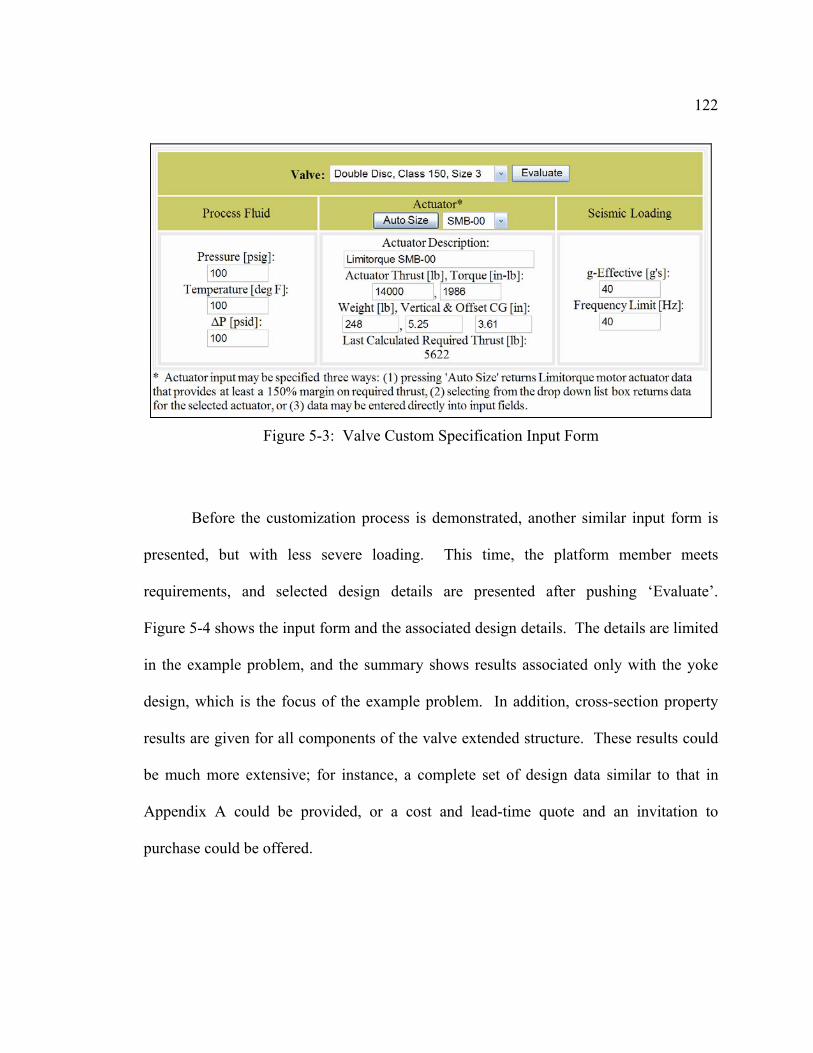
122
Before the customization process is demonstrated, another similar input form is
presented, but with less severe loading. This time, the platform member meets
requirements, and selected design details are presented after pushing ‘Evaluate’.
Figure 5-4 shows the input form and the associated design details. The details are limited
in the example problem, and the summary shows results associated only with the yoke
design, which is the focus of the example problem. In addition, cross-section property
results are given for all components of the valve extended structure. These results could
be much more extensive; for instance, a complete set of design data similar to that in
Appendix A could be provided, or a cost and lead-time quote and an invitation to
purchase could be offered.
Figure 5-3: Valve Custom Specification Input Form

123
When the form in Figure 5-3 is evaluated, the dialogue shown in Figure 5-5
appears, indicating failure of the standard valve, i.e., standard product platform. The
Figure 5-4: Example Valve Result Details

124
compromise question dialogue resolves by choosing ‘yes’ to attempt to compromise on
input (See Section 5.2.1), ‘no’ to proceed with the custom design of reinforcement ribs
(See Section 5.2.2), or ‘cancel’, which displays results and notes criteria failures (See
Figure 5-6 for an example) and is useful for assessing how to proceed toward feasibility,
for exploring the design space, and for assessing in-service overloads as discussed in
Section 5.1.
Figure 5-5: Compromise Question for the Valve Example

125
Engineer-to-order customization is included through a two-part strategy: (1) a
compromise input strategy implemented by a Pareto Frontier Plot that allows the user to
choose automatically between conflicting input parameters as described in Section 5.2.1,
and (2) an automatic reinforcement rib sizing strategy implemented through optimization
techniques as described in Section 5.2.2.
5.2.1 The Compromise Input Strategy
Choosing ‘Yes’ from the compromise question dialogue box initiates the
compromise input strategy. For this example, the user is given a tool for automatically
choosing a compromise between the effective seismic load (GEFF) and the actuator thrust,
as evident by the dialogue box text, and this combination is useful because it is known
that these parameters challenge valve performance most typically. The automated choice
Figure 5-6: Example Output Showing a Noted Criteria Failure

126
is implemented using a Pareto Frontier Plot, and Figure 5-7 shows the plot for this
example.
Input for the plot is obtained by evaluating valve performance at ten values of
GEFF, and for each, a goal seek iteration is performed on actuator thrust until the
corresponding maximum allowed thrust value is obtained that does not violate
performance constraints. Since only two variables are involved in the goal seek, a simple
optimality criteria algorithm is sufficient. As a precursor however, the upper extreme
Figure 5-7: Valve Example Pareto Frontier Plot

127
value of GEFF is determined from a similar goal seek with actuator thrust set equal to
zero, and this results in an eleventh point. In addition, the lowest value of GEFF equals
one, which corresponds to valve component dead weight loading. The enclosed shaded
region in Figure 5-7, which represents a feasible design space, is created from plotting the
eleven points, adding a twelfth point at (1,0) to close the loop.
As can be seen in Figure 5-7, the user is instructed to click inside the feasible
region to change the input form according to the clicked location point, and Figure 5-8
shows the response to a click inside this region, where a simple dialogue box indicates
the (GEFF, thrust) pair used to update the form, and the ‘*’ shows the location of the point,
which is close to the Pareto frontier. Although the example clicked location was placed
near the Pareto frontier, input can be obtained by clicking anywhere within the region,
and this allows the user complete freedom in exploring the design space.

128
Plot construction is performed using VML (Vector Markup Language), which is a
XML schema that can be implemented in Windows Internet Explorer™. Although VML
has weaknesses, such as poor documentation, inconsistent performance, and dwindling
support, it is used to develop this example because it is easy to program within an HTML
document. It is recognized that better approaches exists, such as SGV (Scalable Vector
Graphics), which is another XML schema, but SGV graphics must reside in a separate
file, which adds off-topic development complications. As future work, perhaps a better-
suited web-based graphing approach can be identified, or a SVG solution can be
developed.
Figure 5-8: Example Compromise Input Selection

129
Figure 5-9 shows posted output obtained from clicking ‘Evaluate’ on the input
form after clicking ‘OK’ on the dialogue shown in Figure 5-8. The actuator torque is
changed along with the thrust and GEFF as thrust and torque are related through valve
stem power transmission threads. Since the selected input from Figure 5-8 is close to the
Pareto frontier, it is expected that at least one limit criterion should be close to the
allowable, and as can be seen, this is true for the frame mode yoke legs stress.
Figure 5-9: Posted Output for the Compromise Input Example

130
5.2.2 The Reinforcement Rib Sizing Customization Strategy
Choosing ‘No’ from the compromise question dialogue box initiates the
reinforcement rib sizing strategy, and Figure 5-10 shows typical reinforcement ribs on a
yoke leg cross-section and on a general neck cross-section used to model other valve
extended structure sections. The strategy is to determine automatically the size of the
ribs, i.e., width (w) and height (h), considering all applicable extended structure sections.
The heart of the strategy is to limit rib dimensions to those given in Table 5-1 and
to employ an optimization algorithm that determines the ribs needed to meet custom
requirements. By limiting the choice of ribs, the optimization process is simplified,
which increases its chance of success. Full-penetration welds attach the ribs along the
length of the extended structure section, and the available rib selection reflects the
tradeoff between a narrow width, which is better for welding, and a small height, which
minimizes their effect on overall valve enveloping dimensions.
Figure 5-10: Cross-Section Rib Design Strategy
Yoke Legs General Neck
h
w

131
For the example rib strategy, the optimization problem is given by Eq. 5.1. A
simple ABC model is employed as the objective function, where the cost of adding ribs is
summed over all extended structure sections (NMAX). The cost for a given section of the
extended structure (N) equals the sum of a fixed cost, which is the first product in the
equation, and a variable cost, which is given by the remaining terms. The coefficient cN
tracks whether a rib is specified for the section, and when a rib is not specified, the cost
equals zero. The performance constraints (P) are the same as for the yoke component
class optimization problem given by Eq. 3.1. Bounds constraints, if any, are likely
different than those considered in Chapter 3, but no bounds constraints are considered for
the sake of simplicity here. One design variable is required for each section (N), and a
single design variable value, which is given by XI(N), is limited to one of the Index
integers from Table 5-1, which specifies a unique rib cross-section. Relative cost
Table 5-1: Cross-Section Rib Database
Index Width (w), [in] Height (h), [in] 1 0.25 1 2 0.25 2 3 0.5 2 4 0.5 3 5 0.75 2 6 0.75 3 7 1 3 8 1 4 9 1.5 4 10 1.5 5 11 0 0

132
parameters that define the ABC model are presented in Table 5-2, and as discussed in
Section 4.3.1.2, costs are given in dollars ($) although true cost magnitudes are masked to
protect confidential sources.
Because the design variables (XI) are integers and the objective function is not
continuous, the SA algorithm is employed, which is well suited for such problems. The
SA implementation used in Chapter 4 was converted to the .NET version of Visual Basic
( )∑ ++=MAXN
NWRNWSN
I wCwhCLCcF 2)X(
where:
0=Nc , if 11=INX , i.e., no rib for section N.
1=Nc , otherwise, i.e., a rib is specified for section N. Subject to:
P1 = (1 - f1(XI) / fMIN) < 0
P2 = (1 - f2(XI) / fMIN) < 0
P3 = (σ1(XI) / SA - 1) < 0
P4 = (σ2(XI) / SA - 1) < 0
XI(N) ∈ {1,2, … , 11}
5.1
Table 5-2: Rib ABC Model Parameters
Symbol Variable or Fixed Cost Value Description
CWS Fixed 75 Welding Setup Cost [$/weld]
CW Variable 4 Weld Raw Material Cost per Unit Volume [$/in3]
CR Variable 2 Rib Raw Material Cost per Unit Volume [$/in3]

133
for this example. Problem solution is robust because the design space is well constrained.
A typical problem with three extended structure sections (NMAX = 3) has only 1331 (113)
possible optimal solutions (XI*).
Once the SA algorithm is complete, the resulting solution is checked for
feasibility, and if feasible, i.e., every Pi(XI*) is less than or equal to zero, rib sizing is a
success, and the resulting solution is posted to the form. Figure 5-11 reiterates the
sample input from Figure 5-3 and gives the key results summary portion of the posted
output that shows that all constraints are satisfied. In addition, the output includes the
manufacturing cost for the required ribs ($142) and a valve model number (DD-150-3-
R020108X), and these have potential use for preparing a quotation and identifying the
required rib modifications. The ‘R020108X’ portion of the model number is coded such
that ‘02’ indicates the rib Index from Table 5-1, ‘01’ indicates the extended structure
section to receive the rib, and ‘08’ indicates the rib placement on the cross-section. The
posted output also includes the number of function evaluations (NFV) required to
perform the SA optimization. For this case, 4802 evaluations are required, which is not
at all excessive, and the corresponding computation time is only about fifteen seconds.

134
Figure 5-12 shows the portion of the posted output that lists cross-section
parameters including the required ribs. As can be seen, only the yoke legs (extended
structure Section 1) require ribs to satisfy the performance constraints of natural
frequency and stress.
Figure 5-11: Automatic Rib Design Example Key Results

135
5.3 Chapter Summary
In this chapter, an algorithm, which is summarized in Figure 5-1, is presented for
implementing a web-based virtual product platform portfolio that does not require the
existence of a physical product line, but is instantiated on-demand to meet user specified
custom requirements. The algorithm considers the strategic transformation of a baseline
standard product line into a product platform portfolio. In addition, it includes a strategy
for implementing an engineer-to-order customization procedure where key design
features are engineered on-demand, which is fundamentally different from most web-
Figure 5-12: Automatic Rib Design Example Cross-Section Parameters

136
based interfaces that employ an assemble-to-order strategy targeted toward high volume
products where variety is limited to what has been designed in advance. The engineer-to-
order customization procedure also includes a strategy for inviting the user to consider a
performance compromise in exchange for cost and/or lead time savings, which further
adds to design flexibility. Finally, the algorithm allows for the complete exploration of a
product platform member’s feasible design space, which is useful for assessing how to
proceed toward feasibility, for generally exploring the design space, and for assessing in-
service overloads.
As an example, the algorithm is applied to the module model valve component
product platform portfolio developed in the example from Chapter 4. A single web page
exists that demonstrates key portions of the algorithm including a user interface that
constrains input toward a single valve artifact, an output section that provides design
details upon determination of a satisfactory design, a compromise input strategy
implemented by a Pareto Frontier Plot, and a custom yoke leg reinforcement rib sizing
strategy. The rib sizing is automated using an SA optimization algorithm with an
objective function based on a simple ABC formulation. Several screen shots are
presented to demonstrate the implementation.
As a result of implementing the algorithm, the voice of the customer and custom
design requirements are introduced and addressed early in the design process, the
potential for overlooked requirements and misunderstandings is greatly reduced, and the
design specification process is improved overall.

137
Chapter 6
Conclusion and Future Work
This dissertation presents a methodology that fulfills the research objectives that
are embodied in three fundamental questions: (1) in what ways can platform-based
product development benefit small companies who produce highly customized products
at low volumes?, (2) how should product platform design differ from current research for
such products, and what factors are important for defining the best platform design
strategy?, and (3) how can the World Wide Web be used to facilitate customized product
design for low volume products? The methodology employs a bottom-up component
platform redesign strategy to transform an existing product line into a virtual product
platform portfolio with the goal of improving manufacturing cost and reducing
production lead time through the introduction of design commonality. Part of the
strategy is the implementation of a resulting virtual product platform portfolio through a
web-based interface that allows the incorporation of user-specified custom design
requirements early into the design process and allows for engineer-to-order customization
on-demand if necessary.
6.1 Dissertation Summary
As discussed in Chapter 1 of this dissertation, the presented methodology is
motivated by the need to improve commonality in a highly customized low volume

138
product line whose members were originally developed one-at-a-time to meet specific
customer requirements, as it can be difficult to achieve and maintain commonality under
this scenario. The methodology builds upon existing research as outlined in Chapter 2,
and a specific focus is on extending the Product Platform Concept Exploration Method
using bottom-up product platform design techniques. Chapter 3 and Chapter 4 present
detailed methodologies for transforming an existing product line of low volume highly
customized products into a virtual product platform portfolio through targeted component
redesign. Finally, Chapter 5 presents an algorithm for implementing a resulting virtual
portfolio through a web-based interface that allows the early incorporation of custom
design requirements into the design process. Details on each contribution follow.
6.1.1 Bottom-Up Platform Design Methodology
Chapter 3 presents a methodology for redesigning an existing line of low volume
highly customized products using a bottom-up product platform development approach
that is based on the PPCEM. Rather than redesign an entire product line, the focus is on
the redesign of a limited set of components with the highest potential for cost savings,
and when applied across the product line, a component-based product platform portfolio
results.
The methodology involves three phases of redesign team activity. In Phase 1,
design knowledge and history is collected about every aspect of the existing product line,
which is employed throughout the redesign process. In Phase 2, a baseline standard
product line is constructed that provides a reference to compare with any redesign effort,

139
and this involves defining a targeted market segmentation grid and targeted components
for redesign, aggregating design inputs, and defining the baseline standard. In Phase 3,
critical component performance functions are aggregated, and targeted component classes
are developed that are then instantiated to yield candidate component platforms. Then,
the redesign involves developing a baseline standard redesign strategy around common
component classes.
Candidate component platforms are created by instantiating the component
classes, and a product platform portfolio is created by replacing baseline standard
components with a select subset of candidate platforms by stretching and/or scaling key
platform parameters. Chapter 4 provides a methodology for optimizing the cost
effectiveness of the portfolio.
To be effective, a component class must adequately address cost, and the
methodology proposes the use of Activity-Based Costing (ABC) to define the
relationship between design parameters and cost. A generalized ABC model is presented
under a low volume production scenario, and a tradeoff metric is formulated that is used
to capture potential cost savings between a proposed product platform portfolio and the
baseline standard product line.
6.1.2 Component Product Platform Portfolio Optimization
Chapter 4 presents a methodology for determining an optimal product platform
portfolio from a subset of candidate component platforms that were developed using the
component-based platform redesign methodology presented in Chapter 3. The
140
methodology is built around an optimization procedure with the goal of minimizing
manufacturing cost without sacrificing product performance or customer perceived
variety.
With a targeted market segmentation grid as a precursor, the process proceeds in
four steps. In Step 1, a set of candidate component platforms is developed, and although
not a necessity, application of the methodology presented in Chapter 3 meets the
requirements for this step. In Step 2, the feasibility of using each candidate on each
artifact is tested, and what results is a collection of candidates for each artifact that satisfy
constraints for that artifact. Step 3 is the formulation of an optimization problem with
one design variable associated with each artifact that points to the candidate to use as a
platform for that artifact. The optimization problem is solved in Step 4 to yield a product
platform portfolio, and a zero-order method is required because the design variables are
constrained to integers and the objective function is not guaranteed to be a continuous
function.
The presented methodology can create the most cost-effective product platform
portfolio from a set of candidate component platforms. The resulting portfolio does not
rely on traditional vertical, horizontal, or beachhead leveraging strategies across the
market segmentation grid, and this is especially beneficial for a product line that was
developed one-at-a-time with designs that may be inconsistent from one to another.

141
6.1.3 Web-Based Product Platform Portfolio Implementation
In Chapter 5, an algorithm is presented for implementing a web-based virtual
product platform portfolio that does not require the existence of a physical product line
but is instantiated on demand to meet user specified custom requirements. The algorithm
considers the strategic transformation of a baseline standard product line into a product
platform portfolio. In addition, it includes strategy for implementing an engineer-to-
order customization procedure where key design features are engineered on-demand,
which is fundamentally different from most web-based interfaces that employ an
assemble-to-order strategy targeted toward high volume products where variety is limited
to what has been designed in advance. The algorithm also includes a strategy for inviting
a user to consider a performance compromise in exchange for cost and/or lead-time
savings, which further increases design flexibility.
As a result of implementing the algorithm, the voice of the customer and custom
design requirements are introduced and addressed early in the design process, the
potential for overlooked requirements and misunderstandings is greatly reduced, and the
design specification process is improved overall.
6.1.4 The Valve Yoke Redesign Example Problem
The methodologies presented in Chapters 3-5 are illustrated with a single example
involving the redesign of yokes on a product line of nuclear-grade valves, which is very
representative of a low volume highly customized product line. In Chapter 3, the valve
product line is introduced, and the component platform redesign methodology is applied

142
toward it step-by-step. A targeted market segmentation grid is defined, a baseline
standard product line is defined from existing artifacts and from existing product
knowledge, a redesign strategy is presented involving a yoke component class and two
alternative yoke mounting interface models, and finally, the yoke component class is
instantiated for each member of the targeted market segmentation grid to yield a set of
candidate component platforms.
The example is continued in Chapter 4 where the product platform portfolio
optimization methodology is employed to create a valve product platform portfolio from
a subset of the instantiated candidate platforms. The optimization methodology is
illustrated in two ways. First, component platform commonality alone is the focus for
simplicity, where the minimum number of platforms required to span the targeted market
segmentation grid is determined without consideration of the interface with each artifact,
and this provides a clear demonstration of the basic optimization procedure step-by-step.
With the second example, interfacing flange design strategies and a custom ABC model
are considered to create a realistic tradeoff metric that properly addresses manufacturing
cost in the optimization problem objective function.
Two alternative yoke mounting interface stretching/scaling strategies are
proposed in Chapter 3, which are the module and stretched models, and a goal of the
second example in Chapter 2 is to determine which is better. In this second example,
some artifacts from the original market segmentation grid are removed before proceeding
with the optimization, and this demonstrates some flexibility inherent in the process. Not
only is it concluded that the module model is better, it is demonstrated capable of

143
achieving maximum possible commonality; however, a caveat is that the sensitivity of
results to cost model parameters is a topic for future study.
In Chapter 5, the presented web-based implementation algorithm is applied to the
module model valve component-based product platform portfolio from the Chapter 4
example. A single web page is created that demonstrates key portions of the algorithm,
including a user interface that constrains input toward a single valve artifact, an output
section that provides design details upon determination of a satisfactory design, a duel-
option engineer-to-order strategy consisting of a compromise input strategy implemented
by a Pareto Frontier Plot, and a custom yoke leg reinforcement rib sizing strategy. The
rib sizing is automated using an SA optimization algorithm with an objective function
based on a simple ABC formulation.
6.2 Research Contributions
The methodologies and algorithms presented in this thesis build upon existing
research regarding product platform portfolio design, i.e., the Product Platform Concept
Exploration Method, and extend it to bottom-up design techniques. A detailed
methodology is presented for the specific focus for transforming an existing product line
of low volume highly customized products into a virtual product platform portfolio
through targeted component redesign. In addition, an algorithm is presented for
implementing a virtual product platform portfolio through a web-based interface that
allows the early incorporation of custom design requirements into the design process and
includes strategies for custom design features on demand through an engineer-to-order

144
approach. Implementing a virtual product platform portfolio improves the specification
of low volume highly customized products as it avoids the stocking of inventory yet
allows for quick response to custom requests.
The methodology also introduces the concept of a component class that is
instantiated to yield candidate component platforms for replacing components from an
existing product line with the greatest potential for cost savings from a redesign effort. In
addition, an innovative method is presented for creating a component-based product
platform portfolio that spans a targeted market segmentation grid with optimal cost
effectiveness without relying on traditional leveraging strategies.
In conclusion, Table 6-1 summarizes the research contributions side-by-side with
the corresponding motivating research questions from the summary of research questions
and objectives in Table 1-1.

145
6.3 Research Limitations
The presented methodology is intended for the redesign of an existing product
line that is produced in low volumes and often must adapt to varied and unknown future
custom design requirements. In addition, the focus is on a product line that was created
one-at-a-time to respond to specific requirements without considering the product line as
a whole. Such a product line can lack commonality of features leading to high
development and production costs that are difficult to predict and to long and uncertain
production times. Applying the proposed methodology can transform an exiting line by
Table 6-1: Summary of Research Contributions
Research Questions Research Contributions
How can product platforms benefit the design of low
volume highly customized products?
Bottom-up methodology and targeted component redesign as an extension of the PPCEM.
Component class, component platform, and
component-based product platform portfolio concepts.
How should product platform design differ from current
research, and what factors are important?
A portfolio optimization methodology that does not rely on traditional leveraging strategies.
A portfolio manufacturing cost model that employs
Activity Based Costing methodology.
How can the Web be used to facilitate product platform portfolio implementation?
An algorithm for virtual portfolio implementation and early custom specification evaluation.
Strategy to transform a baseline standard product line
into a product platform portfolio.
Engineer-to-order ‘customize’ and ‘compromise’ methodology.
An integrated design and marketing tool that can improve cost, lead-time, and customer goodwill.

146
adding commonality to key components that often require redesign resulting in cost
savings from a more streamlined production process and by incorporating custom
requirements early into the design process that potentially reduces costly rework and
missed requirements.
Although only one product line example is given for applying the methodology,
the example is highly representative of the type of product that is the focus of the
methodology. The example is presented in detail such that all aspects of the
methodology are demonstrated. A realistic redesign project could potentially result in a
voluminous amount of detail that is beyond the scope of a typical thesis, but the example
purposely limits details to a manageable level so as not to detract from demonstrating the
underlying methodology. In addition, although the valve product line is real, the yoke
redesign example does not reflect a real redesign project, and details such as the choice of
the targeted market segmentation grid or the module verses stretched mounting flange
interface design strategy are strictly the creation of the researcher and not the effort of a
realistic redesign team consisting of all aspects of the business. Finally, a real-world
design team could potentially identify additional improvements and cost savings that
were not readily apparent with the documented example using the methodology as they
would benefit from having different perspectives on the team (e.g., manufacturing,
marketing, management).
There are other limitations that were discovered during work on the example
problem. For instance, the SA algorithm used in Chapter 4, which solves the
optimization problem associated with the product platform portfolio non-traditional
market segmentation grid leveraging strategy, is not sufficiently robust to give consistent

147
results. In addition, since a real-world design team was not assembled, data collection
resources were limited, which makes it impossible to apply robust design techniques as
advocated in Section 3.1.1.
These limitations provide some of the motivation for potential future work, which
is the final topic for discussion, and which is presented next.
6.4 Potential Future Research
The presented methodology provides a strong foundation for addressing the
focused intent of redesigning an existing line of low volume highly customized products,
and of implementing a resulting product platform portfolio. However, there is potential
for strengthening and reinforcing the utility of the underlying methods, and some
thoughts for improvement and for extending the work to other research areas are
presented in these final paragraphs.
Implementation of the product platform portfolio optimization procedure given in
Chapter 4 can benefit from an improved zero-order optimizer. The SA algorithm
employed in the example does not yield consistent results, and the inconsistency
increases with the number of candidate component platforms. As an alternative to or
concurrent with a better portfolio optimizer, a strategy for dividing the targeted market
segmentation grid into more manageable sub-segments could improve consistency;
however, sub-segmenting could reduce the generality of results. As another alternative,
perhaps a hybrid between the proposed arbitrary leveraging strategy and traditional
148
leveraging could prove acceptable, and traditional horizontal, vertical, or beachhead
leveraging could be employed in a way that is natural for the product line.
The underlying premises behind the presented methodology could be
strengthened through the preparation of other example problems. By its very nature, low
volume highly customized products can include varied design challenges, and addressing
other examples could bring to the surface other design needs that were not readily
apparent during development of the methodology. The best examples are real-world
projects conducted by a redesign team consisting of all aspects of the targeted product
line from sales and marketing to design and manufacturing. Without the need to present
a methodology, a real-world project could concentrate on the redesign task at hand and
provide interesting detail on topics such as formation of the redesign team, how to
compromise on design strategy among the team members, or successful manufacture of
an instantiated virtual product platform member. Typically, heavy industrial equipment
used for material processing, manufacturing, or power production are produced in low
volume and require customization, and thus, they could benefit from application of the
methodology. Some specific examples of products discussed in the literature that could
benefit are hydraulic cylinders (Shirley 1990), absorption chillers (Seepersad, et al. 2000;
2002), and refiner plates (Simpson, et al. 2003).
A few specific enhancements to the presented methodology are worthy of
mention. A real-world project could present opportunities to apply robust design
techniques as advocated in Section 3.1.1, and to develop a sensitivity analysis strategy as
recommended in Section 4.3.3. With a real-world project, the final tangible product is
the web-based interface described in Chapter 5, and a real-world interface could benefit

149
from additional features. For instance, a help system could be supplied to guide the user
in interface navigation, or supporting web pages could be created to enhance its utility.
With the valve yoke redesign example problem for example, supporting pages could be
added to allow the choice of different material specifications and different allowable
stress criteria, and a detailed sales price and an invitation to purchase could be presented
along with final design details. In addition, other analysis procedures could be included
such as the stress analysis of other components (e.g., the stem, the discs, and the actuator
mounting flange). Finally, other component platforms could be developed (e.g., for the
stem). A real-world web-based interface may benefit from access control (e.g., a login
system) that could help track usage and sales and could protect against damaging use by
competitors (e.g., inside information leading to unfair advantage when bidding for jobs).
A real-world project could reveal unforeseen hurdles, and the first hurdle is
getting a project off the ground. An important area of future work is to determine the
best way to introduce such a redesign project to management. For example, at Flowserve
Corporation, which is the source of the example product line, the policy is that all capital
is procured through Black Belt projects. The proposed methodology could appear radical
to some, which could hinder project approval as management may require information
regarding a successful example implementation, and perhaps a small project (i.e., one that
does not require significant resources or commitment and has low risk) could be
proposed and implemented and later used to springboard larger, more radical projects.
Perhaps portions of the methodology could be applied to the general design or
redesign of various products in an emerging or existing product platform portfolio. For
example, the product platform optimization procedure outlined in Chapter 4 is presented

150
as a stand-alone process that could be applied to an existing product line without
implementing the overall methodology. For instance, given a product line that currently
requires multiple size fasteners, the platform portfolio optimization process could be
used, perhaps with minor modification, to design a portfolio of fasteners that improves
size commonality.
There is potential to extend the research in several areas. The ABC model could
be expanded beyond manufacturing cost to include, for example, inventory, decreased
design cost due to the streamlined process, decreased lead time, mistake avoidance, or
improved quality. The minimum commonality example in Chapter 4 is a type of
minimum cover problem that could be solved using an integer programming algorithm,
leading to improved convergence rates. Another interesting future research topic is how
to extend the methodology to redesign multiple components, especially when there are
common interfaces that must be considered to reduce cost and increase performance.

151
Bibliography
Abbass, H. A., Sarker, R. and Newton, C., 2001, "A Pareto-frontier Differential Evolution Approach for Mult-objective Optimization Problems," Proceedings of the IEEE Conference on Evolutionary Computation, Vol. 2, pp. pp 971-978.
Abrahamson, S., Senin, N., Wallace, D. and Borland, N., 1999, Sept. 12-16, "Integrated Engineering, Geometric, and Customer Modeling: LCD Projector Design Case Study," 1999 ASME Engineering Technical Conferences - Computers in Engineering Conference, Las Vegas, NV, ASME, Paper No. DETC/CIE-9084.
Ahn, S. H., Sundararajan, V., Smith, C., Kannan, B., D'Souza, R., Sun, G., Mohole, A., Wright, P. K., Kim, J., McMains, S., Smith, J. and Sequin, C. H., 2001, "CyberCut: An Internet-based CAD/CAM System," ASME Journal of Computing and Information Science in Engineering, Vol. 1, No. 1, pp. 52-59.
Allada, V. and Lan, J., 2002, Sept. 29 - Oct. 2, "New Modules Launch Planning for Evolving Modular Product," ASME 2002 Design Engineering Technical Conferences - Design For Manufacturing Conference, Montreal, Canada, ASME, Paper No. DETC2002/DFM-34190.
Anderson, D. M. and Pine, B. J., II, 1997, Agile Product Development For Mass Customization, Irwin, Chicago, IL.
Balabanov, V., Giunta, A. A., Golovidov, O., Grossman, B., Mason, W. H. and Watson, L. T., 1999, "Reasonable Design Space Approach to Response Surface Approximation," Journal of Aircraft, Vol. 36, No. 1, pp. 308-315.
Balakrishnan, A., Kumara, S. R. T. and Sandaresan, S., 1999, "Manufacturing in the Digital Age: Exploiting Information Technologies for Product Realization," Information Systems Frontiers, Vol. 1, No. 1, pp. 25-50.
Baldwin, C. Y. and Clark, K. B., 2000, Design Rules Volume 1. The Power of Modularity, MIT Press, Cambridge, MA.
Belegundu, A. D. and Chandrupatla, T. R., 1999, Optimization Concepts and Applications in Engineering, Prentice Hall, Upper Saddle River, NJ.
Benami, O. and Jin, Y., 2000, Sept. 10-13, "An E-Documenting Approach to Conceptual Design," 2000 ASME Design Engineering Technical Conferences - Computers In Engineering Conference, Baltimore, MD, ASME, Paper No. DETC2000/CIE-14649.

152
Berti, S., Germani, M., Mandorli, F. and Otto, H. E., 2001, August 21-23, "Design of Product Families - An Example Within a Small and Medium Sized Enterprise," International Conference on Engineering Design, Glasgow, ICED 01-C586/344.
Blackenfelt, M. and Sellgren, U., 2000, Sept. 10-13, "Design Of Robust Interfaces In Modular Products," ASME 2000 Design Engineering Technical Conferences - Design Automation Conference, Baltimore, MD, ASME, Paper No. DETC00/DAC-14486.
Chen, Y. H., Wang, Y. Z. and Wong, M. H., 2001, "A Web-Based Fuzzy Mass Customization System," Journal of Manufacturing Systems, Vol. 20, No. 4, pp. 280-287.
Coutinho, M., Eleish, R., Kim, J., Kumar, V., Ling, S. R., Neches, R. and Will, P., 1998, Sept. 13-16, "Active Catalogs: Integrated Support for Component Engineering," 1998 ASME Design Engineering Technical Conference - Computers in Engineering Conference, Atlanta, GA, ASME, Paper No. DETC98/CIE-5521.
Dahmus, J. B., Gonzalez-Zugasti, J. P. and Otto, K. N., 2000, September 10-13, "Modular Product Architecture," ASME Design Engineering Technical Conferences - Design Theory and Methodology Conference, Baltimore, MD, ASME, Paper No. DETC2000/DTM-14565.
Dai, Z. and Scott, M. J., 2006, "Effective Product Family Design Using Preference Aggregation," ASME Journal of Mechanical Design, Vol. 128, No. 4, pp. 659-667.
de Weck, O. L., Suh, E. S. and Chang, D., 2003, "Product Family and Platform Portfolio Optimization," ASME Design Engineering Technical Conferences - Design Automation Conference, Chicago, IL, ASME, DETC2003/DAC-48721.
D'Souza, B. S. and Simpson, T. W., 2002, Sept. 29-Oct. 2, "A Genetic Algorithm Based Method for Product Family Design Optimization," ASME 2002 Design Engineering Technical Conferences - Design Automation Conference, Montreal, Canada, ASME, Paper No. DETC02/DAC-34106.
D'Souza, B. S. and Simpson, T. W., 2003, "A Genetic Algorithm Based Method for Product Family Design Optimization," Engineering Optimization, Vol. 35, No. 1, pp. 1-18.
Duray, R., Ward, P. T., Milligan, G. W. and Berry, W. L., 2000, "Approaches to Mass Customization: Configurations and Emperical Validation," Journal Of Operations Management, Vol. 18, No. 6, pp. 605-625.
Eckel, B., 2000, Thinking in C++, 2nd Edition, Prentice Hall, Upper Saddle River, New Jersey.

153
Ericsson, A. and Erixon, G., 1999, Controlling Design Variants: Modular Product Platforms, ASME, New York.
Ezekoye, L. I., 1978, "A Simplified Method for Calculating the Natural Frequency of Valve Superstructures," Paper No. 78-PVP-4, ASME, New York.
Farrell, R. S., 1999, "Automated design optimization of valve bolted flanges," M.S. Thesis, Mechanical & Nuclear Engineering, Penn State University, University Park, PA.
Farrell, R. S. and Simpson, T. W., 2003, "Product Platform Design to Improve Commonality in Custom Products," Journal of Intelligent Manufacturing, Vol. 14, No. 6, pp. 541-536.
Farrell, R. S. and Simpson, T. W., 2006, "A Method to Improve Platform Leveraging in a Market Segmentation Grid within an Existing Product Line," ASME Design Engineering Technical Conferences - Design Automation Conference, Philadelphia, PA, ASME, Paper No. DETC2006/DAC-99469.
Farrell, R. S., Stump, G., Park, J. and Simpson, T. W., 2003, Sept 2-6, 2003, "A Prototype Web-Based Custom Product Specification System," ASME 2003 Design Engineering Technical Conferences - Computers In Engineering Conference, Chicago, IL, ASME, Paper No. DETC2003/CIE-48274.
Farrell, R. S., Stump, G., Park, J. and Simpson, T. W., 2007, "Prototype Implementation of a Virtual Product Family Through a Web-Based Custom Product Specification System," International Journal of Mass Customisation, Vol. 2, No. 1, pp. 161-178.
Feitzinger, E. and Lee, H. L., 1997, "Mass Customization at Hewlett-Packard: The Power of Postponement," Harvard Business Review, Vol. 75, No. 1, pp. 116-121.
Fellini, M. K., Papalambros, P. Y. and Perez-Duarte, A., 2002, Sept. 29 - Oct. 2, "Platform Selection Under Performance Loss Constraints In Optimal Design of Product Families," ASME 2002 Design Engineering Technical Conferences - Design Automation Conference, Montreal, Canada, ASME, Paper No. DETC2002/DAC-34099.
Fellini, R., Kokkolaras, M. and Papalambros, P., 2005a, "Commonality Decisions in Product Family Design," Product Platform and Product Family Design: Methods and Applications (Jiao, J., ed.), Springer, New York, pp. 157-185.
Fellini, R., Kokkolaras, M., Papalambros, P. and Perez-Duarte, A., 2005b, "Platform Selection Under Performance Loss Constraints in Optimal Design of Product Families," ASME Journal of Mechanical Design, Vol. 127, No. 4, pp. 524-535.

154
Flores, R., Jensen, G. G. and Shelley, J., 2002, Sept. 29 - Oct. 2, "A Web Enabled Process for Accessing Customized Parametric Designs.," ASME 2002 Design Engineering Technical Conferences - Design Automation Conference, Montreal, Canada, ASME, Paper No. DETC2002/DAC-34078.
Fujita, K., 2002, "Product Variety Optimization Under Modular Architecture," Computer-Aided Design, Vol. 34, No. 12, pp. 953-965.
Fujita, K., Sakaguchi, H. and Akagi, S., 1999, "Product Variety Deployment and Its Optimization Under Modular Architecture and Module Commonalization," ASME Design Engineering Technical Conferences, Las Vegas, NV, Paper No. DETC99/DFM-8923.
Fujita, K., Yoneda, T., Akagi, S. and Ishikawa, M., 1998, "Simulateous Optimization of Product Family Sharing System Structure and Configuration," ASME Design Engineering Technical Conferences, Atlanta, GA, Paper No. DETC98/DFM-5722.
Fujita, K. and Yoshida, H., 2001, "Product Variety Optimization: Simultaneous Optimization of Module Combination and Module Attributes," ASME Design Engineering Technical Conference and Computers and Information in Engineering Conference, Pittsburgh, PA, Paper No. DETC2001/DAC-21058.
Galsworth, G. D., 1994, Smart, Simple Design, Omneo, Essex Junction, VT.
Georgiopoulos, P., Fellini, M. K., Sasena, M. and Papalambros, P. Y., 2002, Sept. 29 - Oct. 2, "Optimal Design Decisions In Product Portfolio Valuation," ASME Design Engineering Technical Conferences - Design Automation Conference, Montreal, Canada, ASME, Paper No. DETC2002/DAC-34097.
Gerhard, J. F., Rosen, D. W., Allen, J. K. and Mistree, F., 2000, Sept. 10-13, "A Distributed Product Realization Environment for Design and Manufacturing," 2000 ASME Design Engineering Technical Conference - Computers in Engineering, Baltimore, MD, ASME, Paper No. DETC2000/CIE-14624.
Gobinath, N., Cecil, J. and Son, T., 2006, "An Internet Based Framework for Micro Devices Assembly," ASME 2006 International Design Engineering Technical Conferences & Computers and Information in Engineering Conference, Philadelphia, PA, Paper No. DETC2006-99698.
Gonzalez-Zugasti, J. P. and Otto, K. N., 2000, Sept. 10-13, "Modular Platform-Based Product Family Design," ASME Design Engineering Technical Conferences - Design Automation Conference, Baltimore, MD, ASME, Paper No. DETC-2000/DAC-14238.
155
Gonzalez-Zugasti, J. P., Otto, K. N. and Baker, J. D., 1998, Sept. 13-16, "A Method for Architecting Product Platforms With an Application to Interplanetary Mission Design," 1998 ASME Design Engineering Technical Conferences - Design Automation Conference, Atlanta, GA, ASME, Paper No. DETC-1998/DAC-5608.
Gonzalez-Zugasti, J. P., Otto, K. N. and Baker, J. D., 1999, Sept. 12-15, "Assessing Value For Product Family Design And Selection," ASME 1999 Design Engineering Technical Conferences - Design Automation Conference, Las Vegas, NV, ASME, Paper No. DETC99/DAC-8613.
Gu, P. and Watson, G., 2001, Sept. 9-12, "HOME: House of Modular Enhancement for Product Redesign for Modularization," ASME 2001 Design Engineering Technical Conferences - Design Automation Conference, Pittsburgh, PA, ASME, Paper No. DETC2001/DAC-21064.
Gu, X., Renaud, J. E., Ashe, L. M. and Batill, S. M., 2000, Sept. 10-13, "Decision-Based Collaborative Optimization Under Uncertainty," ASME 2000 Design Engineering Technical Conferences - Design Automation Conference, Baltamore, MD, ASME, Paper No. DETC2000/DAC-14297.
Han, C. S., Kunz, J. C. and Law, K. H., 1999, "An Internet-Based Distributed Service Architecture," ASME Design Engineering Technical Conferences - Computers in Engineering Conference, Las Vegas, NV, ASME, Paper No. DETC99/CIE-9077.
Hernandez, G., Allen, J. K. and Mistree, F., 2002, Sept. 29 - Oct. 2, "Design Of Hierarchic Platforms For Customizable Products," ASME Design Engineering Technical Conferences - Design Automation Conference, Montreal, Canada, ASME, Paper No. DETC2002/DAC-34095.
Hernandez, G., Allen, J. K., Simpson, T. W., Bascaran, E., Avila, L. F. and Salinas, F., 2001, "Robust Design of Families of Products With Production Modeling and Evaluation," ASME Journal of Mechanical Design, Vol. 123, No. 2, pp. 183-190.
Ishii, K. and Yang, T. G., 2003, Sept. 2-6, "Modularity: International Industry Benchmarking and Research Roadmap," ASME 2003 Design Engineering Technical Conferences - Design For Manufacturing Conference, Chicago, Illinois, ASME, Paper No. DETC2003/DFM-48132.
Jayaram, S., Vance, J. M., Gadh, R., Jayaram, U. and Srinivasan, H., 2001, "Assessment of VR Technology and its Applications to Engineering Problems," ASME Journal of Computing and Information Science in Engineering, Vol. 1, No. 1, pp. 72-83.
Khajavirad, A. and Michalek, J. J., 2007, "An Extension of the Commonality Index for Product Family Optimization," ASME Design Engineering Technical Conferences - Design Automation Conference, Las Vegas, NV, ASME, Paper No. DETC2006-DAC35605.

156
Knill, D. L., Giunta, A. A., Baker, C. A., Grossman, B., Mason, W. H., Haftka, R. T. and Watson, L. T., 1999, "Response Surface Models Combining Linear and Euler Aerodynamics for Supersonic Transport Design," Journal of Aircraft, Vol. 36, No. 1, pp. 75-86.
Lipson, H., Pollack, J. B. and Suh, N. P., 2001, Sept. 9-12, "Promoting Modularity in Evolutionary Design," ASME 2001 Design Engineering Technical Conferences - Design Automation Conference, Pittsburgh, PA, ASME, Paper No. DETC2001/DAC-21099.
Marion, T. J., Thevenot, H. J. and Simpson, T. W., 2007, "A Cost-based Methodology for Evaluating Product Platform Commonality Sourcing Decisions with Two Examples," International Journal of Production Research, pp. in press.
Martin, M. V. and Ishii, K., 1997, Sept. 14-17, "Design For Variety: Development Of Complexity Indicies And Design Charts," ASME Design Engineering Technical Conferences - Design For Manufacturing Conference, Sacramento, CA, ASME, Paper No. DETC97/DFM-4359.
Martin, M. V. and Ishii, K., 2000, September 10-13, "Design for Variety: A Methodology for Developing Product Platform Architectures," ASME 2000 Design Engineering Technical Conferences - Design For Manufacturing Conference, Baltimore, MD, ASME, Paper No. DETC2000/DFM-14021.
Mather, H., 1995, October 22-27, "Product Variety -- Friend or Foe?," 38th American Production & Inventory Control Society International Conference and Exhibition, Orlando, FL, APICS, pp. 378-381.
Maupin, A. J. and Stauffer, L. A., 2000, September 10-13, "A Design Tool to Help Small Manufacturers Reengineer a Product Family," ASME 2000 Design Engineering Technical Conferences - Design Theory and Methodology Conference, Baltimore, MD, ASME, Paper No. DETC2000/DTM-14568.
Messac, A., Ismail-Yahaya, A. and Mattson, C. A., 2003, "The Normalized Normal Constraint Method for Generating the Pareto Frontier," Structural and Multidisciplinary Optimization, Vol. 25, No. 2, pp. 86-98.
Messac, A., Martinez, M. P. and Simpson, T. W., 2000, September 10-13, "Effective Product Family Design Using Physical Programming and the Product Platform Concept Exploration Method," ASME 2000 Design Engineering Technical Conferences - Design Automation Conference, Baltimore, MD, ASME, Paper No. DETC2000/DAC-14252.
Messac, A., Martinez, M. P. and Simpson, T. W., 2002, "Effective Product Family Design Using Physical Programming," Engineering Optimization, Vol. 34, No. 3, pp. 245-261.

157
Meyer, M. H., 1997, "Revitalize Your Product Lines Through Continuous Platform Renewal," Research Technology Management, Vol. 40, No. 2, pp. 17-28.
Meyers, R. H. and Montgomery, D. C., 2002, Response Surface Methodology, 2, John Wiley & Sons, Inc., New York.
Montgomery, D. C., 2001, Design and Analysis of Experiments, 5th edition, John Wiley & Sons, Inc., New York.
Nayak, R. U., Chen, W. and Simpson, T. W., 2000, Sept. 10-13, "A Variation-Based Method for Product Family Design," ASME 2000 Design Engineering Technical Conferences - Design Automation Conference, Baltamore, MD, ASME, Paper No. DETC2000/DAC-14264.
Nayak, R. U., Chen, W. and Simpson, T. W., 2002, "A Variation-Based Method for Product Family Design," Engineering Optimization, Vol. 34, No. 1, pp. 65-81.
Nelson, S. A., Parkinson, M. B. and Papalambros, P. Y., 2001, "Multicriteria Optimization in Product Platform Design," ASME Journal of Mechanical Design, Vol. 123, No. 2, pp. 199-204.
Park, J., 2003, "Production Cost Modeling To Support Product Family Design Optimization," ASME Design Engineering Technical Conferences and Computers and Information in Engineering Conference, Chicago, IL, Paper No. DETC2003/DAC-48720.
Park, J. and Simpson, T. W., 2003, Sept. 2-6, "Production Cost Modeling To Support Product Family Design Optimization," ASME Design Engineering Technical Conferences - Design Automation Conference, Chicago, IL, ASME, Paper No. DETC2003/DAC-48720.
Parkinson, J., Taylor, C. L., Cox, J. J. and Roach, G. M., 2004, Sept. 28 - Oct. 3, "A Methodology For Web-Based Product Family Design Systems," ASME 2004 Design Engineering Technical Conferences - Computers In Engineering Conference, Salt Lake City, Utah, ASME, Paper No. DETC2004/CIE-?
Pessina, M. W. and Renner, J. R., 1998, "Mass Customization at Lutron Electronics - A Total Company Process," Agility & Global Competition, Vol. 2, No. 2, pp. 50-57.
Pine, B. J., II, 1993, "Mass Customizing Products And Services," Planning Review, Vol. 22, No. 4, pp. 6-13, 55.
Prince, J., 2006, "The Beginning of Online/Retail Competition and its Origins: An Application to Personal Computers," International Journal of Industrial Organization, Vol. 25, pp. 139-156.

158
Roark, R. J. and Young, W. C., 1989, Formulas for Stress and Strain, 6th Edition, McGraw-Hill, New York.
Robertson, D. and Ulrich, K., 1998, "Planning For Product Platforms," Sloan Management Review, Vol. 39, Summer 1998, pp. 19-31.
Sabbagh, K., 1996, Twenty-First Century Jet: The Making and Marketing of the Boeign 777, Scribner, New York, NY.
Sanderson, S. W. and Uzumeri, M., 1997, Managing Product Families, Irwin, Chicago, IL.
Satish, V. V., Motipalli, K. and Krishnaswami, P., 2006, "An Innovative Web Application for Design and Automated NC Code Generation," ASME 2006 Design Engineering Technical Conferences & Computers and Information in Engineering Conference, Philadelphia, PA, Paper No. DETC2006-99503.
Seepersad, C. C., Hernandez, G. and Allen, J. K., 2000, Sept. 10-13, "A Quantitative Approach to Determining Product Platform Extent," ASME 2000 Design Engineering Technical Conferences - Design Automation Conference, Baltimore, MD, ASME, Paper No. DETC00/DAC-14288.
Seepersad, C. C., Mistree, F. and Allen, J. K., 2002, Sept. 29-Oct. 2, "A Quantitative Approach for Designing Multiple Product Platforms for an Evolving Portfolio of Products," ASME Design Engineering Technical Conferences - Design Automation Conference, Montreal, Canada, ASME, Paper No. DETC02/DAC-34096.
Senin, N., Wallace, D. and Borland, N., 2003, "Distributed Object-Based Modeling in Design Simulation Marketplace," Journal of Mechanical Design, Vol. 125, No. 1, pp. 2-13.
Shirley, 1990, "Models For Managing The Redesign And Manufacture Of Product Sets," Journal Of Manufacturing And Operations Management, Vol. 3, No. 2, pp. 85-104.
Siddique, Z. and Rosen, D. W., 1998, Sept. 13-16, "On The Applicability Of Product Variety Design Concepts To Automobile Platform Commonality," 1998 ASME Design Engineering Technical Conferences - Design Theory and Methodology Conference, Atlanta, GA, ASME, Paper No. 98-DETC/DTM-5661.
Siddique, Z. and Rosen, D. W., 2000, Sept. 10-13, "Product Family Configuration Reasoning Using Discrete Design Spaces," ASME 2000 Design Engineering Technical Conferences - Design Theory and Methodology Conference, Baltamore, MD, ASME, Paper No. DETC2000/DTM-14666.

159
Siddique, Z. and Shao, Z., 2001, September 9-12, "A Graph Grammar Based Approach for Development of an Internet-Based Product Family Information System," ASME Design Engineering Technical Conferences - Computers in Engineering Conference, Pittsburgh, PA, ASME, Paper No. DETC2001/CIE-21280.
Simison, R. L., 2000, "GM Retools to Sell Custom Cars Online," Wall Street Journal, New York, Sec. B, p. 23.
Simpson, T. W., 2004, "Product Platform Design and Customization: Status and Promise," Artificial Intelligence for Engineering Design, Analysis and Manufacturing, Vol. 18, No. 1, pp. 3-20.
Simpson, T. W., 2005, "Methods for Optimizing Product Platforms and Product Families: Overview and Classification," Product Platform and Product Family Design: Methods and Applications (Simpson, T. W., Siddique, Z., Jiao, J., eds.), Springer, New York, pp. 133-156.
Simpson, T. W., Chen, W., Allen, J. K. and Mistree, F., 1997a, Oct. 13-16, "Designing Ranged Sets of Top-Level Design Specifications for a Family of Aircraft: An Application of Design Capability Indicies," SAE World Aviation Congress and Exposition, Anaheim, CA, Paper No. AIAA 97-5513.
Simpson, T. W., Maier, J. R. A. and Mistree, F., 1999, September 12-15, "Product Platform Concept Exploration Method for Product Family Design," ASME 1999 Design Engineering Technical Conferences - Design Theory and Methodology Conference, Las Vegas, Nevada, ASME, Paper No. DETC99/DTM-8761.
Simpson, T. W., Marion, T., Holtta-Otto, K., de Weck, O. L., Kokkolaras, M. and Shooter, S., 2006, "Platform-Based Design and Development: Current Trends and Needs in Industry," ASME 2006 International Design Engineering Technical Conferences & Computers and Information in Engineering Conference, Philadelphia, PA, Paper No. DETC2006-99229.
Simpson, T. W., Nanda, J., Halbe, S., Umapathy, K. and Hodge, B., 2003, "Development of a Framework for Web-Based Product Platform Customization," ASME Journal of Computing and Information Science in Engineering, Vol. 3, No. 2, pp. 119-129.
Simpson, T. W., Peplinski, J., Koch, P. N. and Allen, J. K., 1997b, September 14-17, "On the Use of Statistics in Design and the Implications for Deterministic Computer Experiments," ASME 1997 Design Engineering Technical Conferences - Design Theory and Methodology Conference, Sacramento, CA, ASME, Paper No. DETC97/DTM-3881.
Simpson, T. W., Seepersad, C. C. and Mistree, F., 2001, "Balancing Commonality and Performance within the Concurrent Design of Multiple Products in a Product
160
Family," Concurrent Engineering: Research and Applications, Vol. 9, No. 3, pp. 177-190.
Simpson, T. W., Siddique, Z. and Jiao, J., eds., 2005, Product Platform and Product Family Design: Methods and Applications, Springer, New York.
Stump, G., Simpson, T. W., Yukish, M. and Bennett, L., 2002, "Multidimensional Visualization and its Application to a Design by Shopping Paradigm," 9th AIAA/ISSMO Symposium on Multidiciplinary Analysis and Optimization, Atlanta, Georga, Paper No. AIAA-2002-5622.
Szykman, S. and Sriram, R. D., 1998, Sept. 13-16, "Internet-Based Delivery of CAD/CAM Capability: An Industry Case Study," 1998 ASME Design Engineering Technical Conferences - Computers in Engineering Conference, Atlanta, GA, ASME, Paper No. DETC98/CIE-5520.
Thevenot, H. J. and Simpson, T. W., 2006, "Commonality Indices for Product Family Design: A Detailed Comparison," Journal of Engineering Design, Vol. 17, No. 2, pp. 99-119.
Tumkor, S., 2000, "Internet-Based Design Catalogue for the Shaft and Bearing," Research in Engineering Design, Vol. 12, No. 3, pp. 163-171.
Ulrich, K., 1995, "The Role of Product Architecture in the Manufacturing Firm," Research Policy, Vol. 24, No. 3, pp. 419-440.
Wallace, D., Abrahamson, S. and Borland, N., 1999, "Design Process Elicitation Through the Evaluation of Integrated Model Structures," ASME 1999 Design Engineering Technical Conferences - Design Theory and Methodology Conference, Las Vegas, NV, ASME, Paper No, DETC99/DTM-8780.
Wang, J., Peng, X. and Yip-Hoi, D., 2006, "A Multi-Agent System for Distributed, Internet Enabled Cutter/Workpiece Engagement Extraction," ASME 2006 International Design Engineering Technical Conferences & Computers and Information in Engineering Conference, Philadelphia, PA, Paper No. DETC2006-99379.
Wright, P. K., 2001, 21st Century Manufacturing, Prentice Hall, Englewood Cliffs, NJ.
Yukish, M. and Simpson, T. W., 2004, "Analysis of an Algorithm for Identifying Pareto Points in Multi-Dimensional Data Sets,," 10th AIAA/ISSMO Multidisciplinary Analysis and Optimization Conference, Albany, NY, Paper No. AIAA-2004-4324.
Zamirowksi, E. J. and Otto, K. N., 1999, September 12-15, "Identifying Product Portfolio Architecture Modularity Using Function and Variety Heuristics," ASME Design

161
Engineering Technical Conferences - Design Theory and Methodology Conference, Las Vegas, NV, ASME, Paper No. DETC99/DTM-8760.
Zhang, X., Yang, Y., Liu, S. and F., L., 2007, "Realization of a Development Platform for Web-Based Product Customization Systems," International Journal of Computer Integrated Manufacturing, Vol. 20, No. 2, pp. 254-264.

162
Appendix A
Seismic Analysis Example
A.1 Discussion
This is an example seismic analysis that is prepared to demonstrate
implementation of analysis methodology and the application of input parameters based
on the aggregation of known custom specifications. Analysis is limited to the
determination of minimum natural frequency of the valve extended structure, actuator
sizing calculations, and stress in the yoke legs. Although other analyses are appropriate
in practice such as stress analysis of other sections of the valve extended structure, the
ones documented are adequate to demonstrate methodology in support of the yoke
component platform redesign example discussed throughout this thesis. Aggregate input
loading employed is given in Table A-1, and in addition, aggregate yoke material and
allowable stress criteria is employed when evaluating yoke stress. The subject artifact is
the Class 150, Size 4 Double Disc Gate Valve.

163
Table A-2 provides a highlight summary of the results obtained that demonstrates
comparison of calculated results with established criteria. For this example, the criterion
is met in all cases.
Figure A-1 is a sketch of the valve that shows extended structure section lengths
L0 through L3 and the corresponding distribution of component weights that are assumed
lumped at their center of gravity. The extended structure is the portion of the valve that
Table A-1: Aggregate Specification Input Parameters
Description Value Units Ref. P Internal Pressure = 290. psi Metal Temperature = 100. OF TA Actuator Induced Stem Thrust = 8000. kip QA Actuator Induced Stem Torque = 1000. Ft-kip GH1 Horizontal Seismic Coefficient = 6. g's GH2 Horizontal Seismic Coefficient = 6. g's GV Vertical Seismic Coefficient = 6. g's GEFF Effective Seismic Coefficient = 11. g's Natural Frequency Limit = 33 Hz Valve Factor = .35
Table A-2: Summary of Performance Analysis Criteria Calculated Limit Units Required Actuator Thrust FACT<TA 2.771 8. kip Beam Mode Natural Frequency FN>33. 62.37 33. Hz Frame Mode Natural Frequency FN>33. 70.55 33. Hz Beam Mode Yoke Legs σMAX<1.5SA 10.68 26.25 ksi Frame Mode Yoke Legs σMAX<1.5SA 15.47 26.25 ksi

164
extends away from the connecting piping, and for this valve, this includes the body neck,
the bonnet and yoke, and the actuator.
The extended structure model consists of a rigid actuator section, and three
flexible sections each with associated sectional properties including section and node
weights, section lengths, and cross-section properties, and Table A-3 provides applicable
data. Section A.2 provides cross-section property calculation details. Except for the
L0
W0 (Actuator)
L1
W1' (Flange, Stem)
W1 (Yoke Legs)
L2
W2' (Packing Assy.)
W2 (Bonnet Neck)
L3
W3' (Flange, Disc Pack)
W3 (Body Neck)
Figure A-1: Extended Structure Model
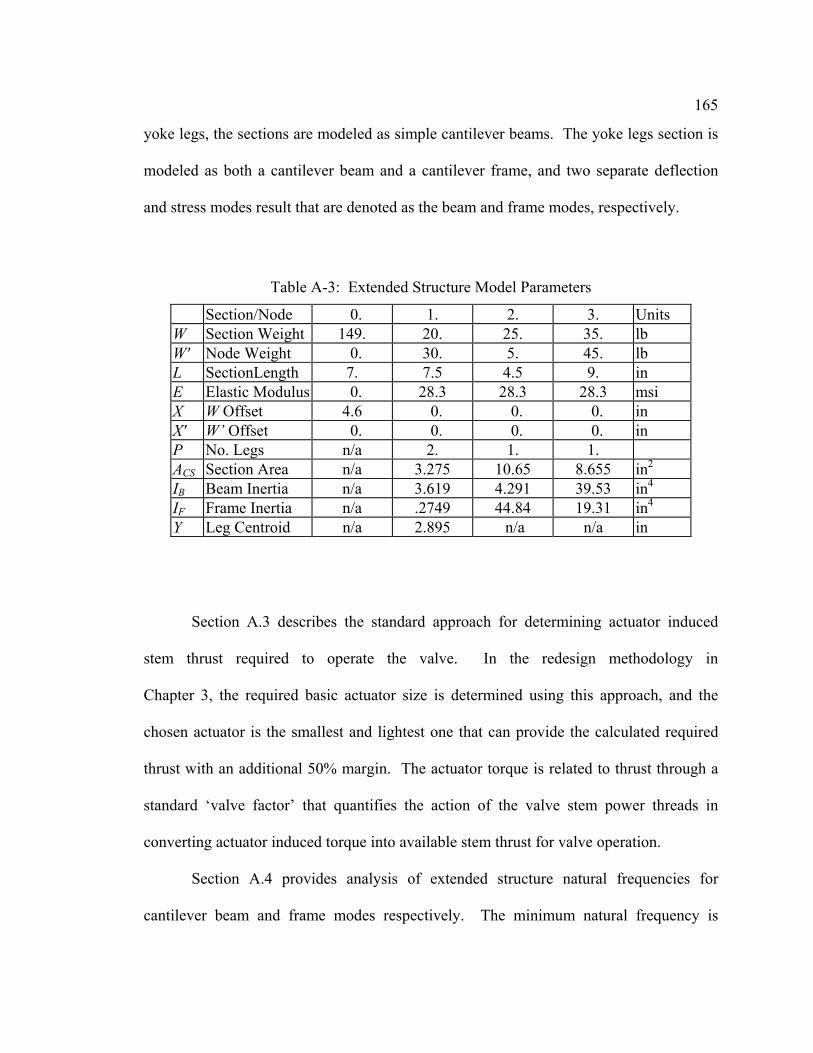
165
yoke legs, the sections are modeled as simple cantilever beams. The yoke legs section is
modeled as both a cantilever beam and a cantilever frame, and two separate deflection
and stress modes result that are denoted as the beam and frame modes, respectively.
Section A.3 describes the standard approach for determining actuator induced
stem thrust required to operate the valve. In the redesign methodology in
Chapter 3, the required basic actuator size is determined using this approach, and the
chosen actuator is the smallest and lightest one that can provide the calculated required
thrust with an additional 50% margin. The actuator torque is related to thrust through a
standard ‘valve factor’ that quantifies the action of the valve stem power threads in
converting actuator induced torque into available stem thrust for valve operation.
Section A.4 provides analysis of extended structure natural frequencies for
cantilever beam and frame modes respectively. The minimum natural frequency is
Table A-3: Extended Structure Model Parameters
Section/Node 0. 1. 2. 3. Units W Section Weight 149. 20. 25. 35. lb W' Node Weight 0. 30. 5. 45. lb L SectionLength 7. 7.5 4.5 9. in E Elastic Modulus 0. 28.3 28.3 28.3 msi X W Offset 4.6 0. 0. 0. in X' W’ Offset 0. 0. 0. 0. in P No. Legs n/a 2. 1. 1. ACS Section Area n/a 3.275 10.65 8.655 in2
IB Beam Inertia n/a 3.619 4.291 39.53 in4
IF Frame Inertia n/a .2749 44.84 19.31 in4
Y Leg Centroid n/a 2.895 n/a n/a in

166
required to be above 33 Hz, which is the established aggregate based on the custom
specifications.
Section A.5 determines reaction forces at the nodes of the valve extended
structure model due to a combination of actuator induced stem thrust and torque and
seismic inertia loading. Seismic loading is included in the form of static coefficients
applied to component weights. Again, the loading is determined from aggregation of
known custom specifications.
Finally, Section A.6 provides stress analysis of the yoke legs resulting from
seismic and actuator induced loading
Analysis techniques are based on classical statics, dynamics, and strength of
materials theory. The methods used are considered nuclear power industry standard and
have been used for the design and qualification of many valves for a variety of power
utilities. The presented methodology is a good example of the existing methodology that
forms part of a baseline standard product line.

167
A.2 Extended Structure Cross-Section Properties
Equations are presented here that are used to calculate extended structure cross-
section properties, and calculation details are provided in Table A-4 where one set of
results is given for each extended structure section. For each applicable cross-section
model, a sketch is provided that shows key dimensions that is followed by applicable
equations.
Figure A-2: Arc Yoke Legs Cross-Section
Arc Yoke Leg Area: EFGHABCACS 2)( 22 ++−=
A.1
Arc Yoke Leg Beam-Mode Inertia for One Leg:
⎟⎠
⎞⎜⎝
⎛⎟⎠⎞
⎜⎝⎛+++=
++=
++−−=
FECFECBV
EFVCECFFEI
IGHCCCABI
V
VB
arctancossin
)sincos(
2)cossin)((
2221
22222121
312144
41
A.2

168
Arc Yoke Leg Frame-Mode Inertia for One Leg: UCSF IGBBGHHGYACCCABI 2)()cossin)(( 3
31244
41 ++++−+−=
22222121 )sincos( EFUCFCEFEIU ++=
⎟⎠
⎞⎜⎝
⎛⎟⎠⎞
⎜⎝⎛+++=
FECFECBU arctansincos 22
21
A.3
Arc Yoke Leg Centroid:
( ) ( )[ ]EFUGHGBABCA
YCS
2sin12133
32 +++−=
A.4
Arc Yoke Leg Beam-Mode Extreme Fiber Distance: CEBX B sin)( +=
A.5
Arc Yoke Leg Frame-Mode Extreme Fiber Distance: { }YCBUCAYGBX F −−−+ cos2,cos,max A.6
Figure A-3: Single Ribbed Circular Neck
Single Ribbed Circular Neck Area: CDBAA 2)( 22 +−= π A.7
Single Ribbed Circular Neck Beam-Mode Inertia 3
6144
41 )( CDBAIB +−= π A.8
Single Ribbed Circular Neck Frame-Mode Inertia: ( )ACACCDBAIF +++−= 22
3144
41 2)(π A.9

169
AB
C
D
BB
F
F Figure A-4: Oval Neck
Oval Neck Area: )( BDACA −= π A.10
Oval Neck Beam-Mode Inertia: )( 33
41 DBCAIB −= π A.11
Oval Neck Frame-Mode Inertia )( 33
41 BDACIF −= π A.12

170
Table A-4: Section Property Results
Arc Yoke Legs (Extended Structure Section 1): Description Value Units
A Leg Inside Radius = 2.625 in B Leg Outside Radius = 3.5 in C Leg Half Angle = .611 in E Rib Dimension = 0. in F Rib Dimension = 0. in G Rib Dimension = 0. in H Rib Dimension = 0. in
Ref. ACS Area = 3.275 in2 Eq. A.1 IB Beam Mode Inertia = 3.619 in4 Eq. A.2 IF Frame Mode Inertia = .2749 in4 Eq. A.3 Y Distance to Leg Centroid = 2.895 in Eq. A.4 XB Beam Mode Extreme Fiber Distance = 2.008 in Eq. A.5 XF Frame Mode Extreme Fiber Distance = .745 in Eq. A.6
Single Ribbed Circular Neck ( Extended Structure Section 2):
Description Value Units A Neck Outside Radius = 1.5 in B Neck Inside Radius = .75 in C Rib Dimension = 2.375 in D Rib Dimension = 1.125 in
Ref. ACS Area = 10.65 in2 Eq. A.7 IB Beam Mode Inertia = 4.291 in4 Eq. A.8 IF Frame Mode Inertia = 44.84 in4 Eq. A.9
Oval Neck ( Extended Structure Section 3):
Description Value Units A Major Outside Radius = 3.469 in B Minor Outside Radius = 2.25 in C Major Inside Radius = 2.938 in D Minor Inside Radius = 1.719 in
Ref. ACS Area = 8.655 in2 Eq. A.10 IB Beam Mode Inertia = 39.53 in4 Eq. A.11 IF Frame Mode Inertia = 19.31 in4 Eq. A.12

171
A.3 Required Stem Thrust
This section presents an analysis for predicting the minimum thrust required to
close and to seal the valve under design flow conditions. Applicable forces include
packing drag, stem end load due to internal pressure (P), disc drag due to differential
pressure (∆P), and required seating force. The employed valve factor takes into
consideration both frictional and flow induced drag.
The basic equations used in the analysis, and analysis results are given in
Table A-5.
Required seating differential pressure is a function of seating surface contact
width and the seat bearing stress required to seal. Required bearing stress is determined
by test on moderately worn seats.
The term (FSEAT –FDISC) represents the force the actuator must contribute to affect
a seal. It conservatively approximates the transfer of stem thrust to seat force when
industry standard valve factors can be assumed.
Differential pressure force on the disc: PDF SEATDISC ∆= 2
41 π
A.13
Stem end load (rejection load): PDF STEMSTEM
241 π= A.14
Force required to seat: REQSEATSEAT PDF ∆= 2
41 π
A.15
Approximate packing load: STEMPACK DF 1000= A.16

172
Gate Valve Required Actuator Thrust: ( ){ } STEMPACKDISCVDISCSEATACT FFFfFFF ++−= ,max A.17
Table A-5: Required Stem Thrust Results
Input: Parameter Description Value Units DSEAT Seat Contact Surface Diameter = 4.4 in DSTEM Stem Basic Diameter = 1. in fV Valve Factor = .35 P Internal Pressure = 290. psi ∆P Differential Pressure = 290. psi ∆PREQ Required Seating Pressure = 320. psi
Results:
Force Description Value Units Ref. FDISC Differential Pressure Force on Disc = 4.41 kip Eq. A.13FSTEM Stem End Load = .2278 kip Eq. A.14FSEAT Required Seating Force = 4.866 kip Eq. A.25FPACK Packing Drag = 1. kip Eq. A.16FACT Required Stem Thrust = 2.771 kip Eq. A.17 (Gate Valve)

173
A.4 Extended Structure Minimum Natural Frequency
Natural frequencies of the valve extended structure due to bending are considered
here. The method used is from the ASME published paper, "A Simplified Method for
Calculating the Natural Frequency of Valve Superstructures" (Ezekoye 1978). The
method employs Rayleigh's principle which states that the maximum kinetic energy must
equal the maximum potential energy in order for the system to satisfy conservation of
energy. The approach is to consider two models of the structure: (1) cantilever beam
mode which considers deflections normal to the yoke window plane, and (2) cantilever
frame mode which considers deflections parallel to the yoke window plane.
Consistent with the extended structure model, the base of the extended structure
rigidly fixed, the extended structure components are rigidly connected, and section weights
are lumped at their centers of gravity. In addition, it is reasonable to ignore axial and pure
shear displacements as they are negligible in comparison to those due to bending since
section lengths are sufficiently large.
The theory is presented next and is followed by Table A-6, which presents
calculation details and resulting calculated minimum natural frequencies.
Forces at Nodes: (N = Node Number)
( )∑=
−− ++=N
IIINN WWWF
1113
1 ' A.18
Moments at Nodes:
( ) ( )∑ ∑= =
−−−−−⎭⎬⎫
⎩⎨⎧ −+=
N
K
N
KIKKIKKN LWLWWM
1112
1111 ' A.19
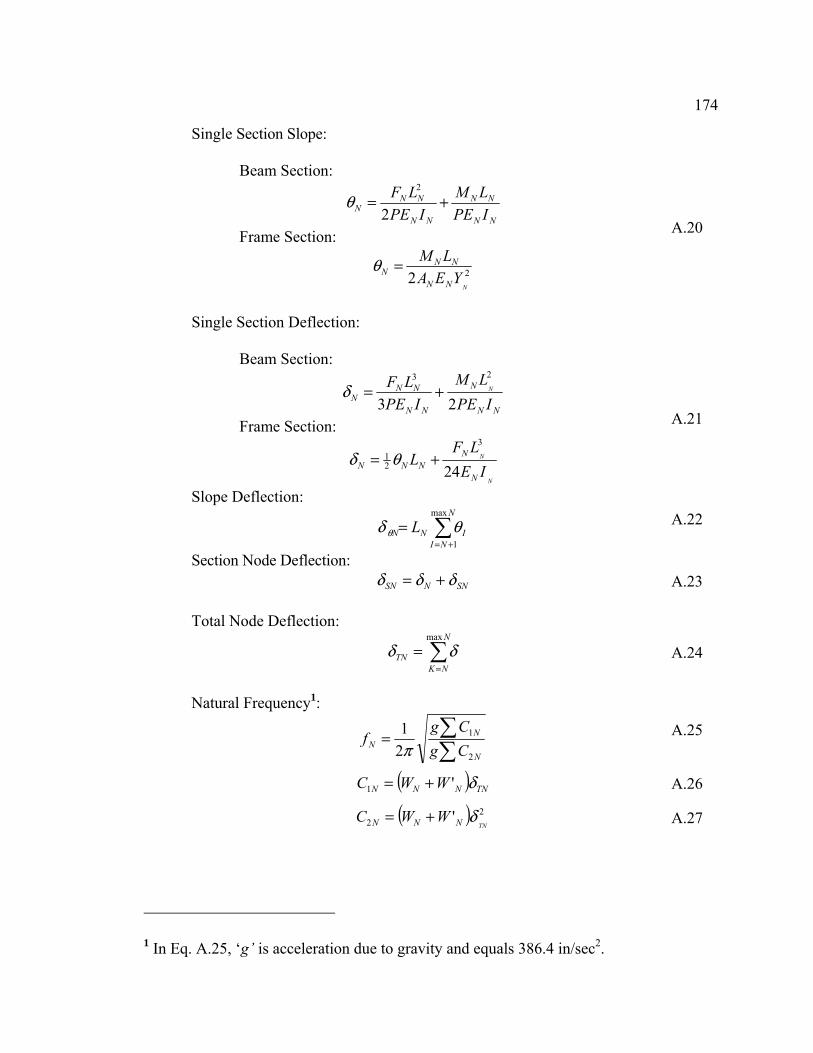
174
Single Section Slope:
Single Section Deflection:
1 In Eq. A.25, ‘g’ is acceleration due to gravity and equals 386.4 in/sec2.
Beam Section:
NN
NN
NN
NNN IPE
LMIPE
LF +=2
2
θ
Frame Section:
22N
YEALM
NN
NNN =θ
A.20
Beam Section:
NN
N
NN
NNN IPE
LMIPE
LF N
23
23
+=δ
Frame Section:
N
N
IELF
LN
NNNN 24
3
21 += θδ
A.21
Slope Deflection:
∑+=
=N
NIINN L
max
1
θδ θ A.22
Section Node Deflection: SNNSN δδδ +=
A.23
Total Node Deflection:
∑=
=N
NKTN
max
δδ
A.24
Natural Frequency1:
∑∑=
N
NN Cg
Cgf
2
1
21π
A.25
( ) TNNNN WWC δ'1 += A.26
( ) 22 '
TNNNN WWC δ+= A.27

175
Table A-6: Extended Structure Natural Frequency Results
Beam Mode Frequency Calculation Details: N Node 0. 1. 2. 3. Units Ref FN Force 0. 185.7 212.3 285.7 lb Eq. A.18 MN Moment 0. 521.5 1939. 2913. in-lb Eq. A.19 τN Slope 0. 4.459E-5 8.955E-5 3.378E-5 rad Eq. A.20 δN Deflection 0. 1.991E-4 2.148E-4 1.675E-4 in Eq. A.21 δτN Slope
Deflection 1.175E-3 9.25E-4 1.52E-4 0. in Eq. A.22
δSN Sect. Node Deflection
1.175E-3 1.124E-3 3.668E-4 1.675E-4 in Eq. A.23
δTN Total Node Deflection
2.834E-3 1.658E-3 5.343E-4 1.675E-4 in Eq. A.24
C1 .4222 8.292E-2 1.603E-2 1.34E-2 in-lb Eq. A.26 C2 1.197E-3 1.375E-4 8.564E-6 2.245E-6 in2-lb Eq. A.27
Frame Mode Frequency Calculation Details:
N Node 0. 1. 2. 3. Units Ref FN Force 0. 185.7 212.3 285.7 lb Eq. A.18 MN Moment 0. 521.5 1939. 2913. in-lb Eq. A.19 τN Slope 0. 2.518E-6 8.571E-6 6.914E-5 rad Eq. A.20 δN Deflection 0. 4.289E-4 2.056E-5 3.429E-4 in Eq. A.21 δτN Slope
Deflection 5.616E-4 5.828E-4 3.111E-4 0. in Eq. A.22
δSN Sect. Node Deflection
5.616E-4 1.012E-3 3.317E-4 3.429E-4 in Eq. A.23
δTN Total Node Deflection
2.248E-3 1.686E-3 6.746E-4 3.429E-4 in Eq. A.24
C1 .3349 8.431E-2 2.024E-2 2.743E-2 in-lb Eq. A.26 C2 7.529E-4 1.422E-4 1.365E-5 9.405E-6 in2-lb Eq. A.27
Resulting Natural Frequencies:
Description Value Units Ref. Beam Mode Natural Frequency = 62.37 Hz Eq. A.25 Frame Mode Natural Frequency = 70.55 Hz Eq. A.25

176
A.5 Extended Structure Reaction Forces
The generalized equations for the forces at the nodes of the extended structure
model are given in this section. In order to qualify an arbitrary valve orientation, the
vector sum of the required static load coefficients (GEFF) is imposed on the structure in a
conservative manner. Loading in both the valve local horizontal and local vertical
directions are considered. The plus one factor accounts for component dead load
weights. Table A-7 provides input data and analysis results.
( )222
21 1+++= VHHEFF GGGG
A.28
Thrust (Vertical Force) at Node N:
( ){ }∑−
=
+++=1
0
'N
IANIEFFN TWWWGT
I
A.29
Shear (Horizontal Force) at Node N:
( ){ }∑−
=
++=1
0
'N
INIIEFFN WWWGV
A.30
Bending Moment at Node N:
( )
( ) ⎪⎪⎭
⎪⎪⎬
⎫
⎪⎪⎩
⎪⎪⎨
⎧
++
−⎥⎦
⎤⎢⎣
⎡ +=
∑
∑ ∑−
=
−
=
−
=
1
0
1
021
1
''
,'max
N
INNIIEFF
N
III
N
IJJIEFF
N
LWXWXWG
LWLWWGM
II
I
A.31
Torsional Moment at Node N:
( ) A
N
INNIIEFFN QLWXWXWGQ
II+++= ∑
−
=
1
0
'' A.32

177
Table A-7: Reaction Force Results
Extended Structure Model Parameters: N Section 0. 1. 2. 3. Units WN Weight 149. 20. 25. 35. lb W'N Weight 0. 30. 5. 45. lb LN Length 7. 7.5 4.5 9. in XN Offset 4.6 0. 0. 0. in X'N Offset 0. 0. 0. 0. in
Load Conditions:
Description Value Units Ref. TA Actuator Thrust = 8000. lb QA Actuator Torque = 1000. in-lb GH1 Horizontal Seismic Coefficient = 6. g's GH2 Horizontal Seismic Coefficient = 6. g's GV Vertical Seismic Coefficient = 6. g's GEFF Effective Seismic Acceleration = 11. g's Eq. A.28
Reaction Force Calculation Results:
N Node 1. 2. 3. 4. Units Ref TN Thrust 9969. 1.024E+4 1.101E+4 1.14E+4 lb Eq. A.29 VN Shear 1969. 2244. 3014. 3399. lb Eq. A.30 MN Moment 7539. 2.133E+4 3.205E+4 6.09E+4 in-lb Eq. A.31 QN Torque 8539. 8539. 8539. 8539. in-lb Eq. A.32
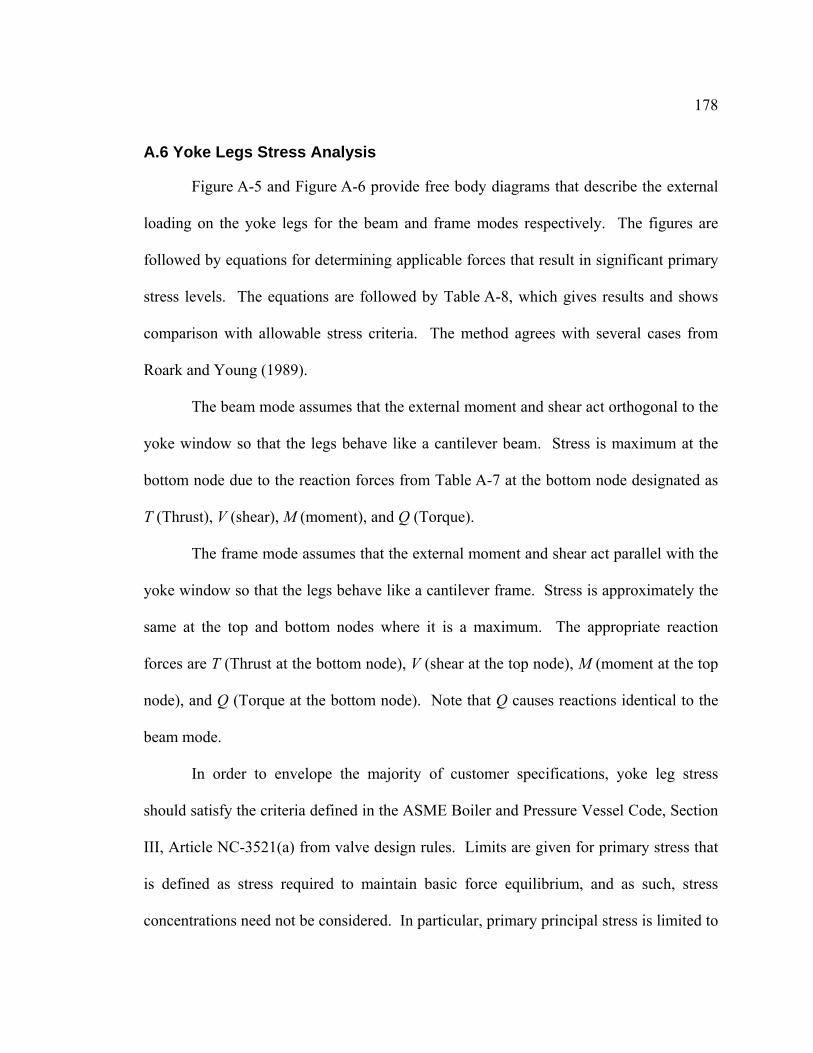
178
A.6 Yoke Legs Stress Analysis
Figure A-5 and Figure A-6 provide free body diagrams that describe the external
loading on the yoke legs for the beam and frame modes respectively. The figures are
followed by equations for determining applicable forces that result in significant primary
stress levels. The equations are followed by Table A-8, which gives results and shows
comparison with allowable stress criteria. The method agrees with several cases from
Roark and Young (1989).
The beam mode assumes that the external moment and shear act orthogonal to the
yoke window so that the legs behave like a cantilever beam. Stress is maximum at the
bottom node due to the reaction forces from Table A-7 at the bottom node designated as
T (Thrust), V (shear), M (moment), and Q (Torque).
The frame mode assumes that the external moment and shear act parallel with the
yoke window so that the legs behave like a cantilever frame. Stress is approximately the
same at the top and bottom nodes where it is a maximum. The appropriate reaction
forces are T (Thrust at the bottom node), V (shear at the top node), M (moment at the top
node), and Q (Torque at the bottom node). Note that Q causes reactions identical to the
beam mode.
In order to envelope the majority of customer specifications, yoke leg stress
should satisfy the criteria defined in the ASME Boiler and Pressure Vessel Code, Section
III, Article NC-3521(a) from valve design rules. Limits are given for primary stress that
is defined as stress required to maintain basic force equilibrium, and as such, stress
concentrations need not be considered. In particular, primary principal stress is limited to

179
1.5S, where S is taken from allowable stress tables included in ASME Code Section II,
Volume D.
Actuator
Yoke Legs
Top Node
Bottom Node
L
M T
V
2V1
2M1 2PMAX
Q
M2 M2
V2
V2
V2
M2
M2
V2
Reactions to T, V, and M Reactions to Q
Figure A-5: Beam Mode Reactions

180
YQV
VV
22
21
1
=
=
Beam Mode Frame Mode
Actuator
Top Node
Bottom Node Legs
2Y L
M1
M1
PMAX
PMAX PMIN
V1
V1 M1
V1 M1
V M
T
V1
Figure A-6: Frame Mode Reactions to T, V, & M
21' VVV += 2221
' VVV += A.33
MM 2
11 = LVM 12
11 = A.34
LVM 22
12 = LVM 22
12 = A.35
21' MMM += n/a A.36
TPMAX 2
1= TY
MVLPMAX 21
2++= A.37
B
B
CS
MAX
IXM
AP '+=σ
B
B
F
F
CS
MAX
IXM
IXM
AP 21 ++=σ A.38
CSAV
32
'=τ A.39
22
41
21 τσσσ ++=MAX A.40

181
Table A-8: Yoke Legs Analysis Results
Reaction Forces from Table A-7:
Parameter At Top At Bottom Units Ref. Node 1. 2.
T Thrust 9969. 1.024E+4 lb Eq. A.29V Shear 1969. 2244. lb Eq. A.30M Moment 7539. 2.133E+4 in-lb Eq. A.31Q Torque 8539. 8539. in-lb Eq. A.32
Component Input Paramters:
Parameter Description Value Units Ref. ACS Yoke Leg Area = 3.275 in2 Eq. A.1 IB Beam Mode Inertia = 3.619 in4 Eq. A.2 IF Frame Mode Inertia = .2749 in4 Eq. A.3 Y Distance to Leg Centroid = 2.895 in Eq. A.4 XB Beam Mode Extreme Fiber = 2.008 in Eq. A.5 XF Frame Mode Extreme Fiber = .745 in Eq. A.6 L Yoke Window Length = 7.5 in
Material Spec. Ref.: SA-351-CF8M (Stainless Steel) @ 1000F
S ASME Code Allowable Stress = 17.5 ksi (Per ASME Code, Section II, Vol. D)
Stress Results:
Mode Beam Frame Units Ref V' Resultant Shear 2597. 1773. lb Eq. A.33 M1 Moment 1.066E+4 3692. in-lb Eq. A.34 M2 Moment 5531. 5531. in-lb Eq. A.35 M' Resultant Moment 1.62E+4 N/A in-lb Eq. A.36 PMAX Resultant Thrust 5122. 7699. lb Eq. A.37
σ Normal Stress 10.55 15.42 ksi Eq. A.38 τ Shear Stress 1.19 .8123 ksi Eq. A.39 σMAX Principal Stress 10.68 15.47 ksi Eq. A.40
Allowable 1.5S 1.5S 26.25 26.25 ksi

182
Appendix B
Valve Quantity Count Data by Type, Size, and Class
Double Disc Gate Valves:
Type Size Class Count Type Size Class Count DD 1 150 1 DD 8 150 16 DD 1 300 1 DD 8 300 8 DD 1 600 7 DD 8 600 2 DD 1 900 8 DD 8 900 7 DD 1 1500 11 DD 8 1500 13 DD 1 1878 39 DD 8 2500 1 DD 1 1888 19 DD 10 150 2 DD 1 2500 12 DD 10 300 12 DD 2 150 9 DD 10 600 9 DD 2 300 1 DD 10 900 17 DD 2 600 9 DD 10 1500 4 DD 2 900 7 DD 12 150 2 DD 2 1500 24 DD 12 300 9 DD 2 1878 29 DD 12 900 4 DD 2 1888 22 DD 12 1500 2 DD 2 2500 19 DD 14 150 2 DD 3 150 13 DD 14 300 10 DD 3 300 2 DD 14 600 1 DD 3 600 8 DD 14 900 9 DD 3 900 24 DD 16 150 1 DD 3 1500 30 DD 16 300 1 DD 3 2500 13 DD 16 900 3 DD 4 150 10 DD 18 150 2 DD 4 300 9 DD 18 300 2 DD 4 600 15 DD 18 600 4 DD 4 900 15 DD 20 600 2 DD 4 1500 10 DD 20 900 8 DD 6 150 9 DD 20 2500 3 DD 6 300 6 DD 22 900 2 DD 6 600 6 DD 24 150 1 DD 6 900 27 DD 24 600 12 DD 6 1500 2 DD 24 900 1
DD 24 1500 1

183
Flex Wedge Gate Valves:
Type Size Class Count Type Size Class Count FW 1 150 3 FW 12 150 30 FW 1 900 3 FW 12 300 17 FW 2 150 3 FW 12 600 3 FW 2 1500 3 FW 12 900 26 FW 3 150 85 FW 12 1500 4 FW 3 300 11 FW 14 150 12 FW 3 600 12 FW 14 300 13 FW 3 900 25 FW 14 600 2 FW 3 1500 17 FW 14 900 9 FW 4 150 54 FW 14 1500 3 FW 4 300 23 FW 16 150 21 FW 4 600 23 FW 16 300 8 FW 4 900 71 FW 16 600 1 FW 4 1500 12 FW 16 900 3 FW 6 150 73 FW 16 1500 1 FW 6 300 12 FW 18 150 8 FW 6 600 17 FW 18 300 18 FW 6 900 53 FW 18 600 5 FW 6 1500 1 FW 18 900 9 FW 6 2500 1 FW 20 150 14 FW 8 150 46 FW 20 300 8 FW 8 300 7 FW 20 600 3 FW 8 600 6 FW 20 900 18 FW 8 900 14 FW 20 1500 3 FW 8 1500 4 FW 24 150 12 FW 10 150 38 FW 24 300 3 FW 10 300 22 FW 24 900 12 FW 10 600 17 FW 24 1500 3 FW 10 900 29 FW 26 150 1
FW 26 900 1 FW 36 150 1 FW 36 300 1

184
Appendix C
Artifact Bounds Constraints and Candidate Component Platforms
C.1 Artifact-Specific Bounds Constraints
Artifact aMIN [in]
aMAX [in]
rMAX [in] Artifact aMIN
[in] aMAX [in]
rMAX [in]
1 5.4345 7.818 n/a 31 1.25 2.75 n/a 2 1.5 3 n/a 32 1.3125 2.8125 n/a 3 3.0875 4.85 n/a 33 2.4625 4.225 n/a 4 4.7125 6.475 n/a 34 3.107 5.4905 n/a 5 3.0665 5.141 n/a 35 3.4795 6.793 n/a 6 5.8595 8.243 n/a 36 3.9415 6.016 n/a 7 3.547 5.0005 n/a 37 1.375 2.875 n/a 8 3.672 5.1255 n/a 38 1.5 3 n/a 9 3.922 5.3755 n/a 39 3.3375 5.1 n/a 10 4.7125 6.475 n/a 40 3.3375 5.1 n/a 11 5.504 7.5785 n/a 41 3.0665 5.141 n/a 12 5.5875 7.35 n/a 42 5.5875 7.35 n/a 13 1.8125 n/a 4.3125 43 2.16 n/a 4.02 14 2.665 n/a 6.775 44 2.4065 n/a 5.0305 15 3.442 n/a 7.308 45 3.8435 n/a 6.0935 16 5.14 n/a 9.86 46 3.7655 n/a 7.7035 17 5.69 n/a 11.43 47 5.82 n/a 9.06 18 6.5635 9.5665 n/a 48 2.625 4.125 n/a 19 2.005 n/a 7.245 49 2.062 n/a 4.188 20 1.625 3.125 n/a 50 2.595 n/a 5.215 21 3.573 n/a 6.927 51 3.5 n/a 7 22 5.5875 7.35 n/a 52 4.31 n/a 8.57 23 5.82 n/a 12.56 53 5.375 n/a 10.375 24 7.773 10.467 n/a 54 5.815 n/a 11.315 25 2 3.5 n/a 55 2.6875 n/a 6.4375 26 4.6915 6.766 n/a 56 2.82 6.016 7.28 27 5.701 8.0845 n/a 57 2.594 n/a 8.718 28 6.5665 8.641 n/a 58 3.1875 4.6875 n/a 29 4.81 n/a 11.07 59 3.56 n/a 12.82 30 4.125 n/a 16.125 60 4.115 n/a 14.155

185
C.2 Candidate Component Platform Solutions
Candidate Platform
a [in]
b [in]
c [rad]
CandidatePlatform
a [in]
b [in]
c [rad]
1 5.5 0.625 0.524 31 2.375 0.625 0.524 2 2.625 0.75 0.524 32 2.375 0.625 0.524 3 3.5 1.125 0.524 33 3 0.75 0.524 4 4.75 0.625 0.524 34 5.375 0.75 0.524 5 3.125 1 0.611 35 4.5 0.625 0.524 6 5.875 0.625 0.524 36 4.5 0.875 0.524 7 3.625 0.625 0.524 37 2.375 1.25 0.524 8 3.75 0.625 0.524 38 2.5 0.75 0.524 9 4 0.625 0.524 39 4.375 0.625 0.524 10 4.75 0.625 0.524 40 3.875 0.625 0.524 11 5.625 0.625 0.524 41 4 0.875 0.524 12 5.75 0.875 0.524 42 6.5 0.875 0.524 13 2.875 0.875 0.698 43 2.5 0.75 0.524 14 2.75 1 0.524 44 2.625 1 0.524 15 4 0.875 0.524 45 3.875 1 0.524 16 6.5 1 0.524 46 3.875 1.375 0.524 17 5.75 1.25 0.524 47 5.875 1.25 0.524 18 8.75 1.125 0.524 48 4.125 1.25 0.524 19 2.5 1.125 0.524 49 3.25 0.75 0.611 20 2.375 0.875 0.524 50 3 0.625 0.785 21 3.625 1.125 0.524 51 3.5 0.875 0.873 22 6.625 0.75 0.524 52 4.375 1.25 0.524 23 6.25 0.875 0.524 53 5.375 1.5 0.524 24 9.875 1.125 0.524 54 5.875 1.875 0.524 25 3 0.875 0.524 55 2.75 1.375 0.524 26 4.75 0.875 0.524 56 5.625 0.625 0.524 27 7 0.625 0.524 57 3.125 1.25 0.698 28 7.125 0.875 0.524 58 3.75 1.375 0.524 29 4.875 1.875 0.698 59 4.75 2.125 0.611 30 8 1.75 0.524 60 5.25 2.125 0.524
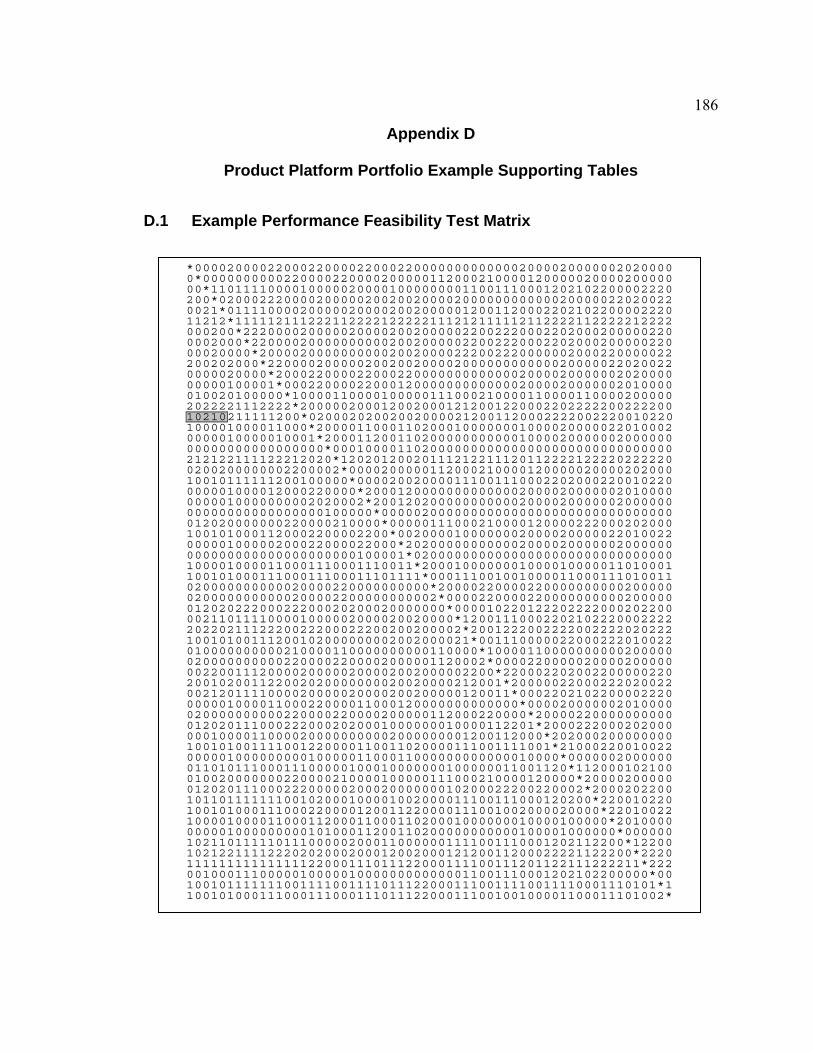
186
Appendix D
Product Platform Portfolio Example Supporting Tables
D.1 Example Performance Feasibility Test Matrix
*000020000220002200002200022000000000000020000200000020200000*0000000000220000220000200000112000210000120000020000200000 00*110111100001000002000010000000011001110001202102200002220 200*02000222000020000020020020000200000000000020000022020022 0021*0111100002000002000020020000012001120002202102200002220 11212*111112111222112222122222111212111112112222112222212222 000200*22200002000002000020020000022002220002202000200000220 0002000*2200002000000000020020000022002220002202000200000220 00020000*200002000000000020020000222002220000002000220000022 200202000*22000020000020020020000200000000000020000022020022 0000020000*2000220000220002200000000000002000020000002020000 00000100001*000220000220001200000000000002000020000002010000 010020100000*10000110000100000111000210000110000110000200000 2022221112222*2000002000120020001212001220002202222200222200 10210211111200*020002020020020000212001120002222002220010220 100001000011000*20000110001102000100000001000020000022010002 0000010000010001*2000112001102000000000001000020000002000000 00000000000000000*000100001102000000000000000000000000000000 212122111122212020*12020120020111212211120112222122220222220 0200200000002200002*0000200000112000210000120000020000202000 10010111111200100000*000020020000111001110002202000220010220 000001000012000220000*20001200000000000002000020000002010000 0000010000000002020002*2001202000000000002000020000002000000 00000000000000000100000*000002000000000000000000000000000000 012020000000220000210000*00000111000210000120000222000202000 1001010001120002200002200*0020000100000002000020000022010022 00000100000200022000022000*202000000000002000020000002000000 000000000000000000000100001*02000000000000000000000000000000 1000010000110001110001110011*2000100000001000010000011010001 10010100011100011100011101111*000111001001000011000111010011 020000000000020000220000000000*20000220000220000000000200000 0200000000000200002200000000002*0000220000220000000000200000 01202022200022200020200020000000*000010220122202222000202200 002110111100001000002000020020000*12001110002202102220002222 2022021112220022200022200200200002*2001222002222002222020222 10010100111200102000000002002000021*001110000022000222010022 010000000000210000110000000000110000*10000110000000000200000 0200000000002200002200002000001120002*0000220000020000200000 00220011120000200000200002002000002200*220002202002200000220 200102001122002020000000020020000212001*20000022000222020022 0021201111000020000020000200200000120011*0002202102200002220 00000100001100022000011000120000000000000*000020000002010000 020000000000220000220000200000112000220000*20000220000000000 0120201110002220002020001000000010000112201*2000222000202000 00010000110000200000000002000000001200112000*202000200000000 100101001111001220000110011020000111001111001*21000220010022 0000010000000001000001100011000000000000010000*0000002000000 01101011100011100000100010000000100000011001120*112000102100 010020000000220000210000100000111000210000120000*20000200000 0120201110002220000020002000000010200022200220002*2000202200 10110111111100102000100001002000011100111000120200*220010220 100101000111000220000120011220000111001002000020000*22010022 1000010000110001120001100011020001000000010000100000*2010000 00000100000000010100011200110200000000000100001000000*000000 102110111110111000002000110000001111001110001202112200*12200 1021221111222020200020001200200012120011200022221122200*2220 11111111111111122000111011122000111100111201122111222211*222 001000111000001000001000000000000011001110001202102200000*00 1001011111110011110011110111220001110011110011110001110101*1 10010100011100011100011101112200011100100100001100011101002*

187
D.2 Example Candidate Arrays and Solution Details
Solution 1 Solution 2 Artifact Ordinal Candidate Platforms (C) Max. XP
Index XP* C(XP*) XP* C(XP*) 1 1,6,11,12,16,17,22,23,27,28,42,47,54,56 14 8 23 12 47 2 2,13,14,19,20,25,33,37,44,50,55 11 8 37 5 20 3 3,21,46,48,51,52,57,58,59 9 4 48 5 51 4 1,4,6,10,11,12,17,23,26,29,34,47,53,54,56,59,60 17 10 29 9 26 5 3,5,15,21,26,29,36,41,45,46,48,51,52,57,58,59 16 11 48 12 51
6 3,5,6,12,16,17,18,21,22,23,24,26,27,28,29,30,34,36,42,45,46,47,48,51,52,53,54,55,57,58,59,60
32 16 30 22 47
7 4,7,8,9,10,15,21,26,29,35,36,39,40,41,45,46,48, 52,58,59
20 9 29 8 26
8 4,8,9,10,15,26,29,35,36,39,40,41,45,46,48,52,58,59
18 7 29 6 26
9 4,9,10,15,26,29,34,35,36,39,40,41,48,52,53, 59,60
17 6 29 5 26
10 1,4,6,10,11,12,17,23,26,29,34,47,53,54,56,59,60 17 8 23 9 26 11 6,11,12,16,17,22,23,27,28,42,47,54,56 13 11 47 11 47 12 12,16,17,22,23,28,42,47,54 9 5 23 8 47 13 5,13,37,55 4 3 37 3 37
14 1,3,4,5,6,10,11,12,13,14,15,21,26,29,34,36,40,41,45,46,48,49,50,51,52,55,56,57,58
29 21 48 13 26
15 3,6,12,15,17,21,23,26,29,34,36,41,45,46,47,48,51,52,53,58,59
21 9 29 8 26
16 16,17,30,47,53,54,60 7 4 47 3 30 17 17,18,24,30,47,54 6 4 30 4 30 18 18,30 2 2 30 2 30
19 1,3,5,6,11,12,13,15,17,19,21,23,26,29,34,36,37, 41,45,46,47,48,50,51,52,53,55,56,57,58,59
31 12 23 21 47
20 2,5,13,14,19,20,25,33,37,44,50,55,57 13 9 37 6 20 21 12,21,26,29,45,46,48,52,53,58,59 11 4 29 3 26 22 12,16,17,22,23,28,42,47,54 9 5 23 8 47 23 16,18,22,23,24,28,30,42,47,54 10 4 23 7 30 24 24,30 2 2 30 2 30 25 3,5,13,14,19,25,37,44,49,50,51,55,57 13 7 37 7 37 26 12,16,17,22,23,26,29,42,47,53,54,59,60 13 5 23 6 26 27 12,16,17,22,23,27,28,30,42,47,54 11 8 30 8 30 28 28,30 2 2 30 2 30 29 29,30 2 1 29 2 30 30 30 1 1 30 1 30

188
D.2 Continued
Solution 1 Solution 2 Artifact Ordinal Candidate Platforms (C) Max. XP
Index XP* C(XP*) XP* C(XP*) 31 2,14,19,20,31,32,37,38,43,44,55 11 7 37 4 20 32 2,14,19,20,31,32,37,38,43,44,55 11 7 37 4 20
33 3,5,7,8,9,13,14,15,19,21,25,33,40,41, 44,45,46,48,49,50,51,55,57,58
24 18 48 16 45
34 3,21,26,29,34,36,45,46,48,51,52,53,57,58, 59,60
16 9 48 7 45
35 1,3,4,6,10,11,12,15,16,17,21,22,23,26,29,34
,35,36,40,41,42,45,46,47,48,51, 52,53,54,56,58,59,60
33 24 47 14 26
36 12,17,26,29,34,36,47,48,52,53,54,59,60 13 4 29 7 47 37 13,37,55 3 2 37 2 37 38 2,13,14,19,20,25,33,37,38,43,44,50,55 13 8 37 5 20
39 3,4,10,15,21,26,29,35,36,39,40,41,45, 46,48,51,52,58,59
19 7 29 13 45
40 1,6,11,12,15,17,26,29,34,36,40,41,47, 48,52,53,54,56,59,60
20 14 48 7 26
41 3,5,15,21,26,29,36,41,45,46,48,51,52, 57,58,59
16 11 48 5 26
42 16,17,28,42,47,54 6 5 47 5 47 43 2,13,14,19,20,25,33,37,38,43,44,49,50 13 8 37 8 37
44 3,5,13,14,15,19,21,40,41,44,45,49,50, 51,55,57
16 10 44 14 51
45 15,26,36,41,45,46,48,52 8 7 48 5 45 46 16,17,29,46,47,52,53,59,60 9 5 47 5 47 47 47,54 2 1 47 1 47 48 46,48,51,57 4 2 48 3 51 49 5,13,14,19,37,44,49,50,55 9 6 44 5 37
50 3,5,13,14,15,21,25,35,39,40,41,44,45, 49,50,51,55,57,58
19 12 44 16 51
51 17,29,46,48,51,52,53,58,59 9 4 48 5 51 52 16,17,23,28,29,42,47,52,53,54,59,60 12 7 47 7 47 53 18,30,53,54 4 2 30 2 30 54 24,30,54 3 2 30 2 30 55 3,21,46,48,51,52,55,57,58 9 4 48 5 51
56 3,5,6,11,12,13,15,17,21,26,29,34,36,41,45, 46,47,48,51,52,53,56,57,58,59
25 17 47 17 47
57 16,17,28,29,42,46,47,51,52,53,54,57, 58,59,60
15 4 29 7 47
58 46,48,51,52,58 5 2 48 3 51 59 29,30,59 3 1 29 2 30 60 29,30,59,60 4 2 30 2 30

VITA
Ronald Scott Farrell
Ronald Scott Farrell is currently a Senior Engineer for Flowserve Corporation in
the research and development department at the Raleigh, North Carolina Plant. For over
twenty-five years, he has been involved in the design, analysis, and formal qualification
of valves and actuators installed at nuclear power plants located throughout the world.
He is well respected by his peers as an expert in valve and actuator design and usage. He
is a practicing registered professional engineer, and is a member of the American Society
of Mechanical Engineers.
Mr. Farrell earned a Ph.D. degree in Mechanical Engineering in 2007 from The
Pennsylvania State University and a M.S. degree in Mechanical Engineering in 1999
from the same university. In 1980 he obtained his B.S. degree in Engineering Science
and Mechanics from The Pennsylvania State University as well. As a graduate student,
he was inducted into the Tau Beta Pi National Engineering Honors Fraternity, and as an
undergraduate, he was inducted into the Pi Mu Epsilon Honorary Mathematics Fraternity.
During his course of studies as a Ph.D. student, Mr. Farrell has co-authored three
conference papers, two published journal papers, and one journal paper yet to be
published. His academic interests are in the areas of product platform design, mass
customization, and information technology related to engineering design.