Embed Size (px)
Citation preview
UPTEC W11031
Examensarbete 30 hpNovember 2011
Comparing Cork Filters to Conventional Sand Filters A Pilot Study of Process Water Treatment
Ulrika Bohlin

i
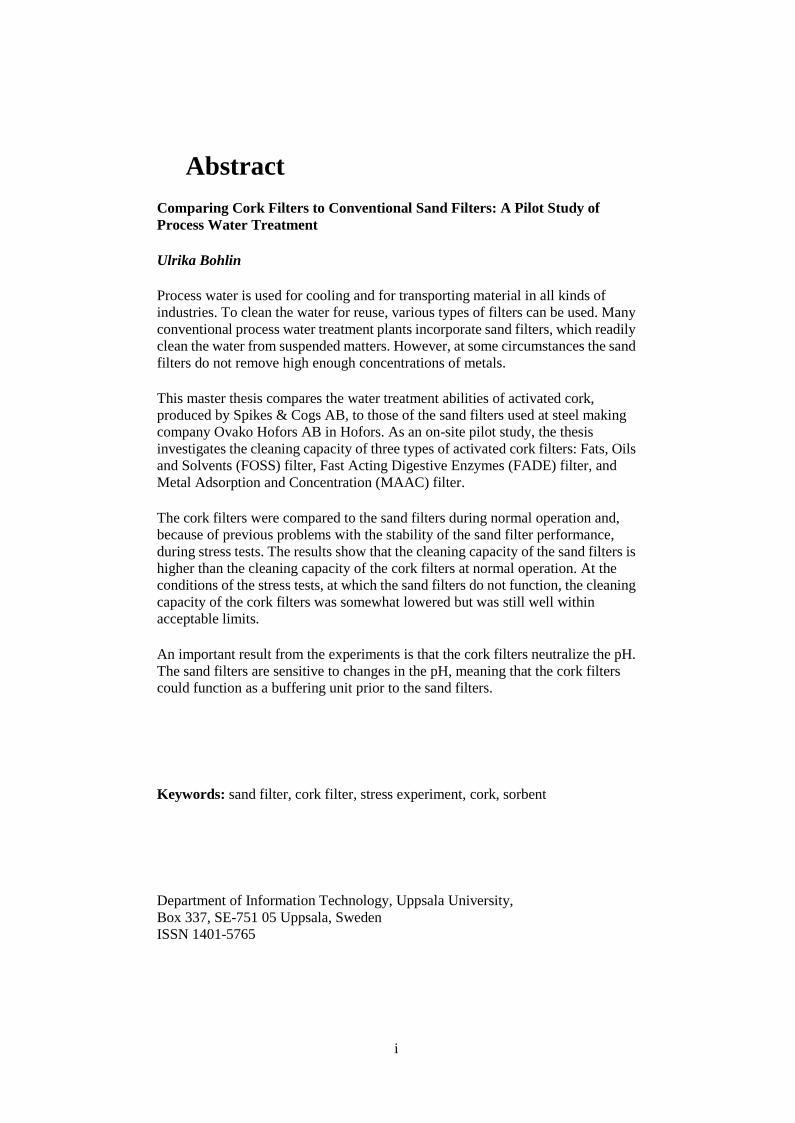
Abstract
Comparing Cork Filters to Conventional Sand Filters: A Pilot Study of
Process Water Treatment
Ulrika Bohlin
Process water is used for cooling and for transporting material in all kinds of
industries. To clean the water for reuse, various types of filters can be used. Many
conventional process water treatment plants incorporate sand filters, which readily
clean the water from suspended matters. However, at some circumstances the sand
filters do not remove high enough concentrations of metals.
This master thesis compares the water treatment abilities of activated cork,
produced by Spikes & Cogs AB, to those of the sand filters used at steel making
company Ovako Hofors AB in Hofors. As an on-site pilot study, the thesis
investigates the cleaning capacity of three types of activated cork filters: Fats, Oils
and Solvents (FOSS) filter, Fast Acting Digestive Enzymes (FADE) filter, and
Metal Adsorption and Concentration (MAAC) filter.
The cork filters were compared to the sand filters during normal operation and,
because of previous problems with the stability of the sand filter performance,
during stress tests. The results show that the cleaning capacity of the sand filters is
higher than the cleaning capacity of the cork filters at normal operation. At the
conditions of the stress tests, at which the sand filters do not function, the cleaning
capacity of the cork filters was somewhat lowered but was still well within
acceptable limits.
An important result from the experiments is that the cork filters neutralize the pH.
The sand filters are sensitive to changes in the pH, meaning that the cork filters
could function as a buffering unit prior to the sand filters.
Keywords: sand filter, cork filter, stress experiment, cork, sorbent
Department of Information Technology, Uppsala University,
Box 337, SE-751 05 Uppsala, Sweden
ISSN 1401-5765
ii
Referat
En jämförelse mellan korkfilter och konventionella sandfilter: Pilotstudie
inom behandling av processvatten
Ulrika Bohlin
Processvatten används i alla typer av industrier. Processvattnets funktion kan vara
att kyla eller att transportera material från olika industriprocesser. Oavsett syftet,
måste vattnet vara rent nog för sitt ändamål. Processvattnet kan renas med bl. a.
olika typer av filter. I många reningsverk används konventionella sandfilter.
Sandfilter är framför allt bra på att ta bort suspenderat material, men även metaller
och oljor.
Syftet med detta examensarbete är att jämföra reningsresultatet efter aktiva
korkfilter från företaget Spikes & Cogs AB med konventionella sandfilter.
Processvattnet som används under experimenten kommer från ståltillverkningen
och bearbetningen på Ovako Hofors AB i Hofors. Försöket genomfördes som en
pilotstudie på plats i Hofors.
Tre aktiverade korkfilter har använts: Fats, Oils and Solvents (FOSS) filter, Fast
Acting Digestive Enzymes (FADE) filter och Metal Adsorption and Concentrating
(MAAC) filter. Effektiviteten i korkfiltren jämfördes med effektiviteten i
sandfilter vid normal drift. Störningar i sandfilterreningsprocessen på Ovako har
inträffat under åren varför korkfiltren även testades under stressade förhållanden.
Resultatet visar att sandfiltrens reningsförmåga är högre än korkfiltrens
reningsförmåga vid normal drift. Under stressexperimentet var korkfiltrens
reningsförmåga något lägre än vid normal drift. Jämfört med sandfilter under
stressade förhållanden kunde korkfiltren hålla en högre reningskapacitet.
Korkfiltren har ett bredare funktionsspann vilket tyder på en större robusthet vid
förändrat substratinnehåll i processvattnet. Ett viktigt resultat av experimenten är
att korkfiltren neutraliserar pH. Sandfiltren är känsliga för förändringar i pH och
korkfiltren kan fungera som en pH-utjämnare om de placeras före sandfiltren.
Nyckelord: sandfilter, korkfilter, stressexperiment, kork, sorbent
Institutionen för informationsteknologi, Uppsala Universitet,
Box 337, SE-751 05 Uppsala, Sverige
ISSN 1401-5765
iii
Preface
This work is a master thesis of 30 ECTS within the Master of Science program in
Aquatic and Environmental Engineering at Uppsala University, Sweden. The
project has been carried out for Spikes and Cogs AB, in Stockholm, Sweden.
Supervisor was Johan de Faire. Subject reviewer was Bengt Carlsson at the
Department of Information Technology, the Division of Systems and Control,
Uppsala University, Sweden. Examiner was Allan Rodhe, Department of Earth
Sciences, Uppsala University, Sweden. The project was financed by Spikes &
Cogs AB and Ovako Hofors AB.
Uppsala, 2011
Ulrika Bohlin
Copyright © Ulrika Bohlin and Department of Information Technology, Uppsala
University
UPTEC W 11031, ISSN 1401-5765
Printed at the Department of Earth Sciences, Geotryckeriet, Uppsala University,
Uppsala 2011

iv
Populärvetenskaplig sammanfattning
En jämförelse mellan korkfilter och konventionella sandfilter: Pilotstudie
inom behandling av processvatten
Ulrika Bohlin
Vatten har ett mycket brett användningsområde och många verksamheter skulle
inte kunna genomföras utan vatten. Samtidigt är vatten livsnödvändigt för att
möjliggöra de allra flesta former av liv på jorden. Därför är det extra viktigt att det
vatten som används renas på ett adekvat sätt. I detta examensarbete har en ny
vattenreningsteknik, där reningen sker med hjälp av aktiverad kork, utvärderats
och jämförts med en befintlig sandfilterrening.
Utvärderingen av de två reningssystemen har skett på stålverket Ovako Hofors AB
i Hofors. Filtren som har använts är framtagna av Spikes & Cogs AB och är av
typerna Fats, Oils and Solvents (FOSS), Fast Acting Digestive Enzymes (FADE
and Metal Adsorption And Concentration (MAAC).
FOSS-filter består av kork som har värmebehandlats för att på så vis skapa en
större yta där absorption av oljor och fetter kan ske. FADE-filtret har en korkmatris
som stomme och mikroorganismer som utsöndrar enzymer som bryter ned
organiskt material. På så vis frigörs bl. a. metaller som finns bundna i det
suspenderade organiska materialet. Vattnet med de frigjorda metallerna kan sedan
filtreras genom ett MAAC-filter där metallerna adsorberas på den aktiverade
korken. Resultatet efter denna behandling är ett vatten med lägre koncentrationer
av oljor, fetter, organiskt material och metaller.
Sandfilter har använts i över hundra år för att rena vatten från suspenderat material.
Sandfilter fungerar så att vatten pumpas eller får rinna genom en bädd av sand.
Suspenderat material fastnar på eller mellan sandkornen och avskiljs på så vis från
vattnet. De sandfilter som används i vattenreningen på Ovako i Hofors är av typen
DynaSand och har en rörlig sandbädd där både vatten och sand pumpas runt.
Den jämförelse som gjorts inom ramen för detta examensarbete har fokuserat på
att undersöka reningskapaciteten hos sandfiltren respektive korkfiltren. Detta har
gjorts genom parallella experiment där vatten från normal drift har använts.
Experiment där korkfiltren utsatts för stress i form av störningar som är kända för
att orsaka minskad funktionalitet i sandfiltren har genomförts. De störningar som
användes var högt och lågt pH samt förhöjda halter av suspenderat material, grafit,
emulsion och avfettningsmedel. Varje störning provades en gång, men med två
olika halter.
De slutsatser som gick att dra utifrån försöken var att vid normal drift fungerar
sandfiltren bättre som renare av processvattnet än vad korkfiltren gör. Ett bättre
reningsresultat med korkfiltren hade förmodligen kunnat uppnås med en större
korkfiltervolym.
v
Utifrån stressexperimenten kunde ett antal slutsatser dras. Reningsresultaten från
de stressade korkfiltren var aningen lägre än resultaten som uppnåddes under
normal drift. Detta är dock fortfarande bättre än vad sandfiltren normalt presterar
under likartade förhållanden. En annan viktig upptäckt var att korkfiltren
neutraliserar pH, vilket gör att om korkfiltren placeras före sandfiltren skulle de
kunna minska belastningen på sandfiltren samt fungera som en pH-buffert. Detta
skulle kunna medföra en säkrare drift av sandfiltren. Vidare visade det sig att
upptaget av molybden och nickel i korkfiltren var pH-beroende. En konsekvens av
detta är att upptaget av molybden och nickel kan styras genom tillsats av syra
respektive bas.
Till vattenreningen kommer ett specifikt flöde med vatten som har använts i
stålkokningsprocessen. Efter att stålet har smälts och slaggbildare har tillsats
avgasas stålet för att ge det rätt egenskaper. Under avgasningen används en
vattendriven vakuumpump. Vattnet från vakuumpumpen kommer därefter till
processvattenreningen. Prover tagna på stålavgasningsvattnet har visat att det har
ett högt metallinnehåll. Ett försök att rena stålavgasningsvattnet med ett
MAAC-filter gjordes med gott resultat. Ett par olika kontakttider, d.v.s. den tid
vattnet är i kontakt med filtret, gjordes. Resultatet blev att det mesta av metallerna
bands till filtret redan under de första 1-5 minuternas kontakttid. Om
stålavgasningsvattnet skulle renas innan det förenas med det övriga vattnet i
vattenreningen skulle metallbördan till sandfiltren kunna minskas.
Examensarbetet visar att korken är en stabil reningsteknik även om den inte når
upp till riktigt samma reningsnivå som sandfiltren. Det finns dock en del kvar att
göra. Mer utförliga pilotförsök på fler typer av vatten skulle ge mer kunskap om
korkfiltertekniken. En ekonomisk analys av korkfiltertekniken jämfört med
konventionella reningstekniker skulle vara intressant. Även livscykelanalys skulle
kunna tillföra en del till kunskapen om korkfilter som ett alternativ till de vanliga
reningsteknikerna.

vi
Table of Contents
Abstract .............................................................................................................................. i
Referat .............................................................................................................................. ii
Preface ............................................................................................................................. iii
Populärvetenskaplig sammanfattning .............................................................................. iv
Table of Contents............................................................................................................. vi
1 Introduction............................................................................................................ 1
1.1 Spikes & Cogs AB ................................................................................................. 1
1.2 Ovako Hofors AB .................................................................................................. 2
1.3 Description and Aim of Project ............................................................................. 3
2 Survey on Industrial Water Treatment ................................................................... 5
2.1 Conventional Methods for Heavy Metal Removal ................................................ 5
2.2 Sand filters ............................................................................................................. 6
2.3 Biosorbents ............................................................................................................ 8
3 Process water treatment plant at Ovako ............................................................... 12
3.1 Disturbances in the PWTP ................................................................................... 13
3.2 Degassing water ................................................................................................... 14
4 Material ................................................................................................................ 15
4.1 Filters ................................................................................................................... 16
4.2 Air Whirl Technology .......................................................................................... 17
5 Method ................................................................................................................. 19
5.1 Contact time ......................................................................................................... 19
5.2 Guidance Values .................................................................................................. 19
5.3 Experiments ......................................................................................................... 20

vii
5.4 Measurement Methods ......................................................................................... 22
5.5 Calculations ......................................................................................................... 22
5.6 Historical data ...................................................................................................... 22
6 Results ................................................................................................................. 24
6.1 Parallel experiments ............................................................................................. 25
6.2 Stress Experiments ............................................................................................... 38
6.3 Concluding Data for Stress Experiments ............................................................. 46
6.4 Degassing Water .................................................................................................. 48
6.5 Concluding data for all experiments .................................................................... 50
7 Discussion ............................................................................................................ 51
7.1 Parallel Experiments ............................................................................................ 51
7.2 Stress Experiments ............................................................................................... 54
7.3 Degassing Experiments ....................................................................................... 56
7.4 In context ............................................................................................................. 57
8 Conclusions.......................................................................................................... 58
9 Further work ........................................................................................................ 59
10 Acknowledgements .............................................................................................. 60
11 References............................................................................................................ 61
Appendix A .................................................................................................................... 62
Appendix B ..................................................................................................................... 64
Appendix C ..................................................................................................................... 69
1
1 Introduction
Most industries have different types of process water running through their plants.
The function of process water can be to transport residual products, solvent of
chemicals or cooling. Regardless of the function of the water, it must be clean
enough for its purpose. There are different kinds of cleaning technologies on the
market, each suited for different applications.
Ovako Hofors AB, a Swedish steel company, uses a closed-circuit system for its
process water. On site in Hofors, the process water undergoes several treatment
procedures such as sedimentation, pH-adjustment, addition of flocculants, sand
filters and lamella sedimentation. These are traditional treatment methods for this
type of industry.
Partial flows of process water from different process steps finally connect at one
common point, the process water treatment plant. The water contains a spectrum of
pollutants; oils, fats, solvents, metals, heavy metals and suspended matter, that
need to be removed before re-use.
Treatment methods applied at the plant generate process water of required quality
for re-use. However, the final treatment step – the sand filters – are sensitive to
certain variables; pH fluctuations and heavy loads of oils and suspended matters.
To evaluate alternative treatment processes, the company Spikes & Cogs AB was
asked to run a pilot study using their activated cork technologies for water
treatment.
The scope of this thesis was to conduct a pilot study to compare the sand filters of
Ovako Hofors AB to the Fats, Oils and Solvents (FOSS), the Fast Acting Digesting
Enzymes (FADE), and the Metal Adsorption And Concentration (MAAC)
technologies developed by Spikes & Cogs AB.
1.1 Spikes & Cogs AB
Spikes & Cogs AB (hereinafter called Spikes & Cogs) is a cleantech company
specialized in treating industrial process water, effluents, leachates and
wastewaters (J. de Faire, personal communication, May 17, 2011). The company
was founded in April 2010 by Urban Falkmarken and Johan de Faire. The concept
is to apply naturally occurring biochemical and biological processes to reduce
organic matters, recover metal ions, absorb emulsified fatty matters and stabilize
inorganic compounds. From an environmental point of view, the idea is to return
treated fluids to the ecosystem without causing any additional environmental
burden to the recipient. The treated water should be clean enough to be able to
re-use as recycled process water, surface water, water for infiltration or water for
irrigation.
The hardware used in Spikes & Cogs products are add-on units of plug-in type.
They can be used as a complement to conventional water treatment methods or as a
replacement for less cost-effective methods. During the summer of 2011, pilot
2
studies of the technologies developed by Spikes & Cogs were conducted. One of
the pilots was located at Ovako in Hofors and is the subject of this master thesis.
1.2 Ovako Hofors AB
Ovako in Hofors, Sweden, is represented by two companies within the same
industrial area: Ovako Hofors AB and Ovako Tube & Ring AB (www.ovako.se).
The forerunner to Ovako was SKF Steel. Today the Ovako group is composed of a
number of companies and is owned by the private equity investor Triton. The main
operation of Ovako Hofors AB is production of steel blanks and heavy bars. Steel
is made in Hofors and some of it is further processed in the Ovako plant in
Hällefors. The steel has high purity. About 70 % of the total steel production is
used to make bearings and the rest is used in other applications with similar high
demands on purity. Ovako Tube & Ring AB processes steel blanks to make tubes
and rings.
1.2.1 Description of Processes
Ovako uses various qualities of steel scrap as raw material to the steelmaking
process (Ovako steel). The scrap arrives by train or by truck and is loaded in scrap
baskets before it is charged to the Electric Arc Furnace (EAF). The EAF process is
run batchwise and the weight of one charge is approximately 100 tons. The steel is
melted in the EAF. In the next step the molten steel is treated in the ladle furnace
where the steel is alloyed and degassed. In the degassing process about 300 m3 of
process water is used. After the degassing, the steel is ingot-cast in 24 cast iron
moulds per charge. The cast iron moulds are removed and the ingots put in a
soaking pit furnace to be heat treated. After soaking, the ingots are rolled in the
rolling mill to blanks in different dimensions.
Tube and Ring AB refines the blanks to tubes and rings. The steel is heated and
processed to the desired dimensions. Tubes are hot rolled and may subsequently be
cold processed to achieve desired properties. Depending on the dimensions, rings
are rolled or forged. In a similar way blanks are refined to bars in Hällefors.
1.2.2 Process Water Treatment Plant
The process water treatment plant (PWTP) is situated in the south part of the
industrial area of Ovako in Hofors (K. Pålsson, personal communication, June 16,
2011). Every hour, 550 m3 of industrial process water flows through the PWTP,
which yields a flow of approximately 5 000 000 m3 a year.
After treatment the production units re-use the water in the manufacturing
processes. In addition, the vacuum pump in the ladle furnace uses 600 m3 of water
per hour for the degassing process. The process runs between 30 and 40 minutes at
each run and about 100 times per week. This yields an additional volume of
approximately 1 560 000 m3 per year to the total amount of process water flowing
through the PWTP. Investigations indicate that a great part of the metal content in
the incoming water to the PWTP come from the degassing water. The process
3
water is returned after treatment in the PWTP to a closed circuit-system in the
industrial area. The excess water from the PWTP overflows to the recipient, river
Hoån.
In addition to the process water flows, it happens that vacuum loaders empty their
burden in the pre-separator basin or in the sludge boxes outside of the PWTP
depending on the water content in the load. The vacuum loaders collect waste all
over the steel plant. Most often it is small amounts of sludge-blended water from
maintenance of sewers. It is also common with wash water used to clean out the
vacuum loaders after transport of solid bulk material like lime or mill scale. Even
though the burdens are small in volume, they can cause disturbances to the PWTP.
The most sensitive part is the sand filter process.
The technology and methods currently used for treating the process water works
well under normal conditions, but when certain variations occur, the sand filters do
not work efficiently.
The necessity of high-quality water in the process plant and environmental
restrictions on overflowing water to Hoån motivate Ovako to take on a pilot study
with technology from Spikes & Cogs. The pilot is done in order to evaluate if some
of Spikes & Cogs technologies could match Ovakos requirements.
1.3 Description and Aim of Project 1.3.1 Purpose
The purpose of this master thesis was to analyze and compare the results of the
sand filters at Ovako to the results of the FOSS, FADE and MAAC technologies.
The purpose was also to compare the stability of the FOSS, FADE and MAAC
technologies to the stability of the sand filters. The stability of the cork filters was
tested through stress experiments. Parameters to be analyzed are:
Oil concentrations
Metal concentrations
Concentration of suspended matters
1.3.2 Methodology
This master thesis was performed in the following steps:
• Perform literature study
• Conduct experiments
• Analyze test results
• Evaluate test results
• Write report
4
1.3.3 Limitations of Thesis
To limit the aspects evaluated during the experiments, some parameters were
selected as more crucial than other. Also, the people responsible for the wastewater
treatment plant at Ovako listed the problems they had encountered through the
years. The following main disturbances to the incoming water system were stated:
• sudden changes in pH levels
• high loads of graphite
• high loads of emulsions
• high loads of degreasing agent
• high loads of suspended matters
The stress experiments were limited to cover the disturbances that are stated
above.
The aspects evaluated were:
The Spikes and Cogs filters during normal operation.
The Spikes and Cogs filters at stressed operation beyond the sand filter
limits of operation.
The parameters used for the evaluation were:
Concentrations of suspended matters and oils.
Concentrations of aluminum (Al), chrome (Cr), copper (Cu), iron (Fe),
manganese (Mn), molybdenum (Mo), nickel (Ni), phosphorous (P), lead
(Pb) and zinc (Zn).
5
2 Survey on Industrial Water Treatment
The following section gives a summary of some of the process water treatment and
wastewater treatment technologies that are commonly available on the market.
The function of sand filters is covered in more detail since it is the technique
currently used at Ovako. Also, this section gives a background to the active
processes of the FOSS, FADE and MAAC technologies. Process water is water
used in different processes in industries. Wastewater is water that has been used in
different applications and can be either industrial wastewater or municipal
wastewater.
2.1 Conventional Methods for Heavy Metal
Removal
Ahluwalia and Goyal (2007) discuss conventional methods for heavy metal
removal from industrial effluents. Several processes have been developed to purify
industrial and municipal wastewater. The most commonly used methods are
precipitation, coagulation, ion exchange, cementation, electro-dialysis,
electrowinning, electrocoagulation and reverse osmosis. The following sections
briefly describe some of the methods.
2.1.1 Precipitation
The precipitation process is a commonly used method that can decrease the
concentration of heavy metals in aqueous solutions to levels of parts per million
(ppm). The process is usually cost effective but the treatment result is impaired at
low pH. The precipitation process therefore depends on the addition of chemicals.
The sludge produced in the treatment has high water content, which makes it
expensive to dispose of. Precipitation can be done using lime, bisulphide or ion
exchangers, but the process lacks the capacity to remove a specific metal and leave
the others. Precipitation is ineffective at low concentrations of metals in the
aqueous solution relative to the normal cleaning result.
2.1.2 Ion exchange
Ion exchange is another method frequently used with good results in the industry.
An advantage of the ion exchange method is the possibility to decrease the
concentration of metals to parts per billion (ppb) after treatment. The method can
handle big volumes and still maintain low concentrations of pollutants in the water
after cleaning. A disadvantage is the relatively high cost of the method compared
to other methods.
An ion exchanger is a solid matrix that can change ions on the matrix surface with
ions in the water surrounding the solid. A disadvantage is the ion exchanger’s
dependence on the pH in the solution and its sensitivity to high loads of organic
materials which easily clog the matrix. Also, ion exchange is very sensitive so
salinity.
6
2.1.3 Electrowinning
Electrowinning is commonly used in the mining and metallurgical industry. The
method is used to treat water from heap leaching and acid mine drainage. With
electrowinning, metals like silver, gold, cadmium and chromium, and others, can
be removed or recovered from industrial effluents. Recovery and removal are
important in the metal transformation, electronics and electrical industries.
Electrowinning is commonly used for refining of metals.
2.1.4 Electrocoagulation
Electrocoagulation is an electrochemical approach to water treatment. An
electrical current is used to remove metals from the solution. In addition to metals,
the electrocoagulation process also removes suspended solids, dissolved metals,
tannins and dyes. Ions and other charged particles precipitate when they are
presented with ions of the opposite electrical charges provided by an
electrocoagulation system.
2.1.5 Cementation
Cementation is a variant of precipitation implying an electrochemical mechanism.
A metal of higher oxidation potential is put into a solution together with a metal of
lower oxidation potential. An example is a solution of copper. At the presence of
solid iron the copper ions are reduced to atomic copper and the iron oxidizes to
ions. Copper and other noble metals are the most frequently separated metals with
the cementation method.
2.1.6 Reverse Osmosis
Reverse osmosis and electro-dialysis involves the use of semi-permeable
membranes. The membranes are used for recovery of metal ions from diluted
wastewater. Selective membranes are used in electro-dialysis. An alternation of
cation and anion membranes is put between the electrodes in an electrolytic cell.
Under continuous electric current the ions migrate, allowing recovery of metals.
2.2 Sand filters
Following section describes sand filters and summarizes the P72 publication of
Svenskt Vatten (The Swedish Water & Wastewater Association) from 1992.
Filtration is a common method for water treatment. There are essentially two types
of filters:
Fast filters with a capacity of 5-10 m3/m
2 for open filters and 10-15 m
3/m
2
for pressure filters.
Slow filters with a capacity of 0.2-0.4 m3/m
2.
7
The unit of measurement, m3/m
2, describes the flow, m
3, through the top or bottom
filter area, m2. In the beginning, sand filters were used for separation of suspended
matters. One of the first big sand filters went into production as early as 1830 for
the purpose of filtrating water from river Thames before the water was distributed
to the Londoners.
Use of the word filtration has changed over the years. In the beginning it was used
to describe the process of separating suspended matters from water. Now, filtration
describes all kinds of processes, not only with the purpose to separate suspended
matters from a solution.
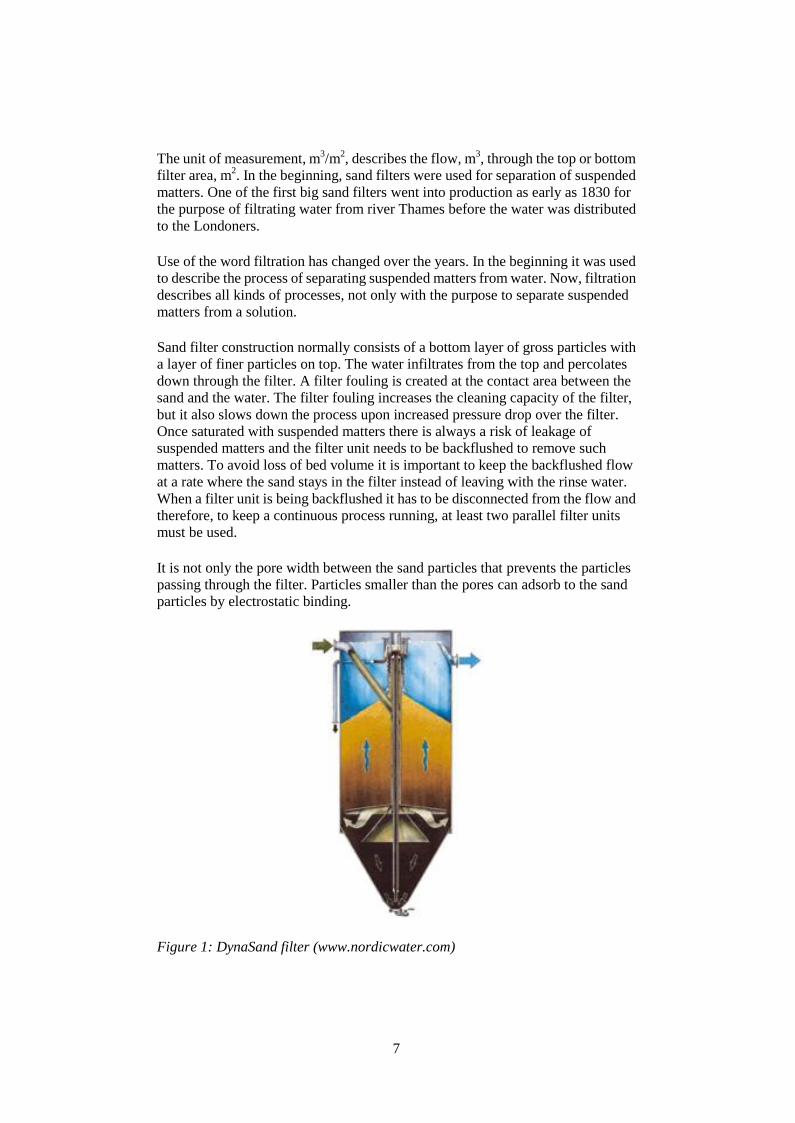
Sand filter construction normally consists of a bottom layer of gross particles with
a layer of finer particles on top. The water infiltrates from the top and percolates
down through the filter. A filter fouling is created at the contact area between the
sand and the water. The filter fouling increases the cleaning capacity of the filter,
but it also slows down the process upon increased pressure drop over the filter.
Once saturated with suspended matters there is always a risk of leakage of
suspended matters and the filter unit needs to be backflushed to remove such
matters. To avoid loss of bed volume it is important to keep the backflushed flow
at a rate where the sand stays in the filter instead of leaving with the rinse water.
When a filter unit is being backflushed it has to be disconnected from the flow and
therefore, to keep a continuous process running, at least two parallel filter units
must be used.
It is not only the pore width between the sand particles that prevents the particles
passing through the filter. Particles smaller than the pores can adsorb to the sand
particles by electrostatic binding.
Figure 1: DynaSand filter (www.nordicwater.com)
8
A sand filter becoming more commonly used is the DynaSand filter which is also
the technique used at Ovako. This technique makes it possible to have a continuous
flow through the filter, because of the built-in backflush function. In a common
fast sand filter the sand is stagnant. In a DynaSand filter the sand is moving
through the filter at a constant speed and the flow through the filter is upstream,
from the bottom to the top (bottom loaded). The water is injected about 1/3 from
the bottom of the filter bed. The sand will therefore be most contaminated at the
bottom of the filter. A mammoth pump, which is a pumped powered by air, lifts the
sand from the bottom to the top while it is rinsed on its way up. At the top of the
filter, the water and the sand will be clean.
In newer DynaSand filters the flow and the construction is reversed i.e. the water
flows downwards and the sand upwards (top loaded).
2.3 Biosorbents
Biosorption is the process were a biological material, living or dead, adsorbs
metals, dyes or different kinds of materials from aqueous solutions (Park et al.,
2010). The first research article discussing a quantitative study on biosorption was
published already in 1902, according to the work done by Park et al. (2010). The
earliest application of biosorption for large scale use involved sewage and
wastewater treatment. During the past 30 years thousands of articles discussing
biosorption and about 70 review papers have been published (Park et al., 2010).
The topics discussed in the articles mainly deal with biosorption phenomena,
equilibrium and kinetic modeling, reactor operation and application in real
industries (Park et al., 2010).
It is important to make a distinction between living and dead biosorbents. Living
biosorbents are microorganisms that digest toxic pollutants and hence remove
them from the wastewater. Dead biosorbents are different kinds of organic
materials, for example rice straws, wheat bran, soy bean husks, plant residues,
sawdust, tree barks and weeds only to mention a few (Park et al., 2010). The
advantages of dead biosorbents are that they do not demand nutrient supplies and
complicated bioreactor systems (Park et al., 2010) and are more tolerant to toxic
environments (Matis et al., 2003). The organic material used as biosorbent is often
common in the region where it is used (Das et al., 2008).
In a review by Babel and Kurniawan (2003), a wide range of different low cost
adsorbents are described. Chitosan, a byproduct from cellulose, is a heavy metal
adsorbent. Zeolites, naturally occurring crystalline aluminosilicates, are
ion-exchangers. Zeolites are especially good at adsorbing strontium and cesium
but also adsorb other heavy metals. Other kinds of clays have been studied for their
ion-exchange capacities and have been found to adsorb zinc, lead and aluminum
from aqueous solutions. Peat moss mainly consists of lignin and cellulose and is an
ion-exchanger. The content of humic acids and fulvic acids in peat moss influences
the uptake of metals. Over all peat moss is a good adsorbent for all metals. Natural
oxides can be used as sorbents for heavy metals. Especially the uptake of arsenic
and chromium has been studied. Industrial wastes such as iron(III) hydroxide,
lignin, blast-furnace slag and saw dust adsorb metals. Other low-cost sorbents
9
described by Babel and Kurniawan are rice husk carbon (RHC) and coconut shell.
RHC removes chromium(VI) at pH 2.5. Coconut shell also removes chromium
(VI) at pH below pH 7 and has a higher sorption capacity at low concentrations.
2.3.1 Cork as Sorbent
Cork bark contains high levels of the hydrophobic substance suberin. The function
of suberin is to prevent water and minerals to pass through the plant wall
(Campbell & Reece, 2005). The barrier is called the Casparian strip and works in
two ways; the Casparian strip keeps water in the plant to prevent the plant from
drying and it prevents too much water and minerals to pass into the plant
(Campbell & Reece, 2005).
In a study conducted by Villaescusa et al. (2000), yohimbe bark and cork from the
oak tree was used as sorbents. Yohimbe is a tropical tree used to extract
yohimbine, an alkaloid with pharmacological properties. The aim of the study was
to investigate the ability of cork and yohimbe bark wastes to remove Cu(II) and
Ni(II) from an aqueous solution. The experiments were all carried out in a small
laboratory scale with untreated cork and yohimbe bark. Samples of 0.1 g of the
sorbent were put in contact with 10 cm3 of different aqueous metal solutions and
shaken until equilibrium was reached. The pH, the sodium chloride (NaCl)
concentration and the metal concentration was varied. When pH was varied a
maximum uptake was observed at pH values around 6-7. When the initial pH value
was greater than 2.5-3 the pH increased to about neutral during the experiment.
Villaescusa et al. (2000) also provided evidence for the theory that the metal
uptake is dependent on the pH. The closer to a neutral pH value, the greater is the
uptake of metals. The increased uptake at increased pH can be explained by the
protons and metal cations competing for surface sites at low pH.
The experiment by Villaescusa et al. (2000) was continued as follows. When
different concentrations of NaCl were added to the solution, the adsorption of
metals decreased quickly. Especially the Ni adsorption to cork seemed to be
sensitive to increased levels of NaCl. The adsorption process of the yohimbe bark
was less sensitive and could keep a level of 90 % removal of Cu(II) at a NaCl
concentration of 2.0 mol/dm3. Cork, at the same concentration, has a 16 % removal
of Cu(II).
The last aspect tried by Villaescusa et al. (2000) was how the initial metal
concentration affects the metal uptake. Concentrations from 5 mg/dm3 to 100
mg/dm3 were applied. The result was that cork was a slightly less efficient sorbent
than yohimbe bark. The uptake increased to 90 mg/dm3 and became constant
above that level.
A study of the adsorption of heavy metals by pre-treated cork was conducted by
Chubar et al. (2004). The metals to be adsorbed were Cu, Ni and Zn. The cork used
was in the fraction 50-100 μm. The pre-treatments of interest for this thesis are the
Fisher esterification and the thermal activation process because similar methods
are used to produce the cork used in the pilot study. The Fisher esterification was
performed by Chubar et al. (2004) to confirm the important role of carboxylic
10
groups in the metal binding process. Biomass of cork was treated with excess
HPLC grade methanol using a solution of diluted hydrochloric acid as a catalyst.
The cork was washed and dried after the treatment. The thermal activation process
was carried out using steam. A porous carbon made of cork biomass was prepared
and activated in steam with temperatures of 700 and 800 °C. The thermal treatment
increases the surface of the cork.
The pre-treated cork and aqueous solutions containing Cu, Ni or Zn were placed in
bottles. The flasks were stirred at 25 °C for a pre-set contact time of 24 or 48 hours.
The solution was filtered and the metal concentration analyzed. Chubar et al.
(2004) concluded that the Fisher esterification is important. Carboxylic groups are
important binding sites for copper and nickel and the only binding sites for zinc.
The sorption capacity of the thermally treated cork in a copper solution becomes
four to six times higher than that for untreated cork.
2.3.2 Microorganisms in Municipal Wastewater Treatment
The following section describes the role of microorganisms in municipal
wastewater treatment plants (WWTP) and summarizes the U2 publication of
Svenskt Vatten (The Swedish Water & Wastewater Association) from 2010.
A common setup of municipal WWTPs is to use an active sludge process. Active
sludge contains microorganisms, most commonly different species of bacteria.
The basic setup is an aerated and mixed basin, where active sludge and wastewater
is blended. The microorganisms digest the nutrients of the incoming wastewater,
multiply and build flocculants. The sludge-blended wastewater is transported to a
settling basin where the active sludge settles. Clean water is decanted from the top
of the settling basin. If flocculants are not built, the sludge will leave with the clean
water to the next step. Some of the active sludge in the bottom of the sedimentation
basin is pumped back to the aerated basin.
This process gives water with a concentration of suspended organic material and
substances of 10-25 %. The water needs further processing, but the main part of the
organic matter is gone.
A similar system for removal of nitrogen is composed of an aerated basin with
oxidative bacteria, an aerated basin with nitrifying bacteria and an anoxic basin
with denitrification bacteria. This is a system that is used to remove nitrogen from
the outgoing water. Giving slightly different results, the basins can be put in
different order.
It is also possible to use microorganisms to reduce the phosphorous load. The
water must pass through an anaerobic basin that contains both nitrate and an excess
of easily accessible carbon. The process can be designed to make all wastewater,
or only parts of the flow, pass through the phosphorus strip basin.

11
2.3.3 Microorganisms as Sorbents
Many studies have been conducted on the topic of reducing metals and heavy
metals from solutions by using microorganisms as sorbents. Matis et al. (2003) use
a combination of Penicillium chrysogenum and fungi to adsorb metals from an
aqueous solution in a two-step process. The contact time of this biosorption is 6
minutes. The experiment was conducted in laboratory scale. The result shows a
90-95 % uptake of Cu, a 50-95 % uptake of Ni and a 70-99 % uptake of Zn. Matis
et al. (2003) draw the conclusion that the method can be used to adsorb metals but
that it requires further improvement and optimization of the method.
In the extensive review conducted by Ahluwalia and Goyal (2007), a wide range of
studies of metal uptake by bacteria and fungi was described. Three fungal, four
algal and two bacterial biosorbents were presented as the best biosorbents in the
studies. Ahluwalia and Goyal also draw the conclusion that it is very important to
understand the mechanism by which microorganisms accumulate metals. If the
mechanism is known it is possible to develop processes for concentration, removal
and recovery of metals from the aqueous solution. An example is fungi that have,
according to Ahluwalia and Goyal (2007) and Gupta et al. (2000), a variety of
ligands on their cell walls involved in metal chelation bonding. A metal ion can
also be adsorbed by building a complex with negatively charged reaction sites on
the cell surface of the fungi. The cell surface of fungi can vary considerably
between different species and the adsorption capacity therefore varies likewise. It
is therefore important to choose the right fungi for adsorption.
12
3 Process water treatment plant at Ovako
A more in-depth description of the PWTP at Ovako follows in this section. The
potential disturbances in the PWTP and their origin are described.
The process water from the processes in the industrial area is gravity fed through
the whole process plant (T. Skoglund, personal communication, May 17, 2011).
When the water reaches the PWTP it is 5 m below ground (1) and has to be
pumped up to ground level. At the treatment plant the water first arrives in a
pre-separator basin (2) where the large particles in the process water settle. In the
next step, the process water is treated in one of two parallel settling basins (3) that
are equipped with oil skimmers. The waterborne particles settle at the bottom of
the basin forming sludge that bottom scrapes collect to one end where the sludge is
pumped to a thickener (5) and on to a sludge storage (12). Skimmers collect the oil
from the settling basin and move it to the other end of the basin where the oil is
collected in an oil storage tank (4). The process water, now containing less oil and
suspended matters, flows to a collection storage (6). From here, four pumps lift the
process water (7) and aluminum chloride (AlCl3), a flocculant, is added on the way
to the sand filters (8). Studies made at Ovako show that most of the metals in the
process water are bound to the suspended matters.
Figure 2: Schematic overview of the PWTP. 1. Collection storage for incoming
wastewater. 2. Pre-separator basin. 3. Settling basin. 4. Oil storage tank. 5.
Thickener. 6. Collector storage. 7. Collecting vessel. 8. Sand filter. 9. collecting
vessel. 10. Cooling tower. 11. Outlet to recipient.12. To sludge processing.
There are 32 parallel DynaSand filters; 8 newer and 24 older. The newer sand
filters were installed in the middle of the 90’s and are top loaded. The old ones are
bottom loaded. In each sand filter, a pump moves the water through the filter. After
13
the sand filters, the clean water flows to a collecting vessel (9) onto two cooling
towers (10) where the water is cooled to 25 °Celsius. From the cooling towers,
pipes lead the water back to the production plant. If there is too much water at the
same time in the PWTP, water can be decanted to recipient (11). The wash water
from the sand filters, which contains all the pollutants and suspended matters, goes
to a lamella sedimentation process. The lamella sludge goes to a sludge storage and
onto a filter press. The water pressed from the sludge in the filter press flows back
to the sedimentation basin. The water from the lamella flows to the pre-separator
basin. During the summer months the need of cooling water is sometimes greater
than the capacity of the PWTP. When this happens, additional water from the river
Hoån is used to cool the processes in the steel plant.
3.1 Disturbances in the PWTP
In the following section the origins of the disturbances in the PWTP are described.
3.1.1 pH
The sand filters of the PWTP have a decreased efficiency at low and high pH. At
normal operation, pH should be between 6.4 and 7.4. If the pH is lower or higher
than the normal operational pH the amount of suspended matters in the filtrated
water will increase.
In the steel mill, uncalcined lime is used as slag forming agent. When needed, a
vacuum loader is used to remove excess or spilt lime from the site. After unloading
the waste lime, the inside of the vacuum loader is washed. The wash water is
sometimes emptied in the pre-separator basin at the PWTP which may result in an
increased pH. The phenomenon of a decreased pH follow the same principles as
that for an increased pH, only that the source is acid water remainings from the
pickling. Independent of if the wash water increases or decreases the pH of the
PWTP system, the water thereby disturbs the sand filters downstream from the
pre-separator basin.
3.1.2 Graphite
Graphite is used as lubricant in some of the rolling processes. The residual graphite
is collected in a trap, but some of it may accidentally overflow to the process water
and end up in the PWTP where it clogs the sand filters. If this happens, the filter
sand has to be replaced. Usually, very low concentrations of graphite will create
disturbances to the filters. There are different kinds of graphite, some are dissolved
in the aqueous phase, others are emulsified and others float on the surface. The one
used in the experiment described in Section 5, is emulsified graphite.
3.1.3 Suspended Matters
On occasions, e.g. when loads have been emptied in the pre-separator basin,
precipitated particles are stirred up and follow the flow to the sand filters. This

14
causes a so-called penetration (i.e. leakage) as the sand filters cannot take the
instant high load of particles.
3.1.4 Emulsions
Emulsions are for example used at the pilger mill at Tube & Ring to lubricate the
tubes during cold rolling. The emulsions are meant to be trapped in an oil trap
before the water leaves the production plant. Because emulsions do not float on the
surface, but are emulsified in the water, they cannot be scraped off when they reach
the PWTP. Instead, if emulsions get to the PWTP they will clog the filters. As a
consequence, the sand bed has to be washed for one or two days, or in the worst
case be replaced. The replacement is both time consuming and expensive.
3.1.5 Degreasing Agent
In the rolling mills, grease and oil are used to make the machines run smoothly.
From time to time the machines need to be degreased and for this purpose
degreasing agents are used. The mechanical parts are dismantled and brought to
the building for degreasing. Normally, all degreasing agents are collected in this
building. If small amounts of degreasing agent reach the PWTP, the flocculation
process before the sand filters will be disturbed. The efficiency of the sand filters
will decrease and the filtered water after the sand filters will contain too high
concentrations of suspended matters.
3.2 Degassing water
In the steelmaking process, the steel must be degassed after being melted. During
the degassing, oxygen is removed from the steel to give it a higher purity. The
process water is used for the vacuum pumps that create a vacuum in the ladle to
remove oxygen. Investigations of the water from the vacuum pumps have shown
that it contains relatively high concentrations of metals. Therefore, it is of interest
to see if the metals from the degassing water can be removed before the water
reaches the PWTP.
15
4 Material
In this section a description of the equipment used for the experiment and the
experimental setup will be given. All experiments were conducted according to the
same setup. The following equipment was used during the pilot study:
• Submersible pump
• Water tank, 600 l
• Air Whirl Technology (AWT) unit
• Circulation pump
• Fats, Oils and Solvents (FOSS) filter, 60 l tank
• Fast Acting Digestive Enzymes (FADE) filter, 60 l tank
• Metal Adsorption AND Concentration (MAAC) filter, 60 l tank
• Orion5star Thermo Scientific meter
Figure 3: The experimental setup. An AWT unit mixes the water in the tank. A
pump circulates the water through the filters, one filter at a time. When the desired
contact time is reached in the first filter, the water is circulated through the next
filter. Samples of the untreated water are taken from the tank before the
circulation is started. Samples of the treated water are taken after the MAAC filter.
The process water was pumped to the tank from the collector storage, Figure 2,
unit no 6, upstream of the sand filters before the addition of flocculants. The water
was circulated through the FOSS filter until the desired contact time was reached.
See section 5.1, for more information on the calculations of the contact time. When
the desired contact time was reached in the first filter, the process water was
pumped to the FADE filter and circulated to reach the desired contact time.
Thereafter, the water was pumped to the MAAC filter. The water was stirred and
aerated by the AWT unit throughout the whole process to facilitate the metal
adsorption during the last step.
In a full scale application with all three filters, the filters are put in the same order
as described above. The water will not be circulated, but pumped through the
filters, see Figure 4.
16
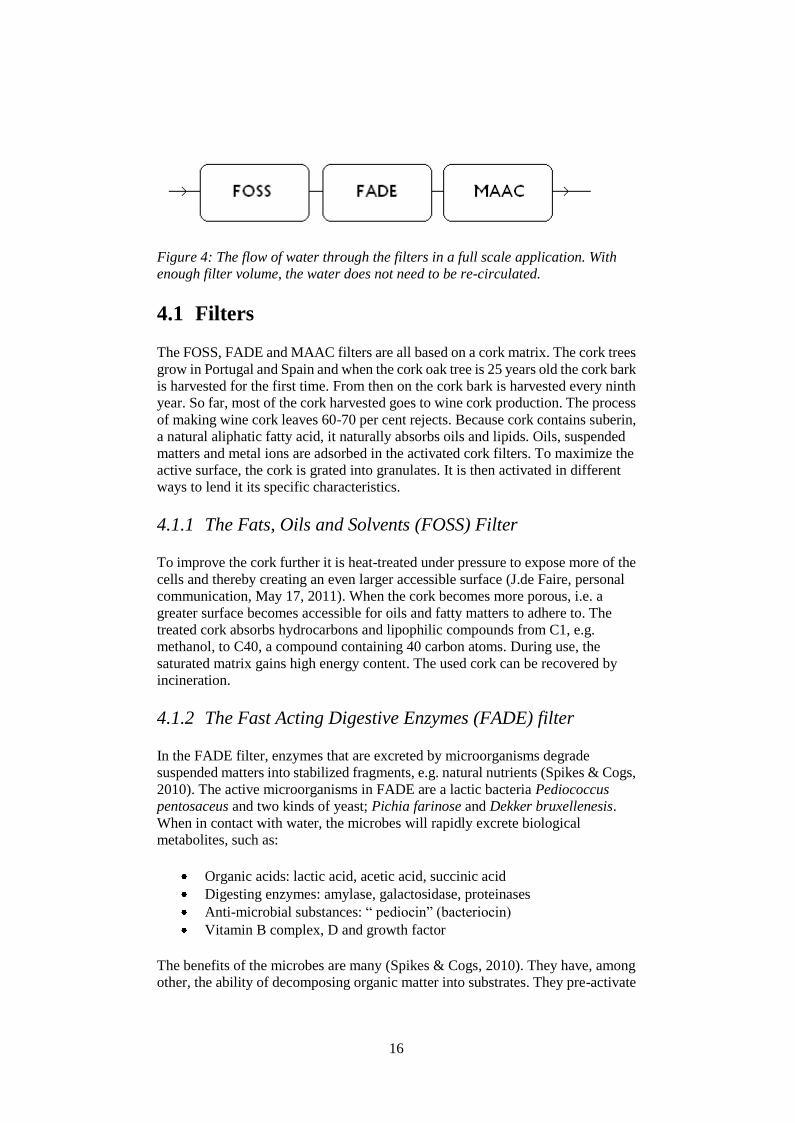
Figure 4: The flow of water through the filters in a full scale application. With
enough filter volume, the water does not need to be re-circulated.
4.1 Filters
The FOSS, FADE and MAAC filters are all based on a cork matrix. The cork trees
grow in Portugal and Spain and when the cork oak tree is 25 years old the cork bark
is harvested for the first time. From then on the cork bark is harvested every ninth
year. So far, most of the cork harvested goes to wine cork production. The process
of making wine cork leaves 60-70 per cent rejects. Because cork contains suberin,
a natural aliphatic fatty acid, it naturally absorbs oils and lipids. Oils, suspended
matters and metal ions are adsorbed in the activated cork filters. To maximize the
active surface, the cork is grated into granulates. It is then activated in different
ways to lend it its specific characteristics.
4.1.1 The Fats, Oils and Solvents (FOSS) Filter
To improve the cork further it is heat-treated under pressure to expose more of the
cells and thereby creating an even larger accessible surface (J.de Faire, personal
communication, May 17, 2011). When the cork becomes more porous, i.e. a
greater surface becomes accessible for oils and fatty matters to adhere to. The
treated cork absorbs hydrocarbons and lipophilic compounds from C1, e.g.
methanol, to C40, a compound containing 40 carbon atoms. During use, the
saturated matrix gains high energy content. The used cork can be recovered by
incineration.
4.1.2 The Fast Acting Digestive Enzymes (FADE) filter
In the FADE filter, enzymes that are excreted by microorganisms degrade
suspended matters into stabilized fragments, e.g. natural nutrients (Spikes & Cogs,
2010). The active microorganisms in FADE are a lactic bacteria Pediococcus
pentosaceus and two kinds of yeast; Pichia farinose and Dekker bruxellenesis.
When in contact with water, the microbes will rapidly excrete biological
metabolites, such as:
Organic acids: lactic acid, acetic acid, succinic acid
Digesting enzymes: amylase, galactosidase, proteinases
Anti-microbial substances: “ pediocin” (bacteriocin)
Vitamin B complex, D and growth factor
The benefits of the microbes are many (Spikes & Cogs, 2010). They have, among
other, the ability of decomposing organic matter into substrates. They pre-activate

17
organic materials for biogas and bioethanol production. During the process the
microbes’ activity lends the solution a pH of 6-7. Under anaerobic conditions the
microbes have the ability to denitrificate. Under aerobic conditions foul smells and
odors can be eliminated and nitrification and digestion will take place. The
microbes’ activity in the solution or material will create an unfriendly environment
for pathogenic bacteria, viruses and fungi.
FADE is facultative anaerobic; if there is no oxygen present, compounds based on
nitrogen, phosphorous and sulfur will be used in the microbial metabolism (Spikes
& Cogs, 2010). By controlling the level of dissolved oxygen in the water, the
process can be adapted to convert the nitrogenous, phosphorous and sulfurous
compounds into compounds more friendly to the environment. More than 85 per
cent of the suspended organic matter in contact with FADE is degraded in 6-48
hours (Spikes & Cogs, 2010).
4.1.3 The Metal Adsorption And Concentration (MAAC) filter
The binding mechanism used in the MAAC filter is based on chelating bonds (J. de
Faire, personal communication, May 17, 2011). A chelating bond is formed when
a single metal ion binds to two or more binding sites within the ligand (Hägg,
1989). When the metal ion has bound to the ligand, it cannot react with other
elements or ions to form metal salts, precipitates or scale.
The MAAC filter matrix is based on cork that is enzymatically treated to expose
more cells and to activate binding sites (J. de Faire, personal communication, May
17, 2011). Amines and carboxylic groups are allowed to form ligands that metal
ions can bind to. When the filter is saturated, the matrix can be incinerated and the
metals recovered by smoke-gas condensation. Another method is to desorb the
metals from the matrix and evaporate them into dry powder. The metals can be
reprocessed and re-used.
4.2 Air Whirl Technology
An AWT unit is used to aerate the water in the experimental tank (M.Bresell,
personal communication, June 13, 2011). The aeration is achieved by adding air
under vacuum, which differs from the commonly used strategy to add air at
over-pressure. The technology is based on rotation. When the unit rotates at high
speed, vacuum is created in the conical part of the unit. Air is sucked into the AWT
unit through the drilled-through shaft. Water, in the form of a centripetal whirl, is
sucked in through the bottom of the cone. The centripetal whirl in the water creates
a fast and strong movement in the medium itself and the added air. When the water
meets the air in the created vacuum in the cone, the two media implode. When this
happens, microscopic air bubbles containing oxygen are created. The bubbles
diffuse into the medium and binds to the water.
Microscopic bubbles have a longer dwell time in the medium and a greater total
area compared to the result from other methods of aeration. A greater area and
longer dwell time creates an environment that facilitates biological and chemical
processes in the water. An AWT unit consumes an average of 1.5 kWh during
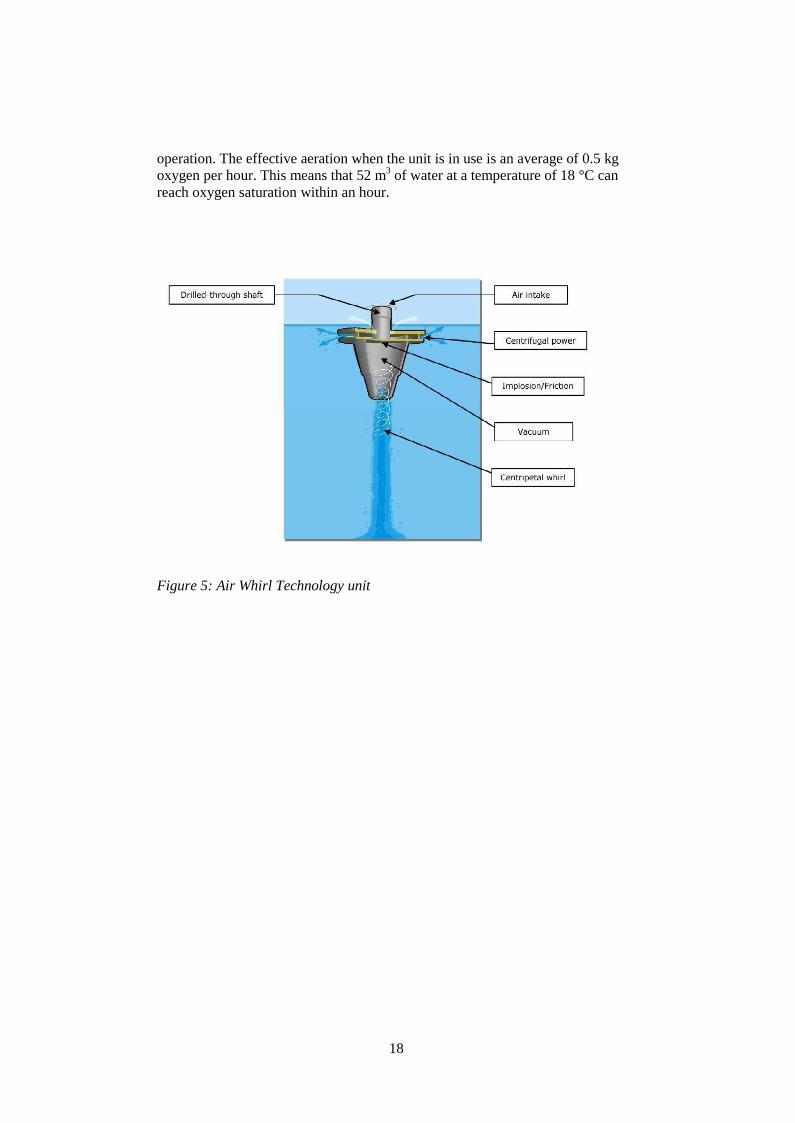
18
operation. The effective aeration when the unit is in use is an average of 0.5 kg
oxygen per hour. This means that 52 m3 of water at a temperature of 18 °C can
reach oxygen saturation within an hour.
Figure 5: Air Whirl Technology unit

19
5 Method
In the following section, a method for calculation of contact time and experimental
methodologies for parallel, stress and degassing water experiments are described.
Also, measurement methods, methods for calculating reduction and historical data
are described.
5.1 Contact time
The time that the water must be in contact with the filter to become clean is an
indication of the efficiency of the filter and is called the contact time. The contact
time was calculated by using the Empty Bed Contact Time (EBCT) method. The
contact time was calculated by dividing the volume of the matrix by the flow rate
through the filter. In the following experiments, a filter volume of 60 l was used.
For example, if the flow rate through the filter is 8.45 l/min, the contact time per
hour of operation is (60 l /(8.45 l/min=) 7.11 minutes per hour of operation. In the
parallel experiments described below, different contact times were used. To
achieve a contact time of 30 minutes, at the contact time per hour of operation in
the example above, the equipment would have to run for (30 min / (7.11 min/hour)
= ) 4.21 hours.
5.2 Guidance Values
The guidance value is a value limiting the emissions to the recipient and the impact
on the environment and is set by the authorities. The guidance values must be
followed, and if they are exceeded, the company has to report to the Länsstyrelse
(County Administrative Board) and present measures to come to terms with the
emission. Specific guidance values for the PWTP at Ovako are given for the
concentrations of suspended matters and oils. The guidance values are given as
average concentrations per month.
Suspended matters: 10 mg/l
Oil: 5 mg/l
There is also a maximum allowed emission value (MAEV). If a MAEV is
trespassed, the Länsstyrelse can take the company to court. The MAEV’s are too
high to be important for this study.
A new general guidance value for emissions of P to recipients in the county of
Gävleborg will be 0.4 mg/l, from January 1, 2012. As it is important for the
company to follow the guidance values, the treatment results for the filters will be
compared to the guidance values.
20
5.3 Experiments
To evaluate the chosen parameters experiments were conducted and samples were
analyzed. In the following, the experimental methods of each experiment are
described.
5.3.1 Parallel Experiments
To test the efficiency of the pilot equipment different contact times were used and
the cleaning effects were compared to the results from the sand filters. The contact
times analyzed were:
30 min with normal flow
15 min with normal flow
15 min with high flow
7.5 min with normal flow.
To reach the different contact times the flow of water through the filters was
regulated. Low flow was set to 6-7 l/min and high flow was set to 11-13 l/min.
Depending on how many of the sand filters that were in use and the flow of the
water through them, the contact time was calculated according to the EBCT
method, see section 5.1. When the calculated time for the water to pass the old
sand filters had passed, water samples were taken from the top of the old sand
filters (bottom loaded). The newer sand filters have reversed inlets and the filtered
water could therefore not easily be handled. The results from the sand filters were
compared to the results from the pilot equipment.
5.3.2 Stress experiments
Different divergences were applied to the process water to allow analyses of the
effects of the FOSS, FADE and MAAC filters. The applied divergences normally
cause a loss of effect of the sand filters. This section describes how the divergences
were applied.
5.3.2.1 pH
Two test rounds of extreme pH were conducted. The first round had a low pH of
5.6 and the second had a high pH of 8.9.
Hydrochloric acid, HCl, was used to lower the pH. The buffer capacity of the
wastewater was measured in the laboratory and the amount of acid needed to lower
the pH of the wastewater to the required level was calculated. 600 l of wastewater
was put into the tank and the pH was adjusted to the desired level.
The same procedure was done with the added base. Sodium hydroxide, NaOH,
was added to increase pH.
21
5.3.2.2 Graphite
6.5 g of graphite was added to get a concentration of approximately 10 mg/l
graphite in the 600 l tank. To blend it properly with the water, the AWT unit was
set at 50 Hz, without aeration.
5.3.2.3 Suspended Matters
Water was filled into the 600 l tank and the concentration of suspended matters in
the water was measured at the laboratory. During the earlier parallel and stress
experiments the concentration of suspended matters in the untreated water had
been analyzed. Data shows that an amount of about 60 mg/l suspended matters
seems to be the average concentration of suspended matters in the incoming
wastewater. A concentration of three times the average concentration was chosen
to simulate a high load. To reach the right level of suspended matters in the
wastewater, dried and sifted sludge from the sludge boxes was added. 90 g of dried
and sifted sludge was added to the total volume. During the second round, an
amount of 85 g dried and sifted sludge was added to the total volume.
5.3.2.4 Emulsions
To make an estimation of a high load of emulsions the oil concentration was used.
The guidance value of the oil concentration for the treated water from the PWTP
was a monthly average of 5 mg/l. Twice the guidance value, 10 mg/l, was
estimated as a high load for the sand filters. The normal load of oil in the incoming
water during the experiments had an average concentration of 1.8 mg/l. To reach
10 mg/l a dose of 7 g was added under intensive stirring with the AWT unit. A
series of samples was taken from the sample tank before the water was pumped to
the filters, and another series from the water coming out from the filter.
5.3.2.5 Degreasing Agent
There is no previous analysis of the concentrations of degreasing agent in the
incoming process water so an estimation of an appropriate high load concentration
had to be made. As with the emulsion, the oil concentration was used to estimate a
high load. A dose of 7 g degreasing agent was added to the tank while stirring with
the AWT unit. A series of samples was taken from the sample tank before the
water was pumped through the filter. Another series of samples was taken from the
sample tank after the adding of degreasing agent. Finally, a third series was taken
from the water leaving the MAAC filter.
5.3.3 Degassing Process Water
A sample of 600 l degassing process water was taken from the buffert basin
upstream of the PWTP. The degassing process water contains metals, but no
organic compounds, which is why this was circulated through the MAAC filter
only. Different contact times were used to evaluate the purification; 1 min, 5 min,
10 min and 15 min.
22
5.4 Measurement Methods
Samples were taken using the same method for all trials. The first series of samples
were taken from the untreated water in the tank (1). The second series of samples
were taken from the tank after the divergence was added (1). The third series of
samples were taken from the water leaving the last filter (2). When the emulsion
and degreasing agents were used, a fourth sample was taken from the tube leading
from the pump into the first filter. Three different samples were taken to analyze
the concentration of oils, suspended matters and metals.
Figure 6: Sampling points. Point 1: Sampling point for untreated water and for
water with added divergence. Point 2: Sampling point for treated water.
At the laboratory the concentration of oils was analyzed using the standard method
ISO-9377-2, suspended matters were analyzed using the standard method
SS-EN-872 and metals were acid digested and analyzed using Inductively Coupled
Plasma (ICP) analysis. For measurements of temperature, conductivity, pH and
dissolved oxygen (DO) an Orion5star Thermo Scientific meter and probes were
used.
5.5 Calculations
The calculation of the contact time of the cork and the reject water was based on
the contact time of the sand filters. The contact time of the sand filters was
calculated from the volume of sand in the sand filters, the number of filters that
was in use and the flow of the incoming water. The flow of the experimental
system was measured manually.
5.6 Historical data
The efficiency of the sand filters has been measured by Ovako for a long time. The
data used in this report are from April, 2010 and onwards. Important to notice is
that the reduction is given in percent. The following equation was used:
23
In Figure 7 the reduction of copper is shown.
Figure 7: Reduction of Cu after sand filter
The values on the negative reduction axis show an increase of the metal in the
effluent water from the sand filters. This was due to an overload of the sand filters
which resulted in a penetration with increased levels of suspended matters, metals
and oils to the filtered water. To enable comparison of the sand filters with the cork
filters at normal operation, values from occasions with obvious disturbances in the
PWTP were removed and an average and a maximum value were used for
comparison. The points removed were 2010-05-04, 2010-07-13, 2010-08-24,
2010-11-30, 2011-04-12 and 2011-06-28. Figures of the reduction of Al, Zn, Cr
and Fe after the sand filters are shown in Appendix A, Figure A1 – A4.
The calculated maximum and the average for the reduction of metals after sand
filters are presented in Table 1.
Table 1: Calculated reduction maximum and mean values after sand filter.
Reduction in (%).
Cu Al Zn Cr Fe
Max 97.9 99.1 93.5 99.4 99.96
Average 85.4 85.7 67.2 89.2 91.5
-80
-60
-40
-20
0
20
40
60
80
100
2010-01-22 2010-08-10 2011-02-26 2011-09-14
Red
uct
ion (
%)
Time
24
6 Results
After the first two parallel experiments, it was decided to quit using the certified
laboratory for the metal analyses that Ovako could do in their own laboratory.
Samples for analyses of Antimonum (Sb) and of the concentration of oils were still
sent to the certified laboratory. The analyses received from the certified laboratory
had a higher reporting limit than the analyses received from the laboratory at
Ovako. Also, the certified laboratory was slow at delivering the results from the
analyses. For a summary, see Table 2.
Table 2: The table shows where each series of samples were analyzed. The
external laboratory used for analyses of oil content was changed after the first six
experiments. After the first two experiments, the concentration of metals was only
analyzed at Ovako. After the ninth experiment Sb was not analyzed anymore
because of its low content. After the sixth experiment the concentration of
suspended matters was only analyzed at Ovako.
Ext.
Lab.1
Oil
Ext.
Lab.2
Oil
Ext.
Lab.1
Metals
Ext.
Lab.
1 Sb
Ext.
Lab.1
Susp
Ovako
Metals
Ovako
Susp
30 min x
x x x x x
15 min x
x x x x x
15 min H x
x x x x
7.5 min June x
x x x x
7.5 min September x
x x x x
pH 5.6 x
x x x x
pH 8.9
x
x
x x
Suspended matters, 10 mg/l x
x
x x
Suspended matters, 15 mg/l x
x
x x
Emulsions, 10 mg/l x
x x
Emulsions, 15 mg/l x
x x
Degreasing agent, 10 mg/l x
x x
Degreasing agent, 15 mg/l x
x x
Graphite, 10 mg/l x x x
The data shown in the following sections are results from metal analyses that are
made in an ICP at Ovako. After the stress experiments with suspended matters,
results of the Sb levels arrived from the certified laboratory. Almost all data were
under reporting limit. After that, no more samples were analyzed for Sb.
Samples for oil concentration analyses were sent to another certified laboratory
(Eurofins) after the stress experiment with low pH. The reason to this was the long
responding time at the first certified laboratory.
Duplicates of all samples were taken during the experiment with 30 minutes
contact time. The analyses of the metal content in the duplicates were made by the
25
Ovako laboratory and showed almost identical results. To lessen the cost of the
pilot study, the burden on the laboratory and the environmental impact only single
samples were used for the following experiments.
Tables or figures of the concentrations and the reduction are presented for all
experiment results. The reduction is calculated according to the procedure in
section 5.6. The results focus on the reduction of Al, Zn, Cu, Cr, Fe, Pb, P, Mn,
Mo, Ni, suspended matters and oil concentration.
Data of the concentrations of suspended matters and oils are compared to their
guidance values.
6.1 Parallel experiments
Parallel experiments were conducted to compare the efficiency of the cork filters
to the efficiency of the sand filters.
The radar diagram has an axis for every substance type. Note that, all radar
diagrams use the logarithmic scale to enable visualization of all results in the same
diagram. The concentration of each substance in the sample is plotted in the graph.
All plotted concentrations are bound together by a line.
Values that are labeled “0 min” represent samples of the untreated water, which
has not yet reached the sand filters or the cork filters. Values that are labeled “30
min” represent samples of water treated with 30 minutes contact time in the cork
filters. Values that are labeled “15 min” represent samples of water treated with 15
minutes contact time in the cork filters. Values that are labeled “7.5 min” represent
samples of water treated with 7.5 minutes contact time in the cork filters. Values
that are labeled “Sand filter” represent samples of the water treated in the sand
filters.

26
6.1.1 30 Minutes Contact Time
The first contact time to be tested was 30 minutes. Duplicates of all samples were
taken. The duplicate samples “0 min” were by mistake taken with a two hour
separation. It was obvious that some of the suspended matters had settled during
the time passed.
The concentration of oils in all samples, both before and after the treatment, was
below reporting limit, 0.1 mg/l. One of the samples for measuring suspended
matters after the sand filter was reported below the reporting limit, 2.0 mg/l.
Figure 8 shows the concentrations at 30 minutes contact time.
Figure 8: 30 minutes contact time. The table show both untreated and treated
water before and after the sand and cork filters. Concentrations in mg/l
To calculate the reduction of suspended matters from the two duplicate samples,
an average of the reported value and the reporting limit was used. The following is
shown in Table 3:
0,001
0,01
0,1
1
10
100
Al
Zn
Cu
CrFe
Susp
Oil
0 min
0 min
30 min
30 min
Sand filter
Sand filter
Guidance value

27
Except for Zn, the sand filters remove more of the substances.
The reduction of Cr and Fe is 3-5 percentages lower in the cork filters than
in the sand filters.
The reduction of Al and Cu is 10 percentages lower in the cork filters than
in the sand filters.
The reduction of suspended matters is 20 percentages lower in the cork
filters than in the sand filters.
Table 3: 30 minutes contact time. Reduction after cork and sand filters in percent.
Al Zn Cu Cr Fe Susp Oil
Cork filter (%) 78.3 81.7 85.3 95.5 94.6 76.5 -
Sand filter (%) 90.8 51.7 96.8 98.5 99.0 95.8 -
In Figure 9, the reduction of Mo, Ni, Mn, Pb and P are shown.
The reduction of Mo is 3 percentages lower in the cork filters than in the
sand filters.
The reduction of Ni is 6 percentages higher in the cork filters than in the
sand filters.
The reduction of Pb is 15 percentages lower in the cork filters than in the
sand filters.
The reduction of Mn is 25 percentages higher in the cork filters than in the
sand filters.
Figure 9: Reduction of Mo, Ni, Mn, Pb and P at 30 minutes contact time.
Reduction in percent.
43.3
85.0
48.4
97.8
40.0
91.9
76.6 82.2
0
10
20
30
40
50
60
70
80
90
100
Mo Ni Mn Pb
Red
uct
ion (
%)
Substance
Sand filter
Cork filter
28
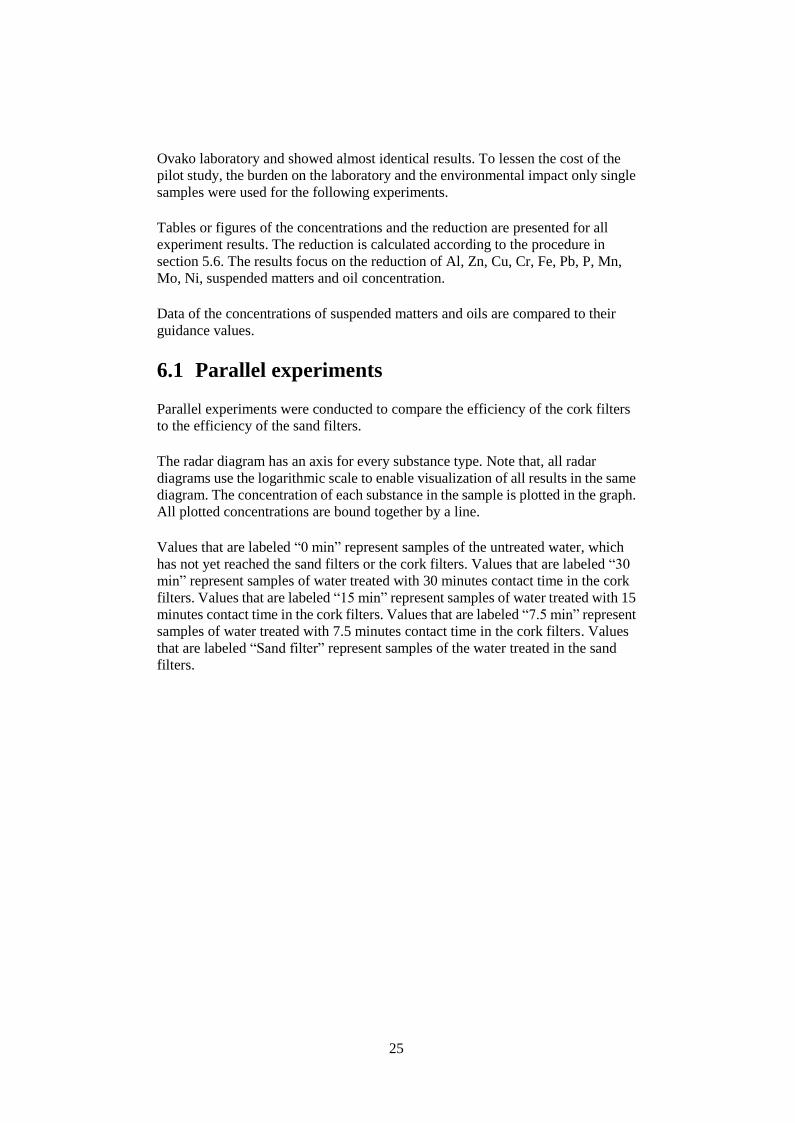
6.1.2 15 minutes contact time, normal flow
The parallel experiment with 15 minutes contact time was conducted in two
batches. The first batch was run with a normal flow of 7 l/min. The results are
shown in Figure 10. Note that the contact time of the sand filters could not be
changed and is still 30 minutes.
Figure 10: 15 minutes contact time, normal flow. The table show both untreated
and treated water before and after the sand and cork filters. Concentrations in
mg/l
The reduction of the concentration of oils in the filters, for both samples in Table 4,
is calculated using the reporting limit of 0.1 mg/l. The reduction of suspended
matters after the sand filters is calculated using the reporting limit of 2.0 mg/l.
The reduction of Zn is 50 percentages higher in the cork filters than in the
sand filters.
The reduction of oil is identical in the cork and the sand filters because the
calculation uses the reporting limit.
The reduction of Cu is 20 percentages lower in the cork filters than in the
sand filters.
0,001
0,01
0,1
1
10
100
1000
Al
Zn
Cu
CrFe
Susp
Oil0 min
15 min
Sand filter
Sand filter
Guidance value
29
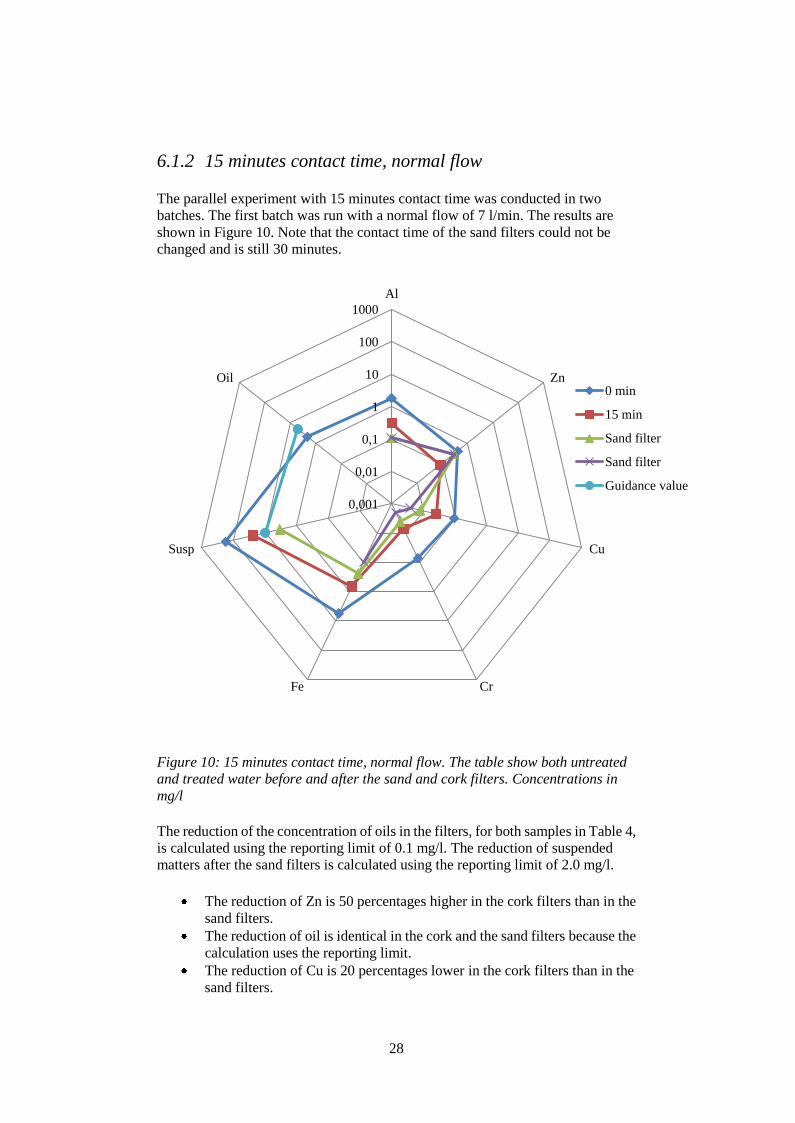
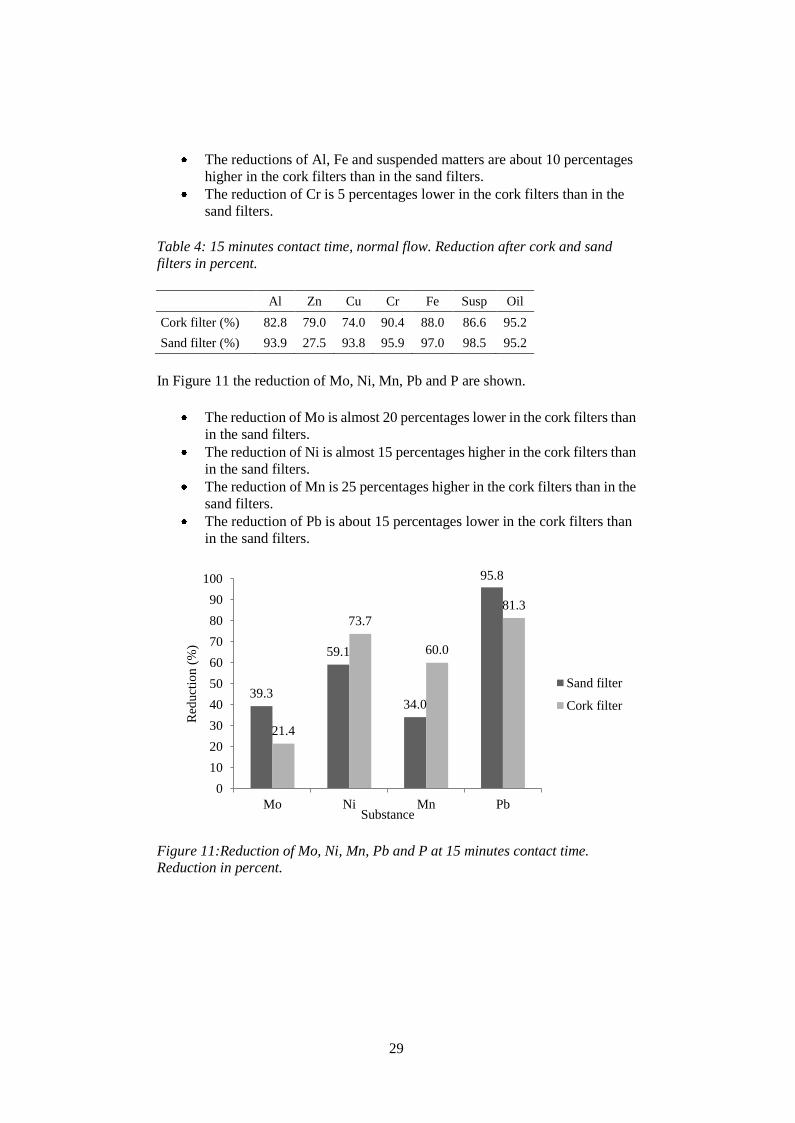
The reductions of Al, Fe and suspended matters are about 10 percentages
higher in the cork filters than in the sand filters.
The reduction of Cr is 5 percentages lower in the cork filters than in the
sand filters.
Table 4: 15 minutes contact time, normal flow. Reduction after cork and sand
filters in percent.
Al Zn Cu Cr Fe Susp Oil
Cork filter (%) 82.8 79.0 74.0 90.4 88.0 86.6 95.2
Sand filter (%) 93.9 27.5 93.8 95.9 97.0 98.5 95.2
In Figure 11 the reduction of Mo, Ni, Mn, Pb and P are shown.
The reduction of Mo is almost 20 percentages lower in the cork filters than
in the sand filters.
The reduction of Ni is almost 15 percentages higher in the cork filters than
in the sand filters.
The reduction of Mn is 25 percentages higher in the cork filters than in the
sand filters.
The reduction of Pb is about 15 percentages lower in the cork filters than
in the sand filters.
Figure 11:Reduction of Mo, Ni, Mn, Pb and P at 15 minutes contact time.
Reduction in percent.
39.3
59.1
34.0
95.8
21.4
73.7
60.0
81.3
0
10
20
30
40
50
60
70
80
90
100
Mo Ni Mn Pb
Red
uct
ion (
%)
Substance
Sand filter
Cork filter
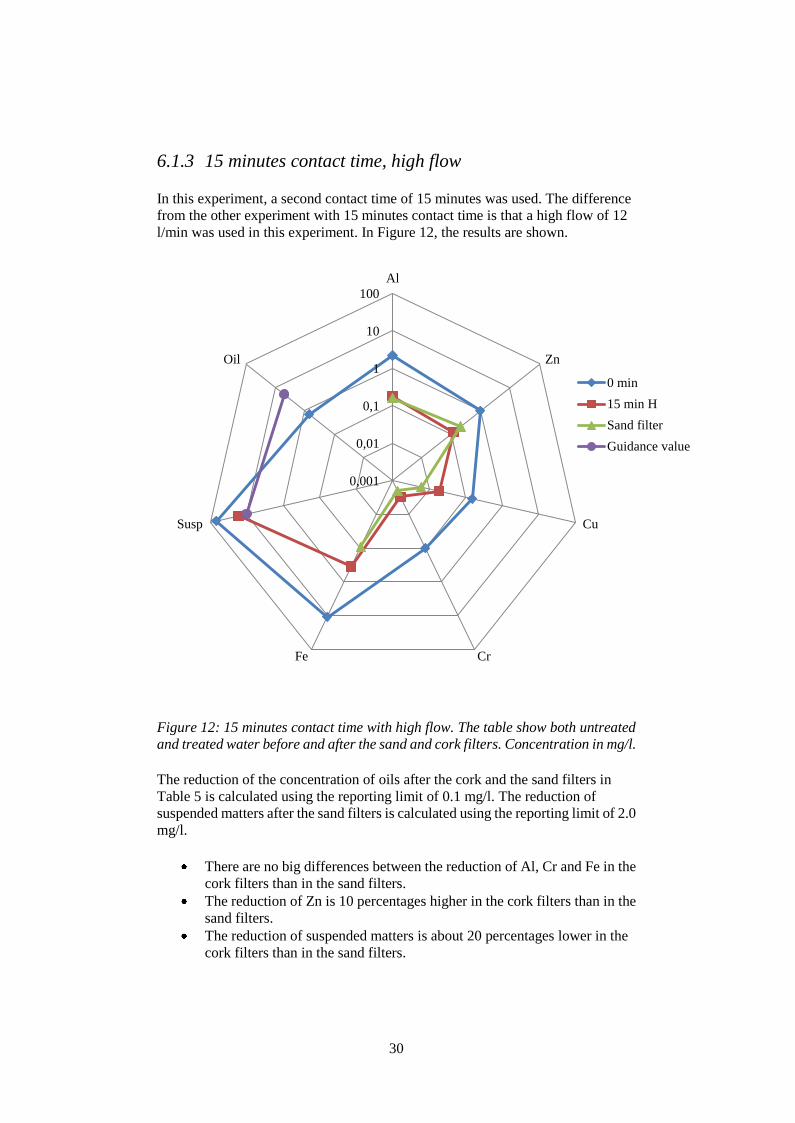
30
6.1.3 15 minutes contact time, high flow
In this experiment, a second contact time of 15 minutes was used. The difference
from the other experiment with 15 minutes contact time is that a high flow of 12
l/min was used in this experiment. In Figure 12, the results are shown.
Figure 12: 15 minutes contact time with high flow. The table show both untreated
and treated water before and after the sand and cork filters. Concentration in mg/l.
The reduction of the concentration of oils after the cork and the sand filters in
Table 5 is calculated using the reporting limit of 0.1 mg/l. The reduction of
suspended matters after the sand filters is calculated using the reporting limit of 2.0
mg/l.
There are no big differences between the reduction of Al, Cr and Fe in the
cork filters than in the sand filters.
The reduction of Zn is 10 percentages higher in the cork filters than in the
sand filters.
The reduction of suspended matters is about 20 percentages lower in the
cork filters than in the sand filters.
0,001
0,01
0,1
1
10
100
Al
Zn
Cu
CrFe
Susp
Oil
0 min
15 min H
Sand filter
Guidance value

31
Table 5: 15 minutes contact time with high flow. Reduction after cork and sand
filters in percent.
Al Zn Cu Cr Fe Susp Oil
Cork filter (%) 91.8 88.0 87.3 97.0 96.8 75.8 85.7
Sand filter (%) 92.7 79.0 96.0 98.0 99.2 97.1 85.7
In Figure 13, the reduction of Mo, Ni, Mn, Pb and P are shown.
The reduction of Mo is about 5 percentages higher in the cork filters than
in the sand filters.
The reduction of Ni is about 10 percentages lower in the cork filters than in
the sand filters
The reduction of Mn is about 10 percentages higher in the cork filters than
in the sand filters.
Figure 13: Reduction of Mo, Ni, Mn, Pb and P at 15 minutes contact time and high
flow. Reduction in percent.
17.1
78.5
52.9
97.4
22.9
67.7 69.4
91.6
0
10
20
30
40
50
60
70
80
90
100
Mo Ni Mn Pb
Red
uct
ion (
%)
Substance
Sand filter
Cork filter
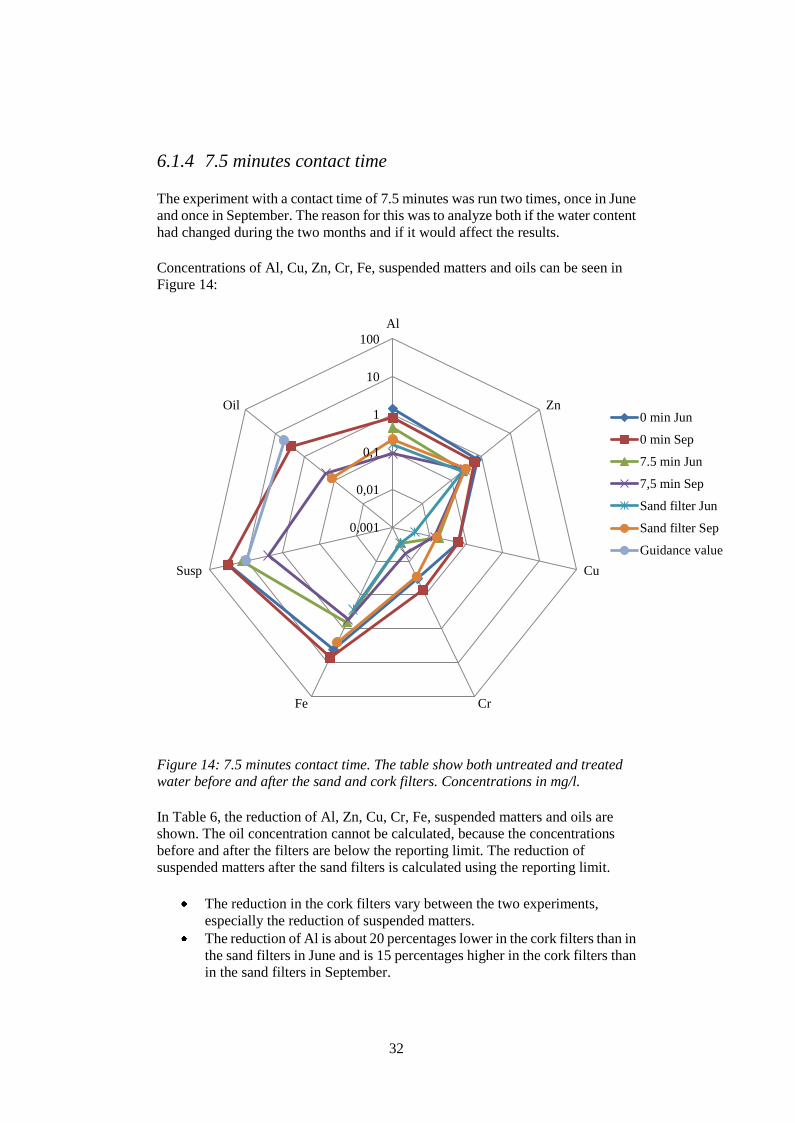
32
6.1.4 7.5 minutes contact time
The experiment with a contact time of 7.5 minutes was run two times, once in June
and once in September. The reason for this was to analyze both if the water content
had changed during the two months and if it would affect the results.
Concentrations of Al, Cu, Zn, Cr, Fe, suspended matters and oils can be seen in
Figure 14:
Figure 14: 7.5 minutes contact time. The table show both untreated and treated
water before and after the sand and cork filters. Concentrations in mg/l.
In Table 6, the reduction of Al, Zn, Cu, Cr, Fe, suspended matters and oils are
shown. The oil concentration cannot be calculated, because the concentrations
before and after the filters are below the reporting limit. The reduction of
suspended matters after the sand filters is calculated using the reporting limit.
The reduction in the cork filters vary between the two experiments,
especially the reduction of suspended matters.
The reduction of Al is about 20 percentages lower in the cork filters than in
the sand filters in June and is 15 percentages higher in the cork filters than
in the sand filters in September.
0,001
0,01
0,1
1
10
100
Al
Zn
Cu
CrFe
Susp
Oil0 min Jun
0 min Sep
7.5 min Jun
7,5 min Sep
Sand filter Jun
Sand filter Sep
Guidance value
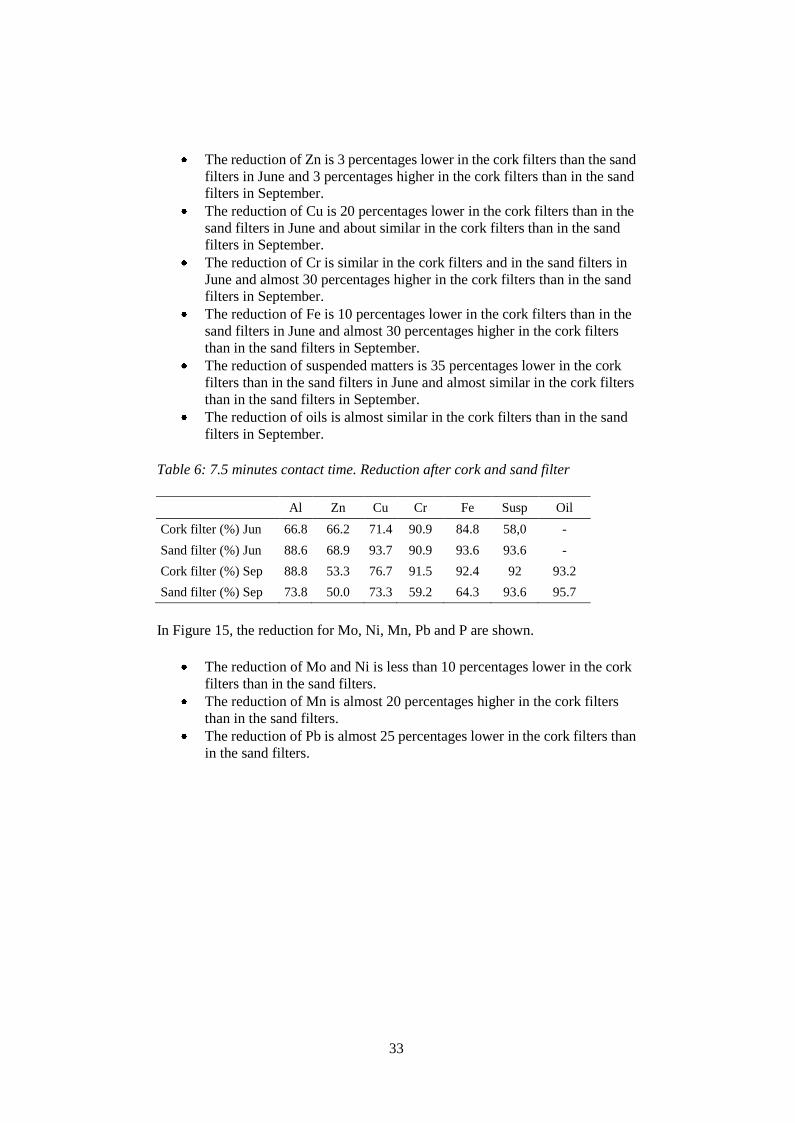
33
The reduction of Zn is 3 percentages lower in the cork filters than the sand
filters in June and 3 percentages higher in the cork filters than in the sand
filters in September.
The reduction of Cu is 20 percentages lower in the cork filters than in the
sand filters in June and about similar in the cork filters than in the sand
filters in September.
The reduction of Cr is similar in the cork filters and in the sand filters in
June and almost 30 percentages higher in the cork filters than in the sand
filters in September.
The reduction of Fe is 10 percentages lower in the cork filters than in the
sand filters in June and almost 30 percentages higher in the cork filters
than in the sand filters in September.
The reduction of suspended matters is 35 percentages lower in the cork
filters than in the sand filters in June and almost similar in the cork filters
than in the sand filters in September.
The reduction of oils is almost similar in the cork filters than in the sand
filters in September.
Table 6: 7.5 minutes contact time. Reduction after cork and sand filter
Al Zn Cu Cr Fe Susp Oil
Cork filter (%) Jun 66.8 66.2 71.4 90.9 84.8 58,0 -
Sand filter (%) Jun 88.6 68.9 93.7 90.9 93.6 93.6 -
Cork filter (%) Sep 88.8 53.3 76.7 91.5 92.4 92 93.2
Sand filter (%) Sep 73.8 50.0 73.3 59.2 64.3 93.6 95.7
In Figure 15, the reduction for Mo, Ni, Mn, Pb and P are shown.
The reduction of Mo and Ni is less than 10 percentages lower in the cork
filters than in the sand filters.
The reduction of Mn is almost 20 percentages higher in the cork filters
than in the sand filters.
The reduction of Pb is almost 25 percentages lower in the cork filters than
in the sand filters.
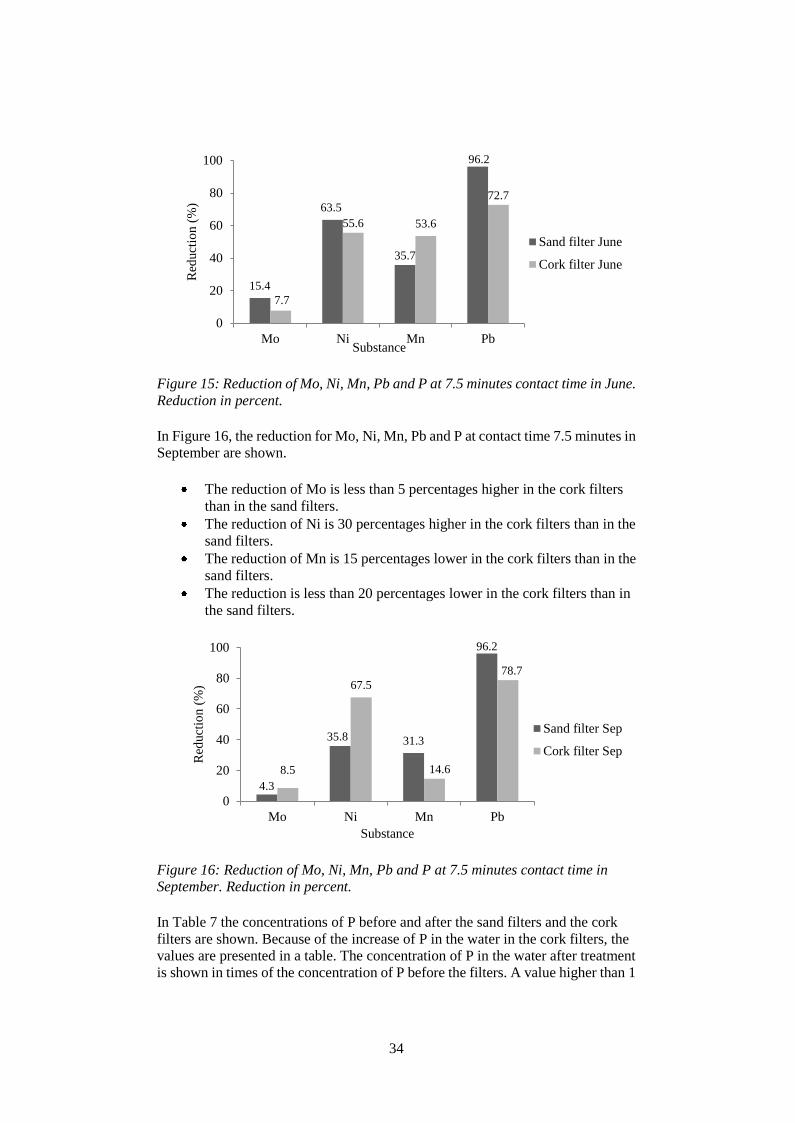
34
Figure 15: Reduction of Mo, Ni, Mn, Pb and P at 7.5 minutes contact time in June.
Reduction in percent.
In Figure 16, the reduction for Mo, Ni, Mn, Pb and P at contact time 7.5 minutes in
September are shown.
The reduction of Mo is less than 5 percentages higher in the cork filters
than in the sand filters.
The reduction of Ni is 30 percentages higher in the cork filters than in the
sand filters.
The reduction of Mn is 15 percentages lower in the cork filters than in the
sand filters.
The reduction is less than 20 percentages lower in the cork filters than in
the sand filters.
Figure 16: Reduction of Mo, Ni, Mn, Pb and P at 7.5 minutes contact time in
September. Reduction in percent.
In Table 7 the concentrations of P before and after the sand filters and the cork
filters are shown. Because of the increase of P in the water in the cork filters, the
values are presented in a table. The concentration of P in the water after treatment
is shown in times of the concentration of P before the filters. A value higher than 1
15.4
63.5
35.7
96.2
7.7
55.6 53.6
72.7
0
20
40
60
80
100
Mo Ni Mn Pb
Red
uct
ion (
%)
Substance
Sand filter June
Cork filter June
4.3
35.8 31.3
96.2
8.5
67.5
14.6
78.7
0
20
40
60
80
100
Mo Ni Mn Pb
Red
uct
ion (
%)
Substance
Sand filter Sep
Cork filter Sep
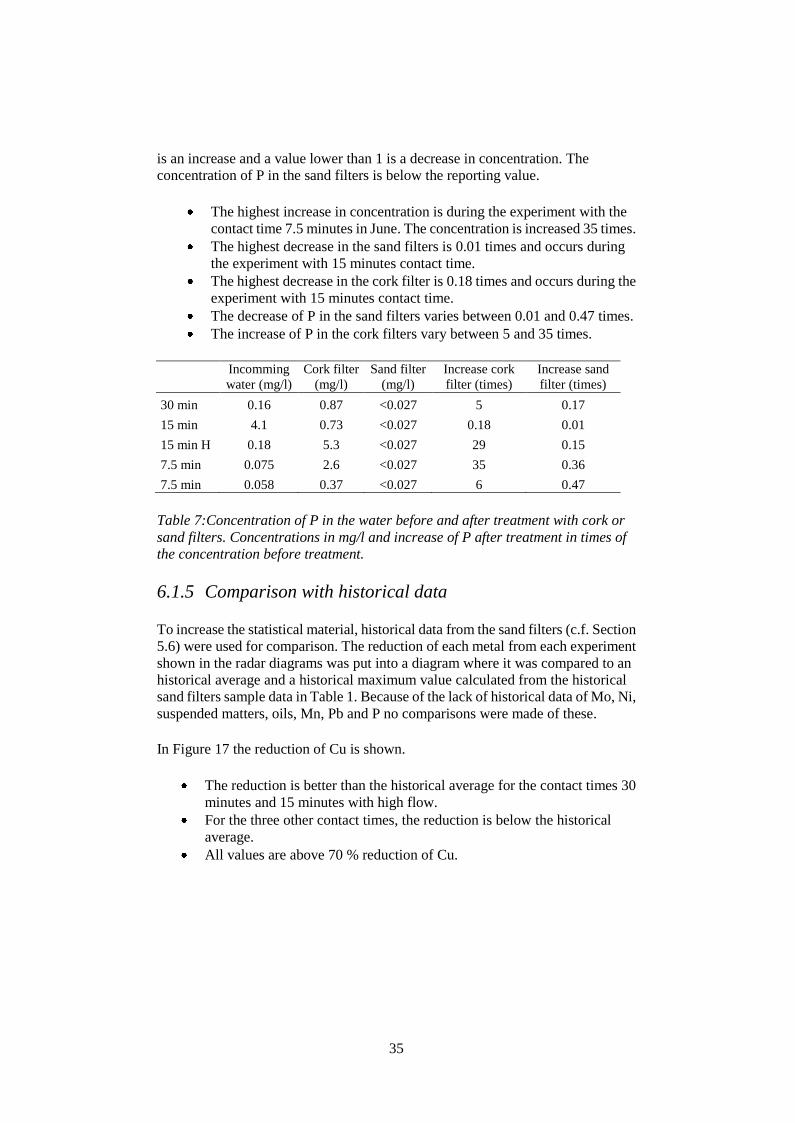
35
is an increase and a value lower than 1 is a decrease in concentration. The
concentration of P in the sand filters is below the reporting value.
The highest increase in concentration is during the experiment with the
contact time 7.5 minutes in June. The concentration is increased 35 times.
The highest decrease in the sand filters is 0.01 times and occurs during
the experiment with 15 minutes contact time.
The highest decrease in the cork filter is 0.18 times and occurs during the
experiment with 15 minutes contact time.
The decrease of P in the sand filters varies between 0.01 and 0.47 times.
The increase of P in the cork filters vary between 5 and 35 times.
Incomming
water (mg/l)
Cork filter
(mg/l)
Sand filter
(mg/l)
Increase cork
filter (times)
Increase sand
filter (times)
30 min 0.16 0.87 <0.027 5 0.17
15 min 4.1 0.73 <0.027 0.18 0.01
15 min H 0.18 5.3 <0.027 29 0.15
7.5 min 0.075 2.6 <0.027 35 0.36
7.5 min 0.058 0.37 <0.027 6 0.47
Table 7:Concentration of P in the water before and after treatment with cork or
sand filters. Concentrations in mg/l and increase of P after treatment in times of
the concentration before treatment.
6.1.5 Comparison with historical data
To increase the statistical material, historical data from the sand filters (c.f. Section
5.6) were used for comparison. The reduction of each metal from each experiment
shown in the radar diagrams was put into a diagram where it was compared to an
historical average and a historical maximum value calculated from the historical
sand filters sample data in Table 1. Because of the lack of historical data of Mo, Ni,
suspended matters, oils, Mn, Pb and P no comparisons were made of these.
In Figure 17 the reduction of Cu is shown.
The reduction is better than the historical average for the contact times 30
minutes and 15 minutes with high flow.
For the three other contact times, the reduction is below the historical
average.
All values are above 70 % reduction of Cu.

36
Figure 17: Reduction of Cu in cork filters, in percent, compared to historical data
from the sand filters.
The reduction of Al is shown in Figure 18.
At contact times 15 minutes with high flows and 7.5 minutes in
September, the reduction is better than the historical average.
The reduction is at its lowest at 68 % for 7.5 minutes contact time in June.
The reduction is above 78% at 30 minutes and 15 minutes contact time.
Figure 18: Reduction of Al in cork filters, in percent, compared to historical data
from the sand filters.
The reduction of Zn is shown in Figure 19.
The reduction is better than the historical average at 30 minutes contact
time and at both the 15 minutes contact times.
At 7.5 minutes contact time in June, the reduction is similar.
At 7.5 minutes contact time in September the reduction is below the
historical average.
60
70
80
90
100
30 min 15 min 15 min H 7.5 min Jun 7.5 min Sep
Red
uct
ion (
%)
Cu
Maximum
Average
60
70
80
90
100
30 min 15 min 15 min H 7.5 min Jun 7.5 min Sep
Red
uct
ion (
%)
Al
Maximum
Average
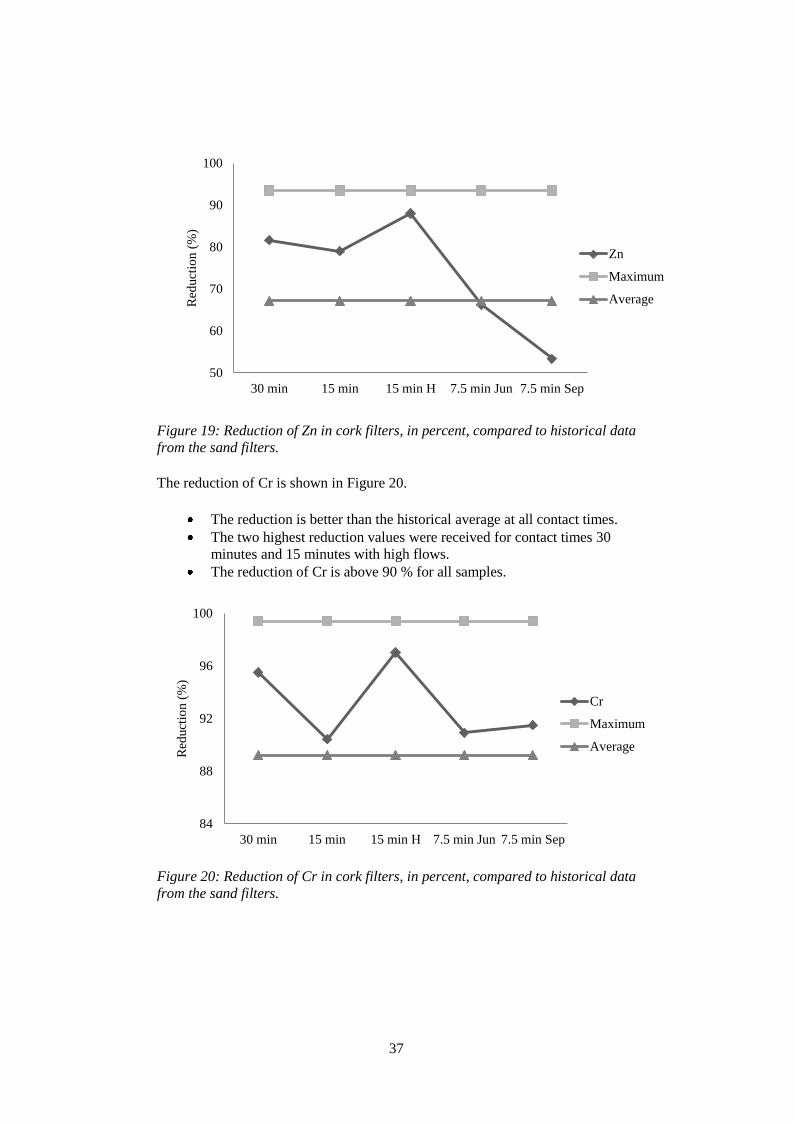
37
Figure 19: Reduction of Zn in cork filters, in percent, compared to historical data
from the sand filters.
The reduction of Cr is shown in Figure 20.
The reduction is better than the historical average at all contact times.
The two highest reduction values were received for contact times 30
minutes and 15 minutes with high flows.
The reduction of Cr is above 90 % for all samples.
Figure 20: Reduction of Cr in cork filters, in percent, compared to historical data
from the sand filters.
50
60
70
80
90
100
30 min 15 min 15 min H 7.5 min Jun 7.5 min Sep
Red
uct
ion (
%)
Zn
Maximum
Average
84
88
92
96
100
30 min 15 min 15 min H 7.5 min Jun 7.5 min Sep
Red
uct
ion (
%)
Cr
Maximum
Average

38
In Figure 21 the reduction of Fe is shown.
30 minutes, 15 minutes with high flow and 7.5 minutes contact time in
September are better than the historical average, while the two other are
below the historical average.
The reduction of Fe is above 84 % for all contact times.
Figure 21: Reduction of Fe, in percent, compared to historical data from the sand
filters.
To summarize, when the sand filters are functioning at their best, the cork filters do
not match their results. For Zn, Cr and Fe the reduction is more often better than
the average reduction of sand filters than it was below. The reduction of Al and Cu
after the cork filter is more often below the average reduction after the sand filters
than it is better than the reduction in the sand filters.
6.2 Stress Experiments
The stress experiments with pH and suspended matters were made before the
service stop. The stress experiments with emulsions, degreasing agents and
graphite were made after the service stop. The service stop was from July 11 to
August 7.
The results of the stress experiments are compared to the normal operational data
of 15 minutes contact time for cork filters from the parallel experiments. For the 15
minutes operational data the oil concentration was below reporting limit, 0.1 mg/l.
To calculate the reduction in the cases the concentration is below reporting limit,
the reporting limit is used. The oil sample from before the addition of the base in
the experiment with a pH of 8.9 has been lost.
The bargraphs show the reduction for some substances. The exact reduction is put
on top of each bar. To make the results more clear, the y-axis is shortened in some
80
85
90
95
100
30 min 15 min 15 min H 7.5 min Jun 7.5 min Sep
Red
uct
ion (
%)
Fe
Maximum
Average
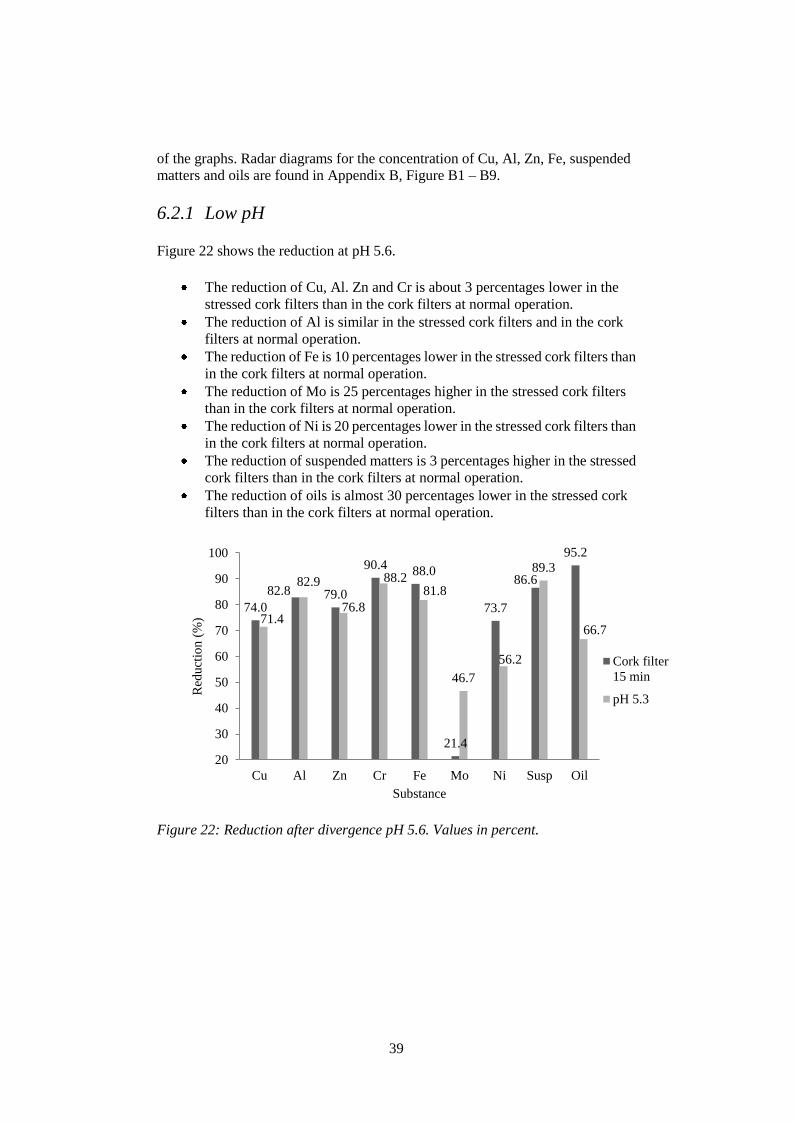
39
of the graphs. Radar diagrams for the concentration of Cu, Al, Zn, Fe, suspended
matters and oils are found in Appendix B, Figure B1 – B9.
6.2.1 Low pH
Figure 22 shows the reduction at pH 5.6.
The reduction of Cu, Al. Zn and Cr is about 3 percentages lower in the
stressed cork filters than in the cork filters at normal operation.
The reduction of Al is similar in the stressed cork filters and in the cork
filters at normal operation.
The reduction of Fe is 10 percentages lower in the stressed cork filters than
in the cork filters at normal operation.
The reduction of Mo is 25 percentages higher in the stressed cork filters
than in the cork filters at normal operation.
The reduction of Ni is 20 percentages lower in the stressed cork filters than
in the cork filters at normal operation.
The reduction of suspended matters is 3 percentages higher in the stressed
cork filters than in the cork filters at normal operation.
The reduction of oils is almost 30 percentages lower in the stressed cork
filters than in the cork filters at normal operation.
Figure 22: Reduction after divergence pH 5.6. Values in percent.
74.0
82.8 79.0
90.4 88.0
21.4
73.7
86.6
95.2
71.4
82.9
76.8
88.2 81.8
46.7
56.2
89.3
66.7
20
30
40
50
60
70
80
90
100
Cu Al Zn Cr Fe Mo Ni Susp Oil
Red
uct
ion (
%)
Substance
Cork filter
15 min
pH 5.3
40
6.2.2 High pH
Figure 23 shows the reduction at pH 8.9.
The reductions in percentages of Cu, Cr and Fe are almost similar in the
stressed cork filters and in the cork filters at normal operation.
The reduction of Al, Zn and suspended matters at pH 8.9 are 3-6
percentages higher in the stressed cork filters than in the cork filters at
normal operation.
The reduction of Mo is 5 percentages lower in the stressed cork filters than
in the cork filters at normal operation.
The reduction of Ni is 7 percentages higher in the stressed cork filters than
in the cork filters at normal operation.
Nothing can be said of the oil concentration because the sample for 0
minutes untreated water was lost.
Figure 23:Reduction after divergence pH 8.9. Values in percent.
74.0
82.8 79.0
90.4 88.0
21.4
73.7
86.6
95.2
75.8
86.7 85.0 89.6 90.9
16.3
80.0
90.5
10
20
30
40
50
60
70
80
90
100
Cu Al Zn Cr Fe Mo Ni Susp Oil
Red
uct
ion (
%)
Substance
Cork filter
15 min
pH 8.7

41
6.2.3 Graphite
In the stress experiment with graphite the concentration after the adding of 6 g
graphite was about 10 mg/l of the substance. Figure 24 shows the reduction of
metals, oils and suspended matters after treatment in the cork filters compared to
the reduction in the sand filters.
The reduction of Cu, Al, Fe and suspended matters are 4-7 percentages
higher in the stressed cork filters than in the cork filters at normal
operation.
The reduction of Zn is 30 percentages lower in the stressed cork filters
than in the cork filters at normal operation.
The reduction of Cr is 3 percentages lower in the stressed cork filters than
in the cork filters at normal operation.
The reduction of Mo is 15 percentages lower in the stressed cork filters
than in the cork filters at normal operation.
The reduction of Ni is 10 percentages lower in the stressed cork filters than
in the cork filters at normal operation.
Figure 24: Reduction after divergence graphite 10mg/l. Values in percent.
6.2.4 Suspended Matters
In Figure 25 the reductions of metals, oil and suspended matters are shown.
The reduction of oils is 20 percentages lower in the stressed cork filters
than in the cork filters at normal operation.
The reduction of Mo is about 10 percentages higher in the stressed cork
filters than in the cork filters at normal operation.
The reduction of Ni is about 10 percentages higher in the stressed cork
filters than in the cork filters at normal operation.
The reduction of Cu is 7 percentages lower in the stressed cork filters than
in the cork filters at normal operation.
74.0
82.8 79.0
90.4 88.0
21.4
73.7
86.6
95.2
81.1
88.0
48.0
87.5
92.5
6.7
64.3
91.2 93.1
0
10
20
30
40
50
60
70
80
90
100
Cu Al Zn Cr Fe Mo Ni Susp Oil
Red
uct
ion (
%)
Substance
Cork filter
15 min
Graphite

42
Otherwise, the reduction results vary between less than one percentage
and up to 4 percentages in the stressed cork filters than in the cork filters at
normal operation.
Figure 25: Reduction after divergence 10 mg/l suspended matters. Values in
percent.
In Figure 26 the reduction, after increasing the concentration of suspended matters
to 15 mg/l, is shown.
The reduction of Al is about 20 percentages lower in the stressed cork
filters than in the cork filters at normal operation.
The reduction of Zn, Cr and oils is about 5 percentages lower in the
stressed cork filters than in the cork filters at normal operation.
The reduction of Ni is about 7 percentages higher in the stressed cork
filters than in the cork filters at normal operation.
The reduction of Mo is about 10 percentages higher in the stressed cork
filters than in the cork filters at normal operation.
The reduction of suspended matters is about 5 percentages lower in the
stressed cork filters than in the cork filters at normal operation.
The reduction in percentages of Cu and Fe is almost similar in the stressed
cork filters than in the cork filters at normal operation.
74.0
82.8 79.0
90.4 88.0
21.4
73.7
86.6
95.2
67.8
78.8
82.5 88.2 87.3
29.4
83.5 84.2
72.1
20
30
40
50
60
70
80
90
100
Cu Al Zn Cr Fe Mo Ni Susp Oil
Red
uct
ion (
%)
Substance
Cork filter
15 min
Suspended
matters
43
Figure 26: Reduction after divergence 15 mg/l suspended matters. Values in
percent.
6.2.5 Emulsions
In Figure 27, the reduction of the concentrations of metals, oils and suspended
matters in both the sand filters and the cork filters are shown.
The reduction of Cu is 7 percentages higher in the stressed cork filters than
in the cork filters at normal operation.
The reduction of suspended matters and Al is 5 and 8 percentages lower in
the stressed cork filters than in the cork filters at normal operation.
Zn and Cr have 3 percentages higher reduction in the stressed cork filters
than in the cork filters at normal operation.
The reduction of Fe is almost similar in the stressed cork filters and in the
cork filters at normal operation.
The reduction of Mo is about 8 percentages higher in the stressed cork
filters than in the cork filters at normal operation.
The reduction of oils is 15 percentages lower in r the stressed cork filters
than in the cork filters at normal operation.
74.0
82.8 79.0
90.4 88.0
21.4
73.7
86.6
95.2
71.3 65.7
72.5
85.0 85.2
33.3
81.2
74.9
89.1
20
30
40
50
60
70
80
90
100
Cu Al Zn Cr Fe Mo Ni Susp Oil
Red
uct
ion (
%)
Substance
Cork filter
15 min
Suspended
matters
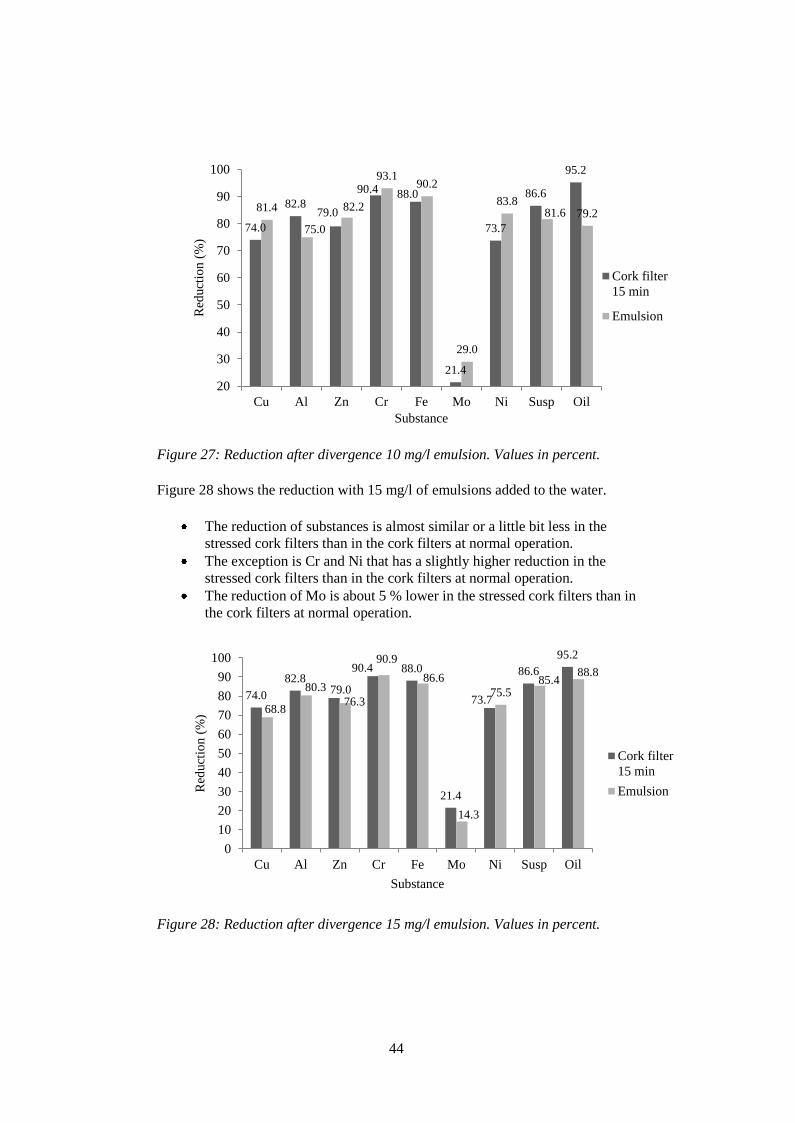
44
Figure 27: Reduction after divergence 10 mg/l emulsion. Values in percent.
Figure 28 shows the reduction with 15 mg/l of emulsions added to the water.
The reduction of substances is almost similar or a little bit less in the
stressed cork filters than in the cork filters at normal operation.
The exception is Cr and Ni that has a slightly higher reduction in the
stressed cork filters than in the cork filters at normal operation.
The reduction of Mo is about 5 % lower in the stressed cork filters than in
the cork filters at normal operation.
Figure 28: Reduction after divergence 15 mg/l emulsion. Values in percent.
74.0
82.8 79.0
90.4 88.0
21.4
73.7
86.6
95.2
81.4
75.0
82.2
93.1 90.2
29.0
83.8 81.6 79.2
20
30
40
50
60
70
80
90
100
Cu Al Zn Cr Fe Mo Ni Susp Oil
Red
uct
ion (
%)
Substance
Cork filter
15 min
Emulsion
74.0
82.8 79.0
90.4 88.0
21.4
73.7
86.6
95.2
68.8
80.3
76.3
90.9
86.6
14.3
75.5 85.4
88.8
0
10
20
30
40
50
60
70
80
90
100
Cu Al Zn Cr Fe Mo Ni Susp Oil
Red
uct
ion (
%)
Substance
Cork filter
15 min
Emulsion
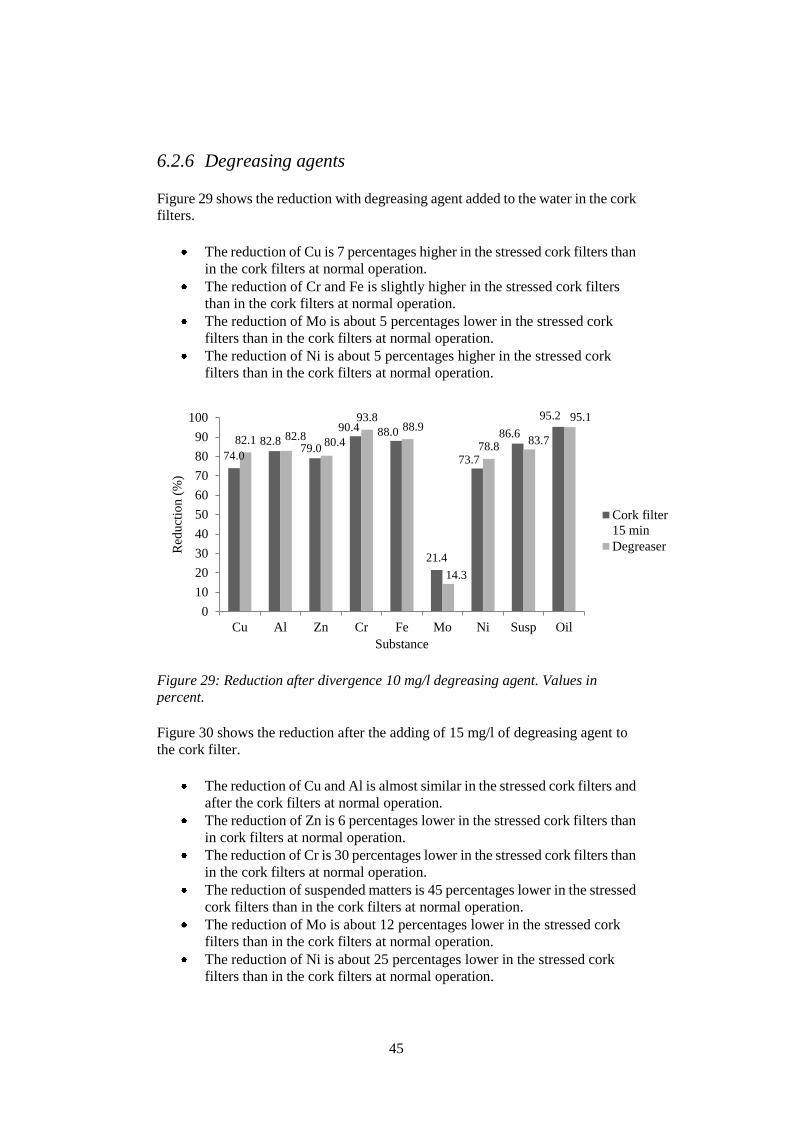
45
6.2.6 Degreasing agents
Figure 29 shows the reduction with degreasing agent added to the water in the cork
filters.
The reduction of Cu is 7 percentages higher in the stressed cork filters than
in the cork filters at normal operation.
The reduction of Cr and Fe is slightly higher in the stressed cork filters
than in the cork filters at normal operation.
The reduction of Mo is about 5 percentages lower in the stressed cork
filters than in the cork filters at normal operation.
The reduction of Ni is about 5 percentages higher in the stressed cork
filters than in the cork filters at normal operation.
Figure 29: Reduction after divergence 10 mg/l degreasing agent. Values in
percent.
Figure 30 shows the reduction after the adding of 15 mg/l of degreasing agent to
the cork filter.
The reduction of Cu and Al is almost similar in the stressed cork filters and
after the cork filters at normal operation.
The reduction of Zn is 6 percentages lower in the stressed cork filters than
in cork filters at normal operation.
The reduction of Cr is 30 percentages lower in the stressed cork filters than
in the cork filters at normal operation.
The reduction of suspended matters is 45 percentages lower in the stressed
cork filters than in the cork filters at normal operation.
The reduction of Mo is about 12 percentages lower in the stressed cork
filters than in the cork filters at normal operation.
The reduction of Ni is about 25 percentages lower in the stressed cork
filters than in the cork filters at normal operation.
74.0
82.8 79.0
90.4 88.0
21.4
73.7
86.6
95.2
82.1 82.8 80.4
93.8 88.9
14.3
78.8 83.7
95.1
0
10
20
30
40
50
60
70
80
90
100
Cu Al Zn Cr Fe Mo Ni Susp Oil
Red
uct
ion (
%)
Substance
Cork filter
15 min
Degreaser
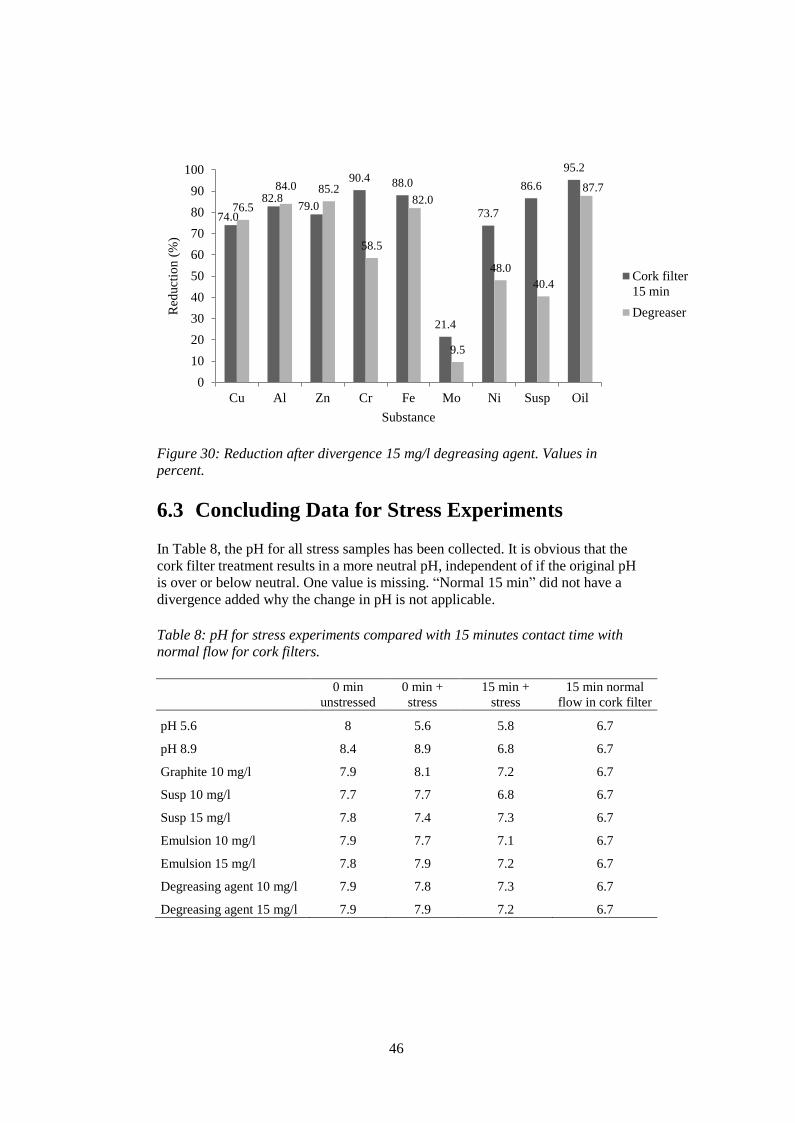
46
Figure 30: Reduction after divergence 15 mg/l degreasing agent. Values in
percent.
6.3 Concluding Data for Stress Experiments
In Table 8, the pH for all stress samples has been collected. It is obvious that the
cork filter treatment results in a more neutral pH, independent of if the original pH
is over or below neutral. One value is missing. “Normal 15 min” did not have a
divergence added why the change in pH is not applicable.
Table 8: pH for stress experiments compared with 15 minutes contact time with
normal flow for cork filters.
0 min
unstressed
0 min +
stress
15 min +
stress
15 min normal
flow in cork filter
pH 5.6 8 5.6 5.8 6.7
pH 8.9 8.4 8.9 6.8 6.7
Graphite 10 mg/l 7.9 8.1 7.2 6.7
Susp 10 mg/l 7.7 7.7 6.8 6.7
Susp 15 mg/l 7.8 7.4 7.3 6.7
Emulsion 10 mg/l 7.9 7.7 7.1 6.7
Emulsion 15 mg/l 7.8 7.9 7.2 6.7
Degreasing agent 10 mg/l 7.9 7.8 7.3 6.7
Degreasing agent 15 mg/l 7.9 7.9 7.2 6.7
74.0
82.8 79.0
90.4 88.0
21.4
73.7
86.6
95.2
76.5
84.0 85.2
58.5
82.0
9.5
48.0
40.4
87.7
0
10
20
30
40
50
60
70
80
90
100
Cu Al Zn Cr Fe Mo Ni Susp Oil
Red
uct
ion (
%)
Substance
Cork filter
15 min
Degreaser

47
In Table 9, the reduction of Mn and Pb in the cork filter is shown. The box marked
with grey has been calculated using the reporting limit for the water after the cork
treatment. The two values marked with a line were below the reporting limit both
before and after the cork treatment.
Table 9: Reductions of Mn and Pb after cork treatment. Values in percent.
Mn Pb
pH 5.6 46.8 85.9
pH 8.9 59.4 97.4
Graphite 10 mg/l 15.5 74.5
Suspended matters 10 mg/l 70.3 83.1
Suspended matters 15 mg/l 57.0 84.9
Emulsion 10 mg/l 56.3 71.4
Emulsion 15 mg/l 31.3 -
Degreaser 10 mg/l 44.2 -
Degreaser 15 mg/l 51.1 67.7
To calculate the increase in concentration of P, a multiple of the concentration
before the cork filter treatment was used. The values given are the times the
concentration of the untreated water has to be multiplied to reach the concentration
after the treatment.
As can be seen in Table 10, the concentration of P increases in all samples except
after the experiment with 10 mg/l of suspended matters added to the water. The
highest increases were for the experiments with low pH and with 15 mg/l of added
degreasing agent.
Table 10: Increase of P after cork filter. The values in the table are the multiple of
the concentration before each cork filter treatment to reach the concentration after
each cork filter treatment.
P
pH 5.6 13.3
pH 8.9 4.7
Graphite 10 mg/l 1.7
Suspended matters 10 mg/l 0.6
Suspended matters 15 mg/l 10.0
Emulsion 10 mg/l 5.8
Emulsion 15 mg/l 1.5
Degreaser 10 mg/l 9.6
Degreaser 15 mg/l 14.1
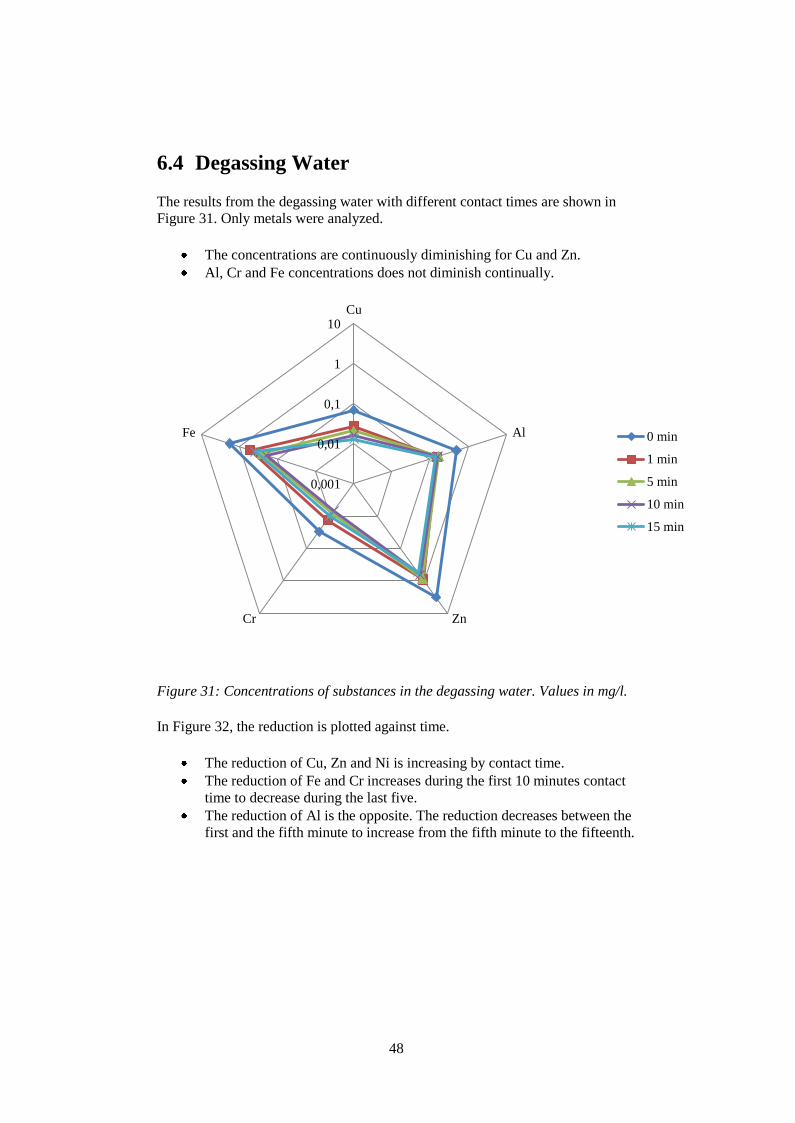
48
6.4 Degassing Water
The results from the degassing water with different contact times are shown in
Figure 31. Only metals were analyzed.
The concentrations are continuously diminishing for Cu and Zn.
Al, Cr and Fe concentrations does not diminish continually.
Figure 31: Concentrations of substances in the degassing water. Values in mg/l.
In Figure 32, the reduction is plotted against time.
The reduction of Cu, Zn and Ni is increasing by contact time.
The reduction of Fe and Cr increases during the first 10 minutes contact
time to decrease during the last five.
The reduction of Al is the opposite. The reduction decreases between the
first and the fifth minute to increase from the fifth minute to the fifteenth.
0,001
0,01
0,1
1
10Cu
Al
ZnCr
Fe 0 min
1 min
5 min
10 min
15 min
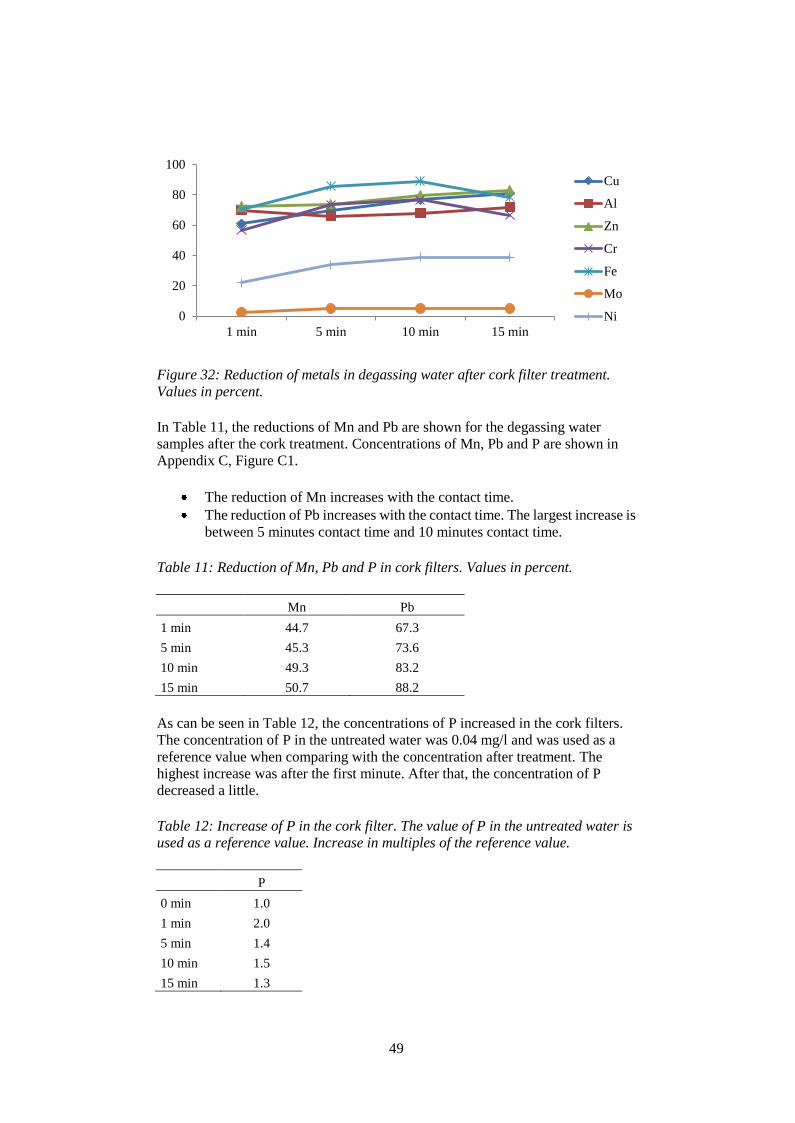
49
Figure 32: Reduction of metals in degassing water after cork filter treatment.
Values in percent.
In Table 11, the reductions of Mn and Pb are shown for the degassing water
samples after the cork treatment. Concentrations of Mn, Pb and P are shown in
Appendix C, Figure C1.
The reduction of Mn increases with the contact time.
The reduction of Pb increases with the contact time. The largest increase is
between 5 minutes contact time and 10 minutes contact time.
Table 11: Reduction of Mn, Pb and P in cork filters. Values in percent.
Mn Pb
1 min 44.7 67.3
5 min 45.3 73.6
10 min 49.3 83.2
15 min 50.7 88.2
As can be seen in Table 12, the concentrations of P increased in the cork filters.
The concentration of P in the untreated water was 0.04 mg/l and was used as a
reference value when comparing with the concentration after treatment. The
highest increase was after the first minute. After that, the concentration of P
decreased a little.
Table 12: Increase of P in the cork filter. The value of P in the untreated water is
used as a reference value. Increase in multiples of the reference value.
P
0 min 1.0
1 min 2.0
5 min 1.4
10 min 1.5
15 min 1.3
0
20
40
60
80
100
1 min 5 min 10 min 15 min
Cu
Al
Zn
Cr
Fe
Mo
Ni
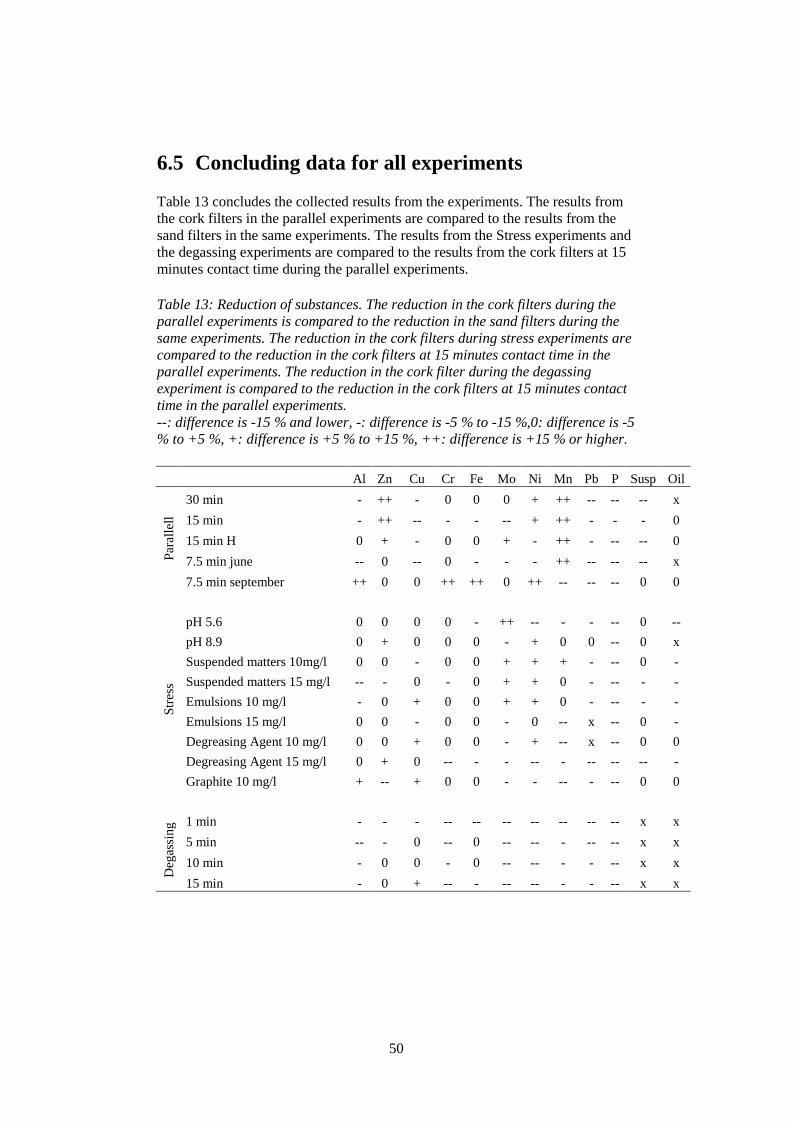
50
6.5 Concluding data for all experiments
Table 13 concludes the collected results from the experiments. The results from
the cork filters in the parallel experiments are compared to the results from the
sand filters in the same experiments. The results from the Stress experiments and
the degassing experiments are compared to the results from the cork filters at 15
minutes contact time during the parallel experiments.
Table 13: Reduction of substances. The reduction in the cork filters during the
parallel experiments is compared to the reduction in the sand filters during the
same experiments. The reduction in the cork filters during stress experiments are
compared to the reduction in the cork filters at 15 minutes contact time in the
parallel experiments. The reduction in the cork filter during the degassing
experiment is compared to the reduction in the cork filters at 15 minutes contact
time in the parallel experiments.
--: difference is -15 % and lower, -: difference is -5 % to -15 %,0: difference is -5
% to +5 %, +: difference is +5 % to +15 %, ++: difference is +15 % or higher.
Al Zn Cu Cr Fe Mo Ni Mn Pb P Susp Oil
Par
alle
ll
30 min - ++ - 0 0 0 + ++ -- -- -- x
15 min - ++ -- - - -- + ++ - - - 0
15 min H 0 + - 0 0 + - ++ - -- -- 0
7.5 min june -- 0 -- 0 - - - ++ -- -- -- x
7.5 min september ++ 0 0 ++ ++ 0 ++ -- -- -- 0 0
Str
ess
pH 5.6 0 0 0 0 - ++ -- - - -- 0 --
pH 8.9 0 + 0 0 0 - + 0 0 -- 0 x
Suspended matters 10mg/l 0 0 - 0 0 + + + - -- 0 -
Suspended matters 15 mg/l -- - 0 - 0 + + 0 - -- - -
Emulsions 10 mg/l - 0 + 0 0 + + 0 - -- - -
Emulsions 15 mg/l 0 0 - 0 0 - 0 -- x -- 0 -
Degreasing Agent 10 mg/l 0 0 + 0 0 - + -- x -- 0 0
Degreasing Agent 15 mg/l 0 + 0 -- - - -- - -- -- -- -
Graphite 10 mg/l + -- + 0 0 - - -- - -- 0 0
Deg
assi
ng
1 min - - - -- -- -- -- -- -- -- x x
5 min -- - 0 -- 0 -- -- - -- -- x x
10 min - 0 0 - 0 -- -- - - -- x x
15 min - 0 + -- - -- -- - - -- x x
51
7 Discussion
The discussion is divided into three parts:
Discussions of the results from the parallel experiments
Discussions of the results from the stress experiments
Discussions of the results from treatment of the degassing water
Note that only one experimental round was run for each contact time and stress
test. The exception was the parallel experiment with 7.5 minutes contact time,
which was run two times.
The filters are constructed to have a continuous flow through them; this has not
been the case during the pilot study. The experiments were run batch-wise and
emptied after each round. The filters were used like this for about 4 days. Then,
they were left for a weekend. After every experiment about 10 liters of filtered
water were left in the bottom of the filters. This might have influenced the results
as well. For example, the two pH stress experiments were run after each other and
the left over water might have influenced the next experiment.
Some of the filters were exchanged during the pilot study. The first exchange was
of a saturated FOSS filter after an unsuccessful experiment with added graphite.
Therefore, the filter was new during the first experiment with suspended matters.
At the same time the FADE and MAAC was reloaded. Furthermore, all filters were
exchanged after the service stop. The first experiment with new filters was
performed with increased concentrations of emulsions.
7.1 Parallel Experiments
The reductions of Cu, Al, Zn, Cr and Fe in the cork filters in Figure 17-Figure 21
vary in a similar way. The reduction was relatively high for all metals at 30
minutes contact time. At 15 minutes contact time the reduction decreased. At 15
minutes contact time with high flow the reduction was higher. At 7.5 minutes
contact time in June the reduction decreased. Finally, the reduction at 7.5 minutes
contact time in September increased compared to the other experiment with 7.5
minutes contact time. An interesting result is the reduction of suspended matters.
Its curve is the opposite to the reduction of metals, except for the last two
experiments at 7.5 minutes contact time. The metals have been thought to be
bound to the suspended matters, so if the concentration of suspended matters
decreased, so would the concentration of metals. Previous analyses made by
Ovako on the water after the sand filters show this. The first three experiments
with contact times of 30 minutes and 15 minutes showed the opposite behavior.
The reduction of metals in the experiments with contact times of 7.5 minutes
followed the reduction of suspended matters; when the reduction of suspended
matters decreased, so did the reduction of metals.
The cause of the contradictory results of the reduction of metals and suspended
matters might be that the metals were bound to inorganic materials in a higher
52
extent in the first three experiments and to organic material to a higher extent in the
last two. The microorganisms in the FADE filter can only digest organic material.
Metals bound to inorganic material will pass through the cork filters. This implies
that the suspended matters in the experiments with 7.5 minutes contact time were
mainly of organic material that could be digested. The metals released could be
reduced in the MAAC filters.
The reduction of Cu, Al, Zn, Cr and Fe during the parallel experiments compared
to the historical data of the sand filters show that the historical data and the data
from the experiment does not have to correlate. The reduction of Cr and Fe was
lower in the cork filters than in the sand filters during the parallel experiments. The
reduction of Cr and Fe in the cork filters compared to the historic reduction of Cr
and Fe in the sand filters show that the reduction of Cr and Fe in the cork filters
was better than the historical average reduction. This might be due to the fact that
the sand filters were in good function during the experiments compared to the
condition of the last 12 months. The reduction of Zn in the cork filters was higher
than the reduction in the sand filters during the parallel experiment. Compared to
the historical data the reduction of Zn in the cork filter was below the historical
average reduction in the sand filters at two times. The behavior of Zn contradicts
the assumption based on the behavior of Cr and Fe. Different properties in Cr and
Fe compared to Zn might result in different binding capacities for the metals to the
sand filters or the cork filters.
The normal assumption is that longer contact time gives a higher reduction. Figure
17- Figure 21 show the reduction in the parallel experiments. The figures show that
this is almost true. There are two exceptions. The reduction of Al and suspended
matters was lower at 30 minutes contact time than at 15 minutes contact time. The
reason for the low reduction of suspended matters can be that the 30 minutes
contact time was the first experiment to be done. There might have been small cork
fragments that were washed out of the cork filters during the first experiment and
made the reduction of suspended matters look lower than it was. Another reason
might be the composition of the suspended matters. If most of the Al is bound to
inorganic material it will not be reduced to the same extent as if it had been bound
to organic matters.
An interesting thing is to see what happens when the flow was increased through
the cork filters. When the flow was increased, the reduction was also increased.
When the flow was increased, the time the filter has to be run was prolonged.
Because the microorganisms in the FADE filter are so small, they slip out of the
filter and are spread through the whole water volume. This gives the enzymes more
time to digest organic suspended matters and thus solve metals. The metal
adsorption in the MAAC filter happens almost momentarily as the water gets in
contact with the matrix. The high flow does not affect the chelate binding. This
also implies that the most part of the suspended matters were organic materials.
Otherwise the FADE microorganisms would not been able to digest the suspended
matters.
Except from Zn, the sand filters were better at removing most of the pollutants in
the process water at normal operation. For all parallel experiments, except 7.5
minutes contact time in June, the concentration of Zn was lower after the cork filter
53
treatment than after the sand filter treatment. The reduction of Zn varied between
69 % and 92 % in the sand filters. This was probably due to the Zn forming
inorganic salts, like ZnCl2, with the chloride from the flocculants added to the sand
filters. The size of the salt particles is too small to fully stick in the sand bed. In the
cork filters, the Zn did not form salts because of the lack of Cl ions and were thus
adsorbed in the MAAC filter matrix. This caused the higher reduction of Zn in the
cork filters compared to the sand filters. The lower reduction of Zn in the cork
filters in June might be because of the MAAC filter becoming saturated.
Removing suspended matters from the process water was a problem for the cork
filters. It was only the water from September, with a contact time of 7.5 minutes,
which was below the guidance value of suspended matters. The reason to the
relatively high concentrations of suspended matters after the cork filters was the
incapacity of the cork filters to handle inorganic suspended matters. If the process
water contains high loads of inorganic components, the reduction of suspended
matters will be low. For some of the experiments the difference in reduction of the
concentration of suspended matters was of one order of magnitude. The sand
filters are good at reducing suspended matters because of their great volume that
allow more of the suspended matters to stick to the filter masses. Also, the pores
between the sand grains are small and suspended matters can get stuck.
The two experiments with 7.5 minutes contact time were supposed to show almost
the same results. As can be seen in section 6.1.4, this was not the case. There were
differences in the reduction of Al, Zn and suspended matters between the two
experiments. The difference in the results between the two experiments may be
due to the filters becoming saturated in June and that the filters were newly
changed in September. The difference may also be due to differences in the
incoming water. The concentration and composition of the suspended matters
might be an explanation. If the suspended matters contained more inorganic
material in June than in September the microorganisms in the FADE filter would
not be able to solve metals in the same extent as if the suspended matter had been
of organic origin. Zn does not seem to follow this pattern and the reason to this has
been given above.
The reduction of oils varied between 85.7 % and 95.2 % after cork filter treatment.
The sand filter reduction was higher and the concentration of oils after the sand
filters was often below reporting limit. This is due to the size of the cork
granulates, which are bigger than the sand particles. The bigger cork granulates
will result in greater pores that the oil can slip through. The reduction in the cork
filters could be increased with greater filter volumes.
The behavior of P is of interest. In four of the five parallel experiments the
concentration of P is increased after the cork filters. The concentration of P in the
process water before the cork filter treatment was low. Even though the
concentration increased more than 30 times, the concentration after treatment in
some cases was not extremely high, 2.6 mg/l. This was still much higher than the
guidance value of 0.4 mg/l set by the authorities.

54
The source of the increase in concentration of P is probably the material the FADE
microorganisms are bound to when they are put into the solution. The increase of P
might be a problem in the long run if it continues to increase and accumulate in the
system. P is an ending resource in nature. There are techniques for harvesting of P
from water. These could be applied to the filter system to solve the problem with
leaching of P. In the sand filters, P is in the form of a salt and is collected in the
sand bed.
The reduction of Mo, Ni, and Mn were over all decreasing with decreasing contact
time. Mo is highly soluble in water and is usually hard to collect in a filter. The
reduction of Mo in the cork filters was sometimes higher than the reduction in the
sand filters. The amount collected in the cork filters seems to be depending on the
contact time more than the flow. The reduction of Ni in the cork filters was more
often higher than the reduction in the sand filters. The reduction of Mn was higher
in the cork filter than in the sand filters for all experiments except the experiment
with 7.5 minutes contact time in September. This was probably due to the earlier
mentioned digesting of organic material leading to a higher reduction of metals.
The reduction of Pb decreased with shortened contact time, but had two increases.
One at 15 minutes contact time with high flow and the other at 7.5 minutes contact
time in September. This was probably also due to the earlier mentioned digesting
of organic material leading to a higher reduction of metals. The reduction of Pb
was higher in the sand filters than in the cork filters during all experiments.
Cork filters at normal operation compared to sand filters at normal operation had a
lower purifying efficiency according to these experiments. The exception was Mn,
Ni and Zn that the cork filters were better at removing. All reductions could
possibly be increased with increased filter volumes.
An advantage of the cork filters was their capacity of turning the pH towards
neutral. This was due to the metal binding in the MAAC filter.
7.2 Stress Experiments
The point of the stress experiments was to see if the capacity of the cork filters was
decreased when divergences were added.
There was no great difference in reduction of Cu, Al, Zn, Fe, Mo and suspended
matters between the stress experiments and the parallel experiments. The
reduction of Cr, Ni and Mn was about 10 % lower for the stress experiments than
for the parallel experiments. The behavior of P was still most varying, but varied
less than in the parallel experiments. The highest increase in concentration of P
after treatment was 13 times the concentration of P in the incoming water for the
stress experiments compared to about 34 times for the parallel experiments.
55
Figure 33: Reduction of Mo and Ni during stress experiment with low pH
compared to pH at normal operation and 15 minutes contact time in the cork
filters and compared to the reduction during stress experiment with high pH.
Values in percent.
In Figure 33 the reduction of Mo and Ni are shown during the stress experiments
with pH. The reduction of Mo was highest for the experiment with pH 5.6 and
lowest at pH 8.9. It is known that Mo is sensitive for variations in pH so the result
is not unexpected. The opposite behavior seems to be the nature of Ni. At low pH
the reduction of Ni was low and at high pH the reduction of Ni was high. For the
metals, except Mo and Ni, the reduction differed with about 10 % between the two
experiments with low and high pH. The reduction of Cu, Al, Zn, Fe and Ni was
higher in the stressed cork filters than in the cork filter at normal operation.
The leaching of P was about 4 times higher in the experiment with low pH than in
the experiment with high pH. To make a comparison, the leaching of P from the
cork filters at the experiment with graphite divergence was of the same magnitude
as that with low pH. The pH for the graphite experiment was 7.9 in the untreated
water and 7.2 in the treated water compared to the pH of the low pH experiment
which was 5.6 in the untreated water and 5.8 in the treated water. The conclusion is
that pH does not seem to control the leaching. As been discussed above in the
parallel experiment, the constitution of the FADE matrix is more likely to affects
the leaching of P.
If the lowest levels of reductions are analyzed for each substance, the lowest
reduction of Cr, Ni, suspended matters and Pb and the next lowest reduction of Fe
and Mo occurred during the experiment with 15 mg/l of degreasing agent. The
experiment with 10 mg/l degreasing agent added to the water did not show the
same low level of reductions. The presence of degreasing agent in the water might
be the cause of the lowered reduction in the cork filters. The ability of the metals to
bind to the lipophilic phase might be the cause of the different behavior. This could
also be the cause why some metals had their top results at the same time.
46.7
21.4 16.3
56.2
73.7 80
0
10
20
30
40
50
60
70
80
90
5 5,5 6 6,5 7 7,5 8
Red
uct
ion (
%)
pH
Mo
Ni

56
The lowest reduction of Zn, Mo, Mn and P occurred during the experiment with 10
mg/l graphite added to the water. If the highest reductions in the cork filters of each
substance are analyzed, the reduction of Cu, Al, Fe, suspended matters and oil
occurred in the experiment with 10 mg/l of graphite added to the water. The
graphite was supposed to absorb in the FOSS filter and the metals to adsorb to the
MAAC filter. The content of graphite should therefore not influence the reduction
of metals even though it seems to do so here.
To conclude the results discussed in this section, it can be observed that the cork
filters were less sensitive for different kinds of stress than the sand filters. The
stress experiments performed were of such nature that the sand filters would have
had problem to operate normally during these circumstances. Cork filters could be
applied before the sand filters to decrease the disturbances in the sand filters.
Because of the operational robustness of the cork filters, they could be the solution
to the problems accounted in the PWTP.
7.3 Degassing Experiments
Most of the reduction of metals in the degassing water happened during the first
minute. This is due to the chelating bonds that form immediately between the
metals and the chelates (Hägg, 1989). There were variations in the reduction; the
reduction of Mo increased up to the fifth minute of contact time. The reduction of
Ni increased from 20 % at 1 minute contact time to about 35 % at 5 minutes contact
time. The reduction of Al decreased with about 5 % between 1 minutes contact
time and 5 minutes contact time.
Not much happened after 5 minutes contact time. There were small increases in the
reduction for Zn, Al, Cu, Pb and Ni, decreases for Fe and Cr. Mo and Mn was
keeping the same level of reduction after 5 minutes contact time. The increase in
the concentration of P was twice as high as in the untreated water after 1 minutes
contact time and the concentration decreased after that. After 5 minutes contact
time the concentration of P after treatment was 1.4 times the concentration in the
untreated water and continues on about that level.
If the degassing water should be pretreated before it reaches the PWTP, the contact
time would only need to be between 1 and 5 minutes. The total metal concentration
in the degassing water before treatment with MAAC filter was 14 mg/l at the time
of the experiment. After one minute contact time with the cork filter the metal
content was 8.7 mg/l in the treated water. The total metal reduction in the
degassing water was 38 %. The concentration of Zn in the degassing water was
higher than in the process water. If a MAAC filter was applied the reduction of Zn
could be increased and the burden on the sand filters could be lowered.
An advantage of the degassing water is its low content of organic material and oils.
If a MAAC filter was applied about 40 % of the metals in the degassing water
could be collected before the degassing water reaches the PWTP. The
concentrations of metals in the degassing water during the performed experiment
were quite similar to the concentration of metals in the incoming process water.

57
7.4 In context
When searching for new organic materials for water treatment use, materials
common in the close surroundings are often used (Das et al., 2008). Cork is grown
in Portugal and Spain, and has been so for many years. Since the wine producers
started to use plastic materials instead of cork to seal wine bottles, the cork
industry have been desperate to find new use for their raw material. If the cork can
be used in filters for water treatment, job opportunities are saved and even created
in Portugal and Spain where such initiatives are of great need. This, and the good
sorption capacities of cork, might compensate for the long transportation route to
get the cork to Sweden. Cork is a renewable resource, which sand is not, and is
therefore a good alternative to conventional sand filters. As have been shown in the
experiments, the reduction capacity of the cork filter was lower than the reduction
capacity of the sand filters. The reduction capacity of the cork filters can be
enhanced. The experiments done have led to the development of a new MAAC
filter with better reduction capacity.
A consequence of the cork filters being separated into three units is the possibility
to customize the cleaning process for different use. Thus, the cork filters can be
applied to a varying range of waters for treatment. As was shown with the stress
experiments, the cleaning capacity was still high for most of the compounds,
which is more than can be said of the sand filters at the same conditions. Cork
filters might be an important complement to sand filters to make the water
treatment process more stable. During such conditions, where sand filters cannot
be used, cork filters could be of good use. An example is water with high or low pH
and a metal content that needs to be removed. Sand filters cannot do the job, but
cork filters could do it.
58
8 Conclusions
In general, the reduction of substances in the cork filters was lower than in
the sand filters at normal operation. The exception was Zn that has a
higher reduction in the cork filters than in the sand filters. The reduction of
suspended matters was lower in the cork filters than in the sand filters at
normal operation.
The reduction of Mo and Ni is pH dependent. This makes it possible to
control the uptake of these metals.
The cork filters neutralized the pH.
At extreme conditions the reduction in the cork filters was only slightly
lower than the reduction at normal operation. It is known that the
efficiency of the sand filters is decreased during these circumstances.
If the degassing water is pretreated with a MAAC filter before it reaches
the PWTP, the contact time for the degassing water in the cork filters
would only have to be 1-5 minutes. The lowered metal concentration
would decrease the metal load to the sand filters.
A combination of cork filters and sand filters would reduce the incidence
of costly disturbances to the sand filters. The sand filters would have a
final polishing effect on the process water.

59
9 Further work
The work done in this thesis is only a beginning of what could be done. To really
evaluate the FOSS, FADE and MAAC technologies, an in-depth pilot study has to
be done on different types of process water.
To be able to really compare the Spikes & Cogs technologies an economic analysis
should be done.
A life cycle assessment on the cork and sand filters might give interesting insights
in the pros and cons of cork and sand filters.

60
10 Acknowledgements
Great thanks to Johan de Faire who has answered all my questions and been a good
supervisor. Also, great thanks to Kjell Pålsson who has been an informal
supervisor at Ovako and helped me a lot with input on the project, contacts on site
and the structure of the report.
Heléne Bergwall and Pernilla Sellfors-Forsling in the laboratory at Ovako, you are
the best! Great thanks to both of you for all help with the samples, your
encouragement and input on all kinds of chemical questions I have had during
these months.
Thanks also to all the nice people working at the process water treatment plant at
Ovako. I would especially like to thank Lars Bengtzén, Rasmus Mohlén and
Anders Rosengren at Maintpartner AB for the time you have taken to show me
how the treatment plant works, answer my questions and helping me with the
materials I needed. Without you the work with the experiment would have been so
much more complicated.
I would also like to show my gratitude to Torbjörn Skoglund, who have answered
my questions and helped me get in the contact with the right persons around the
plant. Thanks also to Torbjörn Pettersson who have come by the experiment site
and chatted about the results and given me valuable input on the subject of water
treatment. Thanks to Mirja Sonestad for all help with the lodging in Hofors. I
appreciate the efforts you have put in to get me somewhere to sleep. Thanks to
Tommy Fors for a never ending will to help me out with material and knowledge
of the steel plant.
Thanks to Bengt Carlsson for the input on my master thesis, Patrik Sternudd for the
support throughout the work and to all others who have been part of this project
either through answering questions, supporting, helping out with practicalities,
being friendly or encouraging.
61
11 References
Ahluwalia SS, Goyal D. 2007.Microbial and plant derived biomass for removal of
heavy metals from wastewater. Bioresource Technology, 98:2243–2257.
Babel S, Kurniawan TA. 2003. Low-cost adsorbents for heavy metals uptake from
contaminated water: a review. Journal of Hazardous Materials, 97:219–243.
Campbell NA, Reece JB. 2005. Biology. 7th edition, Pearson Benjamin
Cummings, San Francisco.
Chubar N, Carvalho JR, Correia MJN. 2004. Heavy metals biosorption on cork
biomass: effect of the pre-treatment. Colloids and Surfaces A: Physicochemical
and Engineering Aspects, 238:51–58.
Das N, Karthika P, Vinodhini V. 2008. Use of natural products as biosorbent of
heavy metals. an overview. Natural Product Radiance, 7:133–138.
Gupta R, Ahuja P, Khan S, Saxena RK, Mohapatra H. 2000. Microbial
biosorbents: Meeting challenges of heavy metal pollution in aqueous solutions.
Current Science. 78:967-973.
Hägg G. 1989. Allmän och oorganisk kemi. 9th edition. Almqvist & Wiksell,
Uppsala.
Matis KA, Zouboulis AI, Lazaridis NK. 2003. Heavy metals removal by
biosorption and flotation. Water, Air and Soil Pollution: Focus, 3:143–151.
Ovako Steel. Welcome to Ovako Steel at Hofors and Hällefors.
Park D, Yun YS, Park JM. 2010. The past, present, and future trends of
biosorption. Biotechnology and Bioprocess Engineering, 15:86–102.
Svenskt vatten. 1992. Dricksvattenteknik. Ytvatten. Publikation P72. Svenskt
vatten AB. Stockholm.
Svenskt Vatten. 2010. Avloppsteknik 2. Reningsprocessen. Publikation U2.
Svenskt vatten AB. Stockholm.
Spikes & Cogs AB. 2010. Product information. FADE. Spikes & Cogs AB.
Nordic water. DynaSand.
WWW article 2011: http://www.nordicwater.com. Downloaded 20110920.
Ovako.
WWW article 2011:http://www.ovako.se. Downloaded 20110616
62
Appendix A
Figure A1: Reduction of Al after sand filter
Figure A2: Reduction of Zn after sand filter
-40
-20
0
20
40
60
80
100
2010-01-22 2010-08-10 2011-02-26 2011-09-14
Red
uct
ion (
%)
Time
-40
-20
0
20
40
60
80
100
2010-01-22 2010-08-10 2011-02-26 2011-09-14
Red
uct
ion (
%)
Time
63
Figure A3: Reduction of Cr after sand filter
Figure A4: Reduction of Fe after sand filter
-100
-80
-60
-40
-20
0
20
40
60
80
100
2010-01-22 2010-08-10 2011-02-26 2011-09-14
Red
uct
ion (
%)
Time
-80
-60
-40
-20
0
20
40
60
80
100
2010-01-22 2010-08-10 2011-02-26 2011-09-14
Red
uct
ion (
%)
Time
64
Appendix B
Figure B1: Reduction at low pH. Concentrations in mg/l.
Figure B2: Reduction at high pH. Concentrations in mg/l.
0,001
0,01
0,1
1
10
100Cu
Al
Zn
CrFe
Susp
Oil0 min
0 min pH 5.3
15 min pH 5.3
15 min normal
0,001
0,01
0,1
1
10
100Cu
Al
Zn
CrFe
Susp
Oil
0 min
0 min pH 8.7
15 min pH 8.7
15 min normal
65
Figure B3: Reduction at a graphite concentration of 10 mg/l. Concentrations in
mg/l.
Figure B4: Reduction at a concentration of suspended matters of 10 mg/l.
Concentrations in mg/l.
0,001
0,01
0,1
1
10
100Cu
Al
Zn
CrFe
Susp
Oil
0 min
0 min graphite
15 min graphite
15 min normal
0,001
0,01
0,1
1
10
100Cu
Al
Zn
CrFe
Susp
Oil0 min
0 min susp
15 min susp
15 min normal

66
Figure B5: Reduction at a concentration of suspended matters of 15 mg/l.
Concentrations in mg/l.
Figure B6: Reduction at a concentration of emulsion of 10 mg/l. Concentrations in
mg/l.
0,001
0,01
0,1
1
10
100
1000Cu
Al
Zn
CrFe
Susp
Oil
0 min
0 min susp
15 min susp
15 min normal
0,001
0,01
0,1
1
10
100Cu
Al
Zn
CrFe
Susp
Oil
0 min
0 min emulsion
15 min emulsion
15 min normal
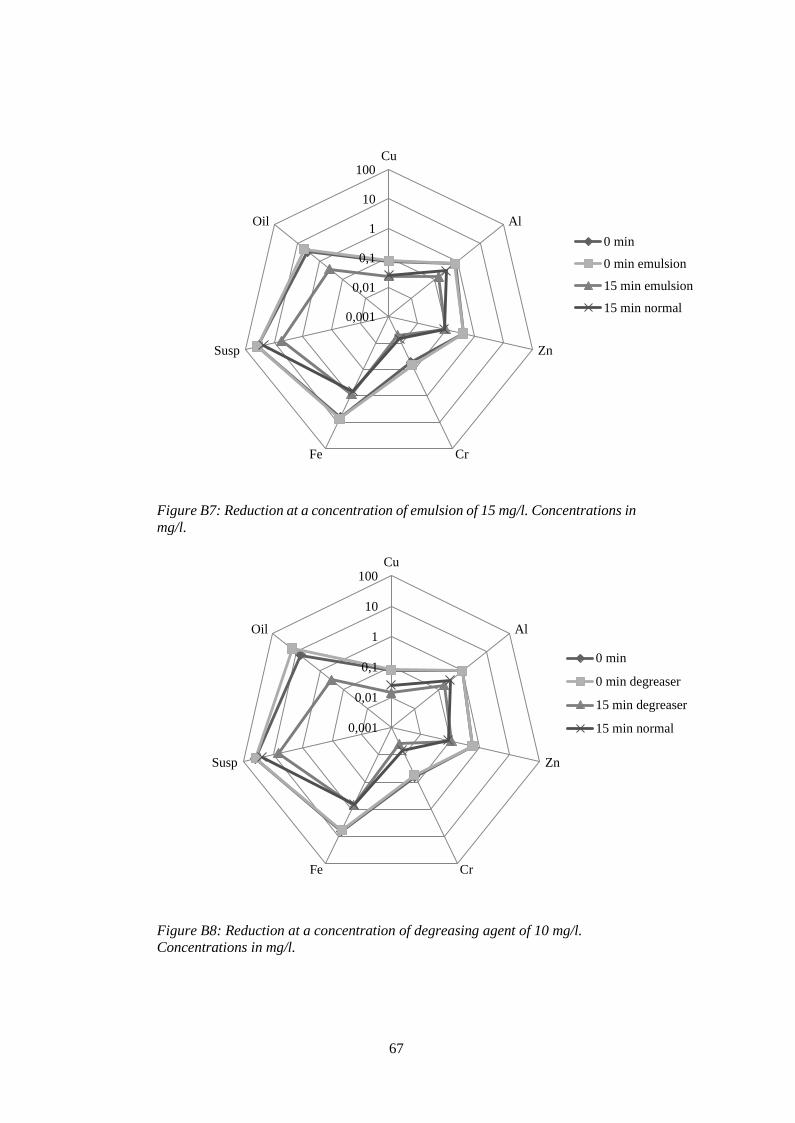
67
Figure B7: Reduction at a concentration of emulsion of 15 mg/l. Concentrations in
mg/l.
Figure B8: Reduction at a concentration of degreasing agent of 10 mg/l.
Concentrations in mg/l.
0,001
0,01
0,1
1
10
100Cu
Al
Zn
CrFe
Susp
Oil
0 min
0 min emulsion
15 min emulsion
15 min normal
0,001
0,01
0,1
1
10
100Cu
Al
Zn
CrFe
Susp
Oil
0 min
0 min degreaser
15 min degreaser
15 min normal

68
Figure B9: Reduction at a concentration of degreasing agent of 15 mg/l.
Concentrations in mg/l.
0,001
0,01
0,1
1
10
100Cu
Al
Zn
CrFe
Susp
Oil
0 min
0 min degreaser
15 min degreaser
15 min normal

69
Appendix C
Table C1: Concentrations of Mn, Pb and P after treatment with cork.
Concentrations in mg/l.
Mn (mg/l) Pb (mg/l) P (mg/l)
1 min 0.83 0.072 0.08
5 min 0.82 0.058 0.056
10 min 0.76 0.037 0.058
15 min 0.74 0.026 0.053