Embed Size (px)
DESCRIPTION
A picture is worth more than a 1000 words. It can save a life. Arjun Watane. Gaussian Derivative. I = imread ( 'brain_tumor_mri_1.jpg' ); I2 = rgb2gray(I); k = fspecial ( ' gaussian ' , [7 7] , 1); %Gaussian filter kernal kdx = conv2(k,[1 0 -1], 'valid' ); %figure; surf( kdx ); - PowerPoint PPT Presentation
Citation preview
A picture is worth more than a 1000 words. It can save a life.
Arjun Watane
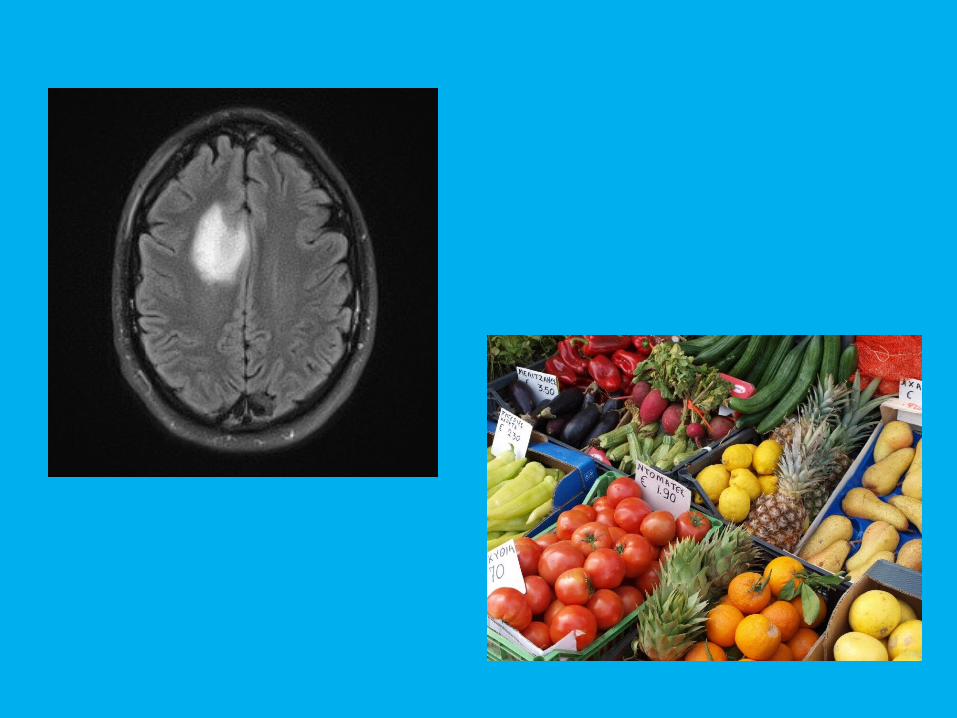
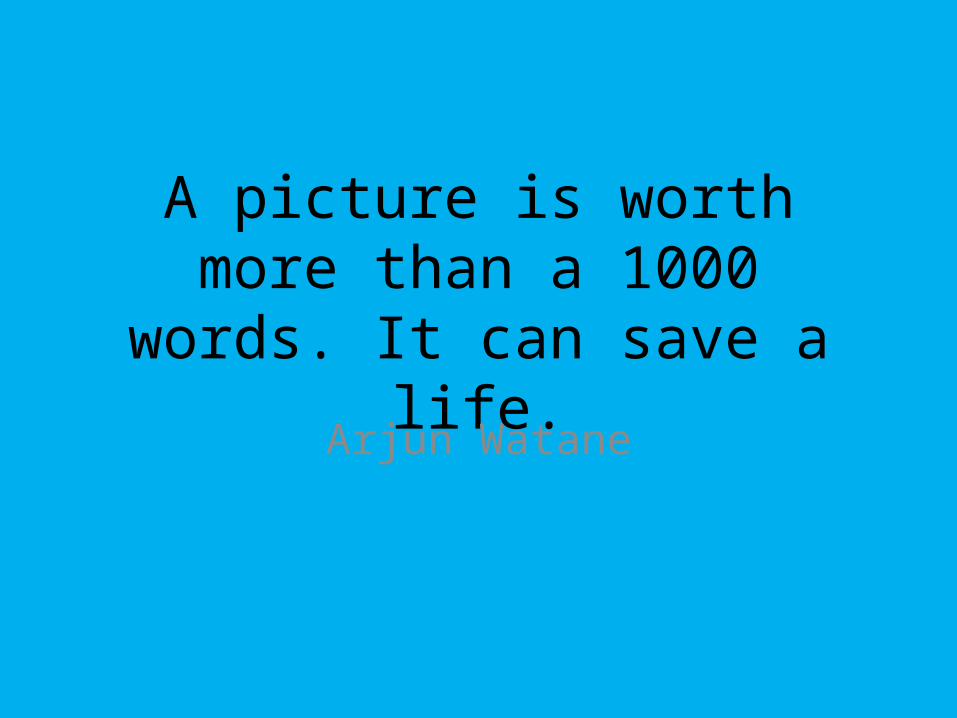
Gaussian Derivative • I = imread('brain_tumor_mri_1.jpg');• I2 = rgb2gray(I);• • k = fspecial('gaussian', [7 7] , 1); %Gaussian filter kernal• • kdx = conv2(k,[1 0 -1], 'valid');• %figure; surf(kdx);• kdy = conv2(k, [1; 0; -1], 'valid');• %figure; surf(kdy);• • imx = conv2(I2, kdx, 'valid');• imy = conv2(I2, kdy, 'valid');• • figure; imshow(I2);• %figure; imshow(imx);• figure; imshow(imy);• imwrite(imy, 'brainTumorMRI1_GaussianDerivative.jpg');
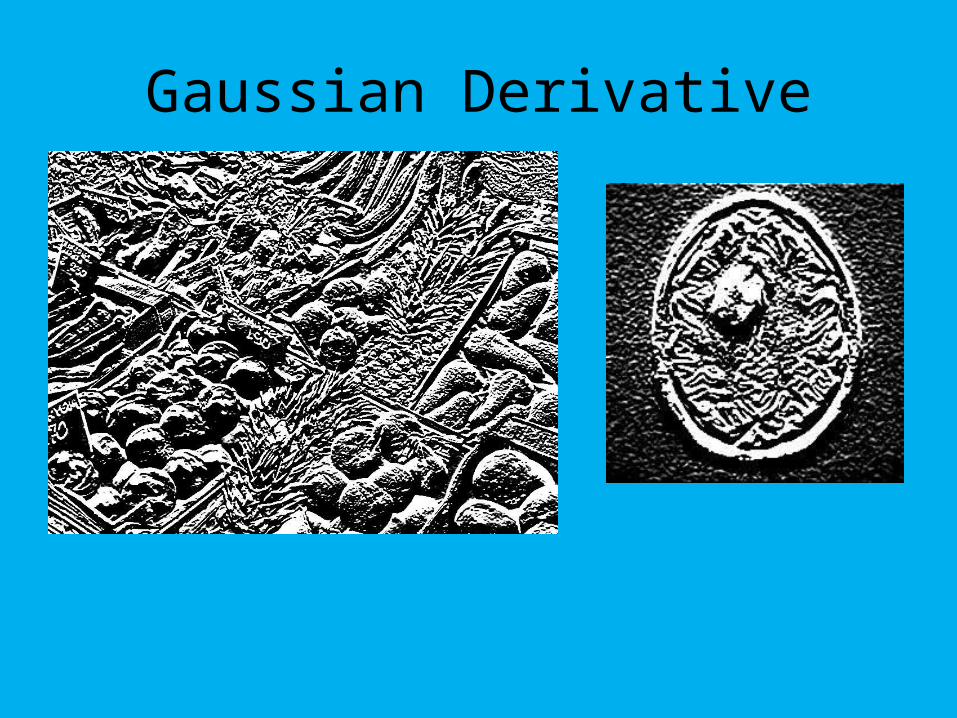
Gaussian Derivative
Edge Detector
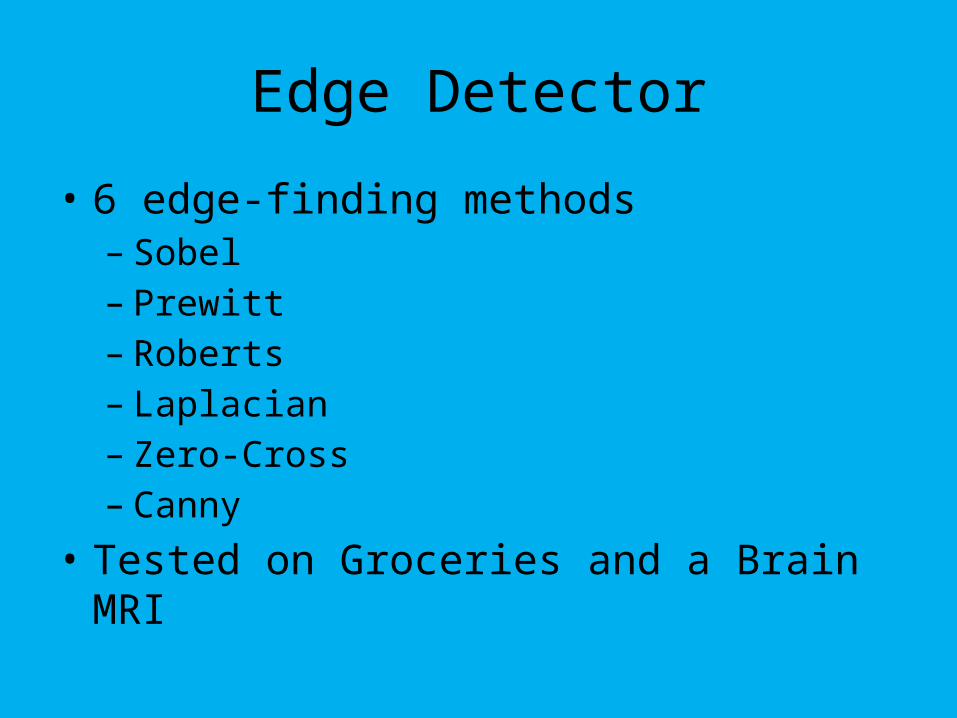
• 6 edge-finding methods– Sobel– Prewitt– Roberts– Laplacian– Zero-Cross– Canny
• Tested on Groceries and a Brain MRI
Edge Detection on Groceries
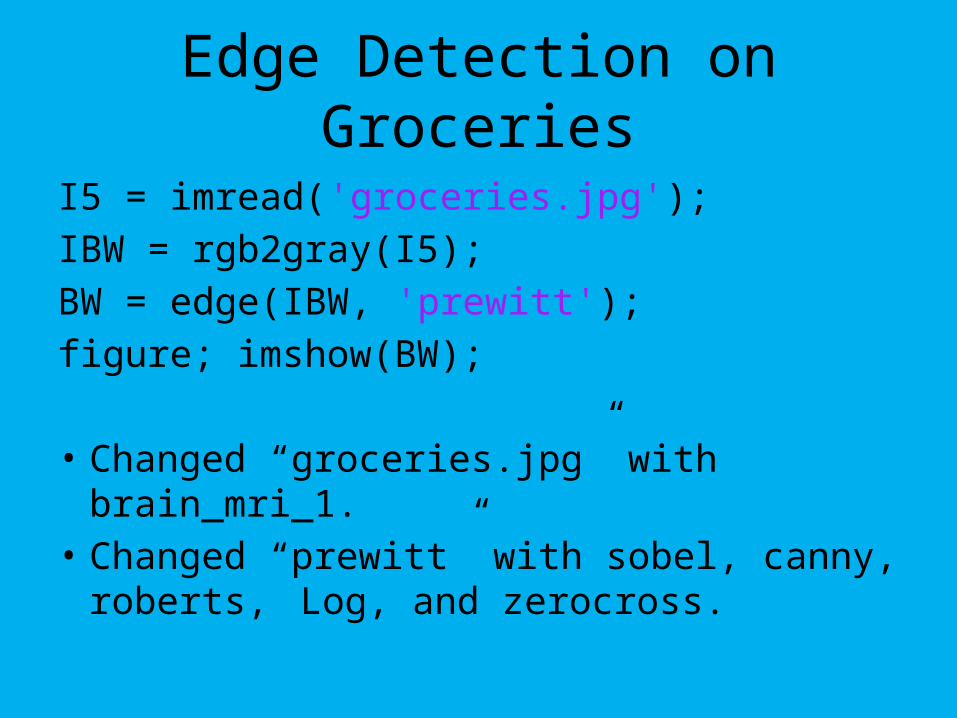
I5 = imread('groceries.jpg');IBW = rgb2gray(I5);BW = edge(IBW, 'prewitt');figure; imshow(BW);
• Changed “groceries.jpg” with brain_mri_1.• Changed “prewitt” with sobel, canny, roberts,
Log, and zerocross.
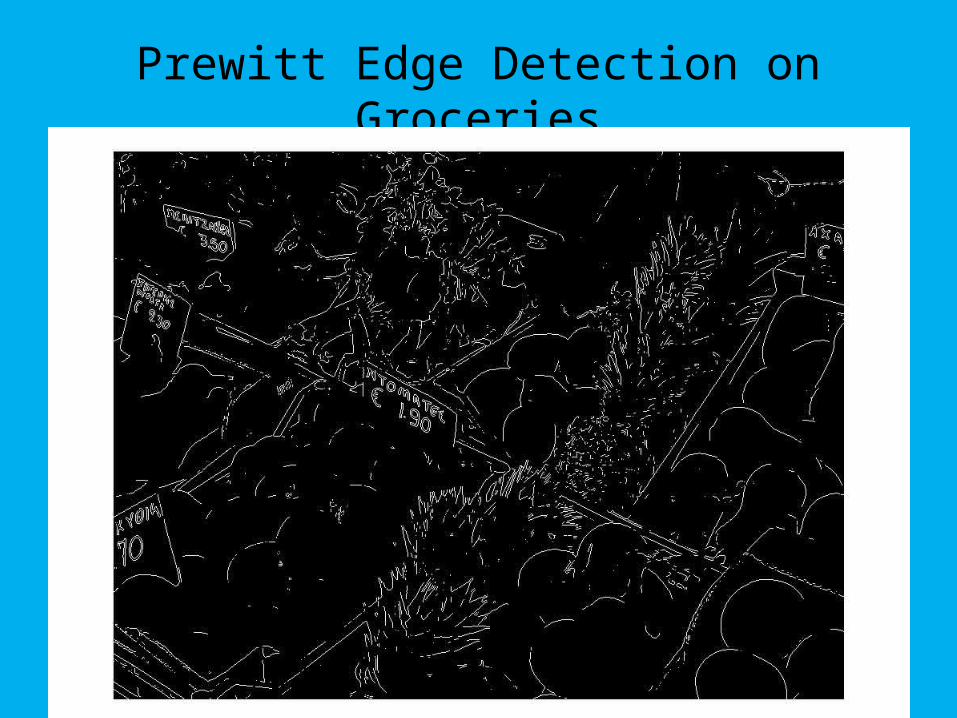
Prewitt Edge Detection on Groceries
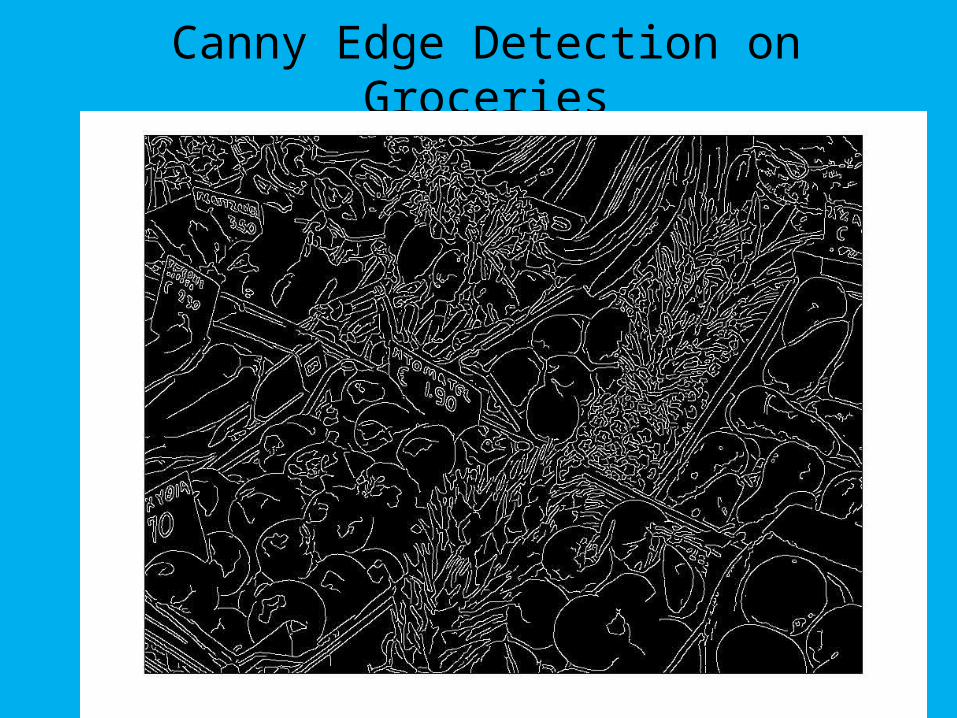
Canny Edge Detection on Groceries

Roberts Edge Detection on Groceries
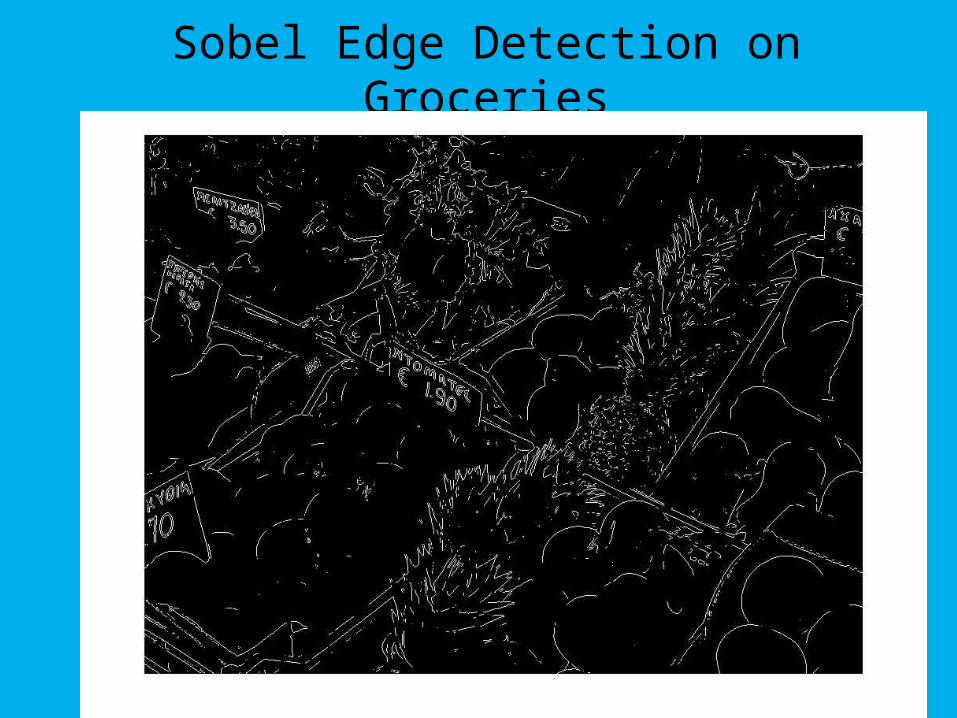
Sobel Edge Detection on Groceries
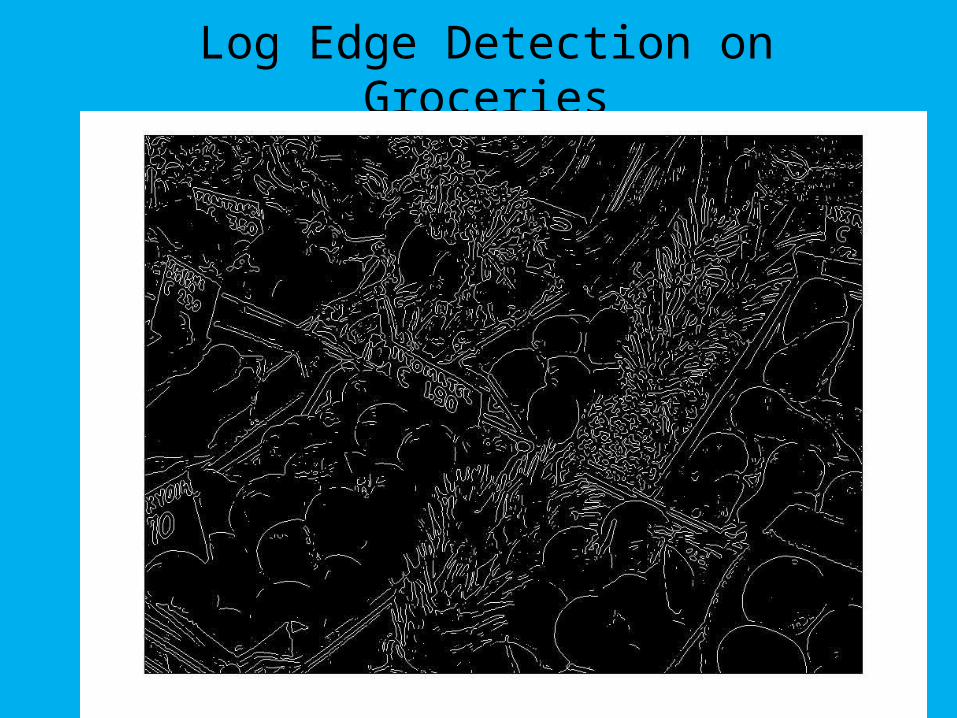
Log Edge Detection on Groceries

Zerocross Edge Detection on Groceries
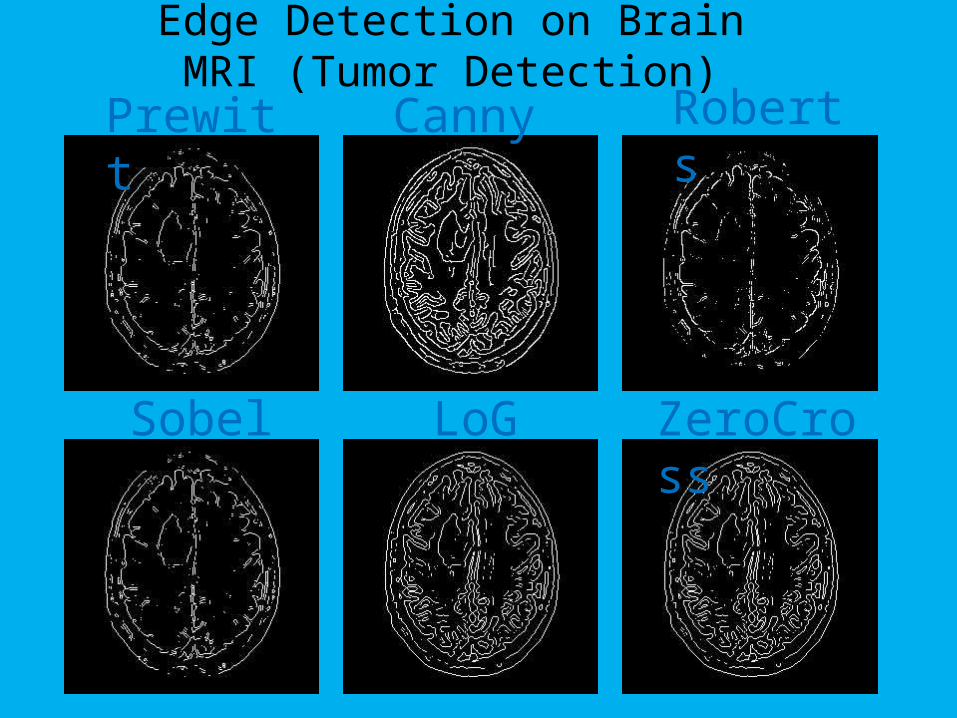
Edge Detection on Brain MRI (Tumor Detection)
Prewitt
ZeroCrossLoGSobel
RobertsCanny

Adaboost
• Pgm files work better. • Found online jpg to pgm converter.
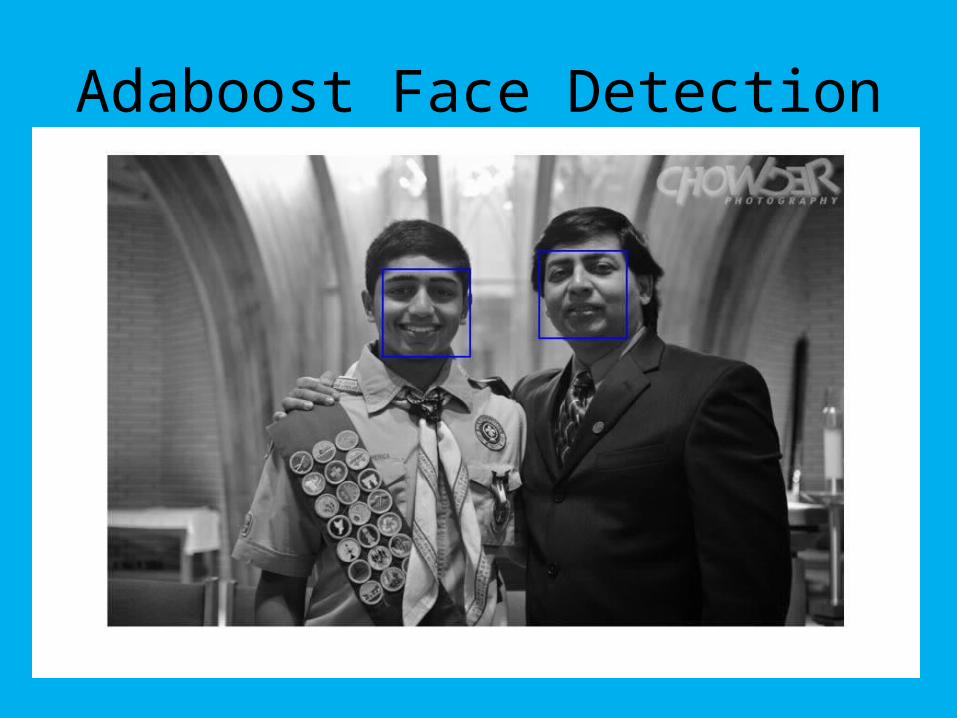
Adaboost Face Detection
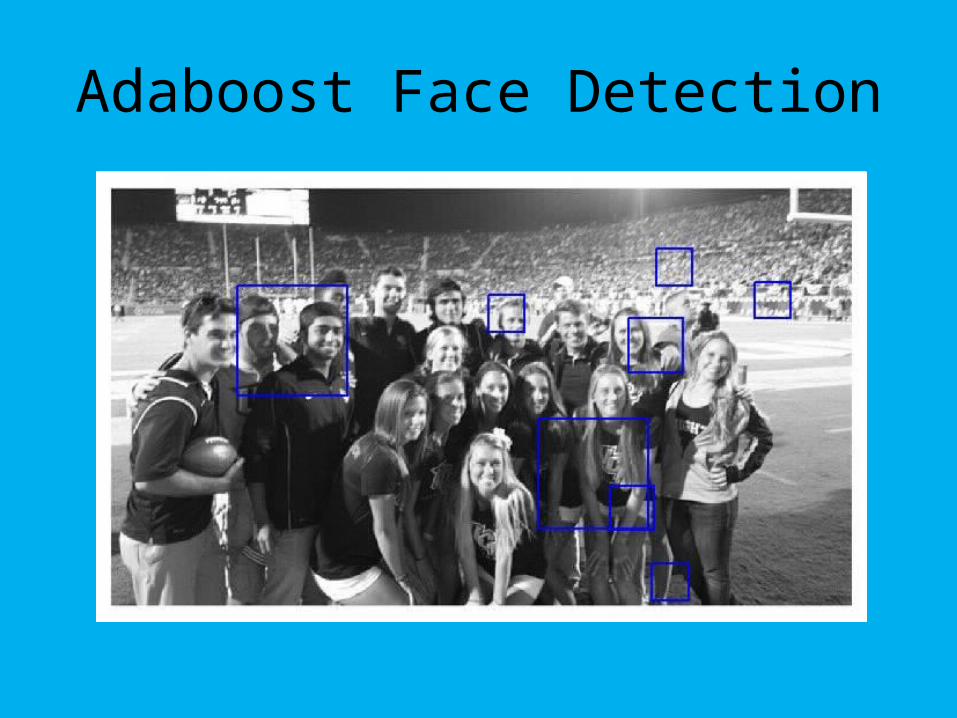
Adaboost Face Detection
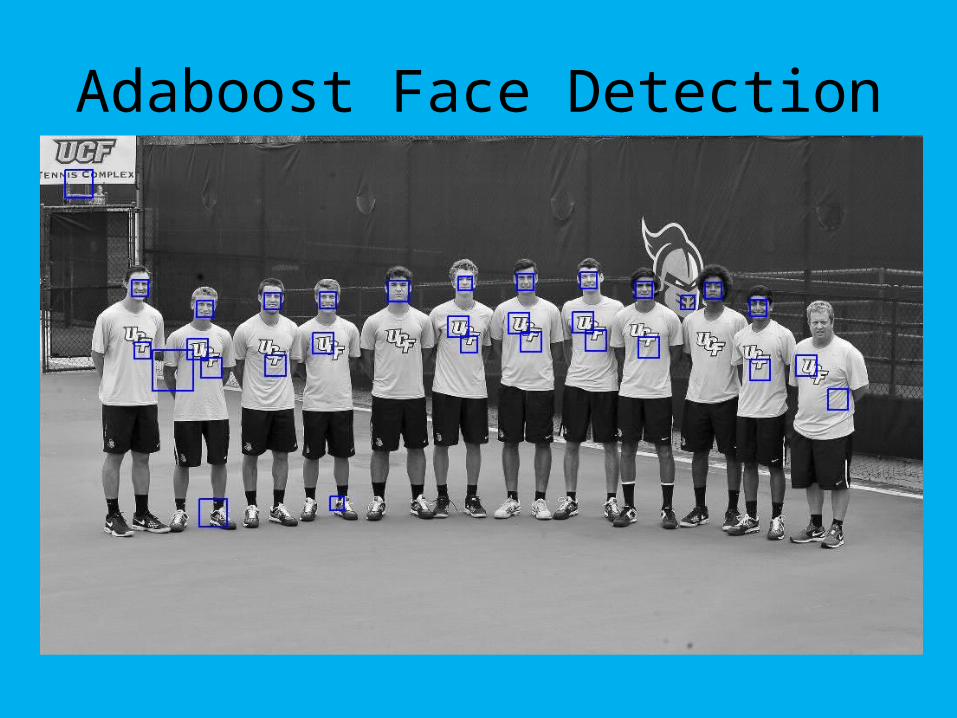
Adaboost Face Detection
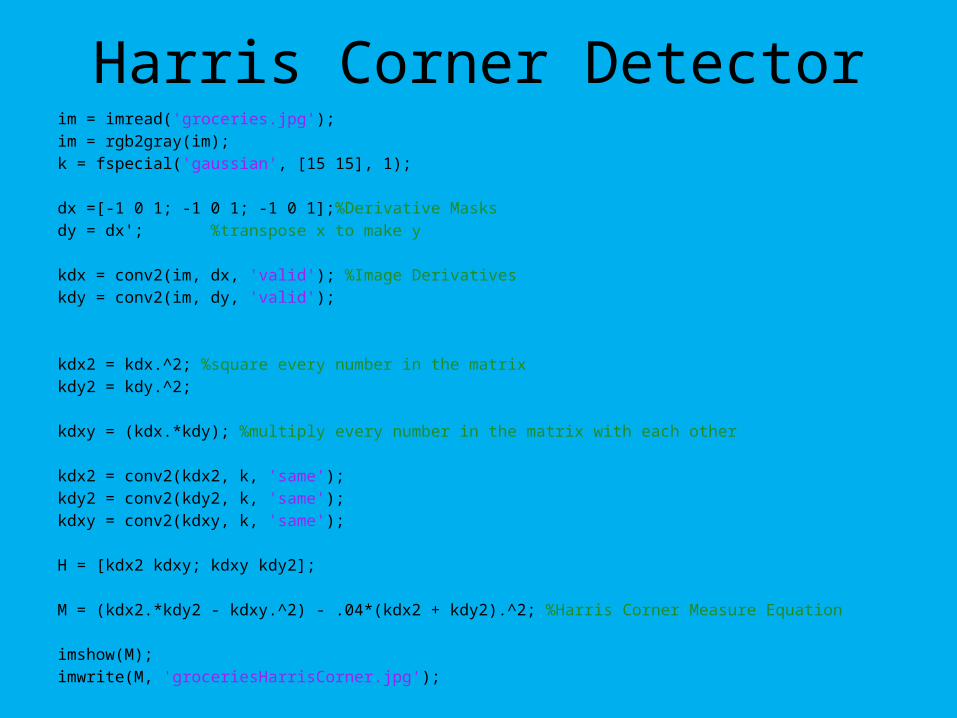
Harris Corner Detectorim = imread('groceries.jpg');im = rgb2gray(im);k = fspecial('gaussian', [15 15], 1); dx =[-1 0 1; -1 0 1; -1 0 1];%Derivative Masksdy = dx'; %transpose x to make y kdx = conv2(im, dx, 'valid'); %Image Derivativeskdy = conv2(im, dy, 'valid'); kdx2 = kdx.^2; %square every number in the matrixkdy2 = kdy.^2; kdxy = (kdx.*kdy); %multiply every number in the matrix with each other kdx2 = conv2(kdx2, k, 'same');kdy2 = conv2(kdy2, k, 'same');kdxy = conv2(kdxy, k, 'same'); H = [kdx2 kdxy; kdxy kdy2]; M = (kdx2.*kdy2 - kdxy.^2) - .04*(kdx2 + kdy2).^2; %Harris Corner Measure Equation imshow(M);imwrite(M, 'groceriesHarrisCorner.jpg');
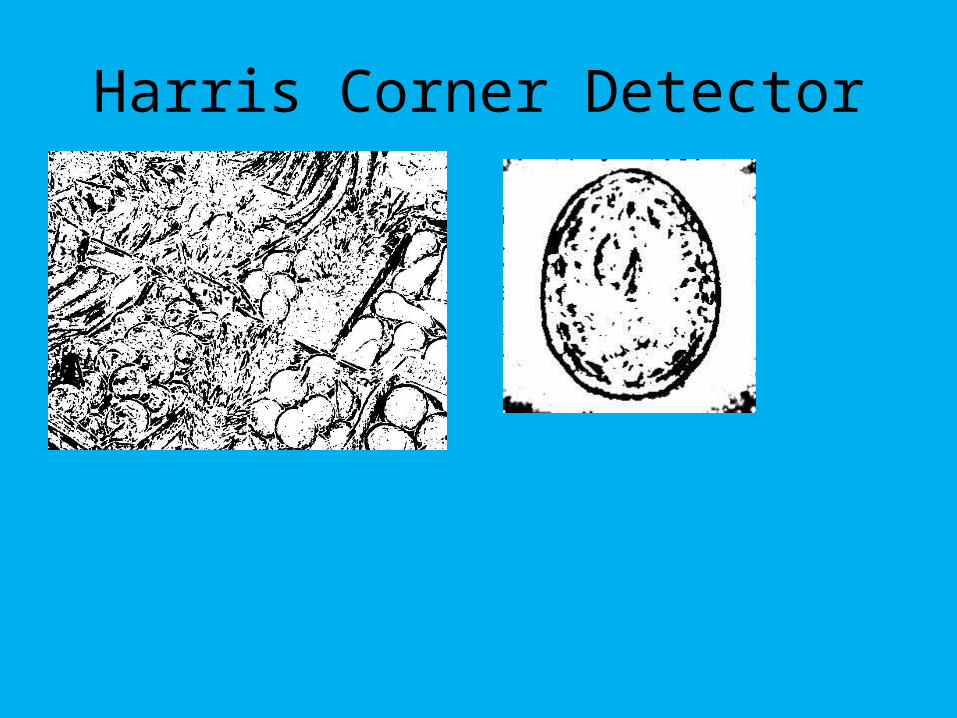
Harris Corner Detector
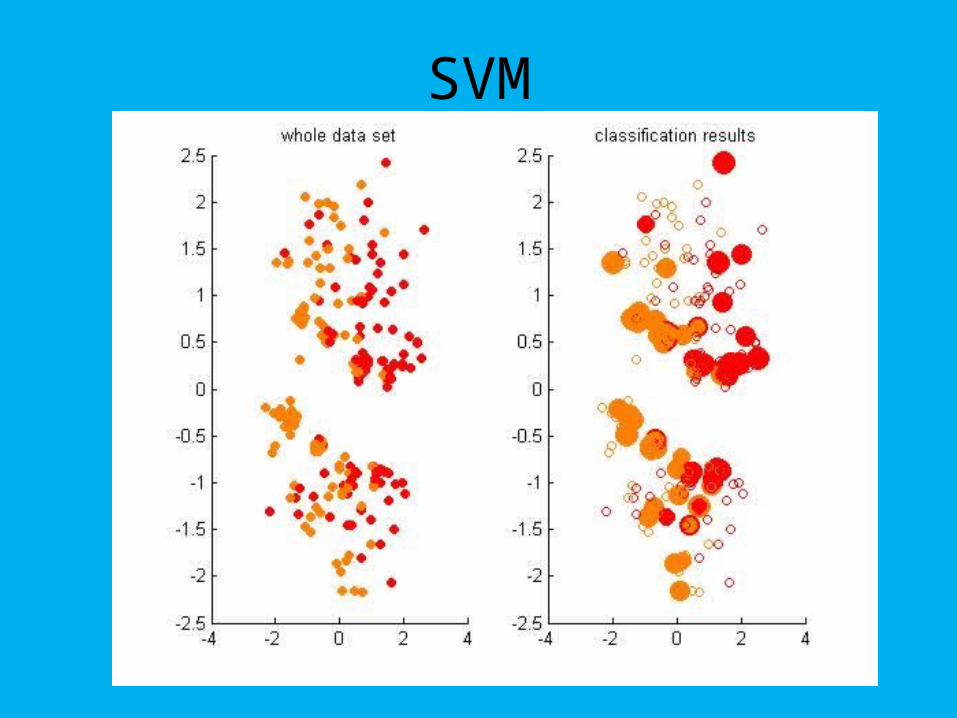
SVM
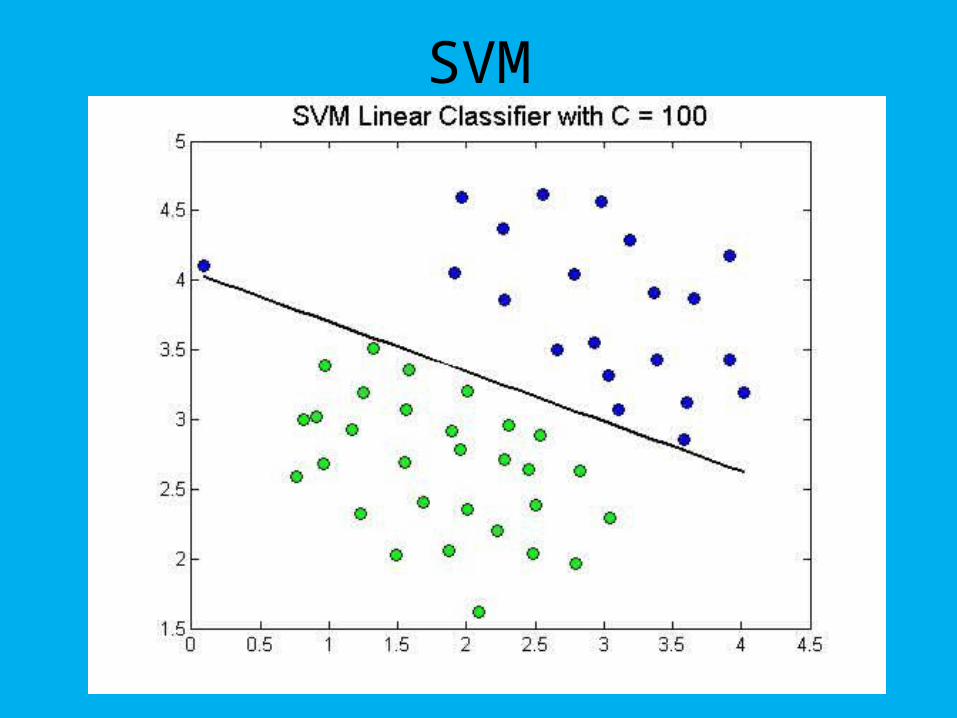
SVM
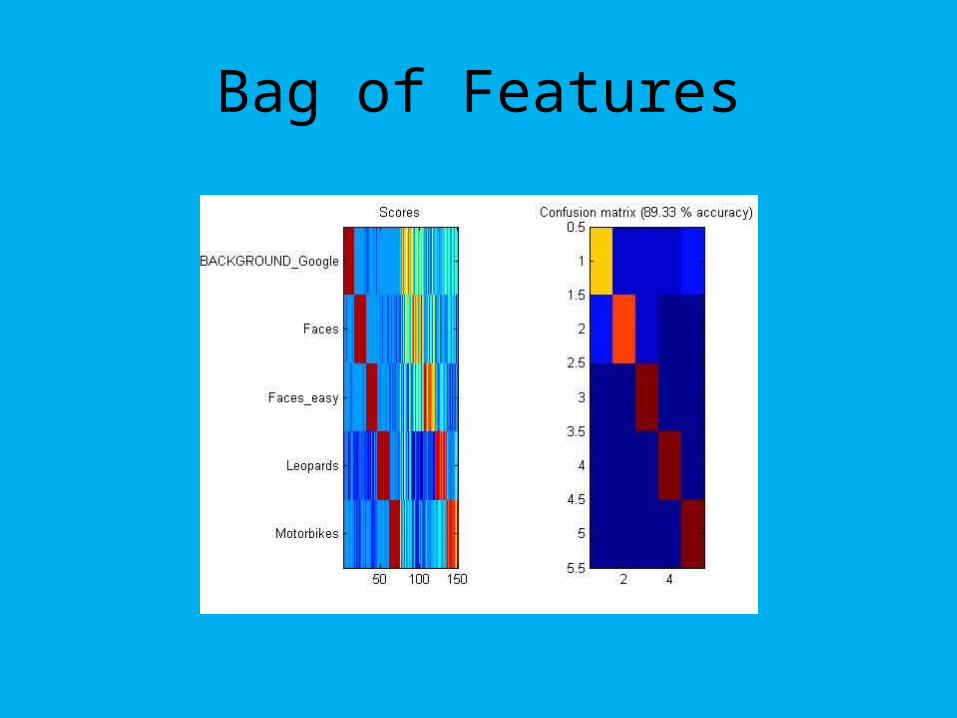
Bag of Features
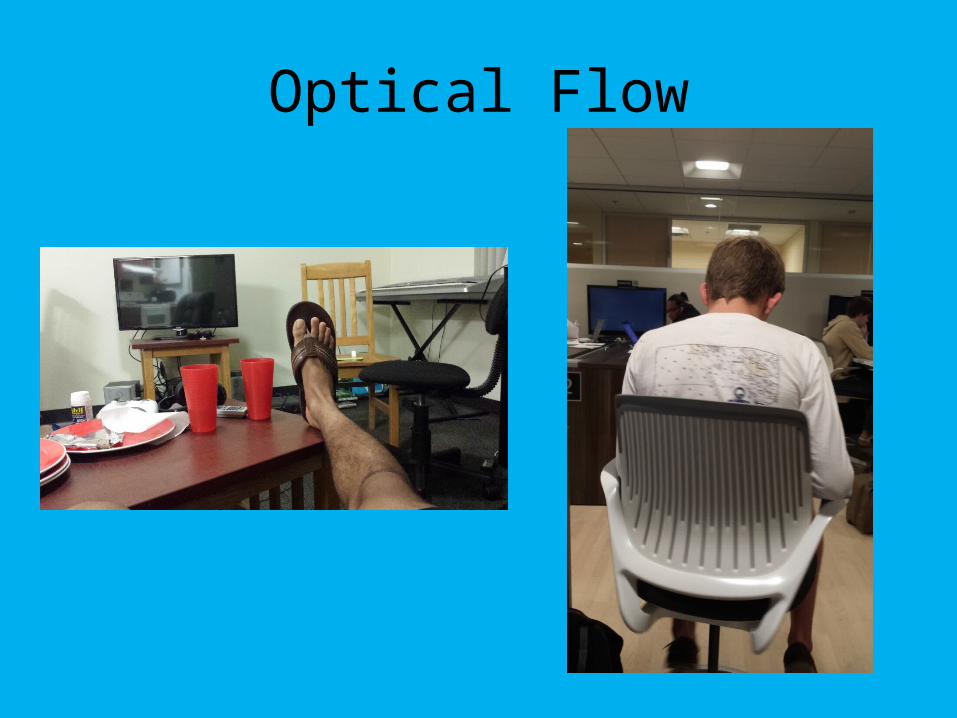
Optical Flow
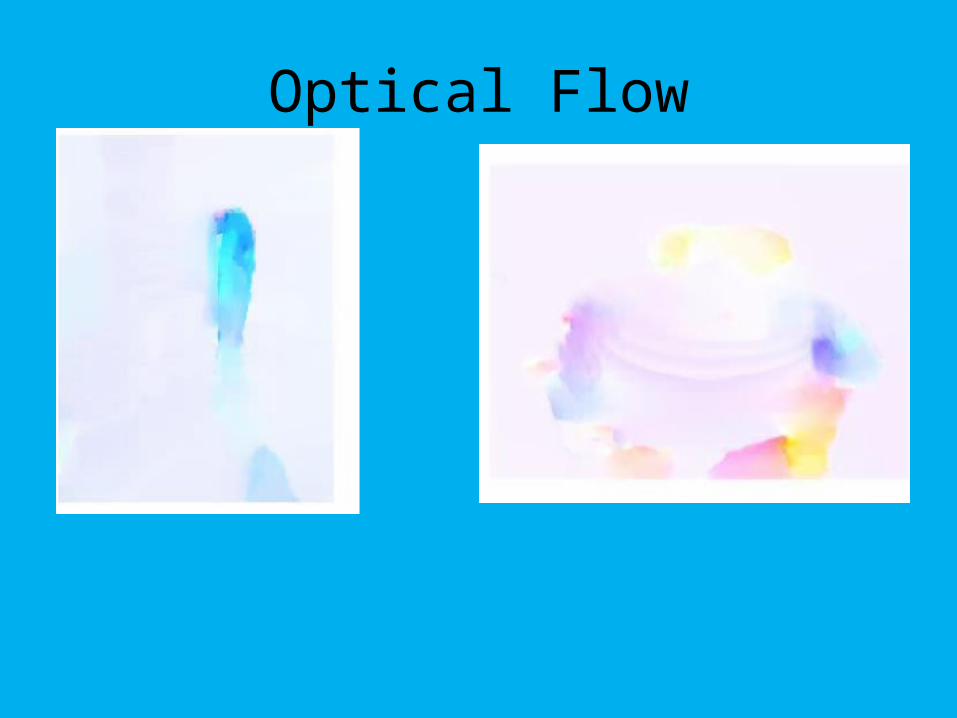
Optical Flow
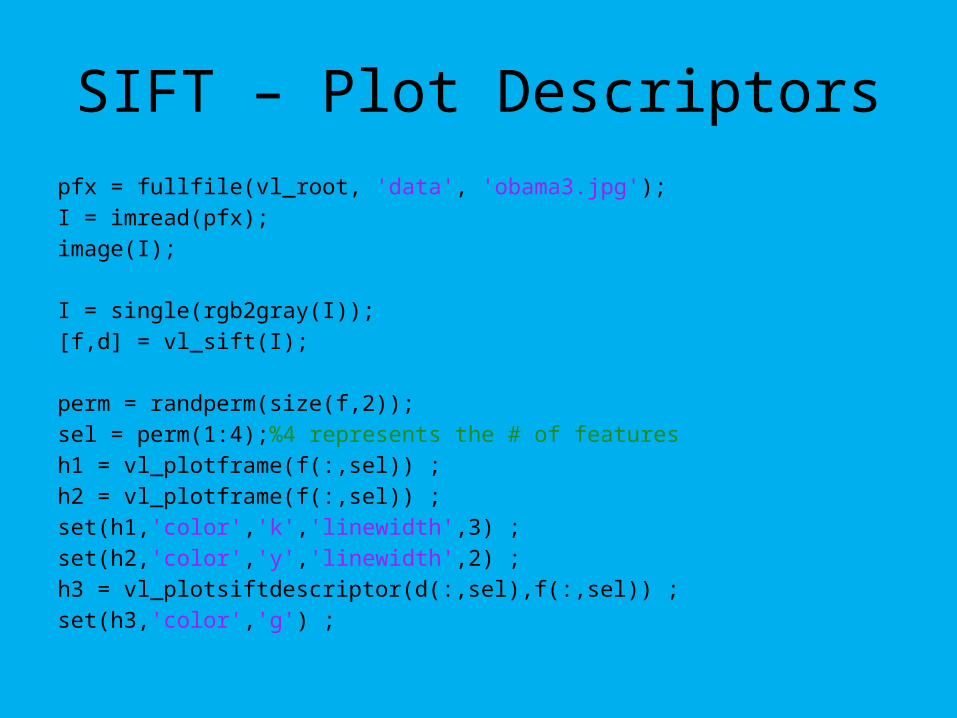
SIFT – Plot Descriptorspfx = fullfile(vl_root, 'data', 'obama3.jpg');I = imread(pfx);image(I); I = single(rgb2gray(I));[f,d] = vl_sift(I); perm = randperm(size(f,2));sel = perm(1:4);%4 represents the # of featuresh1 = vl_plotframe(f(:,sel)) ;h2 = vl_plotframe(f(:,sel)) ;set(h1,'color','k','linewidth',3) ;set(h2,'color','y','linewidth',2) ;h3 = vl_plotsiftdescriptor(d(:,sel),f(:,sel)) ;set(h3,'color','g') ;
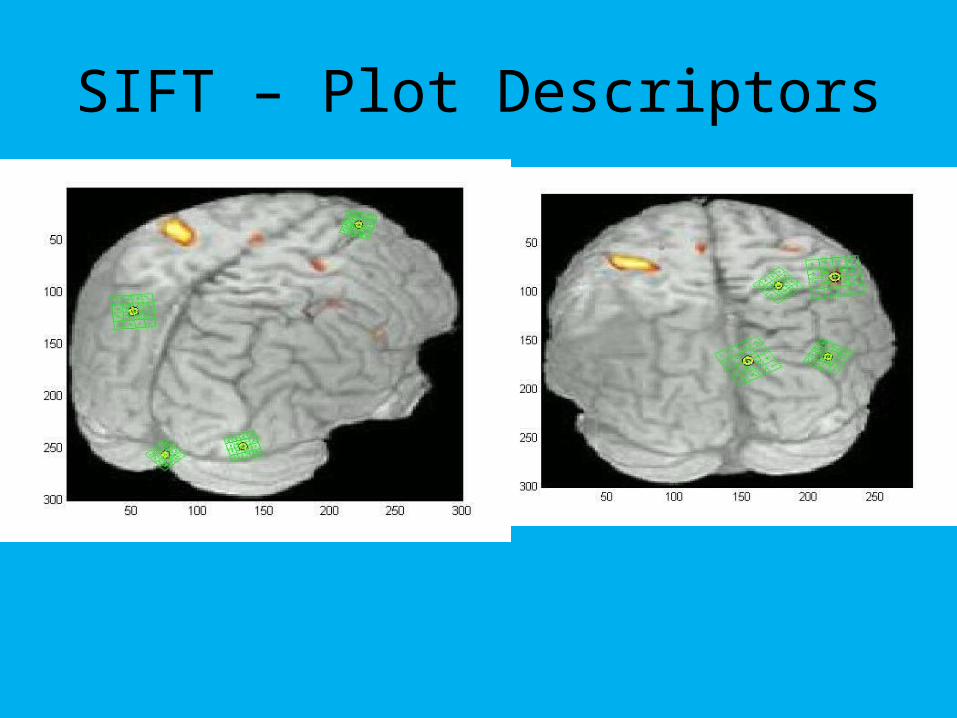
SIFT – Plot Descriptors
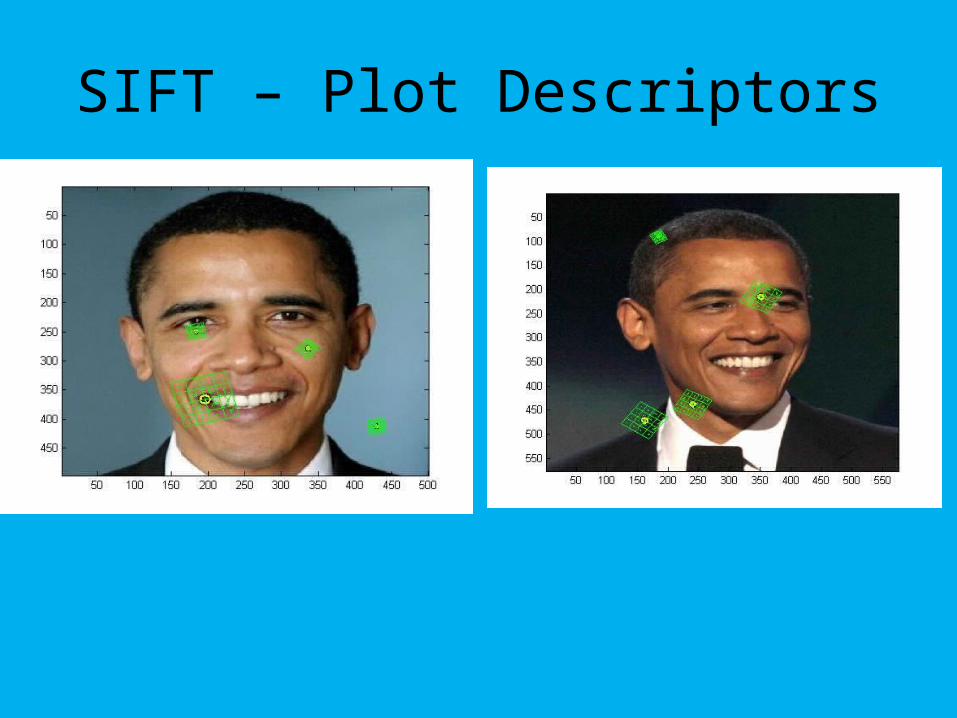
SIFT – Plot Descriptors
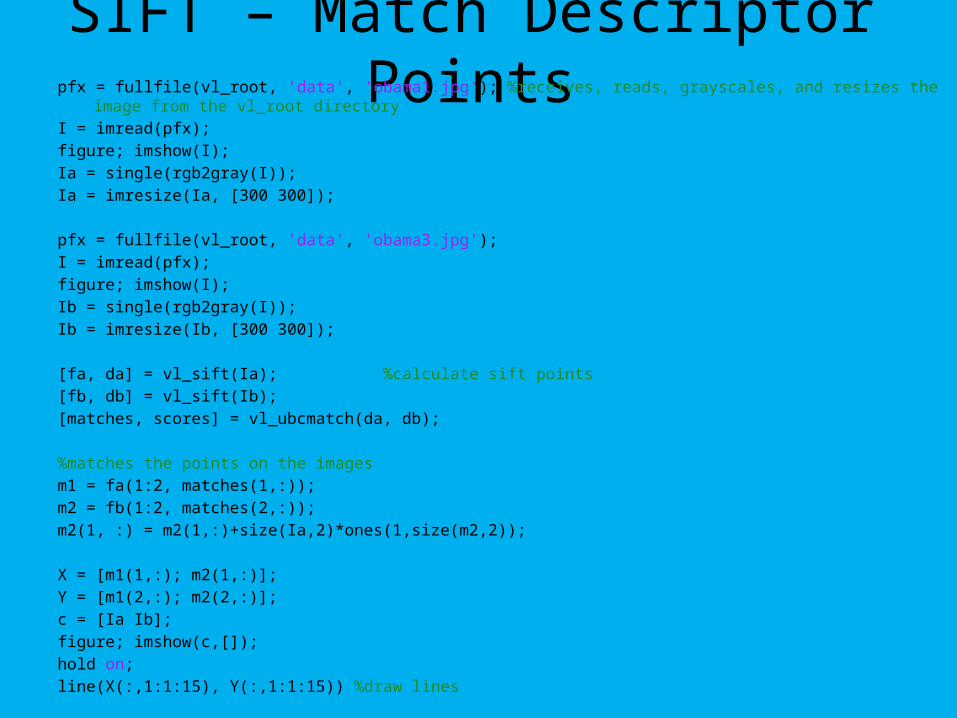
SIFT – Match Descriptor Pointspfx = fullfile(vl_root, 'data', 'obama1.jpg'); %receives, reads, grayscales, and resizes the
image from the vl_root directoryI = imread(pfx);figure; imshow(I);Ia = single(rgb2gray(I));Ia = imresize(Ia, [300 300]); pfx = fullfile(vl_root, 'data', 'obama3.jpg');I = imread(pfx);figure; imshow(I);Ib = single(rgb2gray(I));Ib = imresize(Ib, [300 300]); [fa, da] = vl_sift(Ia); %calculate sift points[fb, db] = vl_sift(Ib);[matches, scores] = vl_ubcmatch(da, db); %matches the points on the imagesm1 = fa(1:2, matches(1,:));m2 = fb(1:2, matches(2,:));m2(1, :) = m2(1,:)+size(Ia,2)*ones(1,size(m2,2)); X = [m1(1,:); m2(1,:)];Y = [m1(2,:); m2(2,:)];c = [Ia Ib];figure; imshow(c,[]);hold on;line(X(:,1:1:15), Y(:,1:1:15)) %draw lines
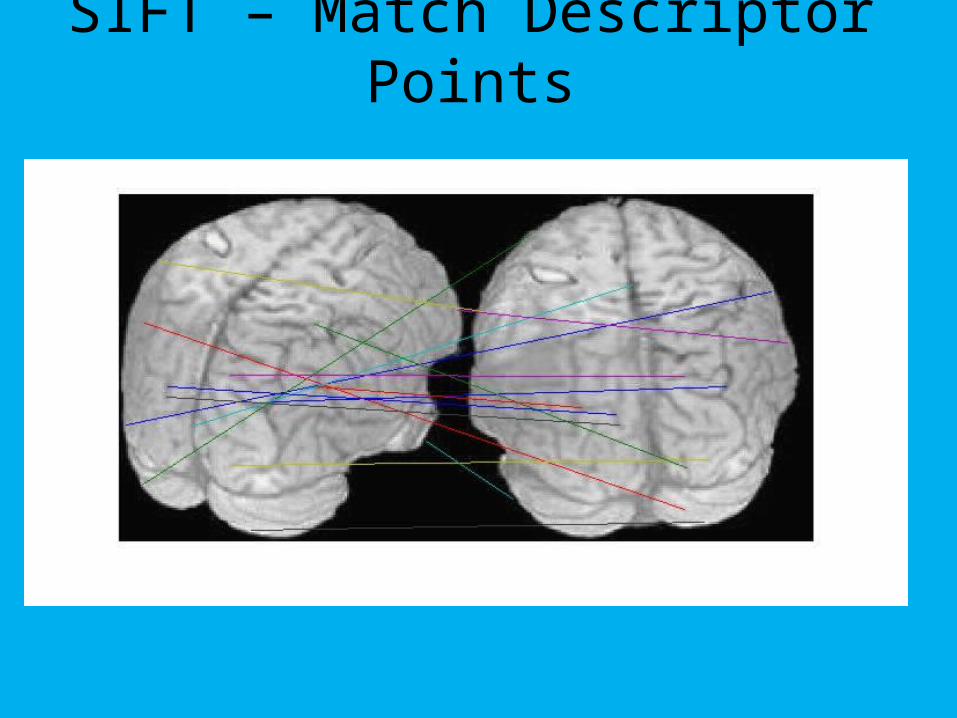
SIFT – Match Descriptor Points
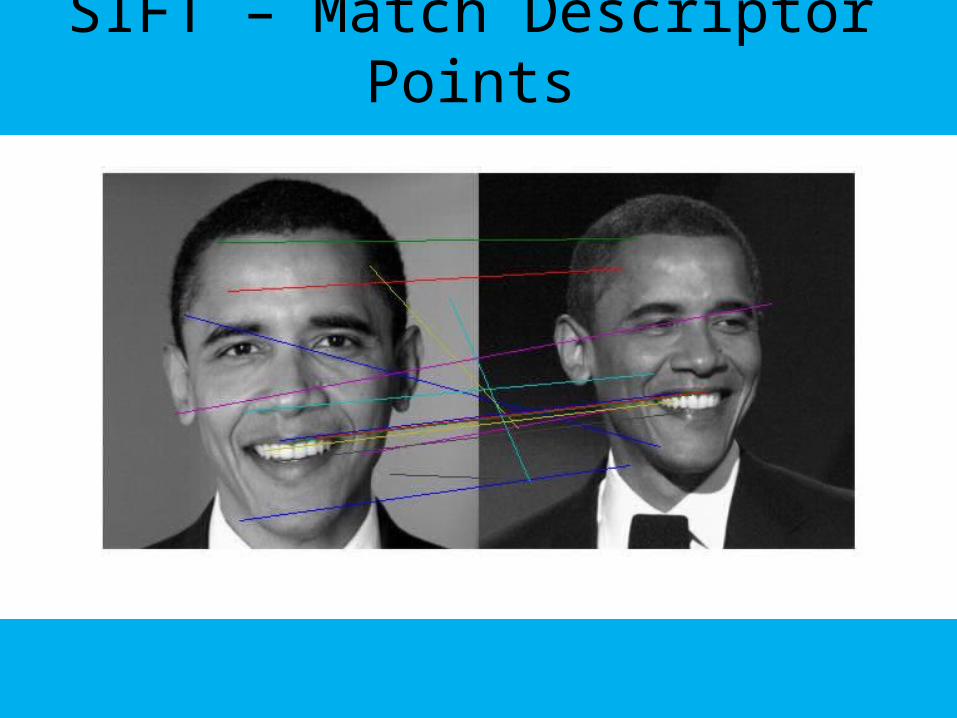
SIFT – Match Descriptor Points