Embed Size (px)
Citation preview
Investigative Ophthalmology & Visual Science, Vol. 33, No. 1, January 1992Copyright © Association for Research in Vision and Ophthalmology
A Photographic Technique for Measuring Horizontaland Vertical Eye Alignment Throughout
the Field of GazeMichael W. QuickC and Ronald G. Boofhe*t$
We present a photographic method based upon corneal light reflections for the measurement of binocu-lar misalignment. Our procedures allow for the measurement of eye alignment errors to fixation targetspresented at any distance throughout the subject's field of gaze, and allow for the measurement oferrors in the horizontal and vertical directions. Furthermore, estimates of the alignment state can bemade simultaneously from both eyes while fixation targets are presented monocularly or binocularly.This photographic method represents an enhancement of typical clinical prism and cover methodsbecause: (1) it can provide extensive information efficiently about patterns of misalignment across alarge number of fixation locations; (2) it also can provide information about the scatter in addition to themagnitude of convergence error; and (3) it can be easily applied to noncooperative subjects such as
. animals and young children. Furthermore, the procedure requires relatively inexpensive equipment andtechnical expertise that are readily available in most clinical or animal research laboratory settings.The method is validated by comparing the results obtained photographically to standard prism andcover assessments of macaque monkeys with strabismus. This comparison demonstrates that resultsobtained by the two methods are in good agreement and that the degree of accuracy is similar for thetwo methods. An estimate of the angle of deviation based on 10 photographs has a 95% confidenceinterval of about two degrees. Invest Ophthalmol Vis Sci 33:234-246,1992
The ability to accurately and quantitatively assessthe pattern of ocular misalignment is an importantstep in the process of diagnosing and understandingthe causes of strabismus. Three common methods areused to assess eye alignment. The primary methodstypically used in the clinical setting involve some ver-sion of prism and cover tests.1'2 An advantage of usingthese tests is that they can be performed quickly andinexpensively. A disadvantage is that they require ex-tended cooperation of the subject, which can be diffi-cult to obtain in young children or animals. Thesemethods are too cumbersome and inefficient to easilypermit a quantitative assessment of the misalignmentstate at more than a couple of fixation target locations(typically a "near" and a "distant" target in the pri-mary position of gaze).
A second set of methods, which has been used pri-marily in eye movement research laboratory settings,
From the *Department of Psychology, f Department of Ophthal-mology, and the JYerkes Regional Primate Research Center,Emory University, Atlanta, Georgia.
Supported in part by NIH grants EY-05975 to R. G. Boothe andRR-00165 to the Yerkes Regional Primate Research Center.
Submitted for publication: November 21,1990; accepted August14, 1991.
Reprint requests: Ronald G. Boothe, Yerkes'Regional PrimateResearch Center, Emory University, Atlanta, GA 30322.
relies on the use of magnetic eye coils3 or eye trackingdevices.45 These methods can provide an extremelyaccurate measure of the eye alignment state in addi-tion to providing dynamic measures of eye move-ments. A disadvantage of these procedures is theircost in terms of expensive equipment or technical ex-pertise necessary for implementation, calibration,and maintenance. The equipment and technical per-sonnel can be justified in an eye movement researchlaboratory, but are not generally available in otherresearch or clinical settings where the primary objec-tive is to obtain a quantitative assessment of binoculareye alignment.
A third procedure, called the Hirschberg test, issometimes used in clinical settings for the assessmentof strabismus, particularly in noncooperative pa-tients.12 The clinician assesses misalignment of theeyes based upon the reflections off the corneas of asmall point source of light. Historically, much confu-sion has surrounded the theoretical rationale andproper usage of this method for obtaining quantita-tive estimates of misalignment. However, explicit geo-metric models that quantify this procedure have beendeveloped and verified.6'7
We recently extended the geometrical model of theHirschberg test derived by Brodie7 and demonstratedthat the method of using corneal light reflections can
234
Downloaded From: https://iovs.arvojournals.org/pdfaccess.ashx?url=/data/journals/iovs/933163/ on 09/07/2018
No. 1 MEASURING BINOCULAR ALIGNMENT / Quick and Doorhe 235
be used to obtain information about the absolutemagnitude of misalignment in addition to the mea-sures of relative misalignment that he described.8 Spe-cifically, we demonstrated that by combining cornealreflex information with estimates of the location ofthe centers of rotation of the eyes, equations for thevisual axes of the two eyes can be specified. Then it ispossible to determine the magnitude of horizontalalignment error of the visual axes from any fixationtarget in the observer's horizontal field of gaze. Thefinal product of our extended model was a definitionof three error terms that specify the discrepancy be-tween the location of the fixation target and (1) thenearest approach of the visual axis for the left eye(Left_Error); (2) the nearest approach of the visualaxis for the right eye (Right Error); and (3) the loca-tion where the visual axes cross (Cross Error).
Our previous model dealt only with eye alignmenterrors in the horizontal direction along the horizontalfield of gaze. In this report, we extend our model intwo ways. First, our model now allows eye positionerrors to be determined in the vertical as well as hori-zontal directions. Second, we are able to make theseassessments in upper and lower gaze in addition to thehorizontal meridian. Examples of misalignment pat-terns now distinguishable but not assessable with ourprevious methods include errors in vertical align-ment, such as dissociated vertical deviations, andchanges in horizontal deviations with changes in ver-tical gaze, such as A and V patterns.
There are a number of general advantages to ourmethodology.
1. It is inexpensive, requiring only items that are rou-tinely available in most clinical or animal researchsettings.
2. It requires minimal technical expertise to set up,calibrate, and use.
3. It can be used with nonverbal subjects, includingyoung children and animals.
4. A quantitative estimate of the alignment state at aparticular target location can be obtained from asingle momentary fixation even without extendedcooperation from the subject.
5. Because of this increased efficiency, detailed infor-mation about fixation scatter during repeated testsat the same location and about patterns of mis-alignment to targets at a number of locationsthroughout the subject's field of gaze can be ob-tained.
Macaque monkeys were used as subjects to validatethe method. However, our methods could be easilyapplied to other subject populations, including hu-man children, in research laboratory or clinical set-tings.
Materials and Methods
Subjects
Nine Macaque monkeys (Macaca nemestrina)were used as subjects to validate the current model.These included two normal control monkeys andseven monkeys diagnosed by prism and cover test con-ducted during an ophthalmological examination ashaving some type of eye misalignment. All proce-dures with the monkey subjects were performed instrict compliance with the ARVO Resolution on theUse of Animals in Research.
Assumptions of the Three Dimensional Model
In our two-dimensional model,8 the shape of theeye was approximated as the union of two spheres, theglobe of the eye, and the cornea. Specifically, we as-sumed that a slice through the eye in the horizontalplane that passes through the center of the pupilwould be adequately described as the union of twocircles. Based on these assumptions, the model'sequations predicted the amount of rotation in the eyein the horizontal plane, independent of the shape ofthe surface in any other plane. All of the points neces-sary for the analysis, such as the centers of rotation ofthe eyes, the corneal centers of curvature, and the fix-ation targets, were assumed to be in this one opticalplane. In three dimensions, this situation becomesmore complicated because some of the necessarypoints fall outside of one plane.
In our three dimensional model, we have switchedfrom a spherical to a toric surface to represent thecornea. We specify the radii of curvature of this sur-face in the vertical and horizontal planes, based onkeratometry measurements obtained during an oph-thalmological examination. Our approximation ofcorneal shape ignores other meridional variations andhigher order aberrations. Another change from ourprevious two-dimensional model is that we use theline of sight to specify the axis for target fixation in-stead of the visual axis.9 This change makes no essen-tial difference in the predictions of the model and hasthe advantage of allowing us to simplify some of therequired calculations. We have retained from the two-dimensional model the assumptions that the eye ro-tates about its geometrical center of rotation and thatthe optical axis is coincident with the pupillary axis.8
The Model Eye.
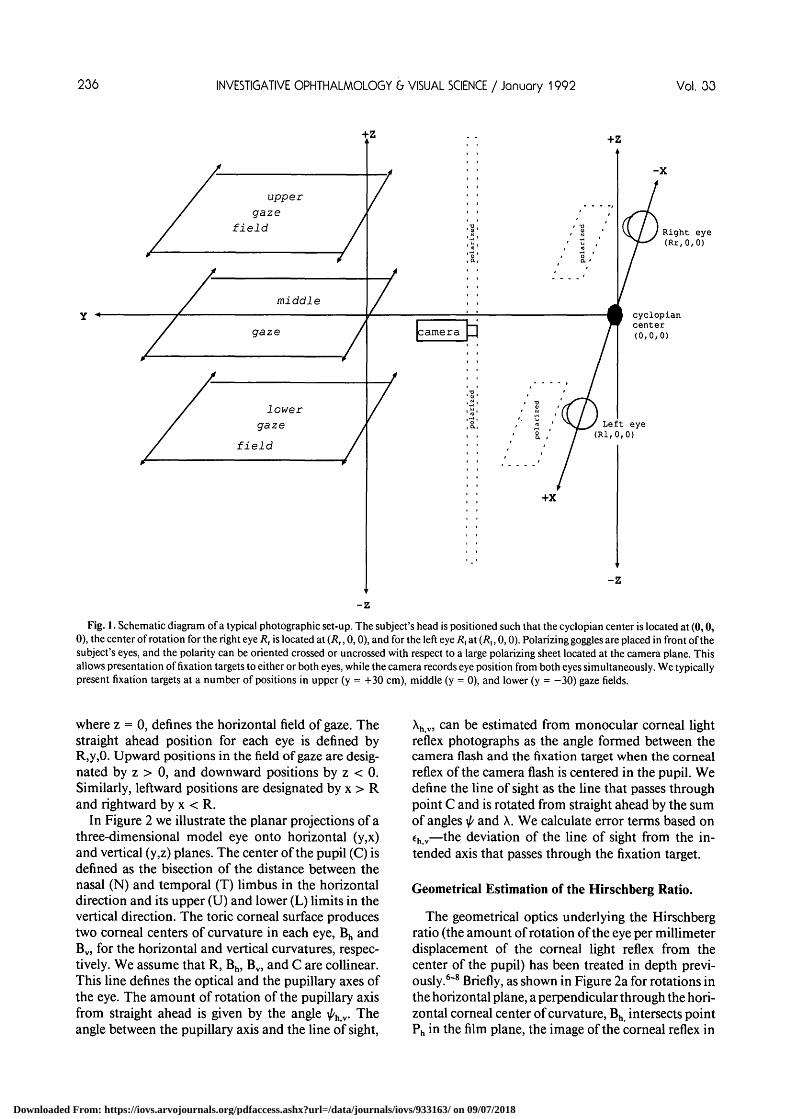
We specify locations in a Cartesian coordinate sys-tem, where the x,y,z position corresponding to 0,0,0 islocated at the cyclopian center (Fig. 1). The x axispasses through the cyclopian center and through thecenter of rotation of each eye (R|r). The x,y plane,
Downloaded From: https://iovs.arvojournals.org/pdfaccess.ashx?url=/data/journals/iovs/933163/ on 09/07/2018
236 INVESTIGATIVE OPHTHALMOLOGY 6 VISUAL SCIENCE / January 1992 Vol. 33
/ upper/ 9aze >/ field /
//
/ middle
// gaze /
/ /
/ lower/ gaze >
/ field // w
•Z
4
/
t
/
/
camera
polarized
• polarized
| |
;
I
polarized
+x
Right eye(Rr,0,0)
- Z
-zFig. 1. Schematic diagram of a typical photographic set-up. The subject's head is positioned such that the cyclopian center is located at (0,0,
0), the center of rotation for the right eye RT is located at (Rr, 0,0), and for the left eye /?, at (/?,, 0,0). Polarizing goggles are placed in front of thesubject's eyes, and the polarity can be oriented crossed or uncrossed with respect to a large polarizing sheet located at the camera plane. Thisallows presentation of fixation targets to either or both eyes, while the camera records eye position from both eyes simultaneously. We typicallypresent fixation targets at a number of positions in upper (y = +30 cm), middle (y = 0), and lower (y = -30) gaze fields.
where z = 0, defines the horizontal field of gaze. Thestraight ahead position for each eye is defined byR,y,0. Upward positions in the field of gaze are desig-nated by z > 0, and downward positions by z < 0.Similarly, leftward positions are designated by x > Rand rightward by x < R.
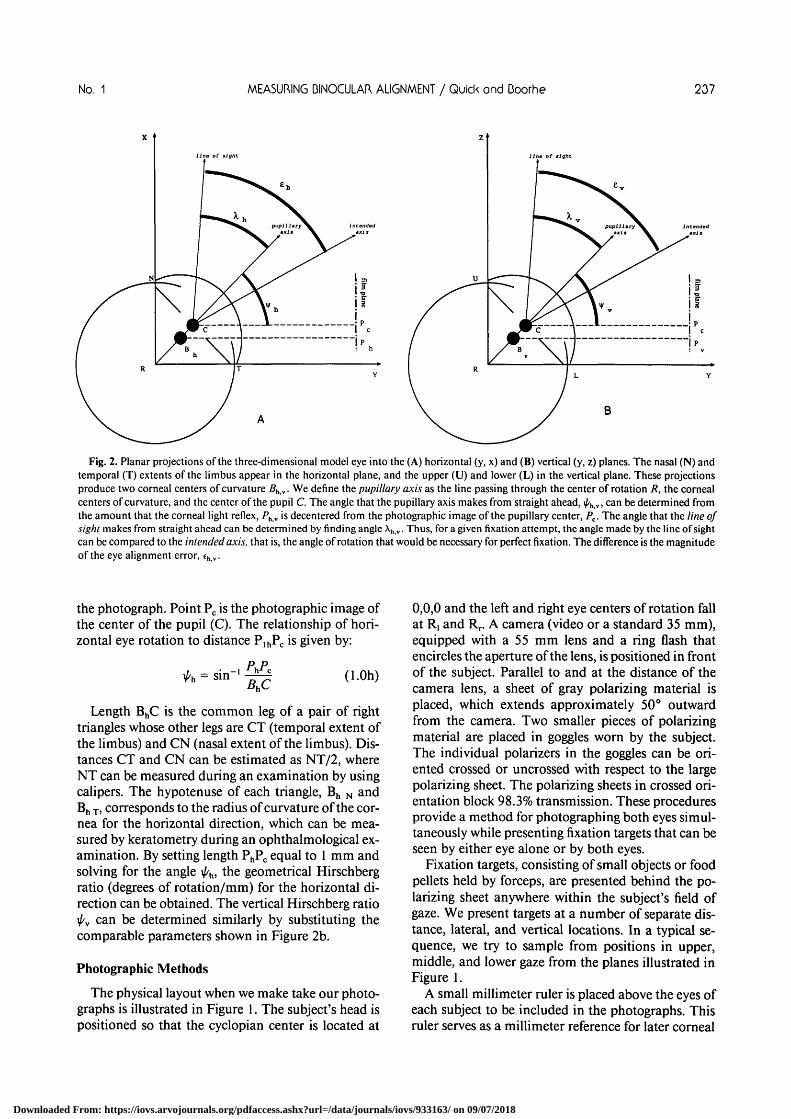
In Figure 2 we illustrate the planar projections of athree-dimensional model eye onto horizontal (y,x)and vertical (y,z) planes. The center of the pupil (C) isdefined as the bisection of the distance between thenasal (N) and temporal (T) limbus in the horizontaldirection and its upper (U) and lower (L) limits in thevertical direction. The toric corneal surface producestwo corneal centers of curvature in each eye, Bh andBv, for the horizontal and vertical curvatures, respec-tively. We assume that R, Bh, Bv5 and C are collinear.This line defines the optical and the pupillary axes ofthe eye. The amount of rotation of the pupillary axisfrom straight ahead is given by the angle ^h v. Theangle between the pupillary axis and the line of sight,
Xh v, can be estimated from monocular corneal lightreflex photographs as the angle formed between thecamera flash and the fixation target when the cornealreflex of the camera flash is centered in the pupil. Wedefine the line of sight as the line that passes throughpoint C and is rotated from straight ahead by the sumof angles \p and X. We calculate error terms based onth v—the deviation of the line of sight from the in-tended axis that passes through the fixation target.
Geometrical Estimation of the Hirschberg Ratio.
The geometrical optics underlying the Hirschbergratio (the amount of rotation of the eye per millimeterdisplacement of the corneal light reflex from thecenter of the pupil) has been treated in depth previ-ously.6"8 Briefly, as shown in Figure 2a for rotations inthe horizontal plane, a perpendicular through the hori-zontal corneal center of curvature, Bh intersects pointPh in the film plane, the image of the corneal reflex in
Downloaded From: https://iovs.arvojournals.org/pdfaccess.ashx?url=/data/journals/iovs/933163/ on 09/07/2018
No. 1 MEASURING BINOCULAR ALIGNMENT / Quick and Doorhe 207
line at sigh
Fig. 2. Planar projections of the three-dimensional model eye into the (A) horizontal (y, x) and (B) vertical (y, z) planes. The nasal (N) andtemporal (T) extents of the limbus appear in the horizontal plane, and the upper (U) and lower (L) in the vertical plane. These projectionsproduce two corneal centers of curvature Bh v. We define the pupillary axis as the line passing through the center of rotation R, the cornealcenters of curvature, and the center of the pupil C. The angle that the pupillary axis makes from straight ahead, ^hv, can be determined fromthe amount that the corneal light reflex, Phv is decentered from the photographic image of the pupillary center, Pc. The angle that the line ofsight makes from straight ahead can be determined by finding angle Xh v. Thus, for a given fixation attempt, the angle made by the line of sightcan be compared to the intended axis, that is, the angle of rotation that would be necessary for perfect fixation. The difference is the magnitudeof the eye alignment error, ehv.
the photograph. Point Pc is the photographic image ofthe center of the pupil (C). The relationship of hori-zontal eye rotation to distance PihPc is given by:
= sin (l.Oh)
Length BhC is the common leg of a pair of righttriangles whose other legs are CT (temporal extent ofthe limbus) and CN (nasal extent of the limbus). Dis-tances CT and CN can be estimated as NT/2, whereNT can be measured during an examination by usingcalipers. The hypotenuse of each triangle, Bh N andBh T, corresponds to the radius of curvature of the cor-nea for the horizontal direction, which can be mea-sured by keratometry during an ophthalmological ex-amination. By setting length PhPc equal to 1 mm andsolving for the angle \(/h, the geometrical Hirschbergratio (degrees of rotation/mm) for the horizontal di-rection can be obtained. The vertical Hirschberg ratioi/'v can be determined similarly by substituting thecomparable parameters shown in Figure 2b.
Photographic Methods
The physical layout when we make take our photo-graphs is illustrated in Figure 1. The subject's head ispositioned so that the cyclopian center is located at
0,0,0 and the left and right eye centers of rotation fallat R, and Rr. A camera (video or a standard 35 mm),equipped with a 55 mm lens and a ring flash thatencircles the aperture of the lens, is positioned in frontof the subject. Parallel to and at the distance of thecamera lens, a sheet of gray polarizing material isplaced, which extends approximately 50° outwardfrom the camera. Two smaller pieces of polarizingmaterial are placed in goggles worn by the subject.The individual polarizers in the goggles can be ori-ented crossed or uncrossed with respect to the largepolarizing sheet. The polarizing sheets in crossed ori-entation block 98.3% transmission. These proceduresprovide a method for photographing both eyes simul-taneously while presenting fixation targets that can beseen by either eye alone or by both eyes.
Fixation targets, consisting of small objects or foodpellets held by forceps, are presented behind the po-larizing sheet anywhere within the subject's field ofgaze. We present targets at a number of separate dis-tance, lateral, and vertical locations. In a typical se-quence, we try to sample from positions in upper,middle, and lower gaze from the planes illustrated inFigure 1.
A small millimeter ruler is placed above the eyes ofeach subject to be included in the photographs. Thisruler serves as a millimeter reference for later corneal
Downloaded From: https://iovs.arvojournals.org/pdfaccess.ashx?url=/data/journals/iovs/933163/ on 09/07/2018
238 INVESTIGATIVE OPHTHALMOLOGY 6 VISUAL SCIENCE / Jonuory 1992 Vol. 33
light reflex measurements. Measurement of the cor-neal light reflex images can be done by projectingslides onto a screen if a 35 mm camera is used, or bygrabbing the individual frames which captured theflash into a computerized graphics system if video isused. In either case, the distance of the corneal lightreflex (in both the horizontal and vertical directions)is measured from the center of the pupil. In caseswhere one edge of the limbus is obscured by the lids,its position is estimated by extrapolating from theportion of the limbus that can be seen in the image.
Empirical Estimation of the Hirschberg Ratio
The geometrical model can be validated by measur-ing the Hirschberg ratio empirically.7-8. Monocular vi-sion is induced by putting an occluder in the gogglesor by using an occluder contact lens. Photographs arethen taken while the subject views fixation targets atknown eccentricities to each side of the camera forhorizontal Hirschberg ratio measurements and aboveand below the camera for vertical measurements.From the photographs taken at each fixation angle,the amount of displacement of the corneal light reflexfrom the center of the pupil is measured, and plots ofthe fixation target angles (in degrees) versus the reflexdisplacements (in mm) for the horizontal and verticaldirections are made. Straight lines can be fit to thesedata sets, and slopes of these lines yield empirical esti-mates of the horizontal and vertical Hirschberg ratios.Similarly, the displacement of the corneal light reflexfrom the pupillary center when the subject is inducedto fixate the camera directly is an estimate of angle X.
Once the Hirschberg ratio and angle X have beendetermined for each eye using the methods just de-scribed, presenting fixation targets at known locationsthroughout the visual field and measuring binoculareye alignment errors are possible. We calculate fiveseparate eye alignment error vectors for each fixa-tion target: (1) horizontal Left—Error; (2) verticalLeft—Error; (3) horizontal Right—Error; (4) verticalRight—Error; and (5) Cross—Error. Details abouthow we calculate these error vectors are presented inthe Appendix. Magnitudes of the Left—Error andRight—Error vectors are expressed in degrees of rota-tion of the lines of sight from their intended target.Directions of these vectors are collapsed to a binaryvalue reflecting eso- or exo-deviations in the case ofhorizontal error, and hyper- or hypo-deviations in thecase of vertical error. Magnitude of Cross—Error isexpressed in meter-angles of distance (1/distance inmeters). This error term is derived as the differencebetween two other meter-angle distances: (1) the dis-tance measured in the y direction between the ob-
server plane (y = 0) and the fixation target; and (2) thedistance in the y direction between the observer planeand the point where the vector projections of the linesof sight cross. The direction of Cross—Error is col-lapsed to a binary value that indicates eso- or exo-de-viations.
Results
Geometric Determination of the Hirschberg Ratio
All monkeys in the study were given an ophthalmo-logical examination under general anesthesia by a pe-diatric ophthalmologist to obtain the empirical mea-surements of corneal curvature and limbal radius.These values were used to calculate the predicted val-ues of the Hirschberg ratio based upon Equation 1.0for the horizontal and vertical directions for 8 mon-keys (7 strabismic and 1 normal). The results are pre-sented in Table 1.
The mean Hirschberg ratio across all monkeys was14.0° of rotation per millimeter of corneal light reflexdisplacement for the horizontal direction, whichagrees well with the same measure calculated previ-ously based on our two-dimensional model on asmaller subset of these monkeys (14.1° /mm).8 Forthe vertical Hirschberg ratio, the mean was 14.2° ofrotation per millimeter of corneal light reflex displace-ment. These Hirschberg values, regardless of direc-tion, ranged from 13.0-16.0°/mm. The differencesbetween the horizontal and vertical Hirschberg ratioswithin an individual eye usually were small, averagingabout 6%. However, larger differences were found inindividual cases, demonstrating that it is prudent tocalculate separate horizontal and vertical values if ker-atometry measurements are available. Differences be-tween the two eyes of the same monkey also wereusually small, averaging about 3% in the horizontaland vertical directions. The Hirschberg ratios ob-tained for the normal monkey were not significantlydifferent from those of the monkeys with strabismus.
Empirical Determination of the Hirschberg Ratio
The results from an empirical estimation of the hori-zontal and vertical Hirschberg ratios, based uponphotographs taken while the monkeys were inducedto take up monocular fixation at known eccentricitieshorizontally and vertically, are shown in Table 1. Weplotted the fixation target angle versus the displace-ment of the corneal light reflex from the pupillarycenter and used linear regression to fit these datapoints with a straight line. In all cases, the goodness offit of the data points to a straight line was over 90% forthe horizontal and vertical directions. This indicatesthat, for the range of target eccentricities used (80°), asingle value for the horizontal Hirschberg ratio and asingle value for the vertical Hirschberg ratio are ap-
Downloaded From: https://iovs.arvojournals.org/pdfaccess.ashx?url=/data/journals/iovs/933163/ on 09/07/2018
No. 1 MEASURING BINOCULAR ALIGNMENT / Quick ond Doorhe 239
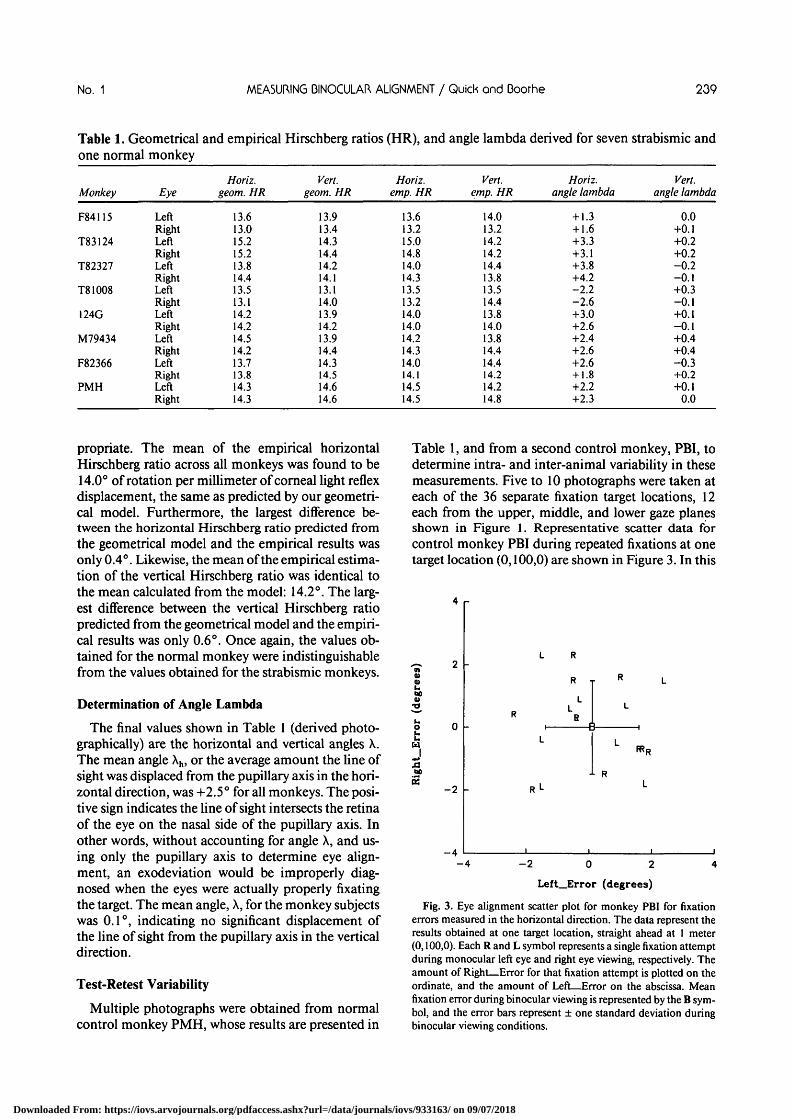
Table 1. Geometrical and empirical Hirschberg ratios (HR), and angle lambda derived for seven strabismic andone normal monkey
Monkey
F84115
T83124
T82327
T81008
I24G
M79434
F82366
PMH
Eye
LeftRightLeftRightLeftRightLeftRightLeftRightLeftRightLeftRightLeftRight
Horiz.geom. HR
13.613.015.215.213.814.413.513.114.214.214.514.213.713.814.314.3
Vert.geom. HR
13.913.414.314.414.214.113.114.013.914.213.914.414.314.514.614.6
Horiz.emp. HR
13.613.215.014.814.014.313.513.214.014.014.214.314.014.114.514.5
Vert.emp. HR
14.013.214.214.214.413.813.514.413.814.013.814.414.414.214.214.8
Horiz.angle lambda
+ 1.3+ 1.6+3.3+3.1+3.8+4.2-2.2-2.6+3.0+2.6+2.4+2.6+2.6+ 1.8+2.2+2.3
Vert.angle lambda
0.0+0.1+0.2+0.2-0.2-0.1+0.3-0.1+0.1-0.1+0.4+0.4-0.3+0.2+0.1
0.0
propriate. The mean of the empirical horizontalHirschberg ratio across all monkeys was found to be14.0° of rotation per millimeter of corneal light reflexdisplacement, the same as predicted by our geometri-cal model. Furthermore, the largest difference be-tween the horizontal Hirschberg ratio predicted fromthe geometrical model and the empirical results wasonly 0.4°. Likewise, the mean of the empirical estima-tion of the vertical Hirschberg ratio was identical tothe mean calculated from the model: 14.2°. The larg-est difference between the vertical Hirschberg ratiopredicted from the geometrical model and the empiri-cal results was only 0.6°. Once again, the values ob-tained for the normal monkey were indistinguishablefrom the values obtained for the strabismic monkeys.
Determination of Angle Lambda
The final values shown in Table 1 (derived photo-graphically) are the horizontal and vertical angles X.The mean angle Xh, or the average amount the line ofsight was displaced from the pupillary axis in the hori-zontal direction, was +2.5° for all monkeys. The posi-tive sign indicates the line of sight intersects the retinaof the eye on the nasal side of the pupillary axis. Inother words, without accounting for angle X, and us-ing only the pupillary axis to determine eye align-ment, an exodeviation would be improperly diag-nosed when the eyes were actually properly fixatingthe target. The mean angle, X, for the monkey subjectswas 0.1°, indicating no significant displacement ofthe line of sight from the pupillary axis in the verticaldirection.
Test-Retest Variability
Multiple photographs were obtained from normalcontrol monkey PMH, whose results are presented in
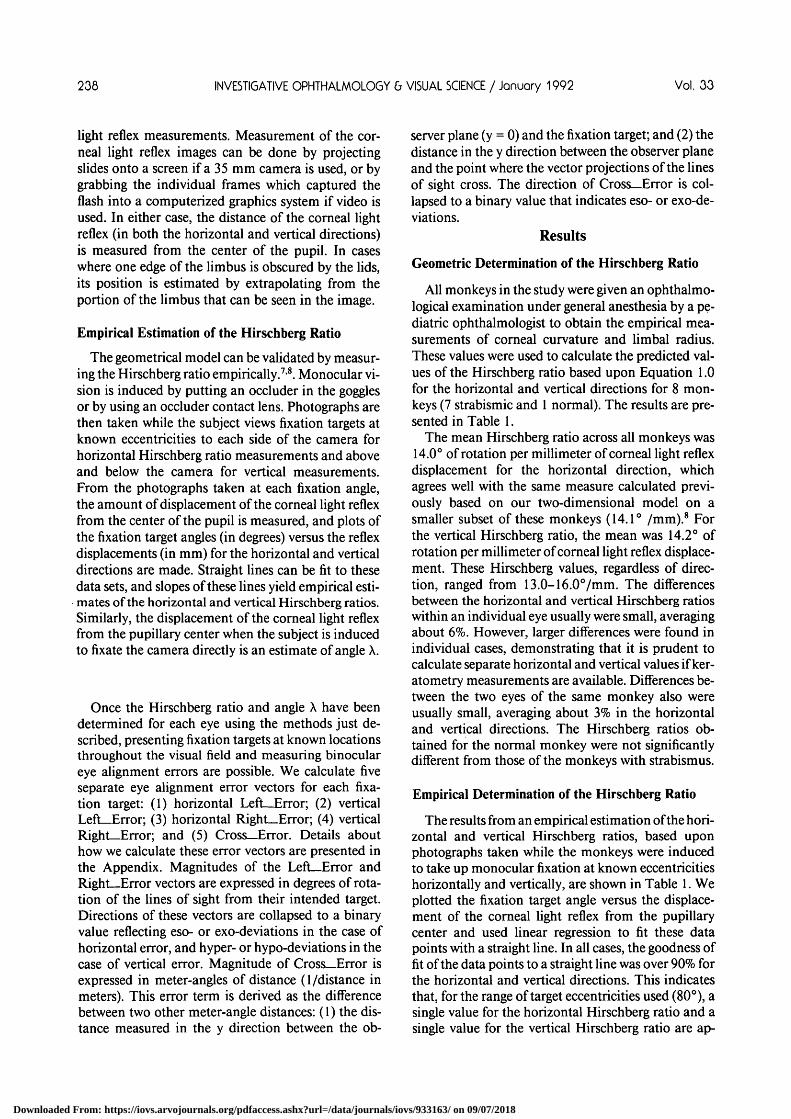
Table 1, and from a second control monkey, PBI, todetermine intra- and inter-animal variability in thesemeasurements. Five to 10 photographs were taken ateach of the 36 separate fixation target locations, 12each from the upper, middle, and lower gaze planesshown in Figure 1. Representative scatter data forcontrol monkey PBI during repeated fixations at onetarget location (0,100,0) are shown in Figure 3. In this
4 r
L R
R T R
L
0)a>60u
T3
- 4
B-B
FRR
•L R
- 4 - 2 0 .2 4
Left_Error (degrees)
Fig. 3. Eye alignment scatter plot for monkey PBI for fixationerrors measured in the horizontal direction. The data represent theresults obtained at one target location, straight ahead at 1 meter(0,100,0). Each R and L symbol represents a single fixation attemptduring monocular left eye and right eye viewing, respectively. Theamount of Right—Error for that fixation attempt is plotted on theordinate, and the amount of Left—Error on the abscissa. Meanfixation error during binocular viewing is represented by the B sym-bol, and the error bars represent ± one standard deviation duringbinocular viewing conditions.
Downloaded From: https://iovs.arvojournals.org/pdfaccess.ashx?url=/data/journals/iovs/933163/ on 09/07/2018
240 INVESTIGATIVE OPHTHALMOLOGY & VISUAL SCIENCE / January 1992 Vol. 33
scatter plot, magnitude of Left—Error in the horizon-tal direction is presented on the abscissa, and magni-tude of Right—Error on the ordinate. Each data pointdepicts the magnitude of horizontal error in the leftand the right eye (regardless of which eye is viewing)during a single fixation attempt. Results from left eyeviewing are shown by the L symbols, and from righteye viewing by the R symbols. Data points from bothviewing (raw data not shown) also overlap with thissame cluster.
We calculated the mean and standard deviations inthe horizontal Left—Error and vertical Right—Errordirections. The mean error for all three viewing con-ditions was near the (0,0) coordinate on the scatterplot, and the standard deviations all had a magnitudeof about 1.5°. In Figure 3 we have superimposed themean and standard deviation values for the binocularviewing condition with the raw data scatter values forleft and right viewing. The data shown in this figureillustrate the results we obtained for all viewing condi-tions for both of our normal monkeys. No significantdifferences were found across any viewing conditionor subset of fixation targets for either monkey. Fur-thermore, there were no significant differences be-tween the two monkeys. Therefore, an average stan-dard deviation was computed across all of the aboveconditions and across both monkeys. The valuesobtained for the standard deviation were 1.5° (forLeft—Error and Right—Error) and 0.29 meter-angles(for Cross—Error). We interpret this to indicate thatour ability to identify an eye position error in mon-keys using the corneal light reflex methodology froma single photograph is limited to errors greater thanapproximately 3° or 0.6 meter-angles. For an esti-mate based on 10 photographs, the 95% confidenceinterval of our mean estimate is about 2°, or 0.4 meterangles.
All of these assessments of trial-to-trial variabilitywere done by having the same person score all of thephotographs. A related question relates to inter-scorervariability when scoring is done by different persons.
To address this question, we took a sample of 20 con-secutive images from one of our videotapes and hadeach image scored independently by two separate indi-viduals. The mean difference between the two scorersin judged eye position was 0.7°.
Validation of the Corneal Light Reflex MethodologyAgainst Traditional Prism and Cover Tests
In Table 2, we compare the corneal light reflex as-sessments of eye alignment to prism and cover assess-ments for the seven strabismic monkeys. The clini-cians who conducted the cover tests were unaware ofthe results of the photographic methods at the timethey made the assessments. Prism and cover estimatesof the misalignment were made at near (approxi-mately 33 cm) and at distance (approximately 2 m). Ajudgment was made at the same time regarding eyepreference for fixation. Photographic measurementsof the deviations were made to targets placed straightahead at 33 cm (0,33,0) and 2.0 meters (0,200,0). Fiveto 10 photographs were taken at each location, andthe result shown is the average. Results from theprism and cover tests were similar to those obtainedby the photographic methods for every case in which acomparison could be made. In two cases, the photo-graphic method produced estimates of the eye align-ment state that could not be obtained by prism andcover because of the uncooperativeness of the mon-keys.
Measuring Patterns of Binocular Alignment Errorsby Photographic Methods.
In this section, we present representative data fromtwo strabismic monkeys to illustrate the types of in-formation that can be revealed routinely using thephotographic methodology. Our first example is adata set taken from monkey F84115. Clinical evalua-tion by a pediatric ophthalmologist using standardprism and cover tests diagnosed this monkey as hav-
Table 2. Comparison of the photographic results to the results obtained by prism and cover testing of sevenesotropic monkeys
Monkey
F84115T83124T82327T81008124GM79434F82366
Near
15°10°15°10°
15° to 20°10°to 15°10°to 15°
Prism and cover assessment
Distance
0°*
3 to 5°*
15° to 20°10°to 15°10° to 15°
Eye
LeftAlternatingRightStrong rightAlternatingAlternatingAlternating
Near
15°12°18°14°17°11°13°
Photographic assessment
Distance
0°3°5°0°
18°11°14°
Eye
AlternatingAlternatingRightStrong rightAlternatingAlternatingAlternating
* Unable to obtain accurate measurement.
Downloaded From: https://iovs.arvojournals.org/pdfaccess.ashx?url=/data/journals/iovs/933163/ on 09/07/2018
No. 1 MEASURING BINOCULAR ALIGNMENT / Quick and Doorhe 241
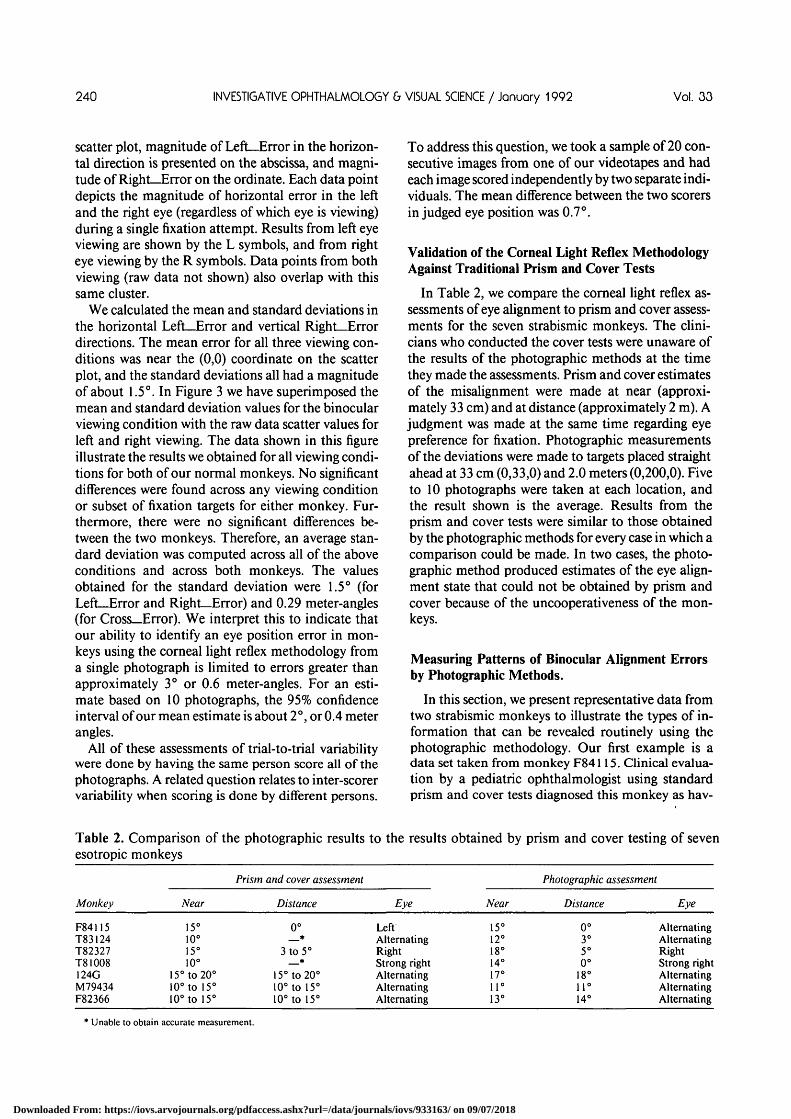
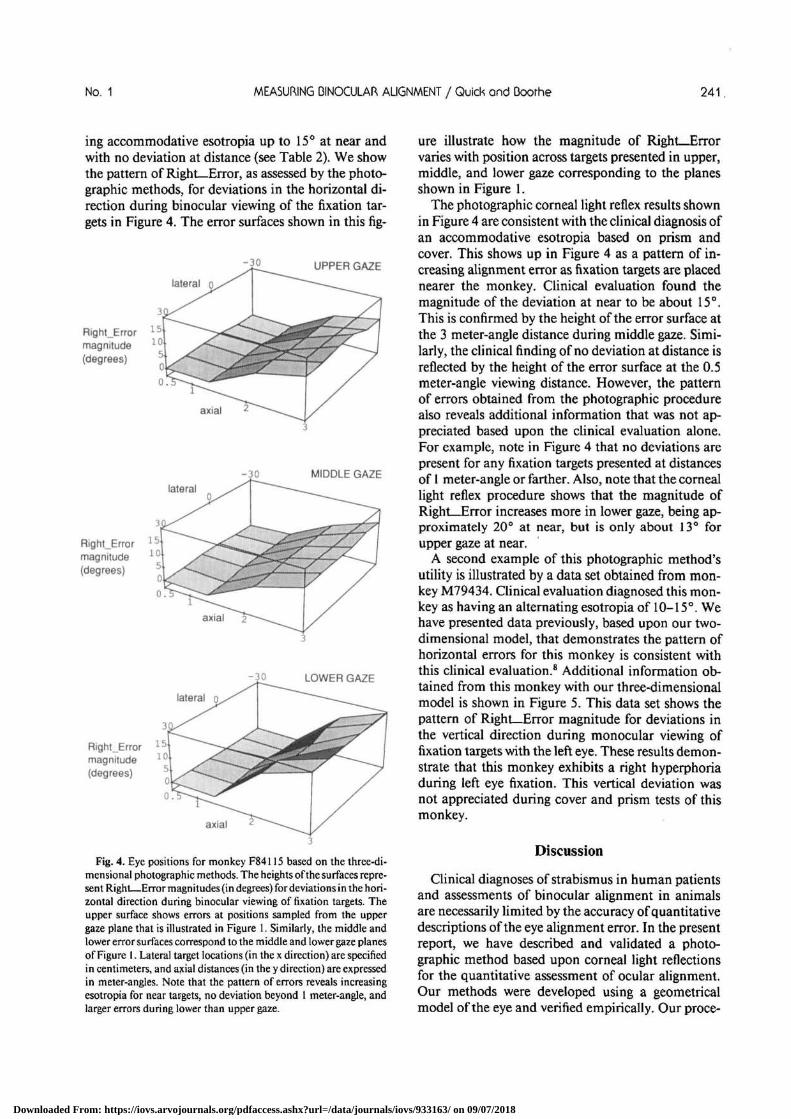
ing accommodative esotropia up to 15° at near andwith no deviation at distance (see Table 2). We showthe pattern of Right—Error, as assessed by the photo-graphic methods, for deviations in the horizontal di-rection during binocular viewing of the fixation tar-gets in Figure 4. The error surfaces shown in this fig-
- 30 UPPER GAZE
lateral o
Right_Errormagnitude(degrees)
axial
- 3 0 MIDDLE GAZElateral
RightErrormagnitude(degrees)
axial
- 3 0 LOWER GAZE
lateral o
Right_Errormagnitude(degrees)
0.
axial
Fig. 4. Eye positions for monkey F84115 based on the three-di-mensional photographic methods. The heights of the surfaces repre-sent Right—Error magnitudes (in degrees) for deviations in the hori-zontal direction during binocular viewing of fixation targets. Theupper surface shows errors at positions sampled from the uppergaze plane that is illustrated in Figure 1. Similarly, the middle andlower error surfaces correspond to the middle and lower gaze planesof Figure I. Lateral target locations (in the x direction) are specifiedin centimeters, and axial distances (in the y direction) are expressedin meter-angles. Note that the pattern of errors reveals increasingesotropia for near targets, no deviation beyond 1 meter-angle, andlarger errors during lower than upper gaze.
ure illustrate how the magnitude of Right—Errorvaries with position across targets presented in upper,middle, and lower gaze corresponding to the planesshown in Figure 1.
The photographic corneal light reflex results shownin Figure 4 are consistent with the clinical diagnosis ofan accommodative esotropia based on prism andcover. This shows up in Figure 4 as a pattern of in-creasing alignment error as fixation targets are placednearer the monkey. Clinical evaluation found themagnitude of the deviation at near to be about 15°.This is confirmed by the height of the error surface atthe 3 meter-angle distance during middle gaze. Simi-larly, the clinical finding of no deviation at distance isreflected by the height of the error surface at the 0.5meter-angle viewing distance. However, the patternof errors obtained from the photographic procedurealso reveals additional information that was not ap-preciated based upon the clinical evaluation alone.For example, note in Figure 4 that no deviations arepresent for any fixation targets presented at distancesof 1 meter-angle or farther. Also, note that the corneallight reflex procedure shows that the magnitude ofRigh1_Error increases more in lower gaze, being ap-proximately 20° at near, but is only about 13° forupper gaze at near.
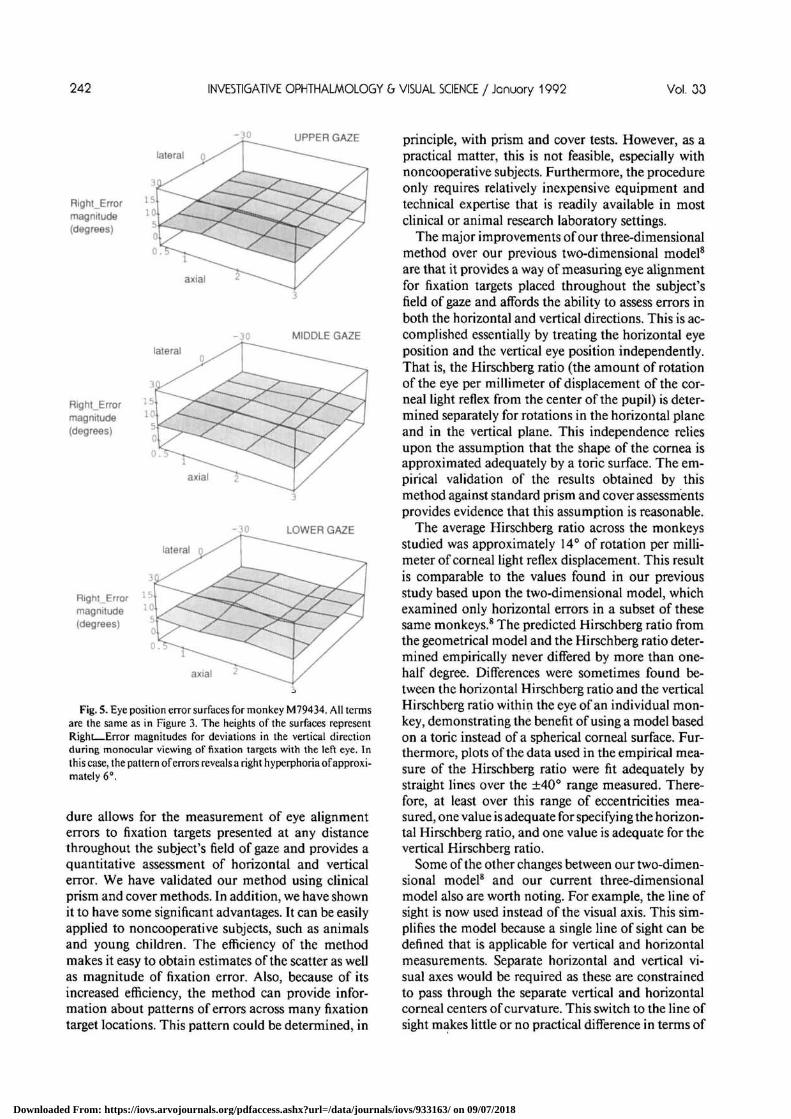
A second example of this photographic method'sutility is illustrated by a data set obtained from mon-key M79434. Clinical evaluation diagnosed this mon-key as having an alternating esotropia of 10-15°. Wehave presented data previously, based upon our two-dimensional model, that demonstrates the pattern ofhorizontal errors for this monkey is consistent withthis clinical evaluation.8 Additional information ob-tained from this monkey with our three-dimensionalmodel is shown in Figure 5. This data set shows thepattern of Right—Error magnitude for deviations inthe vertical direction during monocular viewing offixation targets with the left eye. These results demon-strate that this monkey exhibits a right hyperphoriaduring left eye fixation. This vertical deviation wasnot appreciated during cover and prism tests of thismonkey.
Discussion
Clinical diagnoses of strabismus in human patientsand assessments of binocular alignment in animalsare necessarily limited by the accuracy of quantitativedescriptions of the eye alignment error. In the presentreport, we have described and validated a photo-graphic method based upon corneal light reflectionsfor the quantitative assessment of ocular alignment.Our methods were developed using a geometricalmodel of the eye and verified empirically. Our proce-
Downloaded From: https://iovs.arvojournals.org/pdfaccess.ashx?url=/data/journals/iovs/933163/ on 09/07/2018
242 INVESTIGATIVE OPHTHALMOLOGY & VISUAL SCIENCE / January 1992 Vol. 33
-30 UPPER GAZE
lateral
RightErrormagnitude(degrees)
Right_Errormagnitude(degrees)
Right_Errormagnitude(degrees)
axial
-30 MIDDLE GAZElateral
axial
lateral o
-30 LOWER GAZE
axial
Fig. 5. Eye position error surfaces for monkey M79434. All termsare the same as in Figure 3. The heights of the surfaces representRight Error magnitudes for deviations in the vertical directionduring monocular viewing of fixation targets with the left eye. Inthis case, the pattern of errors reveals a right hyperphoria of approxi-mately 6°.
dure allows for the measurement of eye alignmenterrors to fixation targets presented at any distancethroughout the subject's field of gaze and provides aquantitative assessment of horizontal and verticalerror. We have validated our method using clinicalprism and cover methods. In addition, we have shownit to have some significant advantages. It can be easilyapplied to noncooperative subjects, such as animalsand young children. The efficiency of the methodmakes it easy to obtain estimates of the scatter as wellas magnitude of fixation error. Also, because of itsincreased efficiency, the method can provide infor-mation about patterns of errors across many fixationtarget locations. This pattern could be determined, in
principle, with prism and cover tests. However, as apractical matter, this is not feasible, especially withnoncooperative subjects. Furthermore, the procedureonly requires relatively inexpensive equipment andtechnical expertise that is readily available in mostclinical or animal research laboratory settings.
The major improvements of our three-dimensionalmethod over our previous two-dimensional model8
are that it provides a way of measuring eye alignmentfor fixation targets placed throughout the subject'sfield of gaze and affords the ability to assess errors inboth the horizontal and vertical directions. This is ac-complished essentially by treating the horizontal eyeposition and the vertical eye position independently.That is, the Hirschberg ratio (the amount of rotationof the eye per millimeter of displacement of the cor-neal light reflex from the center of the pupil) is deter-mined separately for rotations in the horizontal planeand in the vertical plane. This independence reliesupon the assumption that the shape of the cornea isapproximated adequately by a toric surface. The em-pirical validation of the results obtained by thismethod against standard prism and cover assessmentsprovides evidence that this assumption is reasonable.
The average Hirschberg ratio across the monkeysstudied was approximately 14° of rotation per milli-meter of corneal light reflex displacement. This resultis comparable to the values found in our previousstudy based upon the two-dimensional model, whichexamined only horizontal errors in a subset of thesesame monkeys.8 The predicted Hirschberg ratio fromthe geometrical model and the Hirschberg ratio deter-mined empirically never differed by more than one-half degree. Differences were sometimes found be-tween the horizontal Hirschberg ratio and the verticalHirschberg ratio within the eye of an individual mon-key, demonstrating the benefit of using a model basedon a toric instead of a spherical corneal surface. Fur-thermore, plots of the data used in the empirical mea-sure of the Hirschberg ratio were fit adequately bystraight lines over the ±40° range measured. There-fore, at least over this range of eccentricities mea-sured, one value is adequate for specifying the horizon-tal Hirschberg ratio, and one value is adequate for thevertical Hirschberg ratio.
Some of the other changes between our two-dimen-sional model8 and our current three-dimensionalmodel also are worth noting. For example, the line ofsight is now used instead of the visual axis. This sim-plifies the model because a single line of sight can bedefined that is applicable for vertical and horizontalmeasurements. Separate horizontal and vertical vi-sual axes would be required as these are constrainedto pass through the separate vertical and horizontalcorneal centers of curvature. This switch to the line ofsight makes little or no practical difference in terms of
Downloaded From: https://iovs.arvojournals.org/pdfaccess.ashx?url=/data/journals/iovs/933163/ on 09/07/2018
No. 1 MEASURING BINOCULAR ALIGNMENT / Quick ond Doorhe 243
the results obtained. The magnitude of the differenceis specified by the angular separation of a line thatpasses from a given point in the visual field throughthe center of the pupil (for the line of sight) comparedto a line that passes from the same point in spacethrough the horizontal or vertical corneal center ofcurvature (for the visual axis). Because the distancebetween the center of the pupil of the eye and thecorneal center of curvature is on the scale of milli-meters, the angle subtended by intersecting lines pass-ing through those two points will be negligible.
The magnitude of Left—Error and Right—Errorerror terms in the horizontal direction depends uponthe interocular distance. Removing this dependencyis possible by restating these error terms into theircyclopian equivalents. We have shown previously8
that
err - tan_, x tan eh
x ± r
where ecc is the magnitude of the deviation in the hori-zontal direction for a cyclopian-centered eye. It canbe derived by knowing the horizontal component ofthe nearest approach of the line of sight, x, the inter-ocular distance, 2r, and the horizontal error magni-tude, eh. LefLError and Right—Error in the verticaldirection, as well as Cross_Error, remain the same fora cyclopian eye. The expression of alignment error interms of these cyclopian values is advantageous inthat it allows our specification of misalignment to berelated directly to Hering's basic law of innervation.10
When specified in relation to a cyclopian eye, ourerror terms reduce to three values corresponding tomagnitude of the error along the horizontal (x), verti-cal (z), and distance (y) axes. Hering argued that thedirection of the discrepancy between the present andthe intended point of sight is grasped by the oculomo-tor system in the form of deviations in three planes,which can be directly related to our three cyclopianerror terms. Hering's basic law of innervation assertsthat elimination of the deviation specified by thesethree error terms is accomplished by the innervationof three corresponding muscle groups.
Our error terms specify the positions of the lines ofsight from the two eyes in three-dimensional spacebut do not provide any direct information about thehoropter, ie, whether or not off-axis targets fall oncorresponding points on the two eyes.1112 A relatedlimitation is that we have no way to measure cycloro-tations of the eyes around the lines of sight. Thus, wehave no way to evaluate deviations from Listing's law.In principle, this information could be incorporatedby using the methods previously described byNakayama.13
Similarly, another limitation of our methods is thatthey provide no information about dynamic proper-
ties of eye movements. We determine only the staticalignment state during target fixation. Some ques-tions about strabismus can be addressed only by mea-suring the dynamic properties. In these cases eye coilor eye tracking methods remain the methods ofchoice for measurements of eye position. However, anumber of important questions about ocular align-ment that arise frequently in clinical or animal re-search laboratory settings can be adequately ad-dressed with our photographic methods.
The scatter plots of our data, as illustrated in Figure3, reveal that trial-to-trial variability in eye positionfor normal monkeys as judged by our methods has astandard deviation of about 1.5°. This limits our abil-ity to detect eye position errors to those larger than acouple of degrees even if we base our estimate of eyeposition on the mean taken from 10 separate photo-graphs. Similar variability probably will be presentwhen these methods are applied to other subject popu-lations, such as human infants. This level of accuracyis roughly comparable to prism and cover tests, but isabout an order of magnitude poorer in resolutionthan magnetic search coil methods or the best eyetracking systems.
An issue that warrants further discussion is whetherthis variability could be reduced to increase the accu-racy of our method. The scatter in our data comesfrom three sources: (1) experimental variability dur-ing data collection; (2) experimental variability dur-ing data scoring; and (3) observer fixation error. Wehave determined that the primary source of error dur-ing data collection relates to uncertainty of head posi-tion at the time the photograph is taken. To illustratethe influence of small fluctuations in head position,note that a head displacement of 1 cm from our fixedcyclopian center will induce approximately 1° of ap-parent error for near target fixation. In the studiesreported in this paper, we did not hold the head rigidlyin place, and we estimate that head position varied asmuch as 1 cm from trial to trial. Thus, we could in-crease the accuracy of our photographic methods sub-stantially if we were to implement a way of holdingthe head more immobile or compensating for itsmovements, as is done with more sophisticated eyetracking systems. However, our goal has been to de-velop a method that is applicable for use in noninva-sive animal studies or with human infants and thatcan be implemented cheaply and without extensivetechnical expertise or extensive training of personnelfor carrying out the procedures. If accuracy finer thana couple of degrees is needed, our belief is that switch-ing to an eye coil or one of the more sophisticated eyetracking methodologies probably would be more effi-cient than putting substantial effort into further refin-ing this relatively simple procedure.
Similarly, a number of experimental parameters
Downloaded From: https://iovs.arvojournals.org/pdfaccess.ashx?url=/data/journals/iovs/933163/ on 09/07/2018

244 INVESTIGATIVE OPHTHALMOLOGY & VISUAL SCIENCE / January 1992 Vol. 33
can be manipulated in an attempt to reduce theamount of methodological variability introducedduring scoring. We have found that inter-scorer dif-ferences, when scoring the same photograph, usuallyfall in the range of about 0.5-1.0° when naive scorersare used and receive no feedback or cross checkingabout how their results compare with other scorers.This can be reduced to less than 0.5° if scorers aregiven training or feedback about how their resultscompare to a standard scorer. Other factors that canbe manipulated include trying to find the optimalamount of magnification of the image during scoringand attempting to increase the image resolution inpixels when scoring from video. We have manipu-lated these variables in an informal way and foundthem to have only marginal influence as long as theyare kept within a reasonable range. For example, anaive assumption might be that resolution will be lim-ited by pixel resolution in the video display. However,we have found that in practice this factor makes rela-tively little difference, presumably for the same rea-sons that vernier acuity is affected little by receptorspacing.14
The third source of scatter is the most interestingfrom a theoretical perspective. It arises from inherentvariability on the part of the observer when attemptsare being made to direct its eyes toward a particulartarget. Traditional measures of binocular alignmenthave been concerned only with the magnitude of theerror in strabismus and provide no information aboutissues of scatter. The increased efficiency of our photo-graphic method allows repeated measures to be ob-tained from the same fixation target location to gener-ate scatter plots of the type illustrated in Figure 3.Examination of the clusters formed by these scatterplots has the potential to provide additional informa-tion about characteristics of strabismus. In a normalindividual, the clusters for left eye, right eye, and bin-ocular viewing are similar to one another in threeways: (1) the center of each cluster falls near the (0,0)coordinate value; (2) the clusters all form a shape thatis approximately circular; and (3) the diameters of thecircular clusters are all similar. In some of our strabis-mic monkeys, we have found abnormalities in theseproperties of the scatter in addition to the errors inmean amount of convergence. These findings will beelaborated on in a future report.
Appendix
Step 1. Determine the horizontal and vertical rotationof the line of sight: In our description of the model inthe text, we described rotations of the eye with refer-ence to the y-axis because this is the easiest to under-stand with reference to the film plane (Fig. 2). How-
ever, we find the calculations to be simpler if we spec-ify rotations in the horizontal plane as the angleformed by the line of sight with the x-axis, which wedesignate at as. By convention, we assume that whenthe eye is in the primary position as = 90. Similarly,for calculating rotations in the vertical plane, we spec-ify the angle of the line of sight from the positive z-axis, where j8s = 90 when the eye is in primary posi-tion. When an eye moves to fixate a target, this move-ment can be described as a rotation as in the x-y planeand a rotation /3S in the z-y plane. If we think of thesetwo planar rotations as occurring independently, twoorthogonal angles of rotation for the line of sight canbe derived. The equation for the horizontal compo-nent, derived from Equation l.Oh (see text) and in-cluding angle X is:
as = 90 ± sin"1 (l.lh)
That is, we have calculated the rotation of the line ofsight as if it were occurring only in the x-y plane. Wethen can repeat this for the rotation in the z-y plane,this time using the comparable vertical parameters:
= 90 ± sin + Xv (l.lv)
The end result yields two orthogonal angles of rota-tion for the line of sight.
Step 2. Determine the vector from the cyclopiancenter to the center of rotation: Consider the cyclopeancenter to be the origin of a vector R that extends to thecenter of rotation of one eye. Methods for estimatingthe position of the geometrical center of rotation havebeen described previously.8 The magnitude of thisvector is R, and its direction is solely along the x axis:
R = R i (2.0)
Step 3. Determine the vector that extends from thecenter of rotation to the center of the pupil: We willlabel this vector RC. Its magnitude is simply the dis-tance from R to C. Its horizontal direction can befound from the angle \f/h, given:
90 ± tAh = «s + K (3.0h)
where angles as and Xh were determined from Equa-tion l.lh. The vertical direction of vector RC can befound from the angle \J/V given:
90 ± ft, = & + Xv (3.0v)
where angles & and Xv were determined from Equa-tion l.lv. The vector RC can be defined as:
RC = RCj + RCyj + RCzk (3.1)
where the vector component in the x direction is:
RCX = RCxycos(as + Xh) (3.2)
Downloaded From: https://iovs.arvojournals.org/pdfaccess.ashx?url=/data/journals/iovs/933163/ on 09/07/2018
No. 1 MEASURING BINOCULAR ALIGNMENT / Quick and Boorhe 245
the vector component in the y direction is:
RCy = RCxysin(as + Xh) (3.3)
and the vector component in the z direction is:
= RCcos(/3s + Av) (3.4)
The vector RCxy is the projection into the x-y plane ofthe original vector RC.
Step 4. Through vector addition, define the vectorfrom the cyclopian center to the center of the pupil:This step is accomplished by adding the vectors de-scribed by Equations 2.0 and 3.1, yielding the desiredvector C.
C = (RX + RCx)i + RCj + RCzk (4.0)
Step 5. Define a vector from the cyclopian center tothe fixation target: The next step is to find the vector Fthat passes from the cyclopian center to the point inspace that defines the fixation target.
F = Fxi + / y + Fzk (5.0)
where the direction components are the Cartesian co-ordinates of the fixation target.
Step 6. Find the vector from the center of the pupil tothe fixation target: From the previous step, we foundthe vector F from the cyclopian center to the fixationtarget. From Step 4 (Equation 4.0), we found the vec-tor C from the cyclopian center to the center of thepupil. If we simplify the notation of this vector:
C = Cxi + CJ + Czk (6.0)
then the vector that extends from the center of thepupil to the fixation target can be found by vectorsubtraction as:
CF = (Cx - Fx)i + (Cy - Fy)j + (Cz - F2)k (6.1)
This vector defines the intended axis (Fig. 2). It corre-sponds to the line of sight in a perfectly aligned eye.
Step 7. Find the magnitude and direction of the eyeposition error: Recall that from the coraeal light reflexmeasurements of our observer (Step 1), .we have al-ready described the angle as that the observer's line ofsight makes away from the x axis in the x-y plane andthe angle 0, that the observer's line of sight makesaway from the z-axis in the z-y plane. To determinethe magnitude of the position error of our observer'sline of sight, all that remains is to find the correspond-ing angles made by the vector CF and the x and z axes,respectively, and compare them to the angles foundby the corneal light reflex method.
If the previous vector equation for the intended axis(Equation 6.1) is simplified:
then the angle this vector makes with the x axis is:
ap = tan"
and the angle that this vector makes with the z axis is:
CFV ._ . .= tan" CF,
Angles ap and 0P are the horizontal and vertical rota-tions of the line of sight that would be required foraccurate fixation. Therefore, the magnitude of the eyeposition error in the horizontal direction, <xm, is theabsolute value of the difference between the valuesfound in Equations l.Oh and 7.lh:
am = an — (7.2h)
Likewise, the magnitude of the eye position error inthe vertical direction, ]8m, is:
ftn = ft, " ft (7.2v)
CF = CFxi + CFj + CFzk (7.0)
The direction of the eye alignment error can be deter-mined from the sign of f3m and otm found in the pre-vious two equations. For both eyes, a negative |8m indi-cates hypodeviations, and a positive value indicateshyperdeviations. To determine the direction of thehorizontal error, the eye being measured also must beknown. For Left_Error, eso-deviations are indicatedwhen am is positive. For Right—Error, eso-deviationsare indicated when am is negative.
The above steps provide a method for determiningLeft—Error and Right—Error in three dimensions.What remains is to find the comparable values forCross—Error.
Step 8. Define a vector from the cyclopian center tothe "point of intersection " of the lines of sight from thetwo eyes: In our two-dimensional model, we definedCross—Error in reference to the location in spacewhere the visual axes from the two eyes crossed. How-ever, in the three-dimensional model, the lines repre-senting the lines of sight from the two eyes are notnecessarily coplanar, and it is possible they fail to in-tersect. Thus, in our current model, we estimate thenearest approach of the lines of sight from the twoeyes we denote as I, the "point of intersection".* Oncethat point is identified, a vector in three dimensionsfrom the cyclopian center to I can be determined.
Using the x-y plane as the example, we can solve forthe intersection point in the horizontal plane. Weneed the x and y values in rectangular coordinates for
* The quotation marks around "point of intersection" indicatethat point I is an estimate of the point at which the lines of sightcome closest to intersecting. The phrase "intersection point," with-out quotation marks, will be used to indicate an actual point ofcrossing of lines projected onto a single plane.
Downloaded From: https://iovs.arvojournals.org/pdfaccess.ashx?url=/data/journals/iovs/933163/ on 09/07/2018

246 INVESTIGATIVE OPHTHALMOLOGY & VISUAL SCIENCE / January 1992 Vol. 33
points C,h and Crh, the centers of the pupils for the leftand right eyes, respectively, and the slopes of the linesof sight of the two eyes. From Equation l.lh, we canobtain the angles als and aK, representing the amountof rotation of the lines of sight for the left and righteyes in the x-y plane. The slope of the lines corre-sponding to these angles can be determined by takingthe tangent of these angles.
To obtain the rectangular coordinates of the centersof the pupils of the two eyes, we can use the horizontalcomponent of vector C. The component vector Clh,from Equation 6.0 for the left eye, would be:
lh "~ Will1 "T" ^ylhJ
Because the origin of vector Clh is the cyclopiancenter, the rectangular coordinates for point C,h aresimply (Cx, Cy). Similarly, we can find the comparablecoordinates for vector Crh. With this information, thepoint-slope form of the equations for the projectionsof the lines of sight from the two eyes can be derived.These equations can be equated and the intersectionpoint solved.8
By projecting the lines of sight and the vectors Ct
and Cr into the vertical plane, the z coordinate forpoint I can be found using the same procedure. Be-cause we are projecting into the x-y and z-y planes, weobtain two estimates of the y coordinate of the "pointof intersection." Therefore, we take the mean of thetwo values as the estimate of the y coordinate. Oncethe rectangular coordinates of point I are determined,the vector from the cyclopian center to the "point ofintersection" can be put in vector notation:
I = /xi + /jj + /2k
Step 9. Find the magnitude and direction ofCross—Error: We express the magnitude of the eyeposition error as the absolute value of the differencebetween the y axis distance of the cyclopian center tothe fixation target (expressed in meter-angles), andthe y axis distance of the cyclopian center to the"point of intersection" (also expressed in meter-an-gles). The distance Fy from the cyclopian center to thefixation target can be obtained from equation 5.0.This distance in meter-angles is:
F - - L" F,
and the comparable measure Iy to the "point of inter-section" is found in equation 8.1. This distance inmeter-angles is:
The magnitude of the Cross—Error, m, is given by theabsolute value of:
m = Im-Fm (9.2)
The direction of the eye alignment error can be deter-mined by the sign of the value m. If the value is posi-tive, the "point of intersection" is nearer the subjectthan the fixation target, indicating an eso-deviation.A negative value indicates an exodeviation.
Key words: ocular alignment, corneal light reflex, Hirsch-berg text, strabismus, pediatric ophthalmology, monkey
(g.0) AcknowledgmentsThe authors thank Dr. Howard Eggers and two anony-
mous reviewers for providing comments and suggested im-provements about an earlier version of this manuscript. Wethank Drs. H. Eggers, S. Guo, and J. A. Gammon for per-forming the ophthalmologic examinations, and the veteri-narians and staff of the Yerkes Regional Primate ResearchCenter for assistance with animal care. The Yerkes RegionalPrimate Research Center is fully accredited by the Ameri-can Association for Accreditation of Laboratory AnimalCare.
References
1. Lang J: Strabismus. Thorofare, NJ, Slack, 1984.2. von Noorden GK: Binocular vision and ocular motility:
Theory and Management of Strabismus. St. Louis, CV Mosby,1985.
3. Robinson DA: A method for measuring eye movement using ascleral search coil in a magnetic field. IEEE Transactions Bio-medical Electronics BME 10:137, 1963.
4. Young LR and Sheena D: Eye-movement measurement tech-niques. Am Psychol 30:315, 1975.
5. Crane HD and Steele CM: Accurate three-dimensional eye-(8.1) tracker. Applied Optics 17:691, 1978.
6. Jones R and Eskridge JB: The Hirschberg test—A re-evalua-tion. American Journal of Optometry and Archives of Ameri-can Academy of Optometry 47:105, 1970.
7. Brodie SE: Photographic calibration of the Hirschberg test. In-vest Ophthalmol Vis Sci 28:736, 1987.
8. Quick MW and Boothe RG: Measurement of binocular align-ment in normal monkeys and in monkeys with strabismus.Invest Ophthalmol Vis Sci 30:1159, 1989.
9. Uozato H and Guyton DL: Centering corneal surgical proce-dures. Am J Ophthalmol 103:264, 1987.
10. Hering E: The Theory of Binocular Vision, Bridgeman B andStark L, editors, Bridgeman B, translator. New York, Plenum,1977.
11. Tyler CW: Sensory processing of binocular disparity. In Ver-(9.0) gence Eye Movements: Basic and Clinical Aspects, Schor CM
and Cuiffreda KJ, editors. London, Buttorworths, 1983.12. Nakayama K: Kinematics of normal and strabismic eyes. In
Vergence Eye Movements: Basic and Clinical Aspects, SchorCM and Cuiffreda KJ, editors. London, Buttorworths, 1983.
13. Nakayama K: Photographic determination of the rotationalstate of the eye using matrices. Am J Optom Physiol Opt51:736, 1974.
(9 1) 14. Westheimer G: The spatial sense of the eye. Invest OphthalmolVis Sci 18:893, 1979.
Downloaded From: https://iovs.arvojournals.org/pdfaccess.ashx?url=/data/journals/iovs/933163/ on 09/07/2018