Embed Size (px)
Citation preview
A Photo Gallery of Legume Content
in Pastures.
Ed Rayburn
Extension Forage Agronomist
West Virginia University
Morgantown, WV 26506
Jim Green
Prof. Emeritus Crop Science
North Carolina State University
Raleigh, NC 27695
Introduction
There are advantages to growing legumes in pastures and hay
fields. These include providing nitrogen for plant growth and
increasing forage quality and animal performance.
Introduction
Botanical composition is a dynamic characteristic in pastures
dependent on plant species, management, and weather. When soil
nitrogen supply is low legumes will be competitive since they
provide nitrogen first for themselves and then to the non-
leguminous plants as root nodules slough off, dead leaves
decompose, and livestock return manure and urine to the soil.
When soil nitrogen supply is high grasses will be competitive.
Introduction
The grazing manager can use livestock grazing pressure to shift
the balance of grasses and legumes. In general, leaving a higher
residual height encourages grasses while grazing to a shorter
height encourages legumes. Under rotational grazing, rest interval
is a critical management need for legumes.
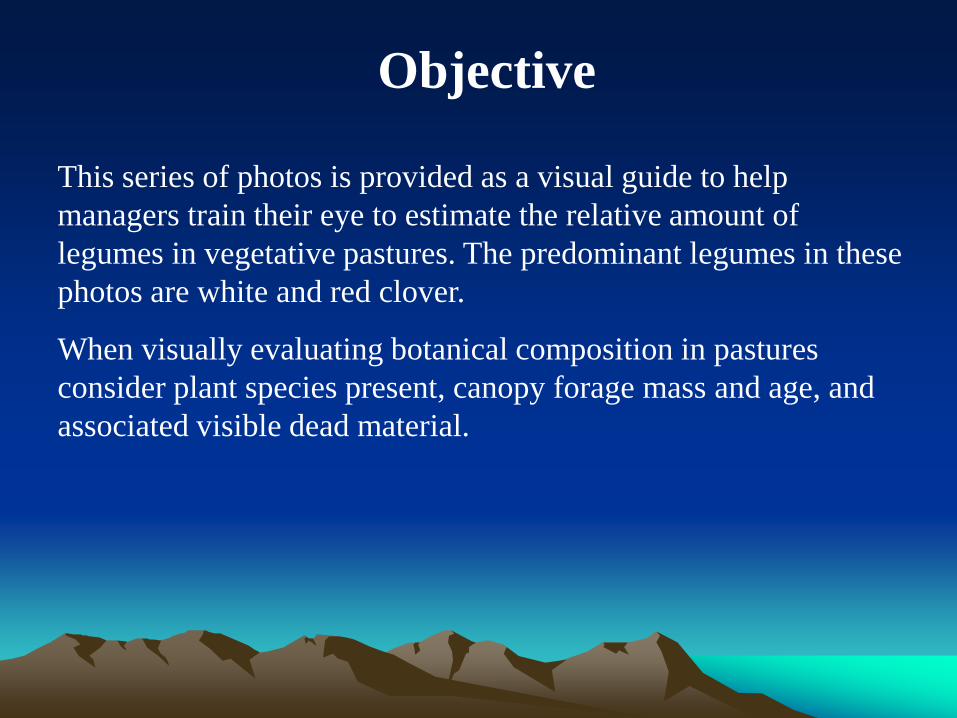
Objective
This series of photos is provided as a visual guide to help
managers train their eye to estimate the relative amount of
legumes in vegetative pastures. The predominant legumes in these
photos are white and red clover.
When visually evaluating botanical composition in pastures
consider plant species present, canopy forage mass and age, and
associated visible dead material.
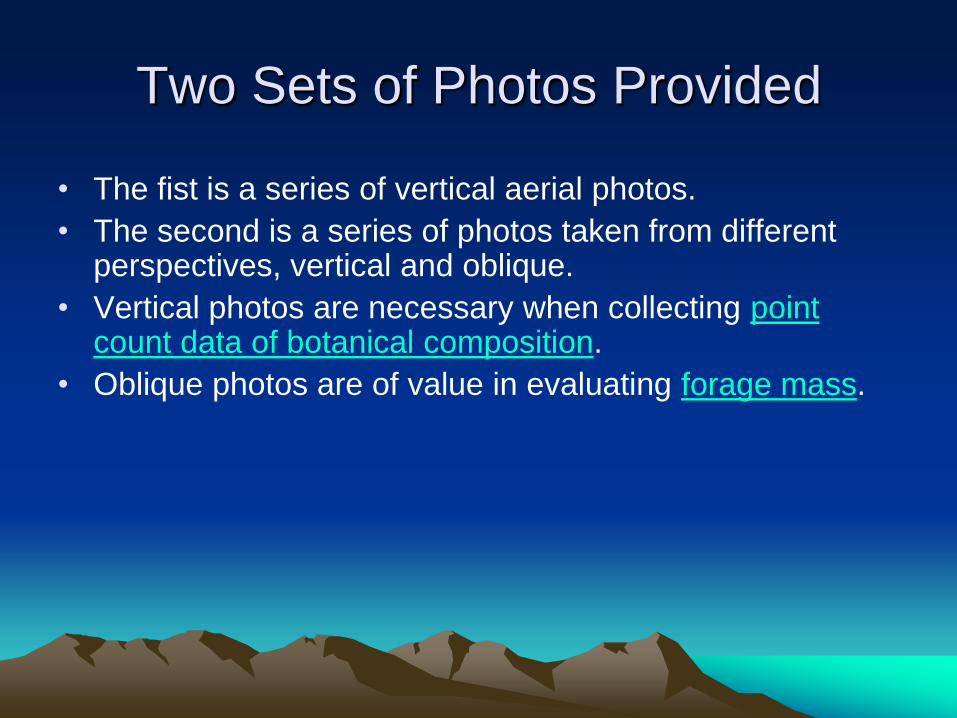
Two Sets of Photos Provided
• The fist is a series of vertical aerial photos.
• The second is a series of photos taken from different perspectives, vertical and oblique.
• Vertical photos are necessary when collecting point count data of botanical composition.
• Oblique photos are of value in evaluating forage mass.
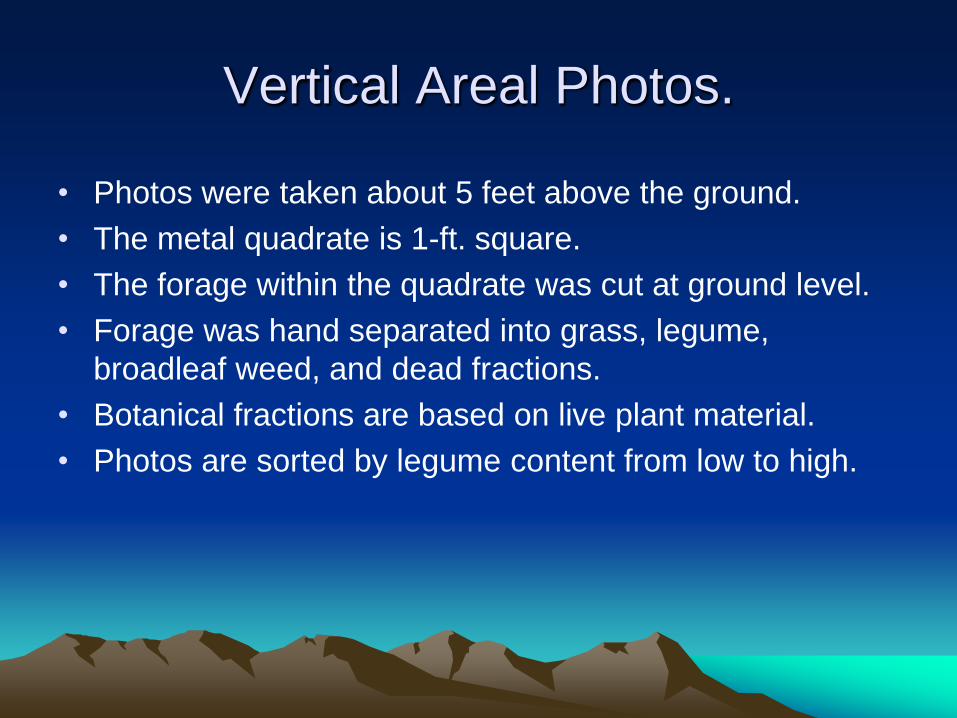
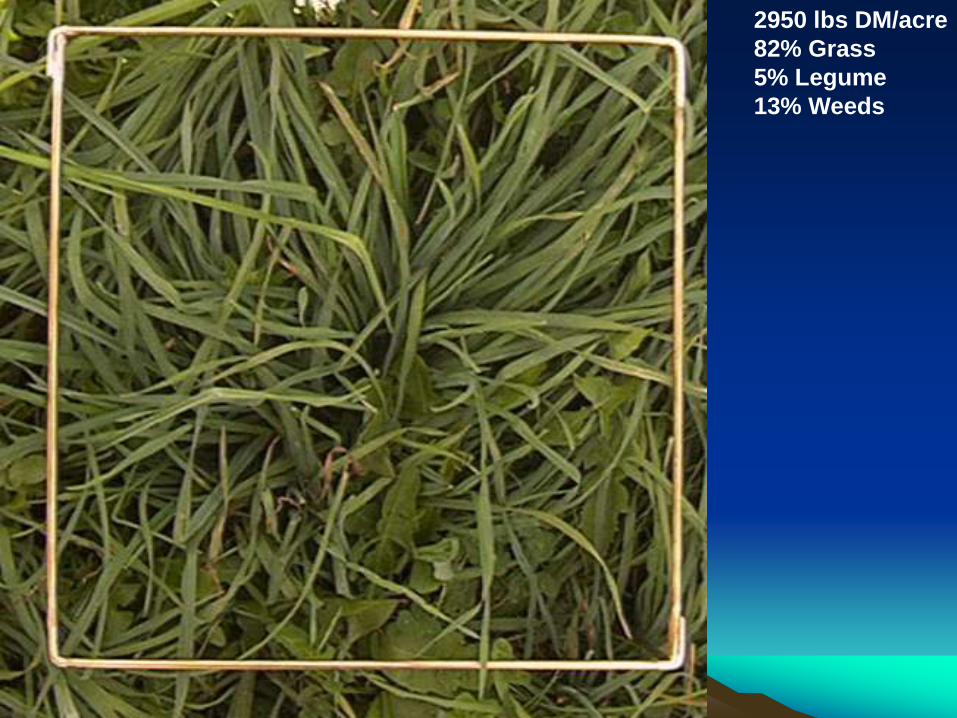
Vertical Areal Photos.
• Photos were taken about 5 feet above the ground.
• The metal quadrate is 1-ft. square.
• The forage within the quadrate was cut at ground level.
• Forage was hand separated into grass, legume,
broadleaf weed, and dead fractions.
• Botanical fractions are based on live plant material.
• Photos are sorted by legume content from low to high.
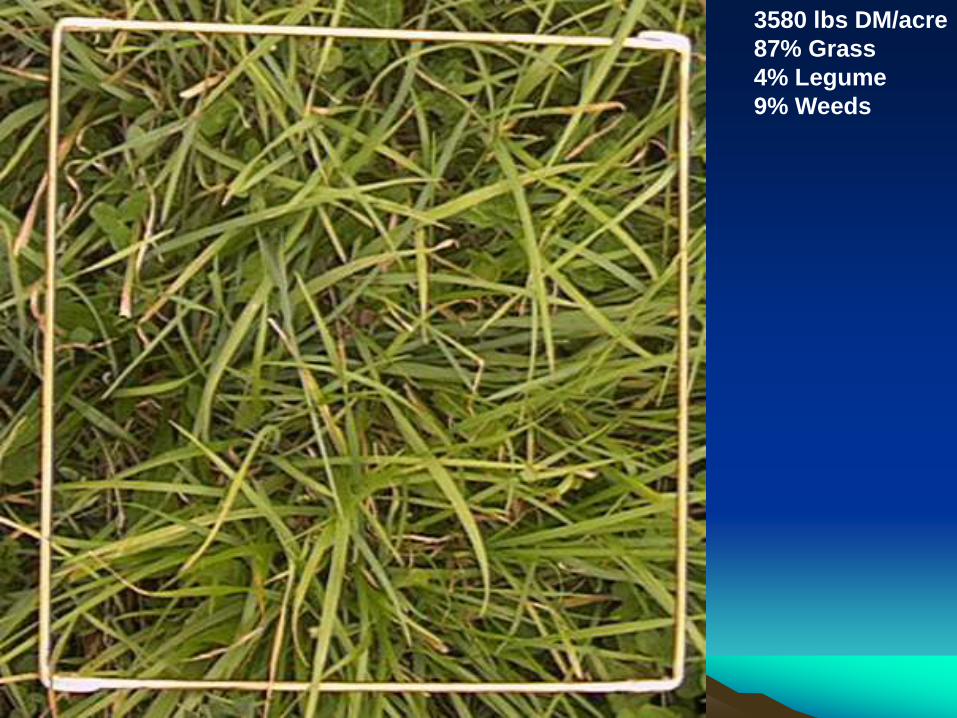
143580 lbs DM/acre
87% Grass
4% Legume
9% Weeds
07
2950 lbs DM/acre
82% Grass
5% Legume
13% Weeds
08
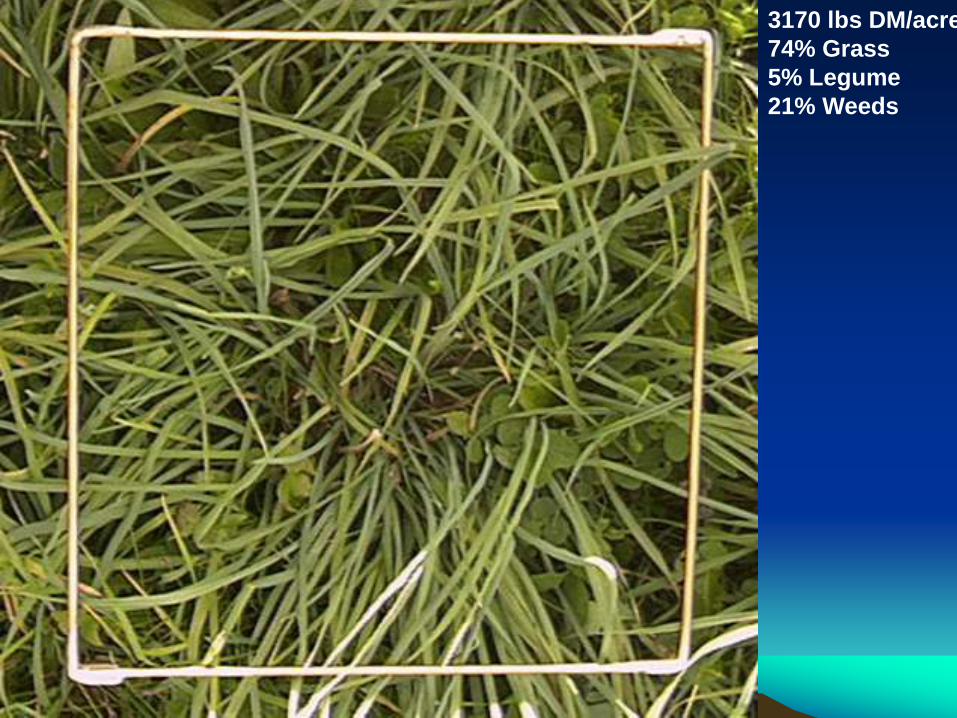
3170 lbs DM/acre
74% Grass
5% Legume
21% Weeds
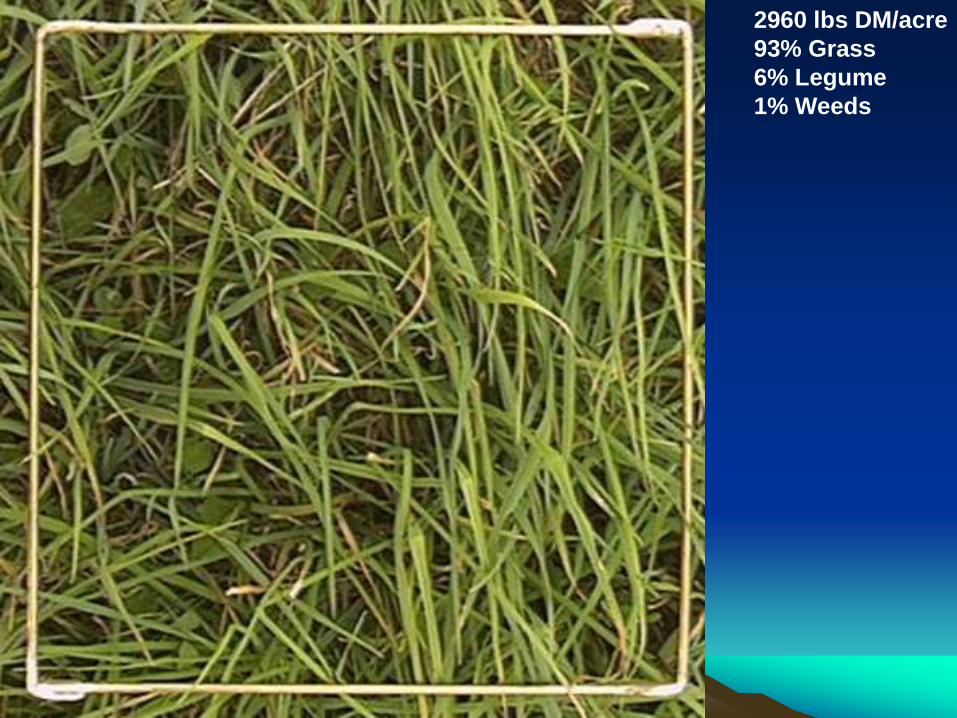
232960 lbs DM/acre
93% Grass
6% Legume
1% Weeds
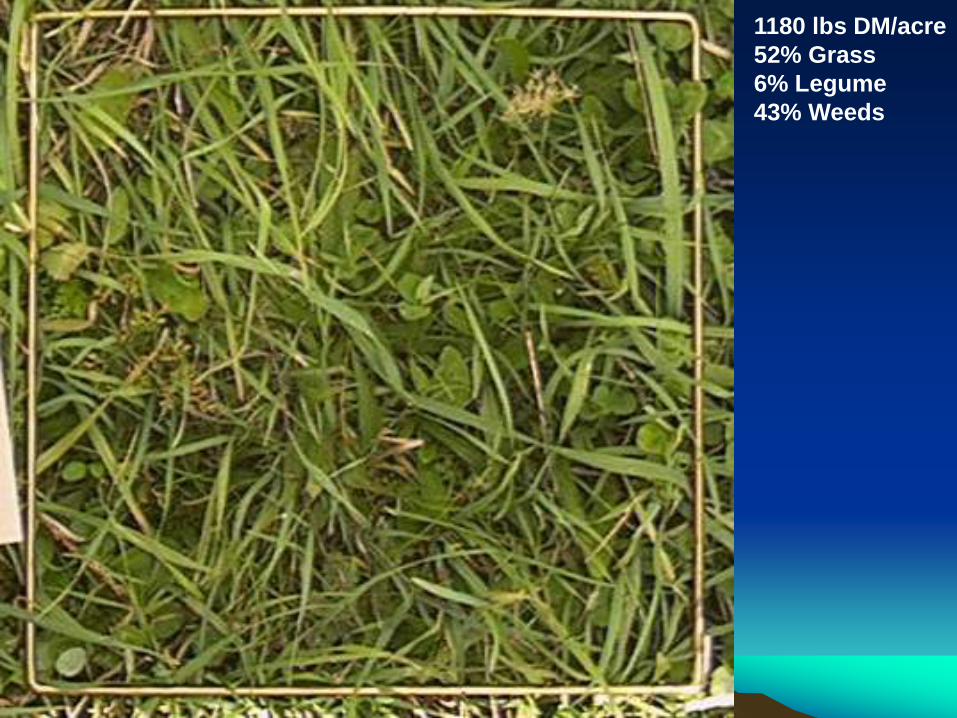
271180 lbs DM/acre
52% Grass
6% Legume
43% Weeds
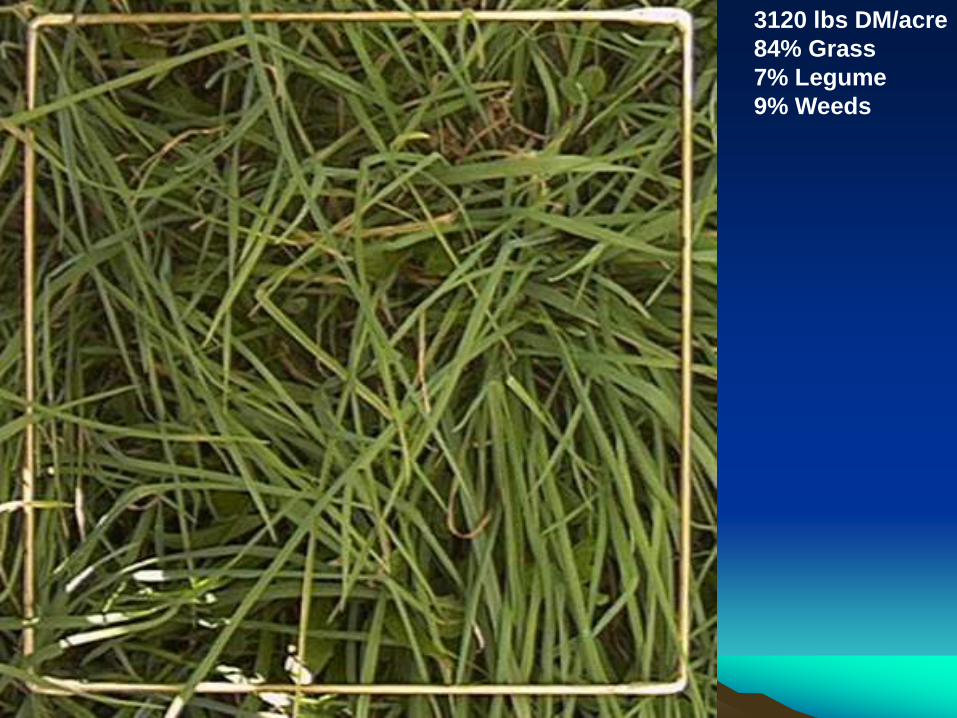
223120 lbs DM/acre
84% Grass
7% Legume
9% Weeds

212830 lbs DM/acre
77% Grass
7% Legume
16% Weeds
10
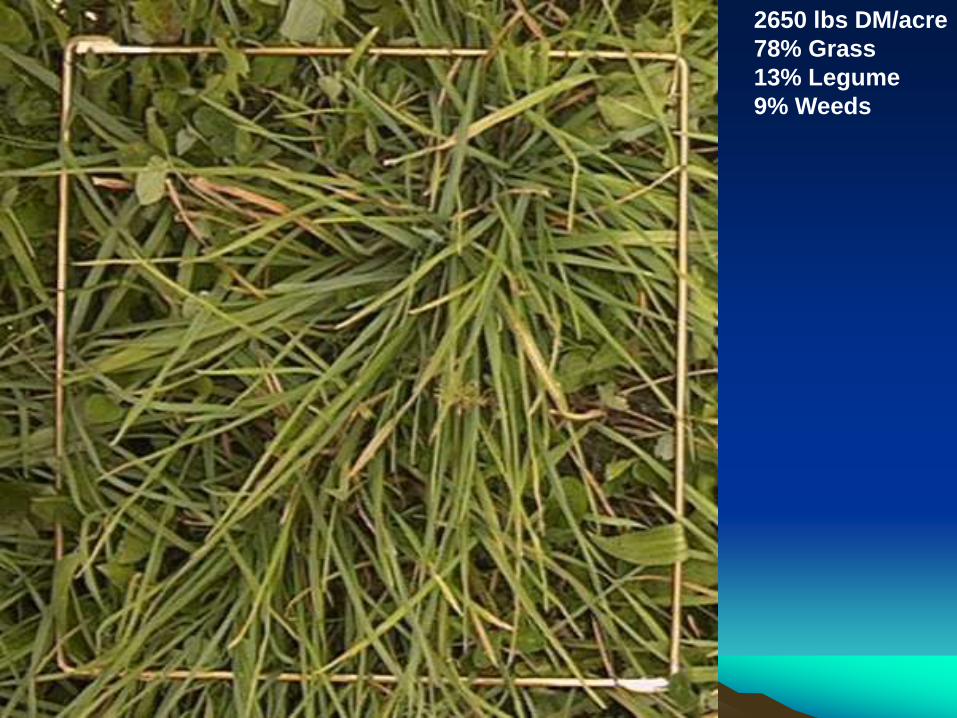
2650 lbs DM/acre
78% Grass
13% Legume
9% Weeds
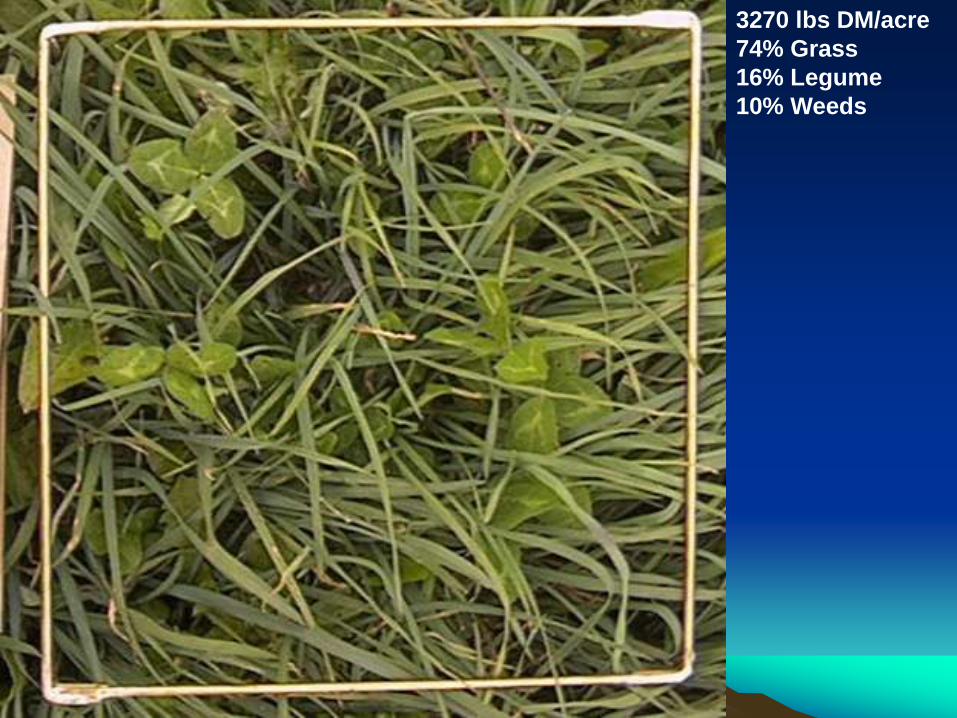
163270 lbs DM/acre
74% Grass
16% Legume
10% Weeds
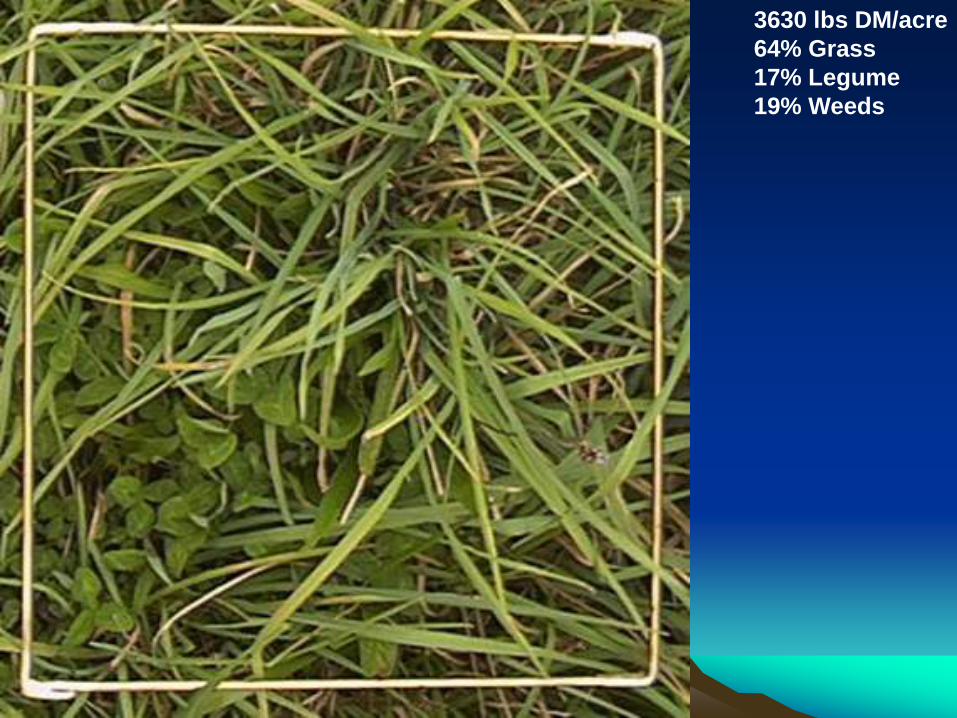
193630 lbs DM/acre
64% Grass
17% Legume
19% Weeds
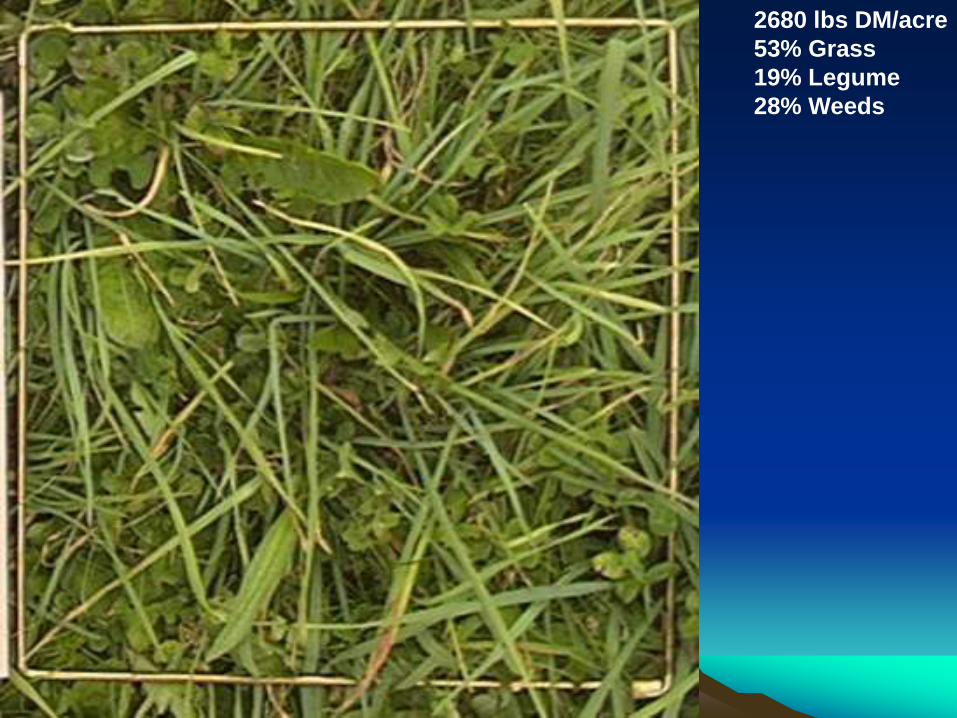
282680 lbs DM/acre
53% Grass
19% Legume
28% Weeds
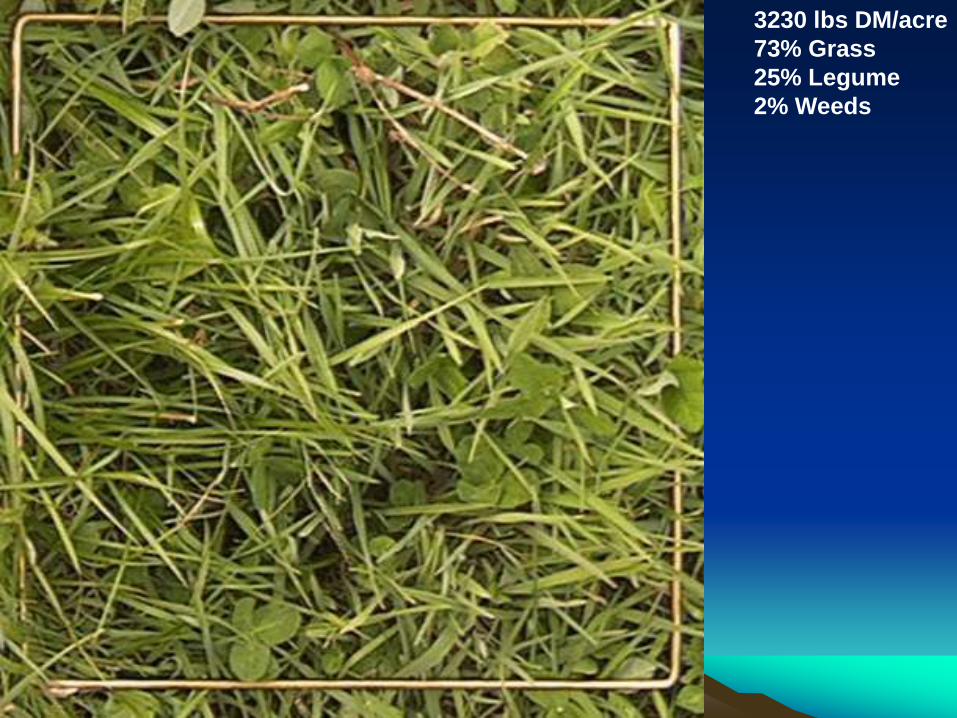
183230 lbs DM/acre
73% Grass
25% Legume
2% Weeds
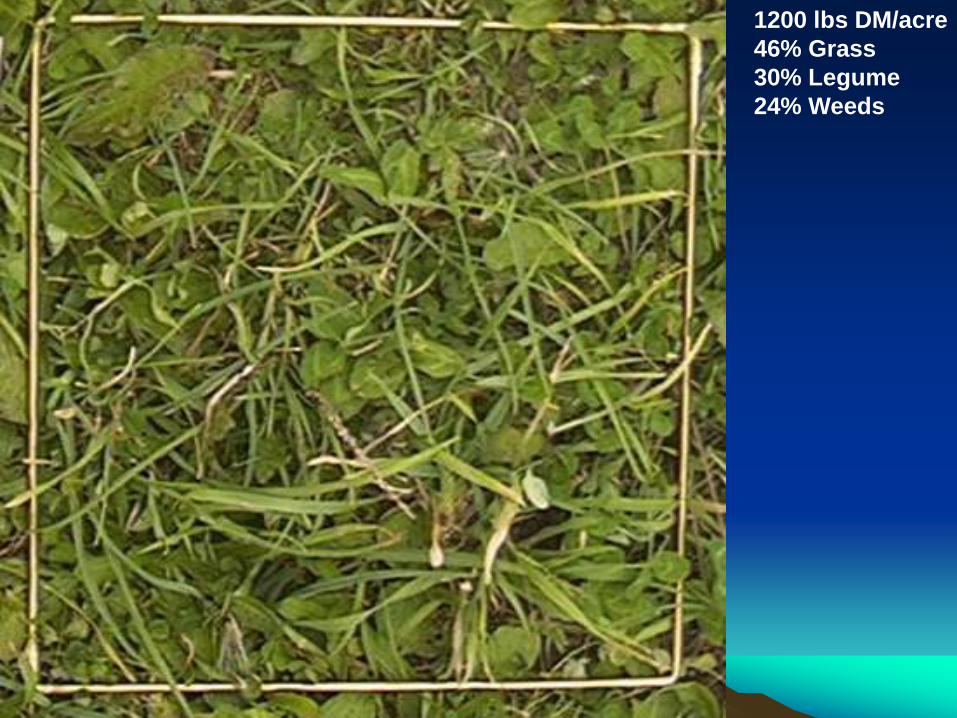
261200 lbs DM/acre
46% Grass
30% Legume
24% Weeds
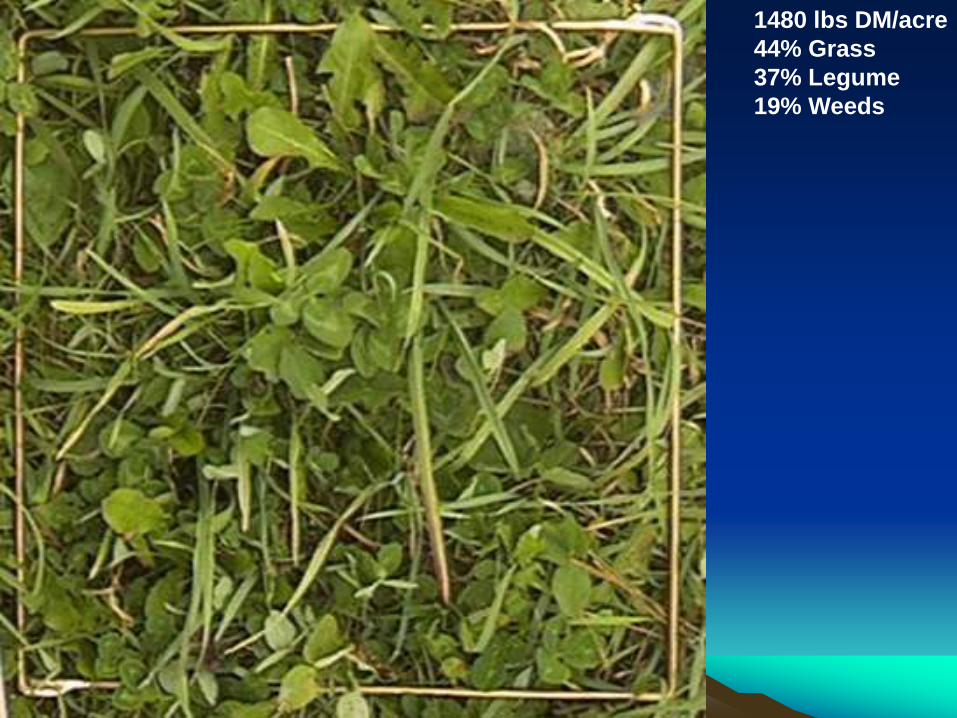
291480 lbs DM/acre
44% Grass
37% Legume
19% Weeds
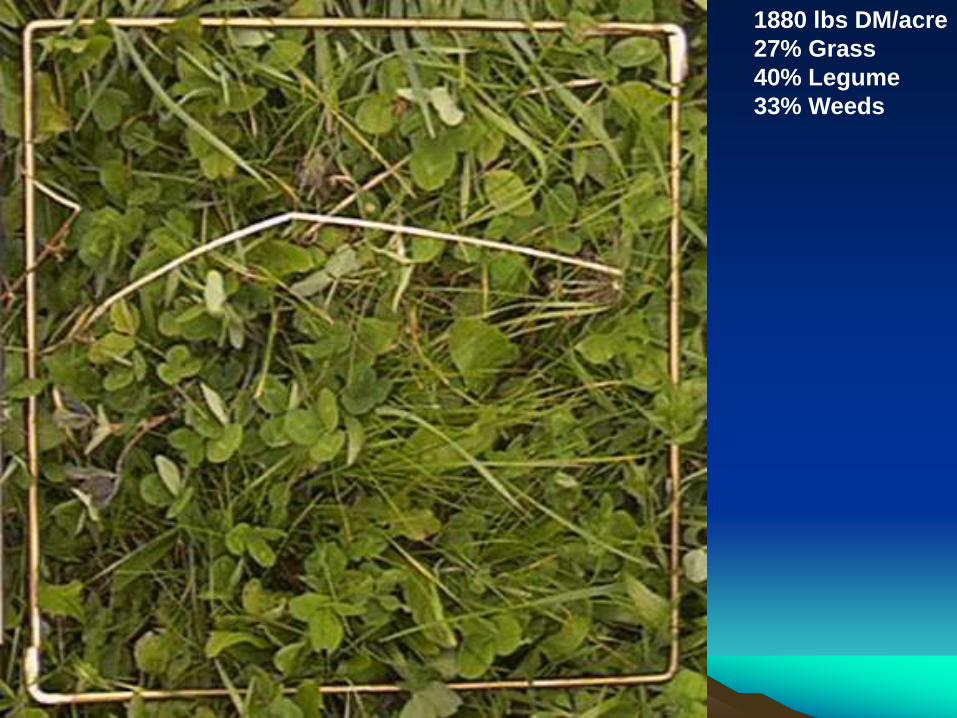
171880 lbs DM/acre
27% Grass
40% Legume
33% Weeds
09
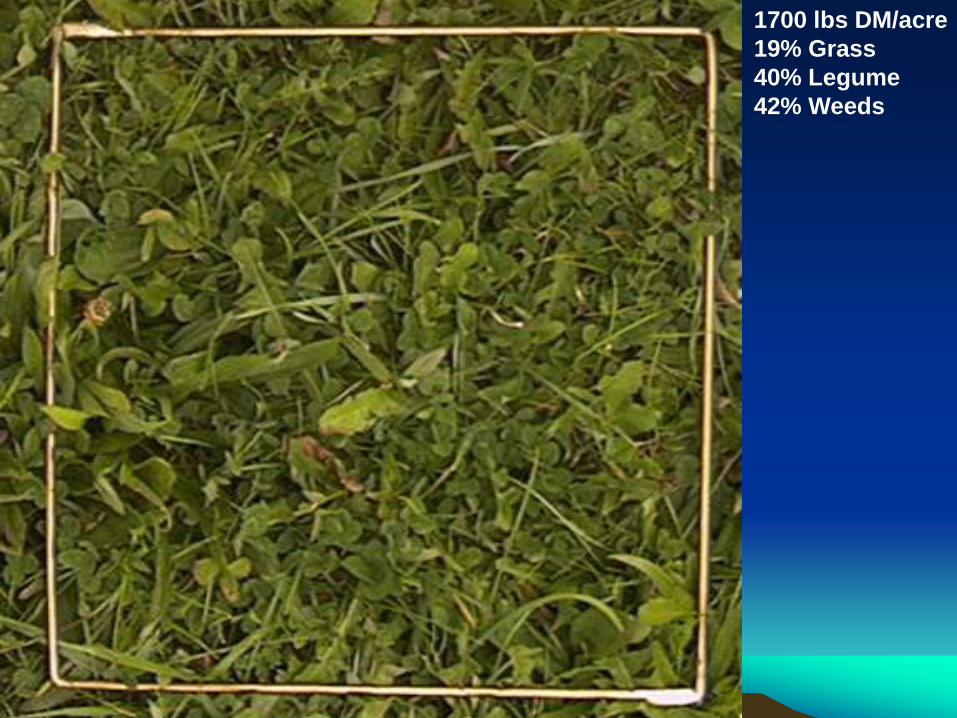
1700 lbs DM/acre
19% Grass
40% Legume
42% Weeds
11
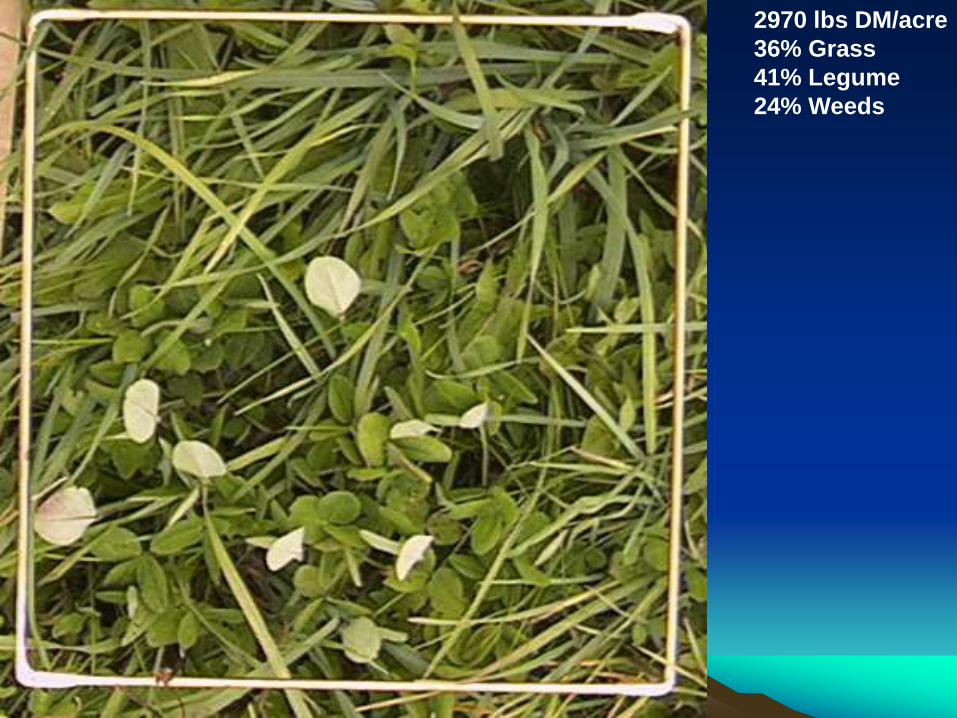
2970 lbs DM/acre
36% Grass
41% Legume
24% Weeds
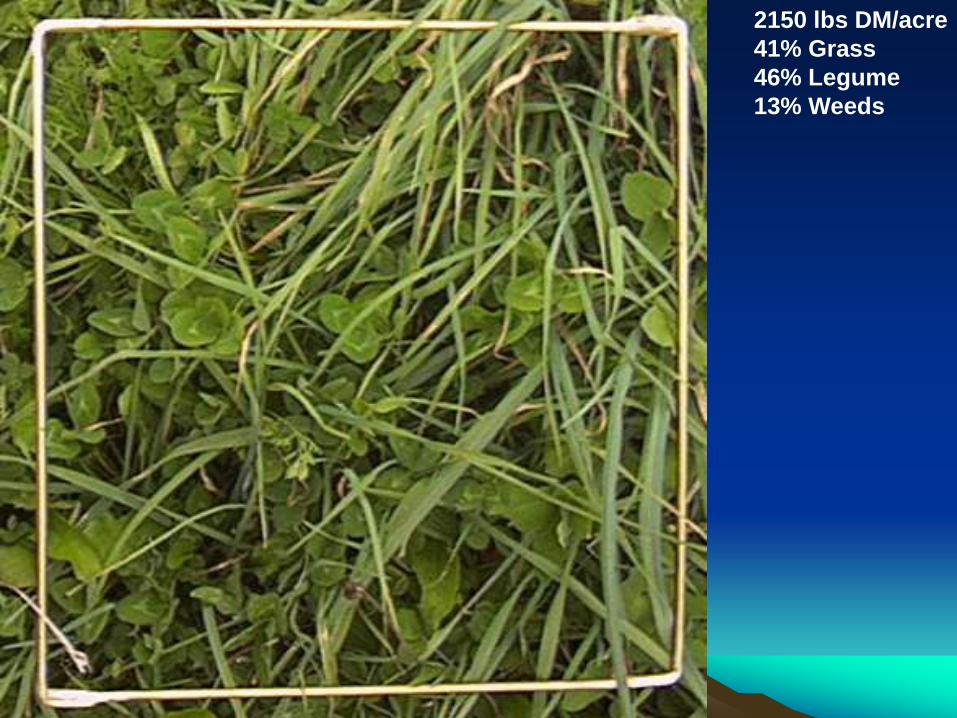
202150 lbs DM/acre
41% Grass
46% Legume
13% Weeds
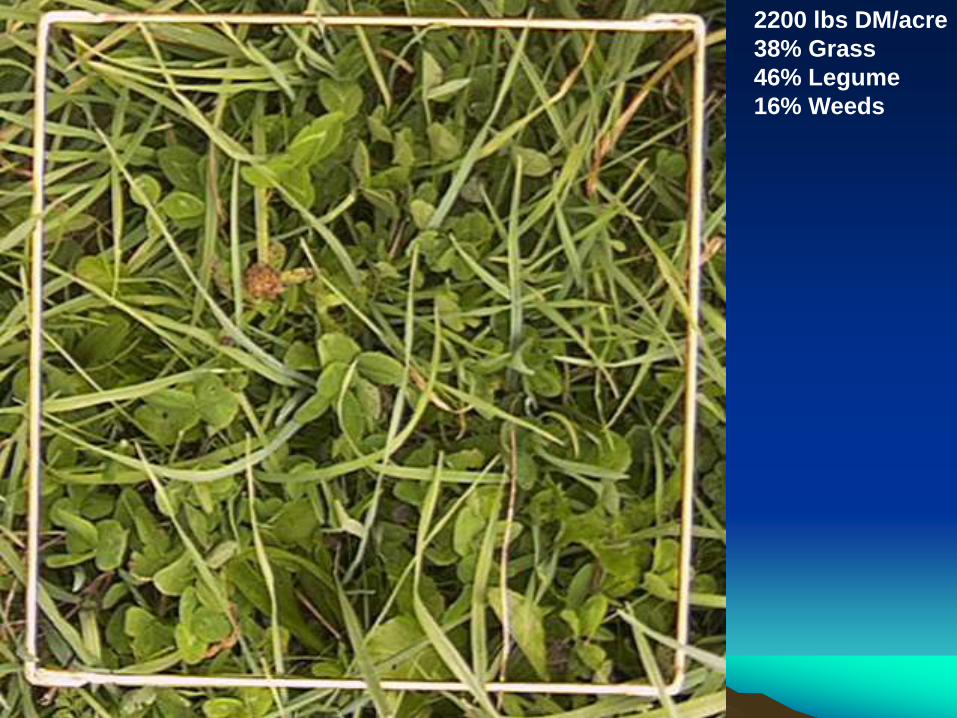
122200 lbs DM/acre
38% Grass
46% Legume
16% Weeds
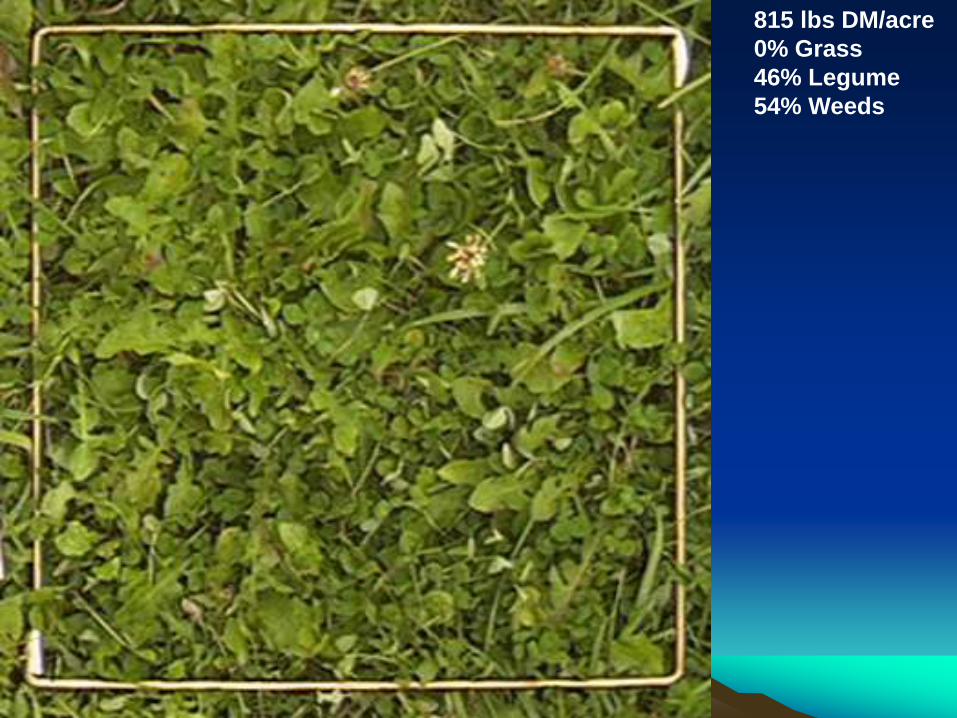
25815 lbs DM/acre
0% Grass
46% Legume
54% Weeds
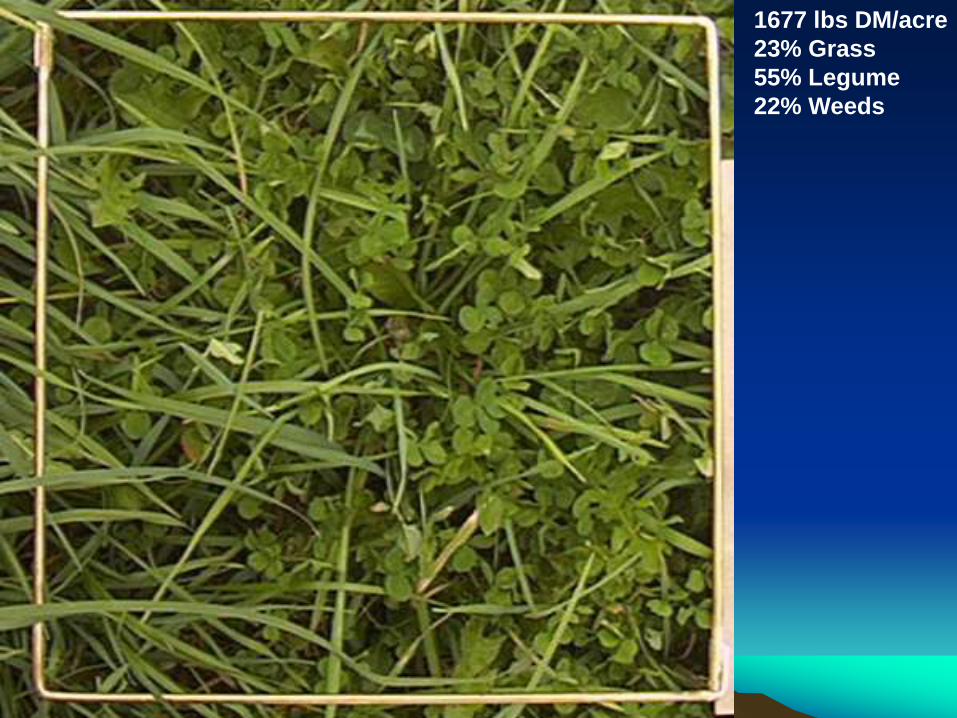
241677 lbs DM/acre
23% Grass
55% Legume
22% Weeds
15
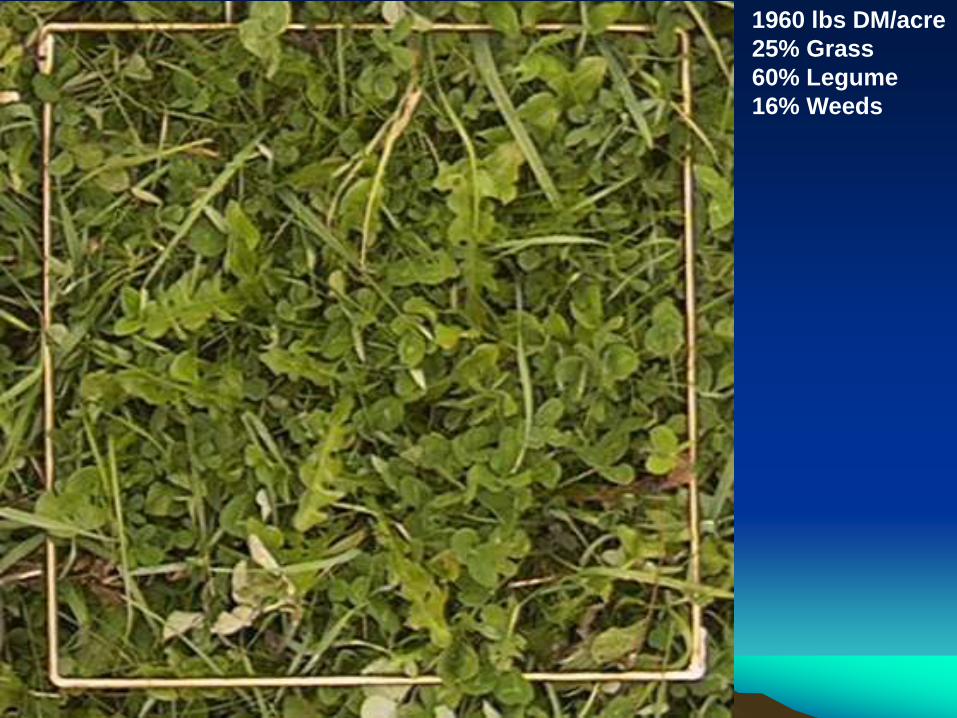
1960 lbs DM/acre
25% Grass
60% Legume
16% Weeds
13
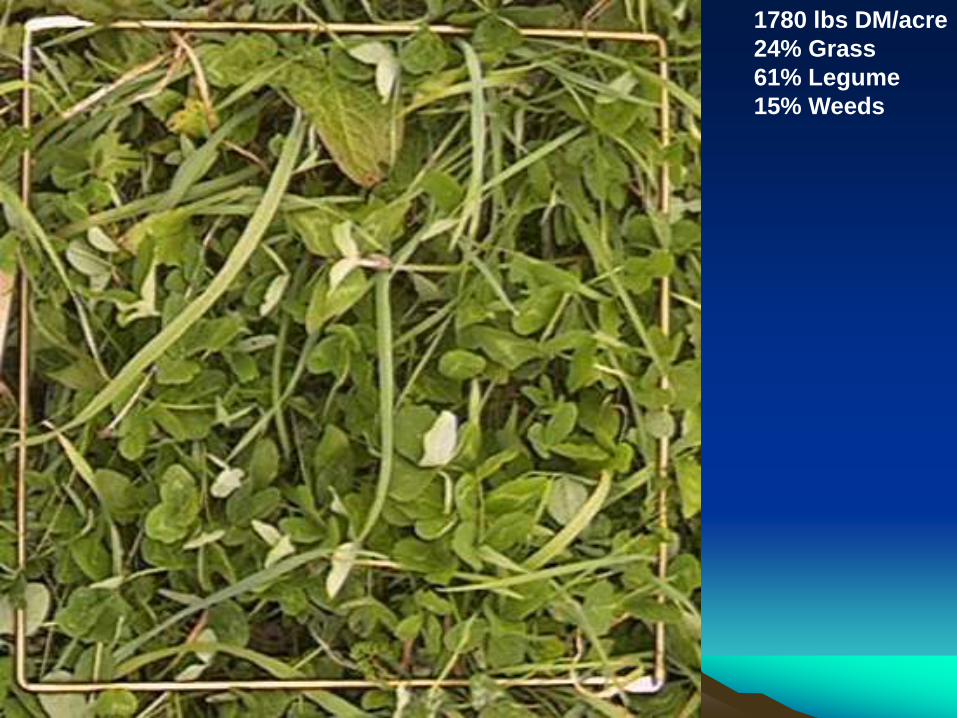
1780 lbs DM/acre
24% Grass
61% Legume
15% Weeds
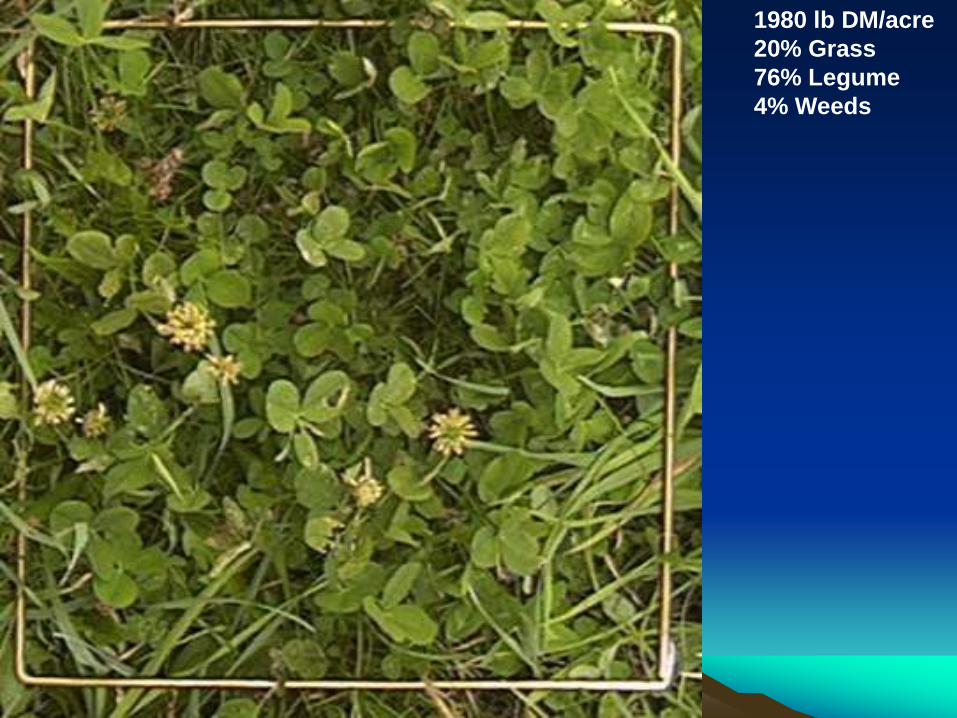
301980 lb DM/acre
20% Grass
76% Legume
4% Weeds
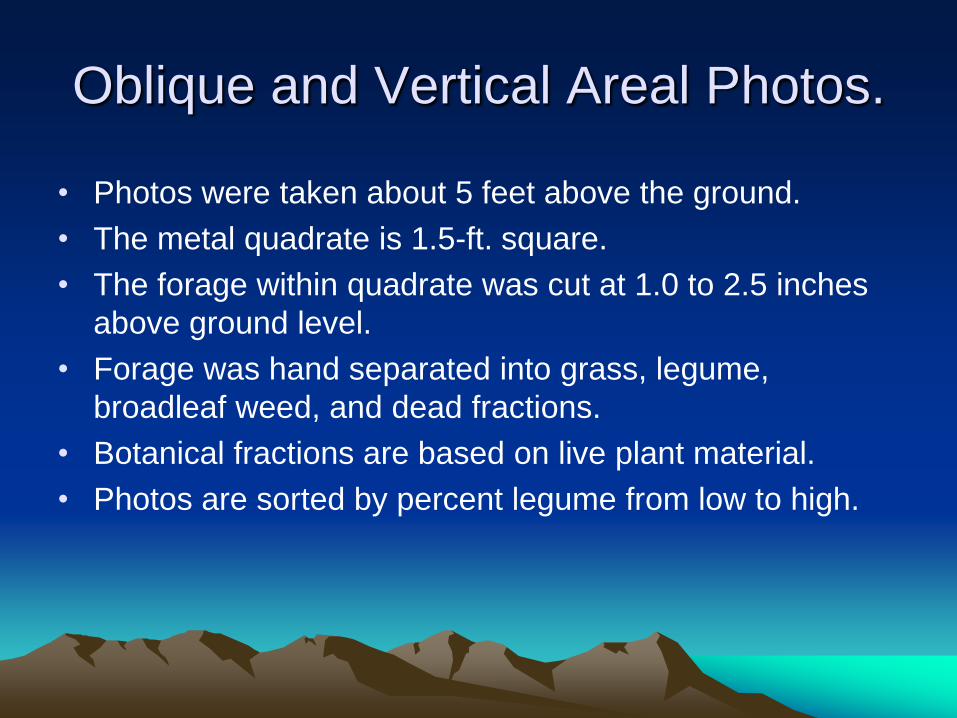
Oblique and Vertical Areal Photos.
• Photos were taken about 5 feet above the ground.
• The metal quadrate is 1.5-ft. square.
• The forage within quadrate was cut at 1.0 to 2.5 inches
above ground level.
• Forage was hand separated into grass, legume,
broadleaf weed, and dead fractions.
• Botanical fractions are based on live plant material.
• Photos are sorted by percent legume from low to high.
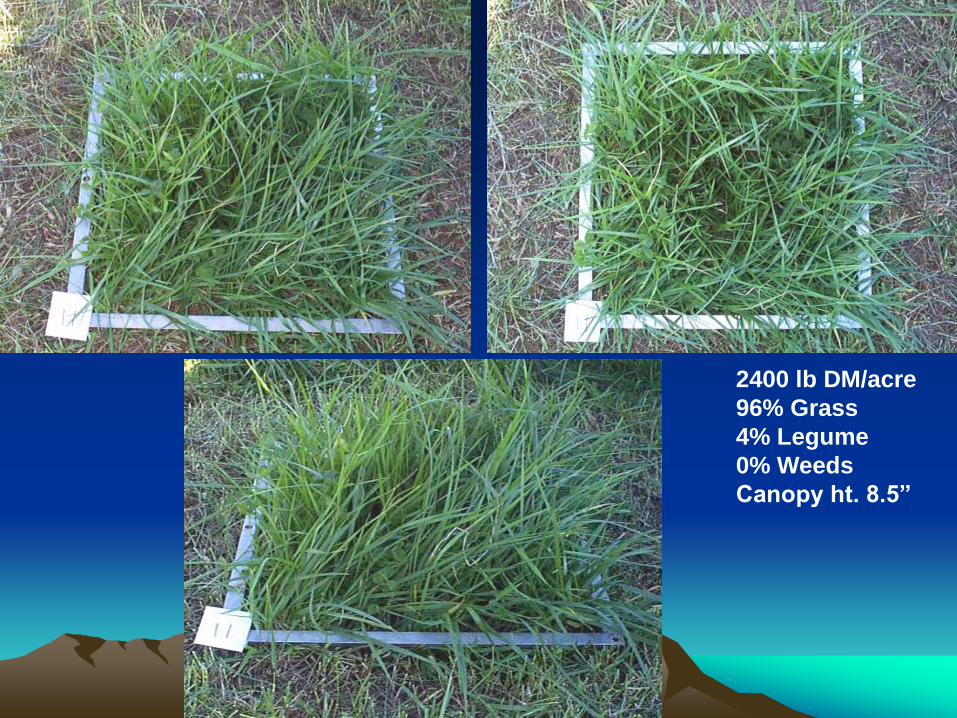
2400 lb DM/acre
96% Grass
4% Legume
0% Weeds
Canopy ht. 8.5”
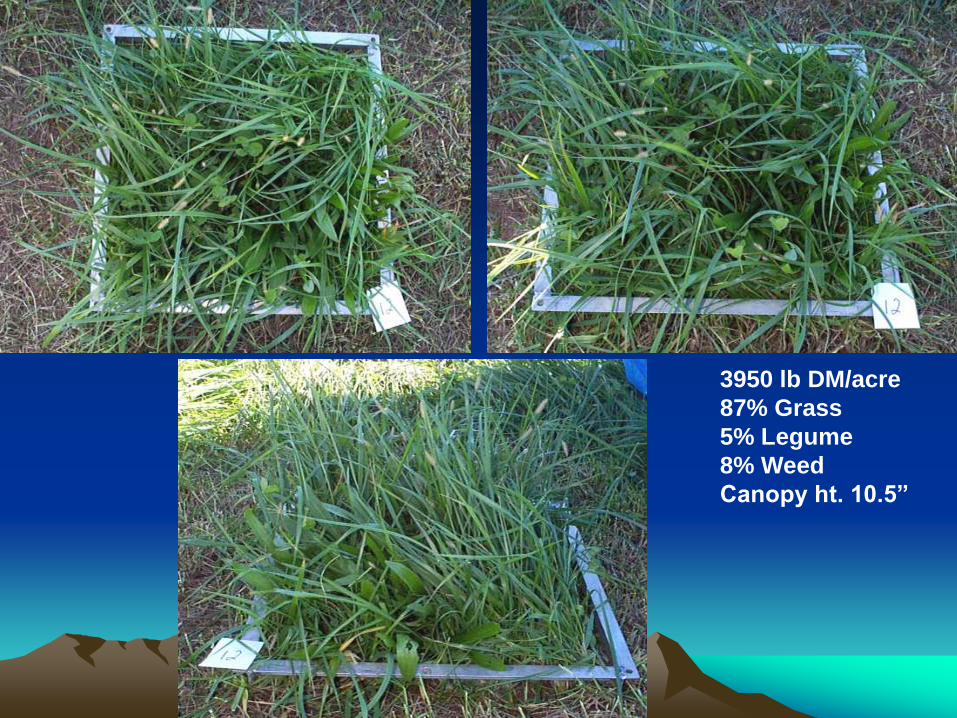
3950 lb DM/acre
87% Grass
5% Legume
8% Weed
Canopy ht. 10.5”
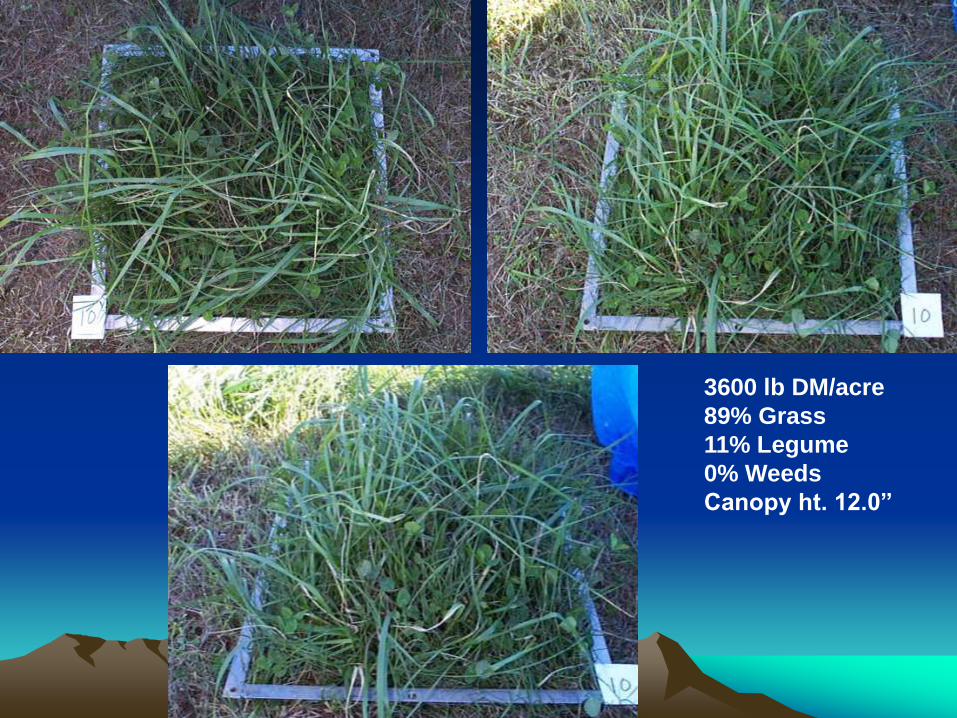
3600 lb DM/acre
89% Grass
11% Legume
0% Weeds
Canopy ht. 12.0”
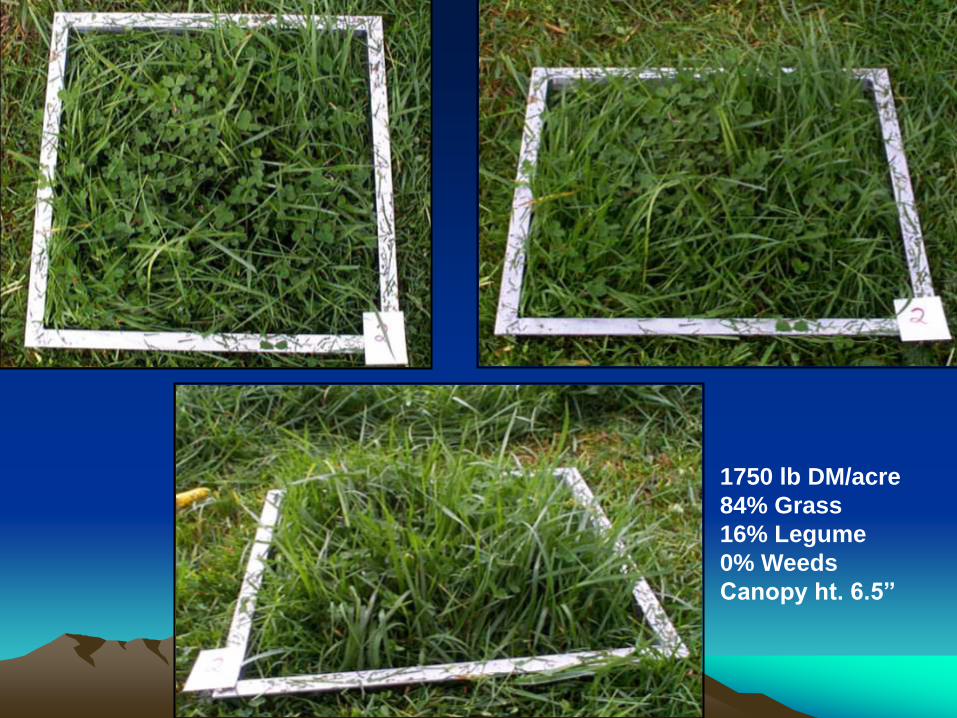
1750 lb DM/acre
84% Grass
16% Legume
0% Weeds
Canopy ht. 6.5”
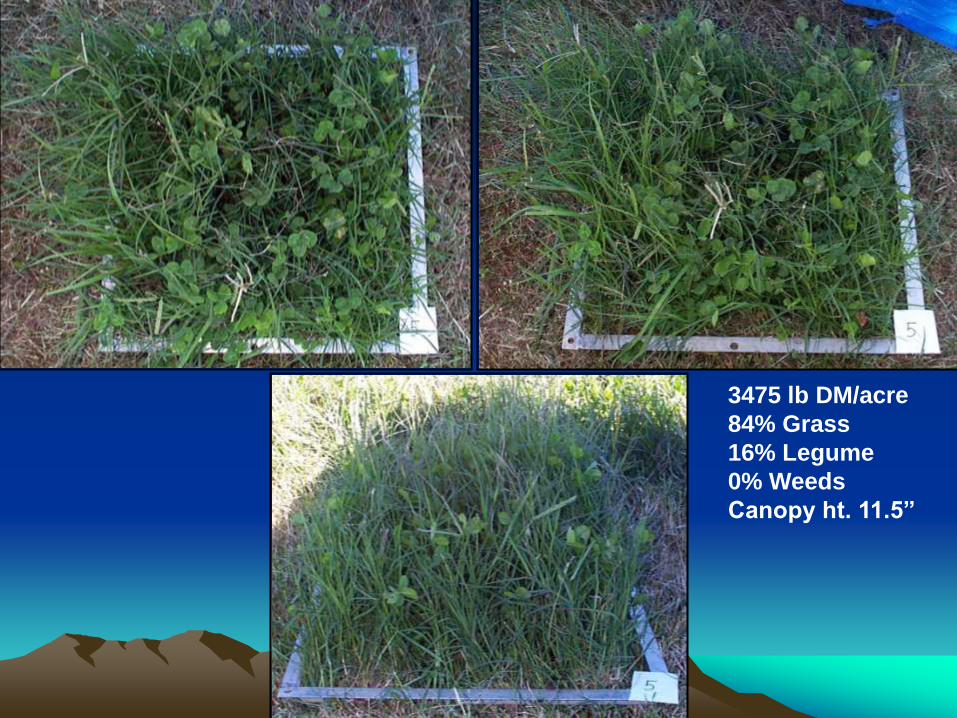
3475 lb DM/acre
84% Grass
16% Legume
0% Weeds
Canopy ht. 11.5”
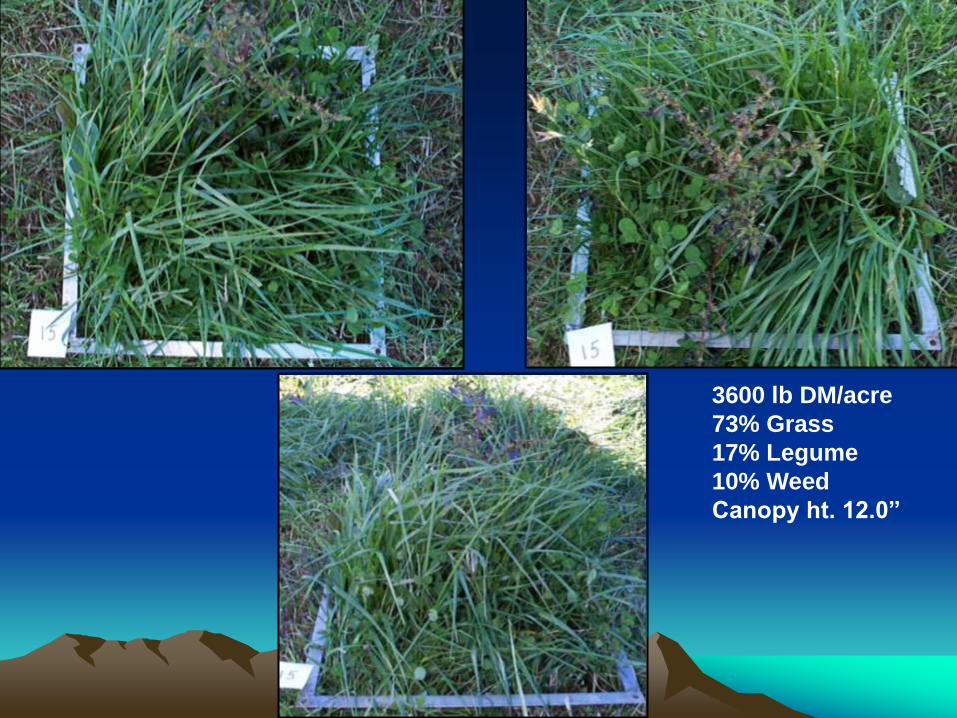
3600 lb DM/acre
73% Grass
17% Legume
10% Weed
Canopy ht. 12.0”
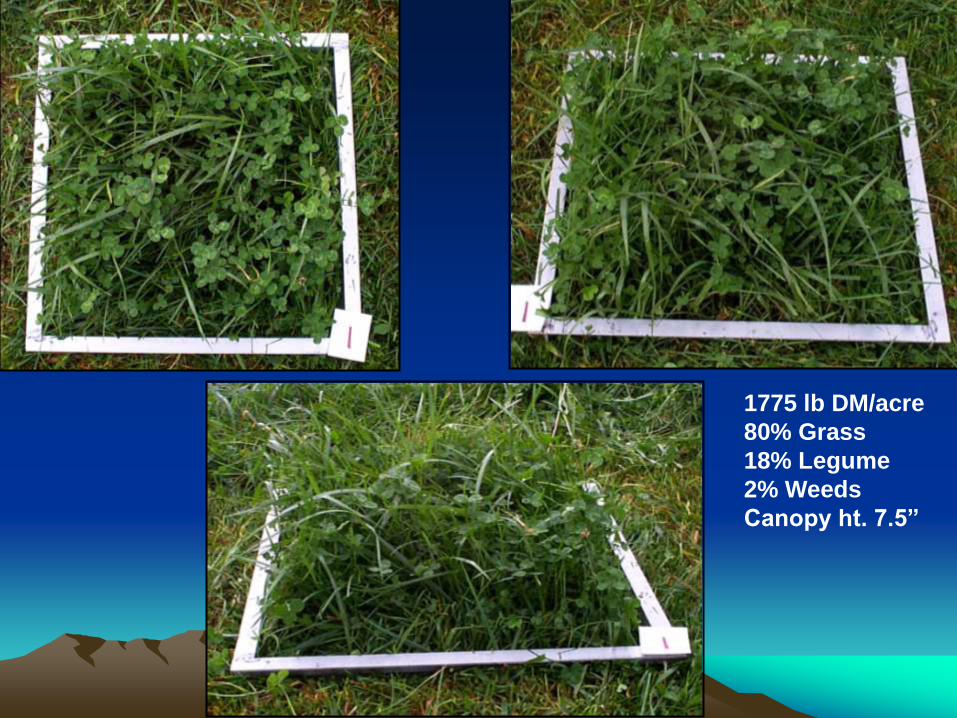
1775 lb DM/acre
80% Grass
18% Legume
2% Weeds
Canopy ht. 7.5”
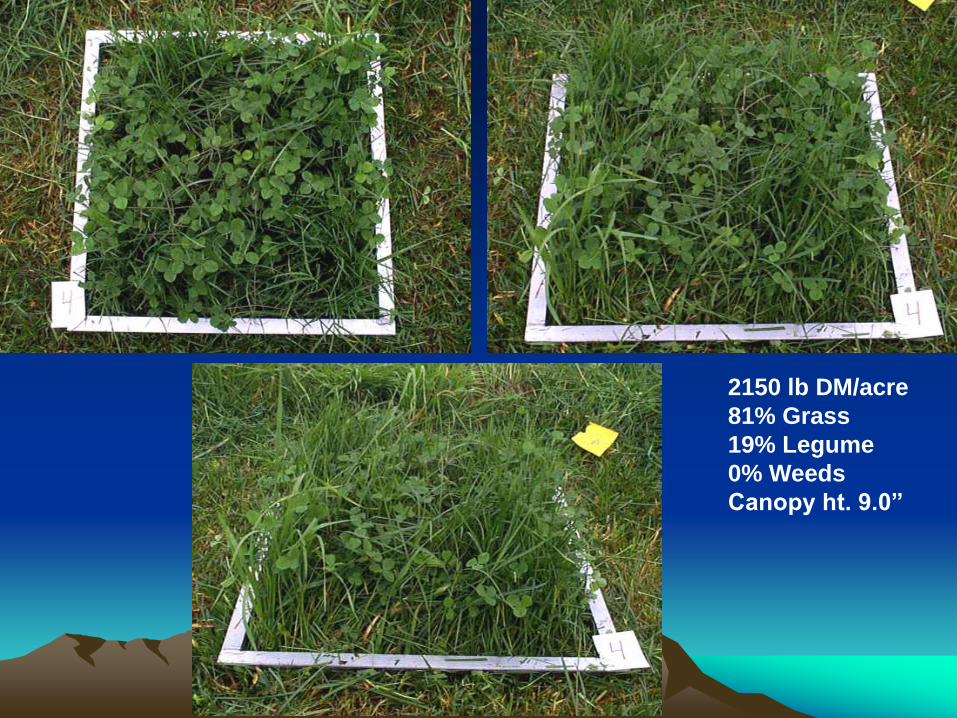
2150 lb DM/acre
81% Grass
19% Legume
0% Weeds
Canopy ht. 9.0”
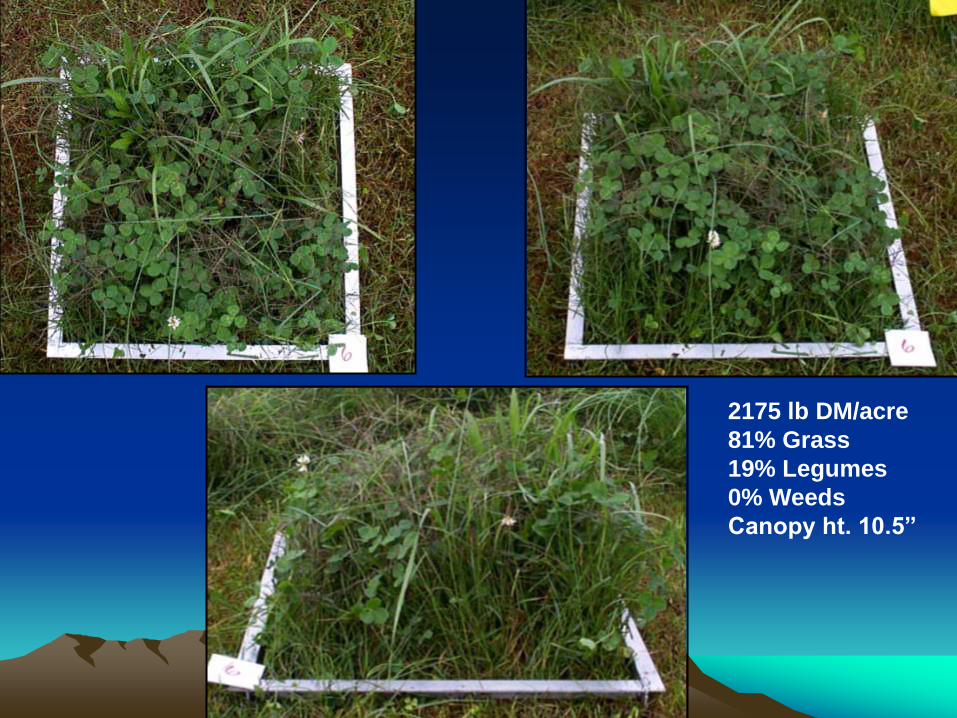
2175 lb DM/acre
81% Grass
19% Legumes
0% Weeds
Canopy ht. 10.5”
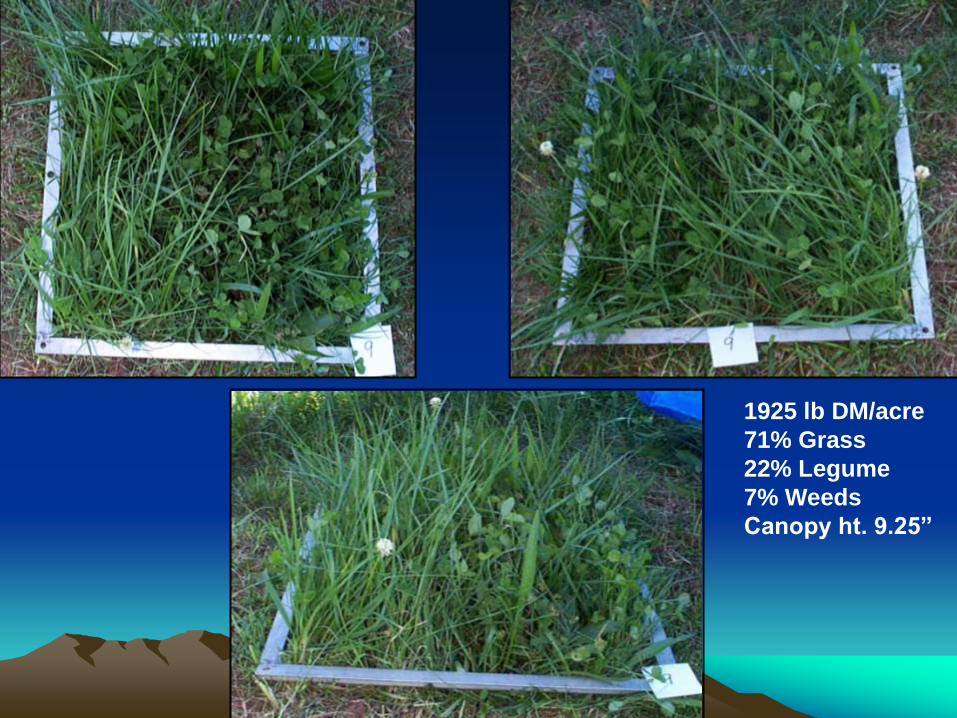
1925 lb DM/acre
71% Grass
22% Legume
7% Weeds
Canopy ht. 9.25”
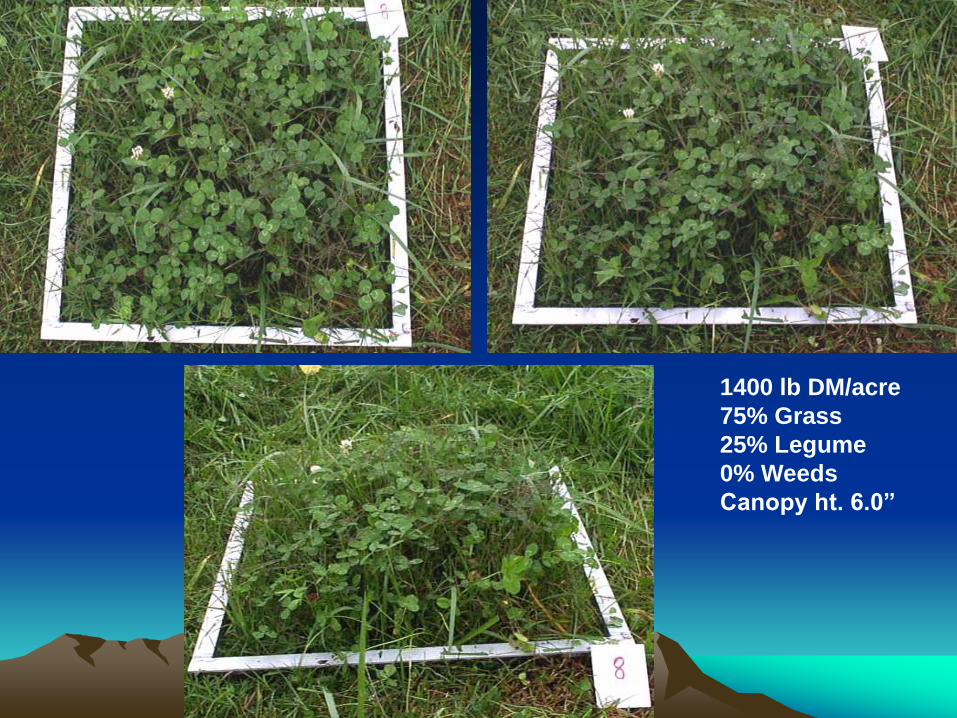
1400 lb DM/acre
75% Grass
25% Legume
0% Weeds
Canopy ht. 6.0”
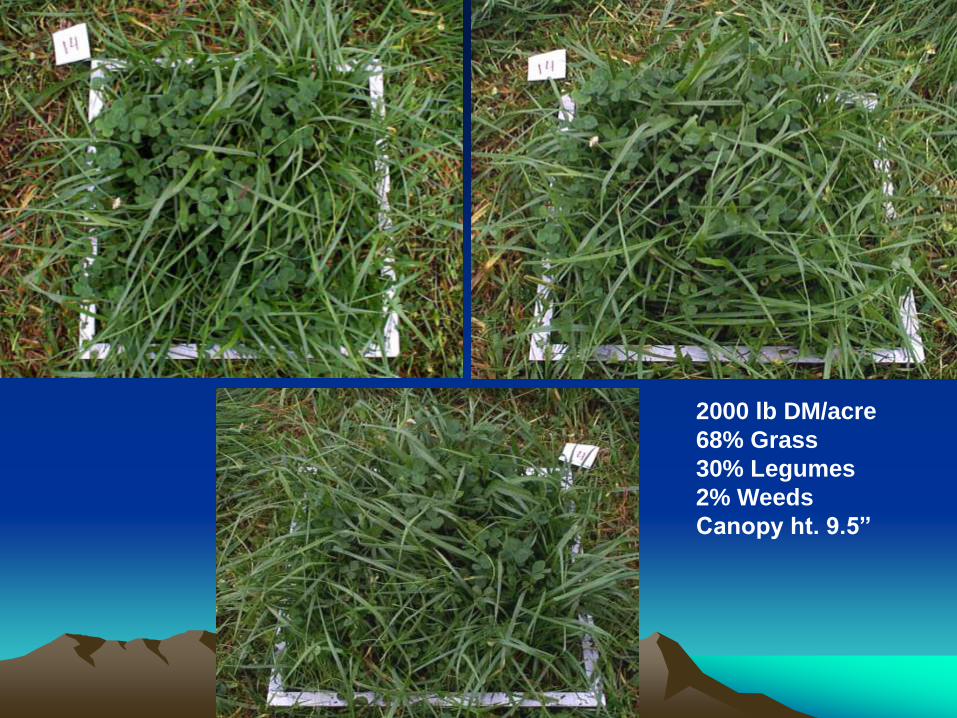
2000 lb DM/acre
68% Grass
30% Legumes
2% Weeds
Canopy ht. 9.5”
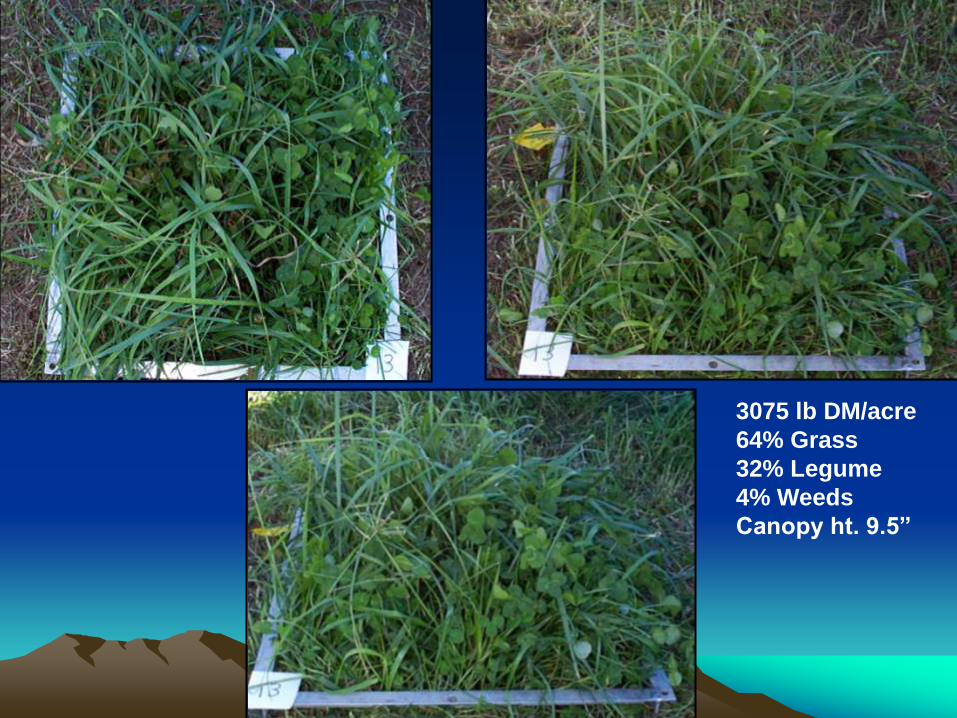
3075 lb DM/acre
64% Grass
32% Legume
4% Weeds
Canopy ht. 9.5”
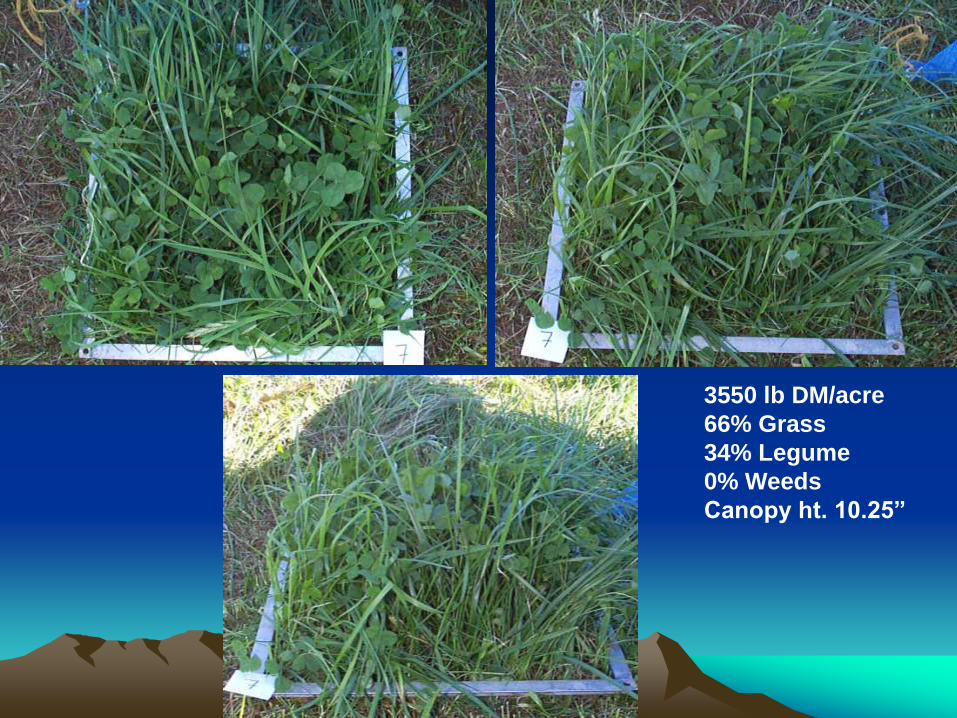
3550 lb DM/acre
66% Grass
34% Legume
0% Weeds
Canopy ht. 10.25”
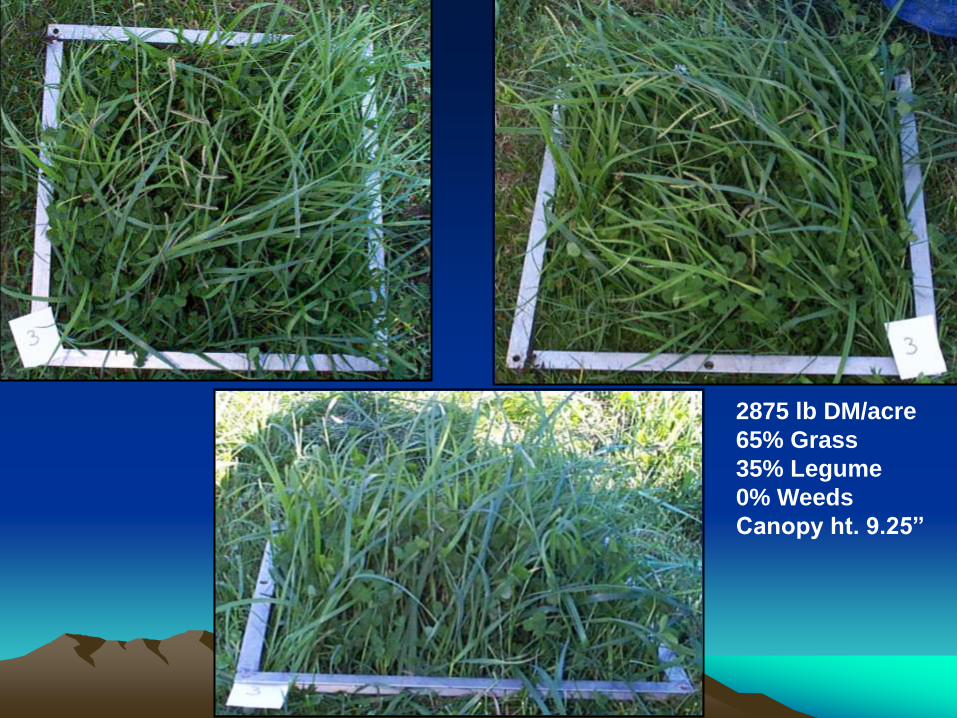
2875 lb DM/acre
65% Grass
35% Legume
0% Weeds
Canopy ht. 9.25”
Conclusion
Forage quantity and quality are two important pasture
characteristics that determine grazing days available per acre
and animal performance per head. Forage quantity or mass can
be estimated using ruler or plate meter canopy height and
appropriate calibrations for the pasture type being used. This
series of photos can help managers train their eye for
determining the botanical composition in pastures. A producers
skill at estimating forage quantity and quality will enable them
to improve the management of their livestock on pasture.
Other References
Rayburn, Ed. 2003. Point Count System for Measuring
Ground Cover from Digital Photos. WVU Extension
Service e-factsheet as Power Point Presentation.
Rayburn, Ed and John Lozier. 2003. Estimating Pasture
Forage Mass from Pasture Height. WVU Extension
Service e-factsheet.
Rayburn, Ed and John Lozier. 2003. A Falling Plate Meter
for Estimating Pasture Forage Mass. WVU Extension
Service e-factsheet.