Embed Size (px)
Citation preview
Report No. 39710 - AO
ANGOLA PUBLIC EXPENDITURE REVIEW (In Two Volumes) Volume 1: Policy Briefing MAY 2007 A Joint Report by:
European Commission (EC) Food and Agriculture Organization (FAO) United Nations Children’s Fund (UNICEF) United Nations Development Program (UNDP) World Health Organization (WHO)
The World Bank and Africa Region Macroeconomics 1
Document of the World Bank
Currency Equivalents Currency Unit: Angolan Kwanza (Kz)
USD= 79.845 Kwanza (Exchange Rate Effective as of April 30, 2007)
Weights and Measures Metric System
Fiscal Year of Budget: January 1 – December 31
Vice President: Obiageli K. Ezekwesili
Country Director: Michael Baxter Sector Manager: Emmanuel Akpa
Task Team Leader: Francisco Galrão Carneiro
TABLE OF CONTENTS
Executive Summary ..............................................................................................................viii Addressing Existing Challenges in Public Finance Management ................................................... ix Facing Trade Offs in Public Spending........................................................................................ x The Reform Agenda in Education ............................................................................................ xi The Reform Agenda in Health................................................................................................ xii The Reform Agenda in Agriculture..........................................................................................xiii Prospective Decentralization Scenarios ...................................................................................xiv
Foreword and Summary..........................................................................................................1
How the Report is Organized...................................................................................................1 Three Cross-Cutting Messages.................................................................................................2
Why a Multi-Year Approach to Budgeting is Useful? ...............................................................4
Remaining Challenges in Fiscal Management..........................................................................5
Short-Term Priorities and Ambitious Budgets ............................................................................5 Strengthening the Budget Process ...........................................................................................6 Budget Preparation ................................................................................................................6 Budget Execution...................................................................................................................7 Budget Monitoring .................................................................................................................8 Ring Fencing and Phasing Out of QFAs .....................................................................................9
Improving Spending in Education ......................................................................................... 12
Minding the Gap between Planning and Budgeting ................................................................... 12 Effectiveness of the Angolan Education System ....................................................................... 13 The Reform Agenda in Education ........................................................................................... 14
Increasing the Efficiency of Spending on Health ................................................................... 16
Strategic View and Oversight ................................................................................................ 16 The Structure of Spending on Health...................................................................................... 17 Strengthening Planning in the Health Sector ........................................................................... 20 Scenarios for Scaling Up Service Coverage ............................................................................. 22 The Reform Agenda in the Health Sector ................................................................................ 25 Inter-sectoral allocation........................................................................................................ 25 Intra-sectoral allocation........................................................................................................ 26 The budget preparation process ............................................................................................ 27 Financial management ......................................................................................................... 27 Monitoring of budget execution ............................................................................................. 28 Further decentralization........................................................................................................ 28 Primary network financing .................................................................................................... 29
Scaling Up Priority for Agriculture ........................................................................................ 32
Strategic Planning................................................................................................................ 32 Growing Importance in the Budget ........................................................................................ 33 Insufficient Availability of Rural Credit .................................................................................... 36 Decentralization and Market Orientation ................................................................................. 38 Competitiveness and the Real Exchange Rate.......................................................................... 39 The Reform Agenda in Agriculture.......................................................................................... 40
Prospective Decentralization Scenarios ................................................................................ 42
Scenario 1: Short-term Administrative Decentralization................................................... 42 The Legal Framework....................................................................................................... 42 The Political-Institutional Framework ................................................................................. 43 The Fiscal and Financial Framework ................................................................................... 45
Scenario 2: Medium-term Administrative Decentralization ............................................... 47 The Legal Framework....................................................................................................... 47 The Political-Institutional Framework ................................................................................. 47 The Fiscal and Financial Framework ................................................................................... 48
Scenario 3: Fiscal Decentralization ................................................................................... 48 The Legal Framework....................................................................................................... 49 The Institutional Framework ............................................................................................. 49 The Fiscal and Financial Framework ................................................................................... 50
- iii -

LIST OF BOXES BOX E1: CROSS-CUTTING POLICY ACTIONS AND EXPECTED IMPACTS ON PFM AND OUTCOMES ..............................XVII BOX 1: THE THEMES UNDERLYING THIS REPORT.......................................................................................2 BOX 2: SUMMARY OF PROGRESS ON SELECTED RECOMMENDATIONS OF THE PEMFAR ........................................ 11 BOX 3: PROPOSED CALENDAR FOR IMPLEMENTATION OF PROPOSALS ............................................................. 31 BOX 4: SUMMARY OF PROSPECTIVE DECENTRALIZATION SCENARIOS IN ANGOLA: MAJOR FEATURES ....................... 52
LIST OF FIGURES FIGURE 1: CHILD MORTALITY BY REGION................................................................................................ 20 FIGURE 2: DOCTORS PER 10,000 INHABITANTS....................................................................................... 20 FIGURE 3: PLANNED MARGINAL INCREASE OF SERVICE COVERAGE FOR THE NEXT THREE YEARS.............................. 22 FIGURE 4: GROWING CAPITAL SPENDING AT THE EXPENSE OF PERSONNEL AND SERVICES ..................................... 34 FIGURE 5: EVOLUTION OF REAL EXCHANGE RATES IN OIL COUNTRIES............................................................. 39
LIST OF TABLES TABLE 1: SHARE OF TOTAL EDUCATION EXPENDITURE PER PROVINCE FROM 1999 TO 2005.................................... 13 TABLE 2: BUDGET EXECUTION RATE FOR GOODS AND SERVICES IN MUNICIPAL, .................................................. 16 TABLE 3: GDP, TOTAL PUBLIC EXPENDITURES AND HEALTH EXPENDITURES ....................................................... 18 TABLE 4: BUDGET AND TOTAL PUBLIC HEALTH EXPENDITURES PER CAPITA (US$ ‘000) ......................................... 18 TABLE 5: PUBLIC HEALTH EXPENDITURES AND HEALTH INDICATORS IN SOME SADC COUNTRIES .............................. 19 TABLE 6: NUMBER OF DOCTORS AND NURSES IN THE NHS PER PROVINCE, 2005 ................................................ 19 TABLE 7: COST AND IMPACT OF SCALING UP SERVICE COVERAGE.................................................................. 23 TABLE 8: SOURCE OF FINANCING FOR AGRICULTURAL PROJECTS ................................................................... 34 TABLE 9: DISTRIBUTION OF INVESTMENT PROJECTS PER PROVINCE ................................................................ 35 TABLE 10:THEMATIC DISTRIBUTION OF INVESTMENT PROJECTS ..................................................................... 36
- iv -

ACRONYMS AND ABBREVIATIONS AUPEC Aberdeen University Petroleum Economics Consultancy BCI Banco de Comércio e Indústria BNA Banco Nacional de Angola BPC Banco de Poupança e Crédito CPI Consumer Price Index CUT Conta Única do Tesouro DHS Demographic and Health Survey DMFAS Debt Management Financial and Analysis System DNC Direcção Nacional de Contatibilidade DNI National Tax Directorate DNPE Direcção Nacional do Patrimonio do Estado DNRH Direcção Nacional de Recursos Humanos DU Dependent Unit EC European Commission ECP Estratégia de Combate à Pobreza EFA Education for All FAO Food and Agriculture Organization of the United Nations FAS Social Action Fund FQ Financial Quotas GAI Gabinete de Apoio Informático GAR Gross Admission Rate GDP Gross Domestic Product GEPE Gabinete de Estudos, Planeamento e Estatística GER Gross Enrollment Rate GEREI Cabinet of Studies and Foreign Relations HIS Health Information System IBAM Brazilian Institute of Municipal Administration IMN Instituto Médio Normal IMT Instituto Médio Técnico INE Instituto Nacional de Estatística INEDA Instituto Nacional de Educação de Adultos INF National Inspectorate of Finance MAPESS Ministério de Administração Pública, Emprego, e Segurança Social MCR Modified Completion Rates MDG Millennium Development Goals MEC Ministry of Education and Culture MECANAGRO National Agricultural Mechanization Company MICS Multiple Indicator Cluster Survey MINADER Ministério da Agricultura e Desenvolvimento Rural MINFIN Ministry of Finance MINPET Ministry of Petroleum MINPLAN Ministry of Planning MOH Ministry of Health MTA Ministry of Territorial Administration MTEF Medium-Term Expenditure Framework NHS National Health System OGE Orçamento Geral do Estado PASS Programa de Apoio ao Sector da Saúde PE Primary Education PEMFAR Public Expenditure Management and Financial Accountability Report PHD Provincial Health Directorate PIP Public Investment Program PSA Production Sharing Agreement PTR Pupil-Teacher Ratio QFA Quasi-Fiscal Activity SADC Southern Africa Development Community SAI Supreme Audit Institution SIGFE Sistema Integrado para a Gestão das Finanças do Estado SINGERH Integrated System for the Management of Public Employees SSA Sub-Saharan Africa UNDP United Nations Development Program UNICEF United Nations Children’s Fund WHO World Health Organization of the United Nations
- v -
ACKNOWLEDGEMENTS This Public Expenditure Review is the result of collaboration between the World Bank and a group of development partners of the Government of Angola that includes the United Nations Development Program (UNDP), the European Commission (EC), the Food and Agriculture Organization of the United Nations (FAO), the World Health Organization of the United Nations (WHO), and the United Nations Children’s Fund (UNICEF). Useful information and insights were provided by government officials in many departments in the Ministry of Education, Ministry of Health, Ministry of Agriculture and Rural Development, Ministry of Territorial Administration, Ministry of Planning, and Ministry of Finance. The collaboration between the World Bank and the development partners was formally agreed through a Memorandum of Understanding signed by the heads of the delegations in Angola in June 2006. The main counterpart in the Government was Mr. Manuel Neto da Costa, Head of the Cabinet of Studies and Foreign Relations of the Ministry of Finance (GEREI – MINFIN). The joint PER team extends its appreciation to Ms. Ana Dias Lourenço, Minister of Planning, Mr. José Pedro de Morais, Minister of Finance, Mr. Manoel Neto da Costa, Head of the Cabinet of Studies and Foreign Relations of the Ministry of Finance (GEREI – MINFIN), and to the Directors of Planning of the Ministries covered in this report for their support and active collaboration. For the World Bank, the task was managed by Francisco Carneiro (Sr. Country Economist, AFTP1), who was also the primary author of the report. The task team included Stefania Abakerli (Local Development Specialist, LCSSO), Jean-Jacques De St. Antoine (Lead Operations Officer, AFTH1), Feng Zhao (Health Specialist, AFTH1), Xiaoyan Liang (Sr. Education Specialist, AFTH1), Eduardo de Sousa (Sr. Economist, AFTS1), Maria Teresa Benito-Spinetto (Research Analyst, AFTP1). Contributions were made by the Bank consultants Mafalda Duarte (Education), Rui Fuschini (Education) José Roberto Rodrigues Afonso, Thereza Lobo, and Rafael Barroso (all Decentralization). Mr. Victor Hugo and Ms. Henda Ducados (Executive Director and Deputy Directors of FAS, respectively) offered useful comments and suggestions on the background paper on decentralization. Useful discussions on decentralization were also held with Serdar Yilmaz (Sr. Social Development Economist, SDV) and Rodrigo Serrano-Berthet (Local Development Specialist, HDNSP). The team is grateful to the Social Development Department (SDV) for funding the consultants who worked on decentralization. The UNDP, jointly with UNCDF, provided important contributions in the area of decentralization and this report draws partially on conclusions and recommendations which are contained in the report entitled “Diagnóstico da Descentralização Fiscal em Angola” of August 2006 authored by Maria Cristina Mac Dowell, Érika Amorim Araújo, Alexandre Sobreira Cialdini, and Nicoletta Ferruglio. The counterpart official from the UNDP in the PER team was Mr. Alfredo Teixeira. The European Commission contributed for the review of public expenditures in the health sector. The counterpart official from the EC in the PER team was Ms. Tamar Bello. The
- vi -

chapter on health draws partially on the analysis and policy recommendations which are contained in the report entitled “Angola: Despesa Pública no Sector da Saúde 2000-2006” prepared by the Programa de Apoio ao Sector da Saúde (PASS) for the Ministry of Health and published by the Ministry of Health early in 2007. Additional contributions to the review of public spending in the health sector were provided by staffs from the World Health Organization (WHO), and the United Nations Children’s Fund (UNICEF). The counterpart official at WHO was Mr. Ole Frank Nielsen and the counterpart official at UNICEF was Dr. Guy Clarisse. The Food and Agriculture Organization (FAO) contributed inputs for the review of public expenditures in the sector of agriculture. The chapter on agriculture draws on a background report prepared by Mr. Guillermo Woods (Consultant, FAO) entitled “Revisión de los Gastos y Inversiones Públicas Destinadas al Sector Agropecuário”. Mr. Francisco Chimuco (FAO) provided useful assistance in the contacts with the authorities and mission preparation for the work associated with the agriculture sector. The counterpart official at FAO was Mr. Frits Ohler. The several missions that were held to Angola in connection with this report were fully supported by the development partners. In the case of the analysis on health issues in particular, Dr. Guy Clarisse (Head of Health Team, UNICEF) and Dr. Fatoumata Binta T.Diallo (WHO Angola Representative) provided constructive advice and input in critical stages of the report. Mr. Lluis Vinyals (Consultant of the EU PASS team) provided documents and data needed by the mission. Dr. Alice Otiato (USAID) shared her knowledge and views on health service delivery. The mission appreciates the help provided by Dr. Kusunga (Director of Bengo Province Health Directorate) during the mission’s field help. Dr. Maria Julia Grave (HAMSET Project Office, MOH) offered instrumental help to set up meetings and field visits. The report was prepared under the overall supervision of Emmanuel Akpa (Sector Manager, AFTP1) who offered overall conceptual guidance, provided critical analytical advice and ensured quality control and management support. Michael Baxter, Country Director (AFCCS2), supported the process and provided the major guidelines. The peer reviewers, Jeffrey Lewis (DECVP), Delfin Go (AFRCE), and Sameh El-Saharty (MNSHD) provided valuable comments and suggestions in different stages of the report. The colleagues from the Country Office in Angola, especially Alberto Chueca-Mora (Country Manager, AFMAO), Olivier Lambert (Sr. Country Officer, AFMAO), and Christopher Porter (Consultant, AFMAO), provided superb support to the task team. Maria Margarida Baessa Mendes and Domingas Pegado provided excellent logistical support for the missions. Ligia Irias-Castillo went beyond the line of duty and showed outstanding commitment to make sure that the editorial quality of the report was kept at the highest standards.
- vii -
EXECUTIVE SUMMARY
Three Cross-cutting Messages
i. Three cross-cutting messages are drawn from the analysis of public spending and fiscal management in the context of this Public Expenditure Review:
The need to prepare public spending plans within a multi-year perspective The need to observe equity considerations in the preparation of the budget The need for steady progress with decentralization
ii. A multi-year approach to budgeting can contribute to improve the efficiency of public spending. The authorities need to strengthen the link between public expenditure policies and the budget process, especially at the sectoral level. At this point, public expenditure policies are established in a largely ad hoc manner and without the underpinning of a medium-term spending plan or strategy. In broad terms, Angola needs to consider how to frame its public expenditure policymaking within a medium to long term framework akin to the permanent income hypothesis in order to insulate the budget from the volatility associated with the price of oil.
iii. The introduction of equity considerations in the budget will help to reduce poverty and vulnerability. There are no technical criteria for the allocation of resources from the central government to the provinces. The richest provinces receive the same budget allocation as the poorest and more vulnerable ones. For a better geographical distribution, population and poverty indicators should be factored in the decision process. The authorities could also consider using criteria based on “positive discrimination” to support the provinces that suffered the most during the war to catch up with the others.
iv. Steady progress with the decentralization agenda is important. The authorities have taken the initiative to start a program of deconcentration and administrative decentralization. So far, the strategy of reform has been in terms of deconcentration (delegation of some responsibilities, while retaining fiscal control). This gradualist approach seems appropriate especially in light of the dearth of capacity in public administration that is especially acute outside Luanda. However, it is necessary to deepen this process in a more meaningful way and also start preparing the building blocks for some fiscal decentralization in the future.
v. A note of caution is necessary in relation to the quality and completeness of the data used in the preparation of this report. The reader is alerted that in many occasions the necessary information was either not available, or when available was of limited coverage, quality and usefulness, in particular in what concerns the sectors of Education and Agriculture. The Government now has a long-term plan to address this problem and it is hoped that data quality and coverage in Angola will improve substantially in the near future.
- viii -

Addressing Existing Challenges in Public Finance Management
vi. Over the next few years, Angola’s revenues from oil will be subject to three sources of variation, in addition to crude price volatility: (i) the changing composition of production; (ii) the increasing volume of extraction; and (iii) the increased importance of PSAs and its implications for the behavior of the State’s profit oil. Thus, more than desirable, it is very necessary that Angola adopts an approach to budgeting that goes beyond the one-year framework of the OGE, to avoid unnecessary disruptions in cash management and to correctly forecast the Government’s fiscal stance.
vii. The need for a multi-year approach to budgeting is even greater when it comes to establish sound public expenditure policies. The link between the latter – especially at the sectoral level – and the budget process is weak in many developing countries, and Angola is no exception. Public expenditure policies – including fuel price and utility tariff subsidies – are established in a largely ad hoc manner, and without the underpinning of a medium-term spending plan or strategy. Therefore, not only the links between policies and budgeting are weak, but the foundation for sound public expenditure policymaking is very shaky as well. The adoption of a medium-term approach to budgeting, therefore, has to be accompanied by a medium-term approach to public expenditure policy as well.
viii. The adoption of such medium-term approaches should be gradual and preceded by further strengthening of the budget process. It is not advisable to move to the outright implementation of a Medium-Term Expenditure Framework (MTEF). MTEFs cannot work if a solid budgetary management process – particularly as regards budget execution – is not in place. Insofar as Angola’s public financial management remains characterized by a dichotomy between formal and “non-conventional” mechanisms of budget execution, adopting an MTEF at this point in time will be difficult, if not impossible.
ix. Improvements in the recording and classification of public spending are necessary for a successful pro-poor public expenditure policy. A pervasive deficiency in the classification of public expenditures was noticed for all sectors covered in this Public Expenditure Review (Education, Health, and Agriculture). The authorities need to improve further the quality of public financial management so that the government can gain a better understanding of its public spending and increase the effectiveness of financial planning and programming. Key to that end is the steady commitment to finalize the implementation of the SIGFE and the need to improve the classification of public spending. Once these steps are concluded, it will be easier to design and implement a pro-poor public spending program.
x. The authorities have adopted a comprehensive model to forecast oil revenues, but sustainability of the new forecasting unit should be secured. In April 2006 the National Tax Directorate (DNI) in the Ministry of Finance formally adopted the Oil Revenue Forecasting Model developed by Aberdeen University Petroleum Economics Consultancy (AUPEC) in the context of the Oil Diagnostic Study. This is a step in the right direction. However, many of the staff in the unit are contracted and paid
- ix -

for by the AUPEC project and are not employed de facto by the Ministry of Finance. The government should exercise more ownership of the project and absorb its staff making them civil servants to guarantee continuity of the forecasting activities once the contract with AUPEC expires.
xi. Bolder improvements are needed on the auditing side of the budget process, which remains weak. The major problem remains in the realm of the relationship between Sonangol and the Ministry of Finance. Sonangol, at the Government’s request, undertakes a wide range of activities or tasks on behalf of the Government. In the past, the Government has sometimes failed to reimburse Sonangol, or has been delayed in doing so. Sonangol’s reaction has been to reduce the tax and profit oil payments it owes to the Government by the amount of the costs it has incurred on Government’s behalf. The consequences of this practice for effective revenue management are adverse. Disputes arise because in the past there has not been clarity on which activities qualify for offset treatment, and because expenditures under qualifying categories have not been audited.
xii. The ring-fencing of quasi-fiscal operations performed by Sonangol should also aim at addressing the issue of conflict of interests. Certain aspects of Sonangol’s role as concessionaire, notably its approval of all major procurement contracts create a significant potential for conflict of interest and loss of revenues to the Treasury. Further, the Government lacks the capacity to oversee effectively Sonangol’s revenues and investment programs. Ring-fencing these activities first within Sonangol would help prepare the transfer. A well defined and time-bound plan to achieve normalization in this process should be adopted by the authorities. However attention must be paid as part of the transition process to upgrade the resources, skills, training, internal procedures and reporting and communication within and among these institutions in order for them to be ready to take back ownership of the Treasury-like activities currently performed by Sonangol. These changes would involve improvements to salary structure, employee career planning and benefits, all of which would require commitment to institutional reform.
Facing Trade Offs in Public Spending
xiii. Sectoral spending on general public services and defense relative to total spending has been responsible for nearly half of the total expenditures. Education and health when considered together, on the other hand, remained responsible for roughly 10 percent of total expenditures while there was a doubling of the share of spending on social security, welfare, and housing in 2005 alone. The sectoral allocation relative to total spending for energy, agriculture, mining, and transportation declined steadily since 2003 from 22.5 percent to just 7 percent in 2005.
xiv. In practical terms, the increased spending on general goods, consumption, higher wages and benefits, means that the government may have to face trade offs in terms of public spending. Given the low level of social indicators and the challenges to be faced by the authorities in their reconstruction of the country, the existence of such trade offs is clear, since spending on education and health have remained at low levels
- x -
while expenditures with general public services and defense have increased much faster. Therefore, the low level of social indicators, partly as a result of decades of war and internal conflicts, call for a quick reprioritization of public spending in favor of social sectors, especially education, health, and agriculture, accompanied by a strategic rationalization of spending on other recurrent expenditures.
The Reform Agenda in Education
xv. The reform agenda in Education requires improvements in the capacity to plan more strategically, better public finance management, and the introduction of an effective monitoring and evaluation system. The review of public spending patterns and outcomes in the education sector revealed important weaknesses that need to be addressed. The strengthening of the overall budget system, as discussed in the previous paragraphs, is a pre-condition for additional reforms in the education sector. This is so because much of the problems faced by the sector today are the result of lack of correct prioritization (too much focus on recurrent spending and uncoordinated investments), and an ineffective system to monitor and evaluate the outcomes of public spending in education.
xvi. The planning and budgeting process need to include steps or mechanisms for coordination (budget preparation) and information sharing (budget preparation and execution of resources) between MEC and the Provincial Governments. This is particularly important because Provincial Governments manage the resources for the sub-system of education (primary grades 1-6) that should have the highest impact in the sector, since it is the level where most of the students are enrolled and the basis for achieving the MDGs and EFA goals. In addition, it is the most cost-effective way to address equity issues, a role that can best be played by a central structure and in this case by MEC as the institution with more specialized knowledge regarding education, the national asymmetries and its national implications.
xvii. Dramatic improvements are needed in the sector’s financial management system. Improvements are required in several instances ranging from budget preparation, disbursements, management of expenditures, expenditure classification and institutional capacity. An adequate financial management system would prevent payment of expenditures not budgeted for (except in special circumstances) which would in turn be an incentive to improve budget preparation. Regarding expenditure classification, it would be most relevant to separate in the functional classification the services of pre-primary and primary education and have a different function for teacher training which is different from secondary and technical education. In terms of institutional capacity, it should be also a priority to train those using the financial management system in inserting data according to the proper expenditure classification.
xviii. The capacity for monitoring and evaluation in the sector of education needs to be strengthened. Another policy recommendation relates to the establishment of a system to assess learning outcomes in all levels of the education system in Angola. A well functioning monitoring and evaluation system can provide information to the planning and decision-making levels as to whether those students who are actually
- xi -

graduating from each cycle of primary education have achieved the minimum standards of learning recognized internationally and whether the main causes of inefficiency of the education system are related to endogenous or exogenous factors to the system.
The Reform Agenda in Health
xix. The reform agenda in the health sector calls for scaled up spending and service coverage combined with better strategic planning, more effective monitoring and evaluation, and further decentralization. This Public Expenditure Review has identified inefficiencies in public spending on health that demand a more strategic approach to the sector. It is necessary to spend more on health, but the additional spending has to be accompanied by better planning, more equity, and effective monitoring and evaluation. Further decentralization is also necessary to improve the coverage of service provision, but this process has to be carefully designed and gradual and evolve at the same pace as capacity constraints are removed.
xx. In the medium term, Angola should increase public spending on health. This increase should be gradual so as to ensure an adequate absorption of resources by the sector. It is important that the expenditures be well channelled, with special attention to scaling up the coverage of services. To maximize the impact of the additional expenditure, this PER recommends that the country consider the following steps to scale up health service coverage:
Step 1: Undertake social mobilization and behavioral interventions as well as supply essential materials to households through community-based interventions. Step 2: Organize outreach and mobile teams to provide a set of standardized services to populations without access to health facilities. Step 3: Expand the primary health care network to provide preventive and basic curative care. Step 4: Strengthen the first level referral care that can provide comprehensive and emergency health care. Step 5: Improve the second-level referral care that can provide specialized care.
xxi. Technical criteria for resource distribution should be introduced. Health sector allocation and expenditures are made on ad hoc basis. This results in an inequitable and inefficient distribution of resources. For a better geographical distribution, population and poverty indicators could be used, especially if information systems and national statistics are improved in the medium term. Health personnel distribution can be another criterion. The government should also consider adopting a system of “positive discrimination” to help the provinces that suffered the most during the war catch up with the others.
- xii -

xxii. The health sector needs a Strategic Investment Plan. Investment spending has increased rapidly in recent years but this rehabilitation effort has not been preceded by a needs analysis and a proper planning of the desired health network. Also, there is insufficient coordination between the central and those provincial governments and other partners. Investment spending should be based on a map of the existing health network and projections of different scenarios with their costs. Such a map is currently being prepared in five provinces, and this exercise should be expanded to the whole country, as quickly as possible in order to reorient the investments already planned.
xxiii. The MOH should build its capacity and create instruments allowing the government to monitor Angola’s progress towards the Millennium Development Goals. The MOH should work with INE to ensure that surveys are periodically conducted to evaluate the health status of the population. The most important is to undertake a Demographic and Health Survey (DHS). As population data are essential for decision making in the sector, the MOH should also promote the undertaking of a population census.
xxiv. The MOH should work with the MOF to review budget categories, within the limits established by the State General Plan of Accounts. The instruments available for financial and technical performance monitoring do not allow evaluating progress in the health sector. It is also necessary to evaluate the usefulness of the current program classifier. A classifier per level of care (primary network, maternities, and general hospitals, specialized and central hospitals) would provide the information relevant for macro decision-making. Finally, when redesigning the Health Information System (HIS), it is essential to develop an interface with SIGFE and SINGERH. This will allow SIGFE to provide information for the analysis of cost-effectiveness or unit costs of the facilities.
xxv. As the government reviews the National Health Policy and redefines the decentralization of local administrations, it should clearly define the role of each level. The change from a deconcentration model to the current decentralized one has not been accompanied by measures to transfer responsibilities for the provision of services that used to be centralized in the MOH. For example, the public health programs of the central level still implement activities at municipal level, while the same programs at provincial level have practically no resources available. The definition of responsibilities should be followed by the transfer of corresponding financial resources, and a major effort to create capacity. This should result in the channelling of much more resources to the provincial level, especially for goods and services. The implementation of this change would take several years and should be designed accordingly.
The Reform Agenda in Agriculture
xxvi. The reform agenda in Agriculture includes scaled up priority for the sector in the budget, better distribution of investment programs (more equity), more accessible credit, and improvements in infrastructure rehabilitation. The review of public spending patterns in the sector of agriculture revealed that this sector has not been receiving the degree of attention that it deserves vis à vis its potential as a source of employment and incomes. Public spending in agriculture is concentrated on a few big
- xiii -
projects in the wealthier parts of the country and do little to reduce existing disparities. Credit constraints and lack of appropriate infrastructure also limit the potentialities of the sector.
xxvii. Total spending in agriculture should increase in volume and in coverage. Total spending in agriculture is still low, representing 1.33% of the total budget, and concentrated in a few geographic areas and themes. While prioritization must necessarily occur, and initial efforts will of course not happen simultaneously in all parts of the country, it is essential that the government’s vision and strategy have a coherent national focus, with activities in each area appropriate to that region’s advantages and possibilities. This means that investments should not be at odds with long run potentials, but must also take into account current evaluations of profitability and market access.
xxviii. There should be a clear strategy to gradually decentralize the execution of public spending and investment in agriculture to the provincial level. Given the characteristics of the agricultural sector, its vast agro-climatic zones, market proximity, and infrastructure needs, it seems that a faster pace of administrative decentralization of public spending in agriculture is warranted in Angola.
xxix. To help private sector development in agriculture and job creation, credit access to farmers should be made easier. Microcredit experiences around the world suggest that this is an area that works best with the least involvement from the government. In Angola, the few successful experiences that have appeared in the recent past, such as Banco Sol and Novo Banco, which have been mediated by NGOs, should be encouraged to develop so that smallholders who usually find it difficult to obtain credit from formal and official sources can be benefited.
xxx. Public spending and investment in agriculture should be oriented towards infrastructure rehabilitation and extension activities and research, prioritizing the smallholders. Most of the agricultural projects supported with public funds currently in Angola are concerned with the support to rehabilitation of large-scale irrigation schemes, and acquisition of heavy machinery and tractors. At the same time, public spending on extension and research projects has been very limited. With the infrastructure needs of the country stemming from the long civil war and the fact that Angola is currently experiencing a substantive oil boom, transportation costs are high, access to markets are almost non-existing, and the country has to deal with a significant appreciation of the real exchange rate. Under this scenario, the current focus of the central government on infrastructure rehabilitation is appropriate, but there should also be more attention to research and extension activities which can help increase productivity in the medium term and reduce unit costs, which by its turn would be helpful in dealing with the effects of an appreciated exchange rate in the sector.
Prospective Decentralization Scenarios
xxxi. A readily available decentralization benchmark that could be recommended for Angola is out of the question. The experience of different countries regarding the organization of the state and its fiscal system is very diverse. Also, the attempt to group
- xiv -
some characteristics and indicate the most appropriate model is quite problematic, since a large number of models are available. This Public Expenditure Review discusses three sequential scenarios for the decentralization process in Angola. These scenarios include the government, civil society, and the private sector. The participation of these sectors is considered to be essential for a better organization, coherence and effectiveness of the process. Underlying the scenarios is that the sharing of power, resources and accountability to subnational governments should prioritize the local sphere (municipal administrations).
xxxii. The first two scenarios are characterized by the implementation of a gradual process of administrative changes. These changes could be carried out within two periods of 3 (three) years each. The aim is to cover a time horizon that allows assessing the development of the process. The assessment at the end of the first period will be important to define the paths for the expansion of decentralization in the subsequent period. The second three-year period should include a larger number of subnational government units and a larger basket of public services to be carried out locally. In financial terms, the transfers from the central government to subnational governments would be limited.
xxxiii. Fiscal decentralization is the ideal outcome scenario. This scenario should include direct elections for subnational authorities and the transfer of all basic services to subnational governments. It would also be necessary to establish a national system for the transfer of funds, control the indebtedness capacity of subnational governments, and to grant more autonomy over the collection of typically local taxes. The major objective is to provide reasonable autonomy for subnational governments to exercise their power, and take hold of their expenditures through a more autonomous fiscal administration. This, however, is considered to be the hardest part.
xxxiv. An array of measures should be adopted in order to grant subnational governments’ full autonomy so that they can perform their functions with regard to the major legal action of the decentralization process. First, a general tax and oil revenue sharing fund should be created. This fund for revenues obtained from the central government and to be distributed to subnational governments should have the following characteristics:
• The fund must contain a percentage value on the revenue product. This percentage must be fixed and previously established by some legal act, and should not be liable to any changes by the federal government’s executive branch and should not depend on the allocation of funds in the budget or be subject to financial programming;
• This general fund should be transferred on a monthly basis, on the same date that was proposed in the case of the very first scenario, to decentralized programs via agreements; occasionally, the transfers may be carried out on a fortnightly or weekly basis;
- xv -
• The criteria for allocation of funds should also be predefined in the same legal act and should consider the population of each jurisdiction as a basic criterion, in addition to other municipal indicators closely related to the demand for public goods and services (a proxy that can be easily assessed and updated is the household consumption of electricity, at least in urban areas);
xxxv. Municipal governments could be allowed to use the revenues from municipal taxes and the most developed ones may even contract loans. This process, however, should not be so decentralized as that of social services. Based on the historical, social and economic characteristics of the country, the power over these two types of revenues should remain in the hands of the central government. Therefore, the implementation, definition of tax rates and regulation of taxes (e.g.: property tax, or even taxes on the delivery of services, business licenses) should still be under the responsibility of the central government, but the management of tax revenues should be delegated to municipal governments. In the third scenario, changes may be proposed to the central government, with the definition of different and higher tax rates for better developed regions – which could be collected as additional rates.
xxxvi. A summary of the main policy actions recommended in this report along with their expected impacts on public finance management and outcomes is presented in Box E.1. The policy options vary from short-term and highly politically feasible to medium- to long-term and moderately politically feasible measures. They are expected to increase efficiency and transparency in public spending while also contributing to scale up service delivery and accountability.
- xvi -
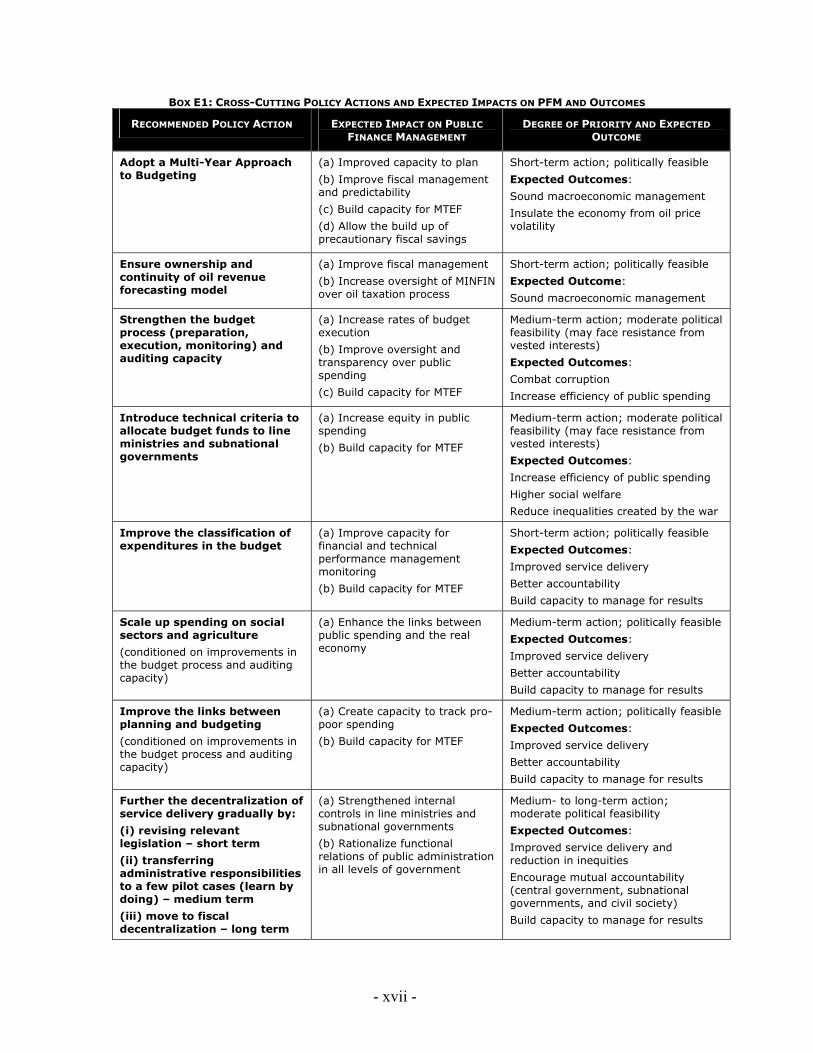
BOX E1: CROSS-CUTTING POLICY ACTIONS AND EXPECTED IMPACTS ON PFM AND OUTCOMES
RECOMMENDED POLICY ACTION EXPECTED IMPACT ON PUBLIC FINANCE MANAGEMENT
DEGREE OF PRIORITY AND EXPECTED OUTCOME
Adopt a Multi-Year Approach to Budgeting
(a) Improved capacity to plan
(b) Improve fiscal management and predictability
(c) Build capacity for MTEF
(d) Allow the build up of precautionary fiscal savings
Short-term action; politically feasible
Expected Outcomes:
Sound macroeconomic management
Insulate the economy from oil price volatility
Ensure ownership and continuity of oil revenue forecasting model
(a) Improve fiscal management
(b) Increase oversight of MINFIN over oil taxation process
Short-term action; politically feasible
Expected Outcome:
Sound macroeconomic management
Strengthen the budget process (preparation, execution, monitoring) and auditing capacity
(a) Increase rates of budget execution
(b) Improve oversight and transparency over public spending
(c) Build capacity for MTEF
Medium-term action; moderate political feasibility (may face resistance from vested interests)
Expected Outcomes:
Combat corruption
Increase efficiency of public spending
Introduce technical criteria to allocate budget funds to line ministries and subnational governments
(a) Increase equity in public spending
(b) Build capacity for MTEF
Medium-term action; moderate political feasibility (may face resistance from vested interests)
Expected Outcomes:
Increase efficiency of public spending
Higher social welfare
Reduce inequalities created by the war
Improve the classification of expenditures in the budget
(a) Improve capacity for financial and technical performance management monitoring
(b) Build capacity for MTEF
Short-term action; politically feasible
Expected Outcomes:
Improved service delivery
Better accountability
Build capacity to manage for results
Scale up spending on social sectors and agriculture
(conditioned on improvements in the budget process and auditing capacity)
(a) Enhance the links between public spending and the real economy
Medium-term action; politically feasible
Expected Outcomes:
Improved service delivery
Better accountability
Build capacity to manage for results
Improve the links between planning and budgeting
(conditioned on improvements in the budget process and auditing capacity)
(a) Create capacity to track pro-poor spending
(b) Build capacity for MTEF
Medium-term action; politically feasible
Expected Outcomes:
Improved service delivery
Better accountability
Build capacity to manage for results
Further the decentralization of service delivery gradually by:
(i) revising relevant legislation – short term
(ii) transferring administrative responsibilities to a few pilot cases (learn by doing) – medium term
(iii) move to fiscal decentralization – long term
(a) Strengthened internal controls in line ministries and subnational governments
(b) Rationalize functional relations of public administration in all levels of government
Medium- to long-term action; moderate political feasibility
Expected Outcomes:
Improved service delivery and reduction in inequities
Encourage mutual accountability (central government, subnational governments, and civil society)
Build capacity to manage for results
- xvii -

FOREWORD AND SUMMARY
How the Report is Organized
1. This Public Expenditure Review (PER) is organized in two volumes and covers the sectors of Education, Health, Agriculture, and the area of decentralization. These sectors were chosen because of their importance and their potential to contribute to poverty reduction through enhanced service delivery (Education and Health) and generation of employment and incomes (Agriculture). The scope of the inquiry is limited due to data limitations. Infrastructure, although important, is omitted because information is scant and difficult to reconcile at this point in time in Angola. It is hoped that as the budget process is strengthened and statistical capacity building takes place, future PERs may have a broader scope and coverage.
2. The main objective of this Public Expenditure Review is to examine the allocative efficiency and equity of public spending in Angola. The report investigates the composition and structure of public spending across sectors and identifies areas where trade offs and synergies are to be found. The PER also discusses options to support the government to prioritize public interventions from its budget in terms of efficiency and equity (impact on poverty), and reviews the milestones achieved in what regards the reform agenda outlined in the PEMFAR of 2005. While there have been noteworthy progresses in strengthening the budget process, there is a need to phase out the quasi-fiscal operations performed by Sonangol and separate out its commercial and regulator roles which are prone to conflicts of interest.
3. The PER is a joint product of the World Bank and several development partners of the Government of Angola. The Government of Angola supported the process underlying this Public Expenditure Review since its inception in June 2006. The report is the result of collaboration between the World Bank and several development partners that include the European Commission (EC), the Food and Agriculture Organization of the United Nations (FAO), the World Health Organization of the United Nations (WHO), the United Nations Development Program (UNDP), and the United Nations Children’s Fund (UNICEF).
4. This volume is a policy briefing and outlines the main findings and policy options associated with the analysis of public spending in terms of equity and allocative efficiency. This volume starts with a discussion on the importance of introducing a multi-year approach to budgeting and of the remaining challenges that have to be addressed in the area of public financial management. The analysis then focuses on the thematic discussions covering the sectors of Education, Health, and Agriculture. A final section puts forward three prospective scenarios for administrative and fiscal decentralization in Angola. For those interested in more detail, a fuller assessment for each sector and on decentralization (including comparative international evidence) is presented in the accompanying Volume II, on which this policy briefing is based.
- 1 -

Three Cross-Cutting Messages
5. A first cross-cutting message of this report is that Angola needs to introduce a multi-year approach to budgeting to use its growing wealth in a more strategic way. The post-conflict status of the country has associated with it huge needs in terms of physical and human capital investments. Deficiencies in public financial management are being addressed at a gradual pace, but mineral wealth is growing fast with favorable scenarios in the diamond and oil sectors. This poses a challenge to the authorities at this point as accumulation and management of abundant windfall revenues becomes particularly difficult when country systems are not properly developed to absorb growing financial flows. At this point, public expenditure policies are established without the underpinning of a medium-term spending plan or strategy. In very broad terms, Angola needs a stronger link between policies and budgeting, but most importantly it also needs to consider how to frame its public expenditure policymaking within a medium to long term framework to secure the lasting benefits of mineral wealth.
6. A second cross-cutting message is that the existing regional, economic and social inequalities in the country call for the introduction of equity criteria in the preparation and execution of the budget. The allocation of revenues to the different sectors is made on ad hoc basis and does not follow any technical criteria. For example, when the price of oil increased in 2005, each province received an additional amount of US$20 million for investment, regardless of their needs or relative size. This lack of objective criteria favors provinces with a smaller population and could perpetuate existing distortions. For a better geographical distribution, population and poverty indicators should be factored in the decision process. The authorities could also consider using criteria based on “positive discrimination” to support the provinces that suffered the most during the war to catch up with the others.
7. A third cross-cutting message is the need for further decentralization. In practice, the administrative system remains highly centralized in Angola. Some progress has been made with deconcentration to the provincial and commune levels in education and health, but not so much in the case of agriculture. The new legislation also carries some confusion as regards concurrent competencies. Concurrence of competencies pose a serious risk of wastage of efforts and resources, difficulty to determine accountability for the provision of services, and institutional conflicts provoked by the absence of boundaries between different powers. The government should continue to gradually decentralize administrative responsibilities and devise a plan to start introducing some fiscal decentralization in the system accompanied by an increase in the amount of training in public administration at the local level. Full decentralization may take years to materialize, but it is important to think strategically and follow principles of good governance when the existing legal framework is reformed and new laws and decrees are created.
- 2 -
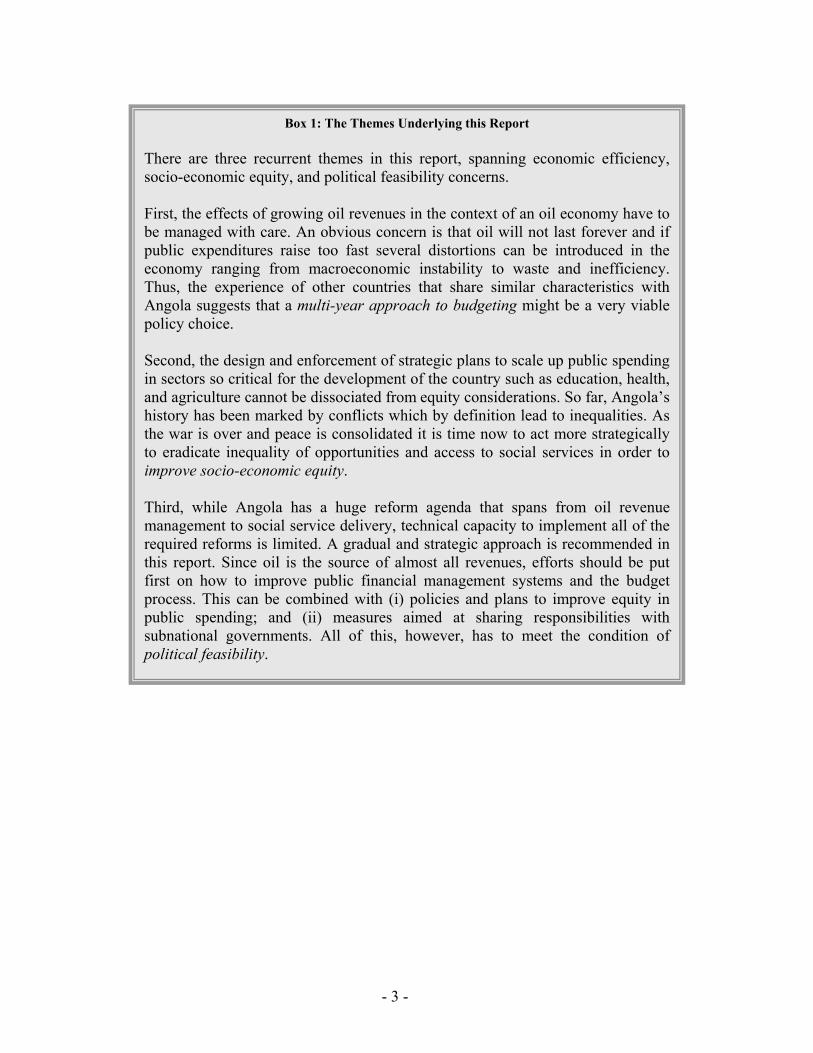
Box 1: The Themes Underlying this Report There are three recurrent themes in this report, spanning economic efficiency, socio-economic equity, and political feasibility concerns. First, the effects of growing oil revenues in the context of an oil economy have to be managed with care. An obvious concern is that oil will not last forever and if public expenditures raise too fast several distortions can be introduced in the economy ranging from macroeconomic instability to waste and inefficiency. Thus, the experience of other countries that share similar characteristics with Angola suggests that a multi-year approach to budgeting might be a very viable policy choice. Second, the design and enforcement of strategic plans to scale up public spending in sectors so critical for the development of the country such as education, health, and agriculture cannot be dissociated from equity considerations. So far, Angola’s history has been marked by conflicts which by definition lead to inequalities. As the war is over and peace is consolidated it is time now to act more strategically to eradicate inequality of opportunities and access to social services in order to improve socio-economic equity. Third, while Angola has a huge reform agenda that spans from oil revenue management to social service delivery, technical capacity to implement all of the required reforms is limited. A gradual and strategic approach is recommended in this report. Since oil is the source of almost all revenues, efforts should be put first on how to improve public financial management systems and the budget process. This can be combined with (i) policies and plans to improve equity in public spending; and (ii) measures aimed at sharing responsibilities with subnational governments. All of this, however, has to meet the condition of political feasibility.
- 3 -

WHY A MULTI-YEAR APPROACH TO BUDGETING IS USEFUL?
8. The macroeconomic outlook remains favorable, but sustainability will require better medium-term expenditure planning. The external current account recorded another surplus at 11.4 percent of GDP in 2006 and gross international reserves reached about 5.7 months of non-oil imports at end-2006. Fiscal revenues should continue to grow robustly with growing oil production until 2010-11 (see Figures 1 and 2 below). They are currently the equivalent to 46.7 percent of GDP and are forecast to decline to 32.5 percent of GDP by 2011. Fiscal spending, on the other hand, is currently the equivalent to 37.5 percent of GDP (2006) and is expected to reach 33.2 percent of GDP by 2011. Under this scenario, that does not assume new oil discoveries, fiscal surpluses would disappear in the medium-term, as oil revenues decline as a percentage of GDP. The first priority for the government in this context is to prepare a clear strategy to manage the oil revenues in the medium to long-term.
9. Over the next few years, Angola’s revenues from oil will be subject to three sources of variation, in addition to crude price volatility: (i) the changing composition of production; (ii) the increasing volume of extraction; and (iii) the increased importance of PSAs and its implications for the behavior of the State’s profit oil. Thus, more than desirable, it is very necessary that Angola adopts an approach to budgeting that goes beyond the one-year framework of the OGE, to avoid unnecessary disruptions in cash management and to correctly forecast the Government’s fiscal stance. In particular, the Government should take advantage of tailor-made instruments, such as the recently adopted Oil Revenue Forecasting Model, to improve the quality and reliability of oil revenue forecasts, over a multi-year period.
10. The need for a multi-year approach to budgeting is even greater when it comes to establish sound public expenditure policies. The link between the latter – especially at the sectoral level – and the budget process is weak in many developing countries, and Angola is no exception. Public expenditure policies – including fuel price and utility tariff subsidies – are established in a largely ad hoc manner, and without the underpinning of a medium-term spending plan or strategy. Therefore, not only the links between policies and budgeting are weak, but the foundation for sound public expenditure policymaking is very shaky as well. The adoption of a medium-term approach to budgeting, therefore, has to be accompanied by a medium-term approach to public expenditure policy as well.
11. The adoption of such medium-term approaches should be gradual. It is not advisable to move to the outright implementation of a Medium-Term Expenditure Framework (MTEF). As pointed out by recent literature (see Le Houerou and Taliercio (2002)), MTEFs cannot work if a solid budgetary management process – particularly as regards budget execution – is not in place. Insofar as Angola’s public financial management remains characterized by a dichotomy between formal and “non-conventional” mechanisms of budget execution, adopting an MTEF at this point in time will be difficult, if not impossible. But this does not prevent the Government from moving towards the conditions required for a successful MTEF.
- 4 -
REMAINING CHALLENGES IN FISCAL MANAGEMENT
Short-Term Priorities and Ambitious Budgets
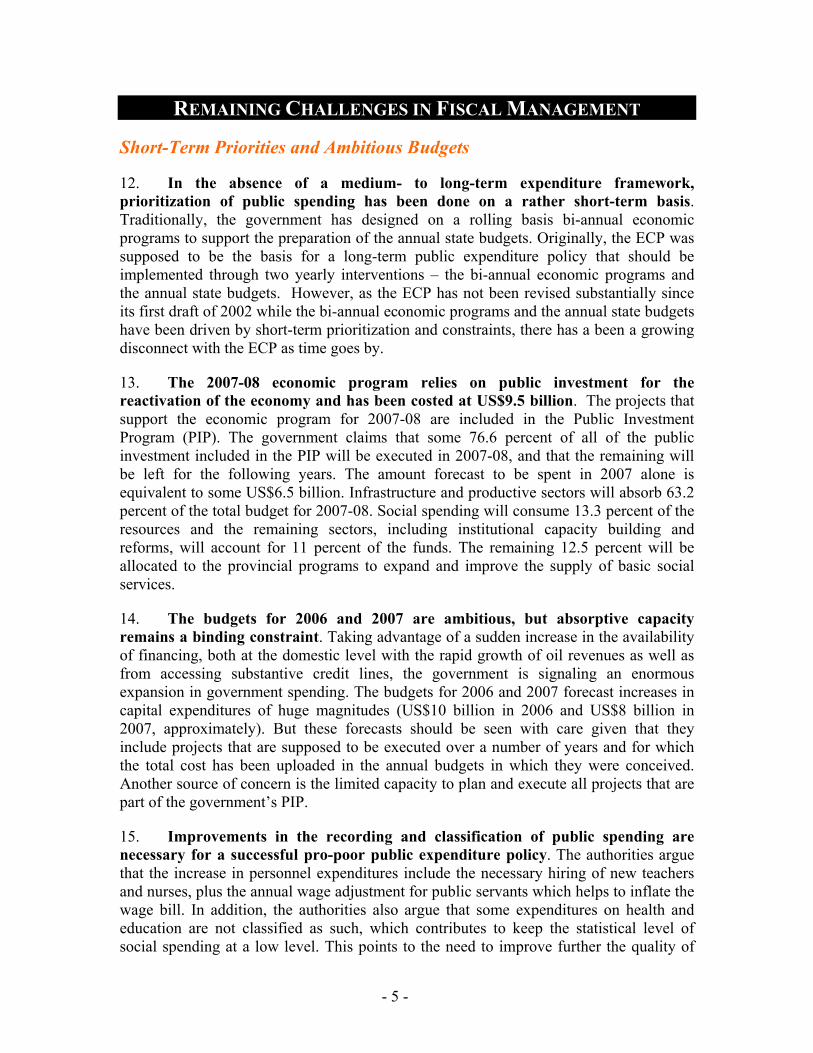
12. In the absence of a medium- to long-term expenditure framework, prioritization of public spending has been done on a rather short-term basis. Traditionally, the government has designed on a rolling basis bi-annual economic programs to support the preparation of the annual state budgets. Originally, the ECP was supposed to be the basis for a long-term public expenditure policy that should be implemented through two yearly interventions – the bi-annual economic programs and the annual state budgets. However, as the ECP has not been revised substantially since its first draft of 2002 while the bi-annual economic programs and the annual state budgets have been driven by short-term prioritization and constraints, there has a been a growing disconnect with the ECP as time goes by.
13. The 2007-08 economic program relies on public investment for the reactivation of the economy and has been costed at US$9.5 billion. The projects that support the economic program for 2007-08 are included in the Public Investment Program (PIP). The government claims that some 76.6 percent of all of the public investment included in the PIP will be executed in 2007-08, and that the remaining will be left for the following years. The amount forecast to be spent in 2007 alone is equivalent to some US$6.5 billion. Infrastructure and productive sectors will absorb 63.2 percent of the total budget for 2007-08. Social spending will consume 13.3 percent of the resources and the remaining sectors, including institutional capacity building and reforms, will account for 11 percent of the funds. The remaining 12.5 percent will be allocated to the provincial programs to expand and improve the supply of basic social services.
14. The budgets for 2006 and 2007 are ambitious, but absorptive capacity remains a binding constraint. Taking advantage of a sudden increase in the availability of financing, both at the domestic level with the rapid growth of oil revenues as well as from accessing substantive credit lines, the government is signaling an enormous expansion in government spending. The budgets for 2006 and 2007 forecast increases in capital expenditures of huge magnitudes (US$10 billion in 2006 and US$8 billion in 2007, approximately). But these forecasts should be seen with care given that they include projects that are supposed to be executed over a number of years and for which the total cost has been uploaded in the annual budgets in which they were conceived. Another source of concern is the limited capacity to plan and execute all projects that are part of the government’s PIP.
15. Improvements in the recording and classification of public spending are necessary for a successful pro-poor public expenditure policy. The authorities argue that the increase in personnel expenditures include the necessary hiring of new teachers and nurses, plus the annual wage adjustment for public servants which helps to inflate the wage bill. In addition, the authorities also argue that some expenditures on health and education are not classified as such, which contributes to keep the statistical level of social spending at a low level. This points to the need to improve further the quality of
- 5 -
public financial management so that the government can gain a better understanding of its public spending and increase the effectiveness of financial planning and programming. Key to that end is the steady commitment to finalize the implementation of the SIGFE and the need to improve the classification of public spending. Once these steps are concluded, it will be easier to design and implement a pro-poor public spending program.
Strengthening the Budget Process
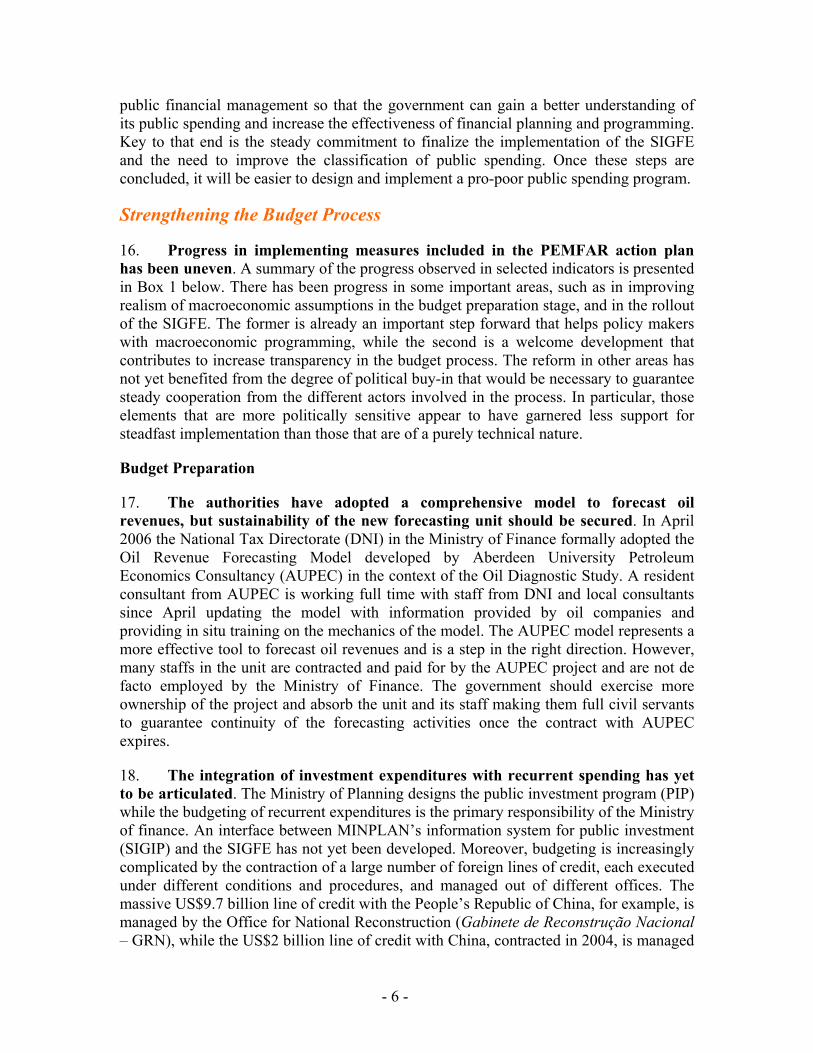
16. Progress in implementing measures included in the PEMFAR action plan has been uneven. A summary of the progress observed in selected indicators is presented in Box 1 below. There has been progress in some important areas, such as in improving realism of macroeconomic assumptions in the budget preparation stage, and in the rollout of the SIGFE. The former is already an important step forward that helps policy makers with macroeconomic programming, while the second is a welcome development that contributes to increase transparency in the budget process. The reform in other areas has not yet benefited from the degree of political buy-in that would be necessary to guarantee steady cooperation from the different actors involved in the process. In particular, those elements that are more politically sensitive appear to have garnered less support for steadfast implementation than those that are of a purely technical nature.
Budget Preparation
17. The authorities have adopted a comprehensive model to forecast oil revenues, but sustainability of the new forecasting unit should be secured. In April 2006 the National Tax Directorate (DNI) in the Ministry of Finance formally adopted the Oil Revenue Forecasting Model developed by Aberdeen University Petroleum Economics Consultancy (AUPEC) in the context of the Oil Diagnostic Study. A resident consultant from AUPEC is working full time with staff from DNI and local consultants since April updating the model with information provided by oil companies and providing in situ training on the mechanics of the model. The AUPEC model represents a more effective tool to forecast oil revenues and is a step in the right direction. However, many staffs in the unit are contracted and paid for by the AUPEC project and are not de facto employed by the Ministry of Finance. The government should exercise more ownership of the project and absorb the unit and its staff making them full civil servants to guarantee continuity of the forecasting activities once the contract with AUPEC expires.
18. The integration of investment expenditures with recurrent spending has yet to be articulated. The Ministry of Planning designs the public investment program (PIP) while the budgeting of recurrent expenditures is the primary responsibility of the Ministry of finance. An interface between MINPLAN’s information system for public investment (SIGIP) and the SIGFE has not yet been developed. Moreover, budgeting is increasingly complicated by the contraction of a large number of foreign lines of credit, each executed under different conditions and procedures, and managed out of different offices. The massive US$9.7 billion line of credit with the People’s Republic of China, for example, is managed by the Office for National Reconstruction (Gabinete de Reconstrução Nacional – GRN), while the US$2 billion line of credit with China, contracted in 2004, is managed
- 6 -

by an office created specifically to manage this loan in the Ministry of Finance (GAC - ???). This adds complexity to a system that is already characterized by weak capacity to program and assess investment projects. The consequence is that very often the full amount for multiyear projects are budgeted within a single year, while the cash required from the Angolan government to start up the projects is under budgeted.
19. There are lingering deficiencies in the budgeting of personnel expenditures. The budget is formulated based on the payroll database maintained by MAPESS. The information on personnel entered in the SIGFE is provided by the Informatics Support Office (Gabinete de Apoio Informático - GAI) at the Ministry of Finance. The GAI updates the MAPESS database by adding information on newly hired civil servants. The interface between the GAI database and the SIGFE is poor, and data are still entered into the SIGFE manually. SIGFE does not maintain detailed information on wage costs, which are contained in the two payroll databases; and the system can only access financial information on wages by spending units. In practice, thus, the government is using two different databases in parallel. Moreover, neither includes the military.
Budget Execution
20. There has been progress in the rollout of SIGFE. The SIGFE became operational in 2004 covering the province of Luanda and as of mid-2006, the system had expanded to the eight largest provinces of Angola.1 According to the authorities, these provinces execute some 70 percent of the relevant categories of government expenditure. The authorities’ plans are to incorporate six more provinces in 2006 and to have the system rolled out to the final four provinces, to missions abroad, and to some autonomous budget units by 2008. The partial rollout to the provinces seems to have yielded positive results. The authorities report that the spending units seem to be improving their compliance with the stages of budget execution envisaged in Angola’s Organic Budget Law. As the Organic Budget Law requires, the SIGFE also includes a double-entry accounting system that is already operational, moving away from the old cash-based, single entry accounting system.
21. While recent progress has concentrated on the expenditure side, coverage of revenue inputs remains incomplete. The SIGFE is supposed to be fed with information on tax receipts at three stages of the tax collection process: (1) tax liabilities self-assessed by taxpayers; (2) tax liabilities that are then paid to the banking system; and (3) tax payments transferred from the banking system into the Treasury’s single account (CUT) at the BNA. However, the SIGFE currently receives information only on the last stage—tax payments transferred to the CUT—and with a 30-day delay. Fuller data are managed by the Tax Directorate on electronic platforms that are incompatible with the SIGFE. Accurate information on accrued tax payments is crucial for financial programming and monthly cash plans for the budget execution units. If this is information is not available or is not accurate, it becomes very difficult to keep expenditures within the budget
1 Luanda, Bengo, Benguela, Kwanza Sul, Huila, Namibe, Cunene, and Cabinda.
- 7 -

ceilings. This situation makes it urgent to develop an automatic interface between the systems or a tax-control system that might be linked directly to SIGFE.
22. The operations performed by Sonangol are now being recorded in the budget, but with a delay of up to 3 months. Government has started to strengthen the capacity of the Ministry of Finance to control expenditures and ring-fence the operations of Sonangol on behalf of the treasury, which are now recorded in the budget, but with a delay of 90 days. There have been attempts to install a SIGFE terminal at Sonangol to register these operations in real time, as it is the case with the other ordinary government expenditures, but this has not yet materialized. The Ministry of Finance acknowledges that it is necessary to ring-fence and phase-out these operations and also that it is necessary to separate the concessionaire and operator roles of Sonangol. However, government and Sonangol have both indicated that there will be no change on this configuration at least until 2010 due to institutional and technical limitations in the Ministries of Finance and Petroleum
23. Weaknesses in the management of financial asset stocks into the SIGFE also have to be overcome. There are significant problems with entering external and domestic debt transactions into the system, which threatens the adequacy of debt service. The two databases for debt management that co-exist at the BNA (DMFAS for external debt and GEMA for domestic debt) are incompatible with the SIGFE. Information provided the DNT are used by the BNA to update these databases. The result of this is a report produced by the BNA in a format that is incompatible with the SIGFE and a data-sharing process that tends to be subject to delays of up to three months. This situation will only be resolved when a debt control system that is directly compatible with the SIGFE’s needs at the DNT is implemented.
24. The CUT has yet to be fully consolidated. The mechanism of the CUT, explained in detail in the PEMFAR report, remains far from being consolidated. The main issues impairing its consolidation are related to some of the operations carried out by Sonangol and the lingering existence of the compensation mechanisms involving Sonangol and the Ministry of Finance. In principle, profit oil, Sonangol’s taxes, the Kwanza-equivalent to the dollar-value of taxes paid by the foreign oil companies, and all other taxes transit through the CUT. However, since the CUT records only actual cash transactions, taxes and profit oil from Sonangol are often not recorded, due the above mentioned compensation mechanism. In addition to its complexity, this cash management system impairs planning and does not prevent over commitments.
Budget Monitoring
25. There have been progresses in the management of non-financial assets and liabilities, but further improvements are necessary. Non-financial assets and liabilities management is under the responsibility of the National Directorate for the Management of Non-Financial Assets of the State (Direcção Nacional do Patrimonio do Estado, DNPE). A key concern in this area is to ensure that quality information on the non-financial assets of the State is generated in order to increase coverage and accuracy of the General State Accounts (Conta Geral do Estado, CGE). Indeed, lack of timely and
- 8 -

accurate data on public debt and on State physical assets inventory prevents the production of reliable assets and liabilities accounting (contabilidade patrimonial). The SIGFE now allows DNPE to maintain an inventory of all new government non-financial assets at both central and provincial levels, but its records on old property and non-financial assets before the computerization of the system remain largely out of date. To update the inventory with past stock a task force will need to be created to collect the information all over the country and feed the SIGFE. There is also a need to strengthen compatibility and linkages between the budget accounting classification for expenditures and revenues and those for non-financial assets.
26. The internal control functions have shown some progress. In Angola, the internal audit function is carried out by the National Inspectorate of Finance (INF) while the external audit function is the responsibility of the Tribunal of Accounts. The Tribunal is the Supreme Audit Institution (SAI) whose sole function is to audit State accounts. Capacity for ex-post monitoring and auditing is still very poor, although there has been some improvement in the quality of returns from the provinces connected to the SIGFE. The Accounts Tribunal has officially adopted the double-entry Accounting Manual and Chart of Accounts underlying the SIGFE, which should help make more consistent the expenditure execution system and its ex-post auditing and monitoring functions.
27. Bolder improvements are needed on the auditing side, which remains weak. The major problem remains in the realm of the relationship between Sonangol and the Ministry of Finance. Sonangol, at the Government’s request, undertakes a wide range of activities or tasks on behalf of the Government. In the past, the Government has sometimes failed to reimburse Sonangol, or has been delayed in doing so. Sonangol’s reaction has been to reduce the tax and profit oil payments it owes to the Government by the amount of the costs it has incurred on Government’s behalf. The consequences of this practice for effective revenue management are adverse. Disputes arise because in the past there has not been clarity on which activities qualify for offset treatment, and because expenditures under qualifying categories have not been audited.
Ring Fencing and Phasing Out of QFAs
28. Encouraging steps have been taken to incorporate Sonangol’s quasi-fiscal operations in the budget, but major weaknesses have yet to be addressed. The budget includes estimates for Sonangol’s key fiscal operations, including expenses on oil subsidies, outlays on goods and services, debt service, and accrued tax and non-tax receipts that the company owes or collects on the government’s behalf. These are offset against each other in a procedure that is cumbersome, opaque, and subject to dispute. Because no cash payments are actually made, it causes substantial swings in arrears from month to month. The Tax Directorate staff is not yet fully able to assess the accuracy of the revenue information Sonangol presents.
29. The Government has moved to incorporate at least some of Sonangol’s quasi-fiscal operations into the budget, but needs to go much farther. In 2005, the expenditure reports Sonangol sent to the MinFin were entered manually into the SIGFE. Sonangol’s reports covered both budgeted and unbudgeted outlays; the latter were
- 9 -

classified as unpaid “floating debt” when they could not be accommodated as regular budgeted expenditure types. However, the reports were not submitted every month but were sent together toward the end of the year. This prevented the MINFIN from assessing Sonangol’s fiscal activities often enough, caused arrears to build up, and hampered intra-year fiscal programming. Moreover, MINFIN staff reportedly had problems classifying spending items that were not always clearly justified in Sonangol reports. On the way forward, an agreement on allowable offsets and planned audits could help a great deal, to start with. Ultimately the quasi-fiscal activities should be moved out of Sonangol. Although this cannot happen immediately, in the meantime all-quasi fiscal activities could be “ring-fenced” within Sonangol for better monitoring and control and ease of eventual transfer. The phases of a possible ring-fencing process proposed in the PEMFAR is described in Box 2.
30. The ring-fencing process should also aim at addressing the issue of conflict of interests associated with the activities of Sonangol. Certain aspects of Sonangol’s role as concessionaire, notably its approval of all major procurement contracts create a significant potential for conflict of interest and loss of revenues to the Treasury. Further, the Government lacks the capacity to oversee effectively Sonangol’s revenues and investment programs although their scale is enormous and has clear macroeconomic relevance. Tempered by expedience and by the need to build capacity in oversight agencies, consideration should be given to transferring Sonangol’s concessionaire roles to the Ministry of Petroleum, where they are traditionally found in international practice. Ring-fencing these activities first within Sonangol would help prepare the transfer (see Box 1 above). The urgency of proper oversight of Sonangol is such that GoA/MINFIN might be well-advised to engage qualified consultants sooner rather than later to assist in performing this function.
31. A well defined and time-bound plan to achieve normalization in this process should be adopted by the authorities. “Normalization” refers in this context to a situation in which the “non-conventional” or “expedient” activities, to use the language of the PEMFAR, would have been eliminated over an agreed time period. This would represent the arrival point of a transition process involving the key institutions - MINFIN, BNA, and MINPET. However attention must be paid as part of the transition process to upgrade the resources, skills, training, internal procedures and reporting and communication within and among these institutions in order for them to be ready to take back ownership of the Treasury-like activities currently performed by Sonangol. These changes would involve improvements to salary structure, employee career planning and benefits, all of which would require commitment to institutional reform.
- 10 -
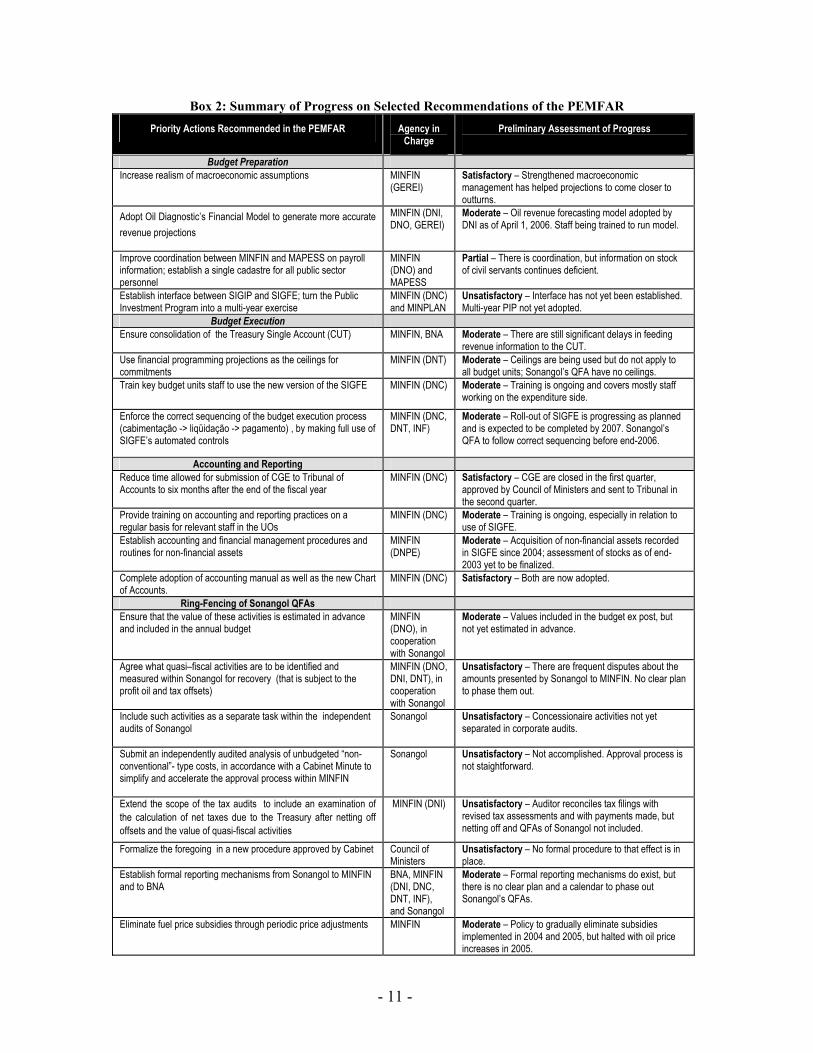
Box 2: Summary of Progress on Selected Recommendations of the PEMFAR Priority Actions Recommended in the PEMFAR Agency in
Charge Preliminary Assessment of Progress
Budget Preparation Increase realism of macroeconomic assumptions
MINFIN (GEREI)
Satisfactory – Strengthened macroeconomic management has helped projections to come closer to outturns.
Adopt Oil Diagnostic’s Financial Model to generate more accurate revenue projections
MINFIN (DNI, DNO, GEREI)
Moderate – Oil revenue forecasting model adopted by DNI as of April 1, 2006. Staff being trained to run model.
Improve coordination between MINFIN and MAPESS on payroll information; establish a single cadastre for all public sector personnel
MINFIN (DNO) and MAPESS
Partial – There is coordination, but information on stock of civil servants continues deficient.
Establish interface between SIGIP and SIGFE; turn the Public Investment Program into a multi-year exercise
MINFIN (DNC) and MINPLAN
Unsatisfactory – Interface has not yet been established. Multi-year PIP not yet adopted.
Budget Execution Ensure consolidation of the Treasury Single Account (CUT) MINFIN, BNA Moderate – There are still significant delays in feeding
revenue information to the CUT. Use financial programming projections as the ceilings for commitments
MINFIN (DNT) Moderate – Ceilings are being used but do not apply to all budget units; Sonangol’s QFA have no ceilings.
Train key budget units staff to use the new version of the SIGFE MINFIN (DNC) Moderate – Training is ongoing and covers mostly staff working on the expenditure side.
Enforce the correct sequencing of the budget execution process (cabimentação -> liqüidação -> pagamento) , by making full use of SIGFE’s automated controls
MINFIN (DNC, DNT, INF)
Moderate – Roll-out of SIGFE is progressing as planned and is expected to be completed by 2007. Sonangol’s QFA to follow correct sequencing before end-2006.
Accounting and Reporting Reduce time allowed for submission of CGE to Tribunal of Accounts to six months after the end of the fiscal year
MINFIN (DNC) Satisfactory – CGE are closed in the first quarter, approved by Council of Ministers and sent to Tribunal in the second quarter.
Provide training on accounting and reporting practices on a regular basis for relevant staff in the UOs
MINFIN (DNC) Moderate – Training is ongoing, especially in relation to use of SIGFE.
Establish accounting and financial management procedures and routines for non-financial assets
MINFIN (DNPE)
Moderate – Acquisition of non-financial assets recorded in SIGFE since 2004; assessment of stocks as of end-2003 yet to be finalized.
Complete adoption of accounting manual as well as the new Chart of Accounts.
MINFIN (DNC) Satisfactory – Both are now adopted.
Ring-Fencing of Sonangol QFAs Ensure that the value of these activities is estimated in advance and included in the annual budget
MINFIN (DNO), in cooperation with Sonangol
Moderate – Values included in the budget ex post, but not yet estimated in advance.
Agree what quasi–fiscal activities are to be identified and measured within Sonangol for recovery (that is subject to the profit oil and tax offsets)
MINFIN (DNO, DNI, DNT), in cooperation with Sonangol
Unsatisfactory – There are frequent disputes about the amounts presented by Sonangol to MINFIN. No clear plan to phase them out.
Include such activities as a separate task within the independent audits of Sonangol
Sonangol Unsatisfactory – Concessionaire activities not yet separated in corporate audits.
Submit an independently audited analysis of unbudgeted “non-conventional”- type costs, in accordance with a Cabinet Minute to simplify and accelerate the approval process within MINFIN
Sonangol Unsatisfactory – Not accomplished. Approval process is not staightforward.
Extend the scope of the tax audits to include an examination of the calculation of net taxes due to the Treasury after netting off offsets and the value of quasi-fiscal activities
MINFIN (DNI) Unsatisfactory – Auditor reconciles tax filings with revised tax assessments and with payments made, but netting off and QFAs of Sonangol not included.
Formalize the foregoing in a new procedure approved by Cabinet
Council of Ministers
Unsatisfactory – No formal procedure to that effect is in place.
Establish formal reporting mechanisms from Sonangol to MINFIN and to BNA
BNA, MINFIN (DNI, DNC, DNT, INF), and Sonangol
Moderate – Formal reporting mechanisms do exist, but there is no clear plan and a calendar to phase out Sonangol’s QFAs.
Eliminate fuel price subsidies through periodic price adjustments MINFIN Moderate – Policy to gradually eliminate subsidies implemented in 2004 and 2005, but halted with oil price increases in 2005.
- 11 -

IMPROVING SPENDING IN EDUCATION
Minding the Gap between Planning and Budgeting
32. The quality and availability of data on education represents a serious constraint to sectoral policy design and implementation. The analysis of expenditure data on education was negatively affected by the lack of consistent classification of spending categories. For example, expenditure data for 1999 to 2003 were classified differently than those for the period 2004 and 2005. The different classification methods impaired the comparison of these two periods. Without reliable data and precise information on public spending, it becomes very difficult to design focused interventions and monitor its implementation.
33. Per capita spending on education has increased. Education expenditure on a per capita basis increased by more than 100 percent from 1999 to 2003 (from US$ 11.8 to US$ 32.2). However, Angola is still very far away from the levels of education spending from its neighboring countries and Sub-Saharan Africa in general. On average, Sub-Saharan African (SSA) countries spent 5.1 percent of GDP on education, whereas Less Developed Countries spent the equivalent to 3.9 percent of GDP in 1997 (World Education Report, 2000). This is considerably higher than the 2.5 percent that was spent on education in Angola as a proportion of GDP in 1999 and even the 3.4 percent spent in 2003. If the levels of investment in education of 2004 and 2005 are taken into consideration, the gap relative to neighboring countries even widened.
34. There seems to exist serious problems in the implementation of the education sector plans insofar as the planning and use of resources are concerned. There are problems in preparing budgets which are reflected in the fact that in some years some institutions do not seem to have budgets even for payment of salaries; there might exist problems in terms of underestimation of resource needs on the side of the cost centers and irrational cuts by central Ministry of Finance and Planning which could explain the big differences between low budgets and high levels of expenditure; and liquidity problems which could explain scenarios like the general very low levels of expenditure compared to the budgets in 2003.
35. The criteria for allocating resources to the provinces are not based on the number of pupils that those resources need to benefit. In 1999, even though Huíla had 15.7 percent of the total of number of pupils enrolled in the country from grade 1 to 8 it only spent 8.72 percent of total primary education expenditure (see Table 1). The same applies to Kuanza Sul and Uíge. On the other hand, provinces like Malange, Zaire and Moxico, present a proportion in terms of primary education expenditure which is higher than their share in the total number of primary pupils enrolled in the country.
- 12 -
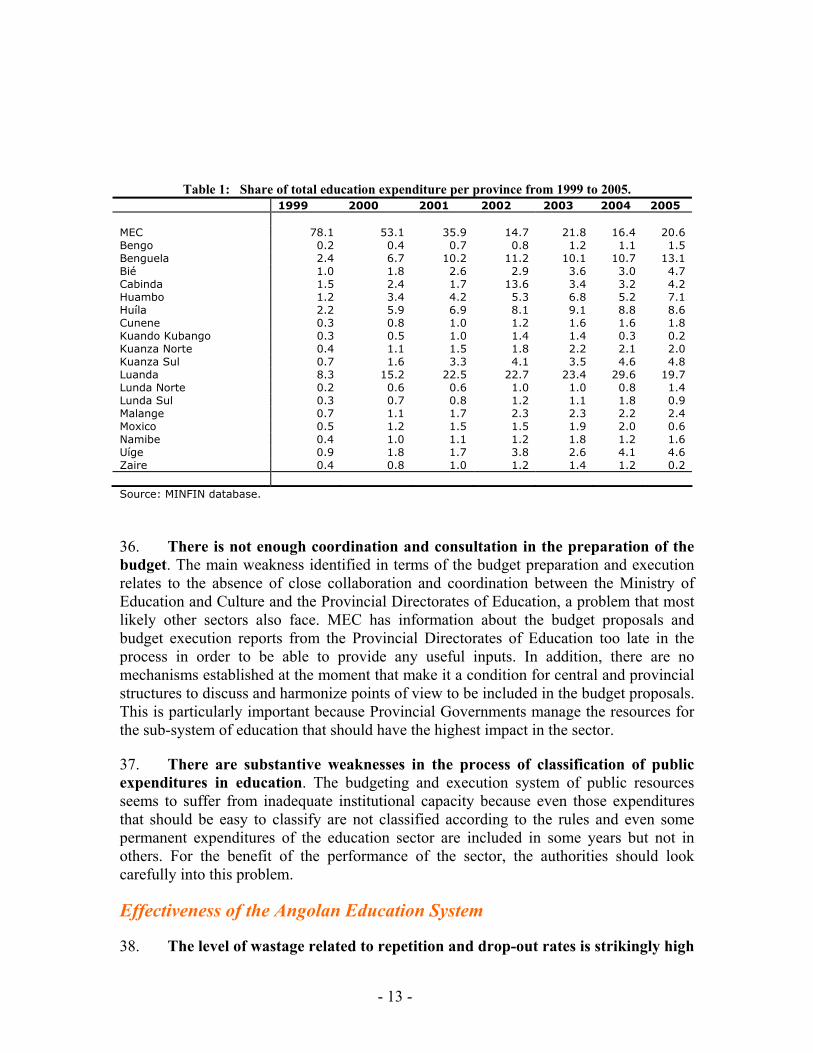
Table 1: Share of total education expenditure per province from 1999 to 2005. 1999 2000 2001 2002 2003 2004 2005 MEC 78.1 53.1 35.9 14.7 21.8 16.4 20.6 Bengo 0.2 0.4 0.7 0.8 1.2 1.1 1.5 Benguela 2.4 6.7 10.2 11.2 10.1 10.7 13.1 Bié 1.0 1.8 2.6 2.9 3.6 3.0 4.7 Cabinda 1.5 2.4 1.7 13.6 3.4 3.2 4.2 Huambo 1.2 3.4 4.2 5.3 6.8 5.2 7.1 Huíla 2.2 5.9 6.9 8.1 9.1 8.8 8.6 Cunene 0.3 0.8 1.0 1.2 1.6 1.6 1.8 Kuando Kubango 0.3 0.5 1.0 1.4 1.4 0.3 0.2 Kuanza Norte 0.4 1.1 1.5 1.8 2.2 2.1 2.0 Kuanza Sul 0.7 1.6 3.3 4.1 3.5 4.6 4.8 Luanda 8.3 15.2 22.5 22.7 23.4 29.6 19.7 Lunda Norte 0.2 0.6 0.6 1.0 1.0 0.8 1.4 Lunda Sul 0.3 0.7 0.8 1.2 1.1 1.8 0.9 Malange 0.7 1.1 1.7 2.3 2.3 2.2 2.4 Moxico 0.5 1.2 1.5 1.5 1.9 2.0 0.6 Namibe 0.4 1.0 1.1 1.2 1.8 1.2 1.6 Uíge 0.9 1.8 1.7 3.8 2.6 4.1 4.6 Zaire 0.4 0.8 1.0 1.2 1.4 1.2 0.2 Source: MINFIN database.
36. There is not enough coordination and consultation in the preparation of the budget. The main weakness identified in terms of the budget preparation and execution relates to the absence of close collaboration and coordination between the Ministry of Education and Culture and the Provincial Directorates of Education, a problem that most likely other sectors also face. MEC has information about the budget proposals and budget execution reports from the Provincial Directorates of Education too late in the process in order to be able to provide any useful inputs. In addition, there are no mechanisms established at the moment that make it a condition for central and provincial structures to discuss and harmonize points of view to be included in the budget proposals. This is particularly important because Provincial Governments manage the resources for the sub-system of education that should have the highest impact in the sector.
37. There are substantive weaknesses in the process of classification of public expenditures in education. The budgeting and execution system of public resources seems to suffer from inadequate institutional capacity because even those expenditures that should be easy to classify are not classified according to the rules and even some permanent expenditures of the education sector are included in some years but not in others. For the benefit of the performance of the sector, the authorities should look carefully into this problem.
Effectiveness of the Angolan Education System
38. The level of wastage related to repetition and drop-out rates is strikingly high
- 13 -

in Angola. Value chain analysis shows that it takes 26 and 30 years of resource inputs, respectively, to produce a primary education graduate instead of the prescribed 8. In addition, it takes 16 and 18 years of resource inputs to produce a pupil with grade 6, instead of the prescribed 6 years if the education system was perfectly effective and 9 years of resource inputs to produce a pupil with grade 4 instead of the prescribed 4. The comparison between Angola and Zambia, for example, which itself has a high level of wastage, highlights the differences. Whereas in Zambia it takes 9.9 years of resource inputs to produce a primary graduate instead of the prescribed 7, it takes 16 years of resource inputs to produce a grade 6 student in Angola.
39. The effectiveness of the education sector in the three levels of primary education is low. In 2000 it took 25.8 years of resource inputs to produce a graduate of the 3rd level of PE (grade 8), 16 years of resources to produce a graduate of the 2nd level of PE (grade 6) and 8,7 years of resources to produce a graduate of the 1st level of PE (grade 4). In 2002, however, these statistics increased to 30 years for grade 8 (up by 4 years), 18 years for grade 6 (up by 2 years) and 9.2 years for grade 4 (up by 0.5 years). This means that the state spends much more on each graduate than it would in the absence of dropouts and repeaters. To translate these observations into costs: a hypothetical system with the same average costs as Angola and no dropouts or repeaters would spend US$ 1,755 producing a primary graduate compared with US$ 6,669 under the current cohort survival rate (using the unit expenditure for 2002 and the cohort analysis for the same year). In Zambia, for example, the state spends 41 percent more on each graduate than it would in the absence of dropouts and repeaters, whereas in Angola the government spends 280 percent more than it would had there been no dropouts and repeaters.
The Reform Agenda in Education
40. The authorities should introduce clear criteria for the allocation of resources among provinces and sub-systems of education. This should be established at the national level and not depend on the proposals coming from the Provincial Governments each year. One of the fundamental criteria should be total enrolment in the different sub-systems of education and provinces.
41. Student intakes in primary education and provinces where PTRs are much lower than the teacher-class ratio should increase. The same is true for the elimination of the variations of PTRs among provinces (one possible way to do it would be through multi-grade teaching which requires appropriate qualifications from the teachers). Moreover, efforts should be made to reduce the pupil per classroom ratios in all levels of PE. Ratios of 94:1, 100:1 and 129:1 in the 1st, 2nd and 3rd levels of PE, respectively, are incompatible with learning outcomes. Either the data received at central level is not accurate, or Angola requires at the moment significant investments in infrastructure to accommodate the strong expansion of the education system in a post-war context.
42. The authorities should carefully consider options to reduce repetition rates. This is one of the main sources of wastage in the education system in Angola. One these
- 14 -

options could be the introduction of the automatic promotion between cycles of primary education. A more sophisticated policy option is a conditional cash transfer akin to “Bolsa Família” which is implemented in Brazil and whereby families in need receive financial assistance from the Government to ensure their children attend school or school de-worming programs. However, since the post-war context is still very recent and most of the logistical and administrative conditions are still being developed to enable the implementation of such mechanisms, it would be important to carefully assess how feasible each one of these programs would be.
43. The planning and budgeting process need to include steps or mechanisms for coordination (budget preparation) and information sharing (budget preparation and execution of resources) between MEC and the Provincial Governments. This is particularly important because Provincial Governments manage the resources for the sub-system of education (primary grades 1-6) that should have the highest impact in the sector, since it is the level where most of the students are enrolled and the basis for achieving the MDGs and EFA goals. In addition, it is the most cost-effective way to address equity issues, a role that can best be played by a central structure and in this case by MEC as the institution with more specialized knowledge regarding education, the national asymmetries and its national implications.
44. Dramatic improvements are needed in the sector’s financial management system. Improvements are required in several instances ranging from budget preparation, disbursements, management of expenditures, expenditure classification and institutional capacity. An adequate financial management system would prevent payment of expenditures not budgeted for (except in special circumstances) which would in turn be an incentive to improve budget preparation. Regarding expenditure classification, it would be most relevant to separate in the functional classification the services of pre-primary and primary education and have a different function for teacher training which is different from secondary and technical education. In terms of institutional capacity, it should be also a priority to train those using the financial management system in inserting data according to the proper expenditure classification.
45. The capacity for monitoring and evaluation in the sector of education needs to be strengthened. Another policy recommendation relates to the establishment of a system to assess learning outcomes in all levels of the education system in Angola. A well functioning monitoring and evaluation system can provide information to the planning and decision-making levels as to whether those students who are actually graduating from each cycle of primary education have achieved the minimum standards of learning recognized internationally and whether the main causes of inefficiency of the education system are related to endogenous or exogenous factors to the system.
- 15 -
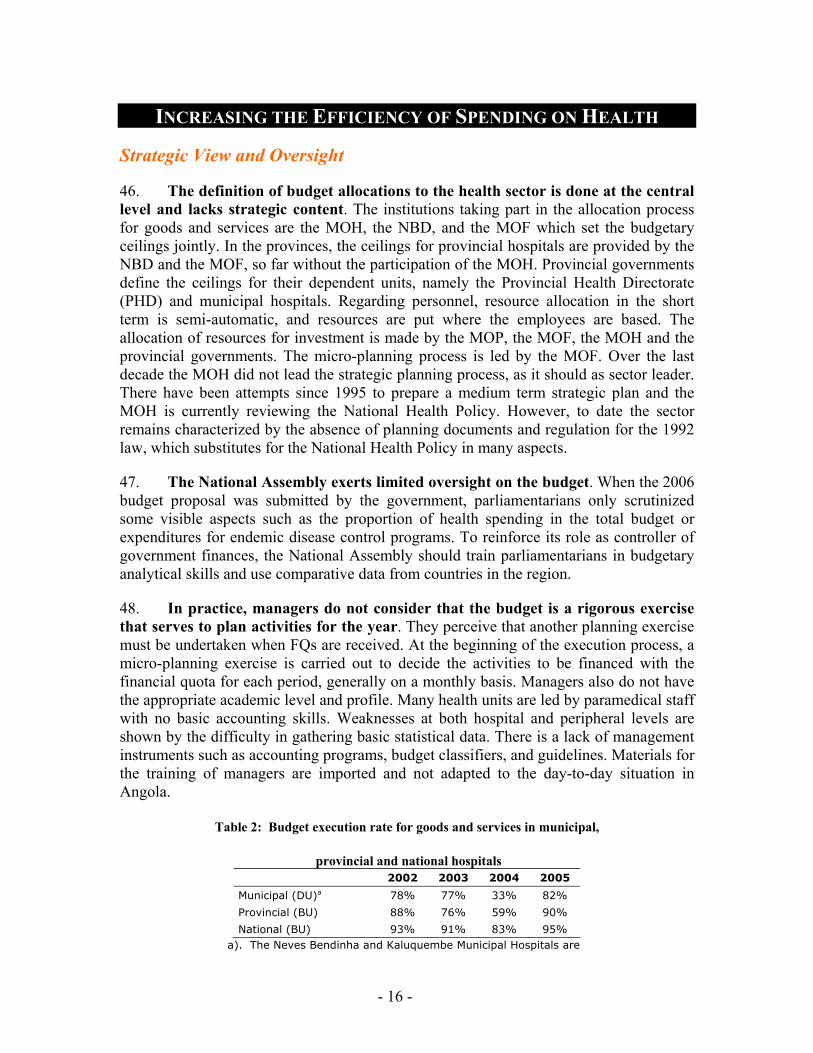
INCREASING THE EFFICIENCY OF SPENDING ON HEALTH
Strategic View and Oversight
46. The definition of budget allocations to the health sector is done at the central level and lacks strategic content. The institutions taking part in the allocation process for goods and services are the MOH, the NBD, and the MOF which set the budgetary ceilings jointly. In the provinces, the ceilings for provincial hospitals are provided by the NBD and the MOF, so far without the participation of the MOH. Provincial governments define the ceilings for their dependent units, namely the Provincial Health Directorate (PHD) and municipal hospitals. Regarding personnel, resource allocation in the short term is semi-automatic, and resources are put where the employees are based. The allocation of resources for investment is made by the MOP, the MOF, the MOH and the provincial governments. The micro-planning process is led by the MOF. Over the last decade the MOH did not lead the strategic planning process, as it should as sector leader. There have been attempts since 1995 to prepare a medium term strategic plan and the MOH is currently reviewing the National Health Policy. However, to date the sector remains characterized by the absence of planning documents and regulation for the 1992 law, which substitutes for the National Health Policy in many aspects.
47. The National Assembly exerts limited oversight on the budget. When the 2006 budget proposal was submitted by the government, parliamentarians only scrutinized some visible aspects such as the proportion of health spending in the total budget or expenditures for endemic disease control programs. To reinforce its role as controller of government finances, the National Assembly should train parliamentarians in budgetary analytical skills and use comparative data from countries in the region.
48. In practice, managers do not consider that the budget is a rigorous exercise that serves to plan activities for the year. They perceive that another planning exercise must be undertaken when FQs are received. At the beginning of the execution process, a micro-planning exercise is carried out to decide the activities to be financed with the financial quota for each period, generally on a monthly basis. Managers also do not have the appropriate academic level and profile. Many health units are led by paramedical staff with no basic accounting skills. Weaknesses at both hospital and peripheral levels are shown by the difficulty in gathering basic statistical data. There is a lack of management instruments such as accounting programs, budget classifiers, and guidelines. Materials for the training of managers are imported and not adapted to the day-to-day situation in Angola.
Table 2: Budget execution rate for goods and services in municipal,
provincial and national hospitals 2002 2003 2004 2005
Municipal (DU)a 78% 77% 33% 82%
Provincial (BU) 88% 76% 59% 90%
National (BU) 93% 91% 83% 95% a). The Neves Bendinha and Kaluquembe Municipal Hospitals are
- 16 -

Budgetary Units 49. There are significant differences between budget execution rates at the central, provincial, and municipal levels. One of the determining factors seems to be the financial decentralization statute. The execution rate for goods and services is significantly higher for national and provincial hospitals than for municipal hospitals. This can result from the financial limits, which are lower in municipal hospitals and from the execution periods, which are substantially longer at this level. This is because municipal hospitals depend on the budgetary unit “provincial government”. For example, the dependent units of the municipality of Andulo, in Bié, may need up to one month to make a payment because it must be authorized by four institutions: the health unit, the municipal administration, the PHD, and the provincial government. According to the technical staff of the MOH, the same procedure takes only 2-3 days at the central level.
50. Financial management procedures and instruments have been developed, but less has been done regarding tools for accounting and monitoring and evaluation. Much attention is given to the publication of budgets approved by the National Assembly. However, information about budget revision and execution is not taken as seriously and it is not well publicized. The main accounting instruments are produced by SIGFE, but they do not allow for an adequate monitoring of the health sector. This results from the fact that the economic category classifier is common for all sectors. Categories are too broad and do not attend to the particular needs of a sector.
51. Performance evaluation is impaired by the lack of rigor in the classification of expenditures. The Health Information System (HIS) was not designed to interface with SIGFE or SINGERH (the MPA data base for the management of public employees), and there is not much rigor in expenditure classification. It is common practice to use the “other services” category for the purchase of all kinds of goods. This makes it impossible to monitor the performance of the sector on a regular basis, and as a result, when an analysis of the sector is necessary, special studies need to be conducted. Although the Tribunal of Accounts has begun to play a disciplinary role in the management of public funds, irregularities are common, notably in public tenders.
The Structure of Spending on Health
52. Health expenditures have remained stable as a proportion of total expenditures and GDP. Since 2001, health expenditures have remained at 2-3 percent of GDP, which is considered low by international standards. As a proportion of total expenditures, health expenditures have been stable at around 4-5 percent or the equivalent to some US$213 million in 2002 and US$447 million in 2005 (Table 3). In 2005 per capita expenditures rose to US$28.8, close to the region’s average. In 2006 the health budget represented US$71 per capita, substantially above the majority of the countries in the region, and above the basic health package calculated at US$37 by the Commission of Macroeconomics and Health. Although other sources2 estimate at US$ 2 Hay, 2003 (extracted from Pavignani 2005)
- 17 -
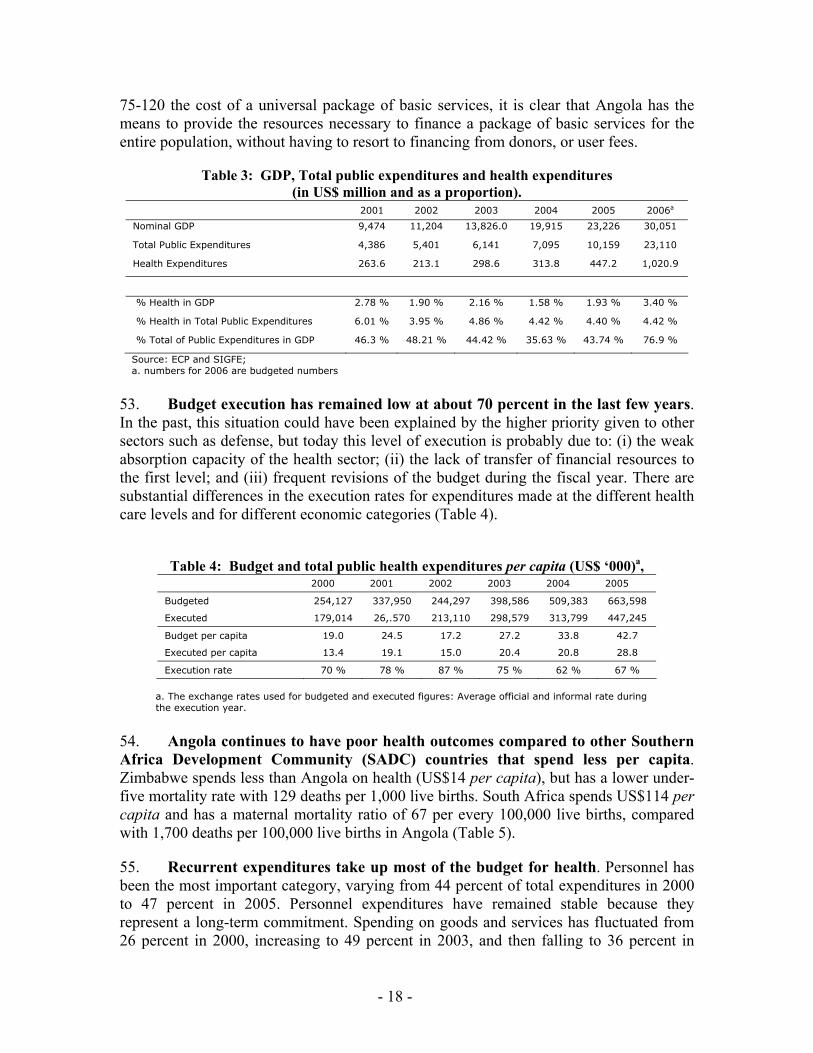
75-120 the cost of a universal package of basic services, it is clear that Angola has the means to provide the resources necessary to finance a package of basic services for the entire population, without having to resort to financing from donors, or user fees.
Table 3: GDP, Total public expenditures and health expenditures (in US$ million and as a proportion).
2001 2002 2003 2004 2005 2006a
Nominal GDP 9,474 11,204 13,826.0 19,915 23,226 30,051
Total Public Expenditures 4,386 5,401 6,141 7,095 10,159 23,110
Health Expenditures 263.6 213.1 298.6 313.8 447.2 1,020.9
% Health in GDP 2.78 % 1.90 % 2.16 % 1.58 % 1.93 % 3.40 %
% Health in Total Public Expenditures 6.01 % 3.95 % 4.86 % 4.42 % 4.40 % 4.42 %
% Total of Public Expenditures in GDP 46.3 % 48.21 % 44.42 % 35.63 % 43.74 % 76.9 %
Source: ECP and SIGFE; a. numbers for 2006 are budgeted numbers
53. Budget execution has remained low at about 70 percent in the last few years. In the past, this situation could have been explained by the higher priority given to other sectors such as defense, but today this level of execution is probably due to: (i) the weak absorption capacity of the health sector; (ii) the lack of transfer of financial resources to the first level; and (iii) frequent revisions of the budget during the fiscal year. There are substantial differences in the execution rates for expenditures made at the different health care levels and for different economic categories (Table 4).
Table 4: Budget and total public health expenditures per capita (US$ ‘000)a,
2000 2001 2002 2003 2004 2005
Budgeted 254,127 337,950 244,297 398,586 509,383 663,598
Executed 179,014 26,.570 213,110 298,579 313,799 447,245
Budget per capita 19.0 24.5 17.2 27.2 33.8 42.7
Executed per capita 13.4 19.1 15.0 20.4 20.8 28.8
Execution rate 70 % 78 % 87 % 75 % 62 % 67 %
a. The exchange rates used for budgeted and executed figures: Average official and informal rate during the execution year.
54. Angola continues to have poor health outcomes compared to other Southern Africa Development Community (SADC) countries that spend less per capita. Zimbabwe spends less than Angola on health (US$14 per capita), but has a lower under-five mortality rate with 129 deaths per 1,000 live births. South Africa spends US$114 per capita and has a maternal mortality ratio of 67 per every 100,000 live births, compared with 1,700 deaths per 100,000 live births in Angola (Table 5).
55. Recurrent expenditures take up most of the budget for health. Personnel has been the most important category, varying from 44 percent of total expenditures in 2000 to 47 percent in 2005. Personnel expenditures have remained stable because they represent a long-term commitment. Spending on goods and services has fluctuated from 26 percent in 2000, increasing to 49 percent in 2003, and then falling to 36 percent in
- 18 -

2005. After reaching a low point of 6 percent in 2002, investment increased until it reached 17 percent of the total in 2005. The substantial increase in investments in 2006 make it the largest category of expenditures for that year.
Table 5: Public health expenditures and health indicators in some SADC countries
Country
Public health expenditure per capita
(2003)
percent of public expenditure in health / total
public expenditure
(2003)
Child mortality rate (per
1,000) (2004)
Maternal mortality rate
(per 100,000 live births) (2000)
Deliveries assisted by
qualified technical personnel
( %) Angola 20 4.9 260 1700 47 (2000)
Botswana 135 7.5 116 100 40.4 (2000)
Mozambique 7 10.9 152 1000 48 (2003)
Namibia 101 12.4 63 300 76 (2000)
South Africa 114 10.2 67 230 84 (1998)
Zambia 11 11.8 182 750 43 (2001/2)
Zimbabwe 14 9.2 129 1100 73 (1999)
Table 6: Number of doctors and nurses in the NHS per province, 2005
Provinces Doctors Nurses Doctors/ 10,000
inhab. Nurses/ 10,000
inhab.
Bengo 30 850 1.50 43
Benguela 65 2.663 0.30 12
Bié 37 1.350 0.36 13
Cabinda 42 1.173 1.00 28
Huambo 48 1.436 0.38 11
Huíla 63 1.688 0.45 12
Kuando Kubango 14 544 0.36 14
Kunene 34 785 0.88 20
Kwanza Norte 28 977 0.78 27
Kwanza Sul 62 992 0.63 10
Luanda 802 7.968 2.03 20
Lunda Norte 38 789 0.74 15
Lunda Sul 40 696 1.70 30
Malanje 32 939 0.75 22
Moxico 27 1.135 0.62 26
Namibe 31 883 1.76 50
Uíge 33 932 0.32 9
Zaire 32 686 1.46 31
Angola 1,458 26,486 0.94 17
Source: DNRH, MOH
56. Investment in the health sector faces severe difficulties that may limit the government’s capacity to effectively use the resources. The absence of an investment plan for the sector, and the lack of coordination between government institutions is just one example of such difficulties. Public investment is managed by the MOH at national and provincial levels, and by provincial governments responsible for the primary network. Various investment initiatives including those of provincial governments and
- 19 -
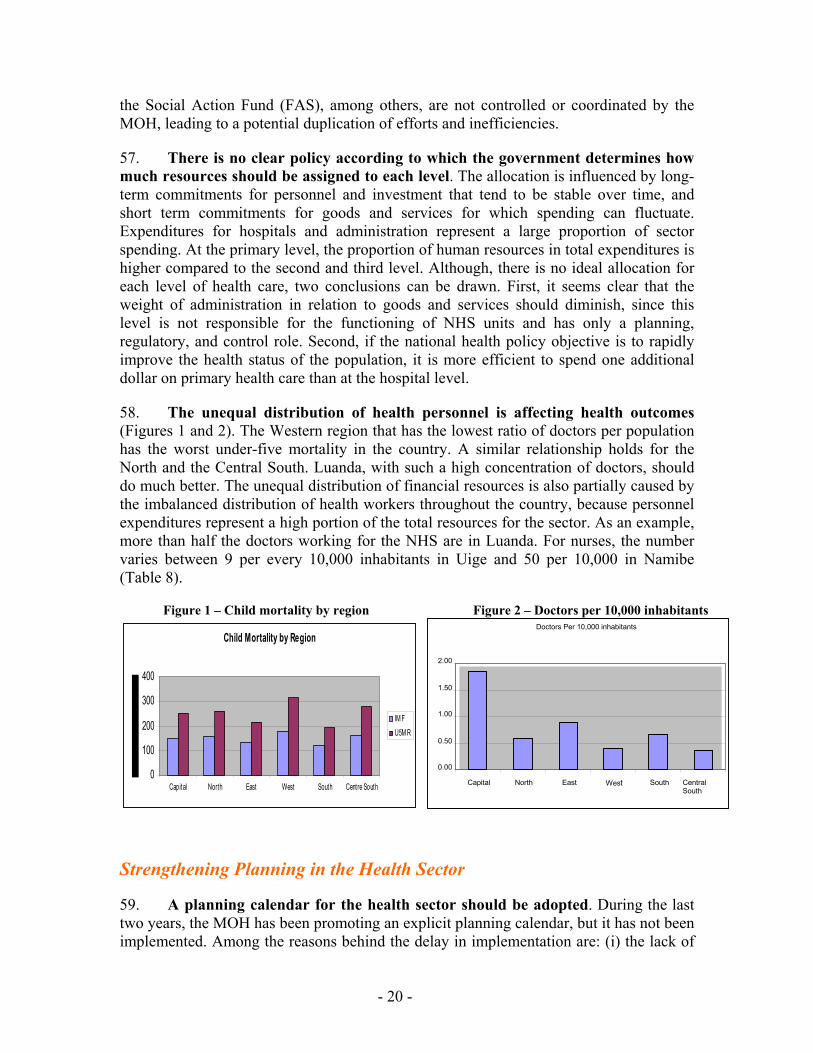
the Social Action Fund (FAS), among others, are not controlled or coordinated by the MOH, leading to a potential duplication of efforts and inefficiencies.
57. There is no clear policy according to which the government determines how much resources should be assigned to each level. The allocation is influenced by long-term commitments for personnel and investment that tend to be stable over time, and short term commitments for goods and services for which spending can fluctuate. Expenditures for hospitals and administration represent a large proportion of sector spending. At the primary level, the proportion of human resources in total expenditures is higher compared to the second and third level. Although, there is no ideal allocation for each level of health care, two conclusions can be drawn. First, it seems clear that the weight of administration in relation to goods and services should diminish, since this level is not responsible for the functioning of NHS units and has only a planning, regulatory, and control role. Second, if the national health policy objective is to rapidly improve the health status of the population, it is more efficient to spend one additional dollar on primary health care than at the hospital level.
58. The unequal distribution of health personnel is affecting health outcomes (Figures 1 and 2). The Western region that has the lowest ratio of doctors per population has the worst under-five mortality in the country. A similar relationship holds for the North and the Central South. Luanda, with such a high concentration of doctors, should do much better. The unequal distribution of financial resources is also partially caused by the imbalanced distribution of health workers throughout the country, because personnel expenditures represent a high portion of the total resources for the sector. As an example, more than half the doctors working for the NHS are in Luanda. For nurses, the number varies between 9 per every 10,000 inhabitants in Uige and 50 per 10,000 in Namibe (Table 8).
Figure 1 – Child mortality by region Figure 2 – Doctors per 10,000 inhabitants
Child Mortality by Region
0
100
200
300
400
Capital North East West South Centre South
IM FU5M R
Doctors Per 10,000 inhabitants
0.00
0.50
1.00
1.50
2.00
Capital North East West South Central South
Strengthening Planning in the Health Sector
59. A planning calendar for the health sector should be adopted. During the last two years, the MOH has been promoting an explicit planning calendar, but it has not been implemented. Among the reasons behind the delay in implementation are: (i) the lack of
- 20 -

concrete instruments which managers can use, with an added value for their work; (ii) the poor leadership by the MOH; and (iii) the limited technical capacity of the MOH Planning Department, either qualitative or quantitative3. The key to success will rely upon: (i) the creation of concrete instruments; and (ii) a stronger effort by the MOH to increase its technical capacity, by recruiting new personnel or subcontracting the development of the instruments. Chart 1 below shows a planning calendar which combines the actions to be taken by the MOH with the MOF (upper boxes), and the actions to be undertaken within the sector’s institutions (lower boxes).
Chart 1: Proposed planning calendar for the health sector
July March April May June
7 March Constitution of THE MOH working group
1-15 April
1 April Training support teams for the provinces
1 MayBalance meeting MINFIN- THE MOH on the execution in the previous year
15 June
15 July Defined ceilings approved by the sectors
1 MayProvincial diagnosis : evaluation of activities of the previous year
31 MayDefinition of priorities of the sector, consistent with the PESS
31 of July Adjustment of the budget proposals o the attributed ceilings
15 June - 15 July
Estimate of the needs of each institution of the sector
Public expenditure analysis of the previous year
Joint setting of budget ceilings per level, province and review of allocation indicators
60. The Ministry of Health should assume a more active role in planning public spending in the health sector. The calendar above suggests a 5-month period for planning and budgeting within the health sector, in line with the timetable of the MOF. The process would start on March 7. An MOH working group would lead the process until its completion. The first mission of this working group would be to analyze the spending of the previous year, and review production and impact indicators. This analysis would be presented at a review meeting at the beginning of May. A month later (May 31), the working group would define the priorities of the sector for the following year. These priorities should be in line with the Health Sector’s Strategic Plan (to be developed). On June 15, the working group would make an internal allocation of resources (budget ceiling scenarios) consistent with the priorities and the analyses of the previous year exercise. Lastly, on July 15, the MOH would defend this resource allocation proposal before the MOF, in a joint meeting.
3 The Planning Department of the MOH (GEPE) has made a considerable effort to increase the number of economists in the Planning Department. However, the largest shortages are in public health. The entire GEPE has only one doctor.
- 21 -

61. For this process to work, it will need instruments for each of the defined stages. Together with the partners providing institutional support, the MOH should develop these instruments and establish its planning function.
Scenarios for Scaling Up Service Coverage
62. Government plans to scale up service coverage need to be costed and indicate what the expected outcomes are. The government plans to significantly scale up the coverage of the services included in the defined essential package. Figure 3 shows the planned marginal increase in service coverage for the next three years according to the government’s strategy for reducing child and maternal mortality. However, the government’s plan does not specify the cost implied, nor the impact to be achieved on child and maternal mortality.
Figure 3: Planned Marginal Increase of Service Coverage for the Next Three Years
0 20 40 60 80 100 120
Percentage of malaria cases in under f ives receiving standardised treatment.
Percentage of diarrhoea cases in under f ives receiving ORT and cont inued feeding.
Percentage of pneumonia cases in under f ives receiving standardised treatment.
Percentage of children under one vaccinated (DTP-3, Polio-3, measles, BCG and yellow fever).
Percentage of pregnant women vaccinated with TT- two or more doses
Percentage of municipalit ies with DTP-3 coverage of 80% or more
Percentage of children under six months old who are exclusively breast fed
Percentage of children aged 6-24 months with appropriate complementary feeding
Percentage of households consuming iodised salt
Number of provinces with a reference system established for obstetric emergencies.
Percentage of births in health units
Percentage of births at tended by trained staf f
Percentage of use of modern contraceptives among women of child bearing age
Number of health services that provide HIV and syphilis counselling and voluntary testing.
Number of health services that undertake prevent ion of mother-to-child t ransmission of HIV.
% of marginal increase
Source: Strategic Plan for the Accelerated Reduction of Maternal and Child Mortality in Angola (2004-2008) 63. The World Bank and UNICEF have conducted a simulation exercise to generate evidence on the steps needed and resources required to reach these targets. The exercise recommends the adoption of five steps to scale up service coverage:
• Step 1: Undertake social mobilization and behavioral interventions as well as supply essential materials to households through community-based interventions;
- 22 -

• Step 2: Organize outreach and mobile teams to provide a set of standardized services to populations without access to health facilities;
• Step 3: Expand the primary health care network to provide preventive and basic curative care;
• Step 4: Strengthen the first level referral care that can provide comprehensive and emergency health care;
• Step 5: Improve the second-level referral care that can provide specialized care. 64. Step 1 aims at reducing child mortality, controlling communicable diseases, and improving environment health. To that effect, it is essential to scale up community-based services (such as breast feeding, bed net use, etc.). The implementation of this step requires a sufficient number of community health volunteers and health promoters to actively disseminate health knowledge and promote healthy behaviors. It is estimated that a ratio of 1:1000 (volunteer to number of people served) is necessary in order to carry out the required workload. Other inputs required include training, incentives, and essential materials (such as mosquito nets). The challenge will be how to establish a sustainable incentive mechanism to motivate community health workers. Many countries have issues on the proper form and amount of the incentives, and in the case of Angola this will need to be decided as a function of the local context. The simulation result indicates that the additional average annual cost for this step would be $2.51 per capita, and if properly implemented, it would potentially reduce infant mortality by 29 percent and under-five child mortality by 39 percent.
Table 7: Cost and Impact of Scaling Up Service Coverage Reduction
in IMR Reduction in U5MR
Reduction in MMR
Cost (US$ per capita per
year) Step 1: Undertake community-based social mobilization and behavioral interventions
29% 39% 1% 2.51
Step 2: Scale up population-based outreach services
9% 8% 9% 1.05
Step 3: Expand primary health care 17% 23% 1% 3.05 Step 4: Strengthen the first level referral care
2% 2% 3% 0.97
Step 5: Improve the second level referral care
1% 1% 3% 0.89
Total Cost of All Five Steps 51% 62% 17% 8.48
65. Step 2 includes efforts to take a package of highly effective and standardized services (such as immunization and antenatal care) outside health facilities and
- 23 -

bring it to the households and communities. This is particularly important in Angola, as 60 percent of the population does not have a reasonable access to health services. The country has achieved a significant success in delivering immunization services in communities, and this effort should be expanded to integrate other interventions and deliver a broader package. This step requires putting together an outreach team with at least two qualified nurses or other types of health professionals to visit communities totaling about 5,000 people in a timely manner. To ensure quality and efficiency, the outreach team needs to work together with community health workers and its support teams in health centers or health posts. Key inputs to make the outreach team functional include vehicles, essential drugs and supplies, and training. The simulation exercise indicates that this step costs an additional US $1.05 per capita per year, and it can potentially reduce infant mortality by 9 percent, under-five mortality by 8 percent, and maternal mortality by 9 percent.
66. Step 3 aims at expanding the health network so that the majority of the population has reasonable access (less than 2 hours walking distance) to basic primary health care. This step requires a major investment effort and sufficient recurrent budget to ensure that the required human resources and other inputs are in place. At this level, health provided in facilities includes both individual curative treatment and preventive services. The cost will be higher for this step as it involves construction, equipment and recurrent costs (salary, supplies). It requires additional US$ 3.05 per capita per year, and it could potentially reduce infant mortality by 17 percent, under-five mortality by 23 percent, and maternal mortality by 1 percent.
67. Step 4 aims at improving the first referral care, which is particularly crucial for complicated cases and maternal complications. Individual treatment and emergency obstetric care needs to be provided at this level, and at least one general doctor or qualified clinical technician needs to be installed. To implement this step, Angola will need to produce more physicians and deploy more physicians in municipalities. This would cost US$ 0.97 per capita per year, and could reduce infant mortality by 2 percent, under-five mortality by 2 percent, and maternal mortality by 3 percent.
68. Step 5 focuses on the delivery of comprehensive emergency obstetric care and specialized care. Specialists are needed at this level. It would cost US$ 0.89 per capita per year and could reduce infant mortality by 1 percent, under-five mortality by 1 percent, and maternal mortality by 3 percent.
69. In total, the five steps, if implemented successfully altogether, would have a significant impact on child and maternal mortality. They could altogether reduce infant mortality by 51 percent, under-five mortality by 62 percent, and maternal mortality by 17 percent. This achievement would cost Angola, on average, an additional US$ 8.48 per capita. Under these assumptions and considering a horizon of three years (as in the country’s strategic plan), Angola would need to increase its budget for health by US$8.5 per capita per year to reach US$85.5 per capita in year 1, US$94 per capita in year 2, and US$102.5 per capita in year 3. This is well within Angola’s economic possibilities.
- 24 -
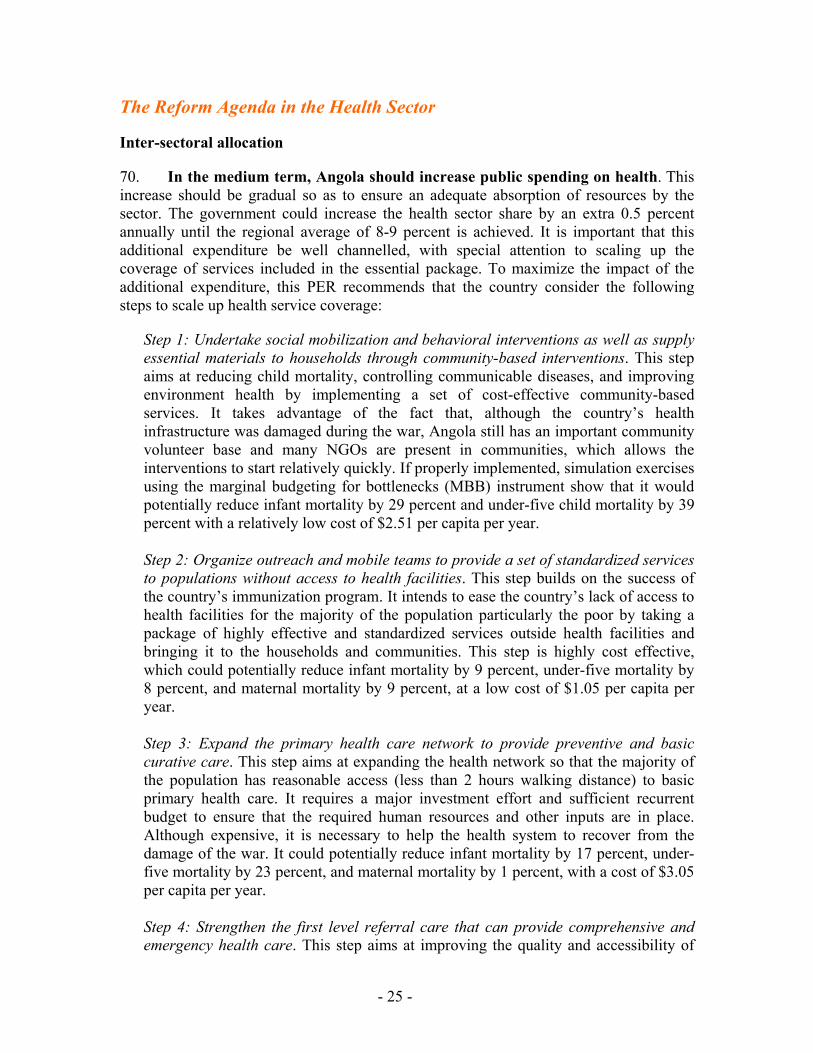
The Reform Agenda in the Health Sector
Inter-sectoral allocation
70. In the medium term, Angola should increase public spending on health. This increase should be gradual so as to ensure an adequate absorption of resources by the sector. The government could increase the health sector share by an extra 0.5 percent annually until the regional average of 8-9 percent is achieved. It is important that this additional expenditure be well channelled, with special attention to scaling up the coverage of services included in the essential package. To maximize the impact of the additional expenditure, this PER recommends that the country consider the following steps to scale up health service coverage:
Step 1: Undertake social mobilization and behavioral interventions as well as supply essential materials to households through community-based interventions. This step aims at reducing child mortality, controlling communicable diseases, and improving environment health by implementing a set of cost-effective community-based services. It takes advantage of the fact that, although the country’s health infrastructure was damaged during the war, Angola still has an important community volunteer base and many NGOs are present in communities, which allows the interventions to start relatively quickly. If properly implemented, simulation exercises using the marginal budgeting for bottlenecks (MBB) instrument show that it would potentially reduce infant mortality by 29 percent and under-five child mortality by 39 percent with a relatively low cost of $2.51 per capita per year. Step 2: Organize outreach and mobile teams to provide a set of standardized services to populations without access to health facilities. This step builds on the success of the country’s immunization program. It intends to ease the country’s lack of access to health facilities for the majority of the population particularly the poor by taking a package of highly effective and standardized services outside health facilities and bringing it to the households and communities. This step is highly cost effective, which could potentially reduce infant mortality by 9 percent, under-five mortality by 8 percent, and maternal mortality by 9 percent, at a low cost of $1.05 per capita per year. Step 3: Expand the primary health care network to provide preventive and basic curative care. This step aims at expanding the health network so that the majority of the population has reasonable access (less than 2 hours walking distance) to basic primary health care. It requires a major investment effort and sufficient recurrent budget to ensure that the required human resources and other inputs are in place. Although expensive, it is necessary to help the health system to recover from the damage of the war. It could potentially reduce infant mortality by 17 percent, under-five mortality by 23 percent, and maternal mortality by 1 percent, with a cost of $3.05 per capita per year. Step 4: Strengthen the first level referral care that can provide comprehensive and emergency health care. This step aims at improving the quality and accessibility of
- 25 -
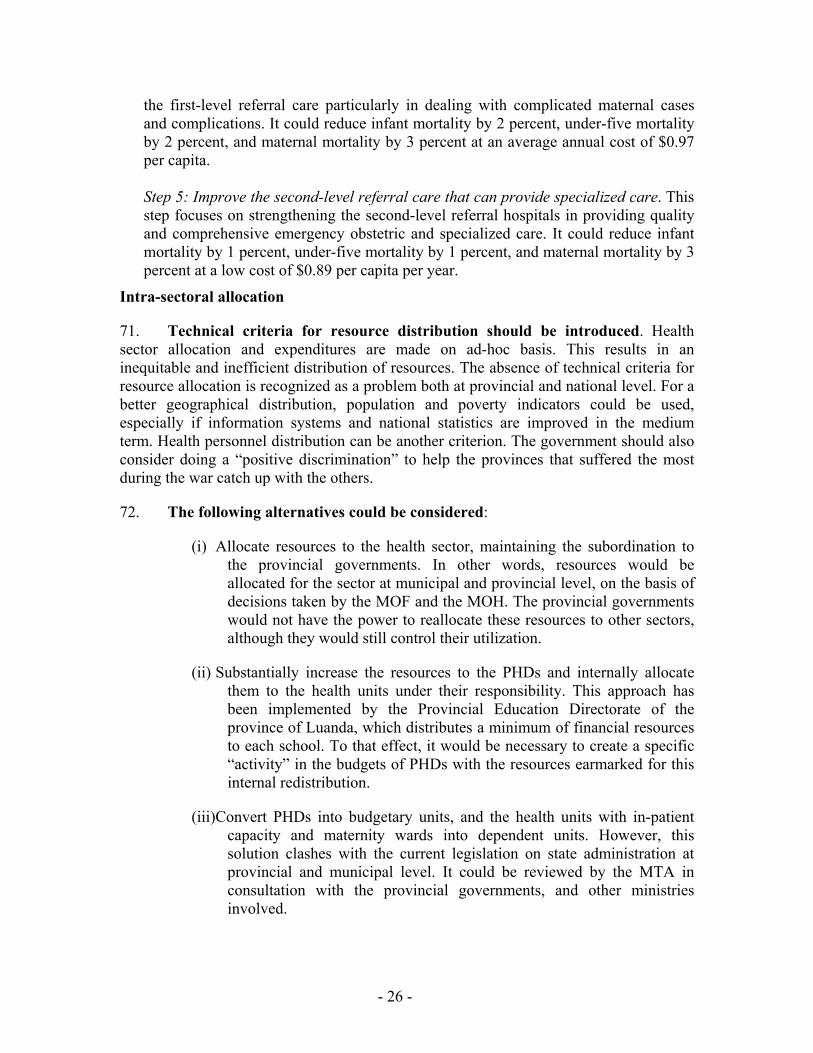
the first-level referral care particularly in dealing with complicated maternal cases and complications. It could reduce infant mortality by 2 percent, under-five mortality by 2 percent, and maternal mortality by 3 percent at an average annual cost of $0.97 per capita. Step 5: Improve the second-level referral care that can provide specialized care. This step focuses on strengthening the second-level referral hospitals in providing quality and comprehensive emergency obstetric and specialized care. It could reduce infant mortality by 1 percent, under-five mortality by 1 percent, and maternal mortality by 3 percent at a low cost of $0.89 per capita per year.
Intra-sectoral allocation
71. Technical criteria for resource distribution should be introduced. Health sector allocation and expenditures are made on ad-hoc basis. This results in an inequitable and inefficient distribution of resources. The absence of technical criteria for resource allocation is recognized as a problem both at provincial and national level. For a better geographical distribution, population and poverty indicators could be used, especially if information systems and national statistics are improved in the medium term. Health personnel distribution can be another criterion. The government should also consider doing a “positive discrimination” to help the provinces that suffered the most during the war catch up with the others.
72. The following alternatives could be considered:
(i) Allocate resources to the health sector, maintaining the subordination to the provincial governments. In other words, resources would be allocated for the sector at municipal and provincial level, on the basis of decisions taken by the MOF and the MOH. The provincial governments would not have the power to reallocate these resources to other sectors, although they would still control their utilization.
(ii) Substantially increase the resources to the PHDs and internally allocate them to the health units under their responsibility. This approach has been implemented by the Provincial Education Directorate of the province of Luanda, which distributes a minimum of financial resources to each school. To that effect, it would be necessary to create a specific “activity” in the budgets of PHDs with the resources earmarked for this internal redistribution.
(iii)Convert PHDs into budgetary units, and the health units with in-patient capacity and maternity wards into dependent units. However, this solution clashes with the current legislation on state administration at provincial and municipal level. It could be reviewed by the MTA in consultation with the provincial governments, and other ministries involved.
- 26 -

73. The health sector needs a Strategic Investment Plan. Investment spending has increased rapidly in recent years but this rehabilitation effort has not been preceded by a needs analysis and a proper planning of the desired health network. Also, there is insufficient coordination between the central and those provincial governments and other partners. The current approach may undermine the future of the health network, making it unsustainable and inadequate for the country’s needs. For that reason, investment spending should be based on a map of the existing health network and projections of different scenarios with their costs. Such a map is currently being prepared in five provinces, and this exercise should be expanded to the whole country, as quickly as possible in order to reorient the investments already planned. The map would be the backbone of the Public Investment Plan (PIP) that would be defined jointly between the MOH and the MOP, and provincial governments. It would facilitate the involvement of the MOF in the formulation of the PIP and would allow calculating recurrent costs for new investments.
The budget preparation process
74. The MOH should strengthen its capacity in strategic planning. The budget preparation process lacks strategy. The MOH does not have an explicit National Health Policy, a Medium Term Strategic Plan, nor other medium term planning instruments such as a National Investment Plan. To date fundamental aspects such as the definition of medium-term activities are undertaken by the MOF, with little involvement of the MOH. With the help of international partners, the MOH has started to redefine the National Health Policy. This policy would establish the main lines for the management of the sector, its funding, the role of the MOH, the eventual integration of vertical programs, and should set the way for a better quality of spending and improvements in the health status of the population. The policy would then be transformed into a medium-term plan, in line with the government’s Economic and Social Plan. Finally, medium-term plans would be prepared in the area of investments and human resources.
75. The MOH should build its capacity and create instruments allowing the government to monitor Angola’s progress towards the Millennium Development Goals. The MOH should work with INE to ensure that surveys are periodically conducted to evaluate the health status of the population. The most important is to undertake a Demographic and Health Survey (DHS). As population data are essential for decision making in the sector, the MOH should also promote the undertaking of a population census.
Financial management
76. The government should increase the provision of financial quotas to municipal hospitals and to the Provincial Health Directorates. Budget execution rates in the sector have been low, and vary with the economic category and the level of care. For example, execution rates for investments have been below average, and the execution rates for goods and services of municipal hospitals are systematically below those of hospitals. To increase execution rates, it will be necessary that the MOF effectively channel financial resources to the budgetary units, and that managers in turn make a
- 27 -

timely transfer to the DUs. To that effect, the MOH could undertake advocacy actions towards the MOF and provincial governments or request the allocation of resources for the health sector at a level below the provincial level. The latter would clash with the current decentralization model of state power.
Monitoring of budget execution
77. The efficiency of public expenditure should be increased at all levels. The cost-effectiveness of some public spending is below the optimal level. For example, the unit costs paid by different health units are very different for the same type of subcontracted services (cleaning, food, etc.). In the area of investments, the costs per square metre for the units of the same level do not follow the market logic. Efficiency improvements are possible through compliance with the legislation in force on public tendering and the establishment of indicative unit prices for key services and for infrastructure. These should be defined by the MOH, the MOP and the MOF.
78. The MOH should work with the MOF to review budget categories, within the limits established by the State General Plan of Accounts. The instruments available for financial and technical performance monitoring do not allow evaluating progress in the health sector. For example, it would be interesting for the MOH to know how much is spent on drugs and materials, which are now under the category “specialized current consumption material”. It is also necessary to evaluate the usefulness of the current program classifier. A classifier per level of care (primary network, maternities, and general hospitals, specialized and central hospitals) would provide the information relevant for macro decision-making. Finally, when redesigning the Health Information System (HIS), it is essential to develop an interface with SIGFE and SINGERH. This will allow SIGFE to provide information for the analysis of cost-effectiveness or unit costs of the facilities.
Further decentralization
79. The new legislation on the state structure at provincial and municipal level should consider the specific needs of the health sector, especially basic health care provision. The inconsistency between the administrative and financial hierarchy directly results in the lack of coordination and leadership of the sector. The contradiction in the legislation, and the “disorderly abandonment” of the MOH functions without an adequate transfer of resources, have resulted in the current fragmentation of the system. The near elimination of the municipal health level, together with the integration of social sectors at this level, have created a vacuum at the level responsible for primary health care. The MOH should have a proactive role in the development of a legal framework that would determine the organization of the sector at the municipal level. It will be necessary for the government to resolve the dilemma posed by the decentralization of authority over the heath sector to the provincial governments, which clashes with the need for the central government to implement a policy of national dimension.
80. As the government reviews the National Health Policy and redefines the decentralization of local administrations, it should clearly define the role of each
- 28 -

level. The change from a deconcentration model to the current decentralized one was not accompanied by measures to transfer responsibilities for the provision of services that used to be centralized in the MOH. For example, the public health programs of the central level still implement activities at municipal level, while the same programs at provincial level have practically no resources available. The definition of responsibilities should be followed by the transfer of corresponding financial resources, and a major effort to create capacity. This should result in the channelling of much more resources to the provincial level, especially for goods and services. The implementation of this change would take several years and should be designed accordingly.
81. It will be important to clarify the mandate of the vertical programs. The following reforms are suggested: (i) that vertical programs stop taking responsibility for procuring and distributing resources; (ii) there should be a centralized procurement for drugs and materials, as justified by the economies of scale; (iii) public health programs at provincial level should receive adequate financial resources, including for the training of the technical staff at municipal level and for supervision; and (iv) the presence of vertical programs should cease at the provincial level, and all public health activities should be integrated at the municipal and communal levels.
Primary network financing
82. The government should channel adequate resources to ensure the good functioning of health centers and posts. Health centers and posts do not receive direct financing for goods and services. This is because the PHDs, with their own budgets, are responsible for the functioning of these units. Yet, resources allocated to the PHDs are not sufficient to guarantee the functioning of the health centers and posts since: (i) 54 percent of the resources are earmarked for administrative expenditures and operation of the PHDs themselves; and (ii) the PHDs do not have capacity in procurement and logistics to attend to the needs of the network of health centers and posts. The government needs to decide on a “recipient” who is better equipped to manage the financial resources at that level, and the decision will need to fit within the government’s decentralization framework. Two alternatives may be considered:
(iv) In the current legal framework, where the PHDs and municipal hospitals are DUs of provincial governments, the government would create an “activity” in the budget of PHDs or municipal hospitals, with resources earmarked to finance current non-salary expenditures of health centers and posts.
(v) Assuming that municipal administrations achieve the status of budgetary
units with administrative and financial autonomy, municipal hospitals and “Municipal Health Directorates” could become DUs of municipal administrations. These directorates would be responsible for the functioning of the health centers and posts within the municipality. Under the current law, municipal directorates have disappeared and have been merged with directorates of other social services. Therefore they
- 29 -

would need to recover some autonomy, taking into account the specificity of the health sector. Functions such as the procurement of essential drugs should remain at least at the provincial level, given the advantages of economies of scale.
83. The increase of resources at the primary level should be phased, in line with the increase in management capacity at this level. The increase in resources will not result in improved service delivery unless the local absorption capacity is improved. This means introducing management instruments and training managers. The success of this initiative will also depend on the presence of banks, suppliers with a tax payer number, an efficient drug market, and good logistics.
84. Box 3 summarizes the recommendations and proposes a schedule of activity implementation for the next four years. The calendar must be consistent and part of the medium term strategic plan, which would follow the new national health policy.
- 30 -

Box 3: Proposed Calendar for Implementation of Proposals Recommendations In charge 2007 2008 2009 2010
Increase the allocation for the sector by 0.5 percent annually
Government in general
Implementation of allocation criteria in the Budgetary Units MOH and MOF
Implementation of allocation criteria for the entire sector MOH and MOF
Work together with MAT to improve the financing of the primary service network, in the framework of the review of the legislation on decentralization
MOH and MAT
Preparation of the National Investment Plan MOH
Preparation of provincial plans and investments MOH and Provincial governments
Reinforcement of the management capacity of investments through the creation of a technical office that defines and monitors the norms that shall govern the new health constructions
MOH
Develop policy planning instruments and strategies, namely PNS and PESS MOH
Implementation of the planning calendar, with the utilization of the developed instruments MOH
Consign resources to the primary network through the creation of an activity managed from the PHD or municipal hospitals (both DUs of the Provincial governments)
MOH, MOF, and PGs
Develop management instruments for the health units adequate to the Country’s context MOH
Define the recommended unit costs and publication of a manual of good practices on the management of public resources
MOH
Review of the cadastre of natures and substitution of the program classifier per level of assistance MOF and MOH
Recovery of the SIS, attempting to express the potential synergies with SIGFE and SINGERH in order to improve the systematic analysis of the sector
MOH, MOF, and MAPESS
Work together with MAT in the decentralization aiming to ensure a uniform implementation of the national health policy all over the territory
MOH and MAT
Provide response in the framework of PNS to the establishment of responsibilities at each level, with special attention on the role of public health programs and the regulatory role of the MOH
MOH
Define (at medium term) the most adequate "recipient" to manage current resources to finance the primary network, observing the legal framework in force at each moment
MOH e MOF
To immediately implement the financing of the primary network through the creation of an activity with resources for health centers and posts
THE MOH, MOF and Provincial governments
- 31 -

SCALING UP PRIORITY FOR AGRICULTURE
Strategic Planning
85. The policy framework for the agricultural sector is described in the Estratégia de Combate à Pobreza (ECP), where a number of policy issues are addressed. Of the ten key goals put forward in the document, one is specific to the sector, calling for “minimizing the risk of hunger, satisfying domestic food needs and relaunching the rural economy as a vital sector in the process of sustainable development.”
86. This goal is subsequently broken down into four specific objectives, as follows:
Reinforce the production capacity of the traditional agricultural sector, particularly with respect to basic foodstuffs and in-shore and artisanal fishing;
Reactivate internal marketing systems;
Ensure the sustainable development of natural resources;
Reorganize and strengthen the legal framework and gradually modernize public institutions, converting them into agents of supervision and promotion of sustainable development.
87. At the strategic level, the government wants to promote local participation in decision making. The ECP further stresses the participation of communities, local areas and municipalities as the strategic nucleus of planning, implementation, monitoring and oversight as a basic principle of development. Interviews with officials of MINADER have highlighted a number of policy elements that are part of the government’s overall policy framework for the agricultural sector and that have been included in a law promulgated recently (Law No. 15 – “Lei de Base para o Desenvolvimento Agrário” – 12/07/2005):
the focus of agricultural support will be on the rehabilitation of basic foodstuff production and surpluses among traditional smallholder farmers. Government support to the sector will draw largely upon collaboration with producer and community groups – cooperatives and associations;
there is a strong need to develop human resource capacities, with a focus on those working at the field level, such as technical experts and extension staff;
rural financial systems are critical, and must receive priority in development – possibly using ‘in-kind’ exchanges;
the rehabilitation of the rural road network is essential for restoring access for service provision and marketing;
- 32 -

land tenure issues are important, but are best resolved – where possible – at local level through community and local authority participation;
irrigation development should be focused at local level, and primarily emphasize small-scale systems within the reach of local communities;
geographical priority would be given to the central highlands region, as it possesses a high production potential and population density.
88. The bulk of current and programmed investment under MINADER is heavily concentrated on government-controlled infrastructure rehabilitation. The next section discusses the PIP for the rural sector which comprises the rehabilitation of large scale government irrigation schemes4. Limited investment has also occurred or has been programmed for rehabilitation of government facilities (research stations, offices). The high proportion of capital expenditure allocated to these schemes contrasts with the objective concerned with the importance of small-scale locally managed irrigation and water control measures and will have to be resolved.
Growing Importance in the Budget
89. Public spending in agriculture as a share of the agricultural GDP is still low in Angola, but it has been increasing since 2003. Total current expenditures for agriculture as a share of the sectoral GDP have increased from 1.72% in 2003 to 6.3% in 2005. Total public investments in the sector have also shown an upward trend, increasing from 0.66% in 2003 to 3% of the agricultural GDP in 2005. Investment in the agricultural sector is highly dominated by the public sector, as some 88% of all funds invested in the sector are public and only 12% come from the private sector.
90. The share of agriculture in the total budget has also increased since 2003, growing by 241% between 2003 and 2005. In 2003, the share of agriculture in the budget represented only 0.39% of total expenditures and in 2005 this share had increased to 1.33%. There has been an even more substantive increase in public investment in agriculture as a share of total investment, that jumped from 0.30% in 2003 to 5.12% in 2005 (an increase of 1,602.5% in 3 years). The growing importance the government has attributed to public investments in agriculture has meant that there has been less spending with personnel and with goods and services (see Figure 4).
91. The execution of the budget for agriculture is highly centralized and concentrated. In 2005, for example, the budget totaled Kwz 16 billion and was executed by only 6 budget units which coordinate and control 31 dependent agencies. These 6 budget units included the Ministry of Agriculture and Rural Development, Ministry of Fisheries, Ministry of Urbanism and Environment, Fund for Rural Development, Fund 4 Investment in primary and secondary roads is under the mandate of the Ministry of Public Works, but responsibility for tertiary roads is less clear. MECANAGRO, a parastatal corporation under MINADER, should in theory have a major responsibility for tertiary roads in rural areas, but lacks both financial and human resources for this role.
- 33 -
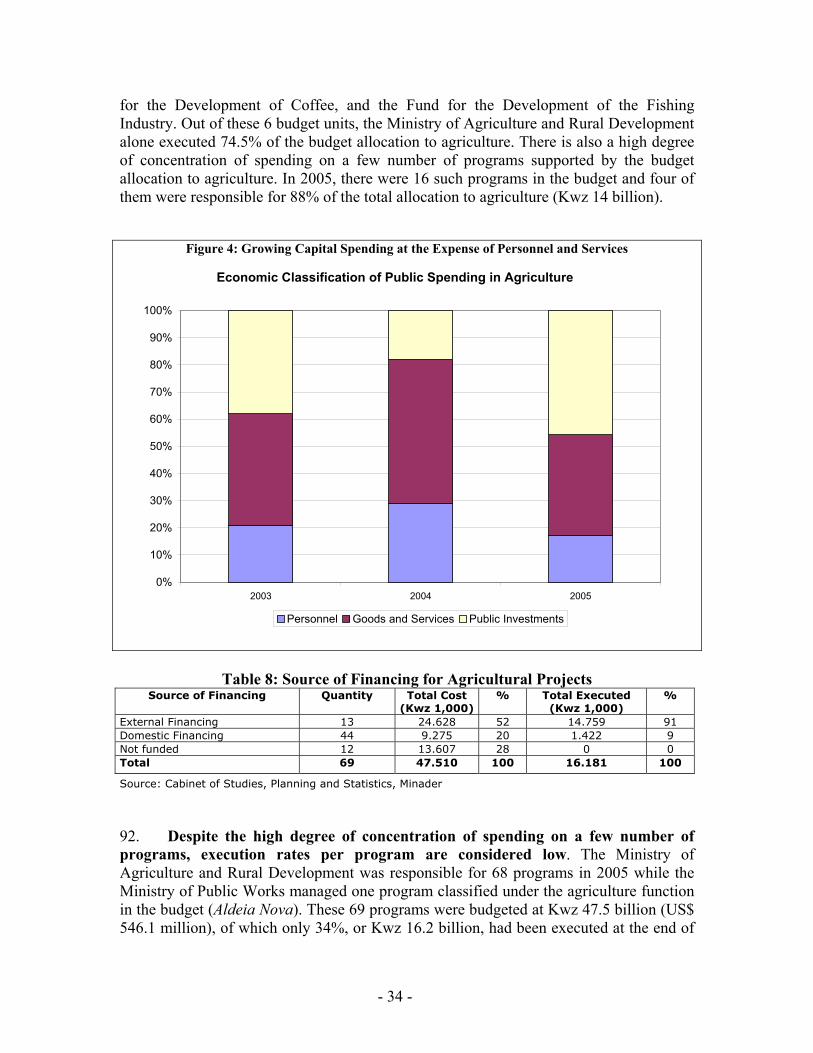
for the Development of Coffee, and the Fund for the Development of the Fishing Industry. Out of these 6 budget units, the Ministry of Agriculture and Rural Development alone executed 74.5% of the budget allocation to agriculture. There is also a high degree of concentration of spending on a few number of programs supported by the budget allocation to agriculture. In 2005, there were 16 such programs in the budget and four of them were responsible for 88% of the total allocation to agriculture (Kwz 14 billion).
Figure 4: Growing Capital Spending at the Expense of Personnel and Services
Economic Classification of Public Spending in Agriculture
0%
10%
20%
30%
40%
50%
60%
70%
80%
90%
100%
2003 2004 2005
Personnel Goods and Services Public Investments
Table 8: Source of Financing for Agricultural Projects Source of Financing Quantity Total Cost
(Kwz 1,000)% Total Executed
(Kwz 1,000) %
External Financing 13 24.628 52 14.759 91 Domestic Financing 44 9.275 20 1.422 9 Not funded 12 13.607 28 0 0 Total 69 47.510 100 16.181 100
Source: Cabinet of Studies, Planning and Statistics, Minader
92. Despite the high degree of concentration of spending on a few number of programs, execution rates per program are considered low. The Ministry of Agriculture and Rural Development was responsible for 68 programs in 2005 while the Ministry of Public Works managed one program classified under the agriculture function in the budget (Aldeia Nova). These 69 programs were budgeted at Kwz 47.5 billion (US$ 546.1 million), of which only 34%, or Kwz 16.2 billion, had been executed at the end of
- 34 -

2005. If this level of execution does not improve, the programs will only be totally executed after another 14 years.
93. More than 50% of the agricultural programs in the country are off-budget, directly financed by donors and private sector. According to a stock-taking of the agricultural programs and projects carried out in the rural areas in Angola in 20055, international donors and oil companies represented a major share of the agriculture programs in the country. The projects directly financed by the EU, World Bank, IFAD and USAID in the agriculture sector represents more than 45% of the total agricultural investments in the Angola.
94. Even within the Government-executed programs, there is a high dependency on external financing for the execution of programs in agriculture. Out of the 69 programs currently included in the budget, 57 are under execution with external financing and 12 have not been funded and therefore have not registered any expenditure. These 12 programs remain inactive since 1999. The 57 under execution account for 83% of the total that has been executed between 1999 and 2005. The 13 programs that are financed with external funds have registered an average execution rate that represents 60% of their total cost, while the 44 programs with domestic financing have registered an execution rate of only 15%.
Table 9: Distribution of Investment Projects per Province Province Quantity Total Cost – millions of kz. % Executed – millions of kz. %
Bengo 8 5,000 14.2 1,500 13.1Bengo y Uige 1 143 0.4 73 0.6 Cabinda 2 254 0.7 10 0.1 Cunene 3 842 2.4 46 0.4 Huambo 1 17 0.0 13 0.1 Huila 10 5,380 15.3 1,198 10.5Kuando Kubango 1 1,033 2.9 29 0.3 Kwanza Norte 1 925 2.6 58 0.5 Kwanza Sul 5 10,873 30.9 7,902 69.2Luanda 8 9,057 25.8 253 2.2 Lunda Sul 1 79 0.2 1 0.0 Malange 1 104 0.3 1 0.0 Moxico 2 780 2.2 197 1.7 National 18 12,352 4,760 Namibe 5 666 1.9 140 1.2 Uige 2 5 0.0 2 0.0 Total 69 47.510 100 16.181 100Source: MINADER
95. The spatial distribution of on-budget agricultural investment projects is concentrated in a few provinces. The provinces of Kwanza Sul, Huila, and Bengo concentrate some 60% of the total cost of all provincial projects and the projects in these 3 provinces account for 93% of the total that has been executed in all provinces. The province of Kwanza Sul is the main beneficiary as it is responsible for 70% of the total
5 Pacheco, Fernando. Inventário dos programas e projectos em curso no sector rural em Angola. The World Bank, 2005
- 35 -

executed in all provinces 6 . Considering only the off-budget agricultural projects, Huambo, Benguela and Bie are the most benefited provinces, encompassing around one third of the total projects. This region is more in line with the historical agricultural production trends, as this region was considered the bread-basket of the country in pre-independence periods. Other regions in the north and the south of the country, with large potential for agriculture and livestock, such as Malange, Cunene and Uige, among others, have been systematically under-funded by both government and donors programs.
96. The agricultural public investment program also presents a high degree of thematic concentration. The agricultural PIP includes 33 irrigation projects which represent 33% of the total cost of all projects and that are responsible for 70% of all funds executed so far. The irrigation projects together with the ones in the food security (13) and mechanization (1) groups account for roughly 97% of the total that has been executed so far. The concentration on irrigation projects may be linked to the availability of foreign funding for this kind of activity, but it is not directly related with the productive potential of the areas where the projects are being implemented. The execution rate for research and extension projects, on the other hand, has been extremely low at just 1.4% of the total between 1999 and 2005.
Table 10: Thematic Distribution of Investment Projects Topic Group Quantity Total Cost–
millions of kz. % Executed – millions
of kz. %
Irrigation 33 32.755 68.9 11.343 70.1 Mechanization 1 4.889 10.3 3.418 21.1 Research 14 4.557 9.6 168.9 1.0 Food Security 13 3.644 7.7 885 5.5 Extension 1 93 0.2 61 0.4 Others 7 1.572 3.3 305 1.9 Total 69 47.510 100 16.181 100 Source: MINADER
97. The investment projects under the mechanization group are all related to activities performed by MECANAGRO, the national agricultural mechanization company. From a budgetary point of view, MECANAGRO is a budget unit subordinated to MINADER that performs services to provincial governments for rehabilitation of tertiary roads, land preparation, rehabilitation of irrigation systems, and rural construction. The project executed in 2005 was the most important project in the agricultural PIP between 1999 and 2005 and was financed with funds from the Chinese credit line. It was mainly concerned with the acquisition of 100 tractors and other heavy machinery.
Insufficient Availability of Rural Credit
98. Rural financial systems are almost completely absent in Angola. Excluding Luanda, there are a total of 41 bank branches in Angola, which are confined entirely to 6 However, it is worth mentioning that, just one project, the “Aldeia Nova”, is responsible for more than 90% of the investments in the Province, or 45% of the total executed, and directly benefits not more than 600 demobilized soldiers (should we keep this last phase?).
- 36 -

provincial capitals. While most of the coastal provinces typically have five or six banks with offices in the provincial capital, only the Banco de Poupança e Crédito (BPC) and the Banco de Comércio e Indústria (BCI) – both State-owned - have close to a national network. As a result, most provincial capitals in the interior tend to be served by only one or two banks. Commercial bank activity is limited largely to short term trading loans, with agriculture and livestock together accounting for US$6.3 million in loans in 2002 (up from US$2.8 million in 2000), or approximately 1.3% of total loans. Fisheries received a further US$2.2 million in 2002 (0.4% of total loans).
99. Several government and non-governmental agencies supplement the formal banking system with specific microfinance programs, such as those operated by the Ministry of the Family and Promotion of Women (MINAFAMU) or Development Workshop. One bank, Banco Sol is also active in microcredit, and a new bank supported by USAID and ChevronTexaco – Novo Banco – has now been approved and is fully operational. Nevertheless microcredit in Angola is still very poorly developed. Development Workshop, which operates the largest microcredit programme in the country, reaches less than 4,000 clients and has a portfolio of less than US$500,000, all in urban areas of Luanda and Huambo. Rural microcredit operations are almost completely undeveloped. The absence of legislation on microfinance has left those few agencies active in the area operating in a legal vacuum, and rendered the acquisition of capital more difficult.
100. Successful efforts to promote credit use among farmers in Angola have been mediated by NGO’s. As noted above, Banco Sol has been a pioneer in linking with some of these NGO’s in lending to small farmers. Among the most important common elements of success are the following characteristics:
Credit, where successful, has been linked to input purchase and has not been contracted independently. Repayment has been contractually linked to marketing proceeds, rather than leaving responsibility for repayment directly with the farmers
Successful programs have been associated with farmer associations, thus solving
the problem of adverse selection together with economies in administrative areas. 101. Replication of these successful models can help promote investment and involvement in the market. However, it should be recognized that rural financial market growth is a long term prospect even under the best of circumstances. Credit for rural marketing enterprises and other small businesses, such as agricultural implement manufacture or food processing are also areas that are in need of financing and capital investment. There is little hope that the formal sector will on its own extend credit to such enterprises 7 . Nevertheless, there is much to recommend an extension of the 7 The recent launched Angola Development Bank will have a focus on medium enterprises and, according to information received during an interview in February, 2007, will prioritize investments in four supply chains, being three of them in the agricultural sector, namely maize, beans and cotton.
- 37 -

microcredit initiatives cited above to small businesses engaged in marketing, transport, farm implement manufacture or food processing on a small scale.
Decentralization and Market Orientation
102. Agriculture is perhaps the prototypical example of an activity that is not best managed from a capital city. While there are undoubtedly activities which must be centrally funded and directed, agriculture is by its very nature a dispersed and decentralized activity. This fact, together with Angola’s extremely wide variation in agro climatic zones, infrastructure, and market proximity suggest that decentralization in agriculture should receive a high priority in governmental strategic plans for the sector. If the key to long term growth is productivity improvement at the farm level coupled with development of marketing chains to connect farmers with demand centers and/or ports there are necessarily many expenditures which must be made at a level well below that of the central government or even the province. Structuring a project from the very outset to emphasize decentralized decision making and disbursement will enable this field level impact to be felt much earlier, even as the central apparatus is itself streamlined and strengthened.
103. Experience in other countries has demonstrated that funding large sector development programs through the central ministerial apparatus will not necessarily result in increased funding levels at the provincial, district or municipality levels. Of particular interest is the experience of Mozambique with the Proagri program. This multi-donor sector wide project succeeded in channeling donor funds through a single mechanism in the agriculture ministry but was less successful (in its first years) in getting this translated into real increases at provincial and lower levels. Concerted effort by donors and counterparts succeeded in changing this pattern by the end of the first five-year phase but it is noticeable that even this has not yet resulted in the hoped-for increases in services and results at the farm level.
104. The central government should also more actively promote the development of the private sector along with a gradual move towards decentralization. While the government has divested itself of many of its large state-run operations, there is still a tendency to look to the government for things which in the past were done by parastatal organizations. Perhaps the most obvious of these is the state agricultural machinery company, MECANAGRO, (formerly known as ENAMA) which is even now re-extending itself into rural areas after decades of virtual total absence and cessation of any farm activities. Reports from the central provinces indicate that it has a poor record in terms of timeliness of services, but that there are bureaucratic inhibitions to the private importation of farm equipment. This is entirely in line with past experience in Angola with ENAMA and is also in line with numerous examples around the world of poor performance of such organizations.
105. The central government should be concerned with the provision of infrastructure or other investments with public good attributes and leave to the private sector any activities inside the farm-gate. Recently, MECANAGRO has also started to offer subsidized sales of seed and other inputs, undercutting possible private
- 38 -
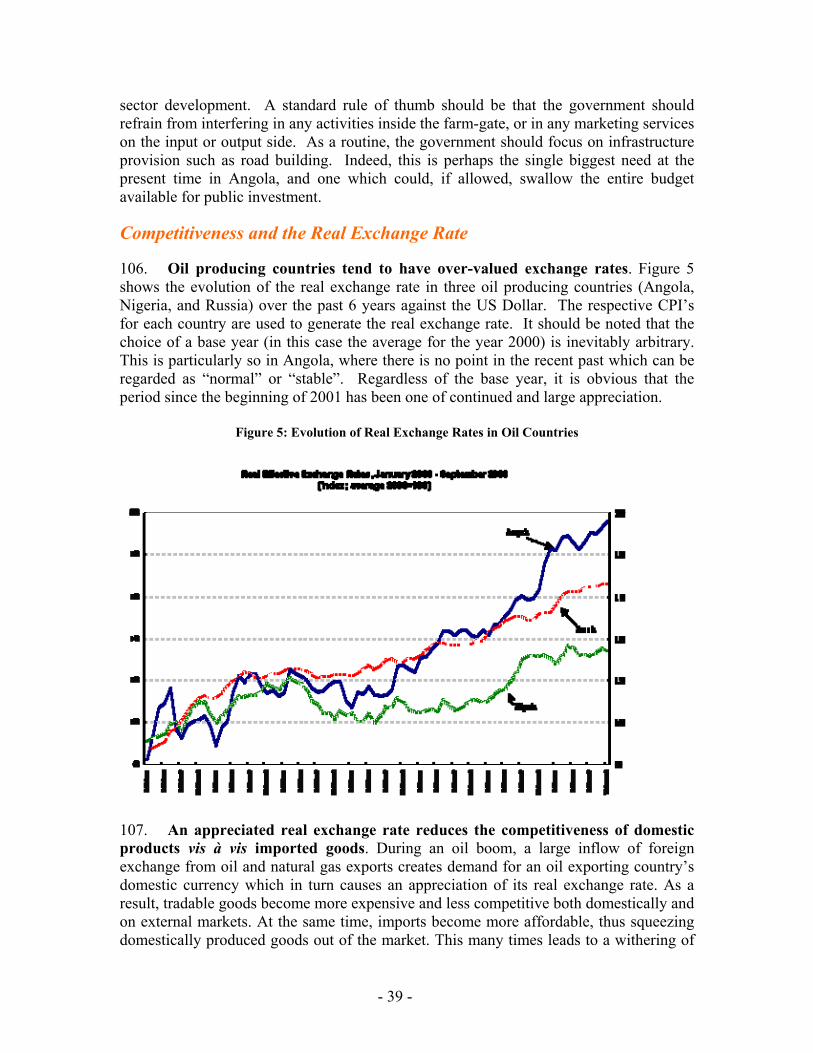
sector development. A standard rule of thumb should be that the government should refrain from interfering in any activities inside the farm-gate, or in any marketing services on the input or output side. As a routine, the government should focus on infrastructure provision such as road building. Indeed, this is perhaps the single biggest need at the present time in Angola, and one which could, if allowed, swallow the entire budget available for public investment.
Competitiveness and the Real Exchange Rate
106. Oil producing countries tend to have over-valued exchange rates. Figure 5 shows the evolution of the real exchange rate in three oil producing countries (Angola, Nigeria, and Russia) over the past 6 years against the US Dollar. The respective CPI’s for each country are used to generate the real exchange rate. It should be noted that the choice of a base year (in this case the average for the year 2000) is inevitably arbitrary. This is particularly so in Angola, where there is no point in the recent past which can be regarded as “normal” or “stable”. Regardless of the base year, it is obvious that the period since the beginning of 2001 has been one of continued and large appreciation.
Figure 5: Evolution of Real Exchange Rates in Oil Countries
107. An appreciated real exchange rate reduces the competitiveness of domestic products vis à vis imported goods. During an oil boom, a large inflow of foreign exchange from oil and natural gas exports creates demand for an oil exporting country’s domestic currency which in turn causes an appreciation of its real exchange rate. As a result, tradable goods become more expensive and less competitive both domestically and on external markets. At the same time, imports become more affordable, thus squeezing domestically produced goods out of the market. This many times leads to a withering of
- 39 -
the agricultural, manufacturing, and other sectors of the economy, a loss of jobs in these sectors, and development of an even greater economic dependence on the oil and natural gas industry.8 In Nigeria, for example, due to competition from artificially cheap food imports made possible by real exchange rate appreciation it became possible for producers in the major agricultural regions to buy imported food at the farm gate at prices below their own costs of production. The result was a collapse in domestic production and a conversion of what had been Africa’s largest agricultural exporter into its largest importer.
108. The appreciating trend of the national currency in Angola can become a major problem for the agricultural sector. Every farmer wishing to produce maize for the coastal urban market has been effectively taxed over the past years by the real appreciation. Casual evidence indicates that they may not be competitive with imports at current exchange rates, but enjoy some de facto protection in the interior due to the extremely poor roads. However, this is more likely to change for the worse if inflation continues high and the exchange rate remains stable in nominal terms. The appropriate and rapid response in a situation such as Angola’s, where it appears to be clear that some degree of appreciation is inevitable, should be a coherent effort at reducing unit costs for farmers so that they can maintain their viability as producers of marketed surplus.
The Reform Agenda in Agriculture
109. Total spending in agriculture should increase in volume and in coverage. Total spending in agriculture is still low, representing 1.33% of the total budget, and concentrated in a few geographic areas and themes. While prioritization must necessarily occur, and initial efforts will of course not happen simultaneously in all parts of the country, it is essential that the government’s vision and strategy have a coherent national focus, with activities in each area appropriate to that region’s advantages and possibilities. This means that investments should not be at odds with long run potentials, but must also take into account current evaluations of profitability and market access. There are distinct long run advantages in different regions, which should not be forgotten as many donors concentrate their efforts in the central provinces. In particular, one can name at least three distinct areas in addition to the central highlands which have a clear and important role in a long-run vision of the sector’s future:
Northern provinces have both higher rainfall and more fertile soils than do the central provinces of the highlands. Given the dominance of cassava culture, there is more work to do in terms of extension and market development to promote growth of other crops which can be readily sold in national and international markets, but this cannot change the fact that the inherent natural and agro climatic advantages of these areas are substantial. Deficient infrastructure (particularly
8 See Carneiro (2007) for a discussion of the challenges faced by oil-rich countries in their development path, especially the impacts of an appreciated real exchange rate on the diversification of the economy away from the oil sector.
- 40 -

roads) will retard progress in the immediate future, but these areas without doubt should figure prominently in a long run national strategy.
Dryer southern provinces (e.g. Cunene, Namibe, parts of Huila) have a long history of animal production which can be developed to satisfy national needs over the long term. While not a short run proposition, this merits a place in a long term vision, particularly in light of the shortage of draft animals in other parts of the country.
Areas in close proximity to major demand centers (e.g. the areas around Luanda, Benguela, and other cities) have developed production of high value crops such as fruits and vegetables. This is a normal development and is one to be supported and encouraged. It should be noted that it is unlikely that grain crops can be efficiently grown on irrigated land, particularly given the existence of large rain fed production zones.
110. There should be a clear strategy to gradually decentralize the execution of public spending and investment in agriculture to the provincial level. Given the characteristics of the agricultural sector, its vast agro-climatic zones, market proximity, and infrastructure needs, it seems that a faster pace of administrative decentralization of public spending in agriculture is warranted in Angola.
111. To help private sector development in agriculture and job creation, credit access to farmers should be made easier. Microcredit experiences around the world suggest that this is an area that works best with the least involvement from the government. In Angola, the few successful experiences that have appeared in the recent past, such as Banco Sol and Novo Banco, which have been mediated by NGOs, should be encouraged to develop so that smallholders who usually find it difficult to obtain credit from formal and official sources can be benefited.
112. Public spending and investment in agriculture should be oriented towards infrastructure rehabilitation and extension activities and research, prioritizing the smallholders. Most of the agricultural projects supported with public funds currently in Angola are concerned with the support to rehabilitation of large-scale irrigation schemes, and acquisition of heavy machinery and tractors. At the same time, public spending on extension and research projects has been very limited. With the infrastructure needs of the country stemming from the long civil war and the fact that Angola is currently experiencing a substantive oil boom, transportation costs are high, access to markets are almost non-existing, and the country has to deal with a significant appreciation of the real exchange rate. Under this scenario, the current focus of the central government on infrastructure rehabilitation is appropriate, but there should also be more attention to research and extension activities which can help increase productivity in the medium term and reduce unit costs, which by its turn would be helpful in dealing with the effects of an appreciated exchange rate in the sector.
- 41 -

PROSPECTIVE DECENTRALIZATION SCENARIOS
113. A readily available benchmark that could be recommended for Angola regarding decentralization is out of the question. The experience of each country regarding the organization of the state and of its fiscal system reveals discrepant aspects, even in the case of countries with geographical, economic or social similarity. Also, the attempt to group some characteristics and indicate the most appropriate model is quite problematic, since a large number of models are available. This section discusses three sequential scenarios for the decentralization process in Angola. These scenarios include the government, civil society, and the private sector. The participation of these sectors is considered to be essential for a better organization, coherence and effectiveness of the process. Underlying the scenarios is that the sharing of power, resources and accountability to subnational governments should prioritize the local sphere (municipal administrations).
Scenario 1: Short-term Administrative Decentralization
114. The first scenario is characterized by the implementation of administrative changes. These changes could be carried out within two periods of 3 (three) years each. The aim is to cover a time horizon that allows assessing the development of the process. The assessment at the end of the first period will be important to define the paths for the expansion of decentralization in the subsequent period. The second three-year period should include a larger number of subnational government units and a larger basket of public services to be carried out locally. In financial terms, the transfers from the central government to subnational governments would be limited.
115. The first stage is known as the experimental phase of administrative decentralization. The proposed changes are quite specific and selective. In political terms, the proposed scenario is indifferent about how subnational authorities are to be chosen, whether they should be appointed or directly elected. With regard to government functions, the objective is to contemplate some few basic services – such as basic education, health centers, and garbage collection. The beneficiaries of decentralization will be the subnational governments to be chosen among those already defined in Law 02/07 as potential candidates for decentralization. An initial suggestion is that only 5 provinces and 20 municipalities be included in the first three years. This small number is due to the necessity to test and monitor closely the implemented changes. However, one may say that there are natural candidates for the selection to this first stage: Luanda, Huambo, Benguela, Huila, Cabinda and Kwanza Sul, for instance due to the presence of both governmental organizations, civil society, international and private organizations in these provinces.
The Legal Framework
116. Revision of the existing legal framework is of paramount importance during the first three years of the process. In general terms, the current legal framework includes the following:
- 42 -

• 1992 Constitution: proposition underway, still undefined • Executive Decree 80/99: Ministry of Finance (recently revised, see below) • Law of the High Authority Against Corruption: not implemented • 2004 Poverty Reduction Strategy • Long-term National Development Strategy (2005-2025) • Law 02/07
117. Other specific regulations that must be scrutinized and adapted to the decentralization process are:
• 2004 Land Law and its 2006 regulation • 2005 Law on Urban Planning • Law of Associations (14/91) • Decree of Nongovernmental Organizations (84/02)
118. The revision and/or preparation of a legal apparatus that governs the decentralization process requires better use of existing fora for discussion and “concertation" in the provincial and local levels. In this regard, the strengthening and clear definition of the complementary relevant roles of some entities deserve special attention, including:
• Fourth National Assembly Committee • Decentralization Work Group • IFAL • FONGA • Employers’ and workers’ organizations • Universities • Civil society organizations • Media
119. A legal measure that is essential for the implementation of administrative reforms is the concession of autonomy to subnational governments selected to manage the decentralization programs in this stage. It is advisable to give such governments legal personality, outside the current administrative framework and independent from the central government. In other words, they will not act as a budgetary and fiscal unit, but rather as an entity that receives transfers from the central government and later manages these funds, undertakes expenditures, makes disbursements and maintains accountability in a process that is separate from the current one.
The Political-Institutional Framework
120. The political-institutional plan should include issues related to political, financial and administrative autonomy. It is not possible to state when political autonomy will be granted to the subnational level of government, since the recent Law 02/07 mentions that municipal administrators still have to be appointed. Administrative
- 43 -
autonomy relies on the revision of the legal framework that regulates decentralization. Some of the aspects that have to be dealt with within the three-year period include:
• Organizational structure: according to the responsibilities to be transferred to the local governments, each municipal administration will have to organize its administrative structure based on their interests and needs, with regard to service delivery and flexibility set up by Law 02/07. Some units are essential, such as planning; financial; personnel; equity; relationship with communes and local authorities, among others. The personnel unit is very important. The plan for the first stage of decentralization establishes that the personnel in charge of the services would still be under the responsibility of the central government.
• Competences: in this three-year period, municipal autonomous governments are expected to have exclusive responsibilities regarding elementary school (first to fourth grades); basic health services (health centers); urban infrastructure (roads, public lighting services, garbage collection and waste treatment, parks and gardens, markets, graveyards, and fairs); social and humanitarian assistance, after the solution to concurrent competences. All of these services are regarded as local, and the province should provide regional guidance and technical support to municipalities. Communes should be considered administrative branches of the municipal autonomous government, especially with respect to the direct relationship with the population and to the follow-up and control of service delivery.
121. In order for the decentralization process to develop in a coherent and effective manner, a National Plan for Institutional Strengthening should be devised for all government levels, civil society organizations, and private corporations. The work done by the Brazilian Institute of Municipal Administration (IBAM) in Angola in 2005 is noteworthy. Specific recommendations were provided based on an assessment of subnational competences and needs, such as support for improved planning and management capacities; establishment of partnerships; production of knowledge; interiorization; and capacity development plan. The latter includes short, medium and long-term training courses, in addition to the qualification of trainers and on-site exposure. The work also included field methodology for determination of the needs for institutional strengthening.
122. The scope of the capacity development plan for the first three years should target:
• Central bodies directly related to subnational governments: Ministry of Finance, MAT, Ministry of Planning, Ministry of Employment and Social Security, Ministry of Agriculture and Rural Development, Ministry of Urban Development and Environment and IFAL;
• the selected 5 provincial governments; • the selected 20 municipalities; • non-governmental and community organizations that operate with and within
these municipalities;
- 44 -
• private companies operating in the provinces and municipalities. 123. The first stage of the plan is expected to assess the opportunities (potentials) and challenges (needs) in 5 provinces and 20 municipalities. Among several aspects, it should include: systematization of existing assessments9; definition of priority areas for each provincial and municipal administration according to the responsibilities to be assumed; and the mapping of existing public and private (profitable or not) technical support services. The second stage of the plan should address the compatibility between the supply and demand of technical support services in order to identify where and which limitations need to be overcome.
124. The following basic elements are suggested for the plan:
• justification of the plan in the context of the initial decentralization process (first three years);
• systematization of supply and demand according to the type of agent; • objectives and goals according to the type of beneficiary agent; • types of qualification and technical support activities to be offered; • estimate of expenditures and possible financial support sources; • entities eligible for service supply; • schedule for implementation of activities, making the supply of qualification
compatible with the supply of technical support services;
The Fiscal and Financial Framework
125. The concession of specific transfers from the central government to the selected provincial and municipal governments is the basis of the fiscal strategy for this initial stage. The problem with the design of a fiscal strategy for decentralization in Angola is that the size of public administration (in terms of tax burden and of the overall expenditure-to-GDP ratio) is extremely large in comparison to other African countries and even to emerging economies. This means that a future allocation of public resources for subnational governments direct management should, in principle, be based on some kind of reallocation of existing resources that are currently used by the central government.
126. Public investments could continue to be totally financed, managed and monitored directly by the central government. Due to the understaffed institutional structure of municipal and communal governments, it is necessary to prepare and implement an administration that at least warrants the management of the current expenditures. The specific objective of the agreements should be therefore the acquisition by subnational governments of goods, materials, and services that are necessary for decentralized service delivery.
9 Special attention should be given to IBAM (2005) study
- 45 -
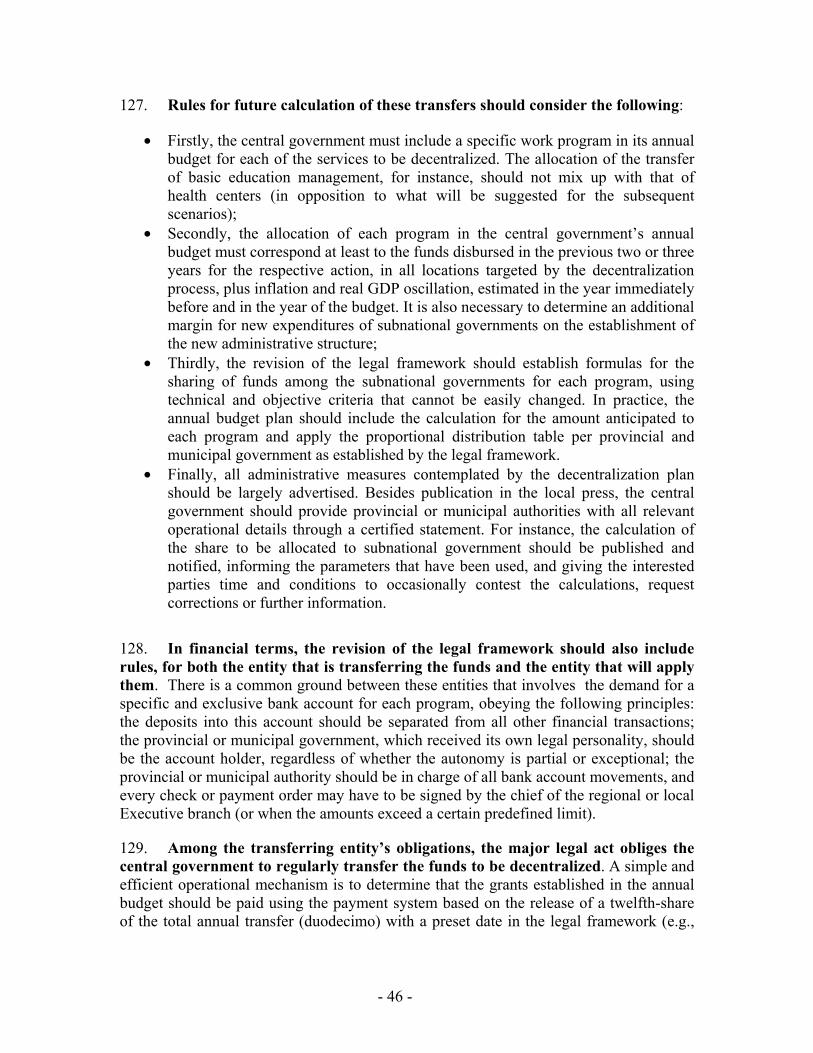
127. Rules for future calculation of these transfers should consider the following:
• Firstly, the central government must include a specific work program in its annual budget for each of the services to be decentralized. The allocation of the transfer of basic education management, for instance, should not mix up with that of health centers (in opposition to what will be suggested for the subsequent scenarios);
• Secondly, the allocation of each program in the central government’s annual budget must correspond at least to the funds disbursed in the previous two or three years for the respective action, in all locations targeted by the decentralization process, plus inflation and real GDP oscillation, estimated in the year immediately before and in the year of the budget. It is also necessary to determine an additional margin for new expenditures of subnational governments on the establishment of the new administrative structure;
• Thirdly, the revision of the legal framework should establish formulas for the sharing of funds among the subnational governments for each program, using technical and objective criteria that cannot be easily changed. In practice, the annual budget plan should include the calculation for the amount anticipated to each program and apply the proportional distribution table per provincial and municipal government as established by the legal framework.
• Finally, all administrative measures contemplated by the decentralization plan should be largely advertised. Besides publication in the local press, the central government should provide provincial or municipal authorities with all relevant operational details through a certified statement. For instance, the calculation of the share to be allocated to subnational government should be published and notified, informing the parameters that have been used, and giving the interested parties time and conditions to occasionally contest the calculations, request corrections or further information.
128. In financial terms, the revision of the legal framework should also include rules, for both the entity that is transferring the funds and the entity that will apply them. There is a common ground between these entities that involves the demand for a specific and exclusive bank account for each program, obeying the following principles: the deposits into this account should be separated from all other financial transactions; the provincial or municipal government, which received its own legal personality, should be the account holder, regardless of whether the autonomy is partial or exceptional; the provincial or municipal authority should be in charge of all bank account movements, and every check or payment order may have to be signed by the chief of the regional or local Executive branch (or when the amounts exceed a certain predefined limit).
129. Among the transferring entity’s obligations, the major legal act obliges the central government to regularly transfer the funds to be decentralized. A simple and efficient operational mechanism is to determine that the grants established in the annual budget should be paid using the payment system based on the release of a twelfth-share of the total annual transfer (duodecimo) with a preset date in the legal framework (e.g.,
- 46 -
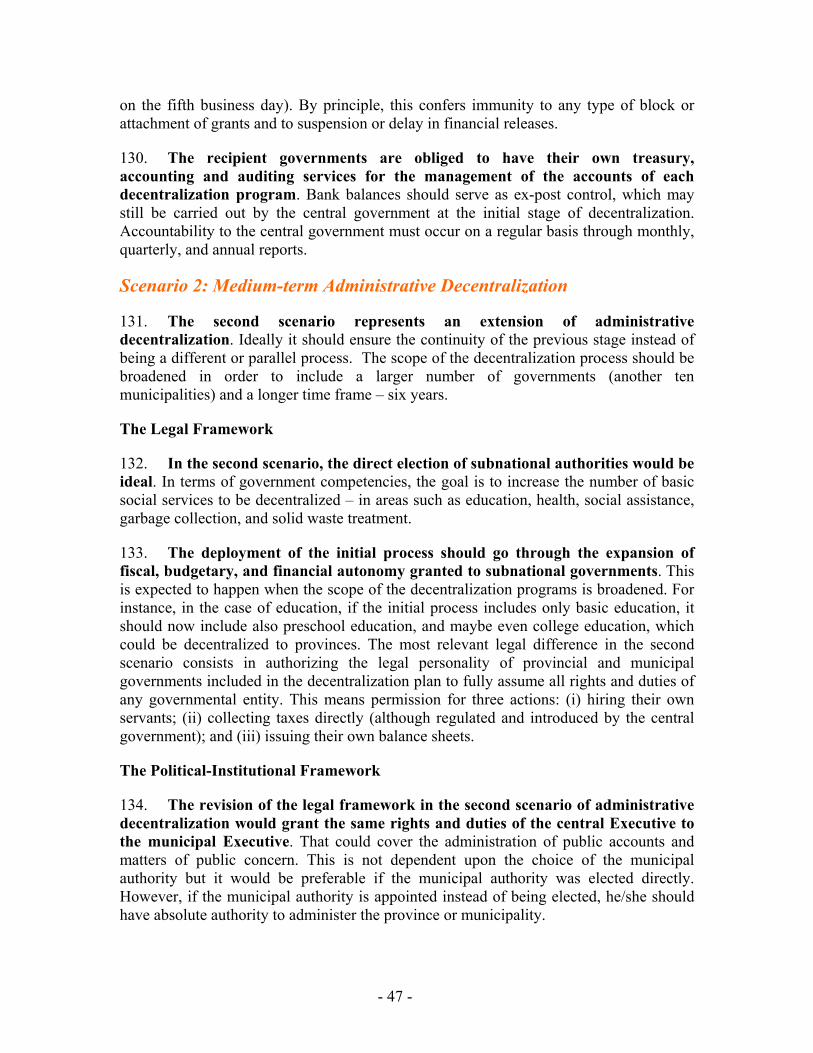
on the fifth business day). By principle, this confers immunity to any type of block or attachment of grants and to suspension or delay in financial releases.
130. The recipient governments are obliged to have their own treasury, accounting and auditing services for the management of the accounts of each decentralization program. Bank balances should serve as ex-post control, which may still be carried out by the central government at the initial stage of decentralization. Accountability to the central government must occur on a regular basis through monthly, quarterly, and annual reports.
Scenario 2: Medium-term Administrative Decentralization
131. The second scenario represents an extension of administrative decentralization. Ideally it should ensure the continuity of the previous stage instead of being a different or parallel process. The scope of the decentralization process should be broadened in order to include a larger number of governments (another ten municipalities) and a longer time frame – six years.
The Legal Framework
132. In the second scenario, the direct election of subnational authorities would be ideal. In terms of government competencies, the goal is to increase the number of basic social services to be decentralized – in areas such as education, health, social assistance, garbage collection, and solid waste treatment.
133. The deployment of the initial process should go through the expansion of fiscal, budgetary, and financial autonomy granted to subnational governments. This is expected to happen when the scope of the decentralization programs is broadened. For instance, in the case of education, if the initial process includes only basic education, it should now include also preschool education, and maybe even college education, which could be decentralized to provinces. The most relevant legal difference in the second scenario consists in authorizing the legal personality of provincial and municipal governments included in the decentralization plan to fully assume all rights and duties of any governmental entity. This means permission for three actions: (i) hiring their own servants; (ii) collecting taxes directly (although regulated and introduced by the central government); and (iii) issuing their own balance sheets.
The Political-Institutional Framework
134. The revision of the legal framework in the second scenario of administrative decentralization would grant the same rights and duties of the central Executive to the municipal Executive. That could cover the administration of public accounts and matters of public concern. This is not dependent upon the choice of the municipal authority but it would be preferable if the municipal authority was elected directly. However, if the municipal authority is appointed instead of being elected, he/she should have absolute authority to administer the province or municipality.
- 47 -

135. A more substantial change would be the municipal government’s right to collect typically local taxes – property tax and occasional taxes to be paid by real estate owners, taxes on garbage collection, cleaning of the streets, and public lighting. The central government should continue to regulate or define the tax rates or parameters for the collection of the property tax (such as zoning of cities and mapping of generic values), as well as the tax entries. The municipal governments should be in charge of collecting the taxes and maintaining the respective registers. If that is not possible, then the responsibility should be handed over to the provincial government (respecting the territory of the municipality that refused to or could not administer the revenue directly).
The Fiscal and Financial Framework
136. The scope of the second scenario should be restricted to the decentralization of the so-called current expenditures incurred to comply with the programs selected as object of this process. Expenditures on investments should still be undertaken by the central government, including the functions and responsibilities extended in the scope of the second stage of decentralization. Unlike the previous stage, which did not allow for investments, subnational governments should be free to carry out works and to purchase machines and facilities. This is expected to occur marginally due to the massive dependence of subnational governments on transfers from the central government; there are only two sources of resources left for direct local investments - the product of revenue from local taxes or the release of funds by the central government.
137. The system of transfers should continue to be contingent upon conditional transfers, but with a more general approach, such as the so-called block grants. If the first stage demanded very specific transfers, with detailed conditionalities (e.g.: for maintenance of the public elementary school system), the second stage may include transfers with sectoral applications (e.g.: education). The budgetary and financial strategy defined in the first stage should be maintained, but the managerial instruments have to be replaced.
138. Subnational governments are expected to assume full responsibility for budgetary, fiscal and also equity management. They are expected to detach themselves from the central government’s management and budget structure and to become totally autonomous in terms of fiscal management. In practice, they will still be extremely dependent upon the central government’s structure in that nearly half of their resources would still come from the center.
Scenario 3: Fiscal Decentralization
139. Fiscal decentralization is the ideal outcome scenario. This scenario should include direct elections for subnational authorities and the transfer of all basic services to subnational governments. It would also be necessary to establish a national system for the transfer of funds, control the indebtedness capacity of subnational governments, and to grant more autonomy over the collection of typically local taxes. The major objective is to provide reasonable autonomy for subnational governments to exercise their power,
- 48 -

and take hold of their expenditures through a more autonomous fiscal administration. This, however, is considered to be the hardest part.
The Legal Framework
140. The revision of the legal framework is crucial in this scenario. First of all, unlike the changes implemented through the Law enacted in early 2007, the changes should be more radical. This may mean a more comprehensive political process, encompassing discussions as broad as possible at the political and community levels.
141. The revision of the legal framework should include three key principles for the implementation of fiscal decentralization:
• Firstly, the new process should be implemented on a nationwide basis, being extended to all subnational governments without exception and without adherence, as established by national laws. There should be a transition period for municipalities not contemplated in the previous two scenarios, allowing some time for adaptation. The central government should be definitively dismissed from the delivery of services.
• Secondly, typically local government functions will have all responsibilities delegated to municipal governments. In other words, the same legal framework should exhaustively list the actions and services to be decentralized, specifying competences to legislate, execute, finance and spend, which should be totally transferred to municipal governments and, in exceptional cases, to provincial governments.
• Thirdly, it is necessary to have a new national system for fund transfers, no longer based on conditional transfers, but on tax revenue sharing, where recipient governments may apply the funds as they wish. A quite simple alternative to define the amount to be regularly transferred is to apply a percentage value on the central government’s total revenue from taxes and from oil. Moreover, the competence to collect (instead of regulating or imposing) all municipal taxes and duties should be delegated to municipal governments all over the country, integrating the budget of the tax collector with the resulting revenue (thus encouraging good management of tax collection), whereas municipalities that fully collect these taxes and are able to pay for their expenditures should be allowed to contract long-term debts (including bank loans).
The Institutional Framework
142. The budgetary process may be totally entrusted to the municipal government, as well as the financial, equity and personnel management. However, one should recall that most servants would be those employed by the central government and would still get their pay from it, with all of the workers’ rights preserved, but new employees should be hired directly by municipal governments.
- 49 -
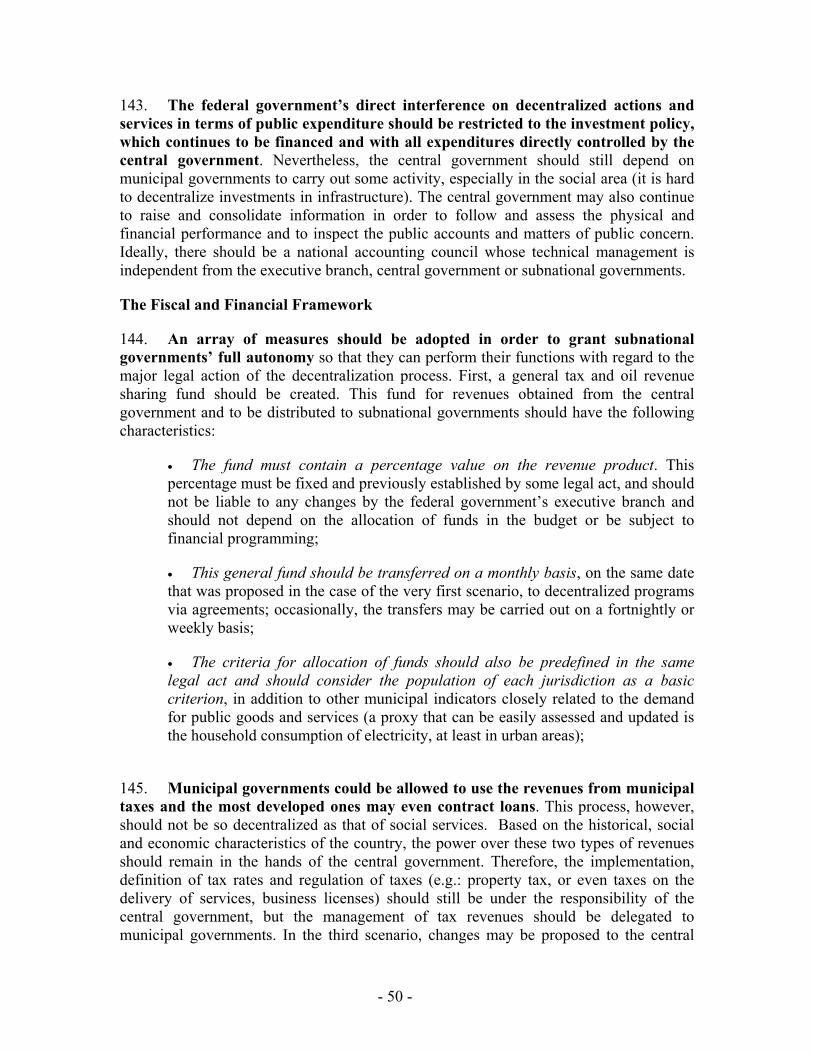
143. The federal government’s direct interference on decentralized actions and services in terms of public expenditure should be restricted to the investment policy, which continues to be financed and with all expenditures directly controlled by the central government. Nevertheless, the central government should still depend on municipal governments to carry out some activity, especially in the social area (it is hard to decentralize investments in infrastructure). The central government may also continue to raise and consolidate information in order to follow and assess the physical and financial performance and to inspect the public accounts and matters of public concern. Ideally, there should be a national accounting council whose technical management is independent from the executive branch, central government or subnational governments.
The Fiscal and Financial Framework
144. An array of measures should be adopted in order to grant subnational governments’ full autonomy so that they can perform their functions with regard to the major legal action of the decentralization process. First, a general tax and oil revenue sharing fund should be created. This fund for revenues obtained from the central government and to be distributed to subnational governments should have the following characteristics:
• The fund must contain a percentage value on the revenue product. This percentage must be fixed and previously established by some legal act, and should not be liable to any changes by the federal government’s executive branch and should not depend on the allocation of funds in the budget or be subject to financial programming;
• This general fund should be transferred on a monthly basis, on the same date that was proposed in the case of the very first scenario, to decentralized programs via agreements; occasionally, the transfers may be carried out on a fortnightly or weekly basis;
• The criteria for allocation of funds should also be predefined in the same legal act and should consider the population of each jurisdiction as a basic criterion, in addition to other municipal indicators closely related to the demand for public goods and services (a proxy that can be easily assessed and updated is the household consumption of electricity, at least in urban areas);
145. Municipal governments could be allowed to use the revenues from municipal taxes and the most developed ones may even contract loans. This process, however, should not be so decentralized as that of social services. Based on the historical, social and economic characteristics of the country, the power over these two types of revenues should remain in the hands of the central government. Therefore, the implementation, definition of tax rates and regulation of taxes (e.g.: property tax, or even taxes on the delivery of services, business licenses) should still be under the responsibility of the central government, but the management of tax revenues should be delegated to municipal governments. In the third scenario, changes may be proposed to the central
- 50 -

government, with the definition of different and higher tax rates for better developed regions – which could be collected as additional rates.
146. The three scenarios outlined in this chapter are not exactly alternatives if we compare their possible paths. In practice, it is as if they were all part of the same scenario, with clearly defined goals, scope, and time for implementation. Box 4 shows a comparison of the major features of each scenario. The third scenario is the desired and optimal arrival point, but it is only achievable in the long run, and this may take one decade or even a whole generation. Its major feature is the concession of full autonomy to subnational governments.
- 51 -
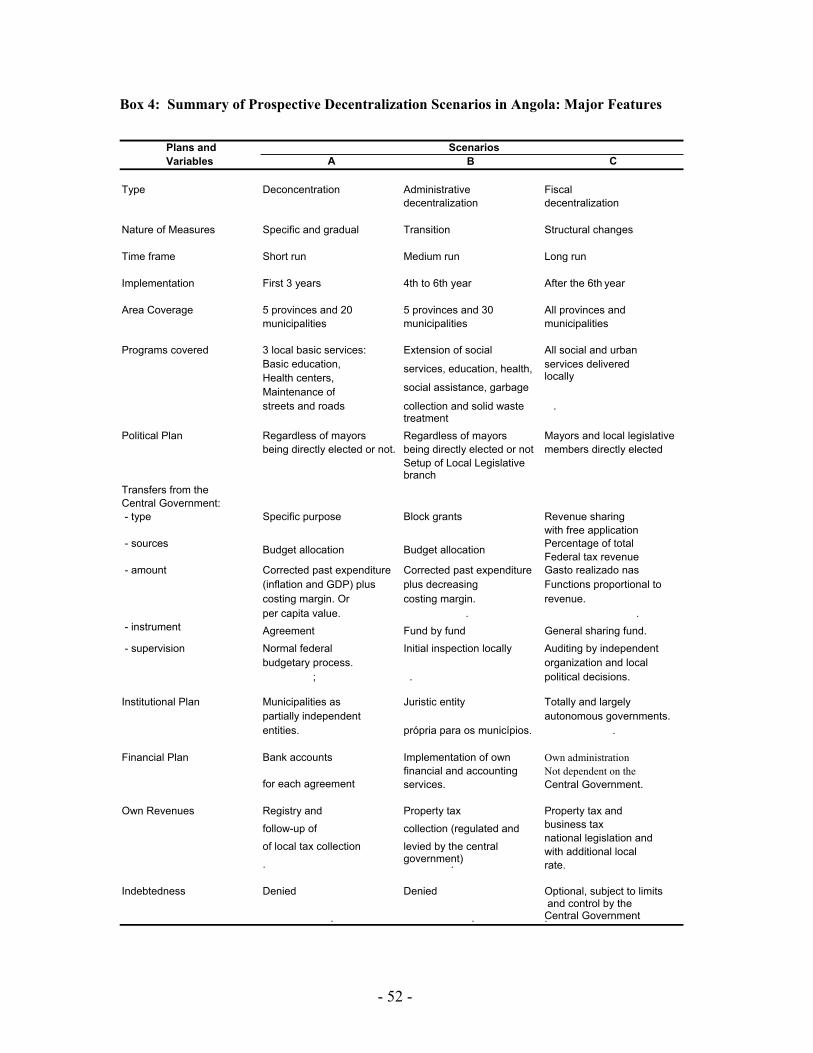
Box 4: Summary of Prospective Decentralization Scenarios in Angola: Major Features
Plans and Variables A B C
Type Deconcentration Administrative Fiscal decentralization decentralization
Nature of Measures Specific and gradual Transition Structural changes
Time frame Short run Medium run Long run
Implementation First 3 years 4th to 6th year After the 6th year
Area Coverage 5 provinces and 20 municipalities
5 provinces and 30 municipalities
All provinces and municipalities
Programs covered 3 local basic services: Basic education, Health centers, Maintenance of streets and roads
Extension of social
services, education, health,
social assistance, garbage
collection and solid waste treatment
All social and urban services delivered locally
.
Political Plan Regardless of mayors being directly elected or not.
Regardless of mayors being directly elected or notSetup of Local Legislative branch
Mayors and local legislative members directly elected
Transfers from the Central Government: - type Specific purpose
Block grants
Revenue sharing with free application
- sources Budget allocation Budget allocation Percentage of total Federal tax revenue
- amount Corrected past expenditure (inflation and GDP) plus costing margin. Or per capita value.
Corrected past expenditure plus decreasing costing margin. .
Gasto realizado nas Functions proportional to revenue. .
- instrument Agreement Fund by fund General sharing fund. - supervision Normal federal
budgetary process. ;
Initial inspection locally
.
Auditing by independent organization and localpolitical decisions.
Institutional Plan Municipalities as partially independent entities.
Juristic entity
própria para os municípios.
Totally and largely autonomous governments. .
Financial Plan Bank accounts
for each agreement
Implementation of own financial and accounting services.
Own administration Not dependent on the Central Government.
Own Revenues Registry and
follow-up of
of local tax collection
.
Property tax
collection (regulated and
levied by the centralgovernment) .
Property tax and business tax national legislation and with additional local rate.
Indebtedness Denied
.
Denied
.
Optional, subject to limits and control by the Central Government .
Scenarios
- 52 -