Embed Size (px)
Citation preview

1
The First Tsunami attack on Sri Lanka
Krakatoa Island– 27th August 1883
Understanding the Tsunami Wave
• Generation• Propagation• Nearshore Transformation• Shoreline Entry• Inland Dissipation
2
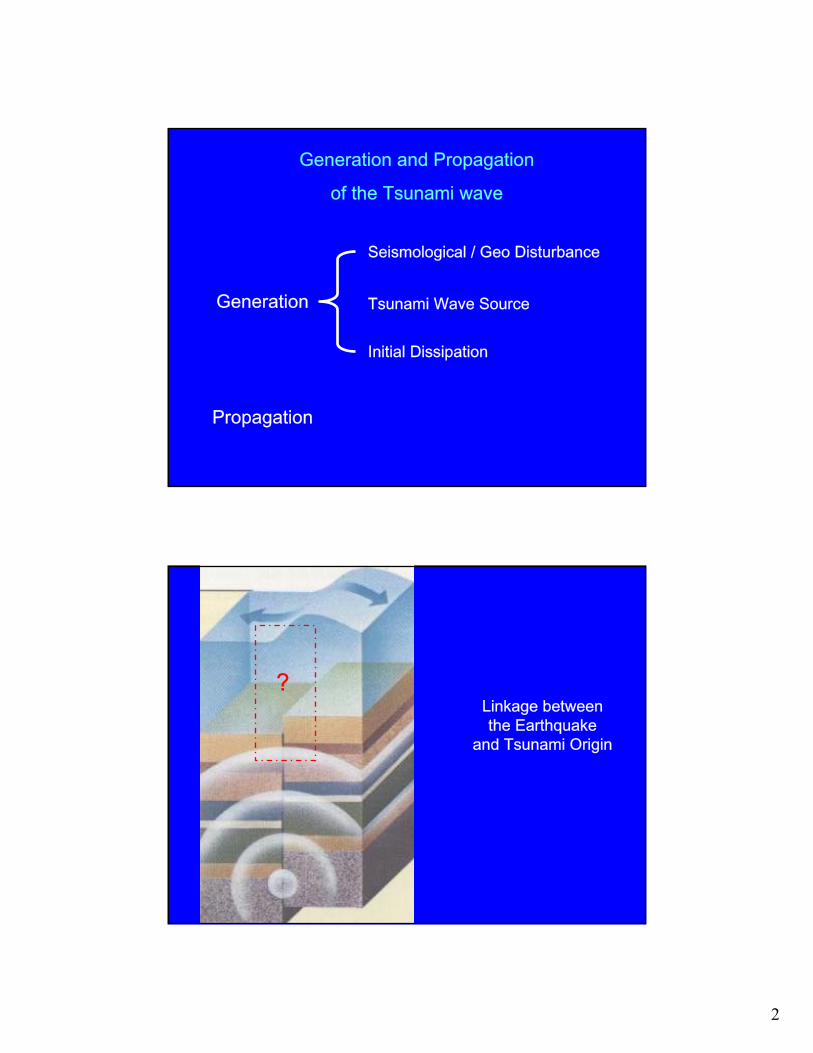
Generation and Propagation
of the Tsunami wave
Seismological / Geo Disturbance
Tsunami Wave SourceGeneration
Initial Dissipation
Propagation
Linkage between the Earthquake
and Tsunami Origin
?

3
Indian Ocean Earthquake – Tsunami 2004
F1
F2
F3 F1 = 330 km
F2 = 570 km
F3 = 300 km
Displacement = 11 m
Fault width = 150 km
F1
F2
F3
230 k
m
435 km
330 km
300 km
570 km
150 k
m
Rupture area of the December 26th Earthquake

4
Indian Ocean Earthquake – Tsunami 2004
F2 = 570 km
F1 = 330 km F3 = 300 km
Radar Satellite record
of wave heights -
Two hours after the EQ
Maximum deep water
wave height = 0.6 m
0.6 mNearshore
Transformation causes
the damage
5
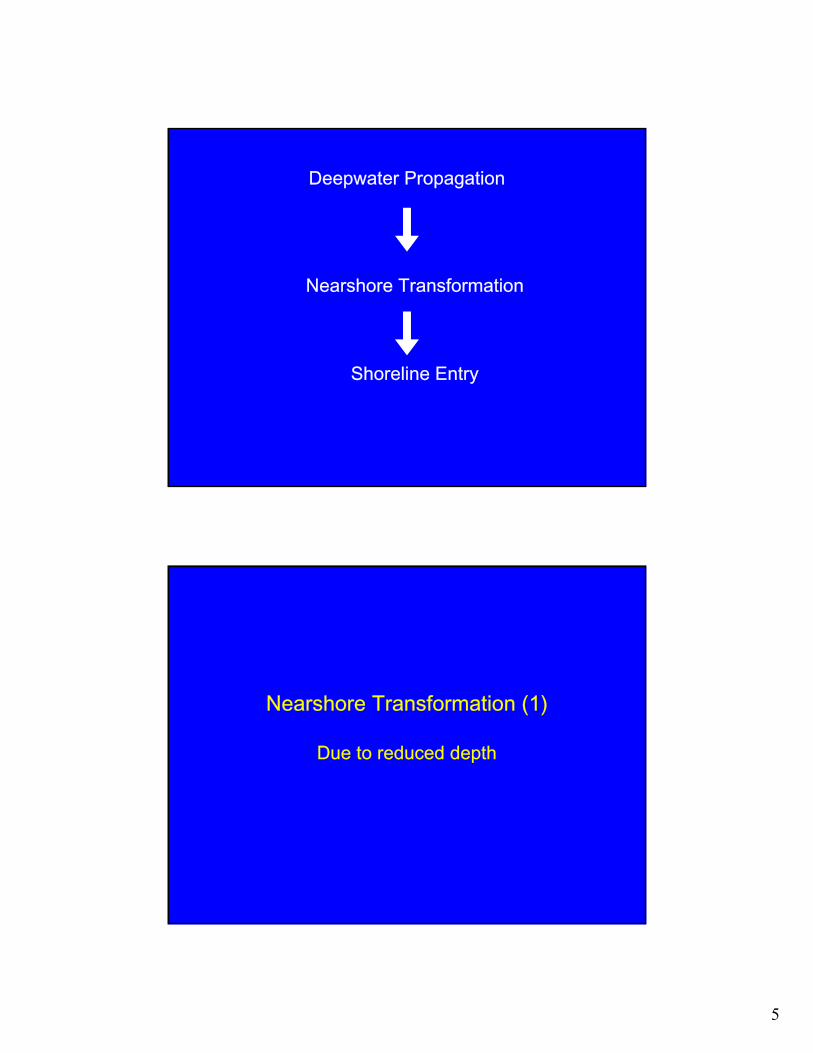
Deepwater Propagation
Nearshore Transformation
Shoreline Entry
Nearshore Transformation (1)
Due to reduced depth

6
Wave Speed,
Energy Transmitted (Power)
Basic Long Wave Mechanics
The wave propagates with hardly any loss of energy
dgc =
cHP 2∝
212 dHP ∝
( )lengthwave
PEloss1
∝Energy Loss
Deepwater Propagation
Nearshore Transformation (1)due to reduced water depth
Nearshore Transformation (2)
Coastal Processes as wave reach the shallow water (2a)
Characteristics influenced by the shape and geometry (2b)
Shoreline Entry

7
SHORELINE ENTRY OF THE WAVE
Flooding - Hikkaduwa

8
The Tsunami
Approaches as a series of waves
around 30 minutes
Indian Ocean Earthquake – Tsunami 2004

9
Indian Ocean Earthquake – Tsunami
2004
Indian Ocean Earthquake – Tsunami
2004

10
Indian Ocean Earthquake – Tsunami
2004

11
Indian Ocean Earthquake – Tsunami
2004

12
Nearshore Transformation (1) (2)
Due to reduced water depth (1)
Coastal Processes as wave reach the shallow water (2a)
Characteristics influenced by the shape and geometry (2b)
Diffraction
Lateral Dispersion of wave energy around the
country

13
Direct waves
Reflected waves
Refracted & Diffracted waves
Direct & RefractedwavesCombined waves

14
Increase in Height/Speed and formation of Eddies
Concentration of wave energy
depth contoursInc
oming
wav
e ray
s
Nearshore TransformationCharacteristics influenced by the shape and geometry (2b)
Unawatuna - concentration of energy and spreading around the headland

15
Bay – Increase of Speed & Height
Headland – concentration of energy and spreading around the headland
Bay – increase of speed & height and circulation

16
Proposed Development of the Port of GalleJapanese Port Consultants
Assessment of the Impacts

17
Field Measurements that captured the event
Surveys conducted by the Japanese and USA experts
Monitoring, Simulation and Prediction
Countermeasures against Tsunamis
Water level Measurements by NARA at Mutwall Fishery Harbour
3m
Field Measurements that captured the event
Harbour Waves
Indian Ocean Earthquake – Tsunami 2004

18
13
14
15
16
17
22-Dec 23-Dec 24-Dec 25-Dec 26-Dec 27-Dec 28-Dec 29-Dec 30-Dec 31-Dec 1-Jan
Time
Wat
er L
evel
(m)
Measurements by Lanka Hydraulic Institute
2-2.5m
water level
Indian Ocean Earthquake – Tsunami 2004
Tidal Period = 12.4 hours
Tsunami period = 20-30 minutes
0
10
20
30
40
50
60
70
80
12/26/04 0:00 12/26/04 6:00 12/26/04 12:00 12/26/04 18:00 12/27/04 0:00
Time
Velo
city
Mag
nitu
de (c
m/s
)
2.5 km/hour
at 15m depth – Tsunami wave speed – 50 km/hour
wave speedIndian Ocean Earthquake – Tsunami 2004

19
9 – 9.20 am
12 – 12.20 pm
3 – 3.20 pm
6 – 6.20 pm
Pressure Variation (m)
Sea wave period = 5-20 seconds
Tsunami wave period = 15-20 minutes
Surveys conducted by theJapanese and USA experts
Indian Ocean Earthquake – Tsunami 2004

20
East of Galle Port
road68m
inside of the house
sand not flushedby tsunami attack
beach
Hikkaduwa Fishery Harbour
7m
wharfsea
No damage to the houseTsunami traces on the 2nd floor
65 fishery boats (inside the harbour) were damaged
view 1
view 1

21
Hikkaduwa
roadbeachwashed train
railway64m
188m
188m 228m
leaf tarnished
Ambalangoda
houses
road
railway
sea
view 1
view 2 view 2
view 1

22
5
Tsunami Wave Heights
in meters
5
3 - 5
117 - 9
5 -114-94-10
2
4- 5
7 - 9
5
5
3 - 4
Tangalle Fishery Harbour
-0.5
-0.4
-0.3
-0.2
-0.1
0
0.1
0.2
0.3
0.4
1-Nov-03 6-Nov-03 11-Nov-03 16-Nov-03 21-Nov-03 26-Nov-03
0.7m
26th Dec 2:30 am High Water
8:30 am Low Water
2:30 pm High Water

23
Incoming waves
Reflected waves
Refracted and Diffracted waves
Incoming & RefractedwavesCombined
waves

24
5
Testified arrival times of the Highest Wave
9:209:50
10:00
11:05
11:30
9:40
10:10
9:00
8:40
9:20

25
Depth profile before
Depth profile after
78.0=dH
Increase in Coastal Erosion due to the changes in the topography
Rock armoured revetments
Interlocking concrete units

26
Soft Vegetation
- Hikkaduwa
7) Planned use of vegetation
Coconut Plantation - Kosgoda

27
Mangrove Forest
L
Mangrove ForestH1
H2U1 U2
+−
+=∆
gUH
gUHH
22
22
2
21
12buau
LHi +=
∆=

28

29
Coral Reefs
d
h
Hi Ht
L
Reef – act as a submerged breakwater
bb uτ

30
1) Early Warning System &
Public Warning System
2) Hazard Map for vulnerability
3) Set Back
4) Evacuation Structures
5) Tsunami Breakwater
6) Tsunami Dike ?
7) Planned use of vegetation
promote successful evacuation from tsunami
mitigate tsunami
Modelling
Response To Tsunamis - Countermeasures against Tsunamis

31
PlanningBefore an extreme event
After an extreme event
Opportunity for
Damage Assessment
in the context of
Planning for Coastal Hazards
Disaster Preparedness and Mitigation Plan
Coastal Hazards
Tsunamis

32
ModerateLowVery Low
HighModerateLow
Very HighHighModerate
Low HighMedium
Mild & Local
Mild & Widespread/
Severe & Local
Severe & Widespread
Probability
Damage or Consequence
Risk = Probability x Damage or Consequence
Land Slides
Tsunami
Thank you