Embed Size (px)
Citation preview
Holland, C. D., Fundamentals of Multicomponent Distillation, McGraw-Hill, New York (1981).
Holland, C. D., and K. S. McMahon, “Comparison of Vaporization Ef- ficiencies with Murphree-type Efficiencies in Distillation-I,” Chem. Eng. Sci., 25,431 (1970).
Kayihan, F., 0. C. Sandall, and D. A. Mellichamp, “Simultaneous Heat and Mass Transfer in Binary Distillatiort-11 Experimental,” Chem. Eng. Sci., 32,747 (1977).
King, C. J., Separation Processes, 2nd ed., McCraw-Hill, New York (1980).
Krishna, R., H. F. Martinez, R. Sreedhar, and G. L. Standart, “Murphree Point Efficiencies in Multicomponent Systems”, Trans. Inst. Chem. Engrs., 55, 178 (1977).
Krishna, R., and 6. L. Standart, “Mass and Energy Transfer in Multi- component Systems,” Chem. Eng. Commun., 3,201 (1979).
Lucia, A,, and S. Macchietto, “A New Approach to the Approximation of Quantities Involving Physical Properties Derivatives in Equation Ori- ented Process Design,” AZChE J . , 29.705 (1983).
Lucia, A,, and K. R. Westmau, “Low Cost Solutions to Multistage, Multi- component Separations Problems by a Hybrid Fixed Point Algorithm,” Foundations of Computer-aided Process Design, 2nd International Conference, Snowmass, CO (1983).
Medina, A. G., N. Ashton, and C. McDermott, “Murphree and Vaporization Efficiencies in Multicomponent Distillation,” Chem. Eng. Sci., 33,331 (1978).
Medina, A. G., N. Ashton, and C. McDermott, “Hausen and Murphree Efficiencies in Binary and Multicomponent Distillation,” Chem. Eng. Sci., 34,1105 (1979).
Murphree, E. V., “Rectifying Column Calculations,” Ind. Eng. Chem., 17,747 (1925).
Naphtali, L. M., and D. P. Sandholm, “Multicomponent Separation Cal- culations by Linearization,” AlChE J . , 17,148 (1971).
Schlunder, E. V., ed. Heat-Exchanger Design Handbook, Hemisphere Publishing Corp., Washington, D.C. (1983).
Schubert, L. K., “Modification of a Quasi-Newton Method for Nonlinear Equations with a Sparse Jacobian,” Math. Comp., 24,27 (1970).
Sherwood, T. K., R. L. Pigford, and C. R. Wilke, Mass Transfer, McGraw-Hill, New York (1975).
Standart, G. L., “Studies on Distillation-V. Generalized Definition of a Theoretical Plate or Stage of Contacting Equipment,” Chem. Eng. Sci., 20,611 (1965).
Standart, G. L., “Comparison of Murphree-type Efficiencies with Vapor- ization Efficiencies,” Chem. Eng. Sci., 26,985 (1971).
Toor, H. L., “Diffusion in Three-Component Gas Mixtures,” AlChE J . , 3, 198 (1957).
Toor, H. L., “Prediction of Efficiencies and Mass Transfer on a Stage with Multicomponent Systems,” AIChE J., 10,545 (1964).
Toor, H. L., and J. K. Burchard, “Plate Efficiencies in Multicomponent Distillation,” AZChE J., 6,202 (1960).
Vogelpohl, A,, “Murphree Efficiencies in Multicomponent Systems,” Int Chem. Eng. Symp. Ser. No. 56,2,25 (1979).
Waggoner, R. C., and L. E. Burkhart, “Non-equilibrium Computation for Multistage Extractors,” Comput. Chem. Eng., 2,169 (1978).
Waggoner, R. C., and G. D. Loud, “Algorithms for the Solution of Material Balance Equations for Non-Conventional Multistage Operations,” Comput. Chem. Eng., 1,49 (1977).
Zuiderweg, F. J., “Sieve Trays-A View of the State of the Art,” Chem. Eng. Sci., 37,1441 (1982).
Supplementary material has &n deposited as Document No. 04262 with the National Auxiliary Publications Service (NAPS), c/o Microfiche Pub- lications, 4 North Pearl St., Portchester, NY 10573, and can be obtained for $4.00 for microfiche or $7.75 for photocopies.
Manusmipt received July 29,1983; reoisim received Dec. 6, and accepted January 28,1984.
A Nonequilibrium Stage Model of Multicomponent Separation Processes
Part II: Comparison with Experiment A nonequilibrium stage model of countercurrent separation processes is used
LO predict composition and temperature profiles during binary and multicomponent distillation in wetted-wall and bubble-cap-tray columns. The profiles predicted by the model are compared with experimental data for the binary systems ben- zene-toluene, ethanol-water, and acetone-chloroform and for the ternary systems benzene-toluene-ethylbenzene, acetone-methanol-water, methanol-isopropanol- water, acetone-methanolethanol, and benzene-toluene-m-xylene. The model does a very commendable job of predicting the composition profiles measured for these systems; average absolute differences between predicted and measured mole fractions are seldom greater than 4 mole percent and are often very much less.
R. KRISHNAMURTHY and
R. TAYLOR Department of Chemical Engineering
Clarkson University Potsdam, NY 13676
SCOPE
In Part I of this series, a nonequilibrium stage model of countercurrent multicomponent separation processes was de- scribed. The motivation for developing the model was the ob-
servation that the equilibrium stage model modified by the in- clusion of a stage efficiency that has the same value for all components (the model presently used to simulate separation processes) is unable to predict accurately the composition pro- files in processes separating multicomponent mixtures in which -___
R. Krishnamurthy is presently with The BOC Group, Murray Hill, NJ 07974.
Page 456 March, 1985 AlChE Journal (Vol. 31, No. 3)
the various species exhibit differing facilities for mass transfer. The model was formulated in a way that exploits much of the existing literature on multicomponent separation processes. For example, the nonequilibrium stage model consists of a set of nonlinear algebraic equations with a large sparse Jacobian matrix (as does the equilibrium stage model). Thus, Newton's method (or one of its relatives) may be used to solve the non- equilibrium stage model equations-just as these methods presently are used to solve the equilibrium stage model equa- tions. Also, as we show in this second episode, the large body of data obtained for the purpose of calculating and correlating stage efficiencies can be effectively used if, instead, the data are used to calculate or correlate binary mass transfer coeffi- cients.
The development of a new model of a process should, at some
stage, be followed by a comparison of its predictions with the results of experiments and with the predictions of rival models. Such a comparison helps to determine if the model is a good one. It is our objective here to compare the predictions of the non- equilibrium stage model with the experimental data of John- stone and Pigford (1942) (distillation of the benzene-toluene, ethanol-water, and acetonechloroform binaries in a wetted-wall column), Dribika and Sandall (1979) (distillation of the ternary system benzeneethylbenzene-toluene in a wetted-wall column), Vogelpohl(l979) (distillation of acetone, methanol, and water and of methanol, isopropanol, and water in a bubble-cap-tray column), Free and Hutchison (1960) (distillation of acetone, methanol, and ethanol in a bubble-cap-tray column), and Nord (1946)(distillation of benzene, toluene, and rn-xylene in a bub- ble-cap-tray column).
CONCLUSIONS AND SIGNIFICANCE
The nonequilibrium stage model described in Part I suc- cessfully predicts the composition (and, in the one case for which data are available, temperature) profiles that were observed in a number of experiments involving vapor phase-controlled distillation of thermodynamically ideal and nonideal systems and diffusionally interacting and noninteracting systems in wetted-wall and tray columns. Average absolute deviations between experimental and prediced mole fractions are seldom greater than 4 mol % and are often very much less. The agree-
THE EXPERIMENTS
The experimental data used to evaluate the nonequilibrium stage model described in Part I have been reported by Johnstone and Pigford (1942), Dribika and Sandall (1979), Vogelpohl(1979), Free and Hutchison (1960), and Nord (1946). Details of the systems and equipment employed in their experiments are summarized below and in Table 1. The work of these investigators was selected for several reasons, the most important being the availability of enough published data, first, to permit a realistic attempt at simulating the experiments, and, second, to allow a comparison between the predictions of the model and the results of the experiments. It is worth noting that a good number of papers and theses in this field do not present enough information for us even to attempt a simu- lation. Other factors considered include the availability of physical
ment between model prediction and experimental observation is particularly good for the simulations of the wetted-wall col- umn experiments and very satisfactory for the tray-column calculations. Actually, we were a little surprised at just how closely the predicted profiles followed the observed profiles. The accuracy of the correlations/expressions used to calculate the mass transfer coefficients seems to be the factor that limits the accuracy of the model predictions, at least for the small-scale systems tested here.
property data for the systems and the suitability of the UNIQUAC model for calculating K values and enthalpies.
Common Aspects
All of the experimental studies cited above involve distillation at total reflux (the advantages of this situation are obvious and noted in Part I). Other features common to all these studies include the use of a total condenser and provision to ensure a saturated reflux. In the experiments the steady state total reflux condition was at- tained by starting the column as though it were a batch still and then manipulating the heat loads at the condenser and reboiler in order to obtain the desired flow rate. In each study, either the vapor velocity or the F factor (the product of the volumetric gas flow rate per unit bubbling area and the square root of the gas density) was
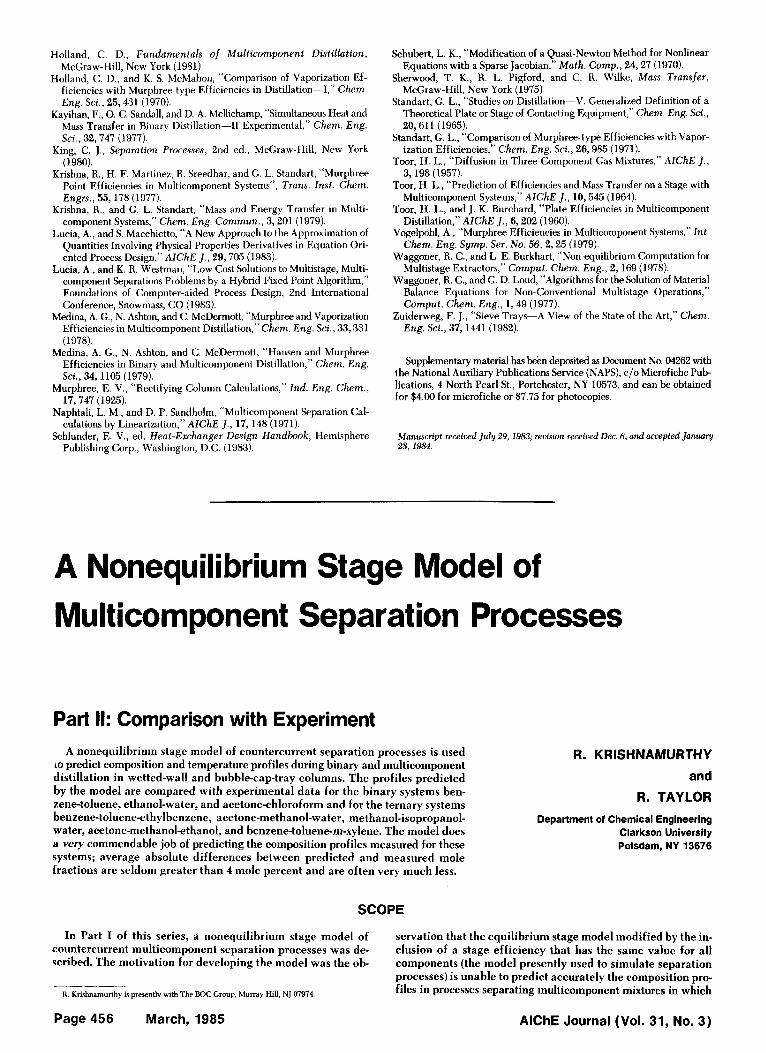
TABLE 1. DETAILS OF EXPERIMENTAL SYSTEMS AND EQUIPMENT
No. of Exit Average Stages/ Column Bubbling Weir Column Correlation for Binary
Column Column Diameter Area Height Width Mass Transfer System Reference Type Length (m) (m2) (m) (m) Coeff icicnts
Benzene-toluene Johnstone & Wetted 1.83 m 0.0297 - - - Gilliland Sherwood Ethanol-water Pigford (1942) wall Acetone-chloroform Benzene-toluene- Dribika & Wetted 1.0 m 0.0220 - - - Gilliland-Sherwood
Acetone-methanol- Vogelpohl(l979) Bubble 38* 0.3000 0.06008 0.030 0.2400 AIChE method
Methanol-isopropanol-water Acetone-methanol- Free & Hutchison Bubble 7 0.1016 0.00689 0.015 0.0813 AIChE method
Benzene- toluene- Nord (1946) Bubble 10 0.1524 0.01459 0.015 0.1300 AIChE method/binary
ethylbenzene Sandall (1979) wall
water cap
ethanol (1960) cap
rn-xylene cap efficiencies
' Only up to 13 were active.
AlChE Journal (Vol. 31, No. 3) March, 1985 Page 457
maintained at roughly the same value in all experiments. All of the investigators whose work we are using concluded that the resistance to mass transfer in the liquid phase was quite negligible.
Distillation In a Wetled-Wall Column
Johnstone and Pigford (1942) conducted experiments in a wet- ted-wall column of dia. 0.0297 m and length 1.83 m. Benzene- toluene, ethanol-water, and acetone-chloroform were the binary systems distilled in their column. The compositions at the top and bottom of the wetted-wall column and average flow rates were reported for several experiments involving all three of the binary systems mentioned above.
Ternary distillation of the mixture benzene-toluene-ethylben- zene has been carried out by Dribika and Sandal1 (1979) in 1.0 m long column of internal diameter 0.022 m. Samples of the liquid phase were taken at six locations along the column and the mea- sured composition and temperature profiles reported for ten ex- perimental runs (Dribika, 1977). Dribika and Sandall claim rea- sonable agreement between their measurements and a theoretical model that included the use of the method of Krishna and Standart (1976) (based on the Maxwell-Stefan equations, which describe diffusion in multicomponent systems) to calculate the mass transfer rates.
Ternary Distillation in fray Columns
Vogelpohl (1979) has reported some results for the distillation of two ternary systems acetone, methanol, and water and methanol, isopropanol, and water) in a 38-tray bubble-cap column of 0.3 m dia. and 0.2 m between trays. Due to the ease of separating these particular systems, only up to 13 trays were active for the experi- mental runs for which composition profiles and F factor are re- ported. The experiments clearly show that the component Mur- phree efficiencies are unequal; indeed, in the acetone-methanol- water system the composition of methanol passes through a max- imum in the column and the efficiency for this Component becomes unbounded. Vogelpohl also shows that the assumption of equal component efficiencies gives rise to large differences between the predicted and measured composition profiles. A theoretical model based on the use of the Maxwell-Stefan equations was in much better agreement with the measurements. It is worth noting that the model used by Vogelpohl applies only to a column operating at total reflux. The model we described earlier is not limited to this condition.
Ternary distillation experiments using acetone, methanol, and ethanol were performed by Free and Hutchison (1960) in a seven-hubble-cap-tray column, 0.1016 m in diameter. They also find that equal Murphree efficiencies cannot explain the behavior of their system. Twelve runs were conducted covering different regions of the ternary composition triangle.
A paper by Nord (1946) was one of the earliest, if not the very first, to provide experimental evidence that the individual com- ponent efficiencies can be different. The experiments, with the system benzene, toluene, and m-xylene were carried out in a ten- bubble-captray column, 0.1524 m in diameter. The vapor velocity was maintained at 0.4572 mas-' (1.5 ft-s-') in all of the runs. Analysis of the samples was by the relatively crude and inaccurate ASTM method (see Nord's paper for complete details).
THE SIMULATIONS
We have tried to predict the measured composition profiles using a model composed of a sequence of n-2 nonequilibrium stages together with a total condenser (numbered as stage 1) and a reboiler (numbered as stage n). The experiments in the wetted-wall column were simulated by dividing the column into ten sections, each of which was treated as though it were a nonequilibrium stage. For the special case of vapor phasecontrolled distillation at total reflux, the nonequilibrium stages are modeled by just 3c + 2 equations,
as shown in Part I. For the condenser, only the component liquid flow rates and the temperature of the reflux are included in the list of variables. The equations corresponding to this set are
(1) vi2 - lil = 0 i = 1,2. . . c
and
where Tbub is the bubble point temperature of a liquid with com- position l , l /L l . Equation 2 follows from the fact that the vapor condensed in stage 1 is returned to the column as saturated re- flux.
The lack of any feed to the experimental columns means that we have to tear the flow streams at the reboiler end and specify the component vapor flow rates and the temperature of the vapor leaving the reboiler (or a stage above the reboiler). Thus the vari- ables for the last stage are the component vapor flow rates and the vapor temperature. The corresponding functions are
(3) v,, - vi, spc = 0 i = 1,2 . . . c
and
T: - T:,, = 0 (4)
The component vapor flows, nizr were calculated from the reported vapor velocities or F factors and the measured composi- tion at the reboiler outlet (not the composition of the batch feed to the reboiler). If the vapor temperature, T,VSw, was not measured, then we have assumed that the vapor is saturated and have replaced T,VSp, in Eq. 4 by Tdew. the dew p i n t temperature of a vapor with composition v,, /V,.
Including the c + 1 equations for each end stage, the total number of equations to be solved is (n - 2)(3c + 2) + 2(c + 1).
Mass Transfer Rate Equations
In our development of the nonequilibrium stage model, we used nonlinear equations of a fairly general form to represent the mass and energy transfer rates. The precise form that these nonlinear equations take depends on the model used to represent the vapor phase transport processes; we have used equations based on a film model of steady state one-dimensional diffusion.
Mass transfer in multicomponent gas-vapor mixtures is accu- rately described by the Maxwell-Stefan equations. Even for a film model of mass transfer, there are a number of methods of calcu- lating the fluxes that could be used. The methods fall into three categories:
1. Methods of the effective diffusivity type (which neglect in- teractions between the species) with the mass transfer rates given by
where ky,ff is an effective mass transfer coefficient, a function of an effective diffusivity and the mass transfer rates N,V (among other things). There are at least eight different ways of calculating the effective diffusivity. However, none of them can be relied upon to give good results when compared to the more rigorous methods we describe now (Smith and Taylor, 1983).
2. Methods that take interaction effects into account but that are implicit in the fluxes (or transfer rates). There are two methods in this category: that of Krishna and Standart (1979j based on an exact solution of the Maxwell-Stefan equations, and the solution of the linearized equations due to Toor (1964) and to Stewart and Prober (1964). Both methods lead to rate equations of the general form of Eq. 1.13, expressed here in matrix form as
where [kv] is a matrix of multicomponent diffusive mass transfer coefficients and is calculated from
(7)
Page 458 March, 1985 AlChE Journal (Vol. 31, No. 3)
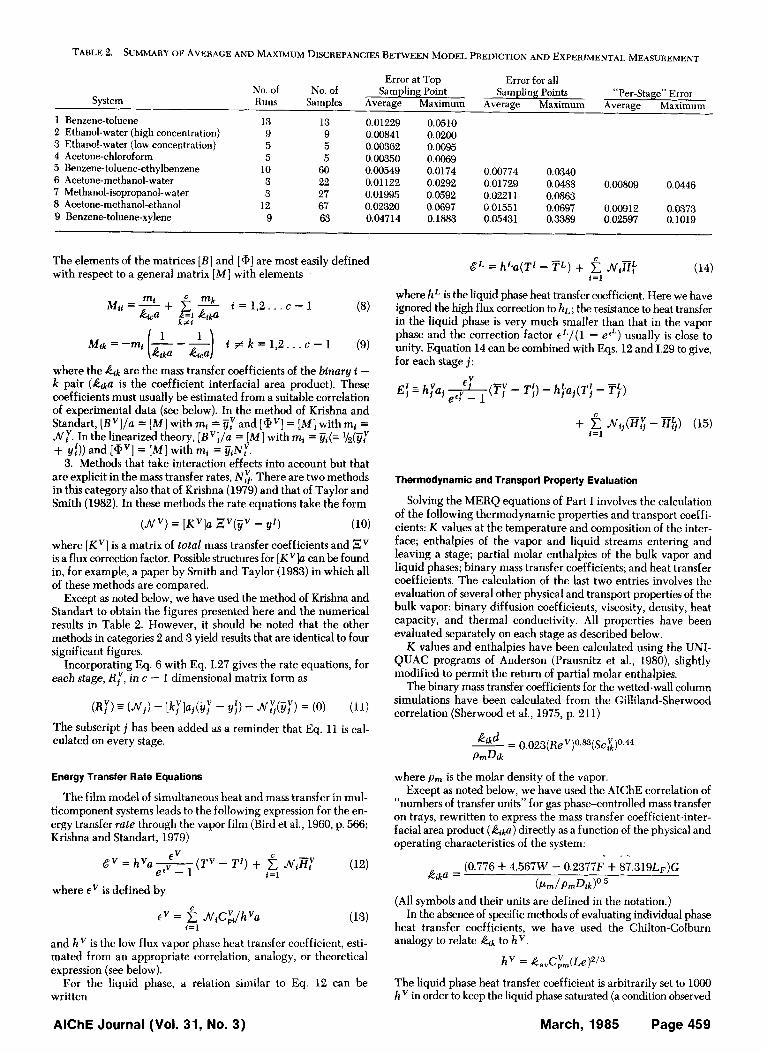
TABLE 2. SUMMARY OF AVERAGE AND MAXIMUM DISCREPANCIES BETWEEN MODEL PREDICTION AND EXPERIMENTAL MEASUREMENT
No. of No. of System Runs Samples
1 Benzene-toluene 13 13 2 Ethanol-water (high concentration) 9 9 3 Ethanol-water (low concentration) 5 5 4 Acetone-chloroform 5 5
6 Acetone-methanol-water 3 22
9 Benzene-toluene-xylene 9 63
5 Benzene-toluene-ethylbenzene 10 60
7 Methanol-isopropanol-water 3 27 8 Acetone-methanol-ethanol 12 67
Error at TOR Error for all Sampling Point Sampling Points “Per-Stage” Error
Average Maximum Average Maximum Average Maximum
0.01229 0.00841 0.00362 0.00350 0.00549 0.01122 0.01995 0.02320 0.04714
0.0510 0.0200 0.0095 0.0069 0.0174 0.00774 0.0340 0.0292 0.01729 0.0488 0.00809 0.0446 0.0592 0.02211 0.0863 0.0697 0.01551 0.0697 0.00912 0.0373 0.1883 0.05431 0.3389 0.02597 0.1019
The elements of the matrices [ B ] and [@a] are most easily defined with respect to a general matrix [MI with elements
where the &{k are the mass transfer coefficients of the binary i - k pair (&a is the coefficient interfacial area product). These coefficients must usually be estimated from a suitable correlation of experimental data (see below). In the method of Krishna and Standart, [ B V ] / a = [MI with m1 = $’ and [apv] = [MI with mi = N y . In the linearized theory, [BV]/a = [MI with mi = &(= ’/z(ijY + y:)) and [ a v ] = [MI with ml = ijiNy.
3. Methods that take interaction effects into account but that are explicit in the mass transfer rates, N;. There are two methods in this category also that of Krishna (1979) and that of Taylor and Smith (1982). In these methods the rate equations take the form
( N v ) = [ K V ] a zv(ijv - y’)
where [Kv] is a matrix of total mass transfer coefficients and Ev is a flux correction factor. Possible structures for [Kv]a can be found in, for example, a paper by Smith and Taylor (1983) in which all of these methods are compared.
Except as noted below, we have used the method of Krishna and Standart to obtain the figures presented here and the numerical results in Table 2. However, it should be noted that the other methods in categories 2 and 3 yield results that are identical to four significant figures.
Incorporating Eq. 6 with Eq. 1.27 gives the rate equations, for each stage, BY, in c - 1 dimensional matrix form as
(RY) ( N j ) - [kr]aj(i jY - y:) - NE(jj7) = (0) (11) The subscript j has been added as a reminder that Eq. 11 is cal- culated on every stage.
Energy Transfer Rate Equations
The film model of simultaneous heat and mass transfer in mul- ticomponent systems leads to the following expression for the en- ergy transfer rate through the vapor film (Bird et al., 1960, p. 566; Krishna and Standart, 1979)
where c is defined by
t V = 2 NiC,”,/hva (13) 1=1
and h V is the low flux vapor phase heat transfer coefficient, esti- mated from an appropriate correlation, analogy, or theoretical expression (see below).
For the liquid phase, a relation similar to Eq. 12 can be written
~ 5 ‘ ~ = hLa(Tr - T L ) + 5 Nr?if (14)
where hL is the liquid phase heat transfer coefficient. Here we have ignored the high flux correction to h ~ ; the resistance to heat transfer in the liquid phase is very much smaller than that in the vapor phase and the correction factor e L / ( l - eEL) usually is close to unity. Equation 14 can be combined with Eqs. 12 and 1.29 to give, for each stage j:
i=1
Thermodynamic and Transport Property Evaluation
Solving the MERQ equations of Part I involves the calculation of the following thermodynamic properties and transport coeffi- cients: K values a t the temperature and composition of the inter- face; enthalpies of the vapor and liquid streams entering and leaving a stage; partial molar enthalpies of the bulk vapor and liquid phases; binary mass transfer coefficients; and heat transfer coefficients. The calculation of the last two entries involves the evaluation of several other physical and transport properties of the bulk vapor: binary diffusion coefficients, viscosity, density, heat capacity, and thermal conductivity. All properties have been evaluated separately on each stage as described below.
K values and enthalpies have been calculated using the UNI- QUAC programs of Anderson (Prausnitz et al., 1980), slightly modified to permit the return of partial molar enthalpies.
The binary mass transfer coefficients for the wetted-wall column simulations have been calculated from the Gilliland-Sherwood correlation (Sherwood et al., 1975, p. 211)
-- ‘lkd - 0.023(ReV)o.s3(S~~)o.44 PmDik
where pm is the molar density of the vapor. Except as noted below, we have used the AIChE correlation of
“numbers of transfer units” for gas phase-controlled mass transfer on trays, rewritten to express the mass transfer coefficient-inter- facial area product (&a) directly as a function of the physical and operating characteristics of the system: - . I._
(0.776 + 4.567W - 0.2377F + 87.319L~)G &ka =
(Pm/PmDik (All symbols and their units are defined in the notation.)
In the absence of specific methods of evaluating individual phase heat transfer coefficients, we have used the Chilton-Colburn analogy to relate k,k to h v.
The liquid phase heat transfer coefficient is arbitrarily set to loo0 h in order to keep the liquid phase saturated (a condition observed
AlChE Journal (Vol. 31, No. 3) March, 1985 Page 459
1.0 I
/ 0 . B
0 . 6
0 . 4
0 . 2
p" 0 Benzene-Toluene
-
A Ethanol- Water
0 Acetone- Chloroform
I I I I I I I
0 . 2 0 . 4 0 . 6 O . a I . 0
0 . 0
0 . 8
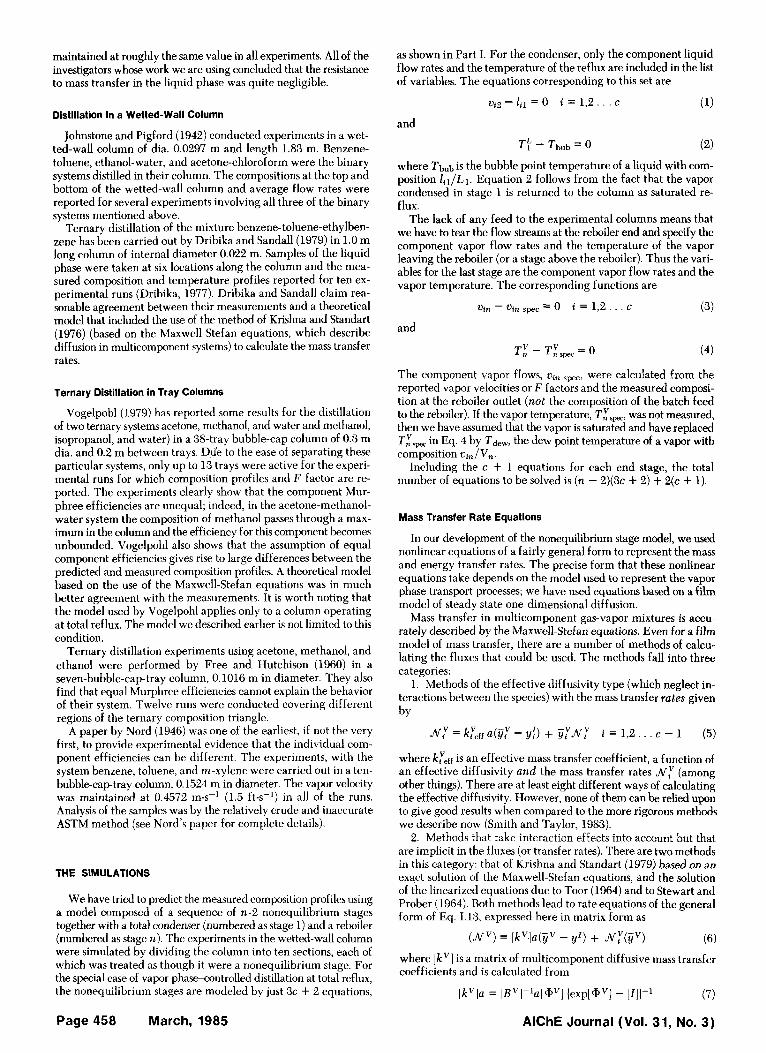
Experimental Mole fraction Figure 1. Comparison of experimental and predicted mole fractions for the binary systems benzene-toluene, ethanol-water, and acetone-chloroform.
in all of the experiments). We shall see below, however, that the composition profiles predicted by the model are virtually inde- pendent of the numerical value of the heat transfer coefficients.
Pure component viscosities and binary diffusion coefficients at a reference temperature of 298 K were obtained from the literature (from the source of the experimental data whenever possible) and corrected to the temperature of the stages using the rules recom- mended by Reid et al. (1977). Other physical properties like den- sity, component specific heats, and thermal conductivities were evaluated using the methods suggested by those who carried out the distillation experiments (Dribika and Sandall are particularly helpful here), or, if nothing was stated, using predictive methods recommended by Reid et al. Properties of mixtures were calculated using the mixing rules suggested by Reid et al.
RESULTS
Distillation in a Wetted-Wall Column
In our simulations of Johnstone and Pigfords experiments, the composition measured at the base of the column was used to de-
/ I 0
c /
0 Benzene
A Toluene
0 Ethylbenzene
8 0 0 2 0 4 8 6 0 8 1 0
Experimental Mole fraction Figure 2. Comparison of experimental and predicted mole fractions for the
benzene-toluene-ethylbenzene system.
( 1 ) Benzene Rn -Run number n
(21 Toluene -
, I 8
0 za 48 60 88 I00
Location Height ( from reboiler end)
Figure 3. Comparison of expertmental and predicted composltion profiles for the benzene-toluene-ethylbenzene system. - experimental profile, - - -
predicted profile.
termine ui,, and the composition at the top of the column was predicted from the model (composition profiles were not measured in these experiments). A comparison of the predicted mole fraction of the more volatile component with the measured mole fraction is shown in Figure 1. The discrepancies between prediction and experiment are extremely small with an average absolute deviation of much less than 1 mol % in most cases (Table 2).
Quite frankly, if agreement of the kind shown in Figure 1 had not been obtained, we would probably have abandoned this project long ago. A much better test of the model is provided by a com- parison of its predictions with measured profiles in multicompo- nent systems. Figures 2 and 3 present such a comparison. In these figures, the data obtained by Dribika and Sandall (1979) are compared with the mole fractions predicted by our model. All details of the simulations that produced these figures are described above. It should be noted again that samples were taken at several locations along the column. This is evident in Figure 3, where composition profiles for three out of ten runs are shown. It is clear from both illustrations that there is excellent agreement between measurement and prediction; average and maximum errors are
0 Acetonn
* Methanol
I A. 0 Water
0 0
0 0 0 . 2 0 4 0 . 6 0 8 I 0
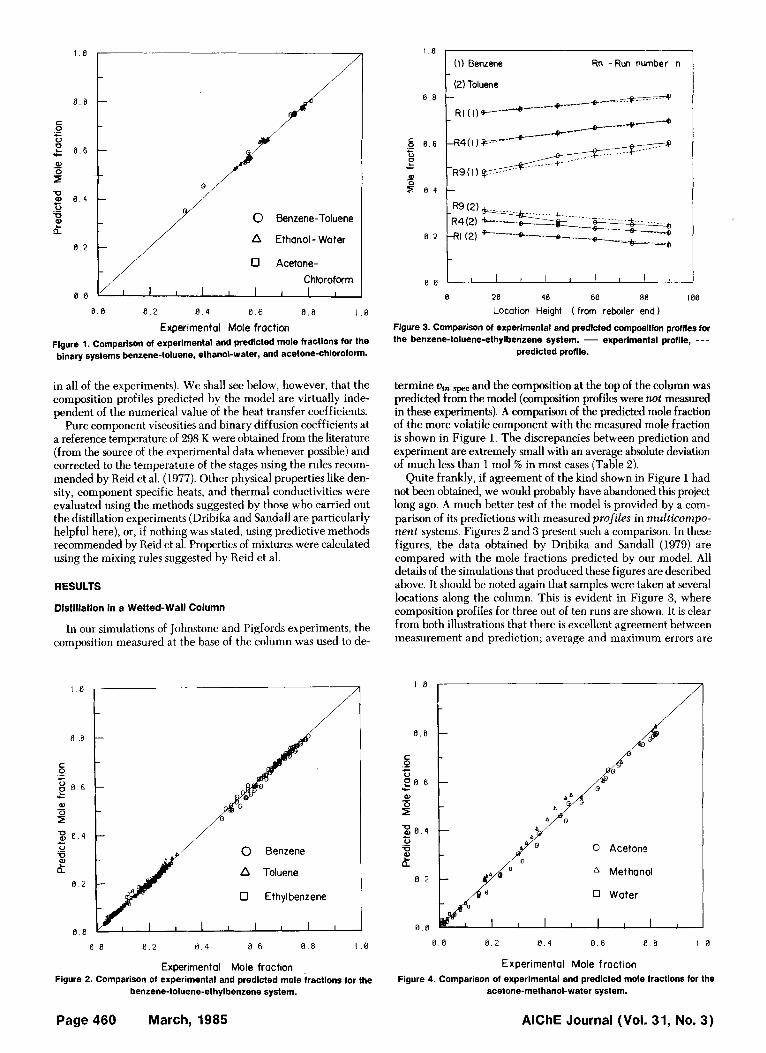
Experimental Mole fraction Figure 4. Comparison of experimental and predicted mole fractions for the
acetone-methanol-water system.
Page 460 March, 1985 AlChE Journal (Vol. 31, No. 3)
1.0 , I Rn- Run number n ( 1 ) Acetone 1 R3(1) (2) Methanol I
0 2
0 0
0 2 4 6 8 I0
Stage Number
Flgure 5. Comparison of experimental and predlcted composltlon profiles for the acetone-methand-water system. - experimental profile, - - - predicted
profile.
very low (Table 2 again). Note that data from all ten runs are contained in Figure 2 and that run 9 (Figure 3) shows the largest discrepancy that we encountered in these simulations. Dribika (1977) also reports temperature profiles; we found that the model predicted temperatures that differed from the experimental ones by around 1.5 K. When the simulations were repeated using 20 nonequilibrium sections, no real improvement (or worsening) in the accuracy of the prediction was obtained; ten sections seemed to be enough.
Distillation in Tray Columns
Predicted and measured composition profiles for the systems acetone-methanol-water and methanol-isopropanol-water (Vog- elpohl, 1979) are compared in Figures 4 to 7. Although the agree- ment is not as good as was found for the wetted-wall column sim- ulations, the discrepancy between predicted and measured values is still quite small; the average error for the acetone-methanol-water system is 1.122 mole percent and the maximum error is 2.92 mole percent (Table 2). These errors are well within acceptable limits.
/ I . 0
0 . 8
c 0 g 0 . 6 L
L .c
W - I D 0 . 4
u E
W t
0
0 .2
0 . 0
c o/
0 Methonol
A lsopropanol
0 Water
0
I I 1 I I I
a . 0 0.2 0 . 4 0.6 0 . 8 I . 0
Experimental Mole fraction
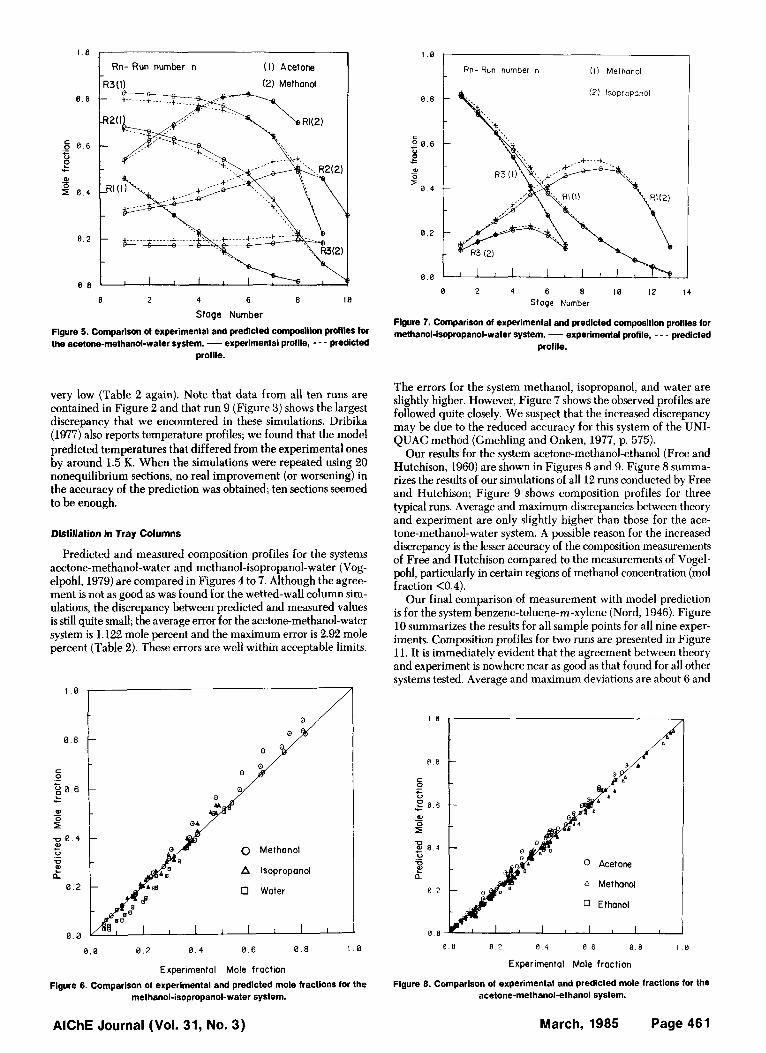
Figure 6. Comparison of experimental and predicted mole fractions for the methanol-isopropanol-water system.
I .0
Rn- Run number n ( I ) Methanol
0 2 4 6 8 i a 12 14 Stage Number
Flgure 7. Comparison of experimental and predicted composition proflles for methanol-isopropanol-water system. - experimental profile, - - - predicted
profile.
The errors for the system methanol, isopropanol, and water are slightly higher. However, Figure 7 shows the observed profiles are followed quite closely. We suspect that the increased discrepancy may be due to the reduced accuracy for this system of the UNI- QUAC method (Gmehling and Onken, 1977, p. 575).
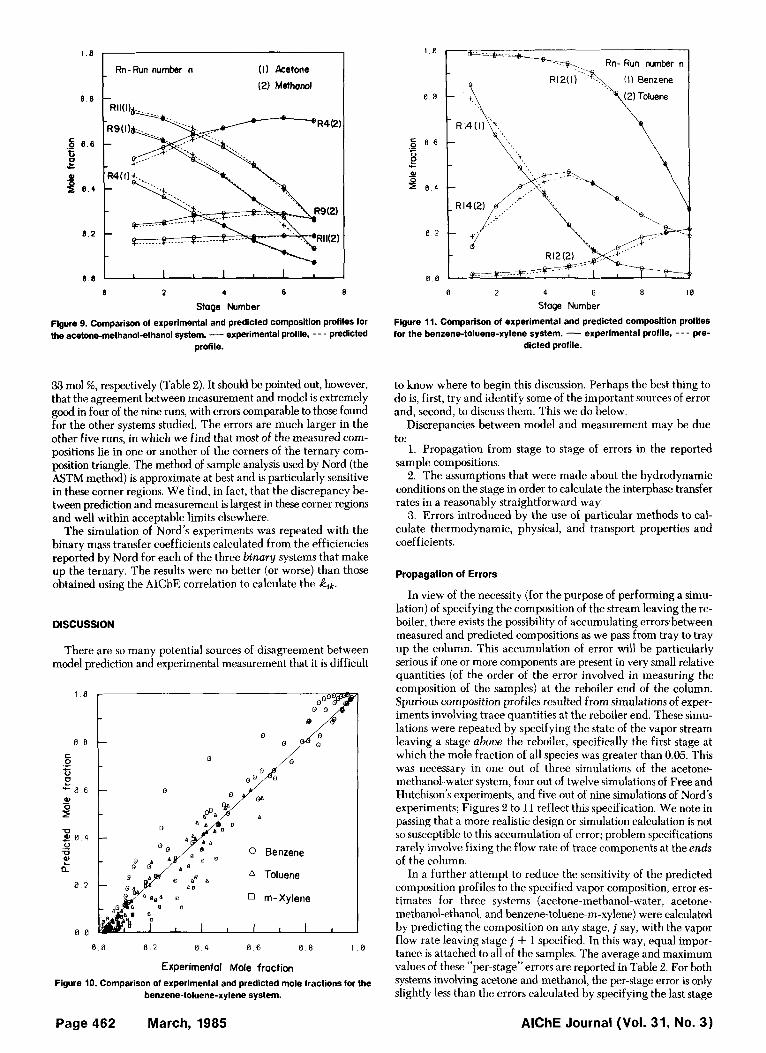
Our results for the system acetone-methanol-ethanol (Free and Hutchison, 1960) are shown in Figures 8 and 9. Figure 8 summa- rizes the results of our simulations of all 12 runs conducted by Free and Hutchison; Figure 9 shows composition profiles for three typical runs. Average and maximum discrepancies between theory and experiment are only slightly higher than those for the ace- tone-methanol-water system. A possible reason for the increased discrepancy is the lesser accuracy of the composition measurements of Free and Hutchison compared to the measurements of Vogel- pohl, particularly in certain regions of methanol concentration (mol fraction <0.4).
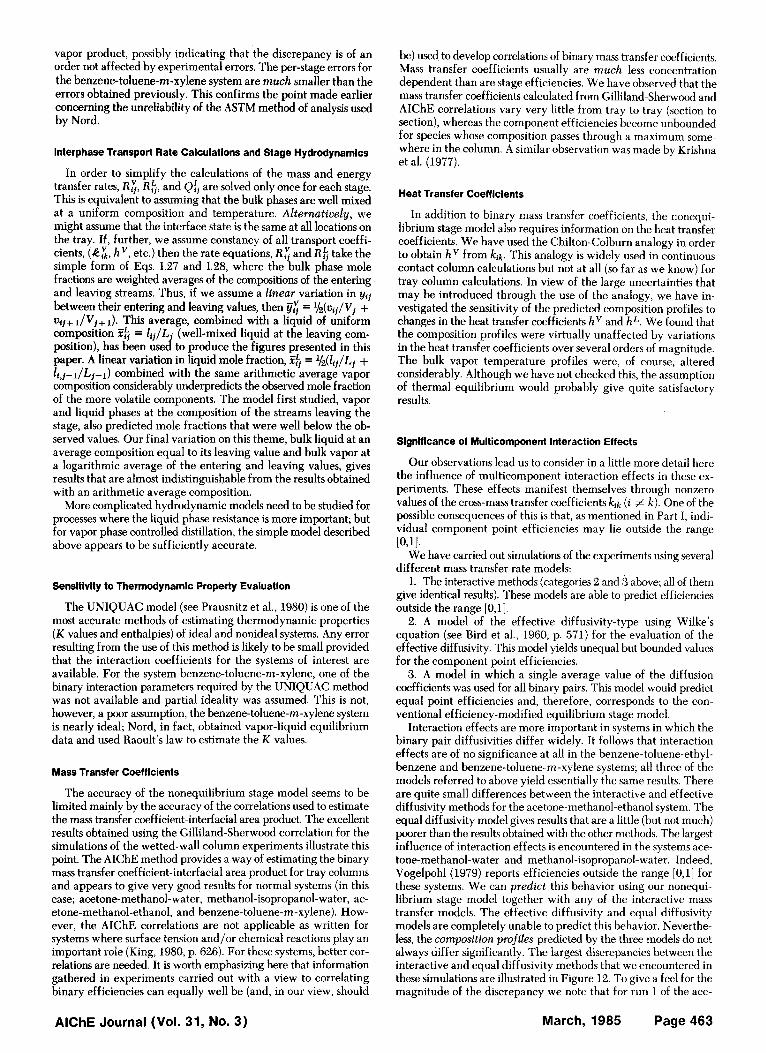
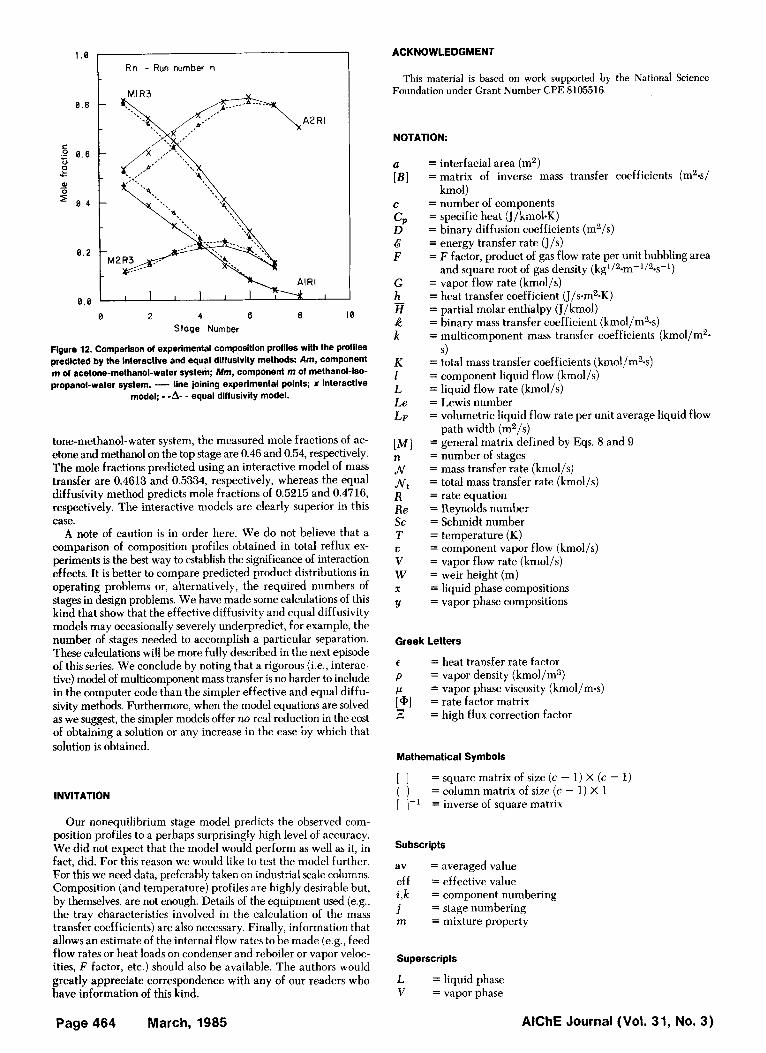
Our final comparison of measurement with model prediction is for the system benzene-toluene-rn-xylene (Nord, 1946). Figure 10 summarizes the results for all sample points for all nine exper- iments. Composition profiles for two runs are presented in Figure 11. It is immediately evident that the agreement between theory and experiment is nowhere near as good as that found for all other systems tested. Average and maximum deviations are about 6 and
I t ?
0 8
._ s
P p 0 4
F
c 0
.c e 8 6
-
0 ._
a 8 2
P
a Methanol
0 Ethanol
0 0 0 2 0 4 8 6 0 8 I 8
Experimental Mole fraction
Flgure 0. Comparison of experimental and predicted mole fractions for the acetone-methanoi-ethanol system.
AlChE Journal (Vol. 31, No. 3) March, 1985 Page 461
Rn-Run number n (I1 Acetone
(2) Methanol
.- 5 0 6
t B
4 0 . 4
0 2
0 .8 1 I 1 I 1 I I
6 2 4 6 8
Stage Number
Figure 9. Comparison of experimental and predicted composition profiles for the acetone-methanol-ethanol system. - experimental profile, - - - predicted
profile.
1 8
0 8
0 6 - c 0 e L
0)
P 8 4
0 2
0 8
0 2 4 6 8 18
Stage Number
Figure 11. Comparison of experimental and predicted composition profiles for the benzene-toluene-xylene system. - experimental profile, - - - pre-
dicted profile.
33 mol %, respectively (Table 2). It should be pointed out, however, that the agreement between measurement and model is extremely good in four of the nine runs, with errors comparable to those found for the other systems studied. The errors are much larger in the other five runs, in which we find that most of the measured com- positions lie in one or another of the corners of the ternary com- position triangle. The method of sample analysis used by Nord (the ASTM method) is approximate at best and is particularly sensitive in these corner regions. We find, in fact, that the discrepancy be- tween prediction and measurement is largest in these corner regions and well within acceptable limits elsewhere.
The simulation of Nord’s experiments was repeated with the binary mass transfer coefficients calculated from the efficiencies reported by Nord for each of the three binary systems that make up the ternary. The results were no better (or worse) than those obtained using the AIChE correlation to calculate the &.
DISCUSSION
There are so many potential sources of disagreement between model prediction and experimental measurement that it is difficult
D A, I
0 8 a 2 a 4 8 6 0 8 I 0
Experimental Mole fraction Figure 10. Comparison of experimental and predicted mole fractions for the
benzene-toluene-xylene system.
to know where to begin this discussion. Perhaps the best thing to do is, first, try and identify some of the important sources of error and, second, to discuss them. This we do below.
Discrepancies between model and measurement may be due
1. Propagation from stage to stage of errors in the reported sample compositions.
2. The assumptions that were made about the hydrodynamic conditions on the stage in order to calculate the interphase transfer rates in a reasonably straightforward way.
3. Errors introduced by the use of particular methods to cal- culate thermodynamic, physical, and transport properties and coefficients.
to:
Propagation of Errors
In view of the necessity (for the purpose of performing a simu- lation) of specifying the composition of the stream leaving the re- boiler, there exists the possibility of accumulating errors between measured and predicted compositions as we pass from tray to tray up the column. This accumulation of error will be particularly serious if one or more components are present in very small relative quantities (of the order of the error involved in measuring the composition of the samples) at the reboiler end of the column. Spurious composition profiles resulted from simulations of exper- iments involving trace quantities at the reboiler end. These simu- lations were repeated by specifying the state of the vapor stream leaving a stage above the reboiler, specifically the first stage at which the mole fraction of all species was greater than 0.05. This was necessary in one out of three simulations of the acetone- methanol-water system, four out of twelve simulations of Free and Hutchison’s experiments, and five out of nine simulations of Nord’s experiments; Figures 2 to 11 reflect this specification. We note in passing that a more realistic design or simulation calculation is not so susceptible to this accumulation of error; problem specifications rarely involve fixing the flow rate of trace components at the ends of the column.
In a further attempt to reduce the sensitivity of the predicted composition profiles to the specified vapor composition, error es- timates for three systems (acetone-methanol-water, acetone- methanol-ethanol, and benzene-toluene-m-xylene) were calculated by predicting the composition on any stage, j say, with the vapor flow rate leaving stage j + 1 specified. In this way, equal impor- tance is attached to all of the samples. The average and maximum values of these “per-stage” errors are reported in Table 2. For both systems involving acetone and methanol, the per-stage error is only slightly less than the errors calculated by specifying the last stage
AlChE Journal (Vol. 31, No. 3) Page 462 March, 1985
vapor product, possibly indicating that the discrepancy is of an order not affected by experimental errors. The per-stage errors for the benzene-toluene-rn-xylene system are much smaller than the errors obtained previously. This confirms the point made earlier concerning the unreliability of the ASTM method of analysis used by Nord.
lnterphase Transport Rate Calculatlons and Stage Hydrodynamics
In order to simplify the calculations of the mass and energy transfer rates, R;, R$ , and are solved only once for each stage. This is equivalent to assuming that the bulk phases are well mixed at a uniform composition and temperature. Alternatiuehj, we might assume that the interface state is the same at all locations on the tray. If, further, we assume constancy of all transport coeffi- cients, ( E x , hV, etc.) then the rate equations, R: and R$ take the simple form of Eqs. 1.27 and 1.28, where the bulk phase mole fractions are weighted averages of the compositions of the entering and leaving streams. Thus, if we assume a linear variation in yif between their entering and leaving values, then i$ = 3/2(ut~/Vf + ujj+ JV*+ 1). This average, combined with a liquid of uniform composition ??$ = l f j /L (well-mixed liquid at the leaving com- position), has been used to produce the figures presented in this paper. A linear variation in liquid mole fraction, ?$ = l/2(Zij/Lj + l i , j - l /Lj- l ) combined with the same arithmetic average vapor composition considerably underpredicts the observed mole fraction of the more volatile components. The model first studied, vapor and liquid phases at the composition of the streams leaving the stage, also predicted mole fractions that were well below the ob- served values, Our final variation on this theme, bulk liquid at an average composition equal to its leaving value and bulk vapor at a logarithmic average of the entering and leaving values, gives results that are almost indistinguishable from the results obtained with an arithmetic average composition.
More complicated hydrodynamic models need to be studied for processes where the liquid phase resistance is more important; but for vapor phase controlled distillation, the simple model described above appears to be sufficiently accurate.
Sensitivity to Thermodynamic Property Evaluation
The UNIQUAC model (see Prausnitz et al., 1980) is one of the most accurate methods of estimating thermodynamic properties ( K values and enthalpies) of ideal and nonideal systems. Any error resulting from the use of this method is likely to be small provided that the interaction coefficients for the systems of interest are available. For the system benzene-toluene-m-xylene, one of the binary interaction parameters required by the UNIQUAC method was not available and partial ideality was assumed. This is not, however, a poor assumption, the benzene-toluene-rn-xylene system is nearly ideal; Nord, in fact, obtained vapor-liquid equilibrium data and used Raoult's law to estimate the K values.
Mass Transfer Coefficients
The accuracy of the nonequilibrium stage model seems to be limited mainly by the accuracy of the correlations used to estimate the m a s transfer coefficient-interfacial area product. The excellent results obtained using the Gilliland-Sherwood correlation for the simulations of the wetted-wall column experiments illustrate this point. The AIChE method provides a way of estimating the binary mass transfer coefficient-interfacial area product for tray columns and appears to give very good results for normal systems (in this case; acetone-methanol-water, methanol-isopropanol-water, ac- etone-methanol-ethanol, and benzene-toluene-rn-xylene). How- ever, the AIChE correlations are not applicable as written for systems where surface tension and/or chemical reactions play an important role (King, 1980, p. 626). For these systems, better cor- relations are needed. It is worth emphasizing here that information gathered in experiments carried out with a view to correlating binary efficiencies can equally well be (and, in our view, should
be) used to develop correlations of binary mass transfer coefficients. Mass transfer coefficients usually are much less concentration dependent than are stage efficiencies. We have observed that the mass transfer coefficients calculated from Gilliland-Sherwood and AIChE correlations vary very little from tray to tray (section to section), whereas the component efficiencies become unbounded for species whose composition passes through a maximum some- where in the column. A similar observation was made by Krishna et al. (1977).
Heat Transfer Coefficients
In addition to binary mass transfer coefficients, the nonequi- librium stage model also requires information on the heat transfer coefficients. We have used the Chilton-Colburn analogy in order to obtain h V from k ik . This analogy is widely used in continuous contact column calculations but not at all (so far as we know) for tray column calculations. In view of the large uncertainties that may be introduced through the use of the analogy, we have in- vestigated the sensitivity of the predicted composition profiles to changes in the heat transfer coefficients h" and hL. We found that the composition profiles were virtually unaffected by variations in the heat transfer coefficients over several orders of magnitude. The bulk vapor temperature profiles were, of course, altered considerably. Although we have not checked this, the assumption of thermal equilibrium would probably give quite satisfactory results.
Significance of Multicomponent Interaction Effects
Our observations lead us to consider in a little more detail here the influence of multicomponent interaction effects in these ex- periments. These effects manifest themselves through nonzero values of the cross-mass transfer coefficients kik (i # k). One of the possible consequences of this is that, as mentioned in Part I, indi- vidual component point efficiencies may lie outside the range I O J I .
We have carried out simulations of the experiments using several different mass transfer rate models:
1. The interactive methods (categories 2 and 3 above; all of them give identical results). These models are able to predict efficiencies outside the range [0,1].
2. A model of the effective diffusivity-type using Wilke's equation (see Bird et al., 1960, p. 571) for the evaluation of the effective diffusivity. This model yields unequal but bounded values for the component point efficiencies.
3. A model in which a single average value of the diffusion coefficients was used for all binary pairs. This model would predict equal point efficiencies and, therefore, corresponds to the con- ventional efficiency-modified equilibrium stage model.
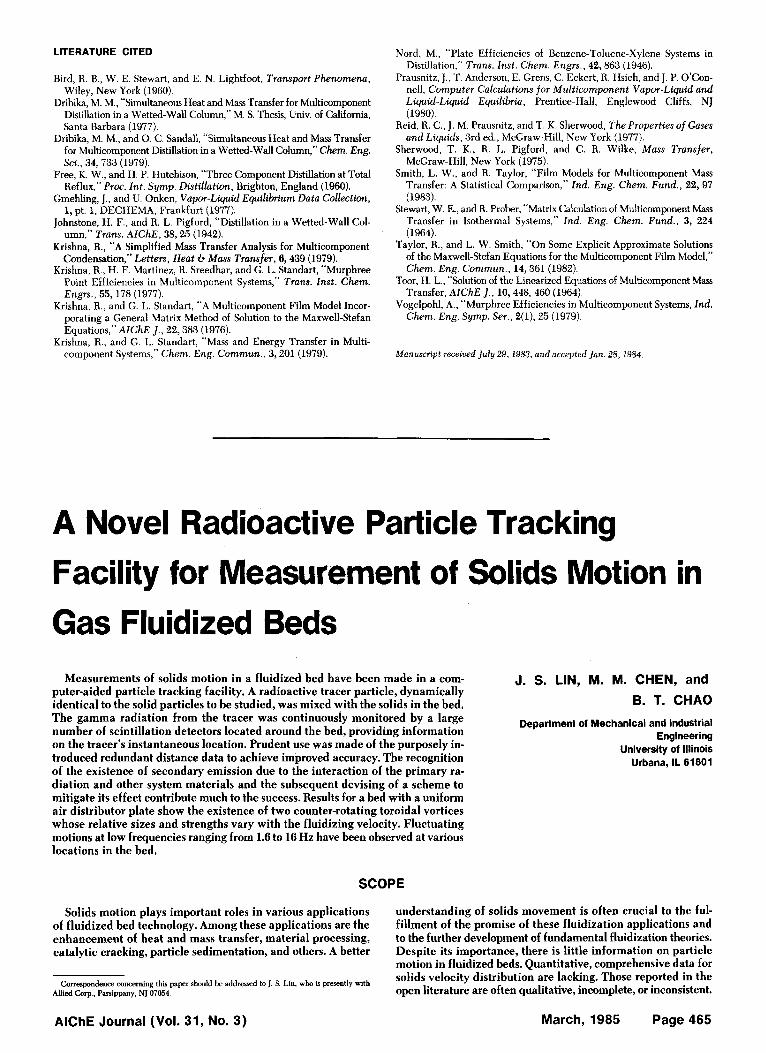
Interaction effects are more important in systems in which the binary pair diffusivities differ widely. It follows that interaction effects are of no significance at all in the benzene-toluene-ethyl- benzene and benzene-toluene-rn-xylene systems; all three of the models referred to above yield essentially the same results. There are quite small differences between the interactive and effective diffusivity methods for the acetone-methanol-ethanol system. The equal diffusivity model gives results that are a little (but not much) poorer than the results obtained with the other methods. The largest influence of interaction effects is encountered in the systems ace- tone-methanol-water and methanol-isopropanol-water. Indeed, Vogelpohl (1979) reports efficiencies outside the range [O,l] for these systems. We can predict this behavior using our nonequi- librium stage model together with any of the interactive mass transfer models. The effective diffusivity and equal diffusivity models are completely unable to predict this behavior. Neverthe- less, the cornpusition profites predicted by the three models do not always differ significantly. The largest discrepancies between the interactive and equal diffusivity methods that we encountered in these simulations are illustrated in Figure 12. To give a feel for the magnitude of the discrepancy w e note that for run 1 of the ace-
AlChE Journal (Vol. 31, NO. 3) March, 1985 Page 463
1 . e
0.8
0.6 0 e *-
0 0 - = 8 . 4
8 . 2
8 .8 0 2 4 6 8 I0
Stage Number
Flgure 12. Comparison of experimental composition profiles with the profiles predlcted by the interactive and equal diffusivity methods Am, component m of acetone-methanol-water system; Mm, component m of methanol-lso- propanol-water system. - line joining experimental points; x interactive
model; - -A- - equal diffusivity model.
tone-methanol-water system, the measured mole fractions of ac- etone and methanol on the top stage are 0.46 and 0.54, respectively. The mole fractions predicted using an interactive model of mass transfer are 0.4613 and 0.5334, respectively, whereas the equal diffusivity method predicts mole fractions of 0.5215 and 0.4716, respectively. The interactive models are clearly superior in this case.
A note of caution is in order here. We do not believe that a comparison of composition profiles obtained in total reflux ex- periments is the best way to establish the significance of interaction effects. It is better to compare predicted product distributions in operating problems or, alternatively, the required numbers of stages in design problems. We have made some calculations of this kind that show that the effective diffusivity and equal diffusivity models may occasionally severely underpredict, for example, the number of stages needed to accomplish a particular separation. These calculations will be more fully described in the next episode of this series. We conclude by noting that a rigorous (i,e., interac- tive) model of multicomponent m a s transfer is no harder to include in the computer code than the simpler effective and equal diffu- sivity methods. Furthermore, when the model equations are solved as we suggest, the simpler models offer no real reduction in the cost of obtaining a solution or any increase in the ease by which that solution is obtained.
INVITATION
Our nonequilibrium stage model predicts the observed com- position profiles to a perhaps surprisingly high level of accuracy. We did not expect that the model would perform as well as it, in fact, did. For this reason we would like to test the model further. For this we need data, preferably taken on industrial scale columns. Composition (and temperature) profiles are highly desirable but, by themselves, are not enough. Details of the equipment used (e.g., the tray characteristics involved in the calculation of the mass transfer coefficients) are also necessary. Finally, information that allows an estimate of the internal flow rates to be made (e.g., feed flow rates or heat loads on condenser and reboiler or vapor veloc- ities, F factor, etc.) should also be available. The authors would greatly appreciate correspondence with any of our readers who have information of this kind.
ACKNOWLEDGMENT
This material is based on work supported by the National Science Foundation under Grant Number CPE 8105516.
NOTATION:
a [BI
CP
c
D & F
G h H k k
K 1 L Le LF
[M 1 n N Nt R Re sc T
V W
Y
-
2,
X
= interfacial area (m2) = matrix of inverse mass transfer coefficients (m2-s/
= number of components = specific heat (J/kmol.K) = binary diffusion coefficients (m2/s) = energy transfer rate (J/s) = F factor, product of gas flow rate per unit bubbling area
= vapor flow rate (kmol/s) = heat transfer coefficient (J/s.m2-K) = partial molar enthalpy (J/kmol) = binary mass transfer coefficient (kmol/m2-s) = multicomponent mass transfer coefficients (kmol/m2-
= total mass transfer coefficients (kmol/m2.s) = component liquid flow (kmol/s) = liquid flow rate (kmol/s) = Lewis number = volumetric liquid flow rate per unit average liquid flow
= general matrix defined by Eqs. 8 and 9 = number of stages = mass transfer rate (kmol/s) = total mass transfer rate (kmol/s) = rate equation = Reynolds number = Schmidt number = temperature (K) = component vapor flow (kmol/s) = vapor flow rate (kmol/s) = weir height (m) = liquid phase compositions = vapor phase compositions
kmol)
and square root of gas density (kg1/2.m-1/2.s-1)
s)
path width (m2/s)
Greek Letters
€
p = vapor density (kmol/m3) p lrp] = rate factor matrix L
= heat transfer rate factor
= vapor phase viscosity (kmol/m.s)
= high flux correction factor
Mathematical Symbols
[ ] ( ) [ ]-I
= square matrix of size (c - 1) x (c - 1) = column matrix of size (c - 1) X 1 = inverse of square matrix
Subscripts
av = averaged value eff = effective value i , k = component numbering j = stage numbering m = mixture property
Superscripts
L = liquid phase V = vapor phase
Page 464 March, 1985 AlChE Journal (Vol. 31, No. 3)
LITERATURE CITED
Bird, R. B., W. E. Stewart, and E. N. Lightfoot, Transport Phenomena, Wiley, New York (1960).
Dribika, M. M., “Simultaneous Heat and Mass Transfer for Multicomponent Distillation in a Wetted-Wall Column,” M. S. Thesis, Univ. of California, Santa Barbara (1977).
Dribika, M. M., and 0. C. Sandall, “Simultaneous Heat and Mass Transfer for Multicomponent Distillation in a Wetted-Wall Column,” Chem. Eng. Sci., 34,733 (1979).
Free, K. W., and H. P. Hutchison, “Three Component Distillation at Total Reflux,” Proc. Int. Syrnp. Distillation, Brighton, England (1960).
Gmehling, J., and U. Onken, Vapor-Liquid Equilibrium Data Collection, 1, pt. 1, DECHEMA, Frankfurt (1977).
Johnstone, H. F., and R. L. Pigford, “Distillation in a Wetted-Wall Col- umn,” Trans. AIChE, 38,25 (1942).
Krishna, R., “A Simplified Mass Transfer Analysis for Multicomponent Condensation,” Letters, Heat 67 Mass Transfer, 6,439 (1979).
Krishna, R., H. F. Martinez, R. Sreedhar, and G. L. Standart, “Murphree Point Efficiencies in Multicomponent Systems,” Trans. Inst. Chem. Engrs., 55,178 (1977).
Krishna, R., and G. L. Standart, “A Multicomponent Film Model Incor- porating a General Matrix Method of Solution to the Maxwell-Stefan Equations,” AIChE I . , 22,383 (1976).
Krishna, R., and G. L. Standart, “Mass and Energy Transfer in Multi- component Systems,” Chem. Eng. Cornmun., 3,201 (1979).
Nord, M., “Plate Efficiencies of Benzene-Toluene-Xylene Systems in Distillation,” Trans. Inst. Chem. Engrs., 42, 863 (1946).
Prausnitz, J., T. Anderson, E. Grens, C. Eckert, R. Hsieh, and J. P. O’Con- nell, Computer Calculations for Multicomponent Vapor-Liquid and Liquid-Liquid Equilibria, Prentice-Hall, Englewood Cliffs, NJ (1980).
Reid, R. C., J. M. Prausnitz, and T. K. Sherwood, The Properties of Gases and Liquids, 3rd ed., McGraw-Hill, New York (1977).
Sherwood, T. K. , R. L. Pigford, and C. R. Wilke, Mass Transfer, McGraw-Hill, New York (1975).
Smith, L. W., and R. Taylor, “Film Models for Multicomponent Mass Transfer: A Statistical Comparison,” Ind. Eng. Chem. Fund., 22, 97 (1983).
Stewart, W. E., and R. Prober, “Matrix Calculation of Multicomponent Mass Transfer in Isothermal Systems,” Ind. Eng. Chem. Fund., 3, 224 (1964).
Taylor, R., and L. W. Smith, “On Some Explicit Approximate Solutions of the Maxwell-Stefan Equations for the Multicomponent Film Model,” Chem. Eng. Cornmun., 14,361 (1982).
Toor, H. L., “Solution of the Linearized Equations of Multicomponent Mass Transfer, AIChE I., 10,448, 460 (1964).
Vogelpohl, A., “Murphree Efficiencies in Multicomponent Systems, Ind. Chem. Eng. Symp. Ser., 2(1), 25 (1979).
Manuscript received July 29, 1983, and accepted fan. 28, 1984.
A Novel Radioactive Particle Tracking Facility for Measurement of Solids Motion in Gas Fluidized Beds
Measurements of solids motion in a fluidized bed have been made in a com- J. S. LIN, M. M. CHEN, and B. T. CHAO
Department of Mechanical and Industrial Engineering
University of Illinois Urbana, IL 61801
puter-aided particle tracking facility. A radioactive tracer particle, dynamically identical to the solid particles to be studied, was mixed with the solids in the bed. The gamma radiation from the tracer was continuously monitored by a large number of scintillation detectors located around the bed, providing information on the tracer’s instantaneous location. Prudent use was made of the purposely in- troduced redundant distance data to achieve improved accuracy. The recognition of the existence of secondary emission due to the interaction of the primary ra- diation and other system materials and the subsequent devising of a scheme to mitigate its effect contribute much to the success. Results for a bed with a uniform air distributor plate show the existence of two counter-rotating toroidal vortices whose relative sizes and strengths vary with the fluidizing velocity. Fluctuating motions at low frequencies ranging from 1.6 to 16 Hz have been observed at various locations in the bed.
SCOPE
Solids motion plays important roles in various applications of fluidized bed technology. Among these applications are the enhancement of heat and mass transfer, material processing, catalytic cracking, particle sedimentation, and others. A better
understanding of solids movement is often crucial to the ful- fillment of the promise of these fluidization applications and to the further development of fundamental fluidization theories. Despite its importance, there is little information on particle motion in fluidized beds. Quantitative, comprehensive data for
Correspondence concerning this should be to J. s. ~ i ~ , who is presently with solids VelocitY distribution are lacking. Those reported in the open literature are often qualitative, incomplete, or inconsistent. Allied Corp., Parsippany, NJ 07054.
AlChE Journal (Vol. 31, No. 3) March, 1985 Page 465