Embed Size (px)
Citation preview
lable at ScienceDirect
Building and Environment 45 (2010) 727–738
Contents lists avai
Building and Environment
journal homepage: www.elsevier .com/locate/bui ldenv
A new thermal performance index for dwelling roofs in the warm humid tropics
Chitrarekha Kabre*
Faculty of Architecture, Manipal Institute of Technology, Manipal University, Manipal, Karnataka 576104, India
a r t i c l e i n f o
Article history:Received 28 May 2009Received in revised form18 August 2009Accepted 19 August 2009
Keywords:Thermal performance indexThermal comfortCeiling surface temperatureMean radiant temperatureDwelling roofWarm humid tropics
* Tel.: þ91 820 2924111; fax: þ91 820 2571071.E-mail address: [email protected]
0360-1323/$ – see front matter � 2009 Elsevier Ltd.doi:10.1016/j.buildenv.2009.08.017
a b s t r a c t
This research aims to find a scientific rating scheme for roof system for the warm humid tropics. Theoverall air-to-air thermal transmittance (U-value) or thermal resistance (R-value) of roof are most widelyused properties, but these are based on steady-state heat conduction and do not respond to changingconditions of climate, design and comfort needs. The paper presents a new thermal performance index,which is based on thermal comfort and actual thermal performance of a roof design option. It providesa basis for identifying the optimum roof design for unconditioned and acclimatised regimes. A review ofthe acceptable limits of ceiling surface temperature is presented. The mathematical modelling for pre-dicting performance of roof based on admittance procedure and derivation of thermal performanceindex is described. In the proposed scheme the galvanized iron roof is given 0% rating and the roofsatisfying the comfort needs for the given climate is rated as 100%. Illustrative examples of built roofs ordesign options are taken from India and Australia. It clearly shows that the roofs with the highest thermalresistance are not necessarily optimum solutions.
� 2009 Elsevier Ltd. All rights reserved.
1. Introduction
In designing climate responsive accommodation for the warmhumid areas, where ambient air temperature and relative humidityare both above the desirable comfort level, the indoor conditionscan be improved by keeping building open for natural ventilation,thus to outside conditions. As a result the outdoor and indoor airtemperatures do not differ much. The primary function of buildingskin is to control the solar heat loads. It is necessary to shield anywindows from direct sun penetration, and to reduce the heattransmitted through the sunlit walls and the roof. The east and westwalls receive a good deal of radiation, but when the angle of inci-dence is small (early morning and late afternoon) the intensity ofradiation is not at its maximum. The north and south walls receivecomparatively little radiation and are much easier to shield withoverhangs. The walls are easily shaded by overhanging eaves,verandas or verdant environment and therefore gradually acquiretemperatures near to the air temperature. However, the roof is themost exposed to impacts of solar radiation, as it receives sunlightfor practically the whole of the day, and in the tropics the angle ofincidence is close to the normal in the hotter parts of the day. Heatgain through roof elevates ceiling surface temperature and causesradiant heat load on the occupants. The term ‘roof’ includes the roofstructure, the outer covering, and layers of insulating materials ormembranes and the ceiling.
All rights reserved.
The question arises, how much radiant heat load can bepermitted without harmful effects on the life and work of theinhabitants? The answer to this question is guided by two con-flicting motives: to satisfy comfort needs of the people of the warmhumid tropics and to optimise the performance of the roof toprovide good value of the investment. In other words, finda performance rating for roofs which is high enough to ensureprogress and yet realistic enough to be generally attainable.
In tropical climates steady-state property, the overall air-to-airthermal transmittance (U-value) or thermal resistance (R-value),alone cannot provide a satisfactory performance criterion for ratingroofs since the thermal performance of a roof is a function of thesol-air temperature wave form which is a function of climaticfactors, surface colour and orientation. A performance criterionbased on thermal comfort and actual thermal performance of a roofsection would be appropriate.
Identification of problem is presented in the next section witha field experiment in India and followed by discussion on the state-of-the-art. The sections following it explain derivation and math-ematical modelling of the new thermal performance index and itsapplication for exemplar roofs in India and Australia.
2. Problem identification
All over the world indigenous and vernacular architecture arereplete with appropriate built responses to climate which is alsotrue in India. However, this would not be true in contemporary

C. Kabre / Building and Environment 45 (2010) 727–738728
architecture with proliferation of modern technology, whichresulted in using ubiquitous building techniques all over thecountry irrespective of the climate. A wide spectrum of eco-friendlyand innovative building systems is being introduced in the housingsector as a consequence of environmental concern. The thermalperformance in most of the cases remains undetermined due tolack of empirical evidence or inadequate computational tools. Anexperiment was conducted by the author to explore the presenttrends in house-building technology and identify the problem ofdesigning roof for thermal comfort in warm humid zone [1]. Forthis study Trivandrum (lattitude 8�290N) and Auroville (lattitude12�N) were chosen because of the well known construction activ-ities in the contemporary housing. The houses were selected basedon the criteria that they were designed by architects and con-structed using different conventional or alternative constructionmaterials. The limited accessibility to the houses was a constraint inthe study and the number of samples is not sufficient to draw anystatistical conclusion to recommend any design solutions.
The experiment comprised of on spot measurement of relevanttemperatures in the summer month of March 1998 between 13:30and 18:00 h. At this time the weather was reasonably clear and theoutdoor air temperature in shade varied from 31� to 33 �C inTrivandrum and from 30� to 32 �C in Auroville. Rooms selected formeasurements were of similar area and ceiling height ranged from2.5 to 3.6 m. Since most of the houses were open for ventilation, theindoor and outdoor shade temperatures were observed as same.The internal surface temperatures of walls were also the same asindoor air temperature, but the ceiling surface temperature variedaccording to roof constructions. For sloping roofs, the side mostexposed to sun was chosen for measurement.
2.1. Instrumentation
The instrument used in the study was Twin Input Digital Ther-mometer (Q1434) supplied by Dick Smith Electronics Pty Ltd.Australia. This instrument is a portable 3 digit, compact-sizeddigital thermometer using two external K-type thermocouples astemperature sensors. Temperature indication follows NationalBureau of Standards and IEC 584 temperature/voltage tables for thetwo K-type thermocouples.
2.2. Analysis
This experiment reflects wide variations in thermal perfor-mance of houses and confirms that the roof played the dominantrole because of diverse constructions. Fig. 1 shows the graph ofmeasured air and ceiling surface temperature. The ‘U’ value wascalculated by the author for all the roofs and is included in thelegend to Fig. 1. In both places examples of good and poor roofdesigns could be observed; the ‘U’ value ranged from 1.4 to 5.29 W/m2 K and the excess ceiling temperature ranged from 0 to 15 K.Fig. 2 shows the construction details of some of the roofs studied.
Since the roof insulation ranged from resistive to capacitive typethe ‘U’ value cannot provide a satisfactory basis for comparison.Two different types of construction (light, sample no. 6 or heavy,sample no. 33) have U values within the acceptable limit of 2.33 W/m2 K, but would perform in different ways.
In case of lightweight sheet roofs the ceiling temperaturedropped by 14 K, from the worst to the best, with timber boardceiling and unventilated attic space, (sample no. 1 and 11 in Fig. 1).The simple Mangalore tile roof in a kindergarten in Auroville(sample no. 22 in Fig. 1) was extremely hot, but the similar roofwith ceiling of particle board and timber (sample no. 23–24 and no.6 in Fig. 1) improved performance three times. Another roof(sample no. 7–8 in Fig. 1) in Trivandrum, using traditional ‘‘fish’’
(fish-tail) clay tiles performed better because of overlapping of tiles.There are two or three layers at any cross section and due to lowmass this roof cooled down by the evening.
In case of heavy roofs, filler slab-Reinforced Concrete slab withclay tiles, (sample no. 2–5, 14, 15, 17 & 21 in Fig. 1) performed betterthan conventional Reinforced Concrete slab (sample no. 12 inFig. 1). The reason for the same could be that it consists of airpockets in between tiles. This argument would not apply to theother filler slab using bricks, where light concrete was used asinsulation. Conventionally Reinforced Concrete roof are insulatedusing lime concrete and flat clay tiles (sample no. 9 in Fig. 1). Shellroof construction like ferro cement channel (sample no. 27–28 inFig. 1) and funicular shell (sample no. 16 in Fig. 1) are being usedfor economic reasons but without insulation does not performvery well, due to the thin skin. The temperature varied alongcurvature.
White washing improved performance two and half times incase of Reinforced Concrete roofs (no. 18–19). Shading of the roof isone of the time-tested solutions. Two extreme types were noticed,one involved laying of tiles on the Reinforced Concrete roof and theother is construction of ‘insulated’ parasol roof. The examples of thefirst type are a layer of clay tile over 100 mm Reinforced Concreteroof with an air gap of 25 mm (sample no. 10 in Fig. 1) and threelayers of country tiles (Spanish) on 75 mm Reinforced Concrete slab(sample no. 25–26 in Fig. 1). The parasol roof construction is anarchitects’ innovation using vermiculite concrete as insulation,(sample no. 36 in Fig. 1). Although many examples of parasol roofsexist in vernacular architecture using lightweight skins, the insu-lation is not necessary. Such a wasteful duplication resultedbecause the architects could not explain this fact to the client in theabsence of quantitative data, since no tool was available to assessthe performance of the unorthodox design alternative.
3. A review of comfort limits and overhead radiant heat
There are no physiological field tests available to determine thediscomfort caused due to the radiant heat from roofs in the warmhumid tropics. However, there are a number of systematic studiesbased on laboratory experiments, which investigated discomfortcaused from heated ceiling panels (used for room heating in coldclimates).
Munro and Chrenko [2] and Chrenko [3] found that the eleva-tion of the mean radiant temperature at head level due to theradiation overhead was the best parameter for indicating thesubjective response of those investigated. All experiments tookplace at constant air temperature, which means that the operativetemperature was increased when the ceiling temperature wasincreased. The operative temperature is defined as the uniformtemperature of an enclosure in which an occupant would exchangethe same amount of heat by radiation plus convection as in theexisting non-uniform environment.
In the studies by McNall and Biddison [4] and by Griffiths andMcIntyre [5] the increased temperature of the heated ceiling wasbalanced by a decrement of the wall temperature to maintainconstant operative temperature. Fanger et al. [6] argued that this isnot realistic, since in practice the air temperature is usuallydecreased to balance the increased ceiling temperature. Further-more, since the subjects were tested in groups, all of them were notnecessarily thermally neutral. Thermal neutrality for a person isdefined as a condition in which he or she prefers neither a highernor a lower ambient temperature level. Thermal neutrality isa necessary condition for a person to attain thermal comfort. It is afurther requirement that no local warm or cool discomfortis experienced on any part of the body. Overhead radiation fora heated ceiling can create such local discomfort: either warm
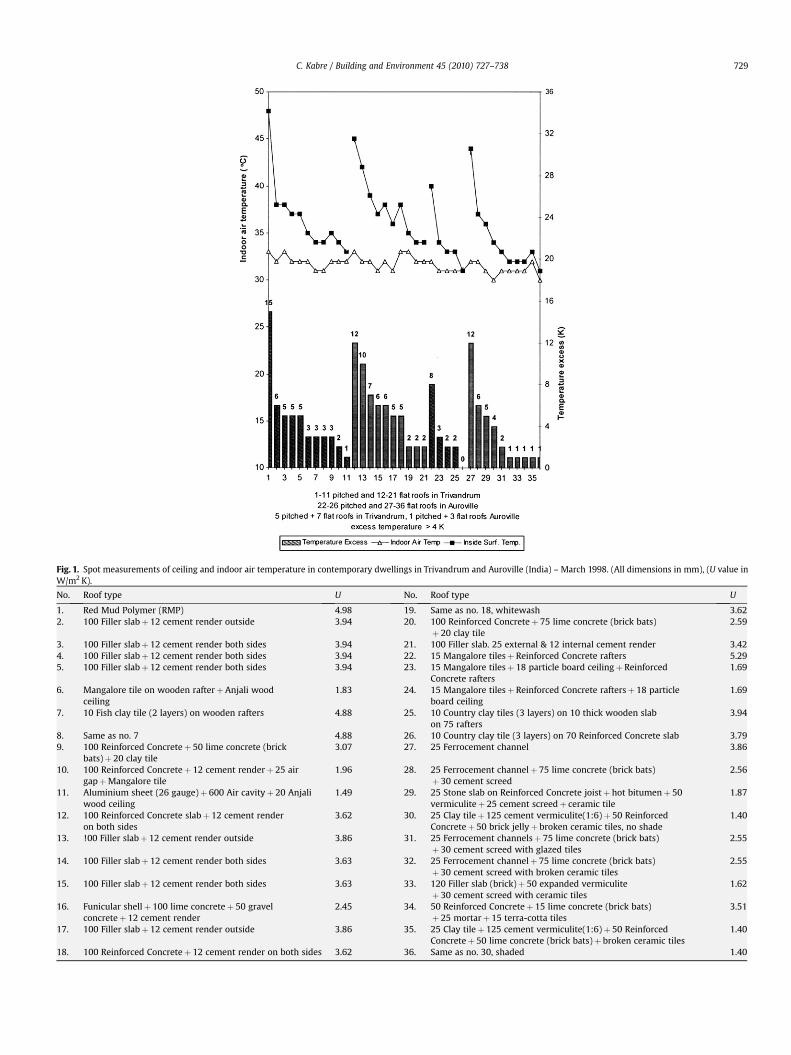
Fig. 1. Spot measurements of ceiling and indoor air temperature in contemporary dwellings in Trivandrum and Auroville (India) – March 1998. (All dimensions in mm), (U value inW/m2 K).
No. Roof type U No. Roof type U
1. Red Mud Polymer (RMP) 4.98 19. Same as no. 18, whitewash 3.622. 100 Filler slabþ 12 cement render outside 3.94 20. 100 Reinforced Concreteþ 75 lime concrete (brick bats)
þ 20 clay tile2.59
3. 100 Filler slabþ 12 cement render both sides 3.94 21. 100 Filler slab. 25 external & 12 internal cement render 3.424. 100 Filler slabþ 12 cement render both sides 3.94 22. 15 Mangalore tilesþ Reinforced Concrete rafters 5.295. 100 Filler slabþ 12 cement render both sides 3.94 23. 15 Mangalore tilesþ 18 particle board ceilingþ Reinforced
Concrete rafters1.69
6. Mangalore tile on wooden rafterþAnjali woodceiling
1.83 24. 15 Mangalore tilesþ Reinforced Concrete raftersþ 18 particleboard ceiling
1.69
7. 10 Fish clay tile (2 layers) on wooden rafters 4.88 25. 10 Country clay tiles (3 layers) on 10 thick wooden slabon 75 rafters
3.94
8. Same as no. 7 4.88 26. 10 Country clay tile (3 layers) on 70 Reinforced Concrete slab 3.799. 100 Reinforced Concreteþ 50 lime concrete (brick
bats)þ 20 clay tile3.07 27. 25 Ferrocement channel 3.86
10. 100 Reinforced Concreteþ 12 cement renderþ 25 airgapþMangalore tile
1.96 28. 25 Ferrocement channelþ 75 lime concrete (brick bats)þ 30 cement screed
2.56
11. Aluminium sheet (26 gauge)þ 600 Air cavityþ 20 Anjaliwood ceiling
1.49 29. 25 Stone slab on Reinforced Concrete joistþ hot bitumenþ 50vermiculiteþ 25 cement screedþ ceramic tile
1.87
12. 100 Reinforced Concrete slabþ 12 cement renderon both sides
3.62 30. 25 Clay tileþ 125 cement vermiculite(1:6)þ 50 ReinforcedConcreteþ 50 brick jellyþ broken ceramic tiles, no shade
1.40
13. !00 Filler slabþ 12 cement render outside 3.86 31. 25 Ferrocement channelsþ 75 lime concrete (brick bats)þ 30 cement screed with glazed tiles
2.55
14. 100 Filler slabþ 12 cement render both sides 3.63 32. 25 Ferrocement channelþ 75 lime concrete (brick bats)þ 30 cement screed with broken ceramic tiles
2.55
15. 100 Filler slabþ 12 cement render both sides 3.63 33. 120 Filler slab (brick)þ 50 expanded vermiculiteþ 30 cement screed with ceramic tiles
1.62
16. Funicular shellþ 100 lime concreteþ 50 gravelconcreteþ 12 cement render
2.45 34. 50 Reinforced Concreteþ 15 lime concrete (brick bats)þ 25 mortarþ 15 terra-cotta tiles
3.51
17. 100 Filler slabþ 12 cement render outside 3.86 35. 25 Clay tileþ 125 cement vermiculite(1:6)þ 50 ReinforcedConcreteþ 50 lime concrete (brick bats)þ broken ceramic tiles
1.40
18. 100 Reinforced Concreteþ 12 cement render on both sides 3.62 36. Same as no. 30, shaded 1.40
C. Kabre / Building and Environment 45 (2010) 727–738 729

Fig. 2. Construction details of some of the sample roofs selected for spot measurements in Trivandrum and Auroville (India).
C. Kabre / Building and Environment 45 (2010) 727–738730
discomfort at head or cold discomfort at the feet (or both). Theyconducted experiments to find the limits of overhead radiation towhich person in thermal neutrality can be exposed without feelingdiscomfort at any part of the body. This simulates many cases inpractice where people modify their clothing to keep them ther-mally neutral. In these experiments the air and wall temperature(rather than just the wall temperature) were lowered to keep thesubjects neutral when exposed to overhead radiation. They sug-gested two parameters for practical use: the ceiling temperature
and the radiant asymmetry. The radiant asymmetry is defined asthe difference in radiant temperatures seen by a small flat elementlooking in opposite directions. This study suggested that fivepercent feeling uncomfortable corresponds to a radiant tempera-ture asymmetry of 4 K which agrees well with the limit suggestedby Chrenko (‘‘elevated mean radiant temperature’’¼ 2.2 K)although he predicted more than 20% feeling uncomfortable at hislimit. Fig. 3 gives the allowable ceiling temperature as a function ofthe angle factor to the ceiling [7].
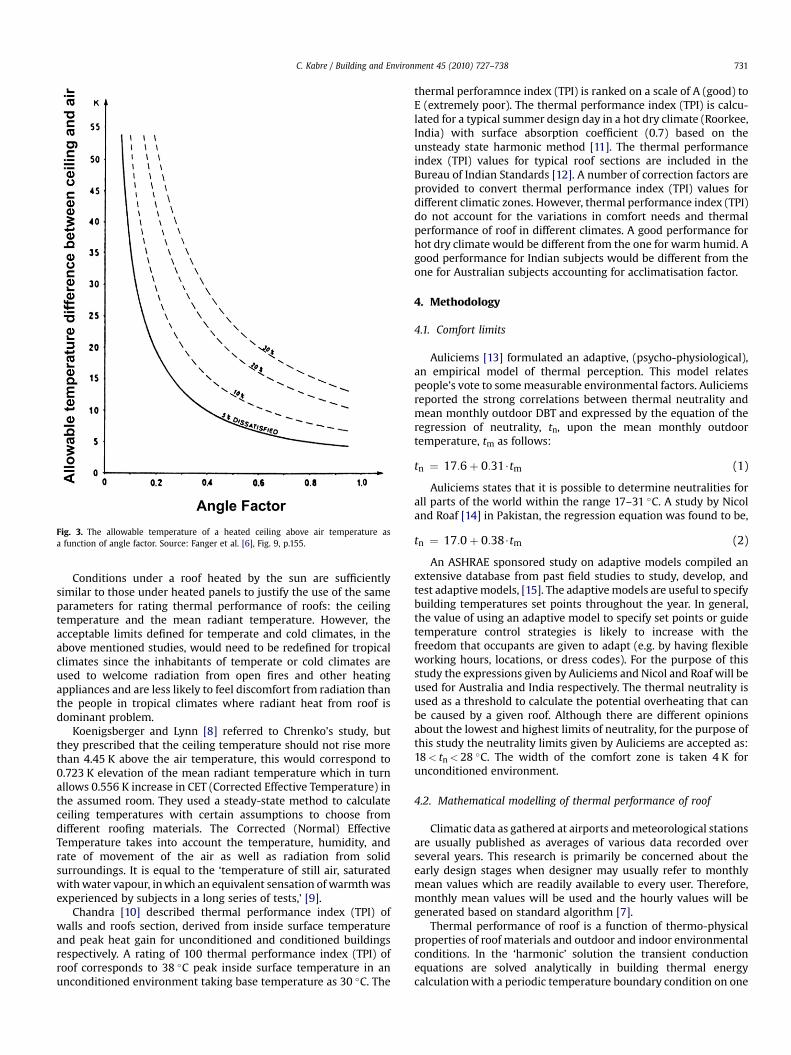
Fig. 3. The allowable temperature of a heated ceiling above air temperature asa function of angle factor. Source: Fanger et al. [6], Fig. 9, p.155.
C. Kabre / Building and Environment 45 (2010) 727–738 731
Conditions under a roof heated by the sun are sufficientlysimilar to those under heated panels to justify the use of the sameparameters for rating thermal performance of roofs: the ceilingtemperature and the mean radiant temperature. However, theacceptable limits defined for temperate and cold climates, in theabove mentioned studies, would need to be redefined for tropicalclimates since the inhabitants of temperate or cold climates areused to welcome radiation from open fires and other heatingappliances and are less likely to feel discomfort from radiation thanthe people in tropical climates where radiant heat from roof isdominant problem.
Koenigsberger and Lynn [8] referred to Chrenko’s study, butthey prescribed that the ceiling temperature should not rise morethan 4.45 K above the air temperature, this would correspond to0.723 K elevation of the mean radiant temperature which in turnallows 0.556 K increase in CET (Corrected Effective Temperature) inthe assumed room. They used a steady-state method to calculateceiling temperatures with certain assumptions to choose fromdifferent roofing materials. The Corrected (Normal) EffectiveTemperature takes into account the temperature, humidity, andrate of movement of the air as well as radiation from solidsurroundings. It is equal to the ‘temperature of still air, saturatedwith water vapour, in which an equivalent sensation of warmth wasexperienced by subjects in a long series of tests,’ [9].
Chandra [10] described thermal performance index (TPI) ofwalls and roofs section, derived from inside surface temperatureand peak heat gain for unconditioned and conditioned buildingsrespectively. A rating of 100 thermal performance index (TPI) ofroof corresponds to 38 �C peak inside surface temperature in anunconditioned environment taking base temperature as 30 �C. The
thermal perforamnce index (TPI) is ranked on a scale of A (good) toE (extremely poor). The thermal performance index (TPI) is calcu-lated for a typical summer design day in a hot dry climate (Roorkee,India) with surface absorption coefficient (0.7) based on theunsteady state harmonic method [11]. The thermal performanceindex (TPI) values for typical roof sections are included in theBureau of Indian Standards [12]. A number of correction factors areprovided to convert thermal performance index (TPI) values fordifferent climatic zones. However, thermal performance index (TPI)do not account for the variations in comfort needs and thermalperformance of roof in different climates. A good performance forhot dry climate would be different from the one for warm humid. Agood performance for Indian subjects would be different from theone for Australian subjects accounting for acclimatisation factor.
4. Methodology
4.1. Comfort limits
Auliciems [13] formulated an adaptive, (psycho-physiological),an empirical model of thermal perception. This model relatespeople’s vote to some measurable environmental factors. Auliciemsreported the strong correlations between thermal neutrality andmean monthly outdoor DBT and expressed by the equation of theregression of neutrality, tn, upon the mean monthly outdoortemperature, tm as follows:
tn ¼ 17:6þ 0:31$tm (1)
Auliciems states that it is possible to determine neutralities forall parts of the world within the range 17–31 �C. A study by Nicoland Roaf [14] in Pakistan, the regression equation was found to be,
tn ¼ 17:0þ 0:38$tm (2)
An ASHRAE sponsored study on adaptive models compiled anextensive database from past field studies to study, develop, andtest adaptive models, [15]. The adaptive models are useful to specifybuilding temperatures set points throughout the year. In general,the value of using an adaptive model to specify set points or guidetemperature control strategies is likely to increase with thefreedom that occupants are given to adapt (e.g. by having flexibleworking hours, locations, or dress codes). For the purpose of thisstudy the expressions given by Auliciems and Nicol and Roaf will beused for Australia and India respectively. The thermal neutrality isused as a threshold to calculate the potential overheating that canbe caused by a given roof. Although there are different opinionsabout the lowest and highest limits of neutrality, for the purpose ofthis study the neutrality limits given by Auliciems are accepted as:18< tn< 28 �C. The width of the comfort zone is taken 4 K forunconditioned environment.
4.2. Mathematical modelling of thermal performance of roof
Climatic data as gathered at airports and meteorological stationsare usually published as averages of various data recorded overseveral years. This research is primarily be concerned about theearly design stages when designer may usually refer to monthlymean values which are readily available to every user. Therefore,monthly mean values will be used and the hourly values will begenerated based on standard algorithm [7].
Thermal performance of roof is a function of thermo-physicalproperties of roof materials and outdoor and indoor environmentalconditions. In the ‘harmonic’ solution the transient conductionequations are solved analytically in building thermal energycalculation with a periodic temperature boundary condition on one
C. Kabre / Building and Environment 45 (2010) 727–738732
side of the slab and a constant temperature boundary condition onother side. This approach gives the temperature or energy patternfor a building assuming it has reached the stable, or equilibrium,state for some given cycle of weather and usage. The ‘‘admittance’’procedure, developed by Danter [16] and adopted by the Institutionof Heating and Ventilating Engineers (IHVE) [17] is typical of thistype of solution. It is a comprehensive procedure and as describedthere (without the complications of harmonics other than that ofperiod 24 h and with only reference to time lag). In order to predictthe heat transmitted through a roof and consequently its effect onindoor comfort; it is necessary to find the following parameters:
� Sol-air temperature� Ceiling temperature� Mean radiant temperature and shape factor
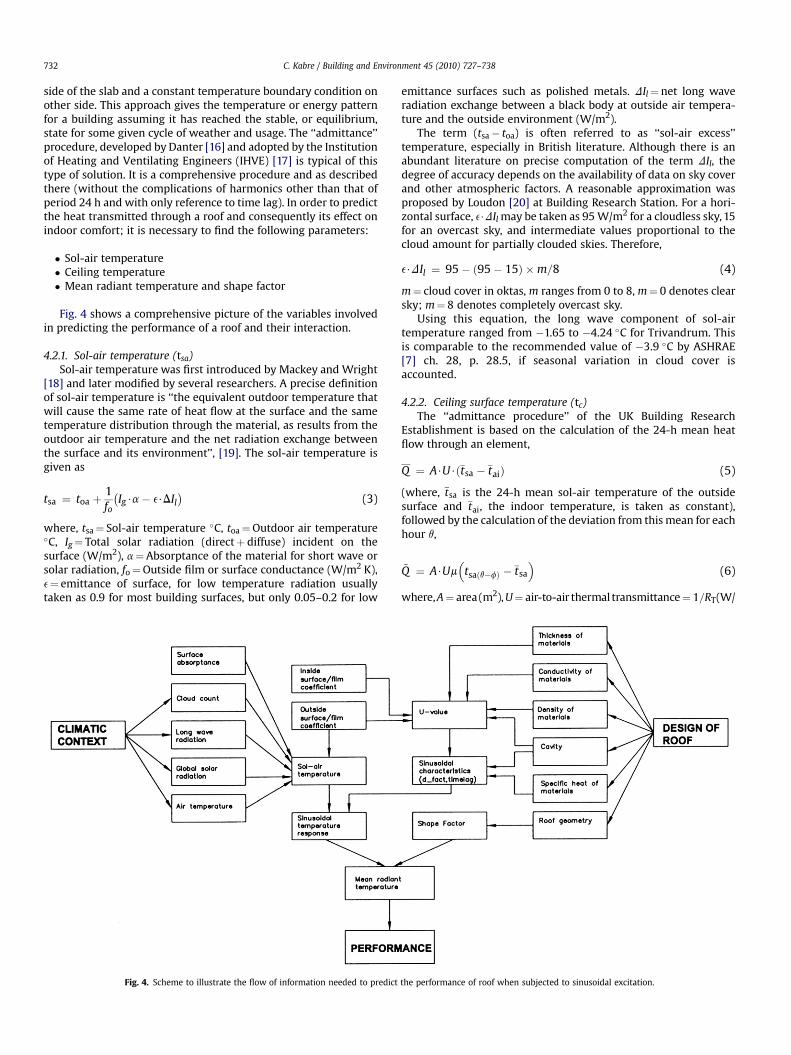
Fig. 4 shows a comprehensive picture of the variables involvedin predicting the performance of a roof and their interaction.
4.2.1. Sol-air temperature (tsa)Sol-air temperature was first introduced by Mackey and Wright
[18] and later modified by several researchers. A precise definitionof sol-air temperature is ‘‘the equivalent outdoor temperature thatwill cause the same rate of heat flow at the surface and the sametemperature distribution through the material, as results from theoutdoor air temperature and the net radiation exchange betweenthe surface and its environment’’, [19]. The sol-air temperature isgiven as
tsa ¼ toa þ1fo
�Ig$a� e$DIl
�(3)
where, tsa¼ Sol-air temperature �C, toa¼Outdoor air temperature�C, Ig¼ Total solar radiation (directþ diffuse) incident on thesurface (W/m2), a¼Absorptance of the material for short wave orsolar radiation, fo¼Outside film or surface conductance (W/m2 K),e¼ emittance of surface, for low temperature radiation usuallytaken as 0.9 for most building surfaces, but only 0.05–0.2 for low
Fig. 4. Scheme to illustrate the flow of information needed to predict
emittance surfaces such as polished metals. DIl¼ net long waveradiation exchange between a black body at outside air tempera-ture and the outside environment (W/m2).
The term (tsa� toa) is often referred to as ‘‘sol-air excess’’temperature, especially in British literature. Although there is anabundant literature on precise computation of the term DIl, thedegree of accuracy depends on the availability of data on sky coverand other atmospheric factors. A reasonable approximation wasproposed by Loudon [20] at Building Research Station. For a hori-zontal surface, e$DIl may be taken as 95 W/m2 for a cloudless sky, 15for an overcast sky, and intermediate values proportional to thecloud amount for partially clouded skies. Therefore,
e$DIl ¼ 95� ð95� 15Þ �m=8 (4)
m¼ cloud cover in oktas, m ranges from 0 to 8, m¼ 0 denotes clearsky; m¼ 8 denotes completely overcast sky.
Using this equation, the long wave component of sol-airtemperature ranged from �1.65 to �4.24 �C for Trivandrum. Thisis comparable to the recommended value of �3.9 �C by ASHRAE[7] ch. 28, p. 28.5, if seasonal variation in cloud cover isaccounted.
4.2.2. Ceiling surface temperature (tc)The ‘‘admittance procedure’’ of the UK Building Research
Establishment is based on the calculation of the 24-h mean heatflow through an element,
Q ¼ A$U$ðtsa � taiÞ (5)
(where, tsa is the 24-h mean sol-air temperature of the outsidesurface and tai, the indoor temperature, is taken as constant),followed by the calculation of the deviation from this mean for eachhour q,
~Q ¼ A$Um�
tsaðq�fÞ � tsa
�(6)
where, A¼ area (m2), U¼ air-to-air thermal transmittance¼ 1=RT(W/
the performance of roof when subjected to sinusoidal excitation.

Fig. 5. Flat and pitched rectangular roof and centre of a room.
Fig. 6. Ceiling surface temperature of flat GI (galvanized iron) roof in Trivandrum(India) and Cairns (Australia).
C. Kabre / Building and Environment 45 (2010) 727–738 733
m2 K), RT¼ total thermal resistance (m2 K/W), m¼ decrement factor(non-dimensional), f¼ time lag (h), tai ¼ 24 h average inside airtemperature (�C), tsa ¼ 24 h average of sol-air temperature (�C),tsaðq�fÞ ¼ sol-air temperature of surface, hours before (�C).
The expression for inside surface temperature of a roof sectioncan be derived from the equations of internal heat flow Qc at theinside surface of a wall at time q (in W/m2), [21,22].
Qc ¼ Uhðtsa � taiÞ þ m
�tsðq�fÞ � tsa
�i(7)
The ceiling surface temperature can be found from,
Qc ¼ hcðtc � taiÞ þ hr3ðtc � tsurÞ (8)
where, hc¼ convective coefficient, hr¼ radiation coefficient,e;¼ emittance, tai¼ inside air temperature at time q, tc¼ ceilingsurface temperature at time q, tsur ¼ average temperature of insidesurface seen by roof, f¼ time lag.
Rsi ¼1
hc þ ehrm2K=W
If the average inside surface temperature of all surfacesexcluding roof is
tsur ¼ tai (9)
Substituting this in equation (8) we get,
Qc ¼ hcðtc � taiÞ þ hreðtc � taiÞ (10)
from which,
tc ¼ tai þQc
ðhc þ ehrÞ¼ tai þ Qc$Rsi (11)
substituting the Qc from equation (7) the ceiling surface tempera-ture can be calculated as follow,
tc ¼ tai þ U$Rsi
hðtsa � taiÞ þ m$
�tsaðq�fÞ � tsa
�i(12)
4.2.3. Mean radiant temperature (tmrt) and shape factor (Fc)Mean radiant temperature is the uniform temperature of an
imaginary enclosure in which radiant heat transfer from the humanbody equals the radiant heat transfer in the actual non-uniformenclosure. Measurement of the globe temperature, air temperature,and the air velocity can be combined to estimate the mean radianttemperature. The mean radiant temperature can also be calculatedfrom measured values of the temperature of surrounding walls andsurfaces and their position with respect to the person. As mostbuilding surfaces have a high emittance e, all the surfaces in theroom can be assumed to be black [7] (ch. 8, p. 8.10). The followingequation is then used:
T4mrt ¼ T4
1 $Fp�1 þ T42 $Fp�2 þ/þ T4
N$Fp�N (13)
where, Tmrt ¼ absolute mean radiant temperature, K, TN¼ absolutetemperature of surface N, K, Fp�N¼ angle factor between a personand surface N.
As the sum of the angle factors is unity, the fourth power ofmean radiant temperature equals the mean value of thesurrounding surface temperatures to the fourth power, weightedby the respective angle factors. The angle factor normally dependson the position and orientation of the person. The relationshipbetween MRT and shape factor is mathematically defined andillustrated in the American National Standard [23].
In a warm humid climate when windows are opened forventilation it can be assumed that the surface temperatures of wallsand floor is the same as the indoor air temperature and only theceiling temperature is elevated due to solar radiation, then theequation (13) can be simplified as
T4mrt ¼ T4
c Fc þ T4aið1� FcÞ (14)
where, Tc¼ absolute surface temperature of ceiling, K, Tai¼ absoluteindoor air temperature, K, Fc¼ angle factor between a person andceiling.
The shape factor can be defined in terms of the solid anglesubtended by the roof. The solid angle at point O is the sum of the
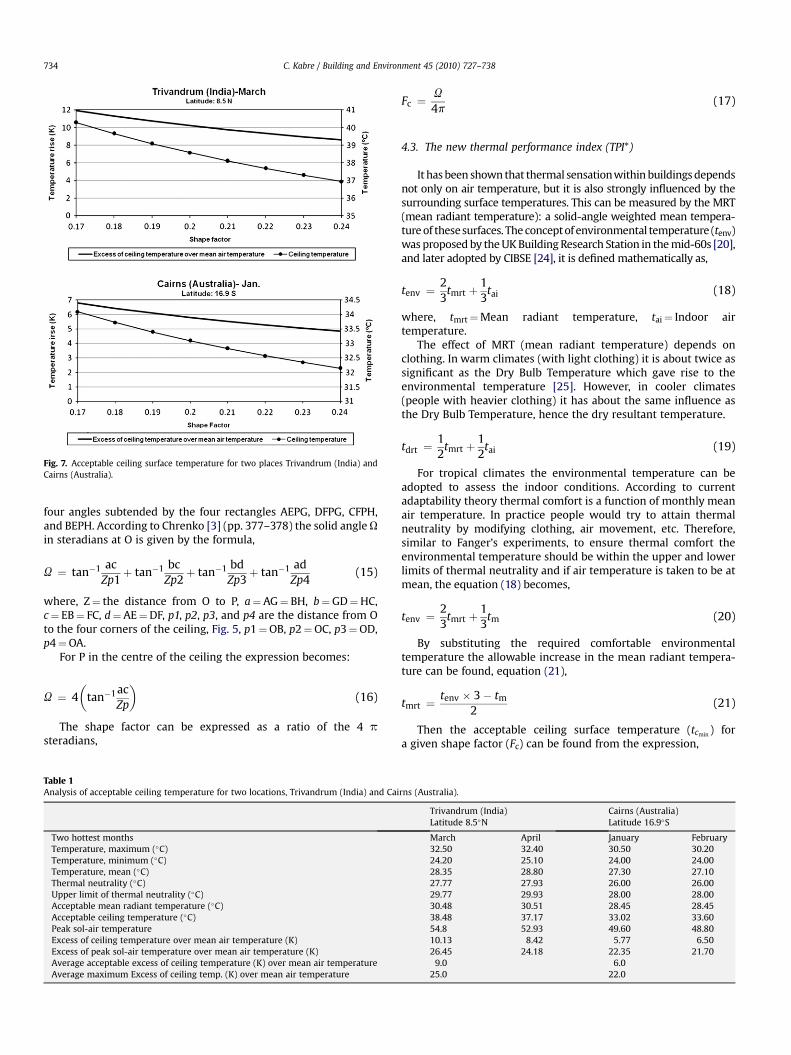
Fig. 7. Acceptable ceiling surface temperature for two places Trivandrum (India) andCairns (Australia).
C. Kabre / Building and Environment 45 (2010) 727–738734
four angles subtended by the four rectangles AEPG, DFPG, CFPH,and BEPH. According to Chrenko [3] (pp. 377–378) the solid angle Uin steradians at O is given by the formula,
U ¼ tan�1 acZp1þ tan�1 bc
Zp2þ tan�1 bd
Zp3þ tan�1 ad
Zp4(15)
where, Z¼ the distance from O to P, a¼AG¼ BH, b¼GD¼HC,c¼ EB¼ FC, d¼AE¼DF, p1, p2, p3, and p4 are the distance from Oto the four corners of the ceiling, Fig. 5, p1¼OB, p2¼OC, p3¼OD,p4¼OA.
For P in the centre of the ceiling the expression becomes:
U ¼ 4�
tan�1acZp
�(16)
The shape factor can be expressed as a ratio of the 4 psteradians,
Table 1Analysis of acceptable ceiling temperature for two locations, Trivandrum (India) and Cai
Two hottest monthsTemperature, maximum (�C)Temperature, minimum (�C)Temperature, mean (�C)Thermal neutrality (�C)Upper limit of thermal neutrality (�C)Acceptable mean radiant temperature (�C)Acceptable ceiling temperature (�C)Peak sol-air temperatureExcess of ceiling temperature over mean air temperature (K)Excess of peak sol-air temperature over mean air temperature (K)Average acceptable excess of ceiling temperature (K) over mean air temperatureAverage maximum Excess of ceiling temp. (K) over mean air temperature
Fc ¼U
4p(17)
4.3. The new thermal performance index (TPI*)
It has been shown that thermal sensation within buildings dependsnot only on air temperature, but it is also strongly influenced by thesurrounding surface temperatures. This can be measured by the MRT(mean radiant temperature): a solid-angle weighted mean tempera-ture of these surfaces. The concept of environmental temperature (tenv)was proposed by the UK Building Research Station in the mid-60s [20],and later adopted by CIBSE [24], it is defined mathematically as,
tenv ¼23
tmrt þ13
tai (18)
where, tmrt¼Mean radiant temperature, tai¼ Indoor airtemperature.
The effect of MRT (mean radiant temperature) depends onclothing. In warm climates (with light clothing) it is about twice assignificant as the Dry Bulb Temperature which gave rise to theenvironmental temperature [25]. However, in cooler climates(people with heavier clothing) it has about the same influence asthe Dry Bulb Temperature, hence the dry resultant temperature.
tdrt ¼12
tmrt þ12
tai (19)
For tropical climates the environmental temperature can beadopted to assess the indoor conditions. According to currentadaptability theory thermal comfort is a function of monthly meanair temperature. In practice people would try to attain thermalneutrality by modifying clothing, air movement, etc. Therefore,similar to Fanger’s experiments, to ensure thermal comfort theenvironmental temperature should be within the upper and lowerlimits of thermal neutrality and if air temperature is taken to be atmean, the equation (18) becomes,
tenv ¼23
tmrt þ13
tm (20)
By substituting the required comfortable environmentaltemperature the allowable increase in the mean radiant tempera-ture can be found, equation (21),
tmrt ¼tenv � 3� tm
2(21)
Then the acceptable ceiling surface temperature (tcmin ) fora given shape factor (Fc) can be found from the expression,
rns (Australia).
Trivandrum (India)Latitude 8.5�N
Cairns (Australia)Latitude 16.9�S
March April January February32.50 32.40 30.50 30.2024.20 25.10 24.00 24.0028.35 28.80 27.30 27.1027.77 27.93 26.00 26.0029.77 29.93 28.00 28.0030.48 30.51 28.45 28.4538.48 37.17 33.02 33.6054.8 52.93 49.60 48.8010.13 8.42 5.77 6.5026.45 24.18 22.35 21.70
9.0 6.025.0 22.0

Fig. 8. Thermal performance of pitched (30�) roofs (light and heavy construction), Trivandrum, India. Note: Absorptivity¼ 0.7, all dimensions in mm. ‘Dec. fact’ is Decrement Factor.
C. Kabre / Building and Environment 45 (2010) 727–738 735
T4mrt ¼ T4
c $Fc þ T4mð1� FcÞ (22)
The rise of ceiling temperature above the air temperature causesthe elevation of mean radiant temperature. Consequently, thetemperature difference between the ceiling and air temperaturecan be taken as the criterion to assess the performance of a roof.The acceptable elevation of ceiling temperature (Dtcmin ) above themean air temperature can be given as,
Dtcmin ¼ tcmin � tm (23)
Similarly the maximum elevation of ceiling temperature (Dtcmax )that can occur for a GI (galvanised iron) roof, ‘‘everyone’s bench-mark for the worst roof,’’ in a given climate. However, the ceilingsurface temperature of GI (galvanised iron) roof nearly same as sol-air temperature, Fig. 6. The peak sol-air temperature will be used.
Dtcmax ¼ tcmax � tm ¼ tsamax � tm (24)
From these two expressions the performance of a given roof canbe rated. For the hottest month find the peak ceiling surfacetemperature for a given roof and the elevation (Dtc) above the mean
air temperature. The new thermal performance index (TPI*) of thegiven roof can be given as,
TPI* ¼ Dtcmax � Dtc
Dtcmax � Dtcmin
� 100 (25)
This new index would indicate in percentage terms how muchperformance is achieved on a scale with the range of acceptableelevation and the worst elevation for a given roof in a particularclimate. The acceptable elevation of ceiling temperature (Dtcmin )above the mean air temperature depends on the mean airtemperature, thermal neutrality, the dimension of the roof or room,the position of the occupant (or height of the environmental point),the surface temperature of walls and floor.
5. Results and analysis
The methodology is demonstrated for two locations Trivandrum(India) and Cairns (Australia). The acceptable ceiling surfacetemperatures are calculated for two hottest months setting theenvironmental temperature to the upper thermal neutrality limit,

Fig. 9. Thermal performance of pitched (25�) tile roofs (light construction) Cairns, Australia. Note: Attic space is ventilated, absorptivity¼ 0.7, all dimensions in mm. ‘Dec. fact’ isDecrement Factor.
C. Kabre / Building and Environment 45 (2010) 727–738736
when there is very little air movement. These calculations areperformed for eight shape factors ranging from 0.17 to 0.24 andaverages are calculated. The shape factors are calculated for a pointlocated at a distance for 1.2, 1.35 and 1.5 m from square roof of sides3.0, 3.3 and 3.6 m, most likely to be in the living space of a house.Fig. 7 shows acceptable ceiling temperature for these two locations.Table 1 presents the analysis of acceptable ceiling temperature inthese two locations. From this analysis it can be observed that theacceptable rise in mean radiant temperature (tmrt) above mean airtemperature in these locations ranged from 0.25 to 1.92 K. Theaverage acceptable ceiling temperature for Trivandrum is 37.8 �Cand for Cairns is 33.3 �C, this is due to not only the difference in theclimate but also because of the different expressions used forthermal neutrality. Consequently, the acceptable rise in ceilingtemperature above mean air temperature (Dtcmin ) for Trivandrum is9 K and for Cairns is 6 K. Thus performance rating of same roof intwo different locations will be different. If the peak ceiling
temperature is 37 �C and mean air temperature is 27 �C (thedifference between two is 10 K), the index is calculated fromequation (24) as follows,
TPI�ðTrivandrumÞ ¼ 25� 1025� 9
� 100 ¼ 93:75%
TPI�ðCairnsÞ ¼ 22� 1022� 6
� 100 ¼ 75%
With high air speed in humid climate the comfort temperaturewould be three or four degrees above still air value [26]. Conse-quently, air movement due to a fan could be accounted by raisingthe upper limit thermal neutrality to 3 K. At terrestrial temperaturethe emissivity of internal surfaces of the room would be practicallynot less than 90% [27]. The radiant exchange within an enclosurewith surfaces of high emissivity is practically the same as if allsurfaces were thermally black owing to the rapid damping out of
C. Kabre / Building and Environment 45 (2010) 727–738 737
reflected energy [3] p. 378. Consequently, colour of internalsurfaces need not be accounted in the calculations.
The new thermal performance index (TPI*) is calculated fora number of roofs common in India and Australia [28]. Thermalperformance of ten examples is presented, case no. 1–5 in Trivan-drum (India), Fig. 8 and case no. 6–10 in Cairns (Australia), Fig. 9.First sinusoidal characteristic of a given roof section is determinedand then the sinusoidal temperature response is calculated, fromwhich the new thermal performance index (TPI*) is estimated.
The new thermal performance index (TPI*) of tile roof inTrivandrum is improved from 0% to 110.18% by simply addingtimber ceiling with ventilated attic space (case 2). While as thenew thermal performance index (TPI*) of concrete roof isimproved from 54.06% to 116.75% by adding tiles over the roof toshade (case 5). Fig. 9 illustrates some of the tile roofs (lightconstruction) in Australian houses. Tile roof with attic space andceiling board provides better performance when treated withdifferent insulation (resistive and or reflective). The new thermalperformance index (TPI*) of tile roof with reflective attic space is108.75% (case 8) and an addition of bulk insulation of 2R improvesit to 112.7% (case 10).
Here it is relevant to mention that the surface of opaque roofingmaterial has three properties determining behaviour with respectto radiant heat exchange, namely its absorptivity, reflectivity andemissivity. Radiation impinging on roof surface may be absorbed orreflected, being fully absorbed by a perfectly black surface and fullyreflected by a perfect reflector. The emissivity is the relative powerof a material to emit radiant energy. For any specific wavelength,absorptivity and emissivity are numerically equal, but both mayvary for different wavelengths.
The magnitude of sol-air temperature is influenced by factorswithin the designer’s control: absorbance and surface air conduc-tance (see equation (3)). The absorptivity decreases and thereflectivity increases with the lightness of colour. But colour doesnot indicate the behaviour of a surface with respect to longer waveradiation. Black and white paints have different absorptivities forsolar radiation and a black surface becomes much more heated onexposure to the sun. But the long wave emissivities of the twocolours are equal.
Whitewash surface ¼ absorptivity of 0:1� 0:3
for shortwave radiation
¼ emissivity of 0:95 for longwave lengths
This is a good radiator, readily losing heat to colder surfaces, andat the same time is a good reflector for solar radiation.
6. Conclusions and further development
Building component properties may be interpreted as ‘‘low-level’’ performance indicators, whereas room performancedescriptions may be interpreted as ‘‘high-level’’ behavioural prop-erties [29]. Thermo-physical properties (for example U value,shading coefficient) may be defined as attributes of discretecomponents whereas energy performance (for example environ-mental temperature, heat gain or loss) may refer to room proper-ties. Furthermore, simple and ‘user-friendly’ indices may be derivedon the basis of these properties to encourage energy efficientdesign, for instance five star energy efficiency ratings for windowsand dwellings.
Although the new thermal performance index (TPI*) is devel-oped for specific conditions prevalent in the warm humid tropics inunconditioned and acclimatised environment. The new thermalperformance index (TPI*) is potentially applicable to any complex
situation. The future development of the the new thermal perfor-mance index (TPI*) is planned along the following lines:
� Integrate other parameters: change in ventilation rate, colour,cloud cover, diffuse radiation etc. and perform a parametricstudy.� Widen the scope of application to other climatic regimes and
conditioned environment.� Validate the calculation results with the simulation software
such as Autodesk� Ecotect� (rc2) 5.6 and with fieldexperimentation.
Acknowledgements
The author would like to thankfully acknowledge the financialassistance of AusAID (Australian Agency for InternationalDevelopment) for this research as part of her PhD course in theUniversity of Queensland. She also thankfully acknowledgesDr. Richard Hyde, Professor, Faculty of Architecture, Design andPlanning, University of Sydney and Dr. S. V. Szokolay, Honoraryreader, Department of Architecture, University of Queensland fortheir supervision in this research. Finally special thanks must begiven to Mr. Tapan Kumar Ghoshal, a mechanical engineer for hisextensive support in this research.
References
[1] Kabre C. Contemporary roofs in the warm-humid tropics of India. In:Proceeding of the 16th International Passive and Low Energy Architecture(PLEA) conference, Brisbane, PLEA International in assoc. with the Dept ofArchitecture, the Univ. of Queensland, Brisbane; 1999. p. 387–392.
[2] Munro AF, Chrenko FA. The effect of radiation from the surroundings onsubjective impressions of freshness. Journal of Hygiene 1949;47:288–96.
[3] Chrenko FA. Heated ceilings and comfort. Journal of Heating and VentilatingEngineers 1953;20(209):375–96.
[4] McNall Jr PE, Biddison RE. Thermal and comfort sensations of sedentarypersons exposed to asymmetric radiant fields. ASHRAE Transactions1970;76(1):123.
[5] Griffiths IS, McIntyre DA. Subjective response to overhead thermal radiation.Human Factors 1974;16(3):415–22.
[6] Fanger PO, Banhidi L, Olesen BW, Langkilde G. Comfort limits for heatedceilings. ASHRAE Transactions 1980;86:141–56.
[7] ASHRAE. Fundamentals handbook (SI). New York: American Society of Heat-ing, Refrigerating and Air-Conditioning Engineers; 2001.
[8] Koenigsberger O, Lynn R. Roofs in warm and humid tropics. Paper Architec-tural Association, no. 1. London: Lund Humphries for the Architectural Asso-ciation; 1965.
[9] Bedford T. Environmental warmth and its measurement. M.R.C. War Memo-randum. London: HMSO; 1940 (17).
[10] Chandra P. Rating of wall and roof sections – thermal considerations. Buildingand Environment 1980;15:245–55.
[11] Suman BM, Saxena BK. Role of roof treatment in thermal design of buildings.Architectural Science Review 1992;35:111–4.
[12] BIS. Handbook of functional requirements of buildings (other than industrialbuilding) SP:41(S&T). New Delhi: Bureau of Indian Standard; 1987.
[13] Auliciems A. Psycho-physiological criteria for global thermal zones of buildingdesign. International Journal of Biometeorology 1982;26(Suppl.):69–86.
[14] Nicol F, Roaf S. Pioneering new indoor temperature standards. Energy andBuildings 1996;23:169–74.
[15] de Dear R, Brager G, Cooper D. Developing an adaptive model of thermalcomfort and preference, final report ASHRAE RP-884. Sydney: MacquarieResearch Ltd. Macquarie University. Available from: http://aws.mq.edu.au/rp-884/ashrae_rp884_home.html; 1997.
[16] Danter E. Periodic heat flow characteristics of simple walls and roofs. Journalof Heating and Ventilating Engineers 1960 July:136–46.
[17] IHVE guide book A. London: Institution of Heating and Ventilating Engineers;1970.
[18] Mackey CO, Wright LT. Summer comfort factors as influenced by the thermalproperties of building materials. ASHVE Transactions Heating, Piping & ACSection 1943;49:148–74.
[19] Rao KR, Ballantyne ER. Some investigation on the sol-air temperature concept,no. 27. Melbourne: Division of Building Research Technical Paper; 1970.
[20] Loudon AG. Summertime temperatures in buildings. Garston Watford; 1968.[21] Szokolay SV. Personal note, 17 October 1997.[22] Szokolay SV. Personal note, 20 May 1999.

C. Kabre / Building and Environment 45 (2010) 727–738738
[23] ANSI/ASHRAE 55. Thermal environmental conditions for human occupancy,ASHRAE Standard an American National Standard. American Society ofHeating, Refrigerating and Air-Conditioning Engineers Inc.; 1992.
[24] CIBSE. Section A5: thermal response of buildings. In: CIBSE guide A: designdata. 4th ed. London: The Chartered Institution of Building Services; 1979.
[25] Szokolay SV. Introduction to architectural science: the basis of sustainabledesign. Oxford: Architectural Press, Elsevier; 2008. p. 18.
[26] Nicol F. Climate and thermal comfort in India. In: Krishan A, Baker N,Yannas S, Szokolay SV, editors. Climate responsive architecture: a designhandbook for energy efficient buildings. New Delhi: Tata McGraw-HillPublishing Company Limited; 2001. p. 66. ch. 3.
[27] Koenigsberger OH, Ingersoll TG, Mayhew A, Szokolay SV. Manual of tropicalhousing and building, Part one: climatic design. 3rd ed. , London: LongmanGroup Ltd; 1974. p. 73.
[28] Kabre C. Computer aided design of climate responsive dwelling (roofs) in theclimatic and technological context of India and Australia. Ph.D. thesis,Department of Architecture, University of Queensland, Brisbane, Australia,2000.
[29] Mahdavi A. ‘‘Open’’ simulation environments: a ‘‘preference-based’’approach. In: Proceedings of the 5th International Conference onComputer Aided Architectural Design Futures 93, North-Holland. US: CMU;1993. p. 195–214.