Embed Size (px)
Citation preview
LUND UNIVERSITY
PO Box 117221 00 Lund+46 46-222 00 00
A new model for CO-absorption of concrete structures. CO-cycle in cement andconcrete Part 7: Models for CO-absorption.
Nilsson, Lars-Olof
2011
Link to publication
Citation for published version (APA):Nilsson, L-O. (2011). A new model for CO₂-absorption of concrete structures. CO₂-cycle in cement and concretePart 7: Models for CO₂-absorption. (Report TVBM-3158; Vol. TVBM-3158). Building Materials, LTH, LundUniversity.
Total number of authors:1
General rightsUnless other specific re-use rights are stated the following general rights apply:Copyright and moral rights for the publications made accessible in the public portal are retained by the authorsand/or other copyright owners and it is a condition of accessing publications that users recognise and abide by thelegal requirements associated with these rights. • Users may download and print one copy of any publication from the public portal for the purpose of private studyor research. • You may not further distribute the material or use it for any profit-making activity or commercial gain • You may freely distribute the URL identifying the publication in the public portal
Read more about Creative commons licenses: https://creativecommons.org/licenses/Take down policyIf you believe that this document breaches copyright please contact us providing details, and we will removeaccess to the work immediately and investigate your claim.
CO2-cycle in cement and concrete Part 7: Models for CO2-absorption.
A new model for CO2-absorption of concrete structures
Lars-Olof Nilsson
Funded by the Swedish Consortium for Financing Basic Research in the Concrete Field
LUND INSTITUTE OF TECHNOLOGY LUND UNIVERSITY
Division of Building Materials
Report TVBM-3158 Lund 2011

ISRN LUTVDG/TVBM--10/3158--SE(1-32) ISSN 0348-7911 TVBM Lund Institute of Technology Telephone: 46-46-2227415 Division of Building Materials Telefax: 46-46-2224427 Box 118 www.byggnadsmaterial.lth.se SE-221 00 Lund, Sweden

2
List of contents
1 Background......................................................................................................................... 4
2 Assumptions and definitions .............................................................................................. 5 2.1 Assumptions/simplifications ............................................................................................ 5
2.2 Definition of material properties ...................................................................................... 6 2.2.1 Diffusion coefficient for CO2 in concrete ................................................................. 6 2.2.2 Resistance to CO2-diffusion of a surface cover......................................................... 6
2.2.3 Amount of CO2 bound in a unit volume of concrete ................................................. 7 3 Model for the depth of carbonation .................................................................................... 8
3.1 Effect of a surface coating ................................................................................................ 9 4 The amount of CO2 bound in concrete ............................................................................. 11 5 The diffusion coefficient for CO2 ..................................................................................... 14
6 Model for CO2-absorption ................................................................................................ 15 7 Calibration/ verification.................................................................................................... 16
7.1 Calibration against the Swedish concrete cover standard .............................................. 16 7.2 Calibration against Cementa’s field exposure data at Smöjen ....................................... 17 7.3 Verification against field data in the project .................................................................. 21
7.4 Conclusions on the calibration ....................................................................................... 22 8 CO2-absorption in different types of concrete structures ................................................. 23
8.1 Indoor structures ....................................................................................................... 23 8.2 Slab-on-grade ........................................................................................................... 24 8.3 Outdoor structures .................................................................................................... 24
8.4 Bridges...................................................................................................................... 24 8.5 Summary......................................................................................................................... 25
References ................................................................................................................................ 26
APPENDIX – calculations for different structures .................................................................. 28
1 Indoor structures ........................................................................................................... 28 1.1 without surface coatings; ..................................................................................... 28 1.1.1 traditional concrete .............................................................................................. 28
1.1.2 self-desiccating concrete ...................................................................................... 28 1.2 with somewhat permeable surface coatings (paint) ............................................. 28
1.3 with almost impermeable surface coatings (PVC, linoleum, parquet, etc.) ......... 29 2 Slab-on-grade ............................................................................................................... 29
2.1.1 Slab-on-grade on mineral wool; traditional concrete............................................. 29
2.1.2 Slab-on-grade on mineral wool; self-desiccating concrete (SDC) ......................... 29 2.2 Slab-on-grade on expanded polystyrene (EPS) .......................................................... 29
2.3 Slab-on-grade on coarse drainage .............................................................................. 30 2.4 Slab-on-grade on sand ................................................................................................ 30
3 Outdoor structures ........................................................................................................ 31
3.1 exposed to rain ..................................................................................................... 31 3.2 sheltered from rain ............................................................................................... 31
4 Bridges.......................................................................................................................... 31 4.1 parts exposed to rain ............................................................................................ 31 4.2 parts sheltered from rain ...................................................................................... 32

3
4
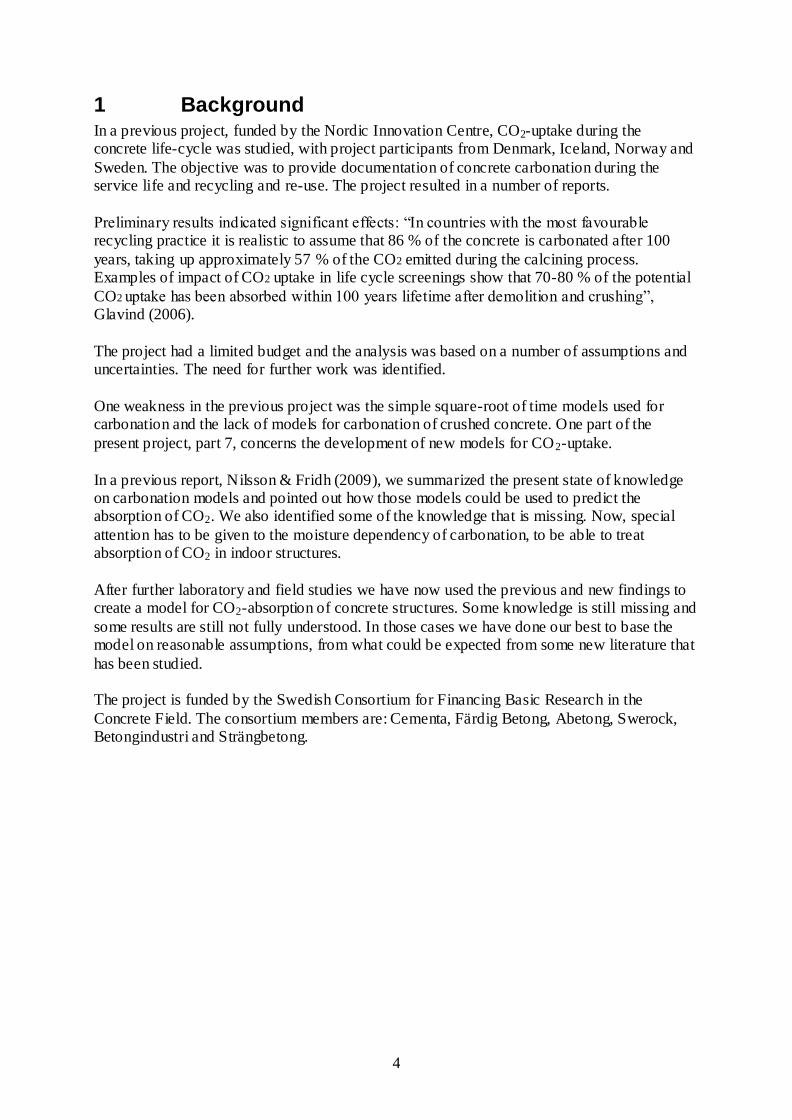
1 Background In a previous project, funded by the Nordic Innovation Centre, CO2-uptake during the concrete life-cycle was studied, with project participants from Denmark, Iceland, Norway and
Sweden. The objective was to provide documentation of concrete carbonation during the service life and recycling and re-use. The project resulted in a number of reports.
Preliminary results indicated significant effects: “In countries with the most favourable recycling practice it is realistic to assume that 86 % of the concrete is carbonated after 100
years, taking up approximately 57 % of the CO2 emitted during the calcining process. Examples of impact of CO2 uptake in life cycle screenings show that 70-80 % of the potential
CO2 uptake has been absorbed within 100 years lifetime after demolition and crushing”, Glavind (2006).
The project had a limited budget and the analysis was based on a number of assumptions and uncertainties. The need for further work was identified.
One weakness in the previous project was the simple square-root of time models used for carbonation and the lack of models for carbonation of crushed concrete. One part of the
present project, part 7, concerns the development of new models for CO2-uptake.
In a previous report, Nilsson & Fridh (2009), we summarized the present state of knowledge on carbonation models and pointed out how those models could be used to predict the absorption of CO2. We also identified some of the knowledge that is missing. Now, special
attention has to be given to the moisture dependency of carbonation, to be able to treat absorption of CO2 in indoor structures.
After further laboratory and field studies we have now used the previous and new findings to create a model for CO2-absorption of concrete structures. Some knowledge is still missing and
some results are still not fully understood. In those cases we have done our best to base the model on reasonable assumptions, from what could be expected from some new literature that
has been studied. The project is funded by the Swedish Consortium for Financing Basic Research in the
Concrete Field. The consortium members are: Cementa, Färdig Betong, Abetong, Swerock, Betongindustri and Strängbetong.
5
2 Assumptions and definitions
2.1 Assumptions/simplifications
In a previous report current models for carbonation were described. For the choice of
model(s) for predicting CO2-uptake by carbonation, these assumptions/simplifications seemed to be reasonable
1. Carbonation is modelled as a sharp carbonation front moving inwards, cf. figure 1. 2. The movement of the carbonation front is due to the combined effect of CO2
diffusing through the already carbonated layer and CO2 being bound by the carbonation reaction at the depth of the front.
3. The amount of CO2 bound per volume of concrete must be quantified in the model. 4. The amount of CO2 bound per weight of binder may not be a constant for a
particular binder; possible effects of degree of hydration and moisture level should
be part of a model and separately quantified. 5. The concrete is modelled as being homogenous, i.e. the higher binder content close
to the exposed surface is neglected. This assumption is on the “safe” side. 6. All CaO is assumed to be fixed in position, i.e. no movement of Ca2+ and OH--ions
is considered.
7. The CO2-binding capacity of carbonated concrete is set to be equal to 0, i.e. the diffusion of CO2 could be modelled as a steady-state transport process.
8. The diffusion coefficient for CO2 for a particular concrete should be modelled as a function of degree of hydration and moisture level.
9. The liberation of water from the carbonation reaction is neglected, i.e. does not
increase the moisture content and humidity. 10. The effect of a surface treatment, paint, wall paper etc., must be considered, at
least as an additional resistance to diffusion of carbon dioxide. These assumptions/simplifications should be agreed upon, within the project. The
assumptions are quantified in the next sections.
The consequences of these assumptions are several: a) The CO2-uptake is quantified by models that include assumptions that are well known
and frequently used in models for carbonation.
b) The historic moisture profiles of the concrete structure must be estimated, not only the equilibrium conditions; the effect of outdoor humidity variations and rain periods, and
the early drying of excess moisture, should be considered to some extent. This is, however, neglected due to lack of information.
c) The profiles of degree of hydration, originating from the time required for the early
drying of the surface regions of the concrete structure, should be considered to some extent. This is, however, neglected due to lack of information.
d) The significance of these effects should be smaller and smaller with time, i.e. with larger depths of carbonation.

6
Fig. 1 An example of the measured (left) degree of carbonation as a function of depth, Möller (1994), and the corresponding CO3-profile in a simplified model (right)
2.2 Definition of material properties
The model includes a few important and decisive material properties. They are defined here in detail.
2.2.1 Diffusion coefficient for CO2 in concrete
The diffusion coefficient for CO2-diffusion in concrete is defined by the flux of CO2-gas
through an infinitesimal layer of concrete
caircairc
air
c
COCOmm
kgCO
s
m
mm
kgCO
sm
m
sm
kgCO
x
cDJ
3
2
2
3
2
3
2
2
22 (1)
where mc refers to the depth and cross-section of concrete. The concentration c of CO2 is given as an amount in a unit volume of air. The amount could of course be given in moles as well.
The diffusion coefficient 2CO
D has, as usual, the dimension m2/s, but when using literature
data it is important to clarify how the concentration of CO2 is defined.
2.2.2 Resistance to CO2-diffusion of a surface cover
The resistance 2CO
R to CO2-diffusion of a thin layer, i.e. a surface cover, is defined by the flux
of CO2-gas through the layer
s
m
m
kgCO
sm
m
m
kgCO
sm
kgCO
R
cJ
airc
air
aircCO
CO 3
2
2
3
3
2
2
2
2
2 (2)
The resistance 2CO
R has the dimension s/m.

7
2.2.3 Amount of CO2 bound in a unit volume of concrete
A model for carbonation, and for CO2-absorption, should be a solution to a mass-balance
equation for CO2. A general mass-balance equation is
ccc
bCOc
msm
kgCO
sm
kgCO
t
c
x
J
t
c2
2
3
22 (3)
where cc is the concentration of CO2 in a unit volume of concrete and cb is the amount of bound CO2, also in a unit volume of concrete. In this mass-balance equation the amount of
bound CO2 cb will later be called a, the amount of CO2 bound in a unit volume of concrete.

8
3 Model for the depth of carbonation With these assumptions, and definitions, a carbonation model may look like the one in figure 2.
Fig. 2 A simple model for carbonation, based on the assumptions 1-10 The flux of diffusing CO2 is based on Equation (1)
2
22
),(
CO
COCOR
c
dx
dcRHDJ (4)
where the diffusion coefficient depends on humidity and degree of hydration. The concentration difference over the carbonated layer with thickness XCO3 is Δc = c-0 = c. The resistance to diffusion of CO2 of the carbonated layer is RCO2, which is given by
3
2
2 0 )(),(
COXx
xCO
COxxRHD
dxR
(5)
In the model in figure 2 the mass balance equation of CO2 at the depth of carbonation XCO3 will be
332
)(COCOCO
dXXadtJ [kg CO2/m2] (6)
where dt is a short time step [s] during which the carbonation front advances dXCO3 [m]. This
can also be written
)()(323
23
COCOCO
COCO
XaR
c
Xa
J
dt
dX
(7)
After integration, the depth of carbonation is
tt
t Xx
xCO
CO
Xx
xCOCO
CO
CO
xxRHD
dxtXa
cdXX
'
0'
0
0 3
2
3
3
33
)(),())((
(8)
JCO2
CO3
Xc
dxc
a = [CaO]
c
Diffusion of CO2:
Reaction of CO2:
x
JCO2
CO3
Xc
dxc
a = [CaO]
c
Diffusion of CO2:
Reaction of CO2:
x
9
The “problem” with this model is that the XCO3 appears on both sides of the equality sign! Consequently, the equation must be solved numerically, by dividing the carbonated layer into
small slices with a thickness of dx and by taking small time-steps dt. During each time-step, the moisture distribution RH(x) must be known.
If further assumptions are made, the model will of course become much more simple. If the
humidity RH, the degree of hydration and the amount a of CO2 bound in a unit volume of
concrete are assumed to be constant throughout the carbonated layer, the depth of carbonation will be
n
CO
CO
COt
tt
RHa
cRHDX
0
)(
)(2
2
2
3 (9)
where the exponent n depends on the humidity conditions and can be quantified from exposure data or from a more elaborated model. That was done by CEB (2000). A value of n = 0.17 was found for surfaces exposed to rain and n ≈ 0 for surfaces protected from rain,
Nilsson & Rodhe (1997a).
The parameters in this model are, theoretically, possible to quantify from laboratory and field measurements but very good data is required. This is further discussed in sections 4, 5 and 7.
3.1 Effect of a surface coating
A coating at the concrete surface will add a resistance to diffusion of carbon dioxide but will not change the carbonation reaction.
Performing the same kind of derivation as in equations (4)-(9), but adding a resistance RCO2 to the resistance against diffusion of CO2 of the carbonated layer with a thickness of XCO3, will
give a slightly different equation for the depth of carbonation
22
2
2
223
)()(
)(2)(
2
COCO
CO
CO
COCOCORRHD
RHa
tcRHDRRHDX
(10)
if we set n=0, which is OK for not too wet structures or structures that are not exposed to rain, CEB (2000).
The consequence of a surface coating is that the time-dependency of the carbonation process
no longer follows the square-root law. An example is shown in figure 3. An example of the effect of the resistance of the surface coating on 50 years of carbonation is
shown in figure 4. Surface resistances that are changing the rate of carbonation between 10 and 90 % have a magnitude of somewhere between R=100000 s/m and R=2000000 s/m.

10
Fig. 3 An example of the carbonation process for a concrete structure with a surface coating.
Indoor concrete with w/c=0.8 and a surface resistance R=1∙106s/m.
Fig. 4 An example of the effect of the resistance of a surface coating on carbonation after 50
years. Indoor concrete with w/c=0.6 and different surface resistances.
0
5
10
15
20
25
30
0 2 4 6 8 10
De
pth
of
carb
on
ati
on
[m
m].
A
mo
un
t o
f a
bso
rbe
d C
O2
[kg
CO
2/
m2]
√year
Depth, XCO3
Amount (kgCO2/m2)
0
10
20
30
40
50
60
0,0E+00 5,0E+05 1,0E+06 1,5E+06 2,0E+06
De
pth
of
carb
on
ati
on
[m
m]
Surface resistance R [s/m]
11
4 The amount of CO2 bound in concrete The aCO2-value has already been shown to include only one uncertain parameter, the degree of carbonation that has to be measured for a set of typical binders and humidity conditions.
The amount of CO2 bound in a unit volume of concrete is
CaO
COCO
COM
Mx
CaO
CaO
C
CaOCxa
23
2
)()( [kg CO2/m3] (11)
or
CaO
CO
RHaaCaCOM
MkkkCxa
2
2 ,,,)(
[kg CO2/m3] (12)
where C is the cement content, CaO/CPC (=ka,C) is the amount of CaO per weight of Portland
cement, (CaO)CO3/CaO (=ka,α·ka,RH) is the degree of carbonation and M is the molar weight.
The degree of carbonation consist of two factors ka,α·ka,RH where the first one depends on the egree of hydration of the binder and the last one describes the moisture dependency of the carbonation reaction. The amount a(x) is marked as being dependent on the depth x, since the
degree of carbonation may be different at different depths.
The parameter CaO/C (=ka,C) follows from the binder composition, where the amount of CaO is only the portion that is possible to carbonate in a concrete. In a Portland cement this factor usually is in the order of 0.60-0.65. For a blended cement this factor must be multiplied with a
factor CPC/C that is the portion of Portland cement clinker in the cement.
The degree of carbonation (CaO)CO3/CaO (=ka,α·ka,RH) is the extent to which the available CaO actually is carbonated. The first factor is usually assumed to represent all of the CaO in the hydrated part of the cement. That factor is simply assumed equal to the degree of
hydration
,ak (13)
The moisture dependency of the degree of carbonation is not well known, however. From a
literature search some examples of actual measurements have been found. In the project some measurements have been done in indoor structures that could be used to estimate this parameter.
Goodbrake et al (1979) measured the degree of carbonation on paste samples of C2S and C3S
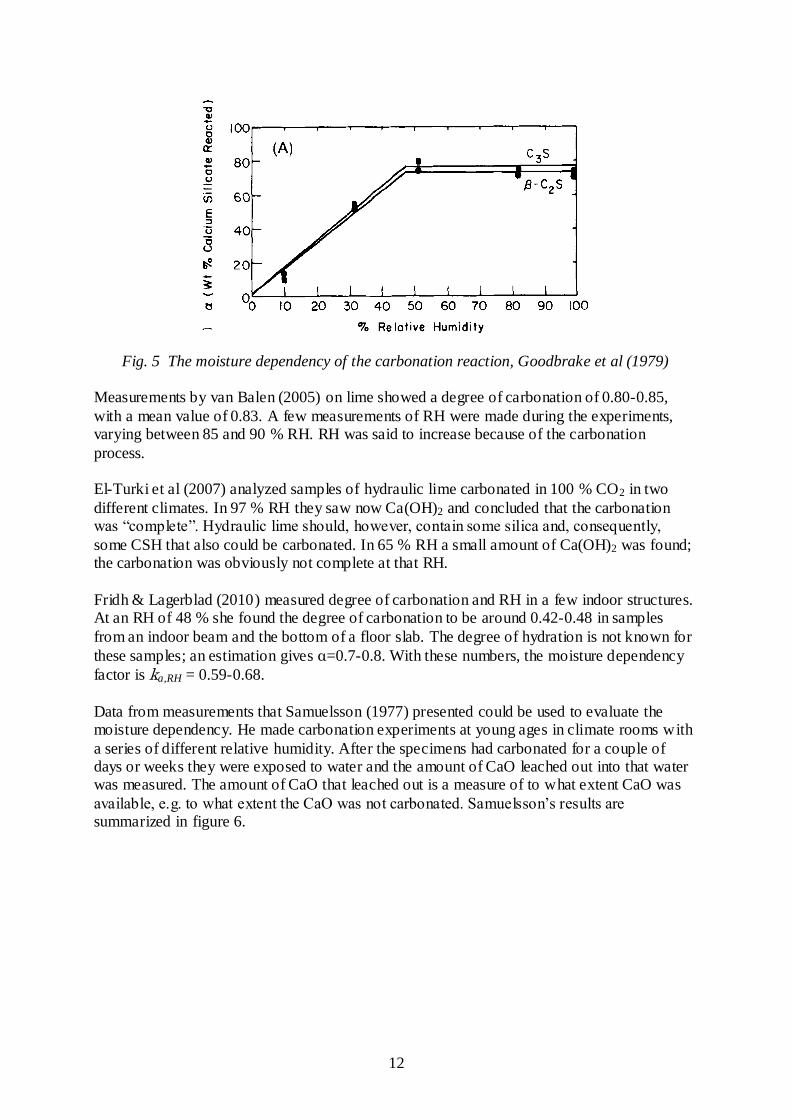
after carbonation in various humidity, from 10 % RH. Their results are shown in figure 5. They concluded that the relationship between the degree of carbonation and RH is linear from 0 at 0 % RH up to 0.68-0.73 at 50 % RH and then constant in the interval 50-100 % RH.
They did not report the degree of hydration. It may very weel be around 0.7, i.e. the moisture
dependency factor would be 1.0 in the RH-interval 50-100 %.
12
Fig. 5 The moisture dependency of the carbonation reaction, Goodbrake et al (1979) Measurements by van Balen (2005) on lime showed a degree of carbonation of 0.80-0.85,
with a mean value of 0.83. A few measurements of RH were made during the experiments, varying between 85 and 90 % RH. RH was said to increase because of the carbonation
process. El-Turki et al (2007) analyzed samples of hydraulic lime carbonated in 100 % CO2 in two
different climates. In 97 % RH they saw now Ca(OH)2 and concluded that the carbonation was “complete”. Hydraulic lime should, however, contain some silica and, consequently,
some CSH that also could be carbonated. In 65 % RH a small amount of Ca(OH)2 was found; the carbonation was obviously not complete at that RH.
Fridh & Lagerblad (2010) measured degree of carbonation and RH in a few indoor structures. At an RH of 48 % she found the degree of carbonation to be around 0.42-0.48 in samples
from an indoor beam and the bottom of a floor slab. The degree of hydration is not known for
these samples; an estimation gives α=0.7-0.8. With these numbers, the moisture dependency
factor is ka,RH = 0.59-0.68.
Data from measurements that Samuelsson (1977) presented could be used to evaluate the moisture dependency. He made carbonation experiments at young ages in climate rooms with
a series of different relative humidity. After the specimens had carbonated for a couple of days or weeks they were exposed to water and the amount of CaO leached out into that water was measured. The amount of CaO that leached out is a measure of to what extent CaO was
available, e.g. to what extent the CaO was not carbonated. Samuelsson’s results are summarized in figure 6.
13
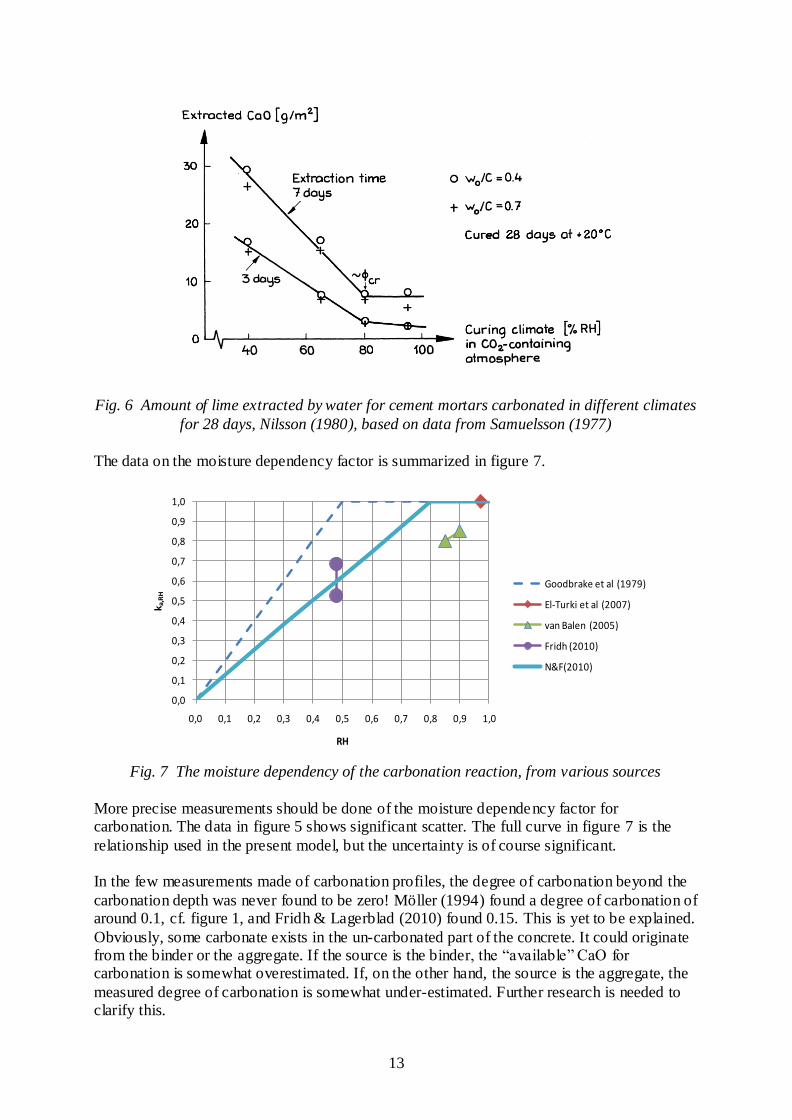
Fig. 6 Amount of lime extracted by water for cement mortars carbonated in different climates
for 28 days, Nilsson (1980), based on data from Samuelsson (1977)
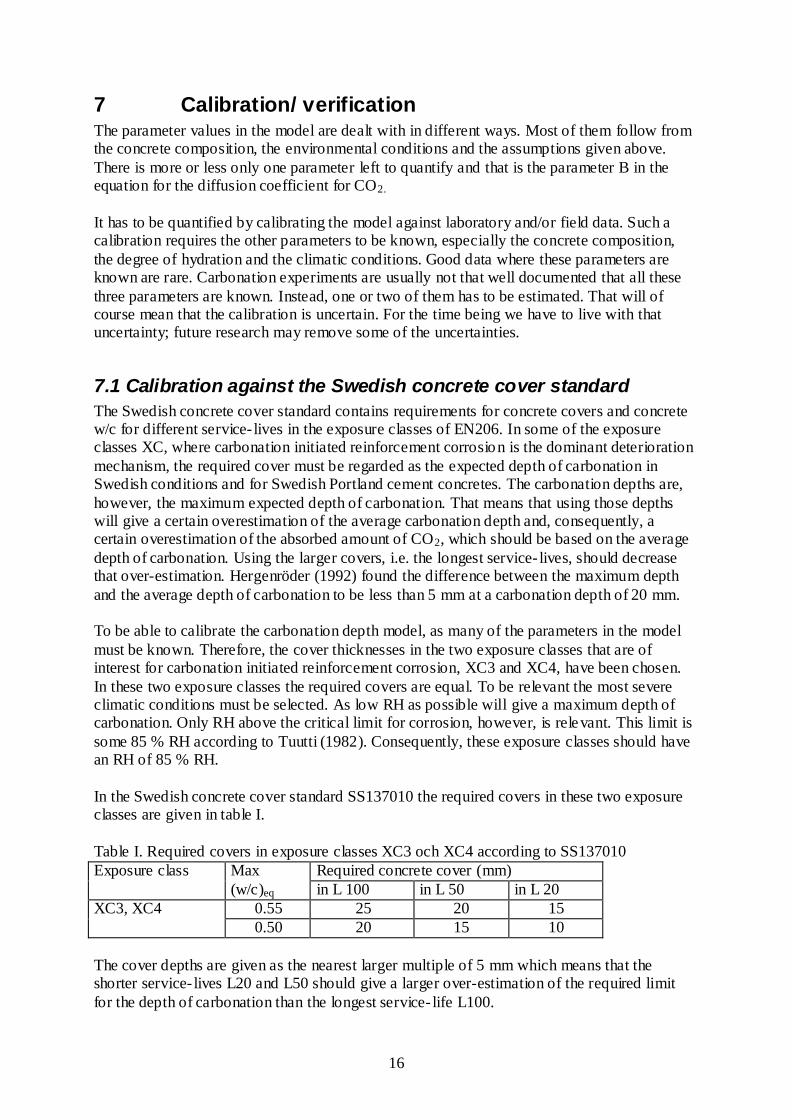
The data on the moisture dependency factor is summarized in figure 7.
Fig. 7 The moisture dependency of the carbonation reaction, from various sources
More precise measurements should be done of the moisture dependency factor for carbonation. The data in figure 5 shows significant scatter. The full curve in figure 7 is the
relationship used in the present model, but the uncertainty is of course significant. In the few measurements made of carbonation profiles, the degree of carbonation beyond the
carbonation depth was never found to be zero! Möller (1994) found a degree of carbonation of around 0.1, cf. figure 1, and Fridh & Lagerblad (2010) found 0.15. This is yet to be explained.
Obviously, some carbonate exists in the un-carbonated part of the concrete. It could originate from the binder or the aggregate. If the source is the binder, the “available” CaO for carbonation is somewhat overestimated. If, on the other hand, the source is the aggregate, the
measured degree of carbonation is somewhat under-estimated. Further research is needed to clarify this.
0,0
0,1
0,2
0,3
0,4
0,5
0,6
0,7
0,8
0,9
1,0
0,0 0,1 0,2 0,3 0,4 0,5 0,6 0,7 0,8 0,9 1,0
k a,R
H
RH
Goodbrake et al (1979)
El-Turki et al (2007)
van Balen (2005)
Fridh (2010)
N&F(2010)

14
5 The diffusion coefficient for CO2
The diffusion coefficient could be quantified together with the a-value by equation (7) in cases where the exponent n = 0. Alternatively, the diffusion coefficient could be estimated
from an equation from literature. Numerous such equations do exist but the data behind them is rare. Here, the one derived for old German cements, Wierig (1964), has been used
5105.4
)(12
xRHCBDCO
(14)
where C is the cement content, is the capillary porosity, B is a constant and the parenthesis
gives the humidity dependency. The factor for the humidity dependency is shown in figure 8.
Fig. 8 The moisture dependency of the diffusion coefficient for carbon dioxide according to
equation (14)
The capillary porosity is calculated as the capillary porosity of cement paste according to
Power’s model
cw
cw
/3 2.0
3 9.0/
(15)
where w/c is the water-cement ratio and α is the degree of hydration. To obtain the correct
capillary porosity the w/c must be based on the actual Portland cement content in the concrete, which could be different from the cement content, if the cement contains non-cementitious constituents such as limestone filler.
Now all the parameters, except one, in the carbonation model in equations (9) and (10) are
quantified. The remaining parameter B is determined by calibration in section 7.
0,0
0,2
0,4
0,6
0,8
1,0
1,2
0 0,1 0,2 0,3 0,4 0,5 0,6 0,7 0,8 0,9 1
DC
O2/D
0
RH

15
6 Model for CO2-absorption A model for absorption of carbon dioxide is now simple to derive, from the models for depth of carbonation in equations (9) or (10) and the amount aCO2 CO2 bound in a unit volume of
concrete. The CO2-uptake of a unit area of concrete will be
3
232 0)(
COXx
xCOCOCO
dxxaXm [kg CO2/m2] (16)
or, if a is assumed to be constant throughout the carbonated layer, simply
232 COCOCOaXm [kg CO2/m2] (17)
This model has been set up in an Excel sheet, including all the parameters mentioned above. The front sheet of this model is shown below.
ABSORPTION OF CO2 BY A CONCRETE STRUCTURE (input in grey-coloured cells only!)
Structure
INPUT OUTPUT. Logaritmic scale OUTPUT. Linear scale1 m2
Type of structure: (text) Depth of carbonation AND amount of absorbed CO2 vs. time Depth of carbonation AND amount of absorbed CO2 vs. time
Exposed Carbona- Uncarbonated Concrete: Cement type (text)
surface ted zone zone w/C 0,65 [0-1]
C 275 [kg/m3]
CaO/CPC 0,65 (portion of CaO in the Portland cement clinker)
cCO2 CPC/C 0,95 (0.95 in OPC, 0.78-0.80 in Byggcement, etc.)
RH α 0,80 (degree of hydration, 0.6-0.9)
Initial CO3/CaO 0,00 (mole ratio; of cement)
xCO3 Surface coating: (text)
Resistance, RCO2 0E+00 (s/m) 0
Degree of carbonation vs. depth = 0 - 1E4 (if none or mineral wool)
CO3/CaO =1E6 (if ceramic tiles, painted glass fiber net etc.)
1 Climate: =1E10 (if sealed or EPS-insulation)
CO2-conc, cCO2 6,0E-04 kgCO2/m3 air
=6E-4 (if normal air)
Humidity, RH 48 [%]
=20-50 (indoor air Depth of carbonation AND amount of absorbed CO2 vs. time:
=85 (outdoor air) user's selection:
=100-5T (slab-on-grade; T=T-diff. over heat insulation) Time (years) 1 2 5 10 20 50 100 75
Age exponent, n 0 (-) 0 Depth (mm) 8 12 18 26 37 58 82 71
=0 (protected from rain) Amount (kgCO2/m2) 0,6 0,8 1,2 1,7 2,5 3,9 5,5 4,8
0 =0.17 (exposed to rain)
Reference: Nilsson, L.-O. & (2011) CO2-cycle in cement and concrete. Part 7: Models for CO2-absorption. A new model for CO2-absorption of concrete structures. Report TVBM-3158, div. of Building Materials, University of Lund
CO2
0
10
20
30
40
50
60
70
80
90
0 2 4 6 8 10
Depth, XCO3
Amount (kgCO2/m2)
0
10
20
30
40
50
60
70
80
90
0 20 40 60 80 100
Time [years]
Depth, XCO3
Amount (kgCO2/m2)
year
16
7 Calibration/ verification The parameter values in the model are dealt with in different ways. Most of them follow from the concrete composition, the environmental conditions and the assumptions given above.
There is more or less only one parameter left to quantify and that is the parameter B in the equation for the diffusion coefficient for CO2.
It has to be quantified by calibrating the model against laboratory and/or field data. Such a calibration requires the other parameters to be known, especially the concrete composition,
the degree of hydration and the climatic conditions. Good data where these parameters are known are rare. Carbonation experiments are usually not that well documented that all these
three parameters are known. Instead, one or two of them has to be estimated. That will of course mean that the calibration is uncertain. For the time being we have to live with that uncertainty; future research may remove some of the uncertainties.
7.1 Calibration against the Swedish concrete cover standard
The Swedish concrete cover standard contains requirements for concrete covers and concrete w/c for different service- lives in the exposure classes of EN206. In some of the exposure classes XC, where carbonation initiated reinforcement corrosion is the dominant deterioration
mechanism, the required cover must be regarded as the expected depth of carbonation in Swedish conditions and for Swedish Portland cement concretes. The carbonation depths are,
however, the maximum expected depth of carbonation. That means that using those depths will give a certain overestimation of the average carbonation depth and, consequently, a certain overestimation of the absorbed amount of CO2, which should be based on the average
depth of carbonation. Using the larger covers, i.e. the longest service- lives, should decrease that over-estimation. Hergenröder (1992) found the difference between the maximum depth
and the average depth of carbonation to be less than 5 mm at a carbonation depth of 20 mm. To be able to calibrate the carbonation depth model, as many of the parameters in the model
must be known. Therefore, the cover thicknesses in the two exposure classes that are of interest for carbonation initiated reinforcement corrosion, XC3 and XC4, have been chosen.
In these two exposure classes the required covers are equal. To be relevant the most severe climatic conditions must be selected. As low RH as possible will give a maximum depth of carbonation. Only RH above the critical limit for corrosion, however, is relevant. This limit is
some 85 % RH according to Tuutti (1982). Consequently, these exposure classes should have an RH of 85 % RH.
In the Swedish concrete cover standard SS137010 the required covers in these two exposure classes are given in table I.
Table I. Required covers in exposure classes XC3 och XC4 according to SS137010
Exposure class Max
(w/c)eq
Required concrete cover (mm)
in L 100 in L 50 in L 20
XC3, XC4 0.55 25 20 15
0.50 20 15 10
The cover depths are given as the nearest larger multiple of 5 mm which means that the shorter service- lives L20 and L50 should give a larger over-estimation of the required limit
for the depth of carbonation than the longest service- life L100.
17
The concept ”(w/c)eq” must be seen as the water-binder ratio in a pure Portland cement concrete. When using other binders the (w/c)eq will be larger which will affect the capillary
porosity and the diffusion coefficient for CO2. For the calibration, the other parameters must be estimated. A very important parameter is the
degree of hydration, which appears both in the capillary porosity in the equation (9) for the diffusion coefficient for CO2, with an exponent of 4.5, and in the equation (11) for the degree
of carbonation. The degree of hydration for different concretes and different curing can be estimated from the data by Norling-Mjörnell (1997). The curing could of course vary but since the most severe climatic conditions for carbonation- induced corrosion should be a
climate with RH = 85 % and protection against rain, long-term curing in that climate should
be relevant. Data by Norling-Mjörnell (1997) gives an α = 0.79 and 0.75 for the two concretes in table I.
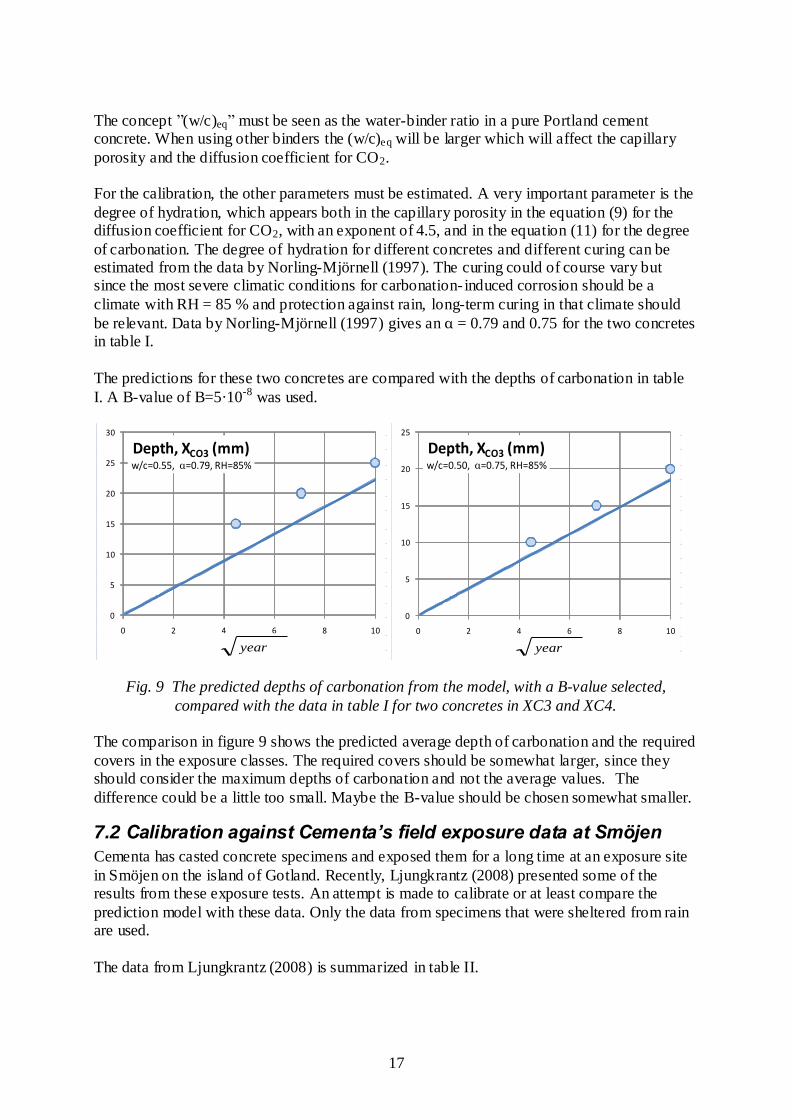
The predictions for these two concretes are compared with the depths of carbonation in table
I. A B-value of B=5·10-8 was used.
Fig. 9 The predicted depths of carbonation from the model, with a B-value selected,
compared with the data in table I for two concretes in XC3 and XC4. The comparison in figure 9 shows the predicted average depth of carbonation and the required
covers in the exposure classes. The required covers should be somewhat larger, since they should consider the maximum depths of carbonation and not the average values. The
difference could be a little too small. Maybe the B-value should be chosen somewhat smaller.
7.2 Calibration against Cementa’s field exposure data at Smöjen
Cementa has casted concrete specimens and exposed them for a long time at an exposure site
in Smöjen on the island of Gotland. Recently, Ljungkrantz (2008) presented some of the results from these exposure tests. An attempt is made to calibrate or at least compare the
prediction model with these data. Only the data from specimens that were sheltered from rain are used.
The data from Ljungkrantz (2008) is summarized in table II.
0
5
10
15
20
25
30
0 2 4 6 8 10
Depth, XCO3 (mm)w/c=0.55, α=0.79, RH=85%
year
0
5
10
15
20
25
0 2 4 6 8 10
Depth, XCO3 (mm)w/c=0.50, α=0.75, RH=85%
year
18
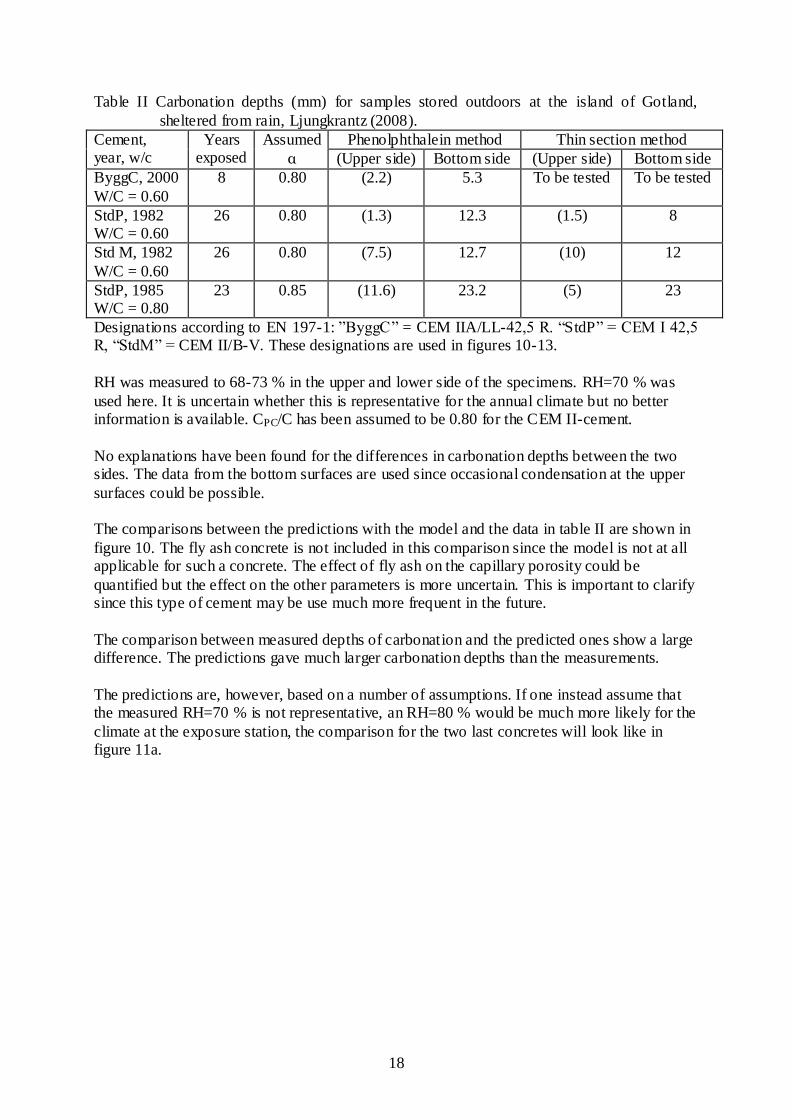
Table II Carbonation depths (mm) for samples stored outdoors at the island of Gotland,
sheltered from rain, Ljungkrantz (2008).
Cement, year, w/c
Years exposed
Assumed
α
Phenolphthalein method Thin section method
(Upper side) Bottom side (Upper side) Bottom side
ByggC, 2000
W/C = 0.60
8 0.80 (2.2) 5.3 To be tested To be tested
StdP, 1982 W/C = 0.60
26 0.80 (1.3) 12.3 (1.5) 8
Std M, 1982
W/C = 0.60
26 0.80 (7.5) 12.7 (10) 12
StdP, 1985 W/C = 0.80
23 0.85 (11.6) 23.2 (5) 23
Designations according to EN 197-1: ”ByggC” = CEM IIA/LL-42,5 R. “StdP” = CEM I 42,5 R, “StdM” = CEM II/B-V. These designations are used in figures 10-13.
RH was measured to 68-73 % in the upper and lower side of the specimens. RH=70 % was
used here. It is uncertain whether this is representative for the annual climate but no better information is available. CPC/C has been assumed to be 0.80 for the CEM II-cement.
No explanations have been found for the differences in carbonation depths between the two sides. The data from the bottom surfaces are used since occasional condensation at the upper
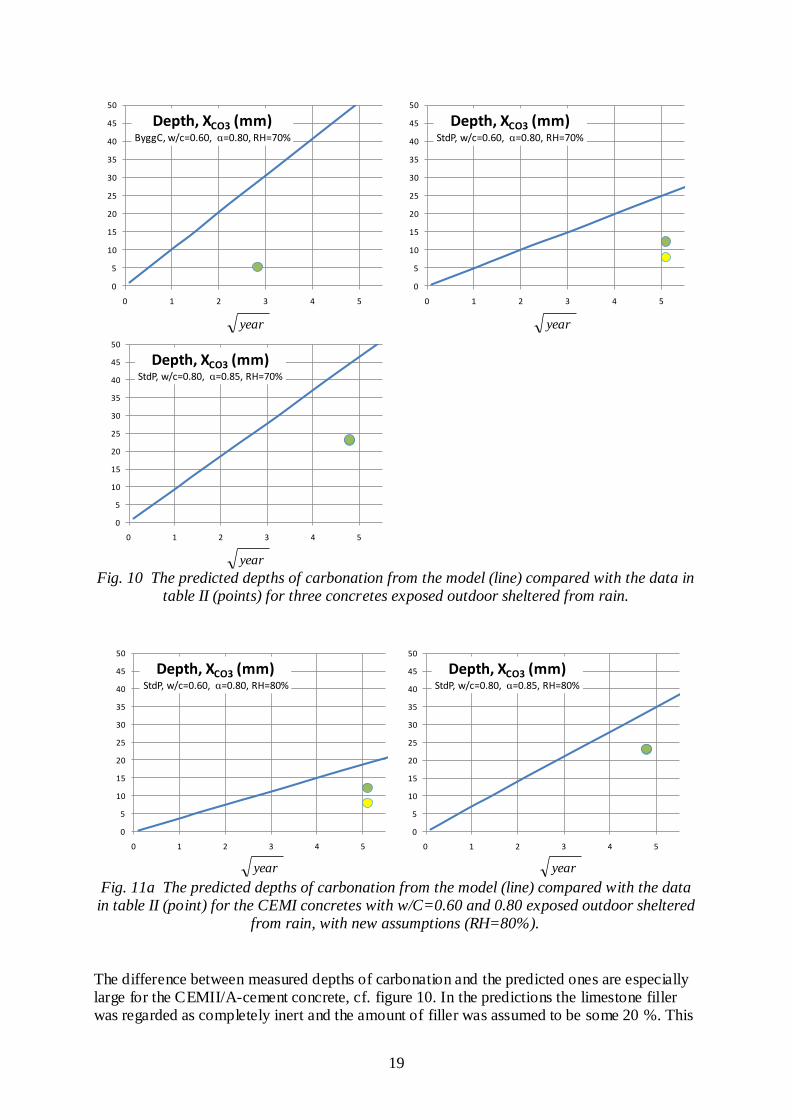
surfaces could be possible. The comparisons between the predictions with the model and the data in table II are shown in
figure 10. The fly ash concrete is not included in this comparison since the model is not at all applicable for such a concrete. The effect of fly ash on the capillary porosity could be
quantified but the effect on the other parameters is more uncertain. This is important to clarify since this type of cement may be use much more frequent in the future.
The comparison between measured depths of carbonation and the predicted ones show a large difference. The predictions gave much larger carbonation depths than the measurements.
The predictions are, however, based on a number of assumptions. If one instead assume that the measured RH=70 % is not representative, an RH=80 % would be much more likely for the
climate at the exposure station, the comparison for the two last concretes will look like in figure 11a.
19
Fig. 10 The predicted depths of carbonation from the model (line) compared with the data in
table II (points) for three concretes exposed outdoor sheltered from rain.
Fig. 11a The predicted depths of carbonation from the model (line) compared with the data in table II (point) for the CEMI concretes with w/C=0.60 and 0.80 exposed outdoor sheltered
from rain, with new assumptions (RH=80%).
The difference between measured depths of carbonation and the predicted ones are especially large for the CEMII/A-cement concrete, cf. figure 10. In the predictions the limestone filler was regarded as completely inert and the amount of filler was assumed to be some 20 %. This
0
5
10
15
20
25
30
35
40
45
50
0 1 2 3 4 5
Depth, XCO3 (mm)ByggC, w/c=0.60, α=0.80, RH=70%
0
5
10
15
20
25
30
35
40
45
50
0 1 2 3 4 5
Depth, XCO3 (mm)StdP, w/c=0.60, α=0.80, RH=70%
0
5
10
15
20
25
30
35
40
45
50
0 1 2 3 4 5
Depth, XCO3 (mm)StdP, w/c=0.80, α=0.85, RH=70%
0
5
10
15
20
25
30
35
40
45
50
0 1 2 3 4 5
Depth, XCO3 (mm)StdP, w/c=0.60, α=0.80, RH=80%
0
5
10
15
20
25
30
35
40
45
50
0 1 2 3 4 5
Depth, XCO3 (mm)StdP, w/c=0.80, α=0.85, RH=80%
year year
year
year year
20
may be quite unrealistic since the filler will have some reactivity which could decrease the
capillary porosity to some extent and the filler content may be much lower. The degree of hydration may also be larger than 0.80. On the other hand, the field data in table II seems
unrealistic; cf. the two top diagrams in figure 10. There is no major difference between the depths of carbonation in the two concrete with the same “w/c” = 0.60. This is strange and needs further analysis and research.
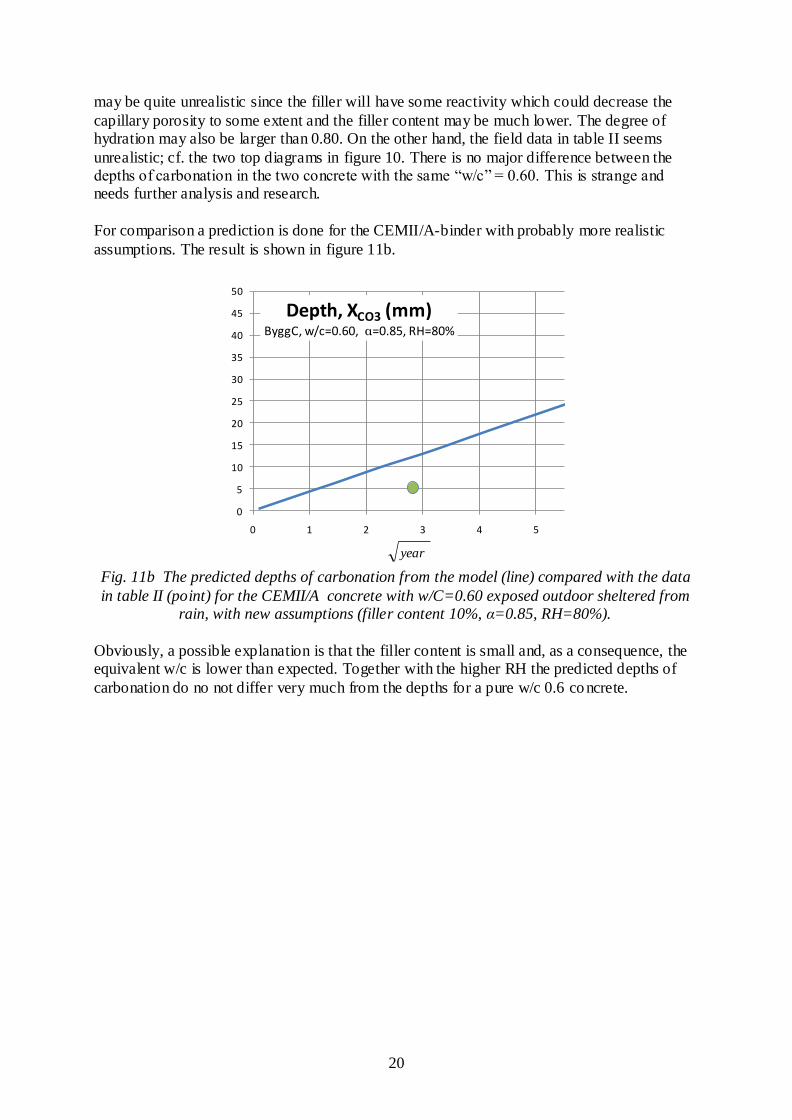
For comparison a prediction is done for the CEMII/A-binder with probably more realistic
assumptions. The result is shown in figure 11b.
Fig. 11b The predicted depths of carbonation from the model (line) compared with the data
in table II (point) for the CEMII/A concrete with w/C=0.60 exposed outdoor sheltered from rain, with new assumptions (filler content 10%, α=0.85, RH=80%).
Obviously, a possible explanation is that the filler content is small and, as a consequence, the equivalent w/c is lower than expected. Together with the higher RH the predicted depths of
carbonation do no not differ very much from the depths for a pure w/c 0.6 co ncrete.
0
5
10
15
20
25
30
35
40
45
50
0 1 2 3 4 5
Depth, XCO3 (mm)ByggC, w/c=0.60, α=0.85, RH=80%
year
21
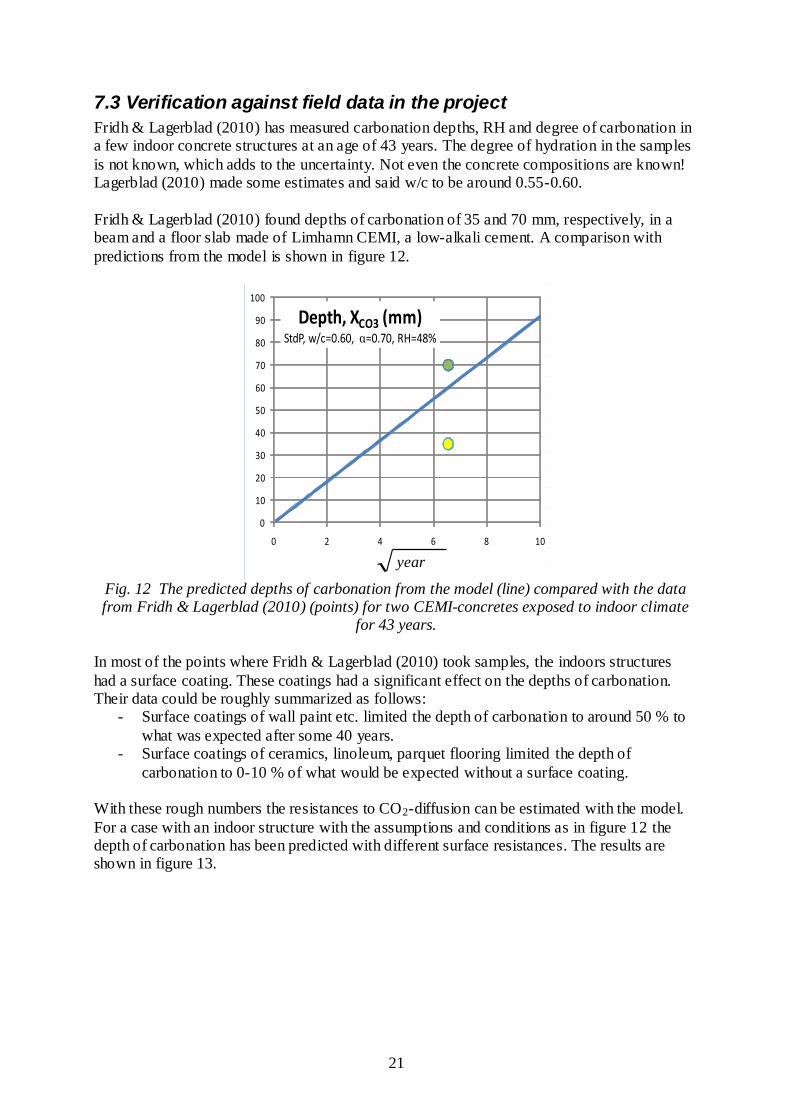
7.3 Verification against field data in the project
Fridh & Lagerblad (2010) has measured carbonation depths, RH and degree of carbonation in a few indoor concrete structures at an age of 43 years. The degree of hydration in the samples
is not known, which adds to the uncertainty. Not even the concrete compositions are known! Lagerblad (2010) made some estimates and said w/c to be around 0.55-0.60.
Fridh & Lagerblad (2010) found depths of carbonation of 35 and 70 mm, respectively, in a beam and a floor slab made of Limhamn CEMI, a low-alkali cement. A comparison with
predictions from the model is shown in figure 12.
Fig. 12 The predicted depths of carbonation from the model (line) compared with the data from Fridh & Lagerblad (2010) (points) for two CEMI-concretes exposed to indoor climate
for 43 years.
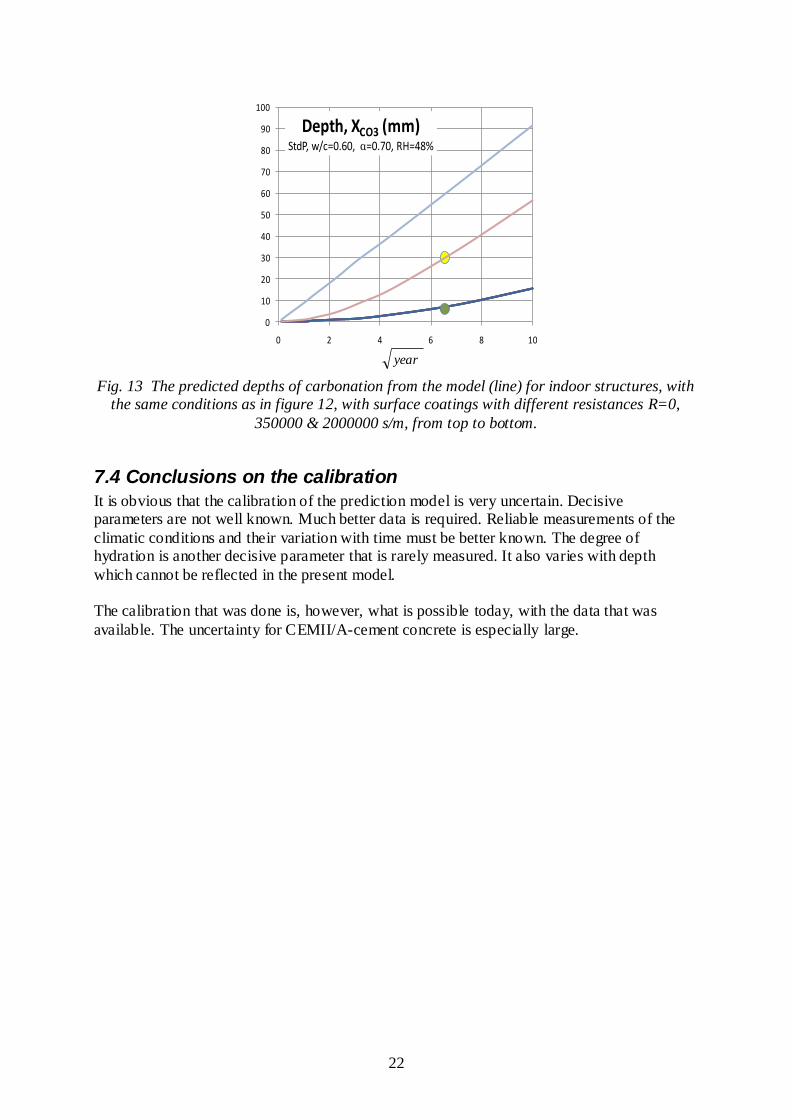
In most of the points where Fridh & Lagerblad (2010) took samples, the indoors structures
had a surface coating. These coatings had a significant effect on the depths of carbonation. Their data could be roughly summarized as follows:
- Surface coatings of wall paint etc. limited the depth of carbonation to around 50 % to
what was expected after some 40 years. - Surface coatings of ceramics, linoleum, parquet flooring limited the depth of
carbonation to 0-10 % of what would be expected without a surface coating. With these rough numbers the resistances to CO2-diffusion can be estimated with the model.
For a case with an indoor structure with the assumptions and conditions as in figure 12 the depth of carbonation has been predicted with different surface resistances. The results are shown in figure 13.
0
10
20
30
40
50
60
70
80
90
100
0 2 4 6 8 10
Depth, XCO3 (mm)StdP, w/c=0.60, α=0.70, RH=48%
year
22
Fig. 13 The predicted depths of carbonation from the model (line) for indoor structures, with
the same conditions as in figure 12, with surface coatings with different resistances R=0,
350000 & 2000000 s/m, from top to bottom.
7.4 Conclusions on the calibration
It is obvious that the calibration of the prediction model is very uncertain. Decisive parameters are not well known. Much better data is required. Reliable measurements of the
climatic conditions and their variation with time must be better known. The degree of hydration is another decisive parameter that is rarely measured. It also varies with depth
which cannot be reflected in the present model. The calibration that was done is, however, what is possible today, with the data that was
available. The uncertainty for CEMII/A-cement concrete is especially large.
0
10
20
30
40
50
60
70
80
90
100
0 2 4 6 8 10
Depth, XCO3 (mm)StdP, w/c=0.60, α=0.70, RH=48%
year
23
8 CO2-absorption in different types of concrete
structures The model gives the amount of carbon dioxide being absorbed as kgCO2/m2 concrete surface. This number can then be multiplied with the number of m2 concrete surface of each type of
structure and for relevant exposure in zones at these structures. Here the absorbed CO2 per m2 is calculated, with the model, for a number of structures.
The structures that are analyzed are
1. Indoor structures
1.1 without surface coatings 1.2 with somewhat permeable surface coatings (paint)
1.3 with almost impermeable surface coatings (PVC, linoleum, parquet, floor paint) 2. Slab-on-grade 2.1 on mineral wool; traditional and self-desiccating concrete
2.2 on expanded polystyrene 2.3 on coarse drainage
2.4 on sand 3. Outdoor structures 3.1 Sheltered from rain
3.2 Exposed to rain 4. Bridges
For these structures estimations have been done on the type of cement, cement content, w/c, degree of hydration and relevant surface coatings. The surrounding climate has been
estimated as an annual average RH in the carbonated part of the concrete. The structures are briefly commented upon in the next sections. The detailed assumptions and
the results of calculations are then presented in the Appendix as depths of carbonation and amount of absorbed CO2 after different exposure times.
8.1 Indoor structures
The indoor climate in buildings varies a lot depending on the type of building, internal moisture sources, the surrounding climate and the rate of ventilation. The surrounding climate, especially the temperature and vapour content, is very different between the north
and south parts of Sweden. Extremely dry conditions are expected in well ventilated buildings in the north during winter. For floor slabs with floor heating, RH could be as low as 10-20 %
in wintertime. In summertime RH of the indoor air could be 50-60 % for longer periods of time.
Since the simple model uses a constant RH, a representative value of 40 % RH has been chosen.
Modern concrete slabs in buildings are made of self-desiccating concrete (SDC), with a low w/c, around 0.40. An additional calculation has been made for indoor structures with SDC in
the various cases.
The surface resistances was assumed to be 0, 350000 and 2000000 s/m for structures without
24
surface coatings, with somewhat permeable surface coatings (“paint”) and with almost
impermeable surface coatings (PVC, linoleum, parquet, floor paint), respectively.
8.2 Slab-on-grade
Concrete slabs-on-grade actually have carbonation from beneath according to the field
investigations, Fridh & Lagerblad (2010). Why this is possible has not been explained and the few cases that were investigated had mineral wool as underlying heat insulation. This insulation creates a temperature difference between the wet soil and the bottom surface of the
concrete slab which lowers the RH to some 85-90 % RH.
Mineral wool is also open for diffusion of carbon dioxide. The surface resistance should be almost zero. A heat insulation of expanded polystyrene, however, must be assumed to have an infinite surface resistance.
The temperature difference between the bottom surface of the concrete slab and the wet soil
depends on a number of parameters such as the type and thickness of the heat insulation, the type of soil, the size, shape and location of the building etc. For a 30 year old, heat insulated, small building, on clay in the south of Sweden, a temperature difference of some 3C could be
expected, corresponding to an RH = 85 %. For a building without heat insulation a much smaller (if any) temperature difference is expected. For buildings on a coarse drainage layer
RH = 95 % was assumed; for buildings on sand 98 % RH. The concrete quality in modern concrete floor slabs are frequently made of SDC, with a w/c
of 0.40 compared to traditionally 0.65-0.70.
8.3 Outdoor structures
Carbonation of outdoor structures is fairly well documented. The absorption of CO2 is, however, expected to be small due to the wet conditions. To demonstrate a comparison with
indoor structures a few predictions have been made with the model. The model uses the RH of outdoor air and, to some extent the time of wetness at the surfaces, due to rain.
The age exponent n has been assumed to be 0.17 for structures exposed to rain and 0 for structures sheltered against rain. In both cases RH of the outdoor air was assumed to be 85 %.
8.4 Bridges
Concrete bridges in Sweden have been produced with ”bridge concrete” for decades, having a w/c of 0.45. In recent decades the cement has been “Degerhamn Anläggning”, an SRPC.
The age exponent n was assumed to be 0.17 for parts of bridges exposed to rain and 0 for parts sheltered against rain. In both cases RH of the outdoor air was assumed to be 85 %.
25
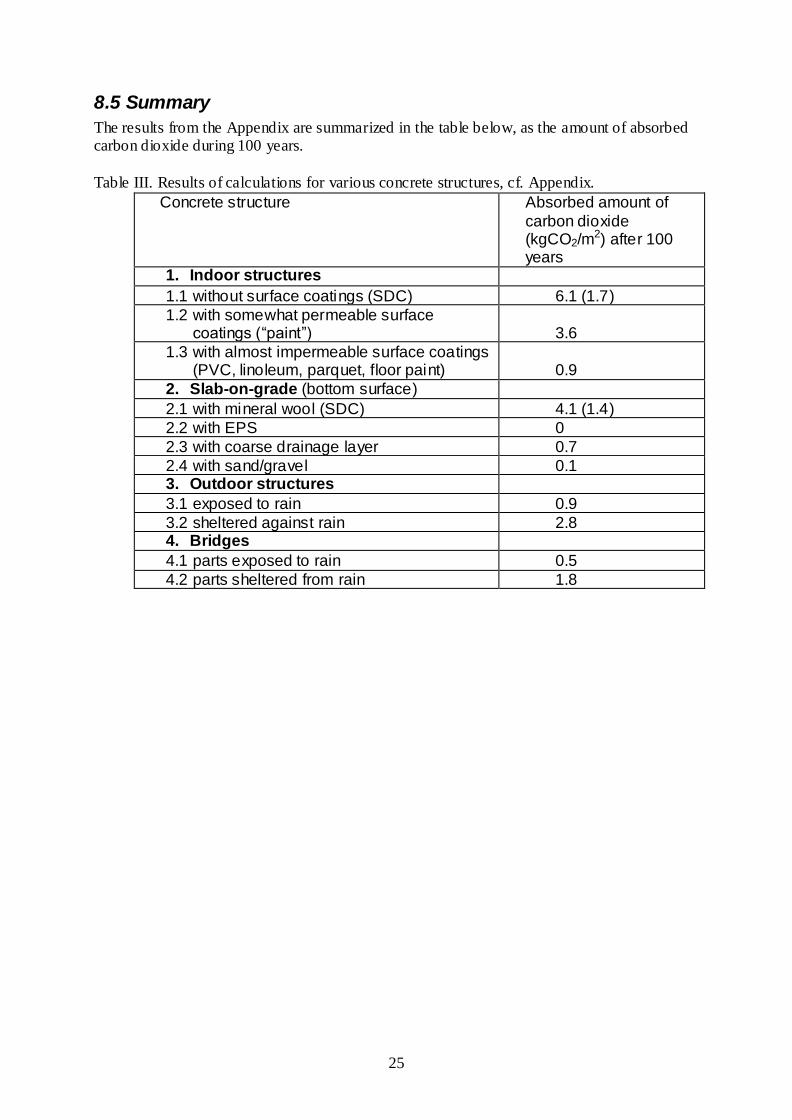
8.5 Summary
The results from the Appendix are summarized in the table below, as the amount of absorbed carbon dioxide during 100 years.
Table III. Results of calculations for various concrete structures, cf. Appendix.
Concrete structure Absorbed amount of
carbon dioxide (kgCO2/m
2) after 100 years
1. Indoor structures
1.1 without surface coatings (SDC) 6.1 (1.7)
1.2 with somewhat permeable surface coatings (“paint”)
3.6
1.3 with almost impermeable surface coatings (PVC, linoleum, parquet, floor paint)
0.9
2. Slab-on-grade (bottom surface)
2.1 with mineral wool (SDC) 4.1 (1.4)
2.2 with EPS 0
2.3 with coarse drainage layer 0.7
2.4 with sand/gravel 0.1 3. Outdoor structures
3.1 exposed to rain 0.9
3.2 sheltered against rain 2.8 4. Bridges
4.1 parts exposed to rain 0.5
4.2 parts sheltered from rain 1.8
26
References CEB (1997): New Approach to Durability Design, CEB Bulletin No 238, Lausanne
van Balen, K. (2005) Carbonation reaction of lime, kinetics at ambient temperature. Cement
and Concrete Research 35 (2005) 647– 657 El-Turki A., Ball, R.J. & Allen, G.C. (2007) The influence of relative humidity on structural
and chemical changes during carbonation of hydraulic lime. Cement and Concrete Research 37 (2007) 1233–1240
Fridh, K & Lagerblad, B. (2011) Carbonation of indoor concrete. Internal draft report, CBI-Cement & Concrete Institute, Stockholm, and Lund University
Goodbrake, C.J., Young, J.F. & Berger, R.L. (1979) Reaction of hydraulic calcium silicates
with carbon dioxide and water. Journal of American Ceramic Society, Vol 62, No 9-10, pp. 488-.
Hergenröder, M. (1992). Zur statistischen Instandhaltungsplanung für bestehende Betonbauwerke und möglicher Korrosion der Bewehrung, TU Munich, Berichte aus dem
konstruktiven Ingenieurbau, 4/92, 131pp Lagerblad, B. (2010) Private communication within the project.
Ljungkrantz, C. (2008) Field exposure on Gotland. Carbonation rate of concrete. Nordic
Mini-seminar, Hirthals, Denmark Möller, J. (1994) Measurement of carbonation in cement-based materials. Chalmers
University of Technology, Göteborg, Licentiate thesis March 1994
Norling-Mjörnell, K. (1997): Moisture conditions in high performance concrete. PhD-thesis P-96:6, div of building materials, Chalmers university of technology, Göteborg.
Nilsson, L.-O. & Fridh, K: (2009) CO2-uptake by concrete through carbonation Part 7: Models. Status January 15, 2009. Report TVBM-7200, division of Building Materials,
University of Lund. Nilsson, L.-O. (1980) Hygroscopic moisture in concrete – drying, measurements and related
material properties. Report TVBM-1003, division of Building Materials, University of Lund.
Nilsson, L.-O. & Rodhe, M. (1997a) Micro-level Design, Sections 4.4.1- 4.4.6 of New Approach to Durability Design, CEB Bulletin No 238, Lausanne
Nilsson, L.-O. & Rodhe, M. (1997b) The CTH Carbonation Model - A Micro-level Model for Carbonation in a Natural Climate. Appendix 2 of New Approach to Durability Design, CEB
Bulletin No 238 Nilsson, L:-O. (2004): Service-life of the New Årsta Bridge. Effect of curing, cover and salt.
Internal report In Swedish), Swetec, Markaryd

27
Samuelsson, P. (1977) Lime efflorescence on concrete surfaces (in Swedish),
Report R3:1977, Swedish Council for Building Research (BFR), Stockholm
Thiery, M., Roussel, N., Habert, G., Belin, P. & Dangla, P (2009) Comment intégrer quantitativement la carbonatation atmosphérique dans le bilan-carbone des matériaux cimentaires? GC’2009, Paris 18-19 March
Tuutti, K. (1982) Corrosion of steel in concrete. CBI research fo 4.82. The Swedish Cement
and Concrete Research Institute, Stockholm. Wierig, H.-J. (1984). Long-time studies on the carbonation under normal outdoor exposure.
Proceedings of RILEM Seminar on the Durability of Concrete Structures Under Normal Outdoor Exposure, Hannover March 1984.

28
APPENDIX – calculations for different structures
1 Indoor structures
Assumptions: Type of cement: CEMI
Water-cement ratio, w/c=0.65 Cement content, C=277 kg/m3
Degree of hydration, α=0.70
RCO2 = 0 Relative humidity, RH=40 %
Age exponent, n=0.
The surface resistances was assumed to be 0, 350000 and 2000000 s/m for structures without surface coatings, with somewhat permeable surface coatings (“paint”) and with almost impermeable surface coatings (PVC, linoleum, parquet, floor
paint), respectively.
1.1 without surface coatings;
1.1.1 traditional concrete
Results: (degree of carbonation = 0.35)
Time (years) 1 2 5 10 20 50 100
Depth (mm) 12 17 27 39 55 87 123
Amount (kgCO2/m2) 0.6 0.9 1.4 1.9 2.7 4.3 6.1
1.1.2 self-desiccating concrete
Assumptions: Type of cement: CEMI
Water-cement ratio, w/c=0.40 Cement content, C=450 kg/m3
Degree of hydration, α=0.70
RCO2 = 0 Relative humidity, RH=40 %
Age exponent, n=0.
Results: (degree of carbonation = 0.35)
Time (years) 1 2 5 10 20 50 100
Depth (mm) 2 3 5 7 9 15 21
Amount (kgCO2/m2) 0.2 0.2 0.4 0.5 0.7 1.2 1.7
1.2 with somewhat permeable surface coatings (paint)
Results: (degree of carbonation = 0.35)
Time (years) 1 2 5 10 20 50 100
Depth (mm) 1 2 5 10 19 42 72
Amount (kgCO2/m2) 0.1 0.1 0.3 0.5 0.9 2.1 3.6
29
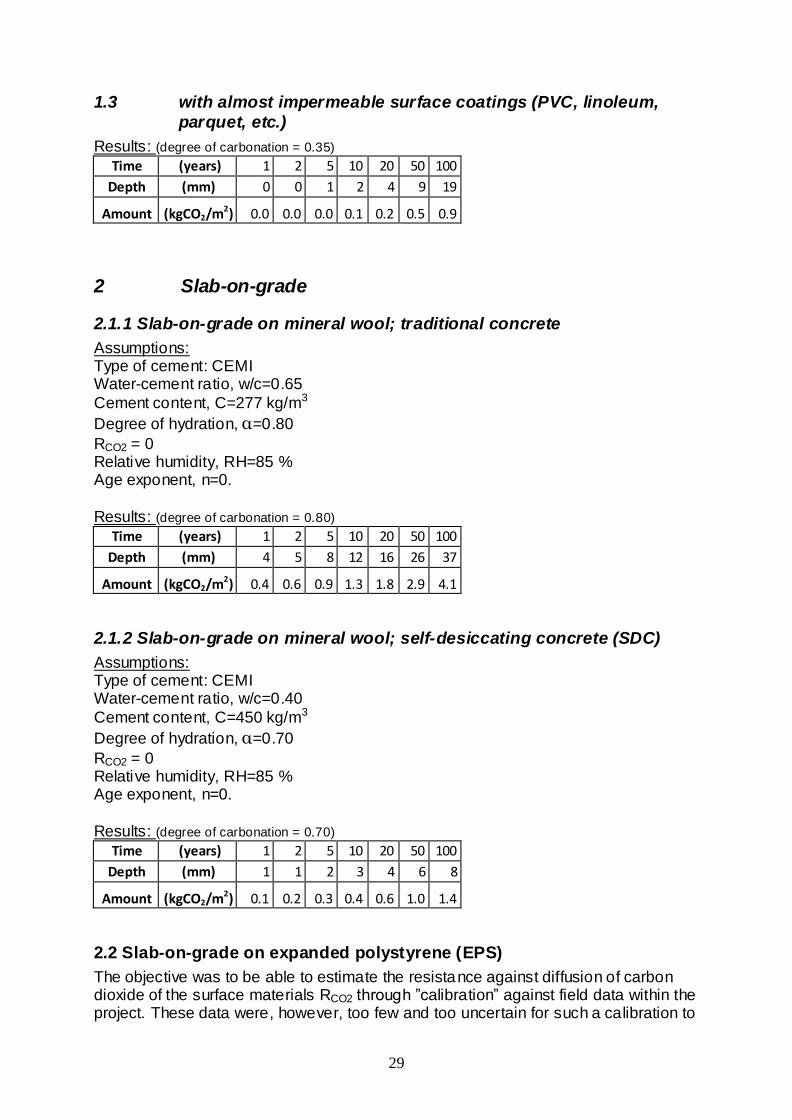
1.3 with almost impermeable surface coatings (PVC, linoleum,
parquet, etc.)
Results: (degree of carbonation = 0.35)
Time (years) 1 2 5 10 20 50 100
Depth (mm) 0 0 1 2 4 9 19
Amount (kgCO2/m2) 0.0 0.0 0.0 0.1 0.2 0.5 0.9
2 Slab-on-grade
2.1.1 Slab-on-grade on mineral wool; traditional concrete
Assumptions: Type of cement: CEMI Water-cement ratio, w/c=0.65
Cement content, C=277 kg/m3
Degree of hydration, α=0.80
RCO2 = 0 Relative humidity, RH=85 % Age exponent, n=0.
Results: (degree of carbonation = 0.80)
Time (years) 1 2 5 10 20 50 100
Depth (mm) 4 5 8 12 16 26 37
Amount (kgCO2/m2) 0.4 0.6 0.9 1.3 1.8 2.9 4.1
2.1.2 Slab-on-grade on mineral wool; self-desiccating concrete (SDC)
Assumptions: Type of cement: CEMI Water-cement ratio, w/c=0.40
Cement content, C=450 kg/m3
Degree of hydration, α=0.70
RCO2 = 0 Relative humidity, RH=85 % Age exponent, n=0.
Results: (degree of carbonation = 0.70)
Time (years) 1 2 5 10 20 50 100
Depth (mm) 1 1 2 3 4 6 8
Amount (kgCO2/m2) 0.1 0.2 0.3 0.4 0.6 1.0 1.4
2.2 Slab-on-grade on expanded polystyrene (EPS)
The objective was to be able to estimate the resistance against diffusion of carbon dioxide of the surface materials RCO2 through ”calibration” against field data within the project. These data were, however, too few and too uncertain for such a calibration to
30
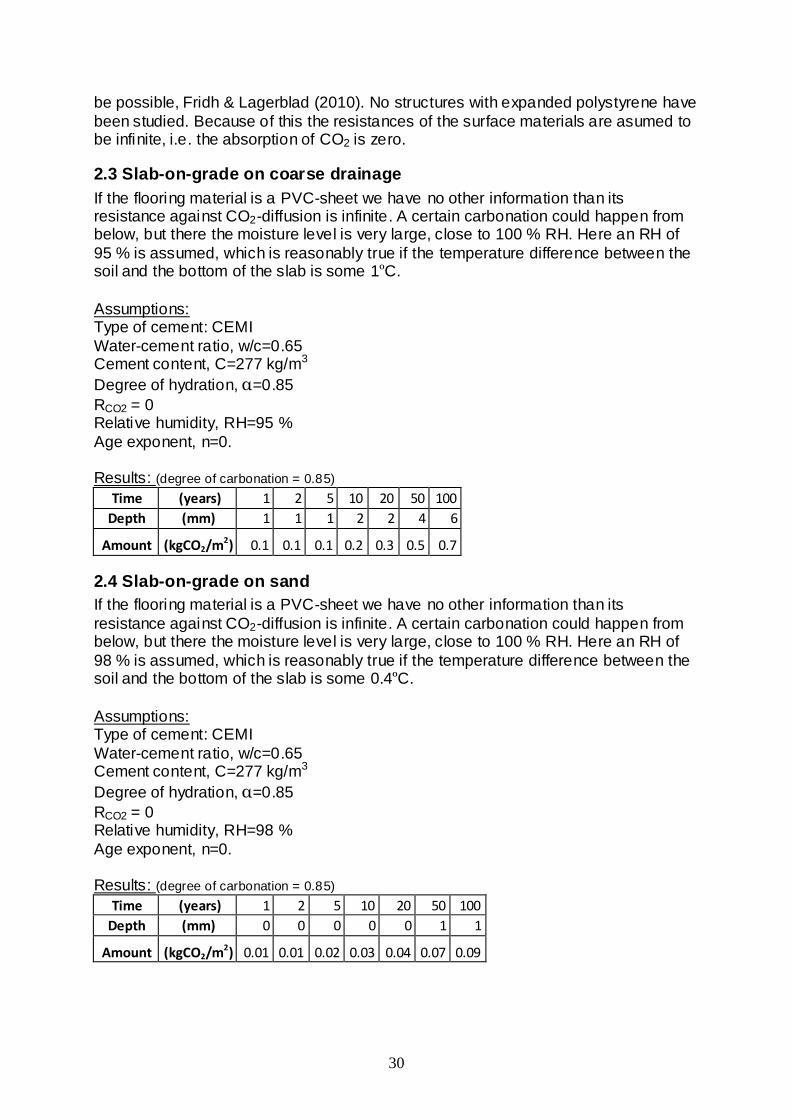
be possible, Fridh & Lagerblad (2010). No structures with expanded polystyrene have
been studied. Because of this the resistances of the surface materials are asumed to be infinite, i.e. the absorption of CO2 is zero.
2.3 Slab-on-grade on coarse drainage
If the flooring material is a PVC-sheet we have no other information than its resistance against CO2-diffusion is infinite. A certain carbonation could happen from below, but there the moisture level is very large, close to 100 % RH. Here an RH of
95 % is assumed, which is reasonably true if the temperature difference between the soil and the bottom of the slab is some 1ºC.
Assumptions: Type of cement: CEMI
Water-cement ratio, w/c=0.65 Cement content, C=277 kg/m3
Degree of hydration, α=0.85
RCO2 = 0 Relative humidity, RH=95 %
Age exponent, n=0. Results: (degree of carbonation = 0.85)
Time (years) 1 2 5 10 20 50 100
Depth (mm) 1 1 1 2 2 4 6
Amount (kgCO2/m2) 0.1 0.1 0.1 0.2 0.3 0.5 0.7
2.4 Slab-on-grade on sand
If the flooring material is a PVC-sheet we have no other information than its
resistance against CO2-diffusion is infinite. A certain carbonation could happen from below, but there the moisture level is very large, close to 100 % RH. Here an RH of
98 % is assumed, which is reasonably true if the temperature difference between the soil and the bottom of the slab is some 0.4ºC.
Assumptions: Type of cement: CEMI
Water-cement ratio, w/c=0.65 Cement content, C=277 kg/m3
Degree of hydration, α=0.85
RCO2 = 0 Relative humidity, RH=98 %
Age exponent, n=0. Results: (degree of carbonation = 0.85)
Time (years) 1 2 5 10 20 50 100
Depth (mm) 0 0 0 0 0 1 1
Amount (kgCO2/m2) 0.01 0.01 0.02 0.03 0.04 0.07 0.09
31
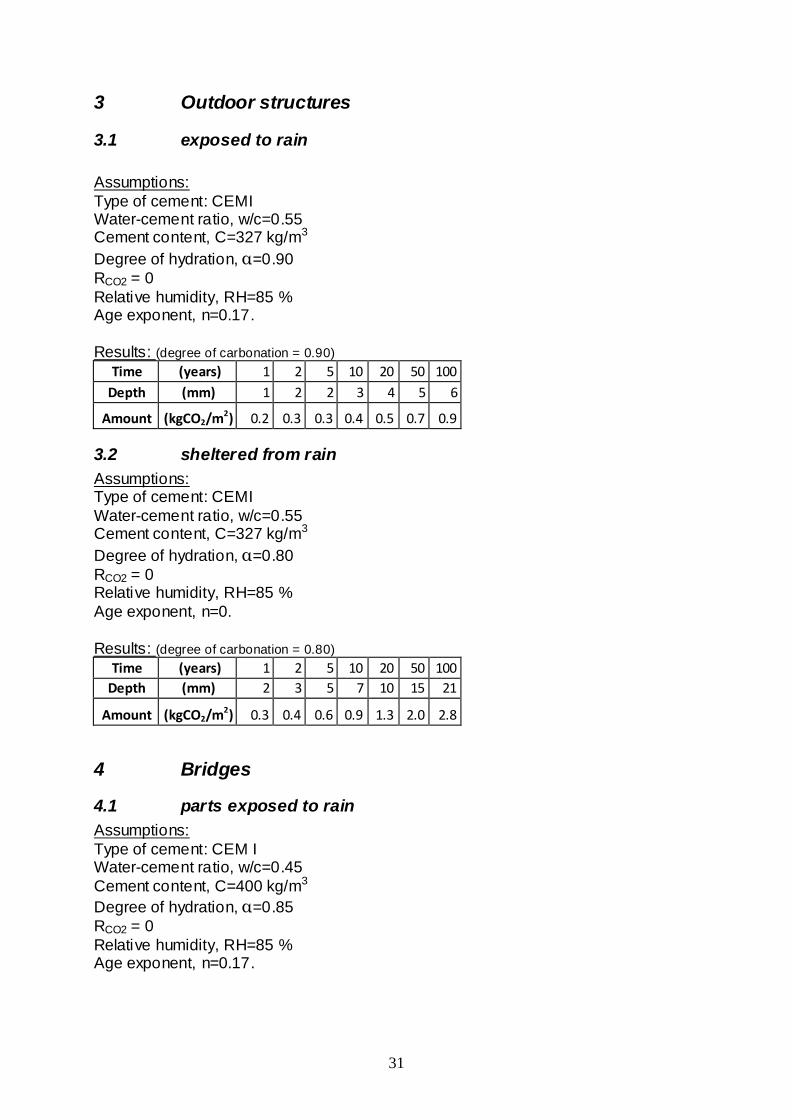
3 Outdoor structures
3.1 exposed to rain
Assumptions:
Type of cement: CEMI Water-cement ratio, w/c=0.55 Cement content, C=327 kg/m3
Degree of hydration, α=0.90
RCO2 = 0
Relative humidity, RH=85 % Age exponent, n=0.17.
Results: (degree of carbonation = 0.90)
Time (years) 1 2 5 10 20 50 100
Depth (mm) 1 2 2 3 4 5 6
Amount (kgCO2/m2) 0.2 0.3 0.3 0.4 0.5 0.7 0.9
3.2 sheltered from rain
Assumptions: Type of cement: CEMI
Water-cement ratio, w/c=0.55 Cement content, C=327 kg/m3
Degree of hydration, α=0.80
RCO2 = 0 Relative humidity, RH=85 %
Age exponent, n=0.
Results: (degree of carbonation = 0.80)
Time (years) 1 2 5 10 20 50 100
Depth (mm) 2 3 5 7 10 15 21
Amount (kgCO2/m2) 0.3 0.4 0.6 0.9 1.3 2.0 2.8
4 Bridges
4.1 parts exposed to rain
Assumptions:
Type of cement: CEM I Water-cement ratio, w/c=0.45
Cement content, C=400 kg/m3
Degree of hydration, α=0.85
RCO2 = 0
Relative humidity, RH=85 % Age exponent, n=0.17.
32
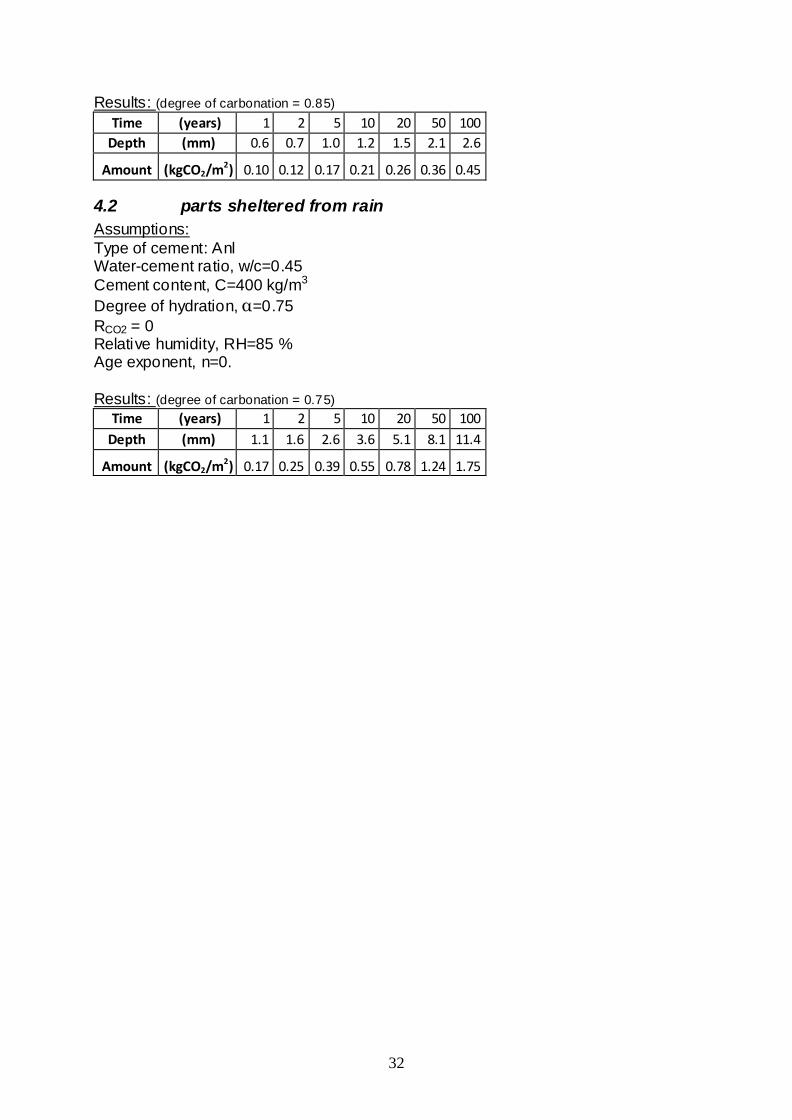
Results: (degree of carbonation = 0.85)
Time (years) 1 2 5 10 20 50 100
Depth (mm) 0.6 0.7 1.0 1.2 1.5 2.1 2.6
Amount (kgCO2/m2) 0.10 0.12 0.17 0.21 0.26 0.36 0.45
4.2 parts sheltered from rain
Assumptions:
Type of cement: Anl Water-cement ratio, w/c=0.45
Cement content, C=400 kg/m3
Degree of hydration, α=0.75
RCO2 = 0 Relative humidity, RH=85 % Age exponent, n=0.
Results: (degree of carbonation = 0.75)
Time (years) 1 2 5 10 20 50 100
Depth (mm) 1.1 1.6 2.6 3.6 5.1 8.1 11.4
Amount (kgCO2/m2) 0.17 0.25 0.39 0.55 0.78 1.24 1.75