Embed Size (px)
Citation preview
A Monte Carlo Approach for the Design of Thermal Fire Detection System
Walter W. Yuen
Department of Mechanical & Environmental Engineering
University of California at Santa Barbara
California, USA
and
W.K. Chow
Department of Building Services Engineering
The Hong Kong Polytechnic University
Hong Kong, China
August, 2002
2
Abstract
A Monte Carlo approach is developed for the design of thermal fire detection system. In
contrast to the traditional deterministic approach, the present approach yields not only a
specific design for a given objective, but also a probabilistic assessment of the effectiveness
of the design which can be used as a basis of comparison for different possible designs. The
approach also allows a systematic assessment of the uncertainty in the design process and
provides a rational basis for possible design improvements.
3
1. Introduction
Fire detection system is required to be installed in a wide range of buildings. Basically,
requirements of the systems are described clearly in the prescriptive codes [1]. For numerous
reasons such as reducing the false alarm rate [2], thermal detectors are selected. For some
projects with new architectural features [3] or special use of the buildings, prescriptive fire
codes might not be applicable. Engineering performance-based fire codes (EPBFC) [4-7] is
therefore adopted. In applying EPBFC for designing thermal detection system, thermal
response of the detectors [8,9] should be considered.
There are many studies on the response of heat detectors to fire-driven flows in the last years
[10-14]. Based on correlations of experimental data and physical modeling, methodologies
and concepts have been developed and accepted, in general, by the fire protection community
as the basis for design and evaluation of thermal detection system. For a given design
objective and detector’s characteristics, a standard procedure is now available [15] for
calculating the required spacing of ceiling-mounted thermal detectors, if prescriptive codes
are not followed.
The proposed design procedure [15] for thermal fire detection system, however, is
deterministic. Assessment of uncertainty is not yet provided. For example, there are
uncertainties associated with the detector’s characteristics. The fire growth rate assumed in
the design fire is also uncertain, and this can have a significant impact on the design spacing.
Subjective decisions in providing the appropriate conservatism in the design must be made by
fire engineers themselves to minimize fire risk associated with such uncertainties.
4
The objective of the present work is to develop a probabilistic approach in the design of
thermal fire detection system. The Monte Carlo sampling technique [16] would be used.
This approach generates not only a specific design for a given design objective, but also a
statistical assessment of the effectiveness of the design. The uncertainties associated with the
fire growth rate and detector’s characteristics can also be included in the design and the
statistical assessment. This approach is flexible and can be adapted to include specific
building characteristics in the development of the design. The Monte Carlo sampling
technique is demonstrated by applying design thermal fire detection system.
Basic theoretical model used in the current deterministic design of thermal fire detection
system model is described in section 2. For the same design objective, results generated by
the deterministic approach and the Monte Carlo approach are presented and compared in
section 3. The effect of uncertainties in fire growth rate and building geometry on the design
result is assessed by the current Monte Carlo approach in section 4. Finally, some
conclusions on the current approach and some perspectives on its role in the development of
engineering performance-based fire codes are presented in section 5.
5
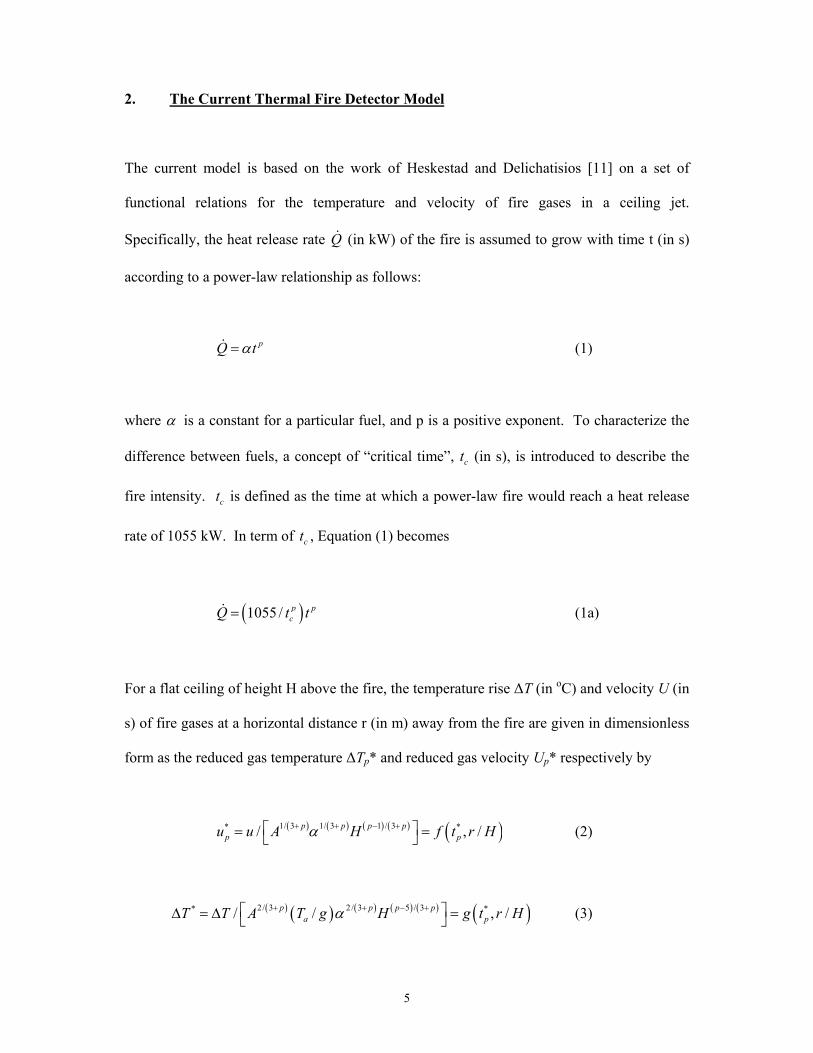
2. The Current Thermal Fire Detector Model
The current model is based on the work of Heskestad and Delichatisios [11] on a set of
functional relations for the temperature and velocity of fire gases in a ceiling jet.
Specifically, the heat release rate Q (in kW) of the fire is assumed to grow with time t (in s)
according to a power-law relationship as follows:
pQ tα= (1)
where α is a constant for a particular fuel, and p is a positive exponent. To characterize the
difference between fuels, a concept of “critical time”, ct (in s), is introduced to describe the
fire intensity. ct is defined as the time at which a power-law fire would reach a heat release
rate of 1055 kW. In term of ct , Equation (1) becomes
( )1055 / p pcQ t t= (1a)
For a flat ceiling of height H above the fire, the temperature rise ∆T (in oC) and velocity U (in
s) of fire gases at a horizontal distance r (in m) away from the fire are given in dimensionless
form as the reduced gas temperature ∆Tp* and reduced gas velocity Up* respectively by
( ) ( ) ( ) ( ) ( )1/ 3 1/ 3 1 / 3* */ , /p p p pp pu u A H f t r Hα+ + − + = = (2)
( ) ( ) ( ) ( ) ( ) ( )2/ 3 2 / 3 5 / 3* */ / , /p p p pa pT T A T g H g t r Hα+ + − + ∆ = ∆ = (3)
6
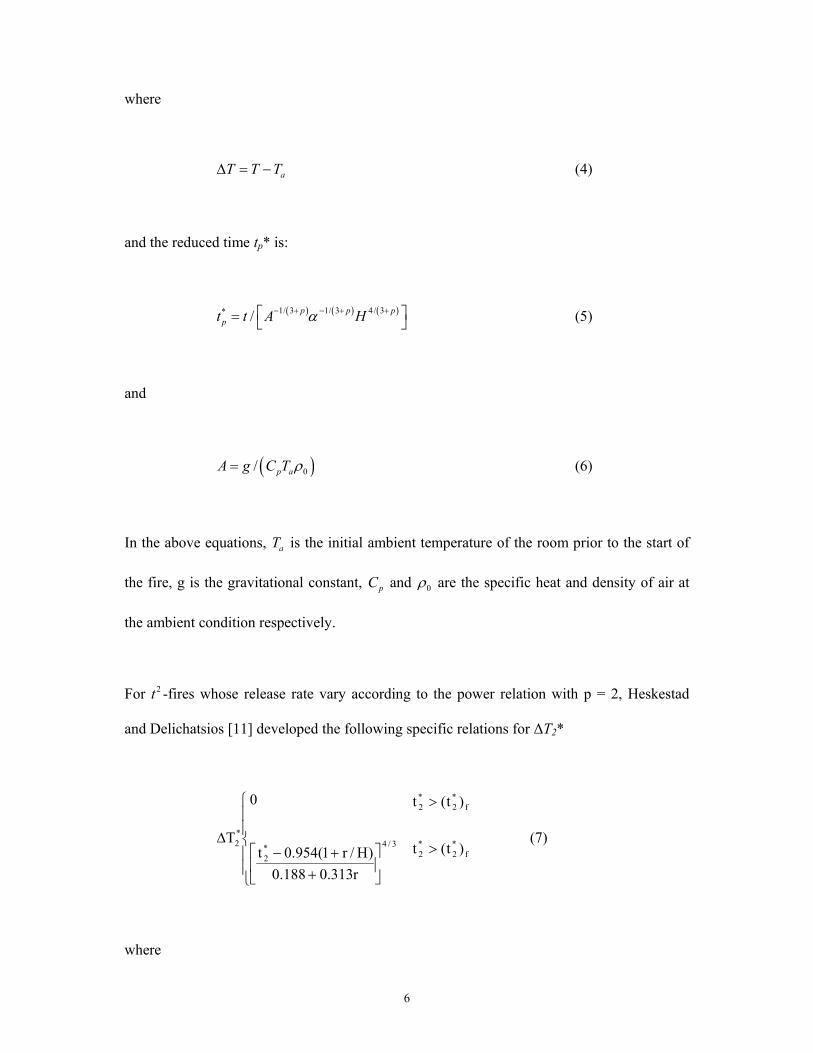
where
aT T T∆ = − (4)
and the reduced time tp* is:
( ) ( ) ( )1/ 3 1/ 3 4 / 3* / p p ppt t A Hα− + − + + = (5)
and
( )0/ p aA g C T ρ= (6)
In the above equations, aT is the initial ambient temperature of the room prior to the start of
the fire, g is the gravitational constant, pC and 0ρ are the specific heat and density of air at
the ambient condition respectively.
For 2t -fires whose release rate vary according to the power relation with p = 2, Heskestad
and Delichatsios [11] developed the following specific relations for ∆T2*
>
+
+−
>
∆f
*2
*2
3/4*2
f*2
*2
*2 )t(t
r313.0188.0)H/r1(954.0t
)t(t0
T (7)
where
7
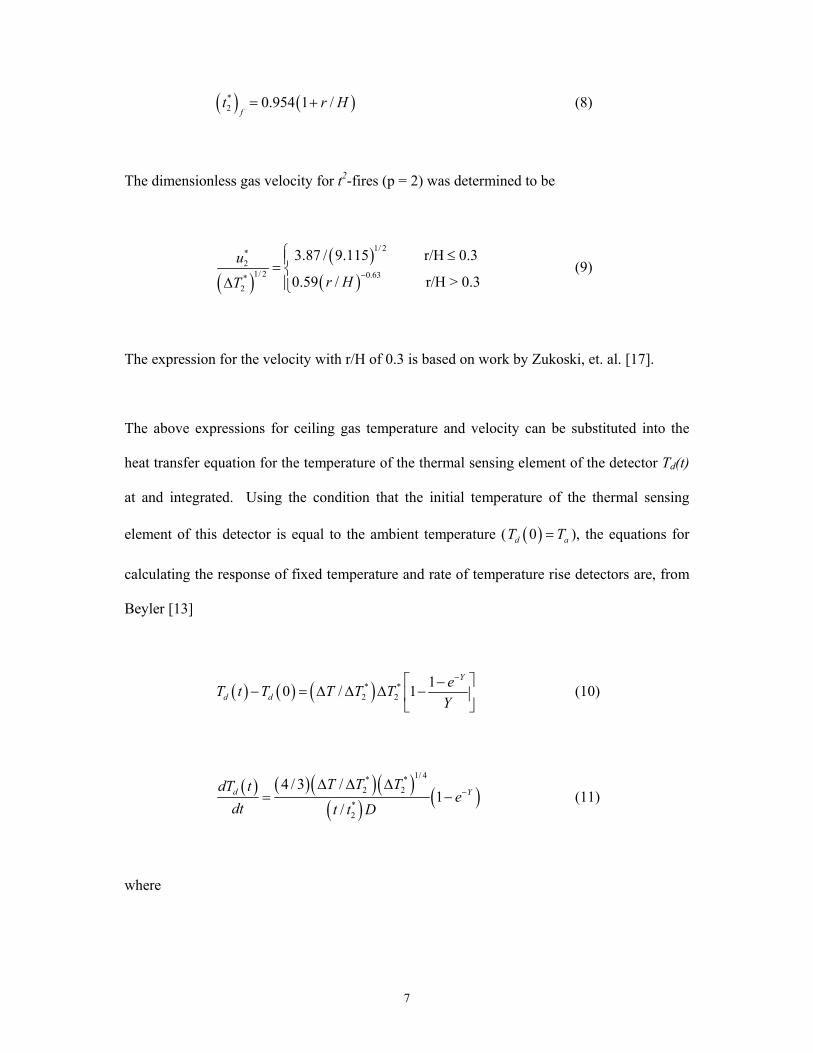
( ) ( )*2 0.954 1 /
ft r H= + (8)
The dimensionless gas velocity for t2-fires (p = 2) was determined to be
( )
( )( )
1/ 2*2
1/ 2 0.63*2
3.87 / 9.115 r/H 0.3
0.59 / r/H > 0.3u
r HT −
≤= ∆
(9)
The expression for the velocity with r/H of 0.3 is based on work by Zukoski, et. al. [17].
The above expressions for ceiling gas temperature and velocity can be substituted into the
heat transfer equation for the temperature of the thermal sensing element of the detector Td(t)
at and integrated. Using the condition that the initial temperature of the thermal sensing
element of this detector is equal to the ambient temperature ( ( )0d aT T= ), the equations for
calculating the response of fixed temperature and rate of temperature rise detectors are, from
Beyler [13]
( ) ( ) ( )* *2 2
10 / 1Y
d deT t T T T TY
− −− = ∆ ∆ ∆ −
(10)
( ) ( )( )( )( ) ( )
1/ 4* *2 2
*2
4 / 3 /1
/d Y
T T TdT te
dt t t D−
∆ ∆ ∆= − (11)
where
8
( )
Dtt
RTIT
T
uuuY *
*
*
*
*
=
2
2
21
21
2
22
1
243 ∆
∆ (12)
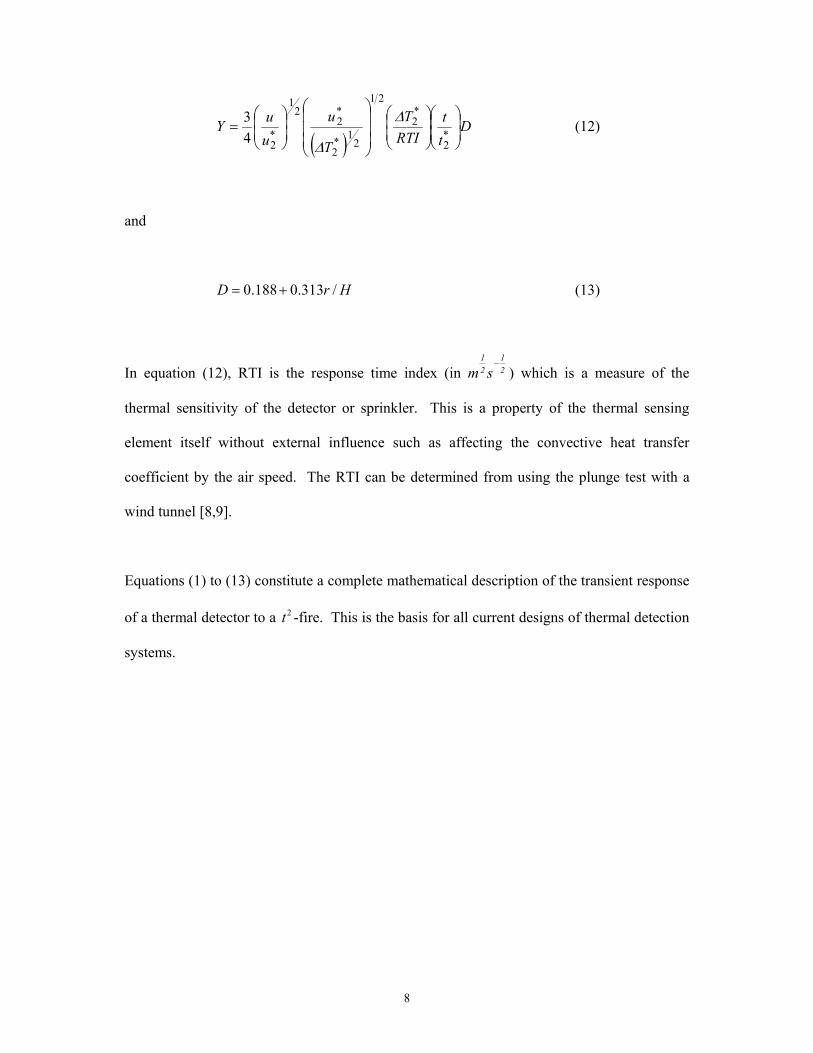
and
0.188 0.313 /D r H= + (13)
In equation (12), RTI is the response time index (in 21
21
sm−
) which is a measure of the
thermal sensitivity of the detector or sprinkler. This is a property of the thermal sensing
element itself without external influence such as affecting the convective heat transfer
coefficient by the air speed. The RTI can be determined from using the plunge test with a
wind tunnel [8,9].
Equations (1) to (13) constitute a complete mathematical description of the transient response
of a thermal detector to a 2t -fire. This is the basis for all current designs of thermal detection
systems.
9
3. Design of Thermal Detection Systems
In a design situation, the objective is to determine the spacing of detectors required to
respond to a specific fire scenario. The detector must respond when the fire reaches a certain
threshold heat release rate or, if the fire growth rate is known, a specific amount of time.
The best possible location of a thermal detector is directly over the fire. If there are specific
hazards to be protected, the design should include detectors directly overhead or inside of the
hazard. In areas without specific hazards, the design approach generally accepted by the fire
protection community is to space the detector evenly in a rectangular pattern across the
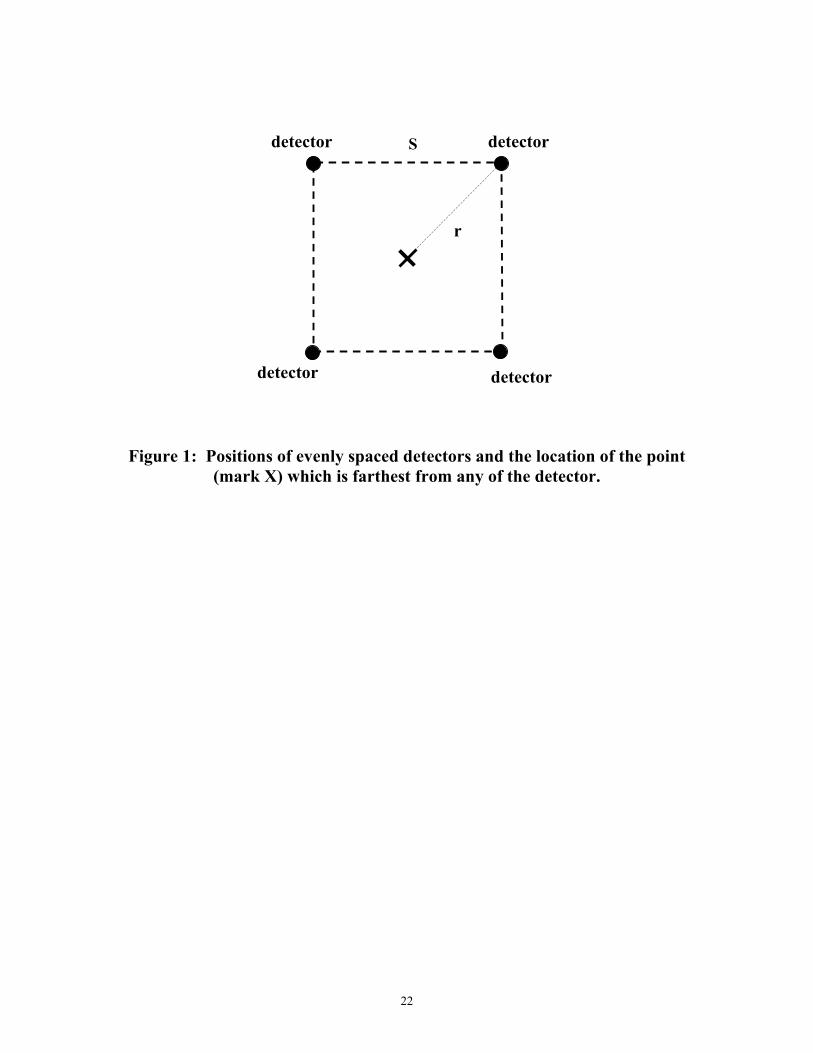
ceiling. When the detectors are evenly spaced, the point that is the farthest from any detector
will be in the middle of the four detectors as shown in Figure 1. For a given detector
spacing S, and a given detector actuation temperature, actT , and detector characteristics RTI,
the detector response time and heat release rate can be determined from Eqs. (1) to (13) with
a radial distance of
1/ 2/ 2r S= (14)
As an illustration of the design process, a fire detection system is now designed for an
unsprinklered manufacturing building using fixed-temperature heat detectors. The
parameters of the illustration is selected to correspond exactly to those of example 1
presented in reference [15] to allow for a direct comparison of the different design
approaches. Specifically, the area being considered has a large flat ceiling 3 m high.
Ambient temperature is assusmed to be 10 oC. The fire scenario involves the ignition of a
stack of wooden pallets. The pallets are stacked 1.5 m high. Fire tests show that this type of
10
fire follows the p = 2 power-law equation with a ct of approximately 150 s. The fixed-
temperature heat detector available has a RTI of approximately 100 1/ 2 1/ 2m s and an actuation
temperature of 57 oC. The plant fire brigade feels that they can control and extinguish the
fire if the fire can be detected when the fire reaches a heat release rate of approximately 1500
kW. The design goal is thus to determine the appropriate detector spacing such that at the
time of the detector activation, the heat release rate of the fire is less than 1500 kW. For the
fire with a ct of 150 s, the goal for the detecting time is about 180 s.
The Determinstic Approach
The known parameters for the design problem are:
H = 1.5 m
aT = 10 oC (283 K)
( )2 21055 /150 0.047 /kW sα = =
RTI = 100 1/ 2 1/ 2m s
The detector needs to reach a temperature of 57 oC in 180 s. Equations (1) to (13) can be
solved iteratively to yield a detector spacing S of about 7 m (r = 5 m). The detail of the
solution process is also given in reference [15].
11
The Monte Carlo Approach
There are clearly many uncertainties associated with the assumed fire scenario (location of
the fire, the fire growth rate, height of the wooden pallets when the fire begin, etc.) which can
change significantly the predicted detector spacing. The Monte Carlo approach [16] will be
effective in illustrating the effect of these uncertainties.
Consider first the effect of the location of the fire. Since the fire can start at any location
below the ceiling, the actual detection time can be significantly shorter than that predicted by
the deterministic approach (which utilizes the longest possible distance between the fire and
the detector). An architect, for example, might thus want to use a large detector spacing (> 7
m) for the fire detection system for the same design objective based on consideration of
economic and other factors. The Monte Carlo approach can be used to provide a rational
evaluation for any proposed variation from a deterministic design.
Specifically, the fire will be assumed to occur anywhere under the ceiling with a uniform
probability distribution. For a given detector spacing S, a large number of calculations (N)
are carried out to yield a distribution for the heat release rate at the time of detection. The
number of cases (Nf) in which the heat release rate exceeds the desgin objective can be
computed. A failure probability can then be evaluated as
fNFN
= (15)
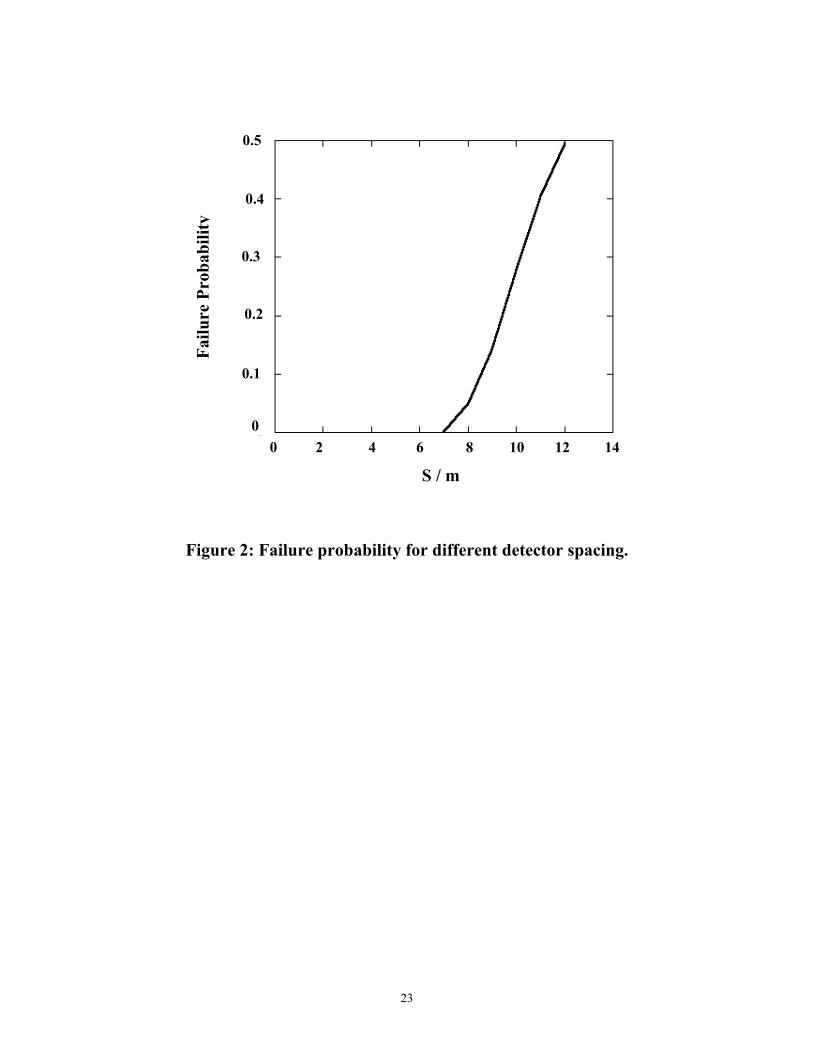
The failure probability for different detector spacing generated with N = 50,000 (larger
number yield essentially the same result) is shown in Figure 2. As expected, the failure

12
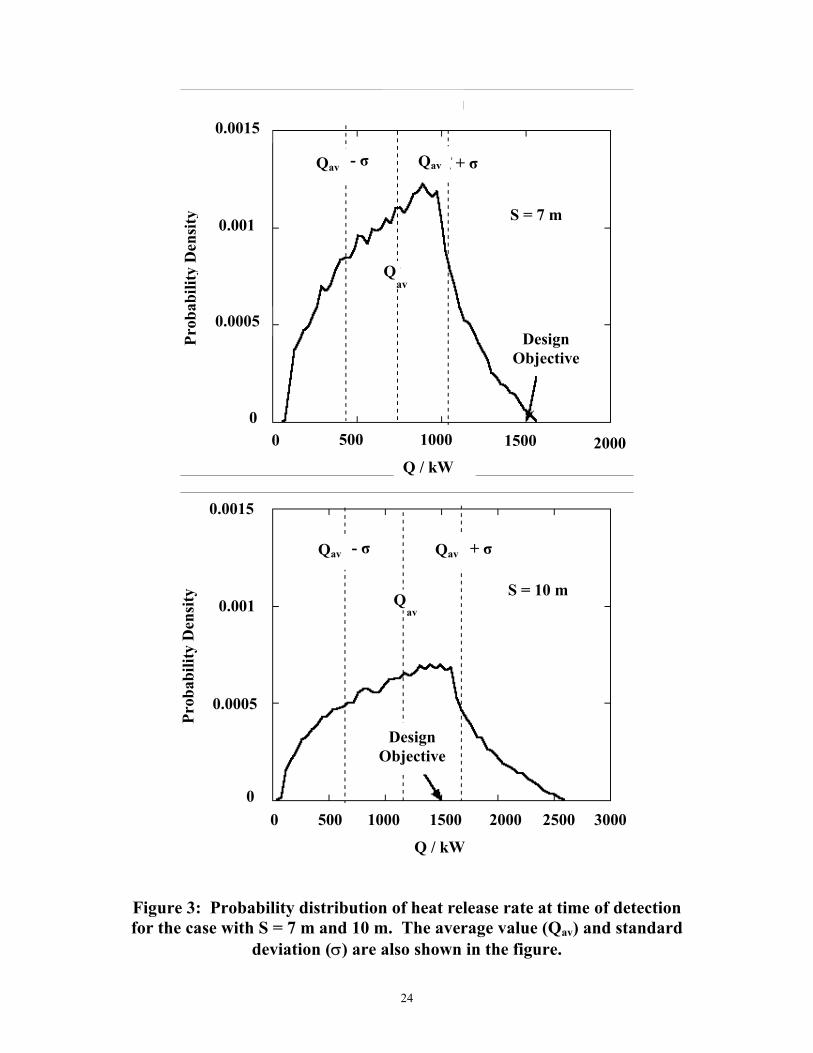
probability is zero up to a spacing of 7 m and the rises rapidly to 0.5 for S = 12 m. The
distribution of heat release rate at the time of detection, however, is anti-symmetric with a
larger concentration in region with lower heat release rate. The distribution for cases with S
= 7 m and S = 10 m are shown in Figure 3. The average heat release rate at the time of
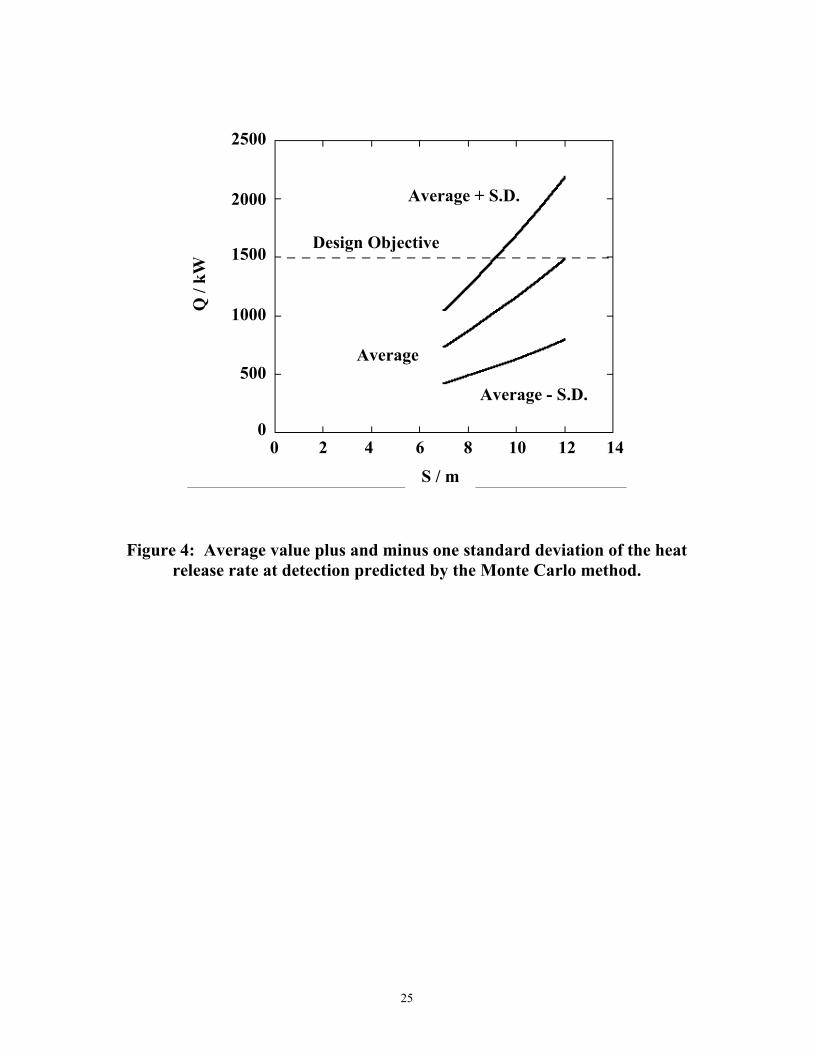
detection together with values bounded by one standard deviation are shown in Figure 4.
These data are valuable for a risk based and/or cost-benefit based design for thermal fire
detection system. For example, if a builder is willing to accept a design in which the design
objective (1500 kW) is met by the average value plus one standard deviation of the heat
release rate at the time of detection, a detector spacing of 8 m can be used for the design.
13
4. A General Monte-Carlo Based Design of Thermal Detection Systems
In addition to the uncertainty of the fire location, the Monte Carlo approach can be used to
readily account for other uncertainty in the fire scenario. In this section, the uncertainty in
the fire growth rate and the height of the wooden pallets when the fire begin will be
considered and their effects on the design will be assessed.
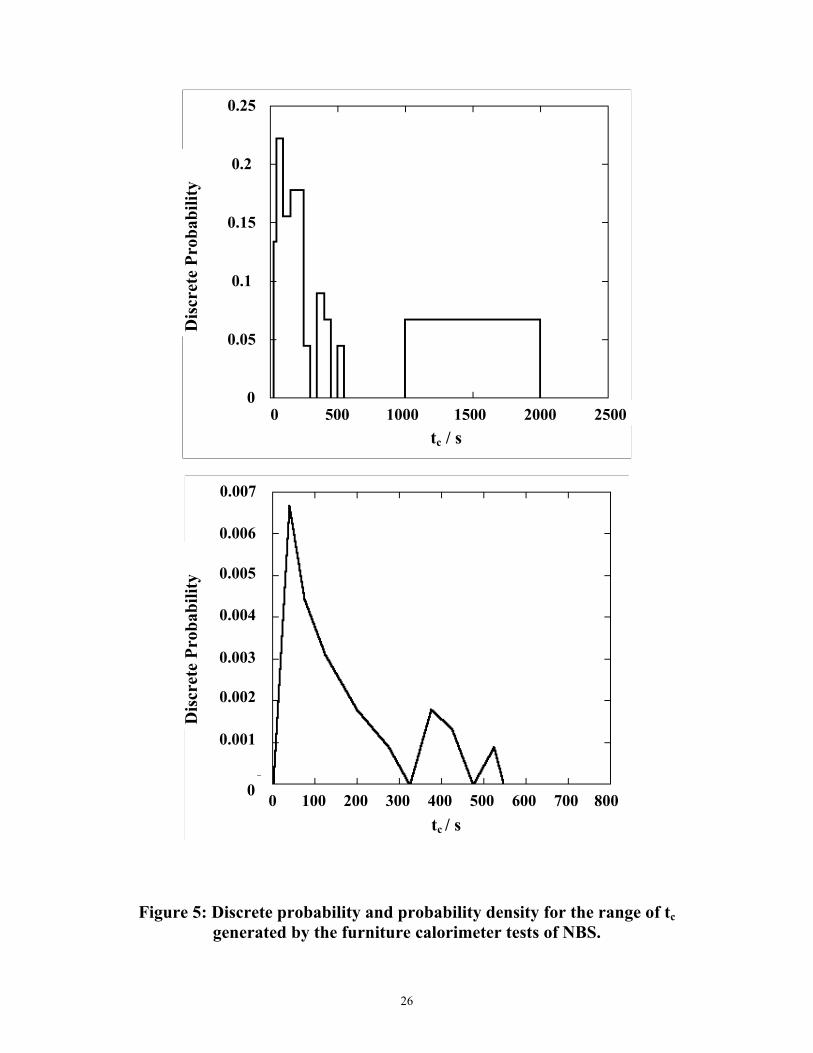
In cases for which the exact fuel involved in a fire cannot be known, the designer must rely
on available data on common materials. One example of such data is a set of values for α
and ct generated from a series of furniture calorimeter tests done at the National Bureau of
Standard [18]. These data are now available from standard reference [9] and is presented as a
discrete probability and probability density distribution in Figure 5. These data will be used
to illustrate the effect of uncertainty in the heat release rate.
Since the stack of wooden pallets has an initial height of 1.5 m, the initial location of the fire
can physically be of any values in the range of 0 to 1.5 m. To assess the effect of this
uncertainty, the present work will assume a uniform probability for the value of H in the
range from 1.5 to 3 m.
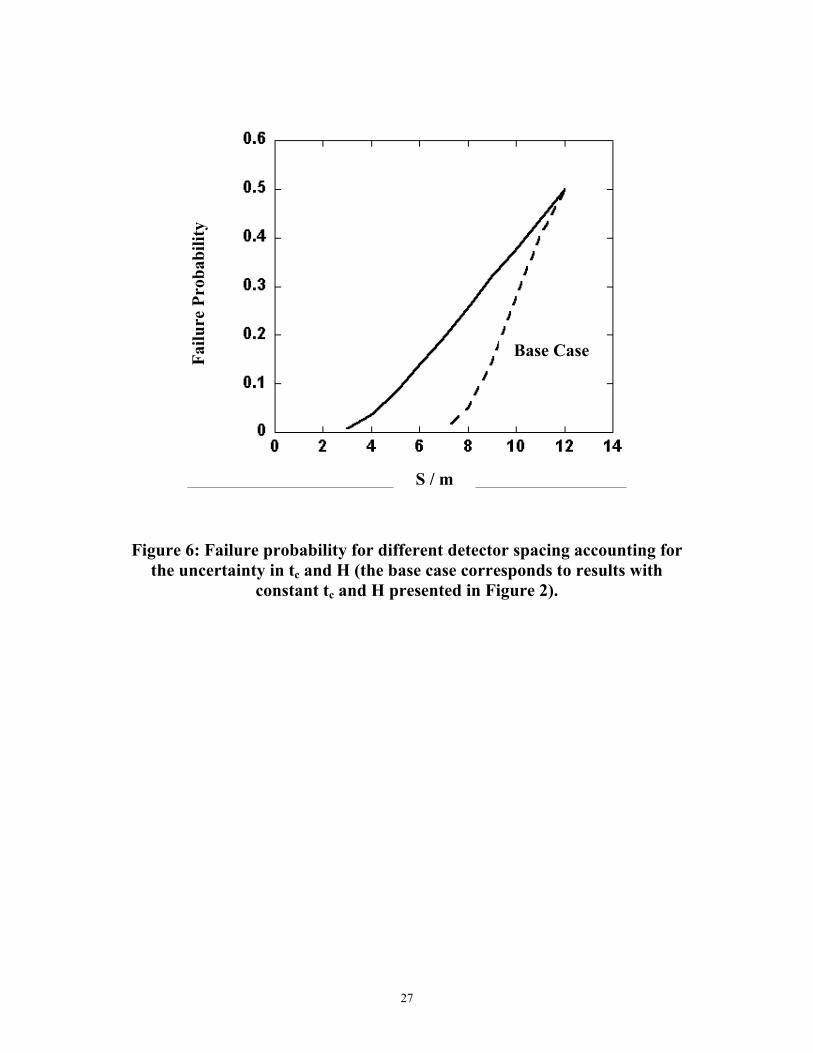
A Monte Carlo simulation with N = 50,000 is carried out to determine the heat release rate at
the time of detection accounting for the above uncertainty. The failure probability for
different detector spacing is presented in Figure 6. The failure probability calculated without
accounting for the uncertainty is also shown in the same figure for comparison. Because of
the increased probability of a fast fire growth rate (smaller ct ), the failure probability
14
increases for a given detector spacing. A detector spacing of about 3 m is now required to
meet the design objective of detecting all fires prior to a heat release rate of 1500 kW.
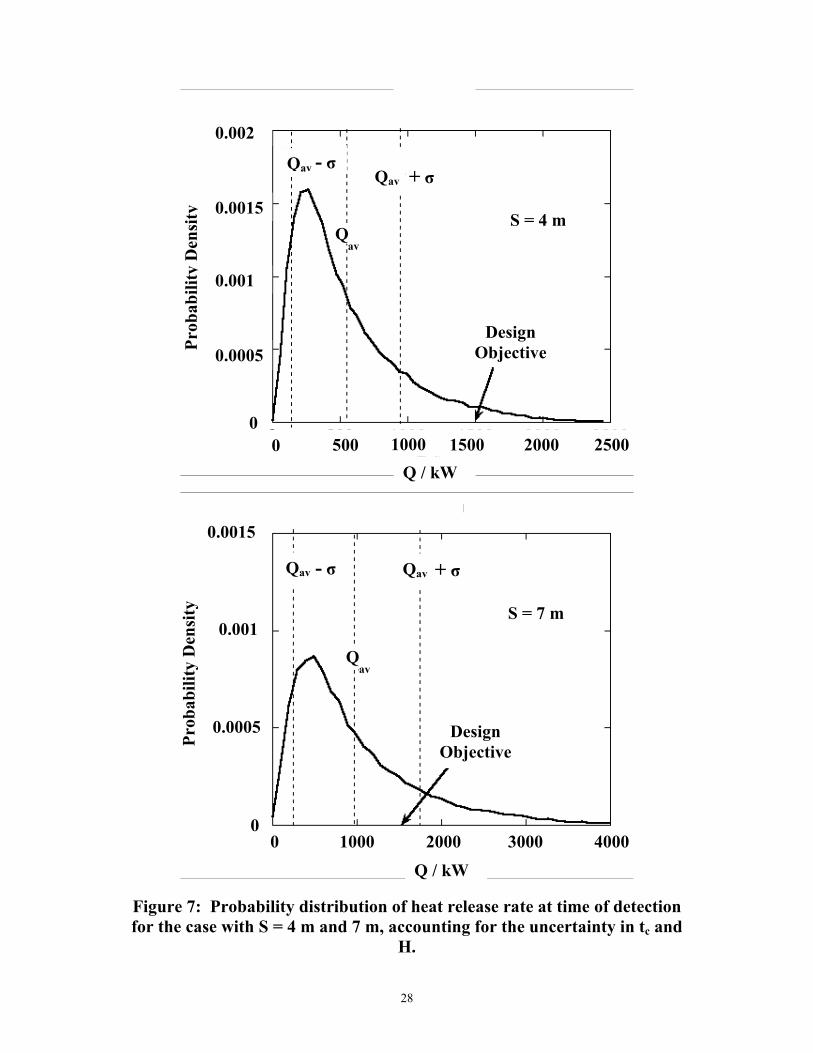
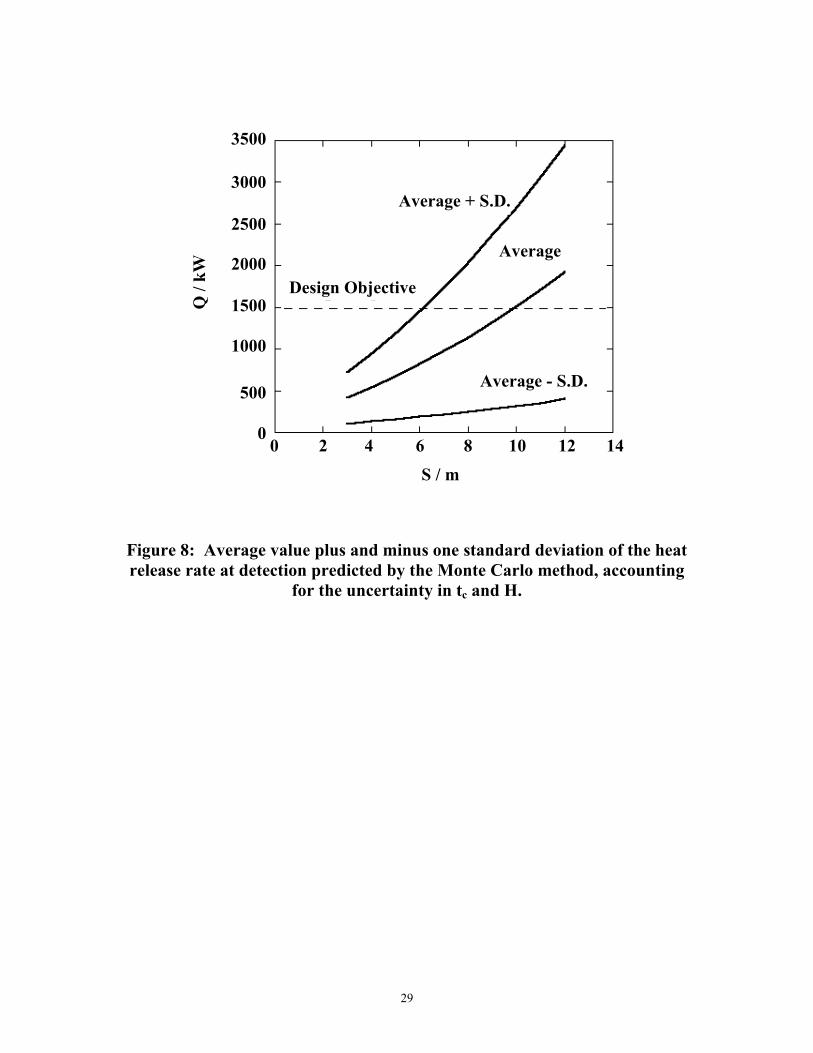
The distribution for the heat release rate at the time of detection for two detector spacings is
shown in Figure 7. It is interesting to note that the qualitative behavior of the distribution is
different from those of Figure 3. Uncertainties in the fire scenario affect not only the
average value of the heat release rate at detection, but also the overall distribution. Finally,
the average heat release rate at the time of detection, and its value plus and minus one
standard deviation are shown in Figure 8. The inclusion of uncertainties leads to a wider
spread of the predicted value for heat release rate at detection. This behavior can have
important implication in the development of risk based and/or cost-benefit based design of
thermal detection system.
15
5. Conclusion
The deterministic approach for the design of thermal fire detection system is shown to be
quite limited in terms of its capability to assess the effect of uncertainties in the assumed fire
scenarios. Utilizing an illustrative example, the Monte Carlo approach [16] is shown to be
effective not only in developing a design for the given design objective, but also in providing
a statistical assessment of the design and the possible alternatives. The method also provides
a rational basis to account for the effect of uncertainties in the assumed fire scenarios. The
Monte Carlo method is thus an effective approach for design applications in the development
of engineering performance-based fire codes [4-6].
16
Nomenclature
A dimensionless constant, Eq. (6)
pC specific heat of gas
D dimensionless parameter, Eq. (13)
g gravitational constant
H height above fire
p positive exponent in heat release rate
Q heat release rate
RTI response time index of detector
S detector spacing
r radial distance from fire plume axis
t time
ct critical time
*pt reduced time
T gas temperature
aT ambient temperature
dT detector temperature
u instantaneous velocity of fire gas
*pu reduced gas velocity
Y dimensionless parameter, Eq. (12)
α fire intensity coefficient
T∆ increase above ambient in gas temperature

17
dT∆ increase above ambient in detector temperature
0ρ density of ambient air

18
References
1. Burry, P., “Fire Detection and Alarm Systems,” A Guide to the BS Code, BS 5839:
Part 1, 2nd Edition, Paramount Publishing Ltd, 1996.
2. Moore, W.D., “Automatic Fire Detectors,” Section 5/Chapter 2, A.E. Cote, P.E., Fire
Protection Handbook, 18th Edition, National Fire Protection Association, Quincy,
Massachusetts, 1997.
3. Chow, W.K., and Hung, W.Y., “Green Building Conference 2002: Architecture
features for the environmental friendly century,” New Symbiotic Building and
Environmental Technology – The Future Scope in Subtropical Region, 23-25
September 2002, Oslo, Norway – Accepted to present.
4. British Standards Draft to Development DD 240, Fire Safety Engineering in
Buildings, Part 1, Guide to the Application of Fire Safety Engineering Principles,
British Standards Institution, London, 1997.
5. CIBSE Guide E, Fire Engineering, The Chartered Institution of Building Services
Engineers, 1997.
6. Hadjisophocleous, G.V., Bénichou, N., and Tamin, A.S., “Literature Review of
Performance-Based Codes and Design Environment,” Journal of Fire Protection
Engineering, Vol. 9, No. 1(1998), pp. 12-40.
7. SFPE Engineering Guide to Performance-Based Fire Protection Analysis and Design
of Buildings, Quincy, MA, Society of Fire Protection Engineers and National Fire
Protection Association, 2000.
8. Heskestad, G., and Smith, H., “Plunge Test for Determination of Sprinkler
Sensitivity,” Research Report JI 3A 1E2RR, Factory Mutual Research Corporation,
Norwood Ma, USA, 1980.
19
9. Heskestad, G., and Bill, R.G., “Qualification of Thermal Responsiveness of
Automatic Sprinklers Including Condition Effects” Fire Safety Journal, Vol.
14(1988), pp. 113-125.
10. Alpert, R. L., “Calculation of Response Time of Ceiling-Mounted Fire Detector,” Fire
Technology, Vol. 8(1972), pp. 181-195.
11. Heskestad, G., and Delichatsios, M. A., “Environment of Fire Detectors Phase I:
Effects of Fire Size, Ceiling Height and Material,” Volume II – Analysis, Technical
Report Serial No. 22427, RC 77-T-11, Factory Mutual Research Corporation, MA,
1977.
12. Schifiliti, R. P., “Use of Fire Plume Theory in the Design and Analysis of Fire
Detector and Sprinkler Response,” Master’s Thesis, Worcester Polytechnic Institute,
Worcester, MA, 1986.
13. Beyler, C. L., “A Design Method for Flaming Fire Detection,” Fire Technology, Vol.
20, No. 4(1984), p.4.
14. Stroup, D. W., and Evans, D. D., “Use of Computer Fire Models for Analyzing
Thermal Detector Spacing,” Fire Safety Journal, Vol. 14(1988), pp.33-45.
15. Schifiliti, R. P., Meacham, B.J., and Custer, R.L.P., “Design of Detection Systems,”
SFPE Handbook of Fire Protection Engineering, 3rd Edition, Section 4, Chapter 1, pp.
4-1– 4-44, Society of Fire Protection Engineers, National Fire Protection Association,
Inc., Quincy, Ma, USA, 2002.
16. “The Monte Carlo Method,” International Series of Monographs in Pure and Applied
Mathematics, Vol. 87 (1966), General Editors: Sneddon, I.N., Stark, M. and Ulam, S.
17. Zukoski, E. E., Kubota, T. and Cetegan, B., “Entrainment in Fire Plumes,” Fire
Safety Journal, Vol. 3(1980), pp. 107-121.

20
18. Stroup, D. W., Evans, D. D., and Martin, P., NBS Special Publication 712, National
Bureau of Standard, Gaithersburg, 1986.
WY20021dyv
21
Figure Captions
Figure 1: Positions of evenly spaced detectors and the location of the point (mark X) which
is farthest from any of the detector.
Figure 2: Failure probability for different detector spacing.
Figure 3: Probability distribution of heat release rate at time of detection for the case with S
= 7 m and 10 m. The average value (Qav) and standard deviation (σ) are also shown in the
figure.
Figure 4: Average value plus and minus one standard deviation of the heat release rate at
detection predicted by the Monte Carlo method.
Figure 5: Discrete probability and probability density for the range of tc generated by the
furniture calorimeter tests of NBS.
Figure 6: Failure probability for different detector spacing accounting for the uncertainty in tc
and H (the base case corresponds to results with constant tc and H presented in Figure 2).
Figure 7: Probability distribution of heat release rate at time of detection for the case with S
= 4 m and 7 m, accounting for the uncertainty in tc and H.
Figure 8: Average value plus and minus one standard deviation of the heat release rate at
detection predicted by the Monte Carlo method, accounting for the uncertainty in tc and H.
22
Figure 1: Positions of evenly spaced detectors and the location of the point (mark X) which is farthest from any of the detector.
S detector
detector
detector
detector
r
23
Figure 2: Failure probability for different detector spacing.
0 6 8 10 12 14 2 40
0.1
0.2
0.3
0.4
0.5
Failu
re P
roba
bilit
y
S / m
24
Figure 3: Probability distribution of heat release rate at time of detection for the case with S = 7 m and 10 m. The average value (Qav) and standard
deviation (σ) are also shown in the figure.
0
S = 10 m
Q / kW
Qav - σ + σ Qav
0.0015
0.001
0.0005
0 500 1000 1500 2000
Qav
Design Objective
2500 3000
Prob
abili
ty D
ensi
ty
Prob
abili
ty D
ensi
ty S = 7 m
Qav - σ + σ Qav
0.0015
0.001
0.0005
0 0 500 1000 1500 2000
Design Objective
Q / kW
av Q
25
Figure 4: Average value plus and minus one standard deviation of the heat release rate at detection predicted by the Monte Carlo method.
S / m
Average
Average - S.D.
Average + S.D.
Design Objective
Q /
kW
2500
2000
1500
1000
500
0 0 2 4 6 8 10 12 14
26
Figure 5: Discrete probability and probability density for the range of tc generated by the furniture calorimeter tests of NBS.
tc / s
0.25
0.2
0.15
0 500 1000 1500 2000 2500
Dis
cret
e Pr
obab
ility
0.1
0.05
0
tc / s
0.007
0.006
0.005
0 100 200 300 400 500 600 700 800
Dis
cret
e Pr
obab
ility
0.004
0.003
0
0.002
0.001
27
Figure 6: Failure probability for different detector spacing accounting for the uncertainty in tc and H (the base case corresponds to results with
constant tc and H presented in Figure 2).
S / m
Failu
re P
roba
bilit
y
Base Case
28
Figure 7: Probability distribution of heat release rate at time of detection for the case with S = 4 m and 7 m, accounting for the uncertainty in tc and
H.
Prob
abili
ty D
ensi
ty
S = 4 m
Qav - σ + σ
Qav
0.002
0.0015
0.0005
0 0 500 1000 1500 2000
Design Objective
Q / kW
av Q
0.001
2500
S = 7 m
Q / kW
Qav - σ + σ Qav
0.0015
0.001
0.0005
0 1000 2000
Qav
Design Objective
4000
Prob
abili
ty D
ensi
ty
3000 0
29
Figure 8: Average value plus and minus one standard deviation of the heat release rate at detection predicted by the Monte Carlo method, accounting
for the uncertainty in tc and H.
S / m
Average
Average - S.D.
Average + S.D.
Design Objective
Q /
kW
3500
3000
1500
1000
500
0 0 2 4 6 8 10 12 14
2500
2000