Embed Size (px)
Citation preview
A MODEL OF CAST-IN-PLACE RC PILE INCLUDINGREINFORCEMENT SWELLING AND ITS APPLICATION TO
EVALUATING THE INFLUENCE OF GROUND MOTION ON PILEFOUNDATIONS
(Translation from Proceedings of JSCE, No. 689/I-57, October 2001)
Masahiro SHIRATO Yoshitomi KIMURA Jiro FUKUI
When pile foundations experience a severe earthquake, it is generally assumed that postpeak bendingbehavior emerges locally in the pile at the top and near the boundaries between different soil layers inthe ultimate limit state. Experimental results for typical cast-in-place RC piles indicate that the postpeakbehavior is mainly caused by the collapse of covering concrete and the local swelling of reinforcing bars. Inthis paper, we propose a simple constitutive model in which a plastic buckling model is used to describe theswelling of reinforcing bars and which employs a fiber element for the piles. Also we use the plastic bucklinglength of the reinforcement bar as the element length. Numerical verification using this proposed modelshows approximate agreement with experimental results for model piles under cyclic loading. Furthermore,we carry out dynamic analysis using the proposed model of a bridge pile foundation, and propose a designcondition and criteria for pile foundations likely to suffer from seismic-induced ground vibration.
Key Words: pile foundation, postpeak behavior, swelling of reinforcing bar, kinematic interaction,seismic design
Masahiro Shirato is a research engineer of Foundation Engineering Research Team, Public Works Re-search Institute, Independent Administrative Institution, Japan. He earned his M. Eng. from TohokuUniversity in 1997. His main research interests include seismic design of foundations, numerical analysisfor soils and foundations and its application to practical design, and limit state design and reliabilitydesign of foundations. He is a member of JSCE.Yoshitomi Kimura is the head of Planning Division, Public Works Research Institute, IndependentAdministrative Institution, Japan. He earned his M. Eng. from Nagaoka University of Technologyin 1987. His research interests include ultimate limit state, ductility design, and reliability design offoundations. He is a member of JSCE.Jiro Fukui is the team leader of Foundation Engineering Research Team, Public Works Research Insti-tute, Independent Administrative Institution, Japan. He earned his M. Eng. from Osaka University in1980. He specializes in design, innovative construction technology, maintenance, and reinforcement offoundations, and inspection and countermeasure of effect of scouring on foundations. He is a memberof JSCE.
1. INTRODUCTION
In designing infrastructure, accountability for performance during earthquakes is being increasingly re-quired. The concept behind design codes for such structures is changing, with performance-based designbecoming more important. Design codes clarify only the performance requirements of structures. In thepresent Japanese design code for highway bridge foundations, the response to very strong seismic motionsof low probability during the service lifetime should be such that no excessive repair work is necessary,thus enabling a quick return to service, and that enough horizontal capacity and ductility are main-tained to facilitate repair of damage to the foundations if needed [1], [2]. The Specifications for HighwayBridges [1], [2] in Japan recommends a ductility design method to verify these requirement. This is a staticdesign method, but an inertial force corresponding to the first vibration mode of the seismic response isapplied to the superstructure, pier, and footing of the foundation.
In order to investigate quantitatively the stability of pile foundations subjected to such inertial forcesfrom the superstructure and the damage sustained, we have performed a series of large scale experi-ments and proposed appropriate limiting requirements for the displacement ductility factor of group-pilefoundations [2], [3], [4]. This recommended critical ductility factor is considered to be independent of thenumber of rows of piles and the type of piles as long as the piles satisfy the recommended structural detailsin the specification, although in practice it is true that the limit ductility factor must depend on thoseelements. The reason for the recommended limit ductility factor being made constant is that the pro-posal is based only on a small number of experimental studies, and numerical models and techniques arenot sufficiently developed, especially in postpeak behaviors, to allow reliable estimates of the relationshipbetween pile foundation stability and the damage sustained by each pile.
Moreover, recent reports of damage such as that in the Hanshin-Awaji earthquake (Kobe Earthquake) of1995 suggest that pile foundations are likely to sustain damage near boundaries between soft and hardsoil layers because of kinematic interactions between motions of the pile and soil during large earthquakes.Many studies have been carried with the aim of developing prediction methods which are suitable forpractical design against such damage [5], [6], [7], [8], [9]. Though it is true that local pile damage andcapacity loss resulting from ground vibration during an earthquake are considered to have a minor directeffect on the restoring force of the pile foundations as a system, since pile foundations consist of manypiles supported by the ground and are highly statically indeterminate, quantitative prediction methods forthe effects of local pile damage and capacity loss and corresponding design methods have not been fullyinvestigated.
In order to develop performance-based design codes/standards, it is necessary to understand the seismicbehavior of pile foundations and to clarify the relationship between possible damage state deep in theground and stability of foundation, just as inertial force has been verified. Unfortunately, experimentalinvestigations face difficulties in simulating dynamic soil-pile interactions under any conditions. On theother hand, numerical approaches are helpful because they can be extended to pile foundations of anydesign and also any ground conditions. However, we still have been unable to develop an appropriatenumerical model for piles that can handle the postpeak behavior of foundations. Cast-in-place RC pilefoundations are the most popular type in Japan. Hence it would be quite useful to develop a model whichcan trace the postpeak behavior of cast-in-place RC piles in order to establish a seismic design concept forsuch foundations.
Many numerical simulations have been reported to trace the postpeak behavior of RC members [10] and ithas been pointed out that the swelling of reinforcement must be properly modeled [11], [12], [13], [14], [15].Further, some consideration is necessary to avoid mesh size dependency of the numerical results when asoftening-type constitutive model is used in finite element analysis [16], [17]. We have carried out exper-iments on group pile foundations and single piles in air subject to cyclic loading and have reported theprogress of damage and postpeak behavior [3], [4]. We also have implemented finite element analysis usinga fiber element for the pile to simulate these experiments [18]. As a result, even though the nonlinearcharacteristics of members are strongly affected by changes in the applied axial load due to the horizontaldisplacement of the superstructure, we have shown that it is possible to trace the postpeak behavior offoundations numerically as long as each fiber is modeled with the appropriate material nonlinearities andswelling of the reinforcement. As for a general cast-in-place RC pile foundation, however, the problem
σ
ε
E0
E0
E1
(σr′, εr
′)(σ0, ε0)
(σr , εr)
s
e
(sr′, er
′)(s0, e0)
(sr, er)
ξ
ξ0
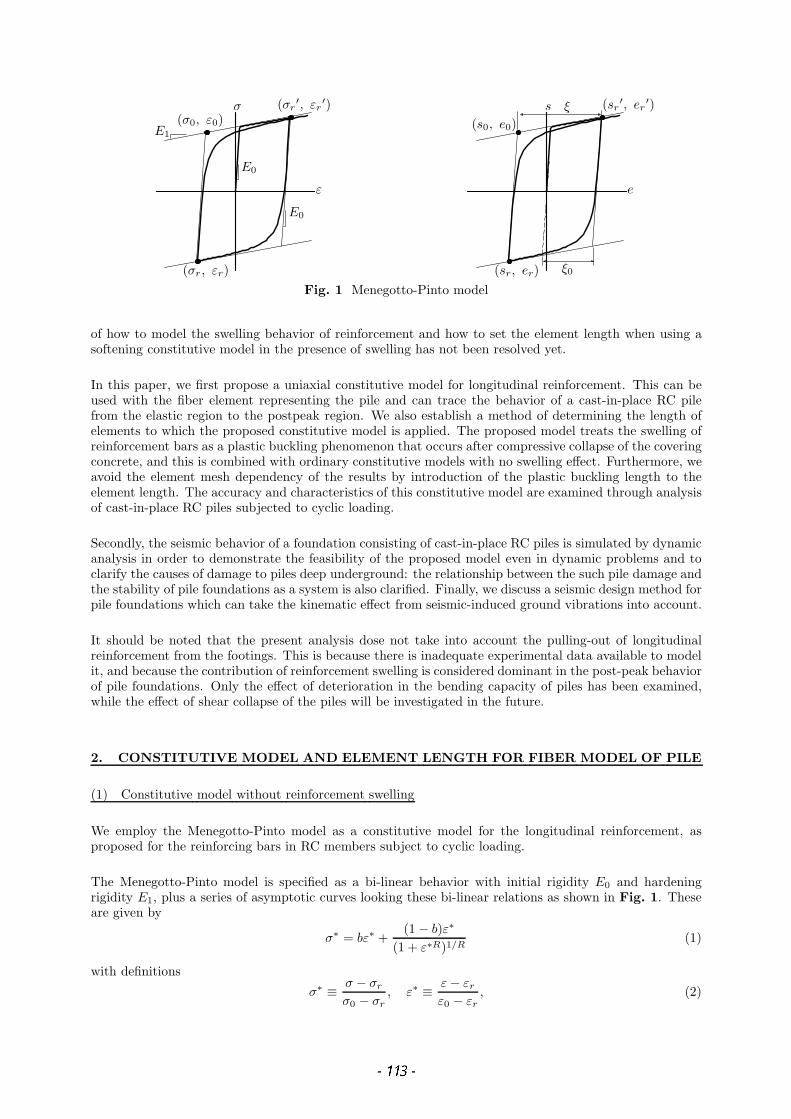
Fig. 1 Menegotto-Pinto model
of how to model the swelling behavior of reinforcement and how to set the element length when using asoftening constitutive model in the presence of swelling has not been resolved yet.
In this paper, we first propose a uniaxial constitutive model for longitudinal reinforcement. This can beused with the fiber element representing the pile and can trace the behavior of a cast-in-place RC pilefrom the elastic region to the postpeak region. We also establish a method of determining the length ofelements to which the proposed constitutive model is applied. The proposed model treats the swelling ofreinforcement bars as a plastic buckling phenomenon that occurs after compressive collapse of the coveringconcrete, and this is combined with ordinary constitutive models with no swelling effect. Furthermore, weavoid the element mesh dependency of the results by introduction of the plastic buckling length to theelement length. The accuracy and characteristics of this constitutive model are examined through analysisof cast-in-place RC piles subjected to cyclic loading.
Secondly, the seismic behavior of a foundation consisting of cast-in-place RC piles is simulated by dynamicanalysis in order to demonstrate the feasibility of the proposed model even in dynamic problems and toclarify the causes of damage to piles deep underground: the relationship between the such pile damage andthe stability of pile foundations as a system is also clarified. Finally, we discuss a seismic design method forpile foundations which can take the kinematic effect from seismic-induced ground vibrations into account.
It should be noted that the present analysis dose not take into account the pulling-out of longitudinalreinforcement from the footings. This is because there is inadequate experimental data available to modelit, and because the contribution of reinforcement swelling is considered dominant in the post-peak behaviorof pile foundations. Only the effect of deterioration in the bending capacity of piles has been examined,while the effect of shear collapse of the piles will be investigated in the future.
2. CONSTITUTIVE MODEL AND ELEMENT LENGTH FOR FIBER MODEL OF PILE
(1) Constitutive model without reinforcement swelling
We employ the Menegotto-Pinto model as a constitutive model for the longitudinal reinforcement, asproposed for the reinforcing bars in RC members subject to cyclic loading.
The Menegotto-Pinto model is specified as a bi-linear behavior with initial rigidity E0 and hardeningrigidity E1, plus a series of asymptotic curves looking these bi-linear relations as shown in Fig. 1. Theseare given by
σ∗ = bε∗ +(1 − b)ε∗
(1 + ε∗R)1/R(1)
with definitions
σ∗ ≡ σ − σr
σ0 − σr, ε∗ ≡ ε − εr
ε0 − εr, (2)
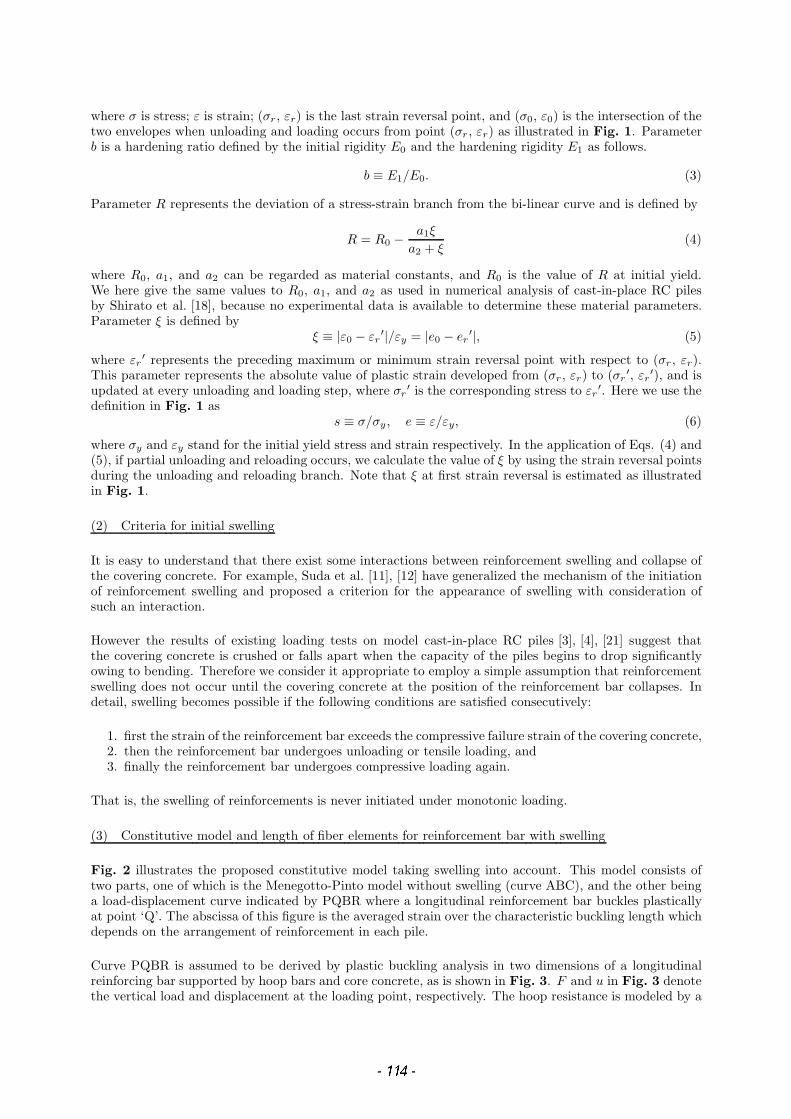
where σ is stress; ε is strain; (σr , εr) is the last strain reversal point, and (σ0, ε0) is the intersection of thetwo envelopes when unloading and loading occurs from point (σr , εr) as illustrated in Fig. 1. Parameterb is a hardening ratio defined by the initial rigidity E0 and the hardening rigidity E1 as follows.
b ≡ E1/E0. (3)
Parameter R represents the deviation of a stress-strain branch from the bi-linear curve and is defined by
R = R0 − a1ξ
a2 + ξ(4)
where R0, a1, and a2 can be regarded as material constants, and R0 is the value of R at initial yield.We here give the same values to R0, a1, and a2 as used in numerical analysis of cast-in-place RC pilesby Shirato et al. [18], because no experimental data is available to determine these material parameters.Parameter ξ is defined by
ξ ≡ |ε0 − εr′|/εy = |e0 − er
′|, (5)
where εr′ represents the preceding maximum or minimum strain reversal point with respect to (σr , εr).
This parameter represents the absolute value of plastic strain developed from (σr , εr) to (σr′, εr
′), and isupdated at every unloading and loading step, where σr
′ is the corresponding stress to εr′. Here we use the
definition in Fig. 1 ass ≡ σ/σy , e ≡ ε/εy, (6)
where σy and εy stand for the initial yield stress and strain respectively. In the application of Eqs. (4) and(5), if partial unloading and reloading occurs, we calculate the value of ξ by using the strain reversal pointsduring the unloading and reloading branch. Note that ξ at first strain reversal is estimated as illustratedin Fig. 1.
(2) Criteria for initial swelling
It is easy to understand that there exist some interactions between reinforcement swelling and collapse ofthe covering concrete. For example, Suda et al. [11], [12] have generalized the mechanism of the initiationof reinforcement swelling and proposed a criterion for the appearance of swelling with consideration ofsuch an interaction.
However the results of existing loading tests on model cast-in-place RC piles [3], [4], [21] suggest thatthe covering concrete is crushed or falls apart when the capacity of the piles begins to drop significantlyowing to bending. Therefore we consider it appropriate to employ a simple assumption that reinforcementswelling does not occur until the covering concrete at the position of the reinforcement bar collapses. Indetail, swelling becomes possible if the following conditions are satisfied consecutively:
1. first the strain of the reinforcement bar exceeds the compressive failure strain of the covering concrete,2. then the reinforcement bar undergoes unloading or tensile loading, and3. finally the reinforcement bar undergoes compressive loading again.
That is, the swelling of reinforcements is never initiated under monotonic loading.
(3) Constitutive model and length of fiber elements for reinforcement bar with swelling
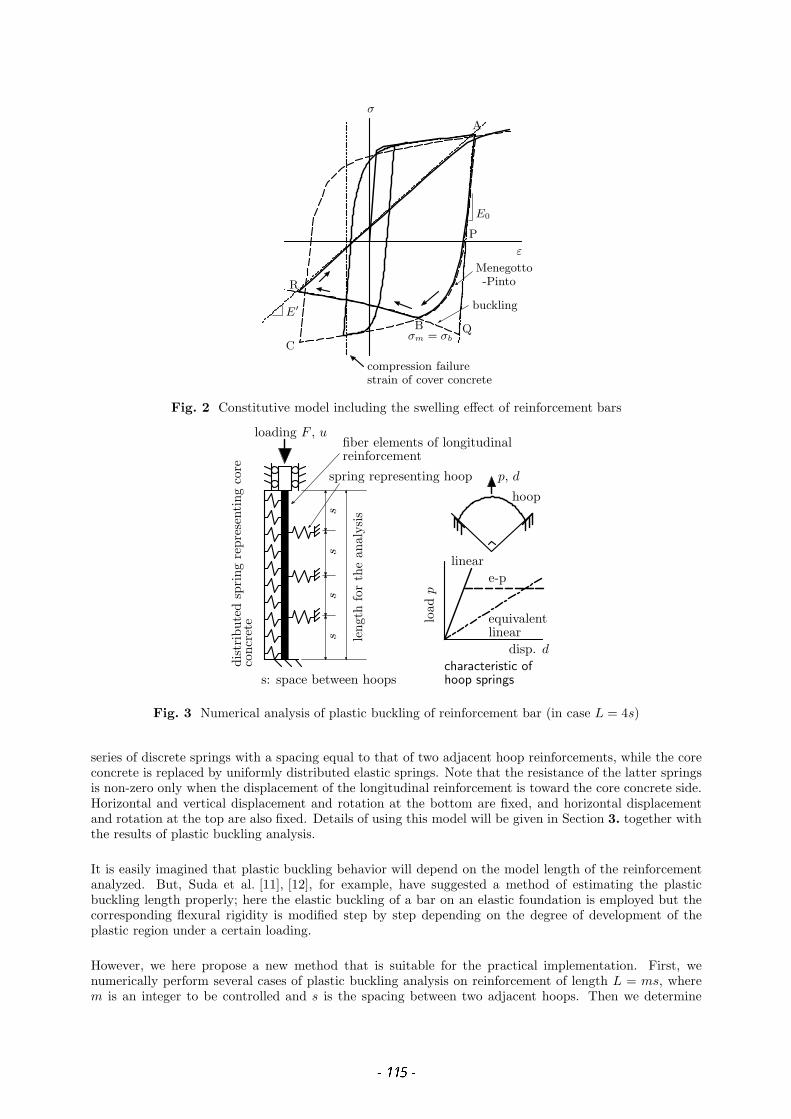
Fig. 2 illustrates the proposed constitutive model taking swelling into account. This model consists oftwo parts, one of which is the Menegotto-Pinto model without swelling (curve ABC), and the other beinga load-displacement curve indicated by PQBR where a longitudinal reinforcement bar buckles plasticallyat point ‘Q’. The abscissa of this figure is the averaged strain over the characteristic buckling length whichdepends on the arrangement of reinforcement in each pile.
Curve PQBR is assumed to be derived by plastic buckling analysis in two dimensions of a longitudinalreinforcing bar supported by hoop bars and core concrete, as is shown in Fig. 3. F and u in Fig. 3 denotethe vertical load and displacement at the loading point, respectively. The hoop resistance is modeled by a
σ
ε
Menegotto
buckling
A
B
C
P
Q
R -Pinto
σm = σb
E0
E′
compression failurestrain of cover concrete
Fig. 2 Constitutive model including the swelling effect of reinforcement bars
characteristic of
ss
ss
leng
thfo
rth
ean
alys
is
s: space between hoops
loading F , ufiber elements of longitudinal
spring representing hoop
conc
rete
disp. d
load
p
p, d
hoop
equivalent
linear
reinforcement
linear
hoop springs
e-p
dist
ribu
ted
spri
ngre
pres
enti
ngco
re
Fig. 3 Numerical analysis of plastic buckling of reinforcement bar (in case L = 4s)
series of discrete springs with a spacing equal to that of two adjacent hoop reinforcements, while the coreconcrete is replaced by uniformly distributed elastic springs. Note that the resistance of the latter springsis non-zero only when the displacement of the longitudinal reinforcement is toward the core concrete side.Horizontal and vertical displacement and rotation at the bottom are fixed, and horizontal displacementand rotation at the top are also fixed. Details of using this model will be given in Section 3. together withthe results of plastic buckling analysis.
It is easily imagined that plastic buckling behavior will depend on the model length of the reinforcementanalyzed. But, Suda et al. [11], [12], for example, have suggested a method of estimating the plasticbuckling length properly; here the elastic buckling of a bar on an elastic foundation is employed but thecorresponding flexural rigidity is modified step by step depending on the degree of development of theplastic region under a certain loading.
However, we here propose a new method that is suitable for the practical implementation. First, wenumerically perform several cases of plastic buckling analysis on reinforcement of length L = ms, wherem is an integer to be controlled and s is the spacing between two adjacent hoops. Then we determine
the critical m0; that is, the characteristic plastic buckling length L0 = m0s at which the most drastic fallin load is observed after initiation of plastic buckling among many trials with different m’s. It should benoted that there exist (m − 1) sets of springs for a bar of length L = ms. Dividing the obtained load Fby the cross sectional area of the reinforcement and also dividing the displacement u by the characteristicplastic buckling length L0 = m0s, we obtain the normalized and averaged stress-strain relation. Finallythis averaged stress-strain relationship is adopted to express the compressive branch of the stress-strainrelation curve PQBR in Fig. 2 by referring to the method employed by Gomes and Appleton [15]. Point ‘P’is where the elastic unloading path of rigidity E0 from the maximum tensile strain point ‘A’ in the historycrosses the zero stress level. Note that, in the analysis of pile behavior later on, we assume a piecewiselinear load-displacement relationship for buckled longitudinal reinforcement and interpolate the discretizedload-displacement data obtained from numerical analysis of plastic buckling of the reinforcement.
Swelling is assumed to occur when compressive stress σm derived from the Menegotto-Pinto model andσb obtained from the curve PQBR become coincident at a certain strain level. Thus, the stress-strainresponse chooses curve B-R not along path B-C of the Menegotto-Pinto model.
When strain reverses after the post buckling branch and becomes an expansion, the stress and strainresponse begins to tend toward the maximum tensile strain point of the history, as proposed by Shiratoet al. [18] This implies that the tensile resistance of longitudinal reinforcement bars that have experiencedswelling under compression becomes smaller than in the virgin state without any swelling. In the numericalanalysis of pile behavior below, we set the value of E0 to E′, which is the instantaneous modulus between‘R’ and ‘A’ (i.e. between the strain reversal point in the compression branch and the maximum tensilestrain point in the history), and set the curvature parameter R = R0 in the Menegotto-Pinto model.
The length of the fiber elements into which the proposed constitutive model is installed must be made equalto the characteristic plastic buckling length L0, as used in the setting of the curve PQBR. This is becausewe want to reflect the physical phenomena onto the element length through averaging the deformationwithin the element.
Judging from the results of past experimental research [3], [4], [21], we can expect the length of the swellingportion of the reinforcement in the standard arrangement to be approximately a half of the diameter of thepile. From this, it can be easily imagined that axial extension and compression will not occur simultaneouslyin one particular fiber of the element as long as the element length is of the same order, so our proposedmethod is considered applicable here. Since, in general, real piles are in practice around ten diametersin length or more, sufficient accuracy is possible from the viewpoint of convergence in the FEM analysis.Note that it is possible to apply the proposed model for handling the swelling effect to any constitutivemodel as long as it is described within the framework of deformation theory.
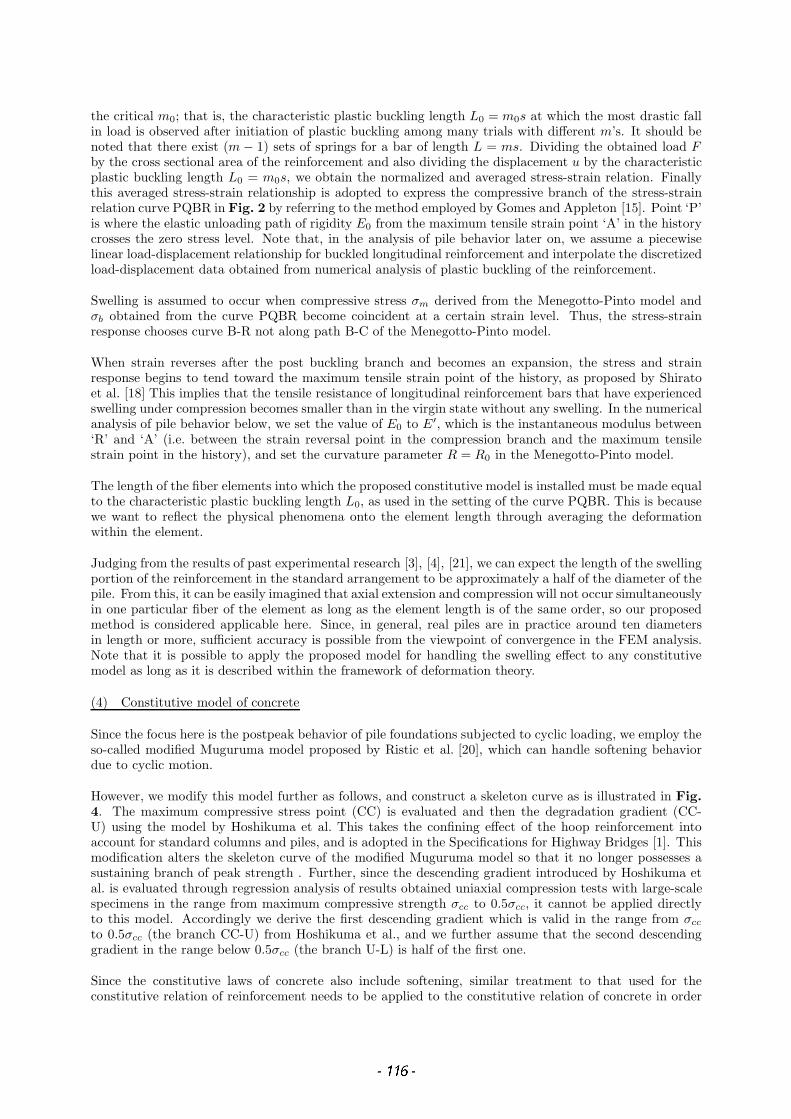
(4) Constitutive model of concrete
Since the focus here is the postpeak behavior of pile foundations subjected to cyclic loading, we employ theso-called modified Muguruma model proposed by Ristic et al. [20], which can handle softening behaviordue to cyclic motion.
However, we modify this model further as follows, and construct a skeleton curve as is illustrated in Fig.4. The maximum compressive stress point (CC) is evaluated and then the degradation gradient (CC-U) using the model by Hoshikuma et al. This takes the confining effect of the hoop reinforcement intoaccount for standard columns and piles, and is adopted in the Specifications for Highway Bridges [1]. Thismodification alters the skeleton curve of the modified Muguruma model so that it no longer possesses asustaining branch of peak strength . Further, since the descending gradient introduced by Hoshikuma etal. is evaluated through regression analysis of results obtained uniaxial compression tests with large-scalespecimens in the range from maximum compressive strength σcc to 0.5σcc, it cannot be applied directlyto this model. Accordingly we derive the first descending gradient which is valid in the range from σcc
to 0.5σcc (the branch CC-U) from Hoshikuma et al., and we further assume that the second descendinggradient in the range below 0.5σcc (the branch U-L) is half of the first one.
Since the constitutive laws of concrete also include softening, similar treatment to that used for theconstitutive relation of reinforcement needs to be applied to the constitutive relation of concrete in order

σ
ε
0.5σcc
σccCC
U
L
Fig. 4 Schematic outline of constitutive model of concrete employed in this paper
to avoid mesh size dependency in the numerical results. Although many reports exist on this subject,there is no well-established method of solving this problem. Therefore we here employ the model proposedHoshikuma et al. without any modification [16].
3. PLASTIC BUCKLING ANALYSIS OF REINFORCING BAR
(1) Numerical model for plastic buckling analysis
Now we carry out a series of plastic buckling analyses of reinforcing bars constrained by core concrete andhoops, as is illustrated in Fig. 3. The 2D finite element method is employed within a framework of finitedisplacements. A reinforcing bar is expressed by a group of fiber elements; that is, the cross section isdivided into a number of layer-like elements.
We adopt the Menegotto-Pinto model as the constitutive model for each fiber of a reinforcing bar. Althoughit would be possible to use other models, rather than the Menegotto-Pinto model originally developed forthe analysis of RC members subject to cyclic load, for consistency of analysis we employ the same model asused for the analysis of the behavior of cast-in-place RC piles, as mentioned later. The spring constant ofthe spring representing the hoop resistance is obtained through a series of separate finite element analysesof an arch model subjected to a normal force at the top, as shown in Fig. 3. In this model, the archconsists of a hoop reinforcement with both ends fixed and an open angle of 90 degrees. The distributedspring used to model the resistance of the core concrete does not resist tensile force, and the compressivespring constant is set just large enough to prevent the longitudinal reinforcement from penetrating intothe core concrete.
The reinforcing bar is divided into ten elements in the longitudinal direction, and the cross section ismodeled by 50 fiber elements. A distributed concrete spring is located at each node. Finally a small initialparabolic imperfection is introduced into the longitudinal reinforcing bar so that buckling can be triggeredeasily.
(2) Determination of plastic buckling length of reinforcing bar
Two model cast-in-place RC piles are examined in this paper. These have been the subject of model tests inexperiments where the behavior of piles subject to horizontal cyclic loading was examined. The numericalanalysis is presented in Section 4. The dimensions of the model piles are summarized in Figs. 10 and 15.We refer to the first as the type-1 pile specimen and to the latter pile as the type 2 pile specimen. Materialconstants and parameters for the Menegotto-Pinto model are chosen to be identical with those employedin the analysis of the experiments described in Section 4.
First, assuming that the hoops never yield, we obtain spring constants kr which represent the hoopresistance by finite element analysis of the arch model shown in Fig. 3. The value of kr for the type-1
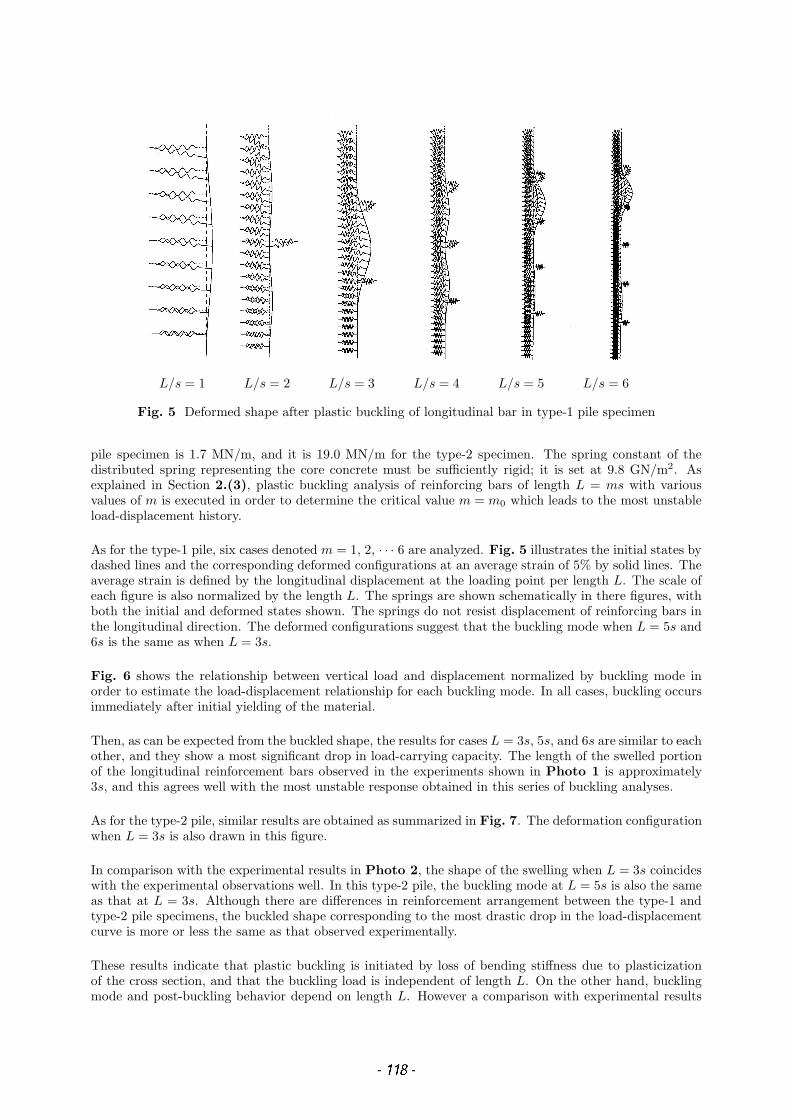
L/s = 1 L/s = 2 L/s = 3 L/s = 4 L/s = 5 L/s = 6
Fig. 5 Deformed shape after plastic buckling of longitudinal bar in type-1 pile specimen
pile specimen is 1.7 MN/m, and it is 19.0 MN/m for the type-2 specimen. The spring constant of thedistributed spring representing the core concrete must be sufficiently rigid; it is set at 9.8 GN/m2. Asexplained in Section 2.(3), plastic buckling analysis of reinforcing bars of length L = ms with variousvalues of m is executed in order to determine the critical value m = m0 which leads to the most unstableload-displacement history.
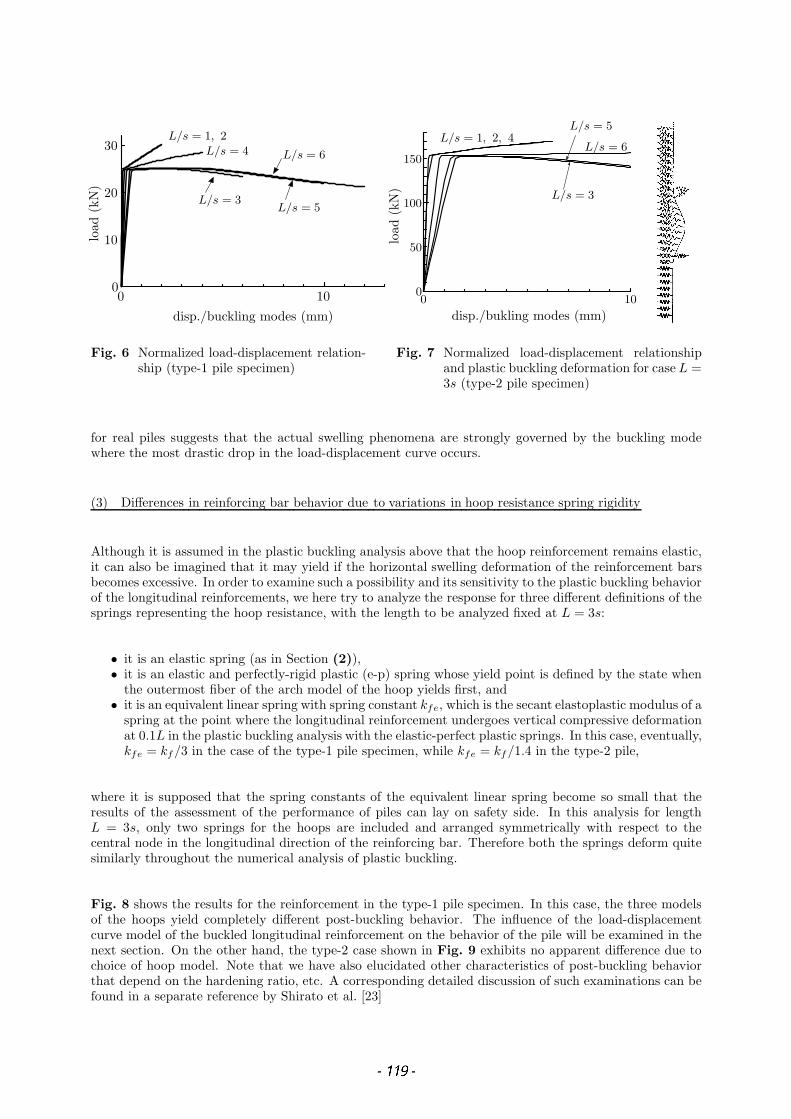
As for the type-1 pile, six cases denoted m = 1, 2, · · · 6 are analyzed. Fig. 5 illustrates the initial states bydashed lines and the corresponding deformed configurations at an average strain of 5% by solid lines. Theaverage strain is defined by the longitudinal displacement at the loading point per length L. The scale ofeach figure is also normalized by the length L. The springs are shown schematically in there figures, withboth the initial and deformed states shown. The springs do not resist displacement of reinforcing bars inthe longitudinal direction. The deformed configurations suggest that the buckling mode when L = 5s and6s is the same as when L = 3s.
Fig. 6 shows the relationship between vertical load and displacement normalized by buckling mode inorder to estimate the load-displacement relationship for each buckling mode. In all cases, buckling occursimmediately after initial yielding of the material.
Then, as can be expected from the buckled shape, the results for cases L = 3s, 5s, and 6s are similar to eachother, and they show a most significant drop in load-carrying capacity. The length of the swelled portionof the longitudinal reinforcement bars observed in the experiments shown in Photo 1 is approximately3s, and this agrees well with the most unstable response obtained in this series of buckling analyses.
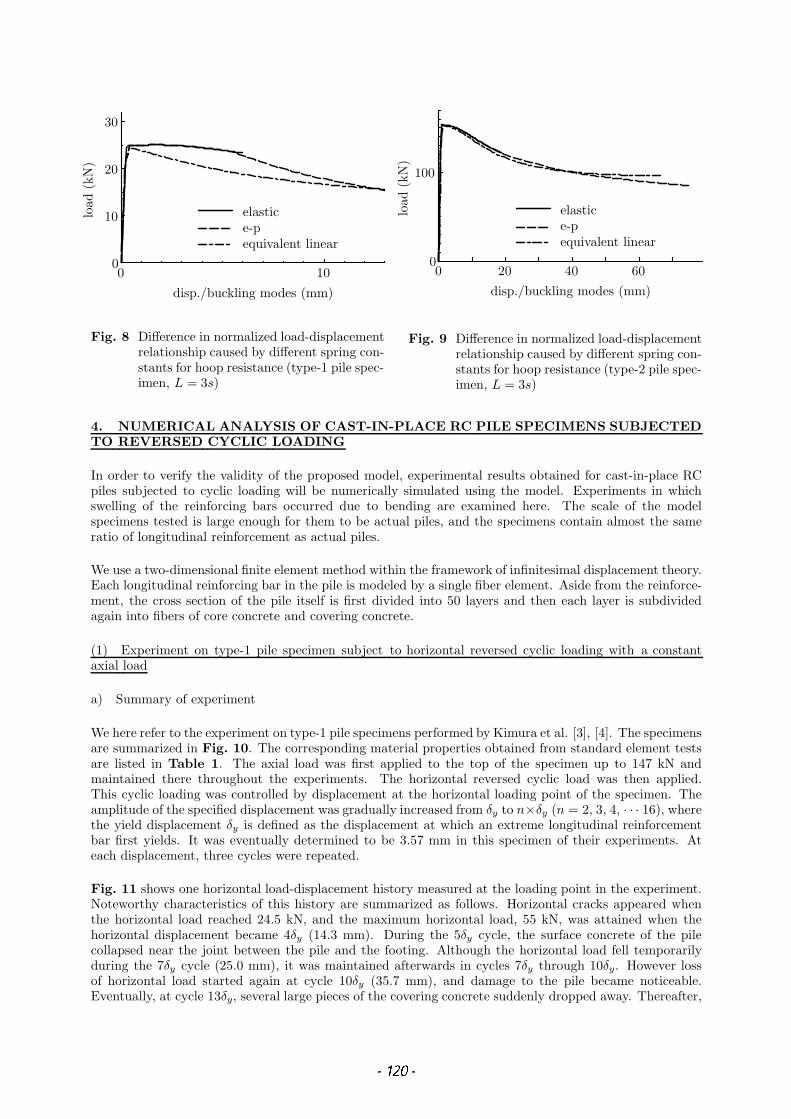
As for the type-2 pile, similar results are obtained as summarized in Fig. 7. The deformation configurationwhen L = 3s is also drawn in this figure.
In comparison with the experimental results in Photo 2, the shape of the swelling when L = 3s coincideswith the experimental observations well. In this type-2 pile, the buckling mode at L = 5s is also the sameas that at L = 3s. Although there are differences in reinforcement arrangement between the type-1 andtype-2 pile specimens, the buckled shape corresponding to the most drastic drop in the load-displacementcurve is more or less the same as that observed experimentally.
These results indicate that plastic buckling is initiated by loss of bending stiffness due to plasticizationof the cross section, and that the buckling load is independent of length L. On the other hand, bucklingmode and post-buckling behavior depend on length L. However a comparison with experimental results
0 100
10
20
30L/s = 1, 2
L/s = 4 L/s = 6
L/s = 5L/s = 3
disp./buckling modes (mm)
load
(kN
)
Fig. 6 Normalized load-displacement relation-ship (type-1 pile specimen)
0 100
50
100
150
L/s = 1, 2, 4
L/s = 3
L/s = 5
L/s = 6
disp./bukling modes (mm)
load
(kN
)
Fig. 7 Normalized load-displacement relationshipand plastic buckling deformation for case L =3s (type-2 pile specimen)
for real piles suggests that the actual swelling phenomena are strongly governed by the buckling modewhere the most drastic drop in the load-displacement curve occurs.
(3) Differences in reinforcing bar behavior due to variations in hoop resistance spring rigidity
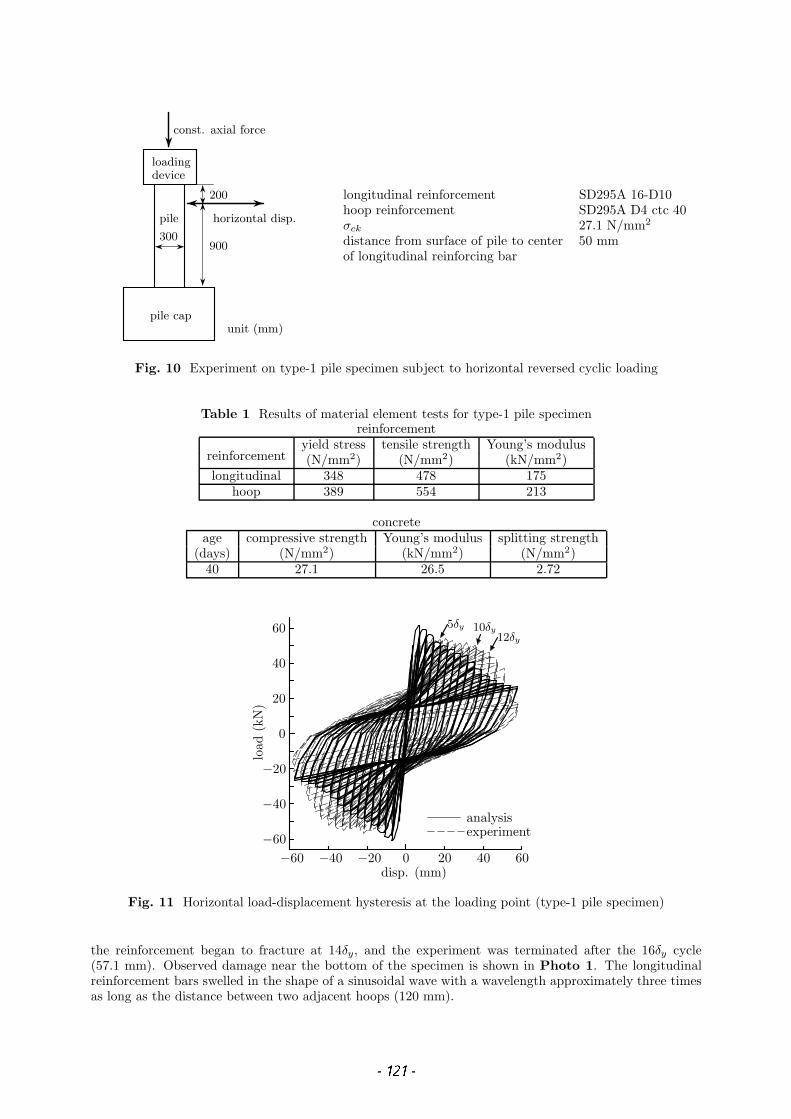
Although it is assumed in the plastic buckling analysis above that the hoop reinforcement remains elastic,it can also be imagined that it may yield if the horizontal swelling deformation of the reinforcement barsbecomes excessive. In order to examine such a possibility and its sensitivity to the plastic buckling behaviorof the longitudinal reinforcements, we here try to analyze the response for three different definitions of thesprings representing the hoop resistance, with the length to be analyzed fixed at L = 3s:
• it is an elastic spring (as in Section (2)),• it is an elastic and perfectly-rigid plastic (e-p) spring whose yield point is defined by the state when
the outermost fiber of the arch model of the hoop yields first, and• it is an equivalent linear spring with spring constant kfe, which is the secant elastoplastic modulus of a
spring at the point where the longitudinal reinforcement undergoes vertical compressive deformationat 0.1L in the plastic buckling analysis with the elastic-perfect plastic springs. In this case, eventually,kfe = kf/3 in the case of the type-1 pile specimen, while kfe = kf/1.4 in the type-2 pile,
where it is supposed that the spring constants of the equivalent linear spring become so small that theresults of the assessment of the performance of piles can lay on safety side. In this analysis for lengthL = 3s, only two springs for the hoops are included and arranged symmetrically with respect to thecentral node in the longitudinal direction of the reinforcing bar. Therefore both the springs deform quitesimilarly throughout the numerical analysis of plastic buckling.
Fig. 8 shows the results for the reinforcement in the type-1 pile specimen. In this case, the three modelsof the hoops yield completely different post-buckling behavior. The influence of the load-displacementcurve model of the buckled longitudinal reinforcement on the behavior of the pile will be examined in thenext section. On the other hand, the type-2 case shown in Fig. 9 exhibits no apparent difference due tochoice of hoop model. Note that we have also elucidated other characteristics of post-buckling behaviorthat depend on the hardening ratio, etc. A corresponding detailed discussion of such examinations can befound in a separate reference by Shirato et al. [23]
0 100
10
20
30
disp./buckling modes (mm)
load
(kN
)
elastice-pequivalent linear
Fig. 8 Difference in normalized load-displacementrelationship caused by different spring con-stants for hoop resistance (type-1 pile spec-imen, L = 3s)
0 20 40 600
100
disp./buckling modes (mm)
load
(kN
)
elastice-pequivalent linear
Fig. 9 Difference in normalized load-displacementrelationship caused by different spring con-stants for hoop resistance (type-2 pile spec-imen, L = 3s)
4. NUMERICAL ANALYSIS OF CAST-IN-PLACE RC PILE SPECIMENS SUBJECTEDTO REVERSED CYCLIC LOADING
In order to verify the validity of the proposed model, experimental results obtained for cast-in-place RCpiles subjected to cyclic loading will be numerically simulated using the model. Experiments in whichswelling of the reinforcing bars occurred due to bending are examined here. The scale of the modelspecimens tested is large enough for them to be actual piles, and the specimens contain almost the sameratio of longitudinal reinforcement as actual piles.
We use a two-dimensional finite element method within the framework of infinitesimal displacement theory.Each longitudinal reinforcing bar in the pile is modeled by a single fiber element. Aside from the reinforce-ment, the cross section of the pile itself is first divided into 50 layers and then each layer is subdividedagain into fibers of core concrete and covering concrete.
(1) Experiment on type-1 pile specimen subject to horizontal reversed cyclic loading with a constantaxial load
a) Summary of experiment
We here refer to the experiment on type-1 pile specimens performed by Kimura et al. [3], [4]. The specimensare summarized in Fig. 10. The corresponding material properties obtained from standard element testsare listed in Table 1. The axial load was first applied to the top of the specimen up to 147 kN andmaintained there throughout the experiments. The horizontal reversed cyclic load was then applied.This cyclic loading was controlled by displacement at the horizontal loading point of the specimen. Theamplitude of the specified displacement was gradually increased from δy to n×δy (n = 2, 3, 4, · · · 16), wherethe yield displacement δy is defined as the displacement at which an extreme longitudinal reinforcementbar first yields. It was eventually determined to be 3.57 mm in this specimen of their experiments. Ateach displacement, three cycles were repeated.
Fig. 11 shows one horizontal load-displacement history measured at the loading point in the experiment.Noteworthy characteristics of this history are summarized as follows. Horizontal cracks appeared whenthe horizontal load reached 24.5 kN, and the maximum horizontal load, 55 kN, was attained when thehorizontal displacement became 4δy (14.3 mm). During the 5δy cycle, the surface concrete of the pilecollapsed near the joint between the pile and the footing. Although the horizontal load fell temporarilyduring the 7δy cycle (25.0 mm), it was maintained afterwards in cycles 7δy through 10δy. However lossof horizontal load started again at cycle 10δy (35.7 mm), and damage to the pile became noticeable.Eventually, at cycle 13δy, several large pieces of the covering concrete suddenly dropped away. Thereafter,
300900
horizontal disp.
pile cap
200
const. axial force
unit (mm)
pile
loadingdevice
longitudinal reinforcement SD295A 16-D10hoop reinforcement SD295A D4 ctc 40σck 27.1 N/mm2
distance from surface of pile to centerof longitudinal reinforcing bar
50 mm
Fig. 10 Experiment on type-1 pile specimen subject to horizontal reversed cyclic loading
Table 1 Results of material element tests for type-1 pile specimenreinforcement
reinforcementyield stress tensile strength Young’s modulus(N/mm2) (N/mm2) (kN/mm2)
longitudinal 348 478 175hoop 389 554 213
concreteage compressive strength Young’s modulus splitting strength
(days) (N/mm2) (kN/mm2) (N/mm2)40 27.1 26.5 2.72
−60 −40 −20 0 20 40 60−60
−40
−20
0
20
40
60
disp. (mm)
load
(kN
)
analysisexperiment
10δy5δy
12δy
Fig. 11 Horizontal load-displacement hysteresis at the loading point (type-1 pile specimen)
the reinforcement began to fracture at 14δy, and the experiment was terminated after the 16δy cycle(57.1 mm). Observed damage near the bottom of the specimen is shown in Photo 1. The longitudinalreinforcement bars swelled in the shape of a sinusoidal wave with a wavelength approximately three timesas long as the distance between two adjacent hoops (120 mm).
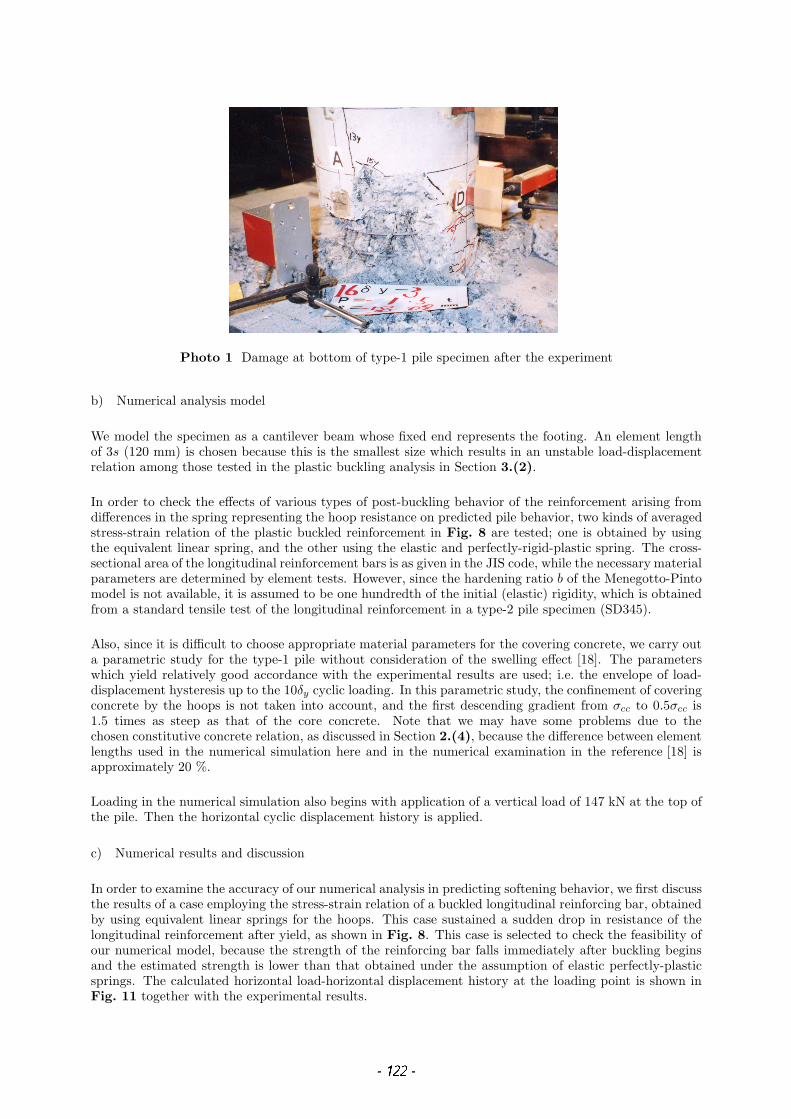
Photo 1 Damage at bottom of type-1 pile specimen after the experiment
b) Numerical analysis model
We model the specimen as a cantilever beam whose fixed end represents the footing. An element lengthof 3s (120 mm) is chosen because this is the smallest size which results in an unstable load-displacementrelation among those tested in the plastic buckling analysis in Section 3.(2).
In order to check the effects of various types of post-buckling behavior of the reinforcement arising fromdifferences in the spring representing the hoop resistance on predicted pile behavior, two kinds of averagedstress-strain relation of the plastic buckled reinforcement in Fig. 8 are tested; one is obtained by usingthe equivalent linear spring, and the other using the elastic and perfectly-rigid-plastic spring. The cross-sectional area of the longitudinal reinforcement bars is as given in the JIS code, while the necessary materialparameters are determined by element tests. However, since the hardening ratio b of the Menegotto-Pintomodel is not available, it is assumed to be one hundredth of the initial (elastic) rigidity, which is obtainedfrom a standard tensile test of the longitudinal reinforcement in a type-2 pile specimen (SD345).
Also, since it is difficult to choose appropriate material parameters for the covering concrete, we carry outa parametric study for the type-1 pile without consideration of the swelling effect [18]. The parameterswhich yield relatively good accordance with the experimental results are used; i.e. the envelope of load-displacement hysteresis up to the 10δy cyclic loading. In this parametric study, the confinement of coveringconcrete by the hoops is not taken into account, and the first descending gradient from σcc to 0.5σcc is1.5 times as steep as that of the core concrete. Note that we may have some problems due to thechosen constitutive concrete relation, as discussed in Section 2.(4), because the difference between elementlengths used in the numerical simulation here and in the numerical examination in the reference [18] isapproximately 20 %.
Loading in the numerical simulation also begins with application of a vertical load of 147 kN at the top ofthe pile. Then the horizontal cyclic displacement history is applied.
c) Numerical results and discussion
In order to examine the accuracy of our numerical analysis in predicting softening behavior, we first discussthe results of a case employing the stress-strain relation of a buckled longitudinal reinforcing bar, obtainedby using equivalent linear springs for the hoops. This case sustained a sudden drop in resistance of thelongitudinal reinforcement after yield, as shown in Fig. 8. This case is selected to check the feasibility ofour numerical model, because the strength of the reinforcing bar falls immediately after buckling beginsand the estimated strength is lower than that obtained under the assumption of elastic perfectly-plasticsprings. The calculated horizontal load-horizontal displacement history at the loading point is shown inFig. 11 together with the experimental results.
−0.05 0 0.05−400
−200
0
200
400
strain
stre
ss(N
/mm
2)
Fig. 12 Stress-strain hysteresis of typical out-ermost longitudinal reinforcement barplaced at the bottom of a pile
−60 −40 −20 0 20 40 60−60
−40
−20
0
20
40
60
disp. (mm)
load
(kN
)
analysisexperiment
5δy
12δy
10δy
Fig. 13 Horizontal load-displacement hysteresisat the loading point for case without con-sidering swelling of reinforcing bars (type-1 pile specimen)
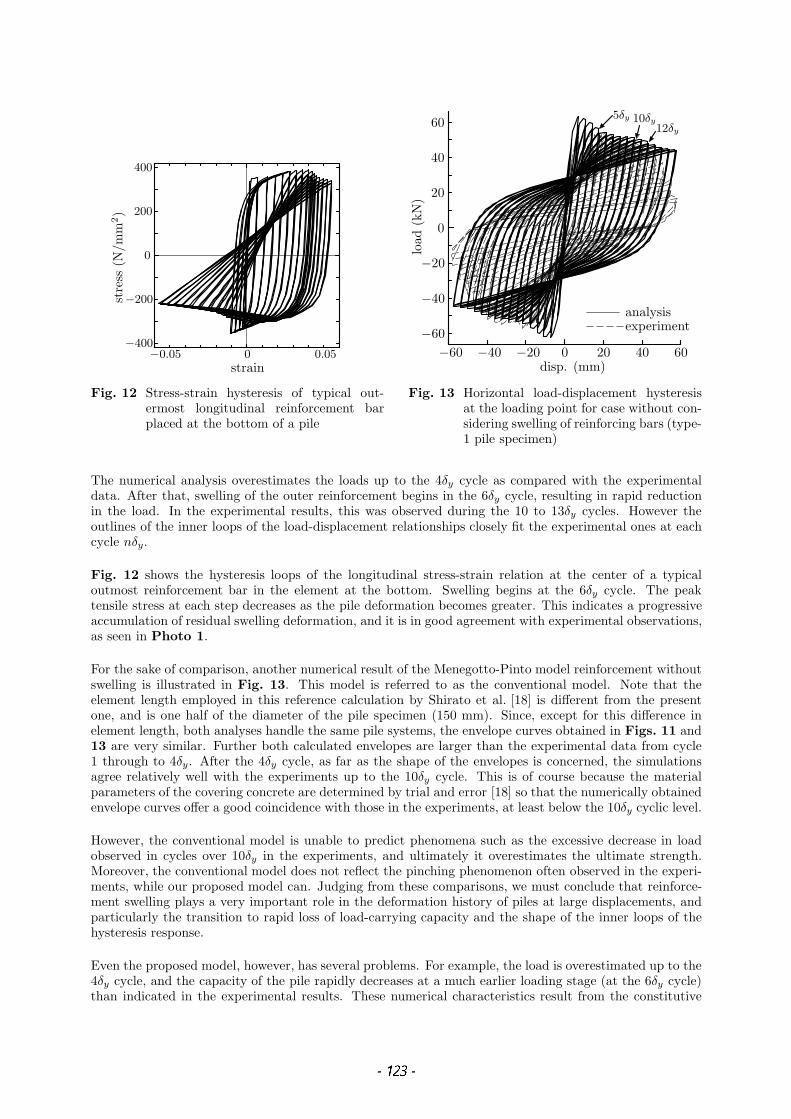
The numerical analysis overestimates the loads up to the 4δy cycle as compared with the experimentaldata. After that, swelling of the outer reinforcement begins in the 6δy cycle, resulting in rapid reductionin the load. In the experimental results, this was observed during the 10 to 13δy cycles. However theoutlines of the inner loops of the load-displacement relationships closely fit the experimental ones at eachcycle nδy.
Fig. 12 shows the hysteresis loops of the longitudinal stress-strain relation at the center of a typicaloutmost reinforcement bar in the element at the bottom. Swelling begins at the 6δy cycle. The peaktensile stress at each step decreases as the pile deformation becomes greater. This indicates a progressiveaccumulation of residual swelling deformation, and it is in good agreement with experimental observations,as seen in Photo 1.
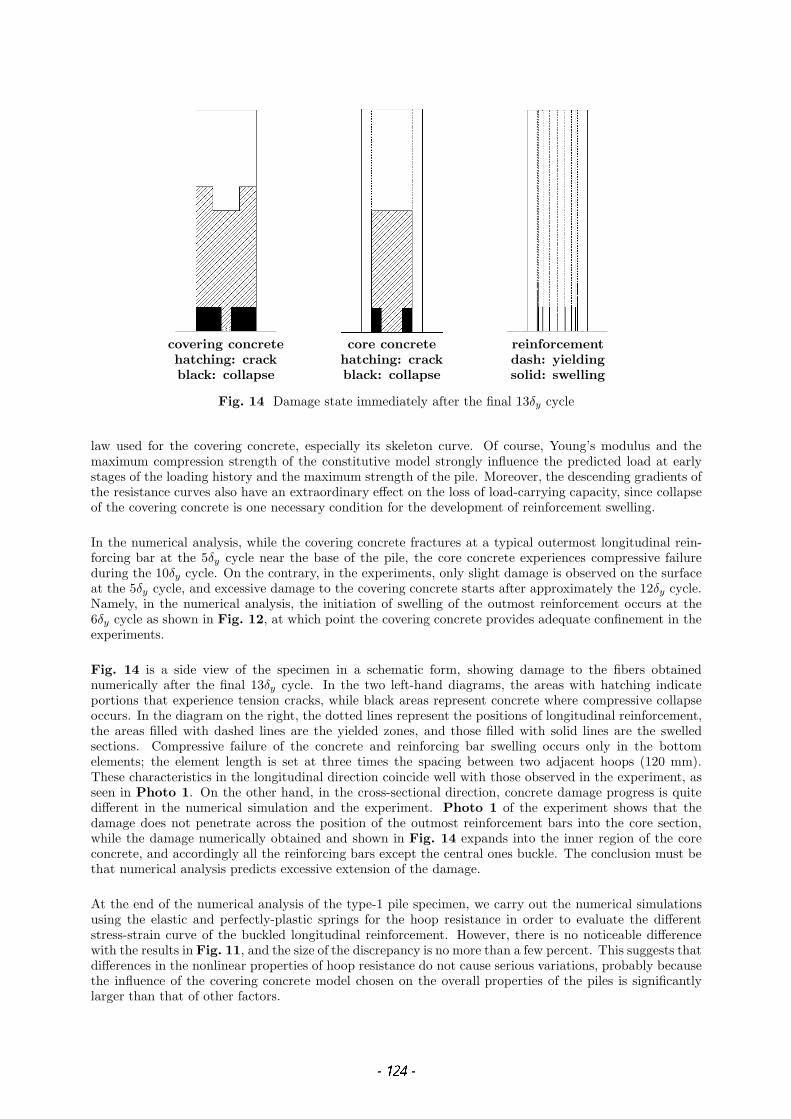
For the sake of comparison, another numerical result of the Menegotto-Pinto model reinforcement withoutswelling is illustrated in Fig. 13. This model is referred to as the conventional model. Note that theelement length employed in this reference calculation by Shirato et al. [18] is different from the presentone, and is one half of the diameter of the pile specimen (150 mm). Since, except for this difference inelement length, both analyses handle the same pile systems, the envelope curves obtained in Figs. 11 and13 are very similar. Further both calculated envelopes are larger than the experimental data from cycle1 through to 4δy. After the 4δy cycle, as far as the shape of the envelopes is concerned, the simulationsagree relatively well with the experiments up to the 10δy cycle. This is of course because the materialparameters of the covering concrete are determined by trial and error [18] so that the numerically obtainedenvelope curves offer a good coincidence with those in the experiments, at least below the 10δy cyclic level.
However, the conventional model is unable to predict phenomena such as the excessive decrease in loadobserved in cycles over 10δy in the experiments, and ultimately it overestimates the ultimate strength.Moreover, the conventional model does not reflect the pinching phenomenon often observed in the experi-ments, while our proposed model can. Judging from these comparisons, we must conclude that reinforce-ment swelling plays a very important role in the deformation history of piles at large displacements, andparticularly the transition to rapid loss of load-carrying capacity and the shape of the inner loops of thehysteresis response.
Even the proposed model, however, has several problems. For example, the load is overestimated up to the4δy cycle, and the capacity of the pile rapidly decreases at a much earlier loading stage (at the 6δy cycle)than indicated in the experimental results. These numerical characteristics result from the constitutive
covering concretehatching: crackblack: collapse
core concretehatching: crackblack: collapse
reinforcementdash: yieldingsolid: swelling
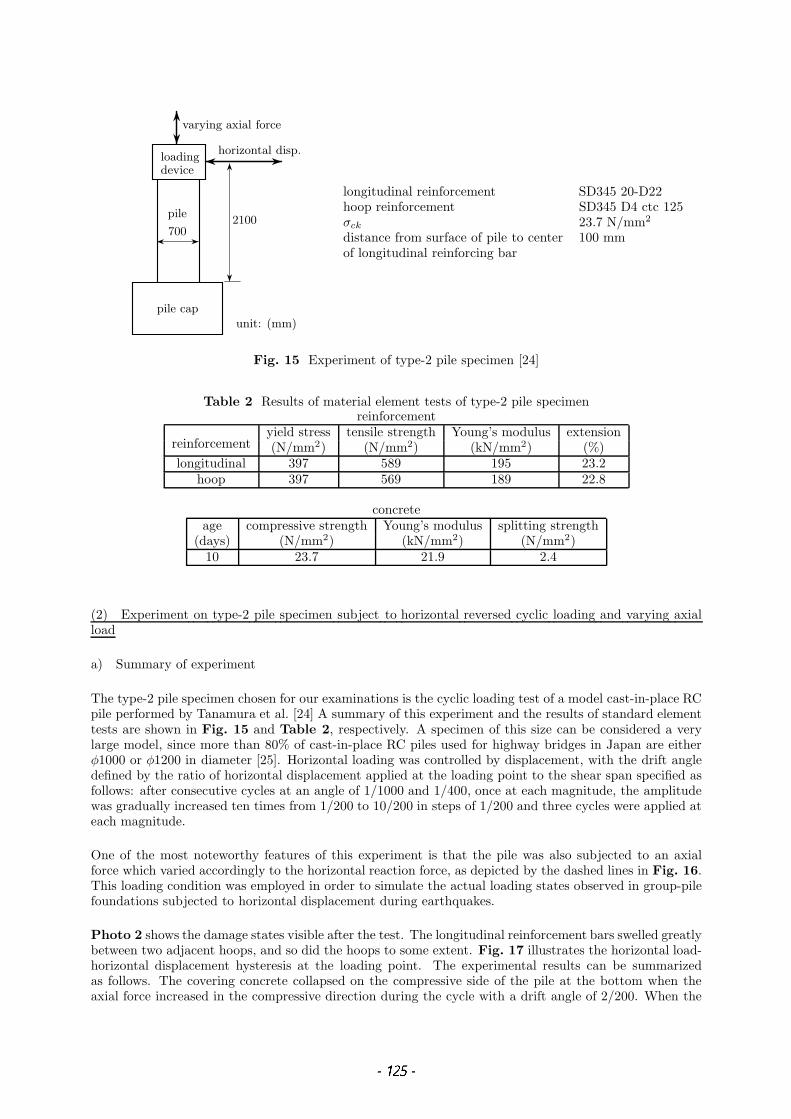
Fig. 14 Damage state immediately after the final 13δy cycle
law used for the covering concrete, especially its skeleton curve. Of course, Young’s modulus and themaximum compression strength of the constitutive model strongly influence the predicted load at earlystages of the loading history and the maximum strength of the pile. Moreover, the descending gradients ofthe resistance curves also have an extraordinary effect on the loss of load-carrying capacity, since collapseof the covering concrete is one necessary condition for the development of reinforcement swelling.
In the numerical analysis, while the covering concrete fractures at a typical outermost longitudinal rein-forcing bar at the 5δy cycle near the base of the pile, the core concrete experiences compressive failureduring the 10δy cycle. On the contrary, in the experiments, only slight damage is observed on the surfaceat the 5δy cycle, and excessive damage to the covering concrete starts after approximately the 12δy cycle.Namely, in the numerical analysis, the initiation of swelling of the outmost reinforcement occurs at the6δy cycle as shown in Fig. 12, at which point the covering concrete provides adequate confinement in theexperiments.
Fig. 14 is a side view of the specimen in a schematic form, showing damage to the fibers obtainednumerically after the final 13δy cycle. In the two left-hand diagrams, the areas with hatching indicateportions that experience tension cracks, while black areas represent concrete where compressive collapseoccurs. In the diagram on the right, the dotted lines represent the positions of longitudinal reinforcement,the areas filled with dashed lines are the yielded zones, and those filled with solid lines are the swelledsections. Compressive failure of the concrete and reinforcing bar swelling occurs only in the bottomelements; the element length is set at three times the spacing between two adjacent hoops (120 mm).These characteristics in the longitudinal direction coincide well with those observed in the experiment, asseen in Photo 1. On the other hand, in the cross-sectional direction, concrete damage progress is quitedifferent in the numerical simulation and the experiment. Photo 1 of the experiment shows that thedamage does not penetrate across the position of the outmost reinforcement bars into the core section,while the damage numerically obtained and shown in Fig. 14 expands into the inner region of the coreconcrete, and accordingly all the reinforcing bars except the central ones buckle. The conclusion must bethat numerical analysis predicts excessive extension of the damage.
At the end of the numerical analysis of the type-1 pile specimen, we carry out the numerical simulationsusing the elastic and perfectly-plastic springs for the hoop resistance in order to evaluate the differentstress-strain curve of the buckled longitudinal reinforcement. However, there is no noticeable differencewith the results in Fig. 11, and the size of the discrepancy is no more than a few percent. This suggests thatdifferences in the nonlinear properties of hoop resistance do not cause serious variations, probably becausethe influence of the covering concrete model chosen on the overall properties of the piles is significantlylarger than that of other factors.
7002100
horizontal disp.
pile cap
varying axial force
unit: (mm)
pile
loadingdevice
longitudinal reinforcement SD345 20-D22hoop reinforcement SD345 D4 ctc 125σck 23.7 N/mm2
distance from surface of pile to centerof longitudinal reinforcing bar
100 mm
Fig. 15 Experiment of type-2 pile specimen [24]
Table 2 Results of material element tests of type-2 pile specimenreinforcement
reinforcementyield stress tensile strength Young’s modulus extension(N/mm2) (N/mm2) (kN/mm2) (%)
longitudinal 397 589 195 23.2hoop 397 569 189 22.8
concreteage compressive strength Young’s modulus splitting strength
(days) (N/mm2) (kN/mm2) (N/mm2)10 23.7 21.9 2.4
(2) Experiment on type-2 pile specimen subject to horizontal reversed cyclic loading and varying axialload
a) Summary of experiment
The type-2 pile specimen chosen for our examinations is the cyclic loading test of a model cast-in-place RCpile performed by Tanamura et al. [24] A summary of this experiment and the results of standard elementtests are shown in Fig. 15 and Table 2, respectively. A specimen of this size can be considered a verylarge model, since more than 80% of cast-in-place RC piles used for highway bridges in Japan are eitherφ1000 or φ1200 in diameter [25]. Horizontal loading was controlled by displacement, with the drift angledefined by the ratio of horizontal displacement applied at the loading point to the shear span specified asfollows: after consecutive cycles at an angle of 1/1000 and 1/400, once at each magnitude, the amplitudewas gradually increased ten times from 1/200 to 10/200 in steps of 1/200 and three cycles were applied ateach magnitude.
One of the most noteworthy features of this experiment is that the pile was also subjected to an axialforce which varied accordingly to the horizontal reaction force, as depicted by the dashed lines in Fig. 16.This loading condition was employed in order to simulate the actual loading states observed in group-pilefoundations subjected to horizontal displacement during earthquakes.
Photo 2 shows the damage states visible after the test. The longitudinal reinforcement bars swelled greatlybetween two adjacent hoops, and so did the hoops to some extent. Fig. 17 illustrates the horizontal load-horizontal displacement hysteresis at the loading point. The experimental results can be summarizedas follows. The covering concrete collapsed on the compressive side of the pile at the bottom when theaxial force increased in the compressive direction during the cycle with a drift angle of 2/200. When the
−800 −600 −400 −200 0 200 400 600 800
−1000
0
1000
2000
3000
4000
horizontal load (kN)
axia
lloa
d(k
N)
Fig. 16 Varying pattern of axial load (dashed lines) [24]; compression is positive. Solid lines indicate thenumerical results.
Photo 2 Damage at bottom of type-2 pile specimen after the experiment (compressive side when the pilewas subject to compressive axial force)
displacement was reversed in the same cycle, the longitudinal reinforcing bars yielded as they moved fromcompression to tension, and the covering concrete on the opposite side, where the fiber stress changedfrom tension to compression, also collapsed simultaneously. Then, during the phase of increasing axialcompression, the longitudinal reinforcing bars on the tensile side of the pile yielded for the first time atthe cycle with a drift angle of 4/200. At the cycle with a drift angle of 6/200, the hoops started to yield.At the last cycle with a drift angle of 10/200, the longitudinal reinforcing bars in tension failed when theaxial force changed from compression to tension.
b) Numerical analysis model
We model the specimen using a cantilever beam as in the analysis of the type-1 pile specimen. The elementlength is three times larger than the spacing between two adjacent hoops on the basis of the results of aseries of the numerical examinations for plastic buckling of the reinforcement as shown in Fig. 7. Theaverage stress-strain relation for the swelled reinforcing bars was based on the post-buckling behaviorobtained using equivalent linear springs for the hoop resistance in Fig. 9. As can been seen in Fig. 9, thepost-buckling behavior of longitudinal reinforcement in the arrangement in the type-2 pile specimen doesnot depend on the mechanical properties of the springs representing the hoop resistance.
We set the necessary sectional parameters and material parameters for the constitutive model of longitu-dinal reinforcement just as in the simulation used for the type-1 pile specimen. The hardening rigidity E1
is set at one hundredth of the initial rigidity (Young’s modulus) E0 which is compatible with the order
−100 0 100
−200
0
200
400
600
horizontal disp. (mm)
hori
zont
allo
ad(k
N) experiment
analysis
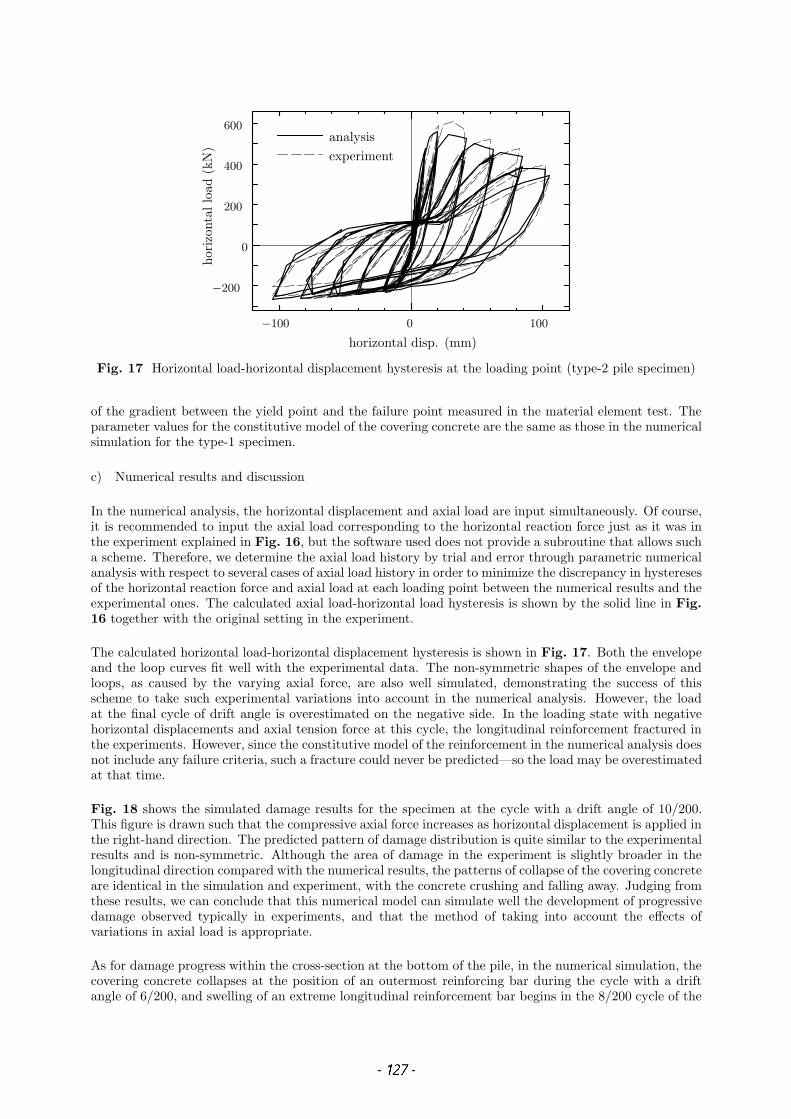
Fig. 17 Horizontal load-horizontal displacement hysteresis at the loading point (type-2 pile specimen)
of the gradient between the yield point and the failure point measured in the material element test. Theparameter values for the constitutive model of the covering concrete are the same as those in the numericalsimulation for the type-1 specimen.
c) Numerical results and discussion
In the numerical analysis, the horizontal displacement and axial load are input simultaneously. Of course,it is recommended to input the axial load corresponding to the horizontal reaction force just as it was inthe experiment explained in Fig. 16, but the software used does not provide a subroutine that allows sucha scheme. Therefore, we determine the axial load history by trial and error through parametric numericalanalysis with respect to several cases of axial load history in order to minimize the discrepancy in hysteresesof the horizontal reaction force and axial load at each loading point between the numerical results and theexperimental ones. The calculated axial load-horizontal load hysteresis is shown by the solid line in Fig.16 together with the original setting in the experiment.
The calculated horizontal load-horizontal displacement hysteresis is shown in Fig. 17. Both the envelopeand the loop curves fit well with the experimental data. The non-symmetric shapes of the envelope andloops, as caused by the varying axial force, are also well simulated, demonstrating the success of thisscheme to take such experimental variations into account in the numerical analysis. However, the loadat the final cycle of drift angle is overestimated on the negative side. In the loading state with negativehorizontal displacements and axial tension force at this cycle, the longitudinal reinforcement fractured inthe experiments. However, since the constitutive model of the reinforcement in the numerical analysis doesnot include any failure criteria, such a fracture could never be predicted—so the load may be overestimatedat that time.
Fig. 18 shows the simulated damage results for the specimen at the cycle with a drift angle of 10/200.This figure is drawn such that the compressive axial force increases as horizontal displacement is applied inthe right-hand direction. The predicted pattern of damage distribution is quite similar to the experimentalresults and is non-symmetric. Although the area of damage in the experiment is slightly broader in thelongitudinal direction compared with the numerical results, the patterns of collapse of the covering concreteare identical in the simulation and experiment, with the concrete crushing and falling away. Judging fromthese results, we can conclude that this numerical model can simulate well the development of progressivedamage observed typically in experiments, and that the method of taking into account the effects ofvariations in axial load is appropriate.
As for damage progress within the cross-section at the bottom of the pile, in the numerical simulation, thecovering concrete collapses at the position of an outermost reinforcing bar during the cycle with a driftangle of 6/200, and swelling of an extreme longitudinal reinforcement bar begins in the 8/200 cycle of the
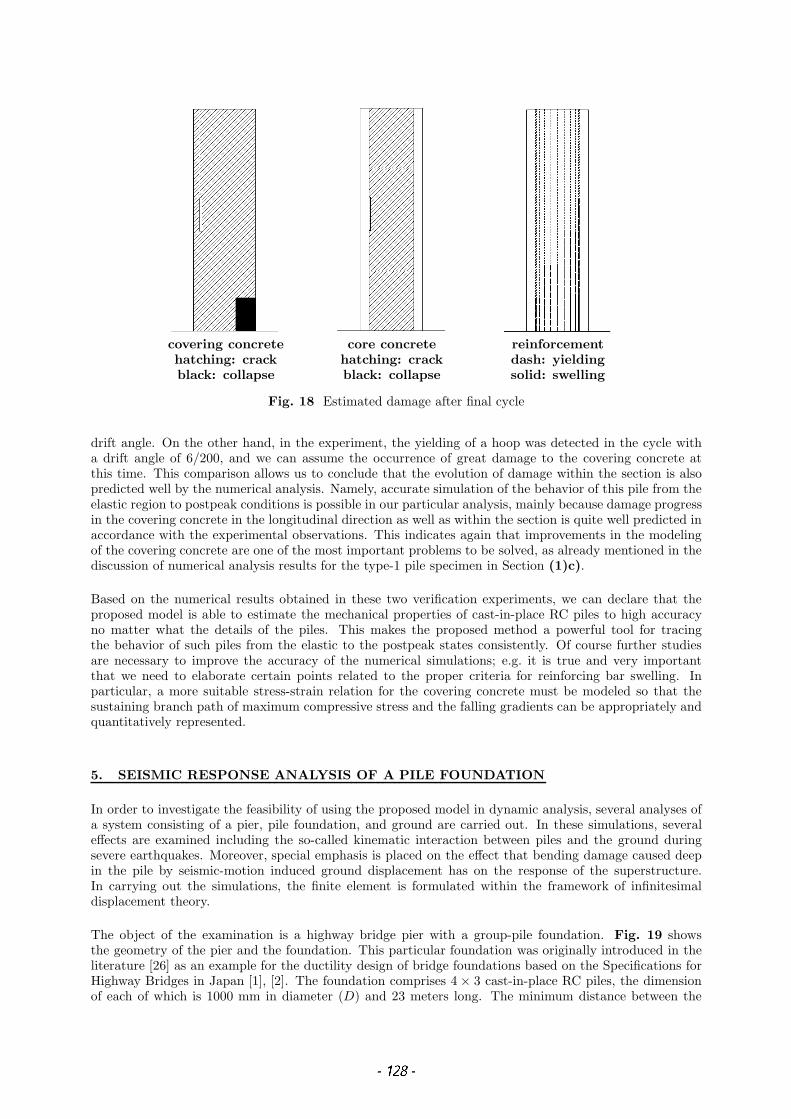
covering concretehatching: crackblack: collapse
core concretehatching: crackblack: collapse
reinforcementdash: yieldingsolid: swelling
Fig. 18 Estimated damage after final cycle
drift angle. On the other hand, in the experiment, the yielding of a hoop was detected in the cycle witha drift angle of 6/200, and we can assume the occurrence of great damage to the covering concrete atthis time. This comparison allows us to conclude that the evolution of damage within the section is alsopredicted well by the numerical analysis. Namely, accurate simulation of the behavior of this pile from theelastic region to postpeak conditions is possible in our particular analysis, mainly because damage progressin the covering concrete in the longitudinal direction as well as within the section is quite well predicted inaccordance with the experimental observations. This indicates again that improvements in the modelingof the covering concrete are one of the most important problems to be solved, as already mentioned in thediscussion of numerical analysis results for the type-1 pile specimen in Section (1)c).
Based on the numerical results obtained in these two verification experiments, we can declare that theproposed model is able to estimate the mechanical properties of cast-in-place RC piles to high accuracyno matter what the details of the piles. This makes the proposed method a powerful tool for tracingthe behavior of such piles from the elastic to the postpeak states consistently. Of course further studiesare necessary to improve the accuracy of the numerical simulations; e.g. it is true and very importantthat we need to elaborate certain points related to the proper criteria for reinforcing bar swelling. Inparticular, a more suitable stress-strain relation for the covering concrete must be modeled so that thesustaining branch path of maximum compressive stress and the falling gradients can be appropriately andquantitatively represented.
5. SEISMIC RESPONSE ANALYSIS OF A PILE FOUNDATION
In order to investigate the feasibility of using the proposed model in dynamic analysis, several analyses ofa system consisting of a pier, pile foundation, and ground are carried out. In these simulations, severaleffects are examined including the so-called kinematic interaction between piles and the ground duringsevere earthquakes. Moreover, special emphasis is placed on the effect that bending damage caused deepin the pile by seismic-motion induced ground displacement has on the response of the superstructure.In carrying out the simulations, the finite element is formulated within the framework of infinitesimaldisplacement theory.
The object of the examination is a highway bridge pier with a group-pile foundation. Fig. 19 showsthe geometry of the pier and the foundation. This particular foundation was originally introduced in theliterature [26] as an example for the ductility design of bridge foundations based on the Specifications forHighway Bridges in Japan [1], [2]. The foundation comprises 4 × 3 cast-in-place RC piles, the dimensionof each of which is 1000 mm in diameter (D) and 23 meters long. The minimum distance between the
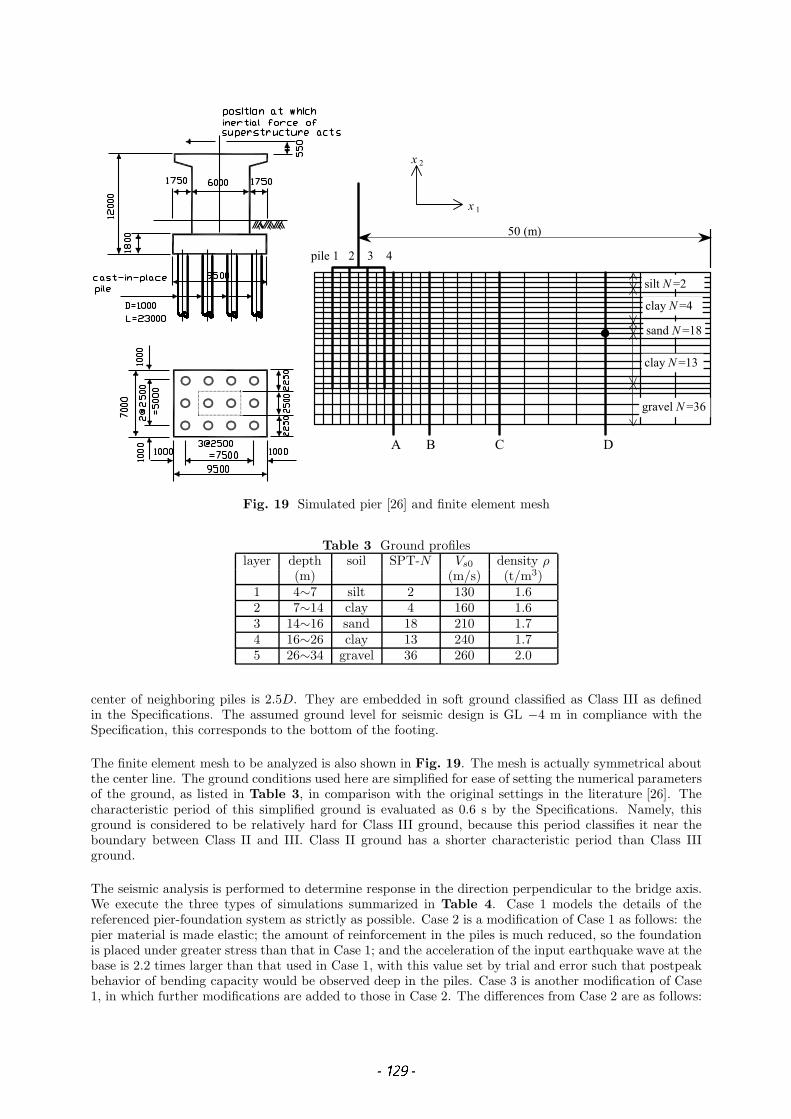
50 (m)
pile 1 2 3 4
A B C D
silt N=2
clay N=4
sand N=18
clay N=13
gravel N=36
x 1
x 2
Fig. 19 Simulated pier [26] and finite element mesh
Table 3 Ground profileslayer depth soil SPT-N Vs0 density ρ
(m) (m/s) (t/m3)1 4∼7 silt 2 130 1.62 7∼14 clay 4 160 1.63 14∼16 sand 18 210 1.74 16∼26 clay 13 240 1.75 26∼34 gravel 36 260 2.0
center of neighboring piles is 2.5D. They are embedded in soft ground classified as Class III as definedin the Specifications. The assumed ground level for seismic design is GL −4 m in compliance with theSpecification, this corresponds to the bottom of the footing.
The finite element mesh to be analyzed is also shown in Fig. 19. The mesh is actually symmetrical aboutthe center line. The ground conditions used here are simplified for ease of setting the numerical parametersof the ground, as listed in Table 3, in comparison with the original settings in the literature [26]. Thecharacteristic period of this simplified ground is evaluated as 0.6 s by the Specifications. Namely, thisground is considered to be relatively hard for Class III ground, because this period classifies it near theboundary between Class II and III. Class II ground has a shorter characteristic period than Class IIIground.
The seismic analysis is performed to determine response in the direction perpendicular to the bridge axis.We execute the three types of simulations summarized in Table 4. Case 1 models the details of thereferenced pier-foundation system as strictly as possible. Case 2 is a modification of Case 1 as follows: thepier material is made elastic; the amount of reinforcement in the piles is much reduced, so the foundationis placed under greater stress than that in Case 1; and the acceleration of the input earthquake wave at thebase is 2.2 times larger than that used in Case 1, with this value set by trial and error such that postpeakbehavior of bending capacity would be observed deep in the piles. Case 3 is another modification of Case1, in which further modifications are added to those in Case 2. The differences from Case 2 are as follows:
Table 4 Summary of computational casesCase 1 Case 2 Case 3
pier nonlinear linear linearbearing capacity at tip ofpile
nonlinear linear linear
arrangement of piles − reduced reducedamplitude of base inputacceleration
×1.0 ×2.2 ×2.0
the upper limit of bearing capacity at the top of the pile is released to make the compressive axial forceon the piles large; and the acceleration of the input earthquake is made twice that used in Case 1 for thesame reason as in Case 2. The arrangement of the reinforcement in the piles in the three cases is listed inTable 5.
A plane strain element is employed to model the ground for simplicity. This simplification does notresult in any problems, because the main purpose of this dynamic analysis is to grasp the characteristicsof the relationships between pile damage caused by seismic ground vibration and the behavior of thesuperstructure-pier-foundation system as a whole. The depth of the element in the out-of-plane direction istwice the depth of the footing in that direction, which is identical to the arrangement employed by Tateishiet al. [9] who reported a seismic dynamic simulation for the same pier. As for the boundary conditions,both edges of the modeled ground are free to move in the horizontal direction but are restrained in thevertical direction, while the motion at the bottom is fixed in both the horizontal and vertical directions.
We employ Hooke’s law as the constitutive relation for the soil, and take the nonlinear characteristics of soilinto account by changing the instantaneous shear modulus according to the stress history step by step. Thisinstantaneous shear modulus is here given by the Ramberg-Osgood model in terms of the stress history ofσ12, where the Cartesian coordinate system x1-x2 is set as indicated in Fig. 19. However, since this kindof model cannot include strength parameters of soils, the stress level continues increasing in the elementswhich undergo large strains. Hence the resistance of the ground to the foundation is overestimated whenthe foundation response becomes relatively large. This situation is one of the problems in our simulationto be solved in the future. Discussions will be necessary as to how the parameters for nonlinear propertiesin the Ramberg-Osgood model are chosen, and on how to choose a nonlinear constitutive model of the soil.
The initial shear modulus G0 of the soil in each layer is determined by the phase velocity of shear wavesin the corresponding layer, as listed in Table 3. Poisson ratios are set at 0.49 independently of the soilproperties. Parameters for the nonlinear properties in the Ramberg-Osgood model are estimated by theusual procedure based on the maximum damping constant and the reference strain [27]. We assume thatthe maximum damping constants of sand and clay are 0.3 and 0.2, respectively. The reference strain εr
is set to strain ε12 when G/G0 reaches 0.5, where G is the secant shear modulus. The reference strain ineach layer is estimated on the basis of existing experimental studies by Iwasaki et al. [28], [29], where thereference strain is determined from the soil profile and the confining pressure. We evaluate the confiningpressure at the depth of the gravity center in each element, with the static earth pressure coefficient fixedat 0.5.
The heads of the piles are rigidly connected to the footing. Since plane strain analysis is to be carried out,the three piles in one row are gathered together into one beam.
The same plastic buckling analysis is carried out for the longitudinal reinforcement as in Section 3., foreach sectioned reinforcement arrangements, and the hoops are modeled by elastic and perfectly-plasticsprings. A series of numerical tests determined that the length of the reinforcing bar which shows themost drastic reduction in load after buckling is three times the spacing between two adjacent hoops forall reinforcement arrangements. However, because of the requirement for connecting the fiber elements ofpiles to the plane strain elements of soils, as will be described later, it becomes much easier to do implementthe mesh if the length of a fiber element is equated to the thickness of a plane strain element for the soil.
We therefore carry out the same series of numerical plastic buckling analyses again under the condition
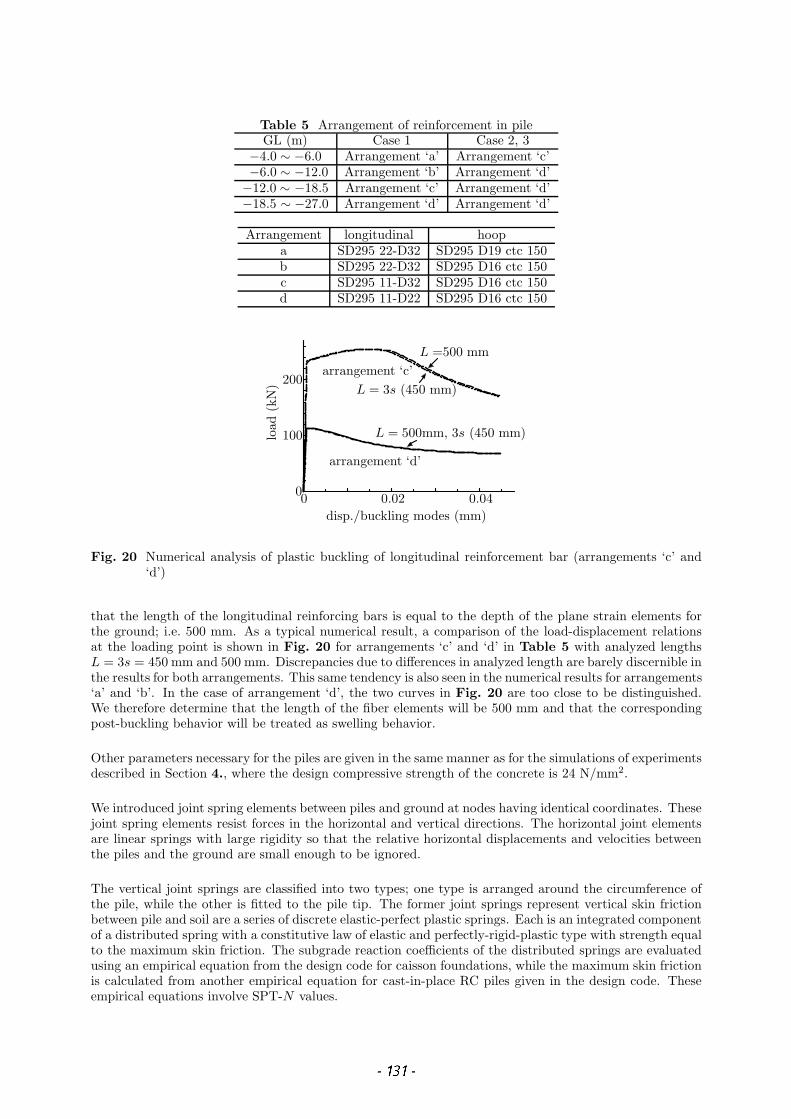
Table 5 Arrangement of reinforcement in pileGL (m) Case 1 Case 2, 3
−4.0 ∼ −6.0 Arrangement ‘a’ Arrangement ‘c’−6.0 ∼ −12.0 Arrangement ‘b’ Arrangement ‘d’
−12.0 ∼ −18.5 Arrangement ‘c’ Arrangement ‘d’−18.5 ∼ −27.0 Arrangement ‘d’ Arrangement ‘d’
Arrangement longitudinal hoopa SD295 22-D32 SD295 D19 ctc 150b SD295 22-D32 SD295 D16 ctc 150c SD295 11-D32 SD295 D16 ctc 150d SD295 11-D22 SD295 D16 ctc 150
0 0.02 0.040
100
200arrangement ‘c’
arrangement ‘d’
L =500 mm
L = 3s (450 mm)
L = 500mm, 3s (450 mm)
disp./buckling modes (mm)
load
(kN
)
Fig. 20 Numerical analysis of plastic buckling of longitudinal reinforcement bar (arrangements ‘c’ and‘d’)
that the length of the longitudinal reinforcing bars is equal to the depth of the plane strain elements forthe ground; i.e. 500 mm. As a typical numerical result, a comparison of the load-displacement relationsat the loading point is shown in Fig. 20 for arrangements ‘c’ and ‘d’ in Table 5 with analyzed lengthsL = 3s = 450 mm and 500 mm. Discrepancies due to differences in analyzed length are barely discernible inthe results for both arrangements. This same tendency is also seen in the numerical results for arrangements‘a’ and ‘b’. In the case of arrangement ‘d’, the two curves in Fig. 20 are too close to be distinguished.We therefore determine that the length of the fiber elements will be 500 mm and that the correspondingpost-buckling behavior will be treated as swelling behavior.
Other parameters necessary for the piles are given in the same manner as for the simulations of experimentsdescribed in Section 4., where the design compressive strength of the concrete is 24 N/mm2.
We introduced joint spring elements between piles and ground at nodes having identical coordinates. Thesejoint spring elements resist forces in the horizontal and vertical directions. The horizontal joint elementsare linear springs with large rigidity so that the relative horizontal displacements and velocities betweenthe piles and the ground are small enough to be ignored.
The vertical joint springs are classified into two types; one type is arranged around the circumference ofthe pile, while the other is fitted to the pile tip. The former joint springs represent vertical skin frictionbetween pile and soil are a series of discrete elastic-perfect plastic springs. Each is an integrated componentof a distributed spring with a constitutive law of elastic and perfectly-rigid-plastic type with strength equalto the maximum skin friction. The subgrade reaction coefficients of the distributed springs are evaluatedusing an empirical equation from the design code for caisson foundations, while the maximum skin frictionis calculated from another empirical equation for cast-in-place RC piles given in the design code. Theseempirical equations involve SPT-N values.
On the other hand, the vertical joint springs located at the tips of the piles are assumed to be non-linear elastic. They have a bi-linear response to compression with a maximum strength equivalent to thebearing capacity at the pile tip, but they have no resistance to tension. The compressive spring constantis estimated from the vertical subgrade reaction coefficient, which is considered in the design of caissonfoundations, while the maximum strength is derived from an empirical equation for the design of cast-in-place RC piles. Note that, in Case 3, the maximum value of bearing capacity at the tip of pile is ignored.Further, we also combine the three joint elements of three piles in the same row into a single joint elementat each depth.
The upper structure system is modeled as a single lumped-mass. The pier is modeled as a single lumped-mass at its middle point and an elastic beam element. The entire section is considered effective, andYoung’s modulus of concrete is used in calculating the bending rigidities of the beam elements. Howevera plastic-hinge region based on the Specifications [1] is specified at the bottom of the pier only in Case1. This plastic-hinge is modeled as a nonlinear rotational spring, the resistance of which is given by asomewhat modified nonlinear relation of the Takeda model [30]. In this modification, the crack pointis neglected; the yield bending capacity of the pier is given according to the Specifications [1]; and thetangent bending rigidity after initial yielding is set to 1/10,000 of the initial bending rigidity. The footingis modeled as an elastic beam element with excessive rigidity, and its mass is located as a lumped mass atits gravity center.
As global damping, Rayleigh damping is assumed, and the coefficients corresponding to the 1st and 2ndmodes are both set to 3%. An eigenvalue analysis of the whole system gives the first and second eigenperiods, where we use the initial rigidity of all the structural members and soils in the calculation. Theresulting characteristic periods are 0.52 s for the first mode and 0.38 s for the second. In the first mode,the shear deformation of the ground is greater, and the displacements of ground and structure are inphase. But the second mode is mainly governed by rocking motion of the structure, and the correspondingphases are opposed to each other. We can conclude that the characteristic period of the structure Ts isshorter than that of the ground TG. This is also supported by the fact that the period of the groundderived according to the design Specifications is 0.6 s. Note that the initial damping matrix at t = 0 s isalways used in seismic response analyses, because we can expect that most of the damping effect in seismicresponse analysis arises from hysteresis damping of the foundation materials because of putting the largeearthquake motion.
(1) Results of dynamic analyses
The basic input earthquake motion is the NS component of one of the most commonly used earthquakesrecords, that taken at the Japan Meteorology Agency in Kobe during the Hanshin-Awaji earthquake (theKobe earthquake) in 1995. In the dynamic analysis, the magnitude of this basic input wave is multipliedby a specific value, and then the adjusted motion is input directly into the nodes of elements at the base.Since the numerical results obtained in Cases 2 and 3 are quite similar to each other, only the results forCases 1 and 2 are explained in detail below.
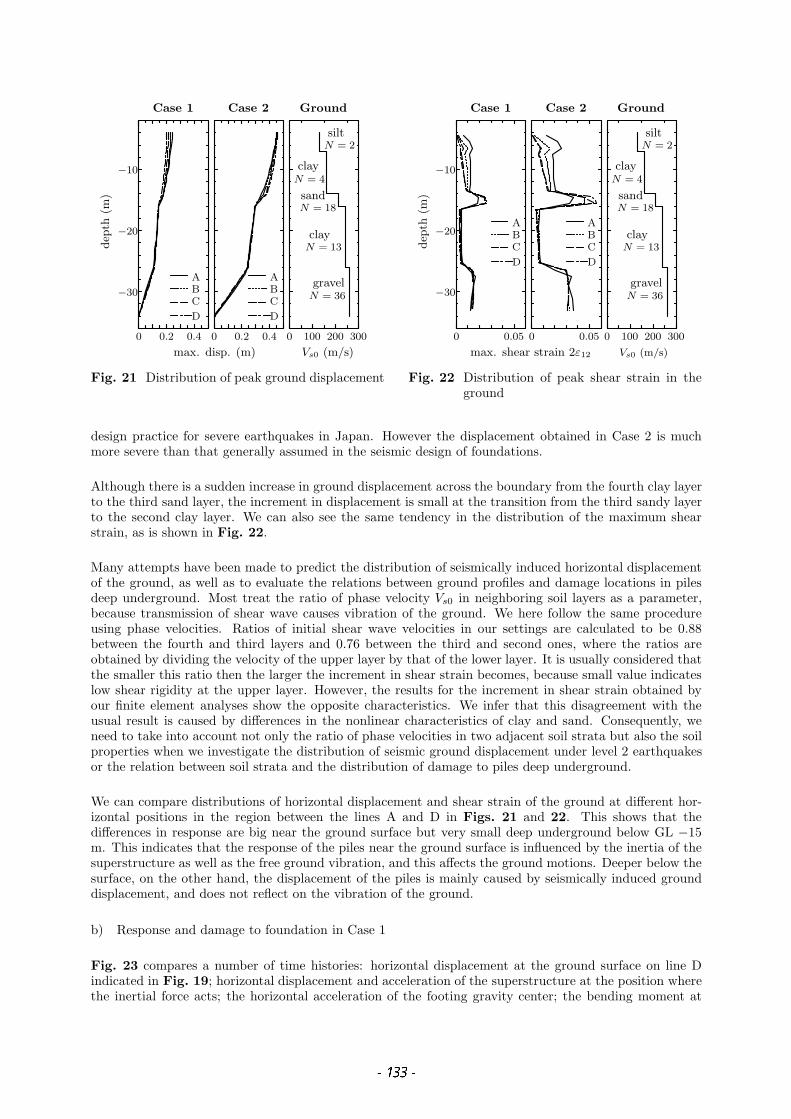
a) Dynamic behavior of ground
Fig. 21 shows the distributions of peak displacement of the ground at different positions, where thesymbols A through D indicate the observation lines labeled A through D in Fig. 19. The same symbolswill be used throughout. The peak values in Fig. 21 are the maximum absolute values. The seismic designcode for railway structures [7] introduces empirical equations to estimate distributions of horizontal grounddisplacement in the depth direction under design seismic motions for bedrock as specified in the code. Thecorresponding commentary explains that the equations are derived through a statistical compilation ofmany dynamic analysis results for many ground conditions. Examination of this railway code suggeststhat the characteristics of L2 motion and Spectral II design seismic motion are very close to our inputsinto the numerical simulations. Therefore, in order to evaluate the effect of earthquake motion on thefoundation as obtained in our seismic simulations from a practical design point of view, it is very helpful tocompare the horizontal displacement of the ground numerically obtained here to that calculated using theempirical equation given in the railway code. This calculation from the code turns out to be approximately0.2 m, so the ground displacement obtained in Case 1 is of the same order as this value obtained by usual
0 0.2 0.4
−30
−20
−10
0 0.2 0.4 0 100 200 300
ABC
D D
CBA
Case 1 Case 2 Ground
max. disp. (m) Vs0 (m/s)
dep
th(m
)
N = 4
sand
N = 36gravel
siltN = 2
clay
N = 18
N = 13clay
Fig. 21 Distribution of peak ground displacement
0 0.05
−30
−20
−10
0 0.05 0 100 200 300
ABC
D
ABC
D
Case 1 Case 2 Ground
max. shear strain 2ε12 Vs0 (m/s)
dep
th(m
)
N = 4
sand
N = 36gravel
siltN = 2
clay
N = 18
N = 13clay
Fig. 22 Distribution of peak shear strain in theground
design practice for severe earthquakes in Japan. However the displacement obtained in Case 2 is muchmore severe than that generally assumed in the seismic design of foundations.
Although there is a sudden increase in ground displacement across the boundary from the fourth clay layerto the third sand layer, the increment in displacement is small at the transition from the third sandy layerto the second clay layer. We can also see the same tendency in the distribution of the maximum shearstrain, as is shown in Fig. 22.
Many attempts have been made to predict the distribution of seismically induced horizontal displacementof the ground, as well as to evaluate the relations between ground profiles and damage locations in pilesdeep underground. Most treat the ratio of phase velocity Vs0 in neighboring soil layers as a parameter,because transmission of shear wave causes vibration of the ground. We here follow the same procedureusing phase velocities. Ratios of initial shear wave velocities in our settings are calculated to be 0.88between the fourth and third layers and 0.76 between the third and second ones, where the ratios areobtained by dividing the velocity of the upper layer by that of the lower layer. It is usually considered thatthe smaller this ratio then the larger the increment in shear strain becomes, because small value indicateslow shear rigidity at the upper layer. However, the results for the increment in shear strain obtained byour finite element analyses show the opposite characteristics. We infer that this disagreement with theusual result is caused by differences in the nonlinear characteristics of clay and sand. Consequently, weneed to take into account not only the ratio of phase velocities in two adjacent soil strata but also the soilproperties when we investigate the distribution of seismic ground displacement under level 2 earthquakesor the relation between soil strata and the distribution of damage to piles deep underground.
We can compare distributions of horizontal displacement and shear strain of the ground at different hor-izontal positions in the region between the lines A and D in Figs. 21 and 22. This shows that thedifferences in response are big near the ground surface but very small deep underground below GL −15m. This indicates that the response of the piles near the ground surface is influenced by the inertia of thesuperstructure as well as the free ground vibration, and this affects the ground motions. Deeper below thesurface, on the other hand, the displacement of the piles is mainly caused by seismically induced grounddisplacement, and does not reflect on the vibration of the ground.
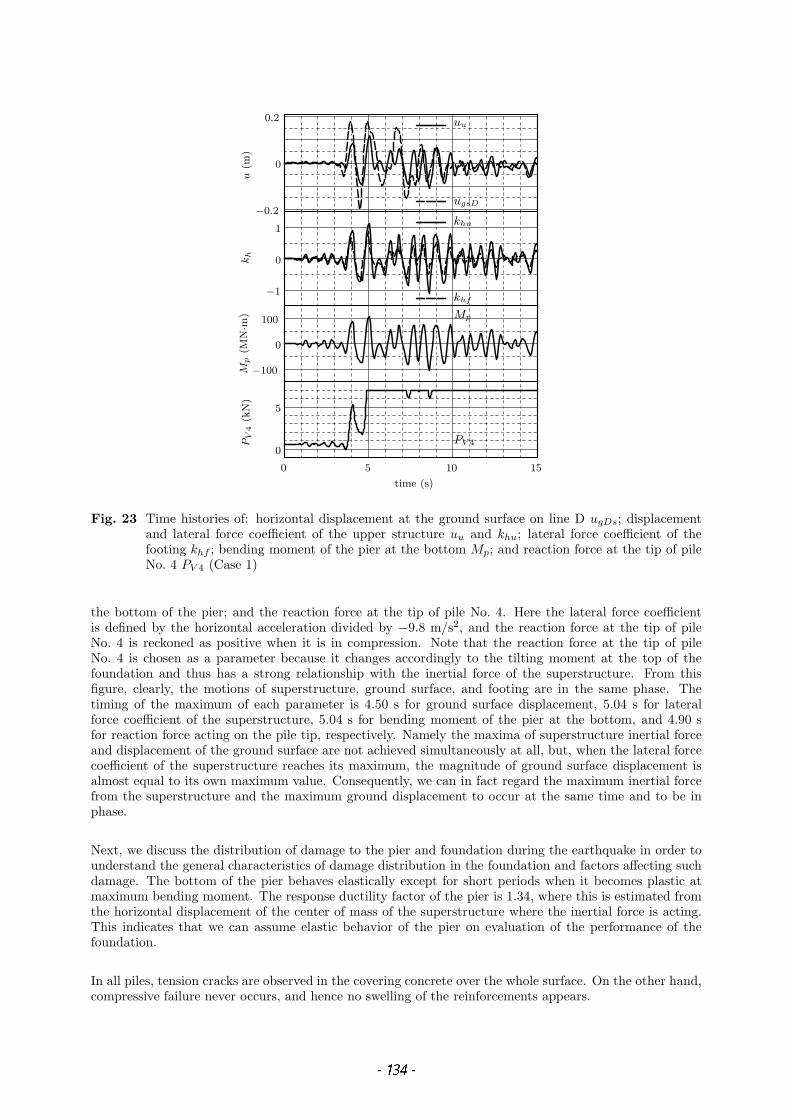
b) Response and damage to foundation in Case 1
Fig. 23 compares a number of time histories: horizontal displacement at the ground surface on line Dindicated in Fig. 19; horizontal displacement and acceleration of the superstructure at the position wherethe inertial force acts; the horizontal acceleration of the footing gravity center; the bending moment at
−0.2
0
0.2
−1
0
1
−100
0
100
0 5 10 15
0
5
u(m
)k
hM
p(M
N·m
)P
V4
(kN
)
time (s)
khu
Mp
PV 4
uu
ugsD
khf
Fig. 23 Time histories of: horizontal displacement at the ground surface on line D ugDs; displacementand lateral force coefficient of the upper structure uu and khu; lateral force coefficient of thefooting khf ; bending moment of the pier at the bottom Mp; and reaction force at the tip of pileNo. 4 PV 4 (Case 1)
the bottom of the pier; and the reaction force at the tip of pile No. 4. Here the lateral force coefficientis defined by the horizontal acceleration divided by −9.8 m/s2, and the reaction force at the tip of pileNo. 4 is reckoned as positive when it is in compression. Note that the reaction force at the tip of pileNo. 4 is chosen as a parameter because it changes accordingly to the tilting moment at the top of thefoundation and thus has a strong relationship with the inertial force of the superstructure. From thisfigure, clearly, the motions of superstructure, ground surface, and footing are in the same phase. Thetiming of the maximum of each parameter is 4.50 s for ground surface displacement, 5.04 s for lateralforce coefficient of the superstructure, 5.04 s for bending moment of the pier at the bottom, and 4.90 sfor reaction force acting on the pile tip, respectively. Namely the maxima of superstructure inertial forceand displacement of the ground surface are not achieved simultaneously at all, but, when the lateral forcecoefficient of the superstructure reaches its maximum, the magnitude of ground surface displacement isalmost equal to its own maximum value. Consequently, we can in fact regard the maximum inertial forcefrom the superstructure and the maximum ground displacement to occur at the same time and to be inphase.
Next, we discuss the distribution of damage to the pier and foundation during the earthquake in order tounderstand the general characteristics of damage distribution in the foundation and factors affecting suchdamage. The bottom of the pier behaves elastically except for short periods when it becomes plastic atmaximum bending moment. The response ductility factor of the pier is 1.34, where this is estimated fromthe horizontal displacement of the center of mass of the superstructure where the inertial force is acting.This indicates that we can assume elastic behavior of the pier on evaluation of the performance of thefoundation.
In all piles, tension cracks are observed in the covering concrete over the whole surface. On the other hand,compressive failure never occurs, and hence no swelling of the reinforcements appears.
yielded
Pile 1 Pile 2 Pile 3 Pile 4
28
26
24
22
20
18
16
14
12
10
8
6
4
depth(m)
soilprofile
silt
clay
sand
gravel
clay
Fig. 24 Yield zone of longitudinal reinforcing bars by tension in piles (Case 1)
As for the longitudinal reinforcement of the piles, Fig. 24 depicts the distribution of tensile yielding. Thegray lines indicate the reinforcement positions, and the black lines represent yielded portions. This tensileyielding occurs not only at the pile tops but also near the boundary of the third sand layer and the fourthclay layer at GL −16 m. The longitudinal range of this yield region is approximately one pile diameterabove and below the boundary. Moreover, yielding is observed in a narrow band at a position right abovethe ground base layer. Namely, deep underground, the reinforcement yields near the boundary betweendifferent layers, where the vertical distribution of horizontal displacement and shear strain of the groundabruptly changes.
It can be seen that similar yielding develops near the boundary between the second and third layers of soilstrata at GL −14 m. But the distribution of horizontal displacement and shear strain of the ground doesnot exhibit a sudden change there, as is clear in Figs. 21 and 22. We can then conclude that the primaryreason of yielding is not only the effect of ground excitation but also abrupt changes in the rigidity andcapacity of the piles, since there is a reduction in reinforcement at GL −12 m.
The yield zone at the top of the piles differs depending on the position of the pile. Further, even at thetop of the piles, we notice a non-symmetrical distribution of yield zone about the longitudinal centerlineof the pile. On the contrary, around GL −16 m, there is almost no difference in yield zone among piles,whether near the center or at the extremity. These results indicate that the dominant factors governingyield are different dependent on depth; yielding at the top of piles is triggered by the inertial force of thesuperstructure, while that near GL −16 m is affected by the seismic ground displacement.
Furthermore, compressive yielding occurs in Nos. 1 and 4 piles around their circumference at GL −16 m aswell as in the central parts at the top. Remember that the bending moment in piles is dependent not onlyon the bending deformation but also on the axial force, as the experimental results in Section 4.(2) madeclear. Thus, the reason for compressive yielding becoming possible only in the reinforcement of Nos. 1 and4 piles is thought to be that the axial forces on surrounding piles become larger, and that the bendingmoment in these piles then exceeds that in the central piles.
0 10
−20
−10
0 10 0 10 0 10 150 300
Pile 1 Pile 2 Pile 3 Pile 4 Ground
abs. bending moment (MN·m) Vs0 (m/s)
dep
th(m
)
silt
clay
sand
clay
gravel
Fig. 25 Distribution of bending moment in each pile (Case 1); solid lines are the absolute maximumvalues, and dashed lines are the values when the compressive reaction at the tip of No. 4 pilereaches a maximum (t = 4.9 s)
Fig. 25 compares the distributions of absolute values of maximum bending moment achieved at eachposition during the earthquake (solid curves) and of absolute bending moment (dashed curves) when thecompressive reaction force at the tip of pile No. 4 reaches a maximum; i.e. at t = 4.9 s. The former indicatethat all piles experience large bending moments at the top as well as near the boundary between the thirdsand layer and the fourth clay layer.
The large bending moments deep below the surface are observed at the location where sudden changes inhorizontal displacement and ground shear strain appear, as shown in Figs. 21 and 22, and these locationsare identical to where the pile reinforcement yields. These results imply the possibility of establishing asimple prediction method for pile damage locations without carrying out a sophisticated seismic responseanalysis of the system consisting of pile foundation and foundation ground as carried out here. That is, bysimply referring to a database of dynamic analysis of foundations under several ground conditions whensubject to level 2 earthquakes, we may be able to determine the positions of possible damage from thephase velocity profile of the soil strata and the properties of the soil layers; e.g. sandy or clay.
On the other hand, the dashed curves in Fig. 25, representing the distribution of pile bending momentwhen pile No. 4 reacts to the maximum compressive reaction force, clearly indicate that there arises almostno matching bending moment in Nos. 1 and 2 piles. Incidentally, Fig. 26 shows the distributions of axialforce in the piles at that same instant, revealing that almost no axial force appears in these piles, either.The time histories of horizontal ground displacement at GL −16 m on the line D, which corresponds to thesolid circle in Fig. 19, and the sectional forces and curvature of pile No. 4 at GL −16.25 m are shown inFig. 27. In these time histories, the bending moment has clearly different amplitudes in the positive andnegative directions depending on the axial force, while the curvature of the same pile and the horizontalground displacement oscillate with almost the same magnitude in both directions. This results from thefact that the bending moment of the piles is greatly affected by the axial force. As a result, we can putgreat emphasis on the advantage of employing a fiber element; i.e. the element can automatically take intoaccount the influence of varying axial force on the mobilized sectional forces of piles.
c) Response and damage to foundation in Cases 2 and 3
Fig. 28 shows the state of damage in the Case 2 simulation. Gray lines indicate the reinforcement again.Here, more reinforcement than in Case 1 yields over the whole pile body, because in Case 2 the amountof reinforcement is reduced. Furthermore, the damage is much more serious lower down than at the topespecially near the boundary between the third and fourth soil layers where some damage is also observed
−30 0 30
−20
−10
−30 0 30 −30 0 30 −30 0 30
Pile 1
axial force (MN)
dep
th(m
)
Pile 2 Pile 3 Pile 4
Fig. 26 Distributions of axial force on piles when the reaction force at the tip of pile No. 4 reaches amaximum, t = 4.9 s (Case 1), where tension is positive
−0.1
0
0.1
−0.0005
0
0.0005
0
6
0 5 10 15
−20
−10
0
uggD
(m)
φ(1
/m
)
M(M
N·m
)N
(kN
)
time (s)
curvature
bending moment
axial force
ground disp.
Fig. 27 Time histories of: horizontal displacement of the ground at GL −16 m on line D uggD; curvatureφ; bending moment M ; and axial force N of pile No. 4 at GL −16.25 m (Case 1)
in Case 1. Near this boundary, it is also apparent that swelling of the reinforcing bars accompaniescompressive collapse of the covering concrete. These kinds of damage can also be observed in Case 3.
The stress-strain hysteresis curves in Fig. 29 are for fibers in the outmost reinforcement bar, whichundergoes swelling, as well as for the covering concrete and core concrete surrounding this particularreinforcement bar. The moment-curvature hysteresis of the same element is illustrated in Fig. 30. This pileexperiences instantaneous swelling of reinforcement several times during the earthquake at this location.Judging from discussion of the results for Case 1, we can conclude that the dominant factor causing thisdamage is seismic ground displacement. However, it is not very clear from Fig. 30 that swelling causestremendous loss of capacity in the pile itself. Fig. 29 also shows the existence of something like a snap-
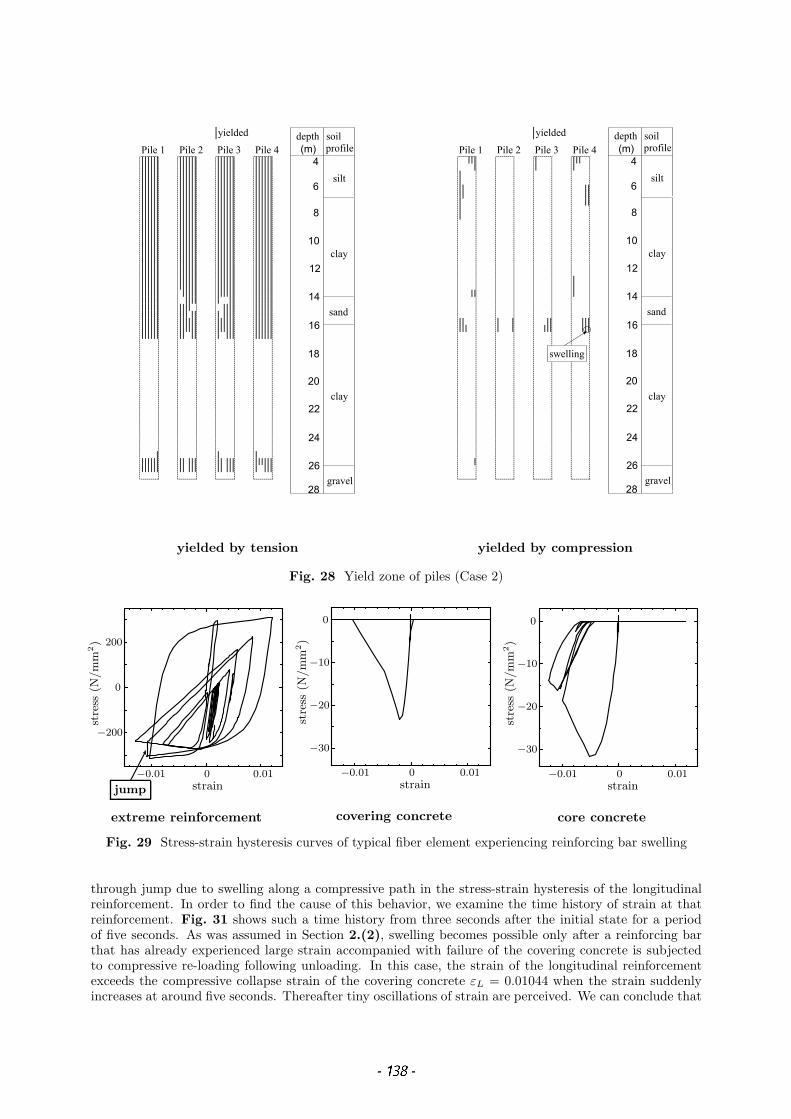
yielded
Pile 1 Pile 2 Pile 3 Pile 4
28
26
24
22
20
18
16
14
12
10
8
6
4
depth(m)
soilprofile
silt
clay
sand
gravel
clay
yielded by tension
yielded
Pile 1 Pile 2 Pile 3 Pile 4
swelling
28
26
24
22
20
18
16
14
12
10
8
6
4
depth(m)
soilprofile
silt
clay
sand
gravel
clay
yielded by compression
Fig. 28 Yield zone of piles (Case 2)
−0.01 0 0.01
−200
0
200
strain
stre
ss(N
/m
m2)
jump
extreme reinforcement
−0.01 0 0.01
−30
−20
−10
0
strain
stre
ss(N
/m
m2)
covering concrete
−0.01 0 0.01
−30
−20
−10
0
strain
stre
ss(N
/m
m2)
core concrete
Fig. 29 Stress-strain hysteresis curves of typical fiber element experiencing reinforcing bar swelling
through jump due to swelling along a compressive path in the stress-strain hysteresis of the longitudinalreinforcement. In order to find the cause of this behavior, we examine the time history of strain at thatreinforcement. Fig. 31 shows such a time history from three seconds after the initial state for a periodof five seconds. As was assumed in Section 2.(2), swelling becomes possible only after a reinforcing barthat has already experienced large strain accompanied with failure of the covering concrete is subjectedto compressive re-loading following unloading. In this case, the strain of the longitudinal reinforcementexceeds the compressive collapse strain of the covering concrete εL = 0.01044 when the strain suddenlyincreases at around five seconds. Thereafter tiny oscillations of strain are perceived. We can conclude that
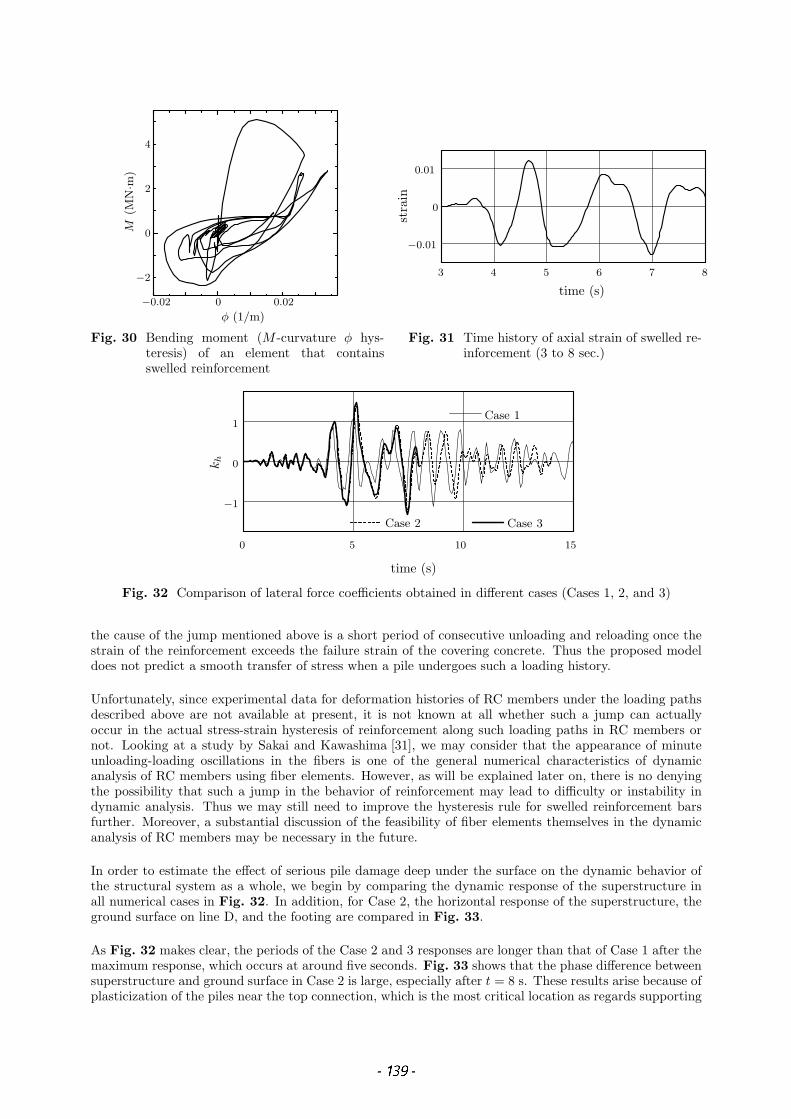
−0.02 0 0.02
−2
0
2
4
φ (1/m)
M(M
N·m
)
Fig. 30 Bending moment (M -curvature φ hys-teresis) of an element that containsswelled reinforcement
3 4 5 6 7 8
−0.01
0
0.01
stra
in
time (s)
Fig. 31 Time history of axial strain of swelled re-inforcement (3 to 8 sec.)
0 5 10 15
−1
0
1
kh
time (s)
Case 2
Case 1
Case 3
Fig. 32 Comparison of lateral force coefficients obtained in different cases (Cases 1, 2, and 3)
the cause of the jump mentioned above is a short period of consecutive unloading and reloading once thestrain of the reinforcement exceeds the failure strain of the covering concrete. Thus the proposed modeldoes not predict a smooth transfer of stress when a pile undergoes such a loading history.
Unfortunately, since experimental data for deformation histories of RC members under the loading pathsdescribed above are not available at present, it is not known at all whether such a jump can actuallyoccur in the actual stress-strain hysteresis of reinforcement along such loading paths in RC members ornot. Looking at a study by Sakai and Kawashima [31], we may consider that the appearance of minuteunloading-loading oscillations in the fibers is one of the general numerical characteristics of dynamicanalysis of RC members using fiber elements. However, as will be explained later on, there is no denyingthe possibility that such a jump in the behavior of reinforcement may lead to difficulty or instability indynamic analysis. Thus we may still need to improve the hysteresis rule for swelled reinforcement barsfurther. Moreover, a substantial discussion of the feasibility of fiber elements themselves in the dynamicanalysis of RC members may be necessary in the future.
In order to estimate the effect of serious pile damage deep under the surface on the dynamic behavior ofthe structural system as a whole, we begin by comparing the dynamic response of the superstructure inall numerical cases in Fig. 32. In addition, for Case 2, the horizontal response of the superstructure, theground surface on line D, and the footing are compared in Fig. 33.
As Fig. 32 makes clear, the periods of the Case 2 and 3 responses are longer than that of Case 1 after themaximum response, which occurs at around five seconds. Fig. 33 shows that the phase difference betweensuperstructure and ground surface in Case 2 is large, especially after t = 8 s. These results arise because ofplasticization of the piles near the top connection, which is the most critical location as regards supporting
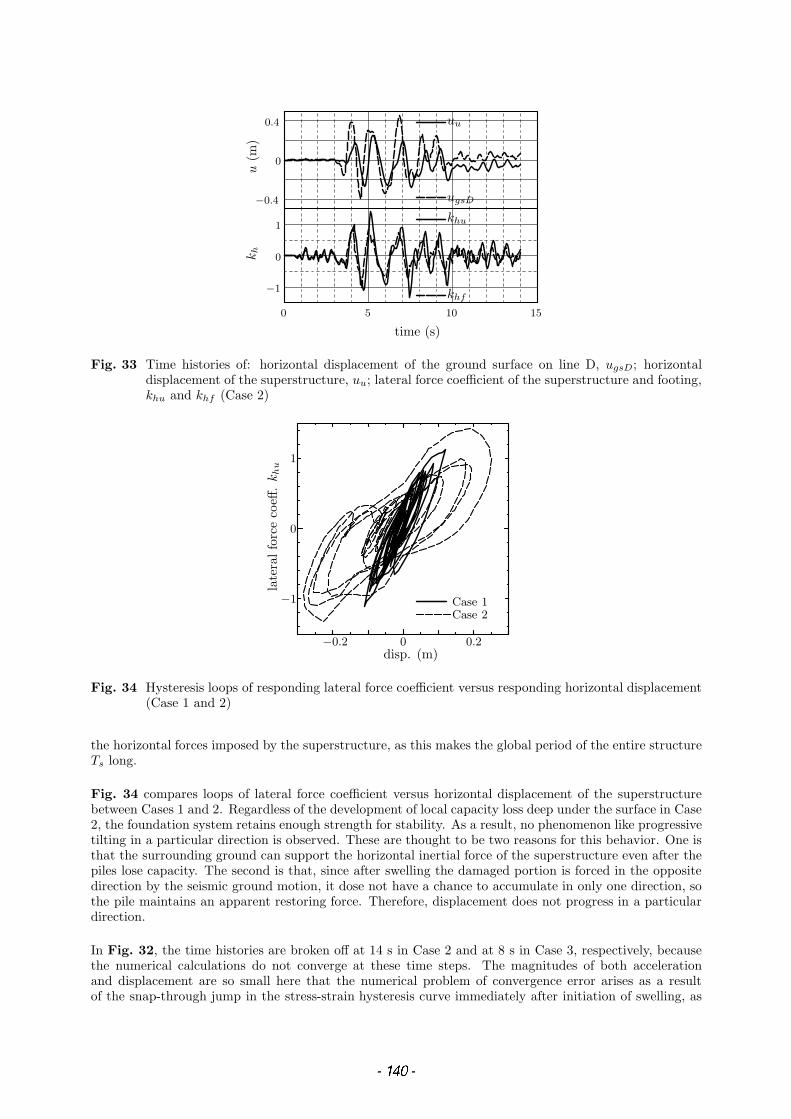
−0.4
0
0.4
0 5 10 15
−1
0
1
u(m
)k
h
time (s)
khu
uu
ugsD
khf
Fig. 33 Time histories of: horizontal displacement of the ground surface on line D, ugsD; horizontaldisplacement of the superstructure, uu; lateral force coefficient of the superstructure and footing,khu and khf (Case 2)
−0.2 0 0.2
−1
0
1
late
ralf
orce
coeff
.k
hu
disp. (m)
Case 1Case 2
Fig. 34 Hysteresis loops of responding lateral force coefficient versus responding horizontal displacement(Case 1 and 2)
the horizontal forces imposed by the superstructure, as this makes the global period of the entire structureTs long.
Fig. 34 compares loops of lateral force coefficient versus horizontal displacement of the superstructurebetween Cases 1 and 2. Regardless of the development of local capacity loss deep under the surface in Case2, the foundation system retains enough strength for stability. As a result, no phenomenon like progressivetilting in a particular direction is observed. These are thought to be two reasons for this behavior. One isthat the surrounding ground can support the horizontal inertial force of the superstructure even after thepiles lose capacity. The second is that, since after swelling the damaged portion is forced in the oppositedirection by the seismic ground motion, it dose not have a chance to accumulate in only one direction, sothe pile maintains an apparent restoring force. Therefore, displacement does not progress in a particulardirection.
In Fig. 32, the time histories are broken off at 14 s in Case 2 and at 8 s in Case 3, respectively, becausethe numerical calculations do not converge at these time steps. The magnitudes of both accelerationand displacement are so small here that the numerical problem of convergence error arises as a resultof the snap-through jump in the stress-strain hysteresis curve immediately after initiation of swelling, as
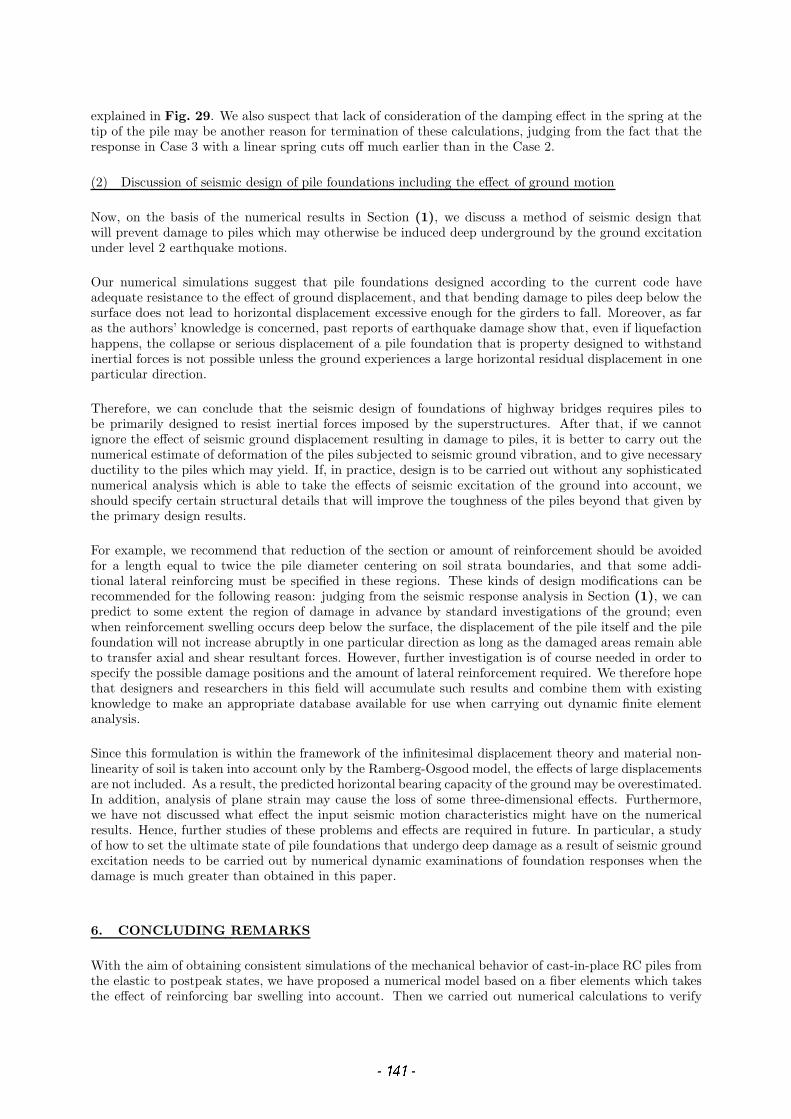
explained in Fig. 29. We also suspect that lack of consideration of the damping effect in the spring at thetip of the pile may be another reason for termination of these calculations, judging from the fact that theresponse in Case 3 with a linear spring cuts off much earlier than in the Case 2.
(2) Discussion of seismic design of pile foundations including the effect of ground motion
Now, on the basis of the numerical results in Section (1), we discuss a method of seismic design thatwill prevent damage to piles which may otherwise be induced deep underground by the ground excitationunder level 2 earthquake motions.
Our numerical simulations suggest that pile foundations designed according to the current code haveadequate resistance to the effect of ground displacement, and that bending damage to piles deep below thesurface does not lead to horizontal displacement excessive enough for the girders to fall. Moreover, as faras the authors’ knowledge is concerned, past reports of earthquake damage show that, even if liquefactionhappens, the collapse or serious displacement of a pile foundation that is property designed to withstandinertial forces is not possible unless the ground experiences a large horizontal residual displacement in oneparticular direction.
Therefore, we can conclude that the seismic design of foundations of highway bridges requires piles tobe primarily designed to resist inertial forces imposed by the superstructures. After that, if we cannotignore the effect of seismic ground displacement resulting in damage to piles, it is better to carry out thenumerical estimate of deformation of the piles subjected to seismic ground vibration, and to give necessaryductility to the piles which may yield. If, in practice, design is to be carried out without any sophisticatednumerical analysis which is able to take the effects of seismic excitation of the ground into account, weshould specify certain structural details that will improve the toughness of the piles beyond that given bythe primary design results.
For example, we recommend that reduction of the section or amount of reinforcement should be avoidedfor a length equal to twice the pile diameter centering on soil strata boundaries, and that some addi-tional lateral reinforcing must be specified in these regions. These kinds of design modifications can berecommended for the following reason: judging from the seismic response analysis in Section (1), we canpredict to some extent the region of damage in advance by standard investigations of the ground; evenwhen reinforcement swelling occurs deep below the surface, the displacement of the pile itself and the pilefoundation will not increase abruptly in one particular direction as long as the damaged areas remain ableto transfer axial and shear resultant forces. However, further investigation is of course needed in order tospecify the possible damage positions and the amount of lateral reinforcement required. We therefore hopethat designers and researchers in this field will accumulate such results and combine them with existingknowledge to make an appropriate database available for use when carrying out dynamic finite elementanalysis.
Since this formulation is within the framework of the infinitesimal displacement theory and material non-linearity of soil is taken into account only by the Ramberg-Osgood model, the effects of large displacementsare not included. As a result, the predicted horizontal bearing capacity of the ground may be overestimated.In addition, analysis of plane strain may cause the loss of some three-dimensional effects. Furthermore,we have not discussed what effect the input seismic motion characteristics might have on the numericalresults. Hence, further studies of these problems and effects are required in future. In particular, a studyof how to set the ultimate state of pile foundations that undergo deep damage as a result of seismic groundexcitation needs to be carried out by numerical dynamic examinations of foundation responses when thedamage is much greater than obtained in this paper.
6. CONCLUDING REMARKS
With the aim of obtaining consistent simulations of the mechanical behavior of cast-in-place RC piles fromthe elastic to postpeak states, we have proposed a numerical model based on a fiber elements which takesthe effect of reinforcing bar swelling into account. Then we carried out numerical calculations to verify
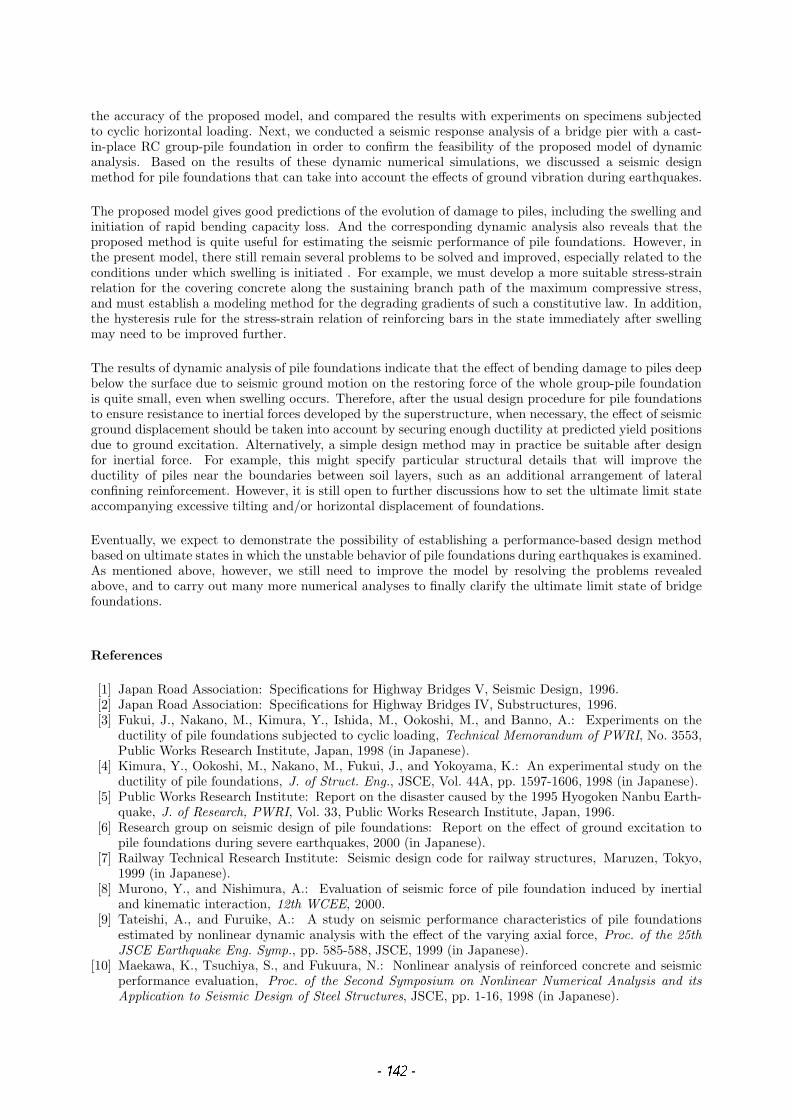
the accuracy of the proposed model, and compared the results with experiments on specimens subjectedto cyclic horizontal loading. Next, we conducted a seismic response analysis of a bridge pier with a cast-in-place RC group-pile foundation in order to confirm the feasibility of the proposed model of dynamicanalysis. Based on the results of these dynamic numerical simulations, we discussed a seismic designmethod for pile foundations that can take into account the effects of ground vibration during earthquakes.
The proposed model gives good predictions of the evolution of damage to piles, including the swelling andinitiation of rapid bending capacity loss. And the corresponding dynamic analysis also reveals that theproposed method is quite useful for estimating the seismic performance of pile foundations. However, inthe present model, there still remain several problems to be solved and improved, especially related to theconditions under which swelling is initiated . For example, we must develop a more suitable stress-strainrelation for the covering concrete along the sustaining branch path of the maximum compressive stress,and must establish a modeling method for the degrading gradients of such a constitutive law. In addition,the hysteresis rule for the stress-strain relation of reinforcing bars in the state immediately after swellingmay need to be improved further.
The results of dynamic analysis of pile foundations indicate that the effect of bending damage to piles deepbelow the surface due to seismic ground motion on the restoring force of the whole group-pile foundationis quite small, even when swelling occurs. Therefore, after the usual design procedure for pile foundationsto ensure resistance to inertial forces developed by the superstructure, when necessary, the effect of seismicground displacement should be taken into account by securing enough ductility at predicted yield positionsdue to ground excitation. Alternatively, a simple design method may in practice be suitable after designfor inertial force. For example, this might specify particular structural details that will improve theductility of piles near the boundaries between soil layers, such as an additional arrangement of lateralconfining reinforcement. However, it is still open to further discussions how to set the ultimate limit stateaccompanying excessive tilting and/or horizontal displacement of foundations.
Eventually, we expect to demonstrate the possibility of establishing a performance-based design methodbased on ultimate states in which the unstable behavior of pile foundations during earthquakes is examined.As mentioned above, however, we still need to improve the model by resolving the problems revealedabove, and to carry out many more numerical analyses to finally clarify the ultimate limit state of bridgefoundations.
References
[1] Japan Road Association: Specifications for Highway Bridges V, Seismic Design, 1996.[2] Japan Road Association: Specifications for Highway Bridges IV, Substructures, 1996.[3] Fukui, J., Nakano, M., Kimura, Y., Ishida, M., Ookoshi, M., and Banno, A.: Experiments on the
ductility of pile foundations subjected to cyclic loading, Technical Memorandum of PWRI, No. 3553,Public Works Research Institute, Japan, 1998 (in Japanese).
[4] Kimura, Y., Ookoshi, M., Nakano, M., Fukui, J., and Yokoyama, K.: An experimental study on theductility of pile foundations, J. of Struct. Eng., JSCE, Vol. 44A, pp. 1597-1606, 1998 (in Japanese).
[5] Public Works Research Institute: Report on the disaster caused by the 1995 Hyogoken Nanbu Earth-quake, J. of Research, PWRI, Vol. 33, Public Works Research Institute, Japan, 1996.
[6] Research group on seismic design of pile foundations: Report on the effect of ground excitation topile foundations during severe earthquakes, 2000 (in Japanese).
[7] Railway Technical Research Institute: Seismic design code for railway structures, Maruzen, Tokyo,1999 (in Japanese).
[8] Murono, Y., and Nishimura, A.: Evaluation of seismic force of pile foundation induced by inertialand kinematic interaction, 12th WCEE, 2000.
[9] Tateishi, A., and Furuike, A.: A study on seismic performance characteristics of pile foundationsestimated by nonlinear dynamic analysis with the effect of the varying axial force, Proc. of the 25thJSCE Earthquake Eng. Symp., pp. 585-588, JSCE, 1999 (in Japanese).
[10] Maekawa, K., Tsuchiya, S., and Fukuura, N.: Nonlinear analysis of reinforced concrete and seismicperformance evaluation, Proc. of the Second Symposium on Nonlinear Numerical Analysis and itsApplication to Seismic Design of Steel Structures, JSCE, pp. 1-16, 1998 (in Japanese).
[11] Suda, K., and Masukawa, J.: Models for concrete cover spalling and reinforcement buckling ofreinforced concrete, 12th WCEE, No. 1437, 2000.
[12] Suda, K., Murayama, Y., Ichinomiya, T., and Shimbo, H.: Buckling behavior of longitudinal rein-forcing bars in concrete columns subjected to reversed lateral loading, 11th WCEE, No. 1753, 1996.
[13] Nakamura, H.: An effect of the buckling of reinforcement bar on the postpeak behavior of RCstructures, Concrete Engineering Series 20, JSCE, pp. 98-100, 1997 (in Japanese).
[14] Nakamura, H., Niwa, J., and Tanabe, T.: An effect of the buckling of reinforcement bar on thepostpeak behavior of RC structures, Proc. of the JCI, Vol. 14, No. 2, 1992 (in Japanese).
[15] Gomes, A., and Appleton, J.: Nonlinear cyclic stress-strain relationship of reinforcement bars includ-ing buckling, Engineering Structures, Vol. 19, No. 10, pp. 822-826, 1997.
[16] Nakamura, H.: Stress-strain relation of concrete as a characteristic of material, Concrete EngineeringSeries 20, JSCE, pp. 92-95, 1997 (in Japanese).
[17] Tomita, Y.: Overview of elasto-plastic finite deformation analyses by finite element method (localizeddeformation and numerical simulation), J. of the Japan Soc. for Tech. of Plasticity, Vol. 36, No. 408,pp. 2-9, 1995 (in Japanese).
[18] Shirato, M., Kimura, Y., Fukui, J., and Takahashi, M.: A numerical analysis for postpeak behaviorof pile foundation, J. of Struct. Eng., JSCE, Vol. 45A, pp. 1387-1398, 1999 (in Japanese).
[19] Menegotto, M., and Pinto, P. E.: Method of analysis for cyclically loaded R.C. plane frames includingchange in geometry and non-elastic behavior of elements under combined normal force and bending,IABSE symposium on resistance and ultimate deformability of structures acted on by well-definedrepeated Loads, Final Reports, Vol. 13, pp. 15-22, Lisbon, 1973.
[20] Ristic, D., Yamada, Y., Iemura, H., and Petrovski, J.: Nonlinear behavior and stress-strain basedmodeling of reinforced concrete structures under earthquake-induced bending and varying axial loads,Research Report, No. 88-ST01, School of Civil Engineering, Kyoto University, 1988.
[21] Ohtsuka, H., Hoshikuma, J., Nagaya, K., and Murai, K.: Experiments of cast-in-place RC pilessubjected to cyclic load, Technical Memorandum of PWRI, No. 3462, Public Works Research Institute,Japan, 1996 (in Japanese).
[22] Hoshikuma, J., Kawashima, K., Nagaya, K., and Taylor, A. W.: Stress-strain model for confinedreinforced concrete in bridge piers, J. of Struct. Eng., ASCE, Vol. 123, No. 5, 1997.
[23] Shirato, M., Fukui, J., and Kimura, Y.: Characteristics of the swelling of longitudinal reinforcementsin cast-in-place RC piles, Proc. of the 25th JSCE Earthquake Eng. Symp., JSCE, pp. 569-572, 1999(in Japanese).
[24] Tanamura, S., Kondoh, M., Kanamori, M., and Sugawara, A.: Cyclic loading tests of model pileswith high-strength shear reinforcements, RTRI Report, Vol. 12, No. 12, pp. 47-52, Railway TechnicalResearch Institute, Japan, 1998 (in Japanese).
[25] Fukui, J., Nakano, M., Ishida, M., Nanazawa, T., Adachi, T., and Taguchi, H.: An investigation ofactual conditions on adoption of types of foundations, Technical Memorandum of PWRI, No. 3500,Public Works Research Institute, Japan, 1996 (in Japanese).
[26] Committee on publishing design examples of highway bridges: Useful design example of highwaybridges, Civil Engineering Journal, Supplement, April-1998, pp. 121-141, Sankaido, Tokyo, 1998 (inJapanese).
[27] Architectural Institute of Japan: An introduction to dynamic soil-structure interaction, Maruzen,Tokyo, 1996 (in Japanese).
[28] Iwasaki, T., Tatsuoka, F., and Takagi, Y.: An experimental study on dynamic deformation charac-teristics of soils, Part II – dynamic deformation characteristics of sand in wide range of strain level –,J. of Research, PWRI, No. 153, Public Works Research Institute, Japan, 1980 (in Japanese).
[29] Iwasaki, Y., Tokita, K., and Yoshida, S.: Dynamic deformation characteristics of alluvial clays –Strain-dependency of shear rigidity –, Technical memorandum of PWRI, No. 1504, Public WorksResearch Institute, Japan, 1979 (in Japanese).
[30] Takeda, T., Sozen, M. A., and Nielsen, N. M.: Reinforced concrete response to simulated earthquakes,J. of the Struct. Div., ASCE, Vol. 96, No. ST12, pp. 2557-2573, 1970.
[31] Sakai, J., and Kawashima, K.: Nonlinear seismic response analysis of a reinforced concrete bridgecolumn by the fiber element, J. of Struct. Eng., JSCE, Vol. 45A, pp. 935-946, 1999 (in Japanese).